Abstract
Vibration monitoring (VM) is an important tool for fault diagnosis in key components of wind turbine gearboxes (WTGs). However, due to the influence of white noise and random interference, it is difficult to realize high-quality denoising of WTG-VM signals. To overcome this limitation, a novel joint denoising method for fault WTG-VM signals is proposed in this article, which we have named EWTKC-SVD. First, the empirical wavelet transform (EWT) boundary exploration method is used to optimize frequency band allocation and obtain the multiple intrinsic mode functions (IMFs). Second, the sensitive IMFs are selected according to the calculated correlation coefficient and kurtosis index, avoiding IMF redundancy. Finally, the fault WTG-VM signals are obtained using SVD denoising. Using this approach, the proposed method realizes high-quality denoising of WTG-VM signals. Furthermore, it also effectively solves the existing problems of conventional methods, namely, inefficient IMF selection, high noise, false frequencies, mode mixing, and end effect. Finally, the effectiveness, superiority, and reliability of the proposed method are proved using simulation and practical case results.
1. Introduction
As a clean and pollution-free renewable energy, wind energy is an important driving force and green engine for global economic development. With the large-scale construction of wind farms [], the problem of high fault rates and high operation and maintenance costs of wind turbine equipment has become increasingly prominent []. In particular, the high fault rate of wind turbine gearboxes (WTGs) and the consequential long shutdown cycle seriously affect the quality of power generation and increase the operation and maintenance cost of wind farms. In particular, the fault rate of bearings, the key components of WTGs, accounts for about 60% of all faults for the whole wind turbine and 20% of the total period of shutdown for faults [,].
At present, vibration monitoring (VM) is an important tool for fault diagnosis in gearboxes, generators, blades, etc. []. However, the VM signals are mostly nonstationary and nonlinear. Meanwhile, WTGs have the characteristics of a harsh erection environment, complex structure, variable load, complex load impact, serious noise interference, and complex transmission path of VM signals. The above factors lead to a low signal-to-noise ratio (SNR) of fault WTG-VM signals. Consequently, the fault information is obscured. At the same time, fault VM signals are subject to different noise disturbances that are not easily removed [,]. Therefore, in this paper, the bearing, one of the key components of the WTG, is taken as the research object, and the denoising processing of its fault VM signals is studied, which lays a foundation for the effective extraction of fault information of the WTG.
After extensive survey and study, the methods that have been put into industrial applications based on the decomposition and processing of WTG-VM signals mainly include Fourier transform (FT), wavelet transform (WT) [,,,], empirical mode decomposition (EMD) [,,], and a series of improved algorithms based on EMD. Among these methods, FT can only convert simple vibration signals in the time domain and frequency domain and cannot complete the decomposition of nonlinear signals. The Fourier transform is a global signal analysis method, so for nonlinear and nonstationary signals like seismic signals, the Fourier transform has certain limitations. The Fourier transform cannot well represent the local time–frequency information of the signal and can only obtain the relationship between the frequency and amplitude of the signal, the frequency components contained in the whole signal, and the simple time-varying characteristic spectrum of the signal. The frequency distribution of the signal at different times cannot be well expressed. WT can decompose nonlinear signals, and its application is relatively simple. However, when WT is applied to VM signals, the mother wavelet coefficients cannot be replaced, and different wavelet bases lead to different calculation results. EMD is applied to nonstationary nonlinear signals. VM signals are decomposed using EMD to obtain several eigenmode functions and a single residual quantity, but in the process of calculating the instantaneous frequency of the eigenmode functions, there are negative frequencies that cannot be explained by scientific reasoning. Therefore, EMD is a method characterized by the accumulation of experience and lacks theoretical verification. In addition, EMD leads to mode mixing and end effects due to unreasonable convergence conditions and over-envelope and under-envelope problems. Later, in order to tackle the problems existing in EMD, improved methods such as Ensemble Empirical Mode Decomposition (EEMD) and Complementary Ensemble Empirical Mode Decomposition (CEEMD) were put forward, but these methods increased the application cost while encountering problems such as mode aliasing.
In response to the issues, in recent years, Gilles has proposed the empirical wavelet transform (EWT) [,,,,]. Compared with EMD, EWT has sufficient theoretical support, can effectively extract intrinsic mode functions (IMFs) without false frequencies, and is computationally simple. At present, EWT has been widely used in fault signal processing in electric power equipment, machinery, and other fields. However, in practice, the large number of IMFs obtained using EWT decomposition cannot be effectively screened, which leads to high noise and complex frequency components. At the same time, the acquisition of IMFs is prone to decomposition redundancy. In addition, the EWT frequency band allocation process requires artificial determination of the number of allocation bands N. In this process, too large a value for N will lead to excessive decomposition, whereas too small a value for N will lead to incomplete decomposition and mode mixing. Based on the above problem, the scale method proposed by Gilles can achieve an adaptive allocation of signals represented with a Fourier spectrum. However, it is limited to narrowband spectrum allocation, and its broadband spectrum allocation effect is not ideal. The VM signals will be allocated into several adjacent frequency bands, thus destroying the integrity of the periodic impact characteristics of VM signals.
To solve the aforementioned problems, this article proposes a method that is based on a combination of EWT, kurtosis [,], the correlation coefficient [,], and singular value decomposition (SVD) [,,,], which we call EWTKC-SVD. It can denoise WTG-VM signals, eliminate white noise, and solve the problems existing in conventional denoising methods. In this approach, first, EWT is used to denoise the white noise of the WTG-VM signals, and the IMFs are obtained to solve the problems of mode aliasing and end effect in the traditional algorithm. At the same time, the EWT uses the band boundary exploration method combining frequency domain allocation and kurtosis value to optimize frequency band allocation, ensuring the extraction of resonant bands of optimal width. Next, sensitive IMFs are chosen by kurtosis and the correlation coefficient criterion as the principal components of the signals, ensuring IMF criticality and avoiding redundancy. Then, the SVD is used to reconstruct and remove the narrowband interference in the noisy WTG-VM signals. In the process, the Hankel matrix is constructed for the sensitive IMFs according to the fault WTG-VM signals characteristics, and then signal denoising is realized using SVD. Meanwhile, the signal-to-noise ratio (SNR) index is introduced to measure whether the proposed method is superior to EMD. Finally, the feasibility and correctness of the proposed method are verified using the simulation and experimental results.
2. EWTKC-SVD Denoising Method Basic Theoretical Framework
2.1. [Empirical Wavelet Transform] Kurtosis, Correlation Coefficient (EWTKC)
The proposed EWTKC concept and calculation includes the following three stages.
Stage 1: EWT and Frequency band allocation
The definitive formulation of the EWT [] decomposition method described in this paper is presented in (1). The Fourier axis allocation of the original signals is depicted in Figure 1 [].
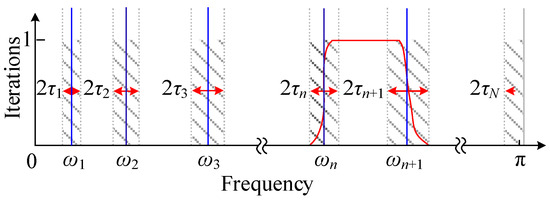
Figure 1.
Fourier axis allocation.
According to (1), signal x(t) is decomposed into IMFs, which correspond to each frequency band:
where ck(t) is IMFs, wx(k,t) is the Fourier transform representing x(t), and φk(t) is the empirical wavelet function. (Note: For ease of reading, due to non-originality, detailed formula derivation of empirical wavelet transform can be seen in the original literature []).
To address the challenges inherent in the EWT frequency band allocation process. A method is proposed to optimize the process, that is, combines the band boundary exploration means of time domain segmentation and kurtosis value (as detailed in Stage 3) with the following idea.
A single frequency window serves as the basis function, and the detection of the resonant band is achieved by expanding the right boundary frequency of the window, and the allocation of the whole frequency band is achieved by translating the left boundary of the window. The window width is adjusted according to the actual data to ensure that the frequency window width can cover at least one or more resonance spectral lines during each band translation to realize the search of the resonance region as well as the whole frequency band. The implementation steps are as follows.
Fourier transform is performed for the original signals to obtain the frequency domain signal x(n), and the frequency domain signals for the kth frequency domain window pk is:
where and are the left boundary frequency of the window and the right boundary frequency after the ith expansion.
The Fourier inverse transform is performed for the signals to calculate the kurtosis index, followed by a single right translation of the right boundary of the frequency domain window to obtain the following.
where fb is the extended frequency band.
The band expansion cycle step is performed according to the kurtosis, and the adjacent i − 1, I, i + 1 kurtosis index is calculated; if i ≥ max(i − 1, i + 1), it indicates that the highest frequency period shock component exists in the frequency range corresponding to the i kurtosis index, i.e., the location of the resonant band of optimal width.
is the boundary frequency corresponding to the allocation of the kth frequency band after the ith expansion, and its corresponding boundary frequency can be obtained according to (4).
The updated frequency for the left boundary can be expressed as follows:
Repeat the above steps to achieve the band range search when the frequency band satisfies (6).
Stage 2: Kurtosis
The kurtosis value serves as a dimensionless parameter, characterizing the sharpness or “spikiness” of a signal’s waveform. The mathematical representation for the kurtosis of the original signal, x(t), derived from the EWT decomposition of multiple IMFs, is as follows:
where K is the kurtosis value, xAve is the mean value of signal x, and σ is the standard deviation of signal x.
Under normal operating conditions of the WTG, the VM signal approximates normally distributed with a kurtosis value of 3, and it exhibits no pronounced periodic shocks. When a local fault occurs, the kurtosis value will increase significantly, and the shock component in the signal will increase significantly. The shock excitation generated using vibration will cause different frequency bands of inherent vibration of each component of WTG, resulting in IMFs containing different frequency bands of inherent vibration components. Therefore, the larger the kurtosis indexes of IMFs, the more obvious the VM signals shock component will be.
Stage 3: Correlation coefficient
The correlation coefficient serves as a pivotal metric indicating the degree of association between variables and the original signals, and the Pearson product-moment correlation coefficient is used to calculate the correlation coefficient of each IMF with the x(t) of the original signals. Given samples X and Y, their correlation coefficients are expressed as follows:
where C is the correlation coefficient; Cov(X,Y) is the covariance of sample X and sample Y; the variance of sample X, is the variance of sample Y.
The correlation coefficient C is in the range of [−1, 1], and the larger the absolute value of the correlation coefficient, the higher the degree of linear correlation between the two samples. By finding the correlation coefficients between several IMF components and the original signals, the interference of non-correlated quantities due to collecting WTG-VM signals is reduced. Therefore, the strength of the kurtosis index reflected in the fault vibration shock and the sensitivity of the correlation coefficient to the interfering signals are defined as the KC values of the IMFs.
where K represents the kurtosis index of IMFs, C is the correlation coefficient of IMFs with the original signals, and α is the weighted degree of IMFs cliff value to KC.
In summary, the overall expression of the EWT, kurtosis, and correlation coefficient is denoted as EWTKC.
2.2. Singular Value Decomposition (SVD)
SVD is a nonlinear filtering method for any set of real matrices A∈Qm×n, which can be decomposed as.
where U and V represent the orthogonal matrix U∈Qm×n, V∈Qm×n; S represents the diagonal matrix, S = [diag(σ1, σ2, …σq), O] or expressed in transposed form, O represents the zero matrix, σi represents the order of the singular values from largest to smallest; q = rank(S).
Given that the WTG-VM signal is inherently one-dimensional, a direct application of SVD is not feasible. Therefore, to address this, a multi-dimensional matrix must be formulated. For this purpose, the Hankel matrix is employed, which can be described as follows. Set the signal x = [x1, x2, x3,…, xN] and 1 < n < N.
Performing SVD on matrix A, the following equation is obtained.
where ui∈Qm×1, vi∈Q1×n, i = 1, 2, 3, …, q.
Upon transformation using SVD, the resultant values are organized in descending order. Since the backbone signal is mainly concentrated on the first few larger singular values, the lower singular values are selected to be set to 0, and then the signal reconstruction is performed to attain the desired denoising objective.
2.3. Denoising Method Flow
EWTKC-SVD flow is as follows.
First, The vibration signal data are processed using time-frequency transformation. EWT completes the optimization of frequency band allocation to achieve frequency band allocation. Meanwhile, the original signal x(t) is decomposed according to time series to obtain IMFs [c1(t), …, cn(t)].
Second, To screen the sensitive IMFs, kurtosis and correlation coefficients of IMFs obtained using EWT decomposition are calculated. Via calculation, IMFs with higher kurtosis index and larger correlation are selected as sensitive IMFs, denoted as [D1(t), …, Dm(t)].
Third, According to the signal, the selected sensitive IMFs are subjected to Hankel matrix construction and denoising by SVD, denoted as [S1(t), …, Sn(t)]. The time-frequency waveform was reconstructed from the components completely processed by the denoising method.
The proposed algorithm model is shown in Figure 2.
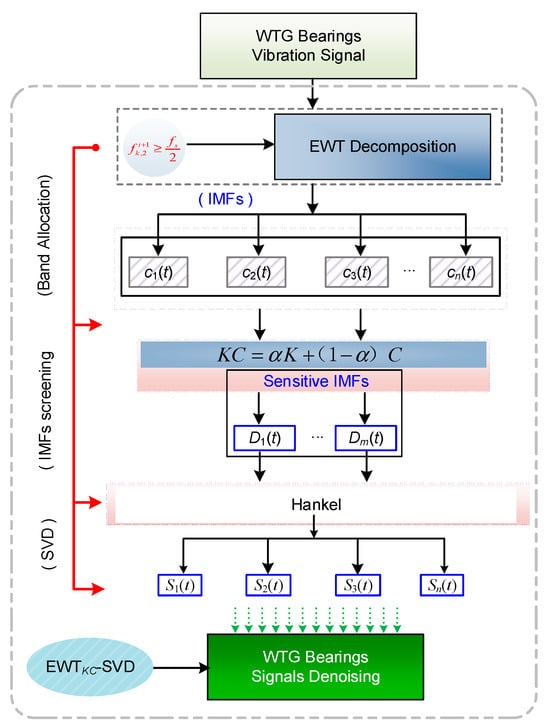
Figure 2.
Denoising flow model.
3. Simulation Analysis
3.1. Simulation and Construction
To validate the efficacy of the denoising methods proposed in this paper. The simulation signal is constructed as shown in (14), and technical index parameters are presented in Table 1. The following simulations are carried out.

Table 1.
Parameters Index.
First, the simulation completes the time-frequency transformation of the signal.
Second, the band allocation of EWT is optimized to complete the band allocation, and IMFs can be obtained using EWT decomposition.
Third, the conventional EMD is used to decompose and analyze the simulation signal to compare the superiority of EWT to EMD.
Finally, EWT-SVD is introduced to denoise the IMFs extracted from EWT, and the signal-to-noise ratio (SNR) is computed to obtain the effect after introducing SVD denoising. (Note: The simulation part excludes the calculation of kurtosis and correlation coefficient).
where n(t) is Gaussian white noise.
3.2. EWT Performance Analysis
The parameters and signals used for simulation are detailed in Table 1. The simulated signal is time-frequency transformed, as shown in Figure 3. Specifically, Figure 3a represents the waveform in the time domain; Figure 3b showcases the waveform in the frequency domain; Figure 3c is the optimization process and simulation waveform of frequency band allocation, and Figure 3d is the frequency domain waveform of frequency band allocation completed using EWT.
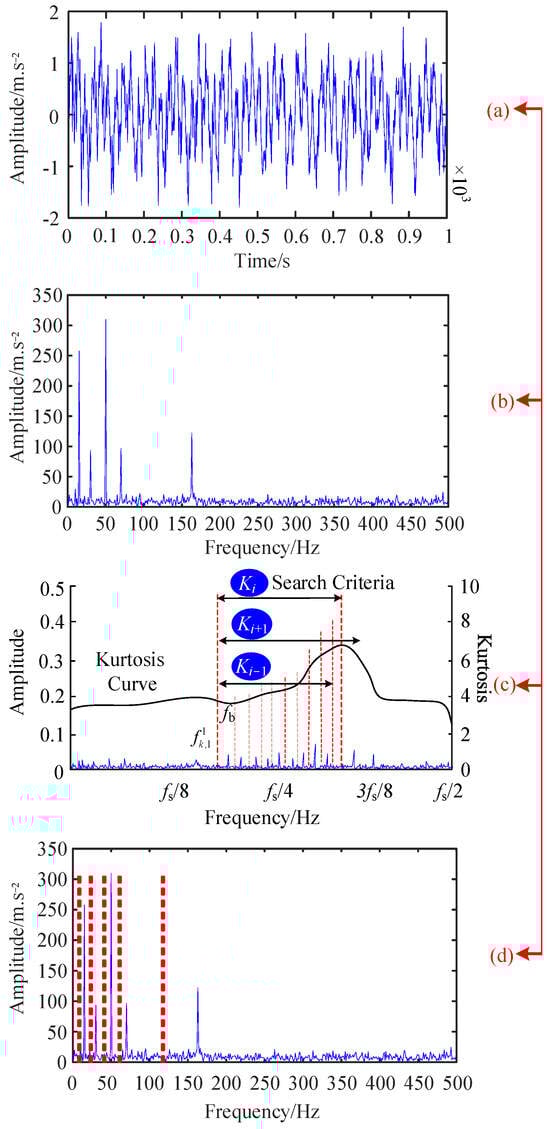
Figure 3.
Signal initial processing: (a) Time domain (b) Frequency domain (c) Band allocation optimization (d) Band allocation.
After completing the time-frequency transformation, the signal is decomposed by EWT to obtain IMFs [denoted as D1(t), D2(t), D3(t),…, D6(t)], which are arranged from low frequency to high frequency. The time-frequency waveform of IMFs is shown in Figure 4. Figure 4a represents the waveform in the time domain, and Figure 4b showcases the waveform in the frequency domain. According to Figure 4, It can be clearly found that 15 Hz, 50 Hz, and 163 Hz appear in IMFs D1(t), D4(t), and D6(t), respectively. Furthermore, each simulation frequency only exists in the corresponding IMFs, but there is a certain degree of noise interference in each IMF signal.
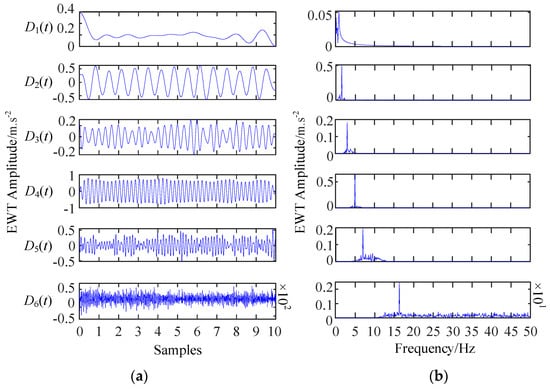
Figure 4.
EWT simulation: (a) Time domain (b) Frequency domain.
Moreover, to highlight the superiority of EWT. This article compares the EMD widely used in industry with EWT using simulation analysis. The time-frequency waveforms of the original signal decomposed by EMD are shown in Figure 5. IMFs obtained using EMD decomposition are sequentially arranged from high frequency to low frequency [denoted as I1(t), I2(t), I3(t)... I6(t)], and the corresponding time-domain simulation waveforms of each component are shown in Figure 5a, and their corresponding frequency domain waveforms are shown in Figure 5b. In the spectrum, the AM signal frequency of 163 Hz appears in I6(t) and I5(t), and the low-frequency cosine signal of 15 Hz appears in I1(t), I2(t) and I3(t) at the same time. This indicates that EMD has a serious mode mixing phenomenon and end effect, and it is difficult to separate the signal of a certain frequency value from IMFs.
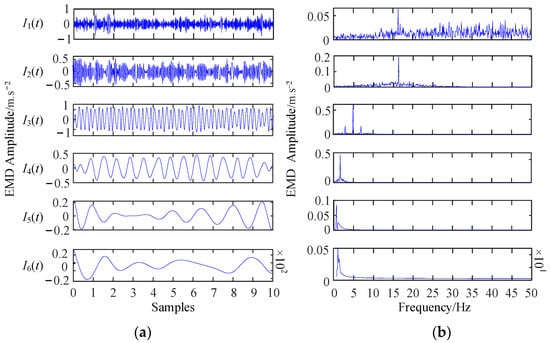
Figure 5.
EMD simulation: (a) Time domain (b) Frequency domain.
By comparison, based on the EMD simulation analysis results, it can be concluded that the high-order component (low-frequency component) is difficult to understand, and the original signal is decomposed into multiple modes, mode mixing, and end effect exist, which cannot effectively characterize the real characteristics of the signal. Conversely, EWT excels in frequency band allocation of the original waveform in the frequency domain, leading to a more accurate decomposition into IMFs. Quantitatively, the SNR, as shown in Table 2, for EMD is significantly lower than EWT’s. Hence, EMD’s signal processing capability is inferior to that of EWT.
Table 2.
SNR Comparison-simulation research.
3.3. EWT-SVD Performance Analysis
From the comparative analysis of simulation outcomes between EWT and EMD, the following observations are made: While EWT holds certain merits over EMD, the frequency domain representations of IMFs indicate that there are still obvious issues, notably noise signal interference, subsequent to EWT decomposition. Given these challenges, this article proposes to introduce SVD denoising on the basis of the EWT method.
The time-frequency waveforms by EWT-SVD denoising are illustrated in Figure 6. As can be seen from the Figure, it is evident that SVD can remove the interference of random noise in IMFs obtained after EWT decomposition. Meanwhile, it can amplify the effective frequency of IMF signals and make the spectral lines presented in IMFs much clearer and intuitive. A direct comparison with the waveform underscores the superior denoising efficacy of EWT-SVD over EWT alone. Consequently, the integration of SVD with EWT more proficiently facilitates signal denoising, eliminating white noise and spurious frequencies and preventing the occurrence of mode mixing and end effects in the denoising process.
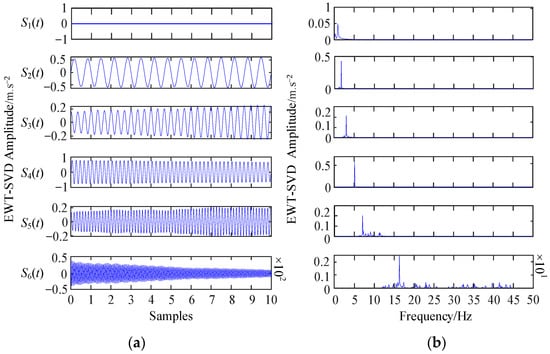
Figure 6.
EWT-SVD simulation: (a) Time domain (b) Frequency domain.
Finally, the signal-to-noise ratio (SNR) of EWT, EMD, EWT-SVD, and EMD-like improved algorithms is obtained using calculation, and the results are shown in Table 2. The findings reveal that the SNR of EWT-SVD markedly surpasses that of EWT, reinforcing the merits of integrating the SVD denoising technique. (Note: The spectrum analysis of EMD-like improved algorithms simulation signal is not described here).
4. Experimental Results
4.1. Experimental Platform
To validate the applicability of the proposed EWTKC-SVD denoising method in practical WTG-VM applications, experimental research was conducted in this study. A 2 MW offshore wind turbine, a multi-functional vibration monitoring (VM) tester combined with the WTGs condition monitoring system (CMS), was utilized to utilize VM signals from the failed impeller-side bearing of the high-speed shaft. Figure 7 illustrates the experimental setup and platform employed in this research.
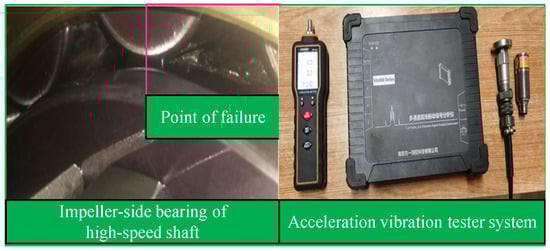
Figure 7.
Experimental platform.
4.2. Denoising Experiment Results
Figure 8 presents the time-frequency waveform of the VM signals collected from the inner raceway fault of the side bearing of the WTG’s high-speed shaft impeller obtained using a Fourier transform. Specifically, Figure 8a displays the time-domain waveform of the fault WTGs-VM signals, from which it can be intuitively seen that the amplitude and fluctuation of the signal are very large. Figure 8b shows the frequency-domain waveform with the optimized frequency band allocation optimization (From EWTKC: Stage 1).
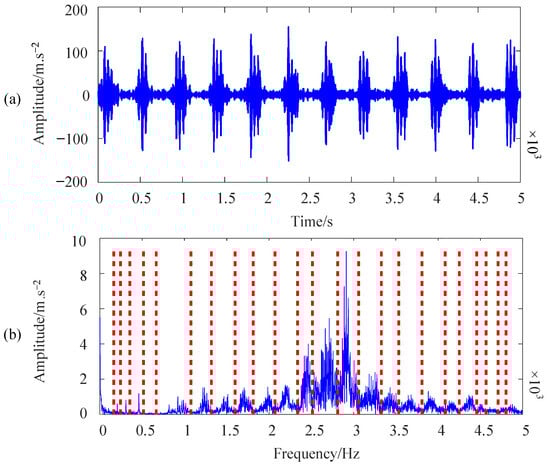
Figure 8.
WTG-VM signals waveform: (a) Time domain (b) Frequency domain.
At the same time, it can be clearly seen from Figure 8 that the experimental frequency domain waveform reflects a rich signal frequency component. However, due to the influence of noise, the interval between high amplitude lines cannot be determined, so it is difficult to determine the fault status of the impeller-side bearing of the WTG high-speed shaft through the frequency. Therefore, the proposed EWTKC-SVD is applied to verify the experiment. The experimental research is as follows:
Firstly, according to the problem of the large number of intrinsic mode functions (IMFs) in the experiment and the inability to have screening effectively. In this article, the kurtosis and correlation coefficient criterion is introduced, and the impact intensity and correlation between IMFs and original signals are obtained using calculating the kurtosis index and correlation coefficient so as to select sensitive IMFs. The kurtosis-correlation coefficient criterion calculation curve is shown in Figure 9a,b. Therefore, in this article, combined with the calculation curve of the kurtosis-correlation coefficient, the 12th, 13th, and 14th IMFs obtained using EWT decomposition were used as the sensitive component, as shown in Figure 9c [D12(t), D13(t) and D14(t)]. In addition, the Hilbert spectra of the three sensitive IMFs selected in this article are calculated; Table 2500 Hz, 2750 Hz, and 3000 Hz can be observed in the Hilbert spectrum, respectively, corresponding to the three selected frequency bands. However, in the process of the experiment, from the time domain waveform observation of the selected three sensitive IMFs [D12(t), D13(t), and D14(t)], we can see that there are still obvious problems, such as noise signal interference. As a result, the SVD signal method proposed in this article is introduced to denoise the sensitive IMFs obtained using EWTKC again.
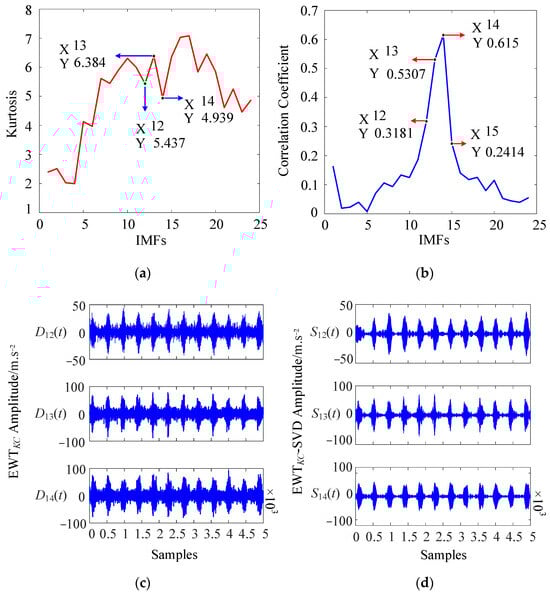
Figure 9.
Sensitive IMFs and denoising results of EWTKC-SVD: (a) Kurtosis calculated curve. (b) Correlation Coefficient calculated curve. (c) EWTKC denoising time domain waveform. (d) EWTKC-SVD denoising time domain waveform.
Then, according to the characteristics of WTGs-VM signals, we need to use the Hankel matrix to reconstruct the signal. After Hankel matrix processing, the three sensitive IMFs selected are denoised by SVD. The time-domain waveform obtained after denoising is shown in Figure 9d. It can be seen from Figure 9d that SVD can remove the interference of random noise to IMFs, amplify the effective frequency of IMF signals, and make the spectral lines presented in IMFs much clearer and more intuitive. Meanwhile, it can be seen intuitively from the waveform that the denoising effect of EWTKC-SVD is significantly better than that of EWTKC denoising, as shown in Figure 9c.
Hence, using experimental investigations, the practical application of the novel joint denoising method, which combines EWT with kurtosis, correlation coefficient, and SVD, has been demonstrated to be highly effective in the context of WTGs-VM.
To further validate the effectiveness of EWTKC-SVD in denoising fault WTGs-VM signals, this study reconstructs the time-frequency waveform of IMFs obtained after SVD denoising was reconstructed. The reconstructed time-frequency waveform was demodulated using the Hilbert envelope spectrum to obtain the fault characteristic frequency []. The resulting reconstructed time-frequency waveform is illustrated in Figure 10. Comparing it with the time-frequency waveform (Figure 8) of the original signal without EWTKC-SVD processing, its denoising effect on the signal is excellent. Furthermore, in this study, experimental data were processed and denoised using various algorithms, and their performance was evaluated based on the signal-to-noise ratio (SNR) as presented in Table 3. It is worth mentioning that the proposed method exhibits superior SNR compared to other algorithms, further substantiating its effectiveness.
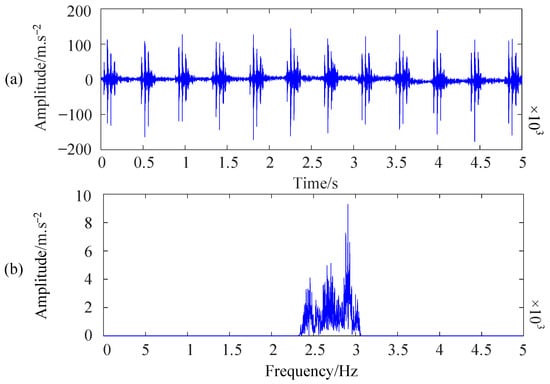
Figure 10.
EWTKC-SVD denoising: (a) Time domain (b) Frequency domain.
Table 3.
SNR Comparison-experimental research.
Furthermore, with the implementation of this method for denoising the fault vibration signals, the fault diagnosis can be completed more clearly, thereby laying the foundation for the signal preprocessing part of fault diagnosis. As an illustration, the basic envelope fault diagnosis technique is employed, and the resulting envelope spectrum is depicted in Figure 11. Within the envelope spectrum, the bearing rotation frequency is observed at 22 Hz, while the bearing inner ring failure frequency is detected at 248 Hz. Additionally, a side frequency component with the failure frequency as the center and the rotation frequency as the interval. Therefore, it can be concluded that the fault is in the inner ring of the side bearing of the fan high-speed shaft impeller.
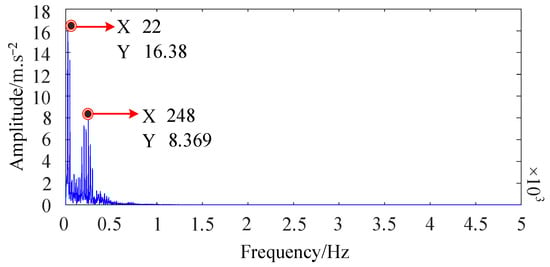
Figure 11.
Envelope spectrum.
5. Conclusions
To achieve exceptional denoising of faulty Wind Turbine Generator-Vibration Monitoring (WTGs-VM) signals and address the drawbacks of conventional denoising methods, this article presents a pioneering EWTKC-SVD denoising approach for fault WTG-VM signals. Primarily, via an in-depth exploration of frequency bands, we optimize the EWT allocation process, leading to multiple Intrinsic Mode Functions (IMFs). The enhanced EWT successfully resolves the issues of inadequate frequency band allocation in conventional EWT, as well as challenges such as high noise, false frequency, mode mixing, and end effect. In comparison to conventional methods, EWT proves to be more suitable for decomposing and processing fault WTGs-VM signals. Additionally, a method combining the kurtosis criterion and correlation coefficient criterion is proposed to select sensitive IMFs as the principal component from the multitude of IMFs obtained using EWT. This ensures a more effective reduction of noise in the fault vibration signal. Moreover, due to the remaining noise issues in the denoising performance of EWTKC, an additional denoising method utilizing SVD is introduced. Consequently, the denoising effectiveness of EWTKC-SVD surpasses that of EWTKC. The viability and accuracy of the proposed method are validated using simulation and experimental results, establishing its practical engineering significance.
Author Contributions
Conceptualization, C.Z.; Data curation, C.Z.; Formal analysis, C.Z.; Funding acquisition, C.Z.; Investigation, X.Z., J.L., C.Z., Z.X. and W.D.; Methodology, C.Z.; Project administration, C.Z.; Resources, C.Z.; Software, X.Z., J.L. and C.Z.; Supervision, C.Z.; Validation, X.Z., J.L. and C.Z.; Visualization, X.Z. and C.Z.; Writing—original draft, X.Z. and C.Z.; Writing—review and editing, X.Z. and C.Z. All authors have read and agreed to the published version of the manuscript.
Funding
This work is supported by the State Key Laboratory of Smart Grid Protection and Control, Nari Group Corporation, Nanjing, Jiangsu, 211106, China (Grant No. SGNR0000KIJS2200309).
Data Availability Statement
All the data are shown in the tables and figures of this paper.
Conflicts of Interest
The authors declare no conflict of interest.
References
- REN21 Secretariat, Global Wind Report. 2021. Available online: http://gwec.net/global-Figure.s/wind-energyglobal-status/ (accessed on 2 September 2023).
- Wei, L.; Qian, Z.; Zareipour, H. Wind Turbine Pitch System Condition Monitoring and Fault Detection Based on Optimized Relevance Vector Machine Regression. IEEE Trans. Sustain. Energy 2020, 11, 2326–2336. [Google Scholar] [CrossRef]
- Peng, Y.; Qiao, W.; Qu, L. Compressive Sensing-Based Missing-Data-Tolerant Fault Detection for Remote Condition Monitoring of Wind Turbines. IEEE Trans. Ind. Electron. 2022, 69, 1937–1947. [Google Scholar] [CrossRef]
- Jin, X.; Xu, Z.; Qiao, W. Condition Monitoring of Wind Turbine Generators Using SCADA Data Analysis. IEEE Trans. Sustain. Energy 2021, 12, 202–210. [Google Scholar] [CrossRef]
- Qiao, W.; Lu, D. A Survey on Wind Turbine Condition Monitoring and Fault Diagnosis—Part II: Signals and Signal Processing Methods. IEEE Trans. Ind. Electron. 2015, 62, 6546–6557. [Google Scholar] [CrossRef]
- Singh, S.; Kumar, N. Detection of Bearing Faults in Mechanical Systems Using Stator Current Monitoring. IEEE Trans. Ind. Inform. 2017, 13, 1341–1349. [Google Scholar] [CrossRef]
- Zhao, B.; Niu, Z.; Liang, Q.; Xin, Y.; Qian, T.; Tang, W.; Wu, Q. Signal-to-Signal Translation for Fault Diagnosis of Bearings and Gears with Few Fault Samples. IEEE Trans. Instrum. Meas. 2021, 70, 3526910. [Google Scholar] [CrossRef]
- Li, H.; Shi, J.; Li, L.; Tuo, X.; Qu, K.; Rong, W. Novel Wavelet Threshold Denoising Method to Highlight the First Break of Noisy Microseismic Recordings. IEEE Trans. Geosci. Remote Sens. 2022, 60, 5910110. [Google Scholar] [CrossRef]
- Rezamand, M.; Kordestani, M.; Carriveau, R.; Ting, D.S.-K.; Saif, M. A New Hybrid Fault Detection Method for Wind Turbine Blades Using Recursive PCA and Wavelet-Based PDF. IEEE Sens. J. 2018, 20, 2023–2033. [Google Scholar] [CrossRef]
- Chen, X.; Yang, Y.; Cui, Z.; Shen, J. Wavelet Denoising for the Vibration Signals of Wind Turbines Based on Variational Mode Decomposition and Multiscale Permutation Entropy. IEEE Access 2020, 8, 40347–40356. [Google Scholar] [CrossRef]
- Hussein, R.; Shaban, K.B.; El-Hag, A.H. Wavelet Transform with Histogram-Based Threshold Estimation for Online Partial Discharge Signal Denoising. IEEE Trans. Instrum. Meas. 2015, 64, 3601–3614. [Google Scholar] [CrossRef]
- Camarena-Martinez, D.; Valtierra-Rodriguez, M.; Perez-Ramirez, C.A.; Amezquita-Sanchez, J.P.; de Jesus Romero-Troncoso, R.; Garcia-Perez, A. Novel Downsampling Empirical Mode Decomposition Approach for Power Quality Analysis. IEEE Trans. Ind. Electron. 2016, 63, 2369–2378. [Google Scholar] [CrossRef]
- Shukla, S.; Mishra, S.; Singh, B. Power Quality Event Classification Under Noisy Conditions Using EMD-Based De-Noising Techniques. IEEE Trans. Ind. Inform. 2014, 10, 1044–1054. [Google Scholar] [CrossRef]
- Zhou, Y.; Ling, B.W.-K.; Mo, X.; Guo, Y.; Tian, Z. Empirical Mode Decomposition-Based Hierarchical Multiresolution Analysis for Suppressing Noise. IEEE Trans. Instrum. Meas. 2020, 69, 1833–1845. [Google Scholar] [CrossRef]
- Gilles, J. Empirical Wavelet Transform. IEEE Trans. Signal Process. 2013, 61, 3999–4010. [Google Scholar] [CrossRef]
- Wang, X.; Tang, G.; Wang, T.; Zhang, X.; Peng, B.; Dou, L.; He, Y. Lkurtogram Guided Adaptive Empirical Wavelet Transform and Purified Instantaneous Energy Operation for Fault Diagnosis of Wind Turbine Bearing. IEEE Trans. Instrum. Meas. 2021, 70, 3506619. [Google Scholar] [CrossRef]
- Xu, Y.; Deng, Y.; Zhao, J.; Tian, W.; Ma, C. A Novel Rolling Bearing Fault Diagnosis Method Based on Empirical Wavelet Transform and Spectral Trend. IEEE Trans. Instrum. Meas. 2020, 69, 2891–2904. [Google Scholar] [CrossRef]
- Zhao, B.; Li, Q.; Lv, Q.; Si, X. A Spectrum Adaptive Segmentation Empirical Wavelet Transform for Noisy and Nonstationary Signal Processing. IEEE Access 2021, 9, 106375–106386. [Google Scholar] [CrossRef]
- Kalra, M.; Kumar, S.; Das, B. Seismic Signal Analysis Using Empirical Wavelet Transform for Moving Ground Target Detection and Classification. IEEE Sens. J. 2020, 20, 7886–7895. [Google Scholar] [CrossRef]
- Li, H.; Wu, X.; Liu, T.; Li, S. The Methodology of Modified Frequency Band Envelope Kurtosis for Bearing fault diagnosis. IEEE Trans. Ind. Inform. 2022, 19, 2856–2865. [Google Scholar]
- Bao, W.; Tu, X.; Hu, Y.; Li, F. Envelope Spectrum L-Kurtosis and Its Application for Fault Detection of Rolling Element Bearings. IEEE Trans. Instrum. Meas. 2020, 69, 1993–2002. [Google Scholar] [CrossRef]
- Abdelkader, R.; Cherif, B.D.E.; Bendiabdellah, A.; Kaddour, A. An Open-Circuit Faults Diagnosis Approach for Three-Phase Inverters Based on an Improved Variational Mode Decomposition, Correlation Coefficients, and Statistical Indicators. IEEE Trans. Instrum. Meas. 2022, 71, 3510109. [Google Scholar] [CrossRef]
- Kong, L.; Nian, H. Fault Detection and Location Method for Mesh-Type DC Microgrid Using Pearson Correlation Coefficient. IEEE Trans. Power Deliv. 2021, 36, 1428–1439. [Google Scholar] [CrossRef]
- Li, H.; Liu, T.; Wu, X.; Chen, Q. A Bearing Fault Diagnosis Method Based on Enhanced Singular Value Decomposition. IEEE Trans. Ind. Inform. 2021, 17, 3220–3230. [Google Scholar] [CrossRef]
- Govindarajan, S.; Subbaiah, J.; Cavallini, A.; Krithivasan, K.; Jayakumar, J. Partial Discharge Random Noise Removal Using Hankel Matrix-Based Fast Singular Value Decomposition. IEEE Trans. Instrum. Meas. 2020, 69, 4093–4102. [Google Scholar] [CrossRef]
- Ha, W.; Shin, C. Seismic Random Noise Attenuation in the Laplace Domain Using Singular Value Decomposition. IEEE Access 2021, 9, 62029–62037. [Google Scholar] [CrossRef]
- Liu, H.; Wang, Z.; Zhao, C.; Ge, J.; Dong, H.; Liu, Z. Improving the Signal-to-Noise-Ratio of Free Induction Decay Signals Using a New Multilinear Singular Value Decomposition-Based Filter. IEEE Trans. Instrum. Meas. 2021, 70, 6504211. [Google Scholar] [CrossRef]
- Tse, N.; Chan, J.Y.C.; Liu, R.; Lai, L.L. Hybrid Wavelet and Hilbert Transform with Frequency Shifting Decomposition for Power Quality Analysis. IEEE Trans. Instrum. Meas. 2012, 61, 3225–3233. [Google Scholar] [CrossRef]
Disclaimer/Publisher’s Note: The statements, opinions and data contained in all publications are solely those of the individual author(s) and contributor(s) and not of MDPI and/or the editor(s). MDPI and/or the editor(s) disclaim responsibility for any injury to people or property resulting from any ideas, methods, instructions or products referred to in the content. |
© 2023 by the authors. Licensee MDPI, Basel, Switzerland. This article is an open access article distributed under the terms and conditions of the Creative Commons Attribution (CC BY) license (https://creativecommons.org/licenses/by/4.0/).