1. Introduction
Textile and apparel production is an important economic pillar in China [
1,
2,
3]. Currently, the traditional apparel production mode is rapidly shifting to customized garment production, increasing the demand for the intelligent customization of orders [
4]. However, the production process of textiles and apparel is complex. A large amount of multi-source manufacturing data (process data, time-series stream data) accumulated in each production workstation are independent of each other and have a severely low reuse rate. Also, the textile and apparel production workstations are highly volatile. Moreover, there are many types of equipment and the information exchange between equipment types is blocked. This leads to unclear traceability of material flow between manufacturing workstations, making process monitoring difficult and potential production bottlenecks hard to detect. This lack of correlation and reuse of global data, including both real-time manufacturing data and historical manufacturing data from the whole production workstations, poses a great challenge to the flexible production and fast bottleneck prediction in the textile and apparel industry.
Exploring how to correlate and utilize manufacturing data from a global perspective is a key to predicting bottleneck workstations and controlling quality for meeting the requirements of textile and apparel production.
Current, research into the information modeling of production resources is dominated by ontology and knowledge graphs. Leveraging ontology in the textile and apparel field can be useful in describing complex relationships between objects [
5,
6]. However, it lacks fine-grained descriptions in massive data. Further, knowledge graphs have attracted attention in the textile industry due to their ability to efficiently organize massive, multi-source, heterogeneous data with complex semantic relationships [
7,
8], but there are fewer explorations on the unified organization of dynamic data. In [
9], the knowledge graph facet model provided an idea for establishing dynamic knowledge modeling.
On the other hand, a bottleneck means that imbalance and inefficiency in the line can cause the operation process to be hampered, resulting in a queue of semi-finished products [
10]. In [
11], the ranked position weight and region approach method are used to overcome bottlenecks in the garment industry. Some scholars are currently focusing on bottleneck analysis based on data science methods such as convolutional neural network (CNN) and long short-term memory (LSTM) in the textile industry [
12,
13,
14]. The above studies reflect somewhat the intelligent decision analysis of the textile and apparel production process. Moreover, in combining knowledge and data science methods to drive textile and apparel manufacturing [
15], the domain knowledge related to the text corpus is integrated into a bidirectional long short-term memory (BiLSTM)-based multitask-learning network to bridge the semantic gap between customer needs and design specifications. However, the implicit relationships contained in textile knowledge are not yet explored in depth enough. Fortunately, the fact that graph neural networks can deal with graph data, such as knowledge graphs, provides a feasible option to fully utilize dynamic data and knowledge for production process bottleneck analysis.
Summarizing the above, this paper proposes a knowledge-graph-embedded time-serial-data-driven bottleneck analysis of textile and apparel production processes. Firstly, a dynamic information association model integrating static data and time-series data is established. Then, a textile-corpus-oriented knowledge extraction method is designed to construct a time-series knowledge graph for textile and apparel production (TKG4TA). Further, a temporal knowledge-driven model for predicting bottleneck workstations is designed, based on manufacturing knowledge in the textile industry. Also, textile knowledge is transformed into embeddings using a graph neural network. In turn, the context-associated information features are learned by LSTM to predict the bottlenecks in the textile and apparel production process.
The main innovations of this paper are as follows: (1) We propose a dynamic information association model that integrates static and time-series data in textile and apparel production. (2) We design a textile-corpus-oriented knowledge extraction method and incorporate the information association model to construct a textile and apparel production time-series knowledge graph. (3) We present a temporal knowledge-driven bottleneck prediction model to predict bottleneck workstations in textile and apparel production lines.
The rest of this paper is organized as follows:
Section 2 introduces the literature review.
Section 3 details the knowledge modeling and graph generation in textile and apparel production processes.
Section 4 proposes the temporal knowledge-graph-driven bottleneck analysis in detail. A case study is evaluated in
Section 5. Finally, the conclusions and limitations of this study are summarized in
Section 6.
4. Bottleneck Prediction for Workstations in Textile and Apparel Production Based on the TKG-LSTM Model
Based on the knowledge modeling and graph construction of the massive data from the textile and apparel production process in
Section 3, the static data and time-series data are linked by a knowledge graph named TKG4TA. This provides a knowledge base for detecting the bottleneck workstations. The reason is that the production cell needs to respond to a task passed from the upstream workstation and the task required by the downstream workstation. However, the location of production bottlenecks is usually non-static. Moreover, there are various manufacturing factors associated with bottleneck prediction. Hence, a real-time bottleneck prediction model for textile and apparel production workstations based on temporal knowledge graph–long short-term memory (TKG-LSTM) is designed, as shown in
Figure 5. The model integrates the network properties of CompGCN and LSTM. CompGCN is a multi-relational graph convolutional network which can capture the dependencies of bottleneck-related static or time-serial manufacturing knowledge in TKG4TA. LSTM can capture the long-term dependencies in the production process, which leads to a better prediction.
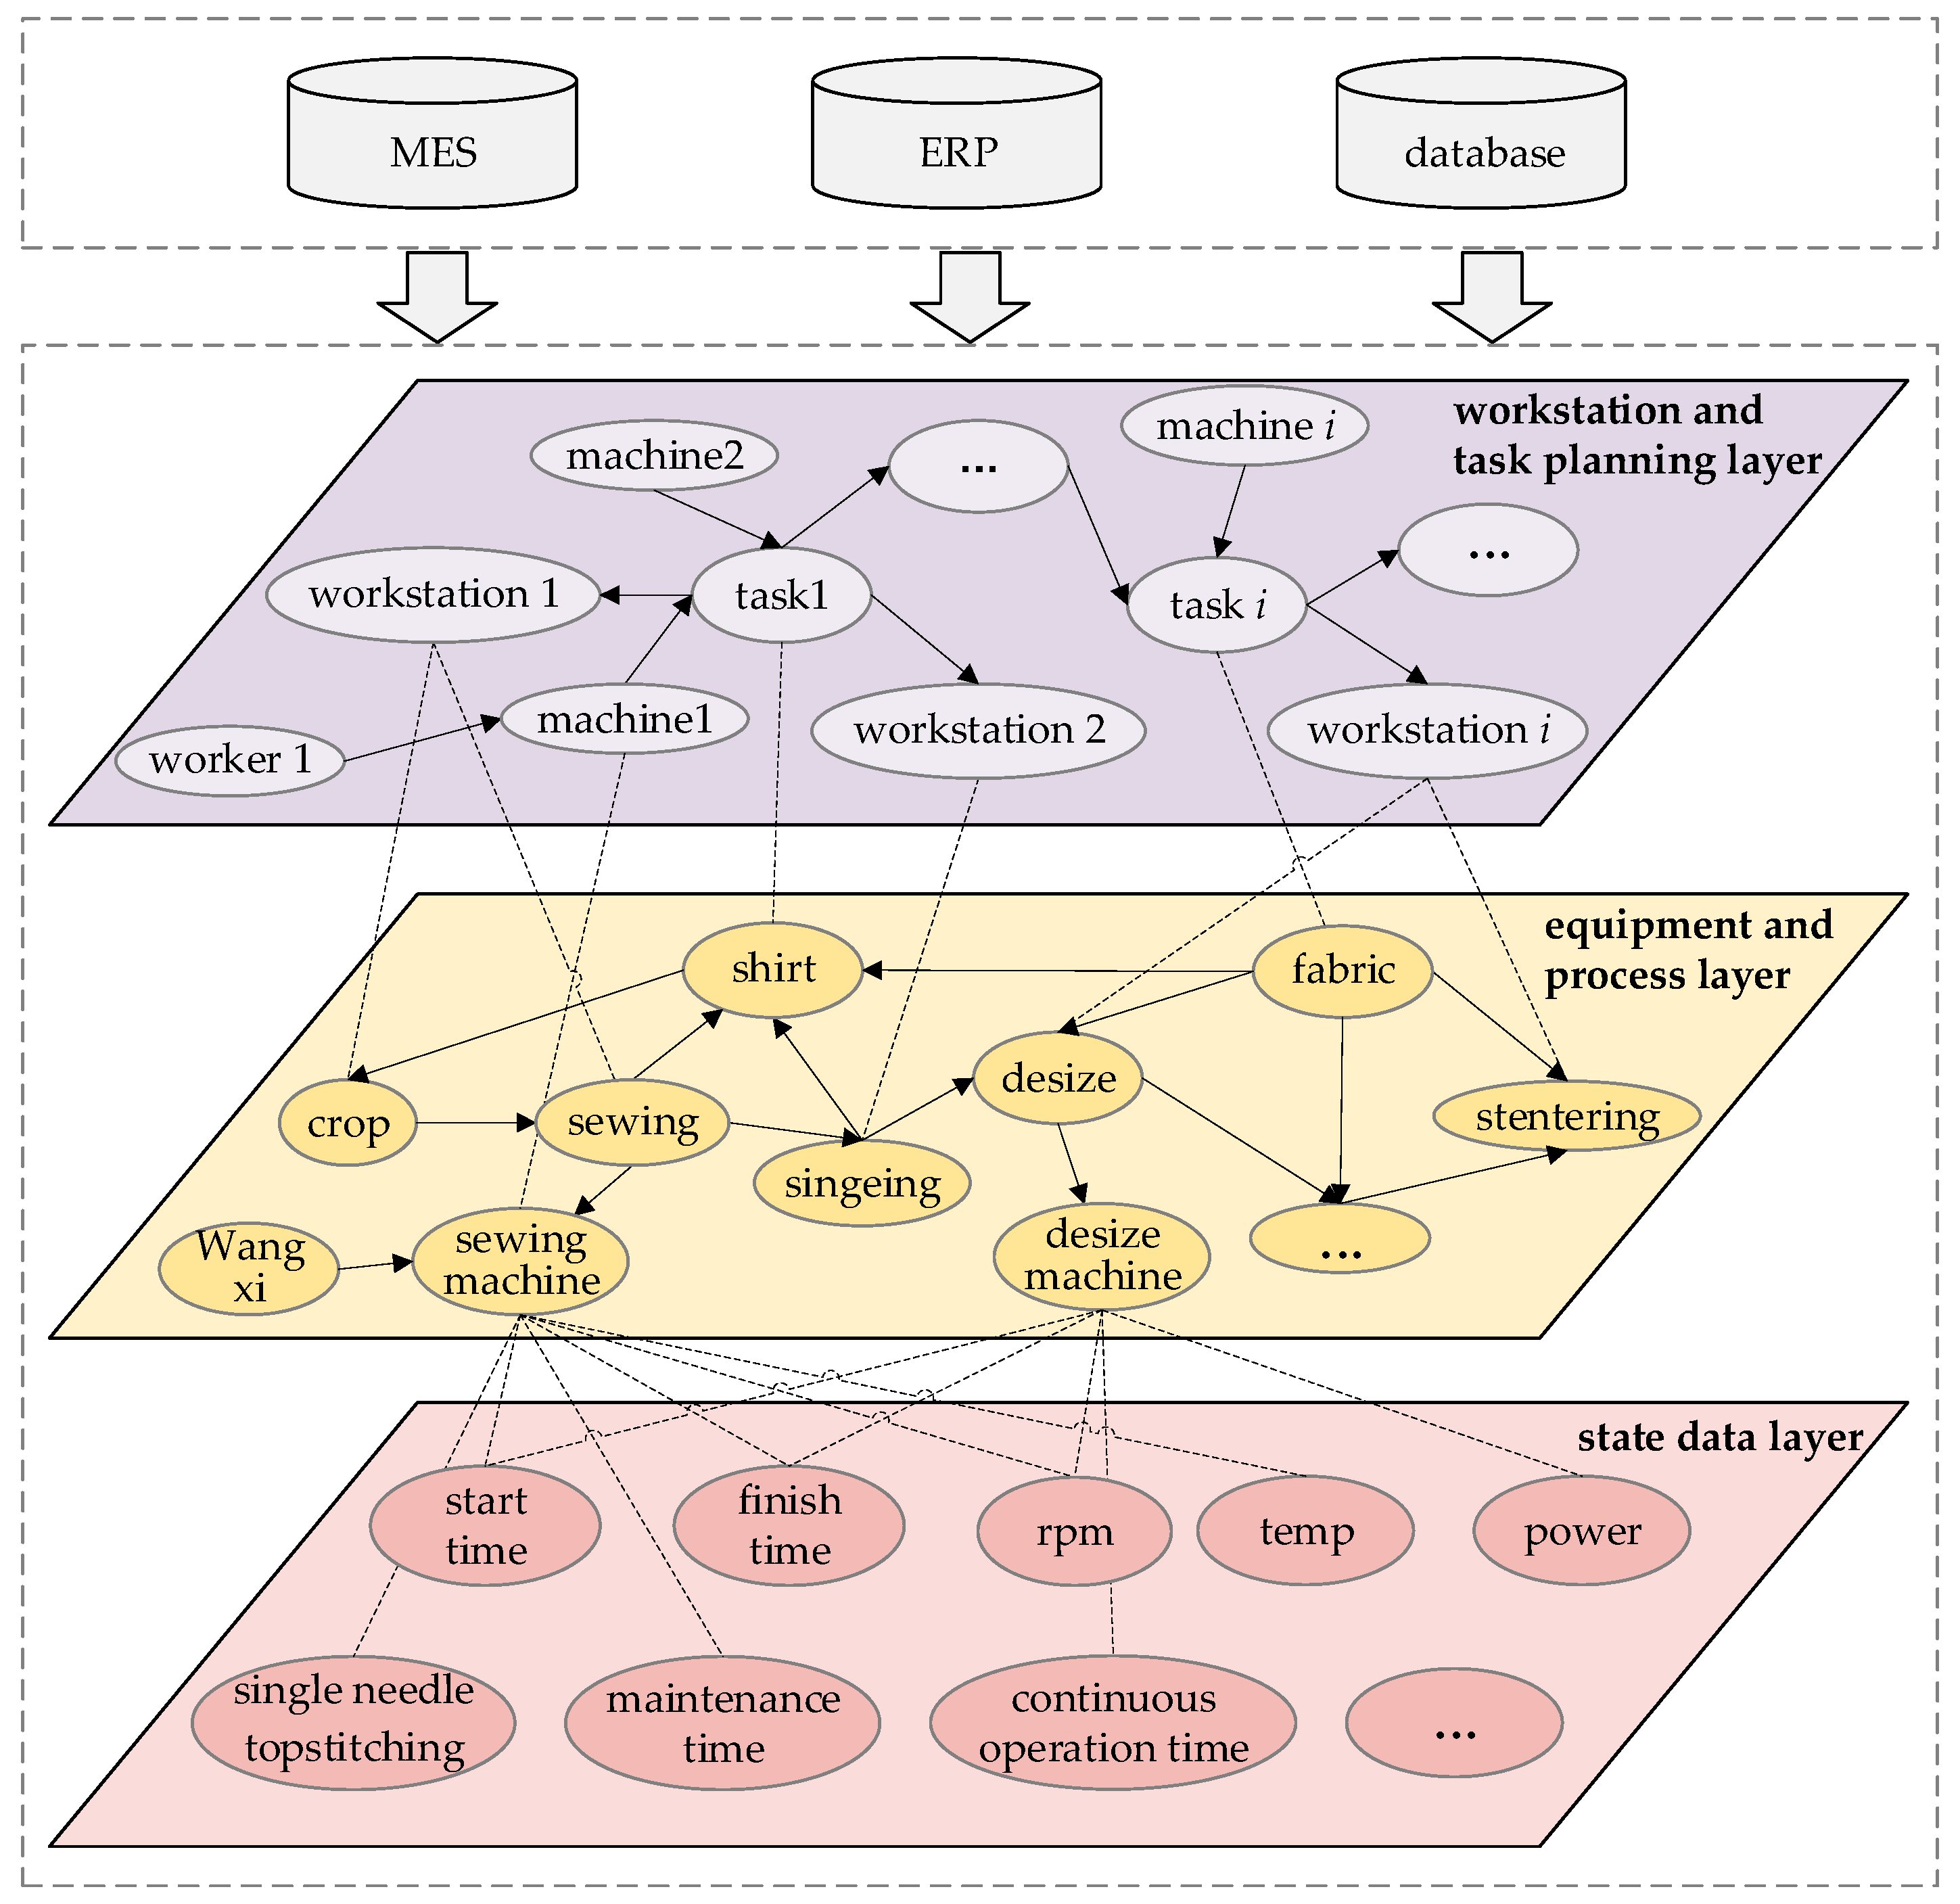
Specifically, the inputs are subgraphs in TKG4TA, including static data and time-series data of the textile and apparel production process. This involves a close relationship with the knowledge nodes of “Human-Machine-Material-Method-Environment” in the production workshop system, including variables describing the state of semi-finished apparel products, variables describing the state of equipment, and variables describing the processing methods in the workshop.
Then, the subgraph in TKG4TA is encoded using CompGCN [
40] to embed the representation of manufacturing data features, including the convolution and aggregation of subgraphs of TKG4TA. Further, after aggregation by the graph convolutional network, LSTM is used to learn the long-term dependence state features in the production process. Moreover, attention weights are added to make different state features play different roles in the bottleneck prediction. Finally, the bottleneck prediction for different workstations is executed by computing the updates.
To facilitate the analysis of the bottleneck workstation, a definition describing the basic elements of the workshop is given, as shown in
Table 4. Bottleneck workstations
BNk are those with the highest long-term utilization or those whose work-in-process inventory in the upstream buffer is the largest of all buffers in the system.
PWT denotes the sum of the waiting times of textile and apparel semi-finished products in the buffer area
Bk of station
Dk at time
t. The larger the
PWT, the weaker the ability to respond upstream. In addition,
NWT denotes the sum of the waiting times for textile and apparel semi-finished products from station
Dk′ in the buffer of station
Dk′ at time
t. The larger the
NWT, the greater the ability to supply downstream. Thus, the workstation bottleneck
BNk at time
t in the device
Dk is described as follows.
The textile production unit needs to respond to both the tasks delivered by the upstream workstation and the tasks required by the downstream workstation. Therefore, the bottleneck value is defined as the negative value of the comprehensive ability of a production cell to satisfy upstream and downstream tasks. The cell with the largest bottleneck value is the bottleneck workstation. Bottleneck workstation
BNk is given in the following.
Meanwhile, to further realize the design idea of the bottleneck prediction model of textile and garment production workstations based on TKG-LSTM, its key descriptions are given as follows.
- (1)
GCN-based node embedding in the subgraph of TKG4TA
For predicting the bottleneck status of each workstation, it is first necessary to extract the bottleneck features of each workstation node, as shown in the bottom layer in
Figure 5. The features related to the workstation bottleneck in TKG4TA are embedded. GCN is applied to deliver the feature embedding of each workstation node to the edge node to aggregate the feature vectors and compute the embedding features of the target workstation. The nodes and relationships are described in detail as follows.
indicates the subgraph feature aggregation of the l + 1th layer with ej as the key node in the TKG4TA. Ne is the first-order neighborhood of node ej. indicates the relationship feature of the k layers. λe indicates a normalization constant. Wrel and denote a transformation matrix and a layer-specific trainable weight matrix, respectively. Then, the subgraph encoding in the TKG4TA can be represented by concatenating and at time t.
- (2)
Long-term relationship feature representation in the workstation production process
Bottleneck workstations are also influenced by their historical station observations and future production planning. These factors exhibit time dependence and inter-correlation. LSTM is utilized to capture these properties after encoding by the GCN. A detailed description is given in the corresponding equations in
Section 3. After encoding based on the LSTM, attention weights α are added to give different weights to different states to characterize the importance of each state, so that each state plays a different role in the prediction.
where
l denotes the number of layers of the LSTM.
W and
b are the weights and biases of the fully connected layer.
is the output of the last time step in the last layer of the TKG-LSTM. Finally, the bottleneck value
yBN of each production unit is output through the fully connected layer.
- (3)
Training updates to the model
The goal is to minimize the error between the true bottleneck time and the predicted value time on the production line.
and
denote the true time and the predicted time, respectively. The loss function of the model is described as follows.
where
is the hyperparameter.
Lreg is the
L2 regularization to avoid overfitting problems.
5. Case Study
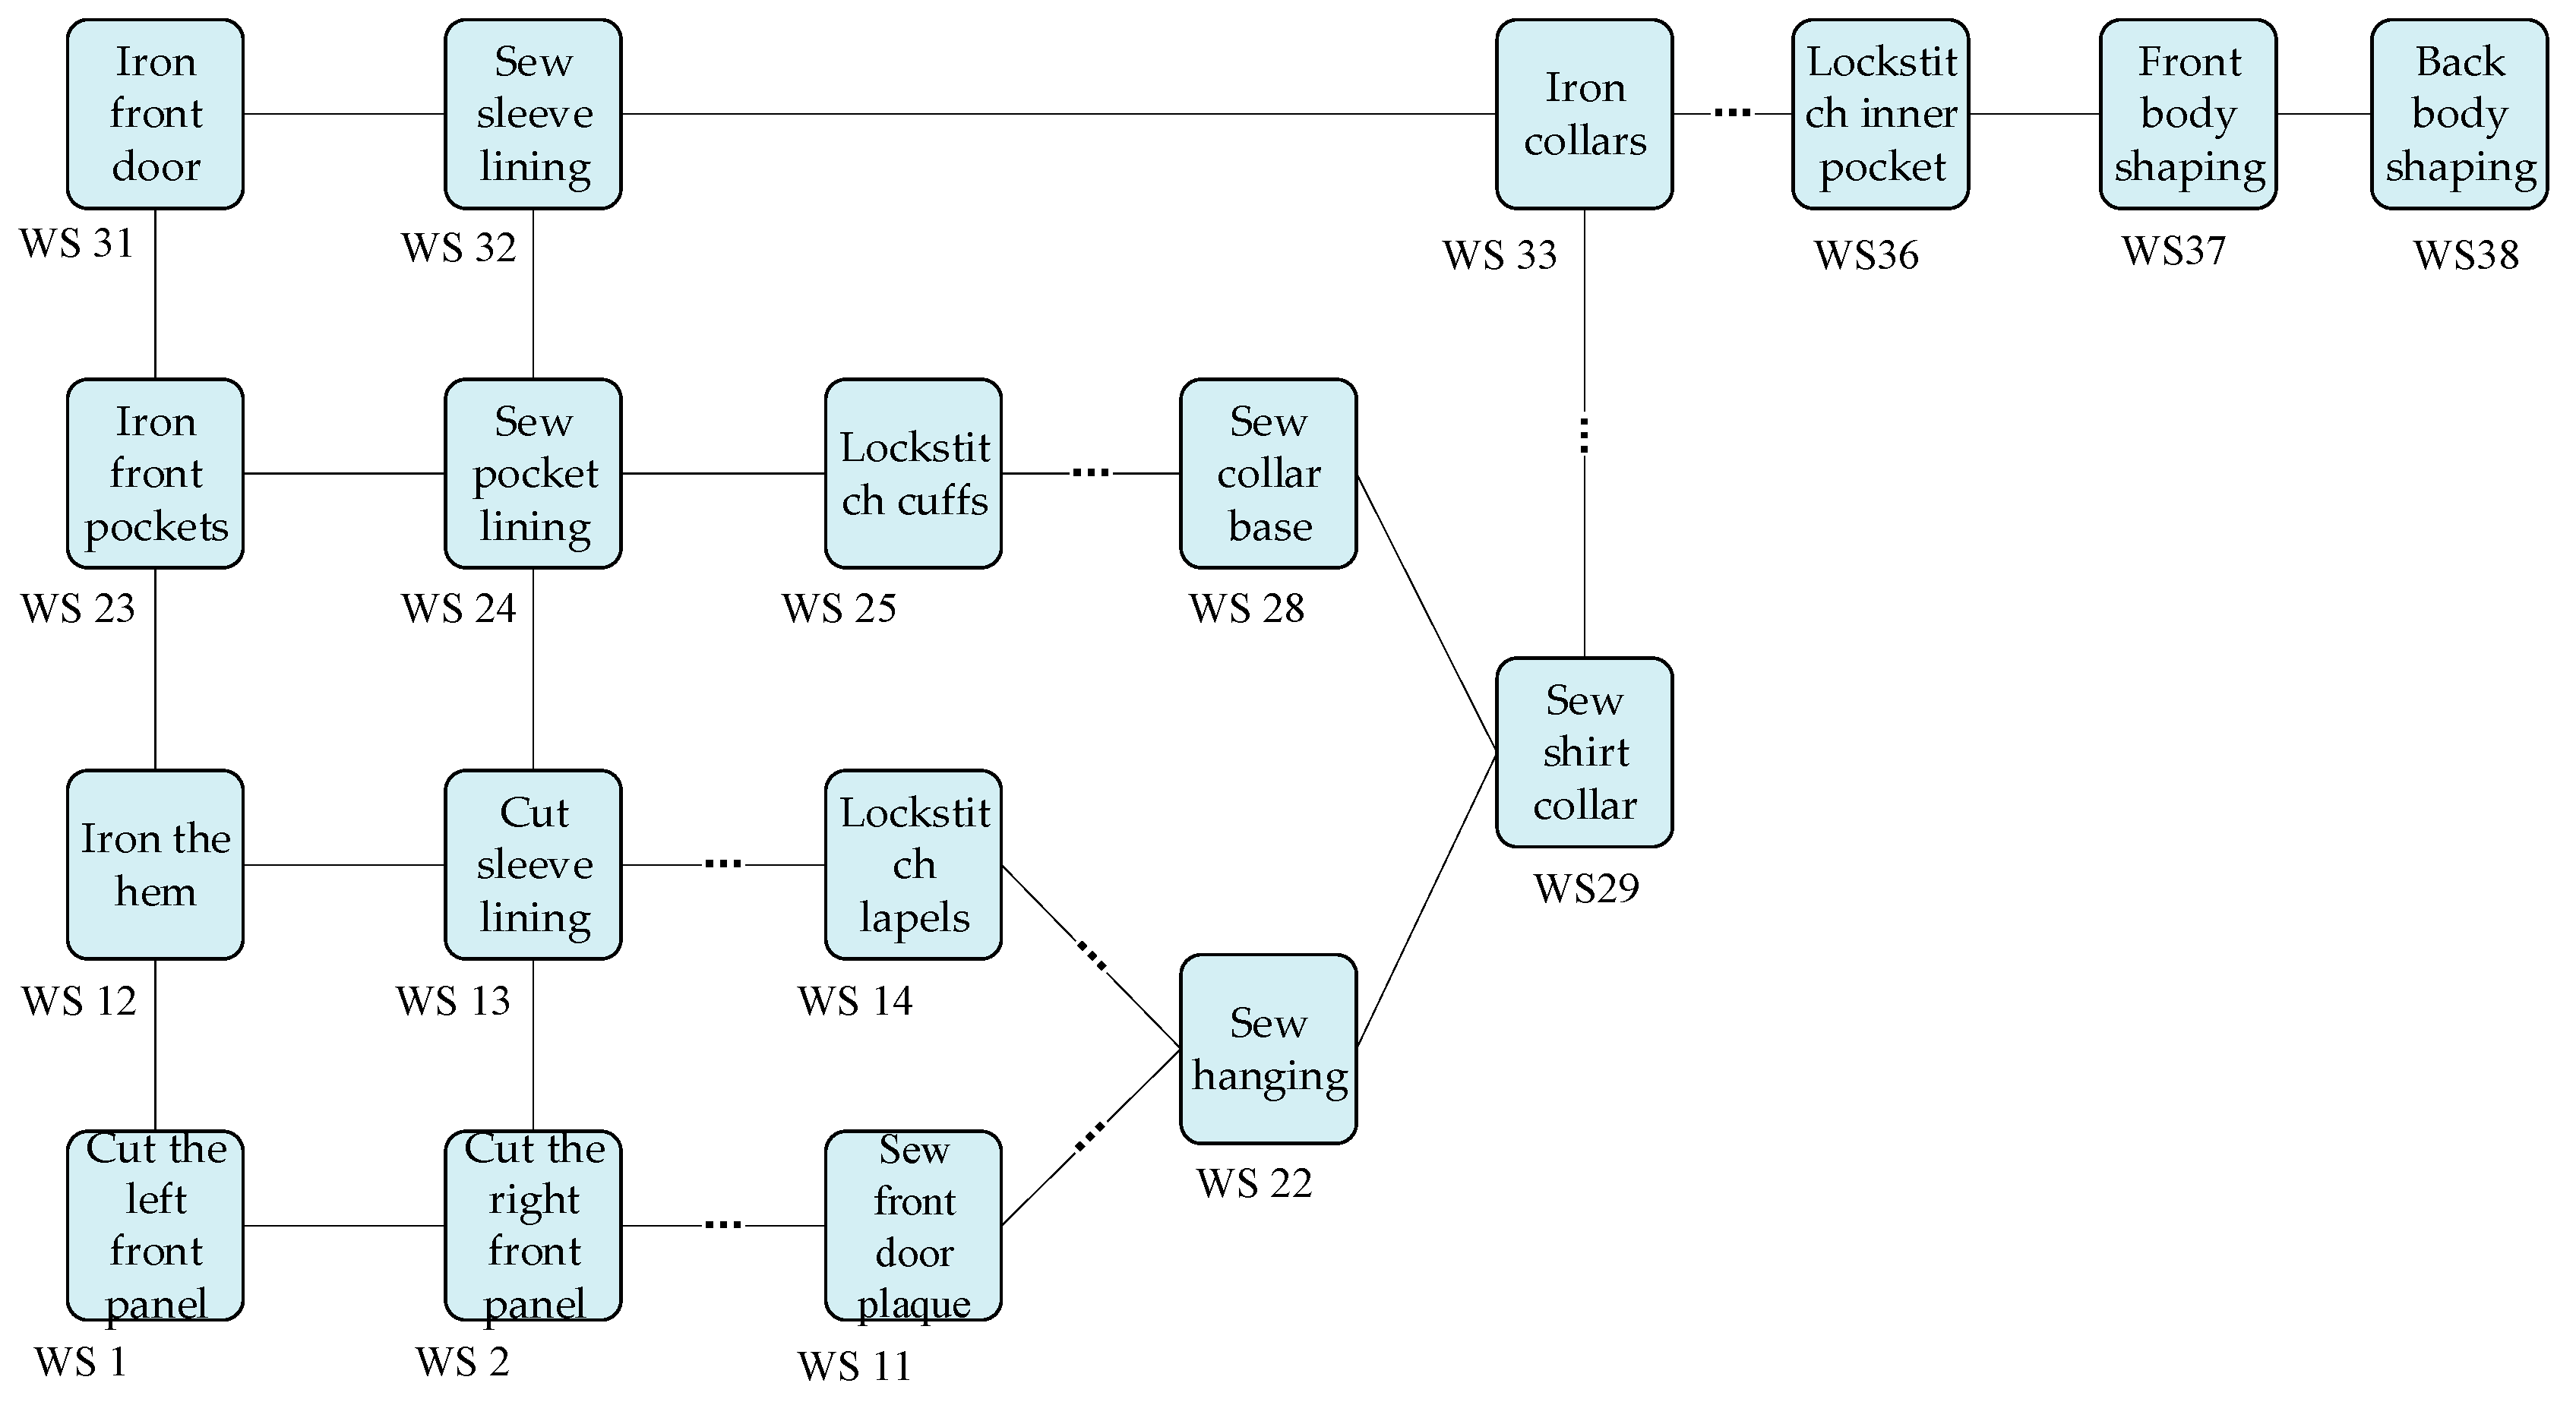
This section demonstrates that the proposed models can utilize textile and apparel production data to construct a knowledge graph, and then predict the workstation bottlenecks in production. The partial workstations (WS) of a production line for shirts are selected as a case, as shown in
Figure 6. The analytic details will be discussed in the follow-up.
5.1. Knowledge Extraction and Knowledge Generation for Textile and Apparel Production
The knowledge extraction for building the TKG4TA mainly comes from a large number of textile and apparel process documents and equipment operation and maintenance manuals, as well as the records from the information system log. Data cleaning is performed to remove the sentences without entity and relationship. To ensure data quality, several persons with empirical knowledge are invited to perform manual screening, labeling, and proofreading. Then, 1682 labeled sentences are obtained. On average, each sentence is about 63 words. Among them, the ratio of training set and validation set is 8:2, and the details of the dataset are shown in
Table 5.
To analyze the effectiveness of the various modules of the network for the proposed joint entity-relationship extraction model, BiLSTM-CRF [
41], Word2Vec-BiLSTM-CRF [
42], and BERT-BiLSTM-CRF [
43] are employed as baseline. Key parameter settings for the models include a batch size of 64, a dropout of 0.3, a learning rate of 0.0015, and an epoch of 80. Adam is used as the optimizer. In addition, P (Precision), R (Recall), and F1 scores are used as the metrics for knowledge extraction. Finally, the performance comparison of the four models on the named entity recognition and relationship extraction tasks are summarized as shown in
Figure 7 and
Figure 8, respectively.
The comparison of the four models shows that the single named entity recognition and the BERT-BiLSTM-Attention-CRF have achieved better results and the difference is not significant. The F1 value of the proposed method for entity recognition is up to 80.3%, and the F1 value for relationship extraction is up to 50.6%. Compared with the BERT-BiLSTM-CRF model, the introduction of the attention mechanism increases the model by 7.2% in entity recognition and 5.4% in relationship extraction in terms of F1 value. Moreover, the BERT-BiLSTM-CRF achieved 3.6% more in F1 values than the Word2Vec-BiLSTM-CRF model on both tasks. This indicates that the embedding accuracy of BERT is greater than that of Word2Vec. Compared with the F1 value of the BiLSTM-CRF-based model, the performance of the model proposed in this paper in the relationship extraction task is improved by 11.2%. This indicates that the joint entity-relationship extraction method can effectively utilize the semantic relationship between the entity recognition and relationship extraction tasks to obtain overlapping relationships. Further, the generated triples are checked by textile professionals to safeguard the quality of the knowledge graph as much as possible.
After obtaining the triples by the joint entity-relationship extraction model, the various static and time-series data stored in the information system are mapped to the knowledge graph based on the ontology model. An example of the time-series knowledge graph for shirt production is constructed as shown in
Figure 9. The relevant knowledge nodes and relationships in the shirt manufacturing process are displayed. Each entity includes static and dynamic attributes of the workstation in shirt manufacturing, which play a key role in keeping the production line running stably. The time-series knowledge graph of shirt production is stored in the neo4j graph database, which will provide the data basis for the bottleneck analysis model later.
5.2. Knowledge Graph-Based Bottleneck Identification in Textile and Apparel Production
Taking the partial flow of production lines for shirt manufacturing in
Figure 6 as the subject of bottleneck analysis, its production line has 38 workstations with 101 workflows. We assigned 80% of the workstation data to the training set and 20% of the workstation data to the validation set for bottleneck prediction. The production line produces several major types of shirts each day, where production lines include both serial structures and parallel structures. Each workstation may contain at least one or several processes. The buffer capacity between workstations is recorded and used as input to associate the time-series knowledge graph. The statistics of the event log data from a shirt production line over a period of time are shown in
Table 6.
- (1)
Metrics strategy
The root mean square error (
RMSE) and the mean absolute error (
MAE) are used as evaluation indicators for the bottleneck prediction model, which are described as follows.
- (2)
Experimental parameter selection
The key experimental parameters for the bottleneck prediction model are shown in
Table 7. It is mainly divided into the parameter settings of GCN and LSTM. First, the dimension of the graph embedding is 200. The number of layers in GCN is 2. Then, the hidden size in LSTM is 200. The learning rate of the model is 0.0015 and the epoch is 1200.
Figure 10 gives the curve of the loss function of the proposed bottleneck prediction based on TKG-LSTM. It can be seen that it converges around 600 epochs.
- (3)
Experimental analysis
To measure the effectiveness of the TKG-LSTM in bottleneck prediction, LSTM and GCN are chosen as baseline, incorporating the bottleneck information including knowledge from TKG4TA and the event logs in
Table 6. Then, the TKG-LSTM and the selected baseline in the bottleneck prediction task spanning is set to 30 min and 60 min. The comprehensive performance comparison is summarized in
Table 8.
As a result, it can be concluded that the TKG-LSTM model can better integrate historical information with multi-features compared to the LSTM and GCN, resulting in a better bottleneck workstation prediction. Among the proposed approaches, bottleneck prediction with time-series features has a better performance in modeling temporal features. In the bottleneck prediction tasks with both 30 min and 60 min spans, the performance of the TKG-LSTM is improved compared to the use of the GCN model or the LSTM model alone for bottleneck prediction. Also, the prediction accuracy is improved by 8.2% and 14.92% in the MAE metrics, respectively. This may be because those models only consider a single bottleneck state feature. In contrast, the proposed TKG-LSTM model can capture temporal knowledge features from the production workstation state data. TKG-LSTM is suitable for processing temporal knowledge graphs due to combining the respective advantages of GCN and LSTM, making the accuracy of the proposed model higher than that of LSTM or GCN on their own.
To further discuss the details of bottleneck workstation prediction, the results are given for several typical workstations based on
Figure 6 for shirt manufacturing, as shown in
Figure 11. Specifically, 600 time steps are selected to analyze the bottleneck prediction results.
Figure 11a shows the variation of bottleneck values at WS 6. The blue and red curves indicate the true and prediction values, respectively. It can be seen that the curves of the predicted value and the true value of WS 6 are in good match. Moreover, the variations of bottleneck values are larger and more negative. According to Equation (15), it can be observed that this is because the shorter waiting time of the fabric to be processed in the cache area makes the waiting time of the fabric from WS 6 in the downstream sewing station longer. This also indicates that the fabric sewing capacity at WS 6 is relatively high. Therefore, it is quite unlikely that WS 6 will be a bottleneck workstation at the moment.
Figure 11b shows the variation of bottleneck value at WS 15, which is also relatively consistent with the curve of the predicted and true values. Moreover, the bottleneck value fluctuates more frequently and remains high for a long time. This is because the waiting time for the sewing of fabrics in the buffer is long, which makes the waiting time for the fabrics from WS 15 in the downstream sewing station shorter. This also indicates that the fabric sewing capacity at WS 15 is weak. Thus, there is a higher probability that WS 15 will become a bottleneck workstation. It is necessary to pay attention to WS 15 in the shirt sewing process. These discussions also reflect the causes of potential bottlenecks in upstream and downstream production workstations for the textile industry. Based on the cause analysis of workstation bottlenecks, it is beneficial to enhance the efficiency in guiding and recommending subsequent textile production operations.
6. Conclusions and Future Work
In this paper, we propose a knowledge-graph-embedded time-serial-data-driven bottleneck analysis of textile and apparel production processes. Firstly, a dynamic information association model in textile and apparel production is established to organize the static data and time-series data from a global level. Then, a textile-corpus-oriented knowledge extraction model is designed to form the triples, taking a large number of documents related to textile process and equipment operation and maintenance manuals as data resources. The comparison of the four models shows that the F1 value of the proposed model for entity recognition is up to 80.3%, and for relationship extraction is up to 50.6%. Moreover, TKG4TA includes the static and dynamic attributes of the workstation in shirt manufacturing. In addition, a temporal knowledge-driven production process bottleneck prediction model, TKG-LSTM, is presented by incorporating GCN and LSTM. Finally, taking the partial flow of production lines for shirt manufacturing as the bottleneck analysis subject, the TKG-LSTM performance in the MAE metrics is improved by 8.2% and 14.92% compared to the use of GCN and LSTM only, respectively. Finally, we analyze several typical workstations for bottleneck prediction. The analysis indicates that the proposed method can predict the different workstations based on real-time data and knowledge from shirt manufacturing, which helps workers find potential bottleneck workstations in a workshop.
Although the proposed methods show superior results in generating TKG4TA and predicting bottleneck workstations in the textile industry, they still have some limitations. Firstly, the hyperparameters involved in the TKG-LSTM are selected for suitable bottleneck prediction in the textile industry. The selection of hyperparameters may need to be optimized in the future to work for different prediction applications. Secondly, there is insufficient consideration of interference factors for bottleneck finding in textile and apparel production. Therefore, it is desired to extend the textile manufacturing knowledge entity and relationship types to apply complex relationship extraction and knowledge graph generation tasks.


