Article

Towards DevOps for Cyber-Physical Systems (CPSs): Resilient Self-Adaptive Software for Sustainable Human-Centric Smart CPS Facilitated by Digital Twins

1
Institute of Technical Informatics, Graz University of Technology, 8010 Graz, Austria
2
Grenoble INP (Grenoble Institute of Engineering and Management), University Grenoble Alpes, G-SCOP, CNRS, 38000 Grenoble, France
3
Andritz Hydro GmbH, R&D Automation, 1120 Vienna, Austria
*
Author to whom correspondence should be addressed.
Machines 2023, 11(10), 973; https://doi.org/10.3390/machines11100973
Submission received: 10 September 2023 / Revised: 16 October 2023 / Accepted: 17 October 2023 / Published: 19 October 2023
(This article belongs to the Special Issue Cyber-Physical Systems in Intelligent Manufacturing)

Abstract

:
The Industrial Revolution drives the digitization of society and industry, entailing Cyber-Physical Systems (CPSs) that form ecosystems where system owners and third parties share responsibilities within and across industry domains. Such ecosystems demand smart CPSs that continuously align their architecture and governance to the concerns of various stakeholders, including developers, operators, and users. In order to satisfy short- and long-term stakeholder concerns in a continuously evolving operational context, this work proposes self-adaptive software models that promote DevOps for smart CPS. Our architectural approach extends to the embedded system layer and utilizes embedded and interconnected Digital Twins to manage change effectively. Experiments conducted on industrial embedded control units demonstrate the approach’s effectiveness in achieving sub-millisecond real-time closed-loop control of CPS assets and the simultaneous high-fidelity twinning (i.e., monitoring) of asset states. In addition, the experiments show practical support for the adaptation and evolution of CPS through the dynamic reconfiguring and updating of real-time control services and communication links without downtime. The evaluation results conclude that, in particular, the embedded Digital Twins can enhance CPS smartness by providing service-oriented access to CPS data, monitoring, adaptation, and control capabilities. Furthermore, the embedded Digital Twins can facilitate the seamless integration of these capabilities into current and future industrial service ecosystems. At the same time, these capabilities contribute to implementing emerging industrial services such as remote asset monitoring, commissioning, and maintenance.

1. Introduction and Background

The ongoing Industrial Revolution is driving a digital transformation entailed by the progressing fusion of computational, physical, and social processes. The observed fusion materializes around Cyber-Physical Systems (CPSs). CPSs are engineered automation systems with integrated computational and physical capabilities to interact with humans through various modalities. The ability to interact with and expand the capabilities of the physical world through computation, communication, and control is an essential driver of emerging technologies and business models [1,2].
For example, the manufacturing industry is transforming its CPSs to transition from traditional mass production and customization to a new paradigm of human-centric mass personalization. This transition will not only deliver unique value by tailoring products to the specific preferences of individual consumers but also promote economic, ecologic, and social sustainability through the effective integration (i.e., connectivity and interaction) of humans, parts, and machines into the production process [3]. Another prominent example is the shift towards Industrial Product-Service Systems (IPS2s). IPS2s denote a new business paradigm that strives for value co-creation between industry partners within and across domains. For that purpose, IPS2s exploit the ever-increasing connectivity of CPSs to create an open ecosystem of products and services. This ecosystem facilitates value optimization for all stakeholders along the value chain by integrating and coordinating various aspects such as the planning, development, provisioning, operation, and utilization of products, services, and immanent software [4,5]. To satisfy stakeholder needs, the individual ecosystem elements must be able to adjust their behavior to the system’s operational context, considering different states and goals at varying proximity and time scales [6,7].
These trends create a need for smarter CPSs that continuously align their architecture and governance to the concerns of various stakeholders, including developers, operators, and users [6,8]. Such smart CPSs are even more software-intensive than traditional CPSs and can be characterized as systems realized through the dynamic composition of autonomous and heterogeneous resources that interact to provide users with rich functionalities. Since smart CPSs operate in highly dynamic environments where both entities and their interconnections are subject to continuous change, the traditional stability assumptions used in CPS design are no longer valid. Such a dynamic operational context introduces uncertainty that spans many diverse dimensions, including context, goals, models, functions, and quality properties of the underlying software systems. Such inherent uncertainty provides enormous potential to harm the longevity of software systems in general and, thus, also the longevity (i.e., the technical sustainability) of software-intensive smart CPS [9].
In the field of ecology, sustainability refers to the capacity of biological systems to maintain their diversity and productivity over time; i.e., sustainability is the endurance of systems and processes. This complex concept encompasses numerous dimensions [10]: social, individual, economic, environmental, and technical sustainability. While the first four dimensions are established concepts, technical sustainability is a rapidly evolving field, referring to “the longevity of information, systems, and infrastructure and their adequate evolution with changing surrounding conditions” mainly associated with the continuous and fast evolution of technologies [9].
In line with other research [9,11,12,13,14,15], we have argued that modern software systems—such as CPS, cloud, and service-oriented systems—must be designed for sustainability. In other words, these systems must be able to handle the continuous change inherent to modern software-intensive systems. We also argue that this can be achieved through the following two system capabilities: adaptation and evolution. Adaptation enables a system to mitigate uncertainty anticipated at the time of development to keep satisfying system and user goals at runtime. Evolution enables a system to adapt to unanticipated uncertainty to handle goal changes and novelty. Integrating these capabilities enhances the technical sustainability of software systems by making them resilient against continuous changes and faults [8].
Traditionally, the adaptation and evolution of software systems have been approached separately with a focus on either runtime or development time. However, modern software systems must be available 24/7 to ensure business continuity. This blurs the traditional segregation between runtime and development time, as uncertainty must be addressed when the information becomes available while the system is running [8]. To address the convergence of runtime and development time, Weyns et al. defined the following question in their research agenda for smarter CPS [8]: “How to integrate adaptation processes with evolution processes of smarter systems to satisfy short- and long-term stakeholder concerns in a continuously evolving operational context?
This article addresses this generic research question in light of modern mission-critical and high-availability industrial CPSs. A mission-critical system is one that is essential for the survival of a business or organization. These systems are created with the sole purpose of achieving mission objectives, as their malfunction can threaten human life, cause environmental damage, and result in significant financial loss. Redundancy is among the vital design principles of mission-critical systems generally applied to increase system availability and reliability. The principle of diverse redundancy is commonly applied in safety-critical domains to reduce the risk of common-cause failures. Safety-critical and mission-critical systems frequently require fault-tolerant mechanisms. In the case of distributed or large-scale systems, where (timely) human intervention is limited, achieving a certain level of system autonomy is generally necessary to automatically or autonomously execute fail-operational, self-protecting, and self-healing mechanisms to ensure continuous system operation [16,17]. Compared to other system classes, mission-critical systems adhere to much stricter requirements regarding their dependability [18]. Since the architectural models and methodologies presented in this work are protocol- and technology-agnostic, they can be readily applied to mission-critical embedded cyber-physical software systems and to diverse software systems that feature more relaxed requirements.
In particular, this article presents the results obtained during a more than six-year-long and still ongoing industrial case study with our industry partner, Andritz Hydro. Andritz Hydro is among the world’s leading suppliers of end-to-end solutions for hydropower plants and highly customized electromechanical systems and automation solutions for hydraulic power generation. Their CPS solutions are responsible for critical infrastructure control and must be designed for uninterrupted and reliable operation, typically 24/7. In our collaborative research effort, we seek holistic solutions for their ongoing shift from a product-centric to a product-service-oriented business.
The following CPS capabilities comprise the essential services of our industry partner’s IPS2 offering: remote asset monitoring, optimization, commissioning, and maintenance. These use cases have also been classified as most relevant at present and in the near future within the comprehensive state-of-the-art analysis of Brissaud et al. [5]. Digital Twins (DTs), as the virtual counterparts to CPS assets, are accepted as an enabler technology for these use cases. In addition, Digital Twins are a crucial concept in the ongoing digital transformation to gain a competitive and economic advantage over competitors in general [5,12,19].
We conducted a multi-stakeholder analysis to identify the technical IPS2 and Digital Twin requirements to obtain an integrated view of business, customer, and provider needs, which we published in [6]. Our analysis finds that CPS providers in the IPS2 context face particularly high risks due to design uncertainty [20]. These risks stem from unclear design requirements (e.g., behavior, operation environment, interfaces) and inherent emergent needs characterized by keeping pace with changing customer needs, emerging cyber security attacks, the increasing risk of fatal software bugs and failures in complex and interconnected CPS, and the evolution of standards and technology throughout the CPS lifetime [21]. Our findings are also supported by other industry studies [5,12,22]. To address these provider risks, we agreed that the envisioned hydroelectric IPS2 offering, and particularly its underlying smart CPS, shall be able to adapt its behavior (i.e., service offerings and service quality) to changing needs and that the identification of needs shall be augmented with operational data from DTs. On this basis, we can narrow the previously stated research question and define the main research question addressed in this work: How can Digital Twin-enhanced smart software systems be designed that support the continuous and reliable adaptation of high-availability mission-critical CPS in their physical space and cyberspace to emergent needs and uncertainties in their environmental and operational context?
Our approach to addressing the two stated research questions is by transferring DevOps principles to the domain of high-availability mission-critical CPSs. DevOps (short for Development Operation) is a set of principles to integrate and streamline the development and operation of modern software systems. DevOps originates from the IT domain and is considered the most effective way to provide value with IT systems through the creation of cross-functional product teams that manage software services throughout their lifecycle, along with automating engineering processes such as the building, testing, and deployment of IT systems [23,24,25]. In recent decades, several engineering processes, design patterns, tools, frameworks, libraries, and middleware technologies have been developed to accelerate software engineering for the consumer market. These IT tools can also be used and integrated for engineering and managing software that is deployed in non-critical industrial cloud and edge environments [26,27,28,29]. However, transferring DevOps to mission-critical industrial and embedded real-time environments is a challenging problem [19,30,31]. Nevertheless, the transfer of DevOps principles to mission-critical embedded CPS encompasses the core of our design and research methodology to enable system adaptation and evolution for smart CPS.

1.1. Toward Resilient, Sustainable, and Human-Centric Smart CPSs: The Potential of DevOps

Although the ongoing Industrial Revolution is not over (Industry 4.0), in 2021, the European Commission announced the next revolution, termed Industry 5.0 [32]. Industry 4.0 is known as the digitalization of the manufacturing industry by CPSs. It is the age of smart and cognitive machines with little room for humans. This raised concerns about the future of society beyond Industry 4.0. Industry 5.0 shall complement the existing technology-driven Industry 4.0 paradigms by shifting the focus toward more resilient, sustainable, and human-centric solutions. Aheleroff et al. summarized their comparison of the Revolutions as follows [33]: Industry 4.0 focuses on “doing things right”, while Industry 5.0 is concerned about “doing the right things”, which results in sustainable development [33,34,35]. Since this work utilizes Industry 4.0 technologies to enhance the technical sustainability of smart CPSs, it is interesting to ascertain how the proposed approach aligns with the goals of the next industrial revolution:
Sustainability is about respecting planetary boundaries, which shall be addressed through circular processes that re-use, re-purpose, re-manufacture, and recycle products to reduce waste and the environmental impact (i.e., circular economy) [32]. As outlined in the introduction, this study seeks holistic software solutions that support the realization of IPS2. Since IPS2s are a fundamental prerequisite for the circular economy [5], this work contributes to the sustainability goals of Industry 5.0.
Resilience denotes the capacity of industry to withstand disruptions and to ensure the provisioning and support of critical infrastructure during times of crisis. This involves developing a higher level of robustness that can better equip industry against unforeseen events [32]. As stated, we are of the opinion that software systems must be designed for sustainability, which means that they must be resilient against continuous changes and faults. In this work, we empirically show that our self-adaptive software models can adapt their architecture and governance to various stakeholders’ short- and long-term needs and thereby support the resilience goals of Industry 5.0.
Human-centric solutions prioritize human needs and interests by shifting from technology-driven progress to an inclusive workplace, where the human is not seen as a cost factor. Instead, humans are seen as investments, and technology is to be developed to serve people and societies, meaning that technology used in manufacturing is adaptive to the needs and diversity of industry workers [34]. The contribution of DevOps towards human-centric CPS is manifold:
  • Learn. DevOps significantly emphasizes comprehensive system monitoring and data collection [25], which facilitates knowledge acquisition and understanding of system behavior and aging. This understanding allows designers and operators to optimize the system towards enhanced value delivery.
  • Train. DevOps promotes the convergence of engineering and operation through continuous experimentation, which enables engineers (e.g., developers, operators, and commissioning workers) to test, compare, and evaluate system changes in the real operational environment from remotely before their actual (remote) deployment to production [36]. In addition to that, continuous experimentation can be used for the remote training of people in real operational environments instead of using simulations only.
  • Value. DevOps facilitates automating engineering tasks such as software deployment and testing during multiple lifecycle phases, including development, commissioning, and maintenance [23]. Hence, DevOps can free engineers from laborious, error-prone, and time-consuming routine tasks so that they can focus on more creative and value-added activities.
  • Collaborate. As stated, we use DevOps to optimize value delivery by streamlining human-driven system evolution by effectively supporting system change and change processes at development time and runtime. However, changing a system during runtime is risky, particularly when adapting safety and mission-critical systems. Hence, our proposed approach also supports machine-driven system adaptation to provide self-protection mechanisms that ensure system safety and integrity during adaptation. These self-adaptation mechanisms can also enhance human–machine collaboration by continuously adapting machine behavior to the needs of individual humans in real time.

1.2. Design Space for the Structured Engineering of Resilient and Sustainable Smart CPSs

This section explains the design space and research scope of the case study presented in this work. In addition, it outlines our research approach and provides the necessary background to define this work’s research agenda, which is given in Section 1.3. In principle, our industrial case study follows a three-stage process that adheres to the systems engineering methodology [37]: (a) system conception and requirements analysis, (b) system design, and (c) system development and validation. We have regularly published relevant results during this process.
In the first and second phases, we investigated architectural concepts, design patterns, and requirements engineering methods from diverse research and industry domains, including cloud, edge, embedded, self-adaptive, service-oriented, and Cyber-Physical Systems. Based on our investigations, we have published several concepts and design patterns [17,21,38], as well as a novel requirements engineering method for the use of Digital Twins in IPS2 [6]. We applied this method to derive the requirements and design of generic self-adaptive system models that facilitate DevOps for CPS, which we published in [31]. In this work, we present the results of the last phase, where we revise and augment our previous works with (a) the learnings and results obtained during system development and validation and (b) the state-of-the-art scientific literature regarding the usage of DTs in modern industrial environments (see Section 2).
To transparently present our research design, methodology, and contributions, we have compiled a visual breakdown of this work shown in Figure 1. In addition, we added the green shaded labels/boxes to indicate the contributions of this work. Table 1 outlines these contributions and the structure of this work.
Figure 1a shows a pseudo-ontology of this work’s design space. The orange design space elements comprise the architectural design dimensions of our approach and the relevant technology elements we use to achieve our target system’s desired capabilities. Figure 1b shows the AdEpS (Adaptation and Evolution processes for Sustainability) model as defined in [9]. The AdEpS model denotes a comprehensive model that takes an architectural perspective on the challenges of software system adaptation and evolution at runtime. In particular, it comprises two interacting processes: one manages adaptation, and the other manages evolution. Within these processes, the AdEpS model considers the challenges of handling change for monitoring, planning, evaluating, coordinating, and implementing reconfigurations. To that purpose, the model explicitly includes the following three elements that are essential for modern self-adaptive and autonomous software systems [9]:
  • The steps and resources of the MAPE-K loop (short for monitor, analyze, plan, enact/execute, and knowledge). The MAPE-K loop denotes the most widely used pattern to structure and implement the behavior of self-adaptive systems [39,40].
  • The various types of uncertainty, covering also the risks identified during our stakeholder analysis described above. Table 2 provides examples per uncertainty type.
  • The explicit representations of the resources on which the change processes work: (a) the architecture description and the system implementation for evolution and (b) the runtime model and running system for adaptation.
Table 2. Uncertainties covered by the AdEpS model [9] shown in Figure 1.
TypeDomain *Description
Goal uncertaintyEvolutionThe goals/requirements of the system may be subject to uncertainties, e.g., User requirement, communication protocols, workflows, and processes may dynamically change in ways that are difficult to predict.
Environmental uncertaintyAdaptationThe context of the system may be subjects of uncertainties, e.g., The availability of resources may dynamically change in ways that are difficult to predict.
Model uncertaintyAdaptationThe runtime architecture model may be subject to uncertainties (i.e., model uncertainty [41]), e.g., The model may only provide inaccurate predictions of an algorithm’s resource usage in time and memory consumption.
Adaptation uncertaintyAdaptationThe adaptation itself may be subject to uncertainties, e.g., The analysis of a real situation may result in the selection of an inaccurate execution plan.
Monitoring uncertaintyBothMonitoring may be subject to uncertainties, e.g., Measuring physical quantities such as distance and pressure may be subject to noise. The cyclic update of measurement values obtained from external services may be subject to unexpected delays and jitter.
Change enactment uncertaintyBothChange enactment may be subject of uncertainty, e.g., The time to change a service may differ from the expected. Applied changes may have unexpected side-effects, e.g., due to high CPU or memory contention.
* Domain refers to the uncertainty type’s associated change management process: adaptation and evolution.
In this work, we use the AdEpS model to perform a structured and transparent mapping of our architectural design approach and this work’s contributions to an established model in the smart CPS and self-adaptive systems research communities. Therefore, the green labels/boxes indicate the contributions proposed, evaluated, and discussed in the remainder of this work.
The circle in the design space shown in Figure 1a comprises the elements fundamental to all CPSs:
  • Primary assets (PAs) denote the processes, machinery, and heavy assets that implement the intended CPSs’ functionality by affecting the physical world. Examples of processes are power generation, power distribution, and goods manufacturing. Examples of machinery and heavy assets are turbines, generators, pumps, presses, and transportation systems.
  • Secondary assets (SAs) denote the information processing and communication technology (ICT) infrastructure required to enhance the primary assets with computing capabilities. This comprises all hardware, software, and network elements required to control the primary assets. Examples of hardware are sensors, actuators, fieldbus systems, and control units (also denoted as programmable logic controllers (PLCs)). Examples of software and networks comprise all software services and data processed and transmitted via ICT infrastructure. Where appropriate, we distinguish ICT infrastructure between Information Technology (IT) and Operation Technology (OT). In principle, IT is designed for the consumer market. In contrast, OT is hardened for safety [16,18], which is an essential system property in critical industrial environments where failures of OT may lead to severe incidents that can cause significant financial losses and harm to humans and the environment. Section 2 provides further details on IT and OT.
  • Real-time closed-loop control of primary assets denotes the most fundamental CPS capability and is realized through the computing and communication capabilities provided by the secondary assets. Our case study investigates a specific CPS class required to provide hard real-time sub-millisecond closed-loop control on resource-constrained embedded devices for critical infrastructure control. A domain-specific example is the excitation control system responsible for maintaining the voltage and frequency of the generator within acceptable limits, which is critical for the stable and reliable feed-in to the power distribution system.
  • The Digital Twin is becoming a defacto standard element to enrich CPS asset capabilities and the smartness of CPS. Nevertheless, it is a novel paradigm in its early stages. So far, research has not agreed on a common definition [42], and with the increasing research on DT, new application areas and definitions emerge such as the one provided in Section 2.1. In industry, even pioneer companies are still in the initial adoption phases [5,19]. Hence, we decided to add Digital Twin to the smarter CPS design space and placed the Digital Twin technology element outside the circle of the most fundamental smart CPS components.
Preview of this work’s Digital Twin usage: Before we explain the remaining design space, we want to briefly preview our approach to using the Digital Twin to enhance CPS smartness. In this work, the Digital Twin concept involves cloning a real object (physical or software/virtual object) into a software counterpart, denoted as a logical object. We use this logical object to reflect all the essential properties and characteristics of the original object to address the needs within a specific application context. In particular, we use logical objects to support dynamic and context-aware updating and reconfiguration of primary and secondary CPS assets at runtime. In the remainder of this work, we investigate how this approach shall facilitate the adjustment (i.e., adaptation) of the underlying CPS software structure and behavior and how this adjustment can affect the physical and virtual CPS spaces in order to satisfy short- and long-term stakeholder concerns in a continuously evolving operational context.
The smarter CPS design space: The principal idea of our design approach toward smarter CPS is to reuse as many elements of the fundamental CPS technologies as possible. Hence, our approach is to enrich the fundamental CPS elements—particularly the secondary assets’ computing capabilities—with the capabilities necessary to manage continuous change. Depending on proximity and time scales [6], the change-management processes of the AdEpS model are driven by either humans or machines. This is illustrated in Figure 1a through the machine-driven CPS self-adaptation and the human-driven CPS evolution capability elements. These capabilities are essential to implement the AdEpS change processes shown in Figure 1b.
Machine-driven change is typically operations/runtime-centric and implements the adaptation-management processes. Self-adaptation systems provide the capabilities necessary for adaptation management, which can be divided into two groups: data-enabled and data-driven approaches. Data-enabled approaches use runtime information to perform immediate (e.g., sub-millisecond scale) system adaptations in reaction to uncertain operational and environmental conditions. Examples include system adaptations in response to failures, misconfiguration, and security attacks to ensure service continuity and dependability (i.e., availability, integrity, safety, and security) [18]. Data-driven approaches typically operate at a slower time scale. They are generally based on machine learning and model-based approaches and may integrate humans into the decision process. Data-driven approaches aim to identify the ideal parameters and process conditions to, e.g., maximize process yield and physical equipment longevity [43,44,45].
Human-driven change is typically development/engineering-centric and implements the evolution processes through the development, testing, and deployment of hardware and software. In industrial systems, these processes are split into offsite (i.e., office, laboratories, and test facilities) and onsite (i.e., operational industrial facilities) activities. Offsite activities comprise rigorously defined development and testing processes to ensure CPS safety and security [16,46]. Onsite activities comprise all commissioning and maintenance work required to make and keep the CPS facilities operational. Today, even small changes in CPS processes or behavior usually result in a halt of the operational system required for the onsite deploying, configuring, and testing of control software. These processes entail downtime, during which costly equipment stops generating revenue. In addition, the primarily manual and laborious interactions with the system are error-prone, time-consuming, and costly. These manual onsite interventions will eventually become unmanageable in the increasingly dynamic industrial environments and ecosystems. Hence, the industry calls for solutions that effectively support the industrial use cases listed in Table 1 (see U1 to U4) [47,48,49,50,51].
With the introduction of DevOps for CPS, we aim to streamline the offsite development-centric and the onsite operation-centric processes. To that aim, we seek to transfer the following DevOps practices: continuous integration (CI), continuous deployment (CD), and continuous experimentation (CE). CICD comprises automated software testing, integration, building, and deployment to reduce manual work and streamline software deployment [52,53]. In a similar vein, CE is a proven method for systematically running experiments within large software-intensive environments to assess the performance and quality of new software variants in their real operational context and environment before their actual deployment [54]. For instance, A/B testing is an approach that compares the performance of software variants by establishing and evaluating controlled online experiments within the operational software system. This methodology improves the software development and engineering processes by enabling a data-driven approach to development and engineering [36].
In line with other research [5,19], we argue that the servitization of CPS assets can support the above use cases and their integration into modern industrial product–service ecosystems. In addition, we also argue that servitization facilitates the integrated adaptation and evolution of smart CPS through unified service-oriented CPS asset interfaces since such interfaces (a) can be offered to humans and machines alike (b) to drive CPS change, (c) to coordinate and manage (i.e., integrate) various change processes, (d) to abstract complexities and technical aspects, and (e) to document and describe CPS runtime and engineering capabilities and behavior.
During the first two phases of our case study and the extensive analysis of the scientific literature (see Section 2), we identified the Digital Twin as a suitable technology element to realize such unified service-oriented interfaces [31]. In our case study, the attraction of the Digital Twin principle lies in its ability to realize capabilities that span multiple lifecycle phases and to make these capabilities accessible to humans and machines alike. In particular, Digital Twins have the potential to serve as a unified means to describe, document, abstract, monitor, access, manage, and transfer runtime and engineering knowledge between humans and machines and across CPS layers and lifecycle phases [55]. In order to unfold this potential, developing a software system that supports the integration and interconnection of Digital Twins throughout all CPS layers (i.e., cloud, edge, and embedded control layers) becomes necessary. The transfer of the Digital Twin principle to the embedded and mission-critical CPS layers is among the main challenges toward realizing DevOps for CPS.
As shown in Figure 1a, we have identified three design dimensions required to provide the outlined smarter CPS capabilities:
  • Adaptability denotes the ability of a system to adjust its properties to new conditions. The sources of such new conditions are represented in the AdEpS model through uncertainty—see [9] for a detailed explanation. Table 1 summarizes and Section 9 discusses how this work addresses the uncertainty types highlighted in Figure 1b. Adaptability is realized through two principal properties of self-adaptive systems: parameter-based and architecture-based adaptation. Parameter-based adaptation is the ability of a software system to adapt internal variables to, e.g., optimize the parameters of a control function or communication protocol at runtime. In contrast, architecture-based adaptation is the ability of a software system to change its structure to, e.g., update software components and the way they are composed and interact. Thereby, architecture-based adaptation supports the evolution of software systems to cope with novelty and unanticipated change (i.e., design/goal uncertainty).
  • Context- and Self-Aware Ability: Self-awareness means the system knows its own states and behaviors. Context-awareness means that the system is aware of its context, i.e., its operational environment. Both properties are based on self- and context-monitoring, which reflects what properties are monitored [56]. Context-awareness is required to obtain awareness of environmental uncertainty. On the other hand, self-awareness is required to address change-enactment uncertainty.
  • Manageability in our case study denotes the ability of the system to make change-management capabilities (i.e., the functions necessary for system adaptation and evolution) easily accessible for humans and machines throughout all system lifecycle phases.
In this work, we follow an architectural approach to address these design dimensions in an integrated manner. We have defined the following research agenda to guide the literature research as well as the research design and evaluation process.

1.3. Research Agenda and Methodology

Based on the initial research questions and the described design space, we apply the Goal Question Metric (GQM) [57] to narrow down the objective of the presented case study:
Purpose: Develop and evaluate.
Issue: A DT-enhanced self-adaptive software framework (SWF) for sub-millisecond real-time closed-loop control of high-availability mission-critical smart CPS.
Object: To support the adaptation and evolution of the CPS physical space and cyberspace to emerging needs (i.e., goal uncertainty) and uncertainties in their environment and operational context (i.e., environmental and change enactment uncertainties) without causing system interruption and downtime.
Viewpoint: From the viewpoint of researchers and practitioners.
Based on this objective, we refine the initial research questions and define three design-specific research questions. These research questions are aligned to the design dimensions shown in Figure 1a.
RQ1 
Context- and Self-Aware Ability: How to design and integrate Digital Twins into software systems so that they provide a high-fidelity (i.e., real-time sub-millisecond) reflection of their CPS operational context in physical space and cyberspace that is available for autonomous (i.e., context-aware and self-aware) decision-making on resource-constrained embedded control units?
RQ2 
Adaptability: How to design control software for resource-constrained embedded control units that supports parameter-based and architecture-based adaptation without causing system downtime and interruptions during the simultaneous execution of sub-millisecond real-time closed-loop control services?
RQ3 
Manageability: How to automate and orchestrate distributed adaptations in the CPS physical space and cyberspace to support practitioners (i.e., development, operation, maintenance, and commissioning engineers) in mastering software-related complexities during CPS development and operations (i.e., monitoring, deployment, commissioning, control/operation, and maintenance)?
In our case study, we use these research questions and the design space to guide our literature research and the design process of the self-adaptive software models underlying our proposed architectural solution. In order to evaluate the characteristics of our proposed self-adaptive software systems, we implement them within an SWF, which we use to conduct empirical experiments. Therefore, we apply the methodology of empirical software experimentation [58] enhanced by the guidelines proposed by Gerostathopoulos et al. [59]. Besides defining a structured research agenda/scope and experiment design, one of their key recommendations is to establish an explicit mapping between software architecture components and their corresponding MAPE-K elements. We establish this explicit mapping in Section 4.2.
Research Scope: To the best of the authors’ knowledge, this work is the first to investigate DT-enhanced self-adaptative software design models for embedded OT control units targeting sub-millisecond real-time closed-loop control. Hence, this work’s case study has the characteristics of a feasibility study, intending to assess the proposed SWF’s (and its underlying design models) effectiveness and applicability. Therefore, this work’s experimental goals are to assess the SWF’s MAPE-K characteristics alongside the execution of mission-critical closed-loop control services. The proposal and evaluation of innovative analyze–plan (AP) approaches that utilize DT capabilities on control units are the subject of future work. Considering the AdEpS model, this work aims to evaluate the SWF’s monitoring (M), enact/execution (E), and knowledge base (K) characteristics and its capabilities to deal with uncertainty. Therefore, this work assesses the SWF’s parameter-based and architecture-based adaptation mechanisms and the SWF’s ability to reflect the states and operational context of its primary and secondary assets. In addition to the empirical evaluation, Section 9 provides a qualitative discussion of how the proposed approach, particularly CE, can contribute to mitigating model uncertainty. Table 1 gives an overview of the conducted experiments and the DevOps capabilities that are thereby demonstrated.

2. State-of-the-Art Analysis of Digital Twins in Modern Industrial Environments

2.1. Definition and Fundamental Concepts of Digital Twins

The concept of DT is a powerful way to bridge the gap between the physical and the cyber worlds by creating logical objects that mirror their physical counterparts. The concept of DT was first proposed in a presentation by Michael Grieves in 2003. Its usage first grew in the manufacturing environment [60,61] and later in the Internet of Things (IoT) [27] and Cyber-Physical Systems (CPSs) communities [43]. Since then, the DT model has evolved from its original conception as a tool for designing and manufacturing physical products to a general framework applicable to virtually any physical object and even intangible objects such as digital services [27,29,31,43,62].
As stated in the introduction, Digital Twin research and Digital Twin usage in industry are both young and rapidly evolving fields. Until now, research has not agreed on a common definition. Therefore, Kuehner et al. [42] conducted a meta-review of definitions of Digital Twin in the context of Industry 4.0. As a result, they proposed the following synthesized definition:
A Digital Twin is a virtual representation of its physical counterpart. Its components provide the basis for a simulation or are simulation models themselves. The Digital Twin has an automated bidirectional data connection with the represented physical counterpart. This connection may span across several life phases of the system”.
However, new definitions emerge with the increasing research and exploration of new application areas. In this work’s design space, where system evolution and adaptation depend on the operational context of both the physical world and the cyber world, the Digital Twin definition must be extended to incorporate evolutionary behavior and the diverse sources of uncertainty (see Figure 1b). To that aim, we provide the following definition of Digital Twin:
A Digital Twin is a virtual representation of a tengible or intengible object. This concept involves cloning a real object into a software counterpart, the logical object. The logical object bidirectionaly reflects the essential properties and characteristics of the real object as required by the specific operational context and lifecycle phase (i.e., the Digital Twin’s intended use). The logical object shall provide a service-oriented interface for seamless interaction and composition with other logical objects and software services and to facilitate the real and logical objects’ cooperation and co-evolution to cope with changing system goals”.
Below, we briefly discuss this definition. Figure 2a illustrates the principle elements of our proposed DT definition, and Figure 2b contains the tangible and intangible objects of interest: the primary and secondary assets. In our case study, the primary assets (i.e., physical equipment, machinery, and processes) and secondary assets (i.e., the entire ICT infrastructure, including the computing hardware and software elements like services, data, and communication links) represent the set of real objects to be reflected by logical objects. These logical objects can then be used to establish the context- and self-awareness required for managing system change and uncertainty. In other words, we generalize the definition of DTs and conceptualize them as digital versions of real-world systems providing a softwarized copy: the logical object of the real object to be modeled. A logical object is designed to reflect the real object’s properties, structure, behaviors, and relationships to meet the operational context needs. In this context, the real object and its software counterpart cooperate and co-evolve to enhance the real object’s functionalities and continuously satisfy short- and long-term stakeholder concerns.
Figure 2b shows the concept of a typical software architecture that supports the DT principle in industrial environments such as power plants, oil refineries, water and wastewater treatment, and manufacturing facilities. From a software architectural point of view, the DT software system can be structured into four layers. The data layer at the bottom represents the target environment (i.e., the CPS) that the DTs shall reflect in the higher software layers. The physical layout of such a CPS is organized as distributed control systems (DCSs) (see Section 2.3) and comprises the primary assets (PAs) and secondary assets (SAs) that implement the intended CPS functionality (Section 1.2 and Section 2.3 give further insights about asset properties). The enterprise service bus (ESB) at the integration layer denotes a middleware framework for interconnecting all software system services and objects. In the physical world, this interconnection is realized through the IT and OT network elements that interconnect the real and logical objects on the data layer, as shown in Figure 3. The architecture-centric view of the ESB allows for abstracting the complexities and heterogeneity of the underlying IT and OT hardware, software, and protocols. In short, the ESB models the middleware that interconnects all objects on the data layer, and it can grant access to information and functions provided by these objects for their integration into the service layer. The service layer denotes the software layer that implements Digital Twin-enhanced services to organize and process gathered data and information. These services provide the functionality to build a modern industrial service (eco-)system to enrich both the data and the business layer functionality.
As we argued in the introduction, Boschert et al. [55] also propose that next-generation Digital Twins must provide the means to cooperate and co-evolve with the elements in the upcoming industrial ecosystem. We explicitly integrate these needs through the service-oriented interface property in our definition of Digital Twin. The service-oriented nature of the interface stems from the fact that a Digital Twin, particularly its logical object, is a software service in its essence. This service provides the means to describe, monitor, and control its associated real object throughout its lifecycle. The design of modern software services adheres to service-oriented computing principles. Service-oriented computing is a computing paradigm that utilizes services as fundamental elements for application development. Instead of paraphrasing the very precise overview of services from Papazoglou and Georgakopoulos, we give it as a direct quotation [63]:
“Services are self-describing, open components that support rapid, low-cost composition of distributed applications. Services are offered by service providers—organizations that procure the service implementations, supply their service descriptions, and provide related technical and business support. Since services may be offered by different enterprises and communicate over the Internet, they provide a distributed computing infrastructure for both intra- and cross-enterprise application integration and collaboration.
Service descriptions are used to advertise the service capabilities, interface, behavior, and quality. Publication of such information about available services provides the necessary means for discovery, selection, binding, and composition of services. In particular, the service capability description states the conceptual purpose and expected results of the service (by using terms or concepts defined in an application-specific taxonomy). The service interface description publishes the service signature (its input/output/error parameters and message types). The (expected) behavior of a service during its execution is described by its service behavior description (for example, as a workflow process). Finally, the Quality of Service (QoS) description publishes important functional and nonfunctional service quality attributes, such as service metering and cost, performance metrics (response time, for instance), security attributes, (transactional) integrity, reliability, scalability, and availability. Service clients (end-user organizations that use some service) and service aggregators (organizations that consolidate multiple services into a new, single service offering) utilize service descriptions to achieve their objectives”.
In addition to these service-oriented aspects, we want to quote and forward the interested reader to Antoine Beugnard’s discussion of the concept of Digital Twin from a software engineering perspective [64]. The author describes the Digital Twin internals and interfaces from a software component’s perspective, also considering the overarching aspects of the Digital Twin’s system layers and lifecycle phases.

2.2. Challenges

In industrial environments, operation technology (OT) comprises the hardware and software that monitors and controls machines, processes, and infrastructure. Information technology (IT) combines technologies for networking, information processing, enterprise data centers, and cloud systems. OT devices control the physical world and run special-purpose software designed for integrity, high availability, and safety. In comparison, IT systems manage data and applications, and the design focus is on security, interoperability, and continuous maintenance supported by practices such as CICD. In theory, CD allows the release of software daily, weekly, fortnightly, or whatever suits the business requirements. In notable contrast, OT devices may run for decades without being updated and consequently might have numerous software vulnerabilities. However, the convergence of runtime and development time and the need for smarter OT software systems—which we discussed in Section 1—results in the increasing use and adoption of IT in the OT domain. This trend is commonly denoted as the convergence of IT and OT and is accompanied by many open challenges [65,66,67].

2.2.1. The Challenge of IT and OT Convergence

One of the most relevant examples of current practices in the OT domain is the significant adoption of microservice architectures and the extensive usage of container technology to facilitate CD. For example, Bellavista et al. [29] introduce design patterns for future DTs. Based on these patterns, they conceptualize and demonstrate a DT container to ease the management of real objects at the industrial edge using IT tools like Docker, Kubernetes, and Istio. Damjanovic-Behrendt and Behrendt [26] propose a similar approach with a strong focus on DT integration and the comparison of open-source tools. In their DT proposal, they use IT tools such as Apache Kafka, RabbitMQ, and the Elastic Stack to deliver the DT core services (i.e., data manager, model manager, and service manager). Wang et al. [28] present a vehicular use case, exemplifying a cloud–edge framework based on Amazon Web Services (AWSs). Their approach describes a sophisticated framework to create a DT aggregate consisting of three DT instances (i.e., Human, Vehicle, and Traffic), together representing a holistic mobility DT. Stated practices are the de facto standard for building highly distributed, adaptive, and manageable cloud and edge deployments.
However, adopting these IT solutions at the OT control unit level remains a challenging problem. Siqueira and Davis [19] thoroughly analyze the state-of-the-art literature on designing and building the computing and software infrastructure required by Industry 4.0. Their survey clearly states that containerization is a mature technology for cloud environments, but its support on embedded devices still needs improvement. Our previous work [31] compares the system architectures of IT and OT environments to analyze the challenges associated with implementing IT-based software-deployment strategies in OT environments. We conclude that using cloud and edge patterns such as sidecar proxies, message broker systems, and load balancers can result in intolerable delays and may lead to single-point and common-cause failures.
As outlined in the introduction, the transfer of these practices from the IT domain to the mission-critical embedded OT domain is at the heart of our methodology. In order to discuss and address the challenges related to modern OT architectures, networks, and communication standards, we proposed a set of microservice [21] and service mesh [17] patterns for use in dependable environments. These publications propose architectural patterns and frameworks to reduce software complexity and increase system interoperability and manageability. We achieve this by encapsulating communication protocols and domain-specific data behind service-oriented interfaces. These interfaces allow for hiding the low-level complexities of the network, protocol/communication, and data layers, which ease the software development process on the application/service layer. We particularly emphasize the importance of evolution at the communication layer to make the systems resilient against protocol changes and to allow the dynamic integration of communication protocol stacks at runtime (which we also experimentally evaluate in Section 8 of the present work). In addition, our previous work discusses the benefits of modern publisher–subscriber machine-to-machine communication protocol standards such as OPC UA, DDS, and oneM2M, as well as the importance of time-sensitive communication. Tian and Hu [68] provide a more technology-specific viewpoint, where the authors discuss the role of OPC UA TSN in the convergence of IT and OT. In [69], Patera et al. build and evaluate the prototypical implementation of an ESB as modeled in Figure 2b. To that aim, they implement a three-layer framework: The top and bottom layers address IT and OT needs, respectively. The middleware layer uses OPC UA as a backplane protocol to interconnect diverse machine-level protocols from the bottom control layer with an event-streaming platform (i.e., Apache Kafka) on the top layer. Although the detailed analysis of their work is out of scope, we want to note that their solution is an instantiation of the infrastructure-as-a-service framework, which we proposed in [17].
The architectural models proposed in the present work are protocol- and technology-agnostic and can, therefore, be implemented using any technology and protocol standard appropriate. In principle, our design models use two protocol patterns: the command–response and publisher–subscriber patterns. These patterns can be implemented through industrial- and consumer-oriented (i.e., OT and IT) protocol standards. The Industrial Internet Consortium defines a comprehensive connectivity framework [70]. We refer the interested reader to their chapter “Core Connectivity Standards”, which assesses the features of the most relevant connectivity standards for modern industrial environments.

2.2.2. The Challenge of Runtime and Development Time Convergence

In Section 1, we explained the need for adaptation and evolution in software systems and showed that the realization of these properties results in blurring the traditional segregation between runtime and development time, which we denote as the convergence of runtime and development time. This section builds on our initial arguments and discusses industry practices to address emerging needs.
Agile software practices, including DevOps, are increasingly adopted by regulated industries, where safety and standard compliance are cornerstones in software development for mission-critical CPSs. These industries rely on rigorous engineering processes to deliver certifiable or certification-ready software. As concluded in [71], agile practices and CICD pipelines produce high-quality and certifiable software ready to be delivered more frequently to the end-user. They also conclude that DevOps practices cannot be directly adopted due to stricter safety, compliance, and CPS architecture requirements. Leite et al. [25] made a similar observation when analyzing the DevOps concept and challenges in the IT sector. They note that adopting DevOps practices imposes significant challenges on the system architecture, embedded systems, and IoT, including their design, management, and operation. Lwakatare et al. [30] conducted multiple case studies about adopting DevOps with companies from various industry domains. Their analysis pinpoints the distinguishing factors between applying DevOps in the web and embedded systems domain. Figure 3 shows their findings and identified key challenges [31].
Despite these challenges, the increasing interest of the regulated industry in DevOps practices has resulted in proposals of concepts and roadmaps [38,55,72,73,74,75,76,77] pursuing the introduction of DevOps for CPS design and operations. Most of these works put the Digital Twin at the center of DevOps to serve as a knowledge base for organizing and automating DevOps processes. While all these and similar works that we have found postulate that the DT can facilitate DevOps principles for CPS, we could not find any work that addresses CPS and DT service design for DevOps. To close this gap, we have recently proposed self-adaptive CPS design models [31] that use the DT as a shared knowledge base to orchestrate DevOps activities in a modern industrial environment, with a particular focus on distributed and networked embedded control units. However, evaluating these models’ effectiveness and practical implementation is still necessary. In addition, a more precise and explicit connection between the generic software models and the DT concept’s realization in practice is required [31].

2.3. Modern Industrial Environments

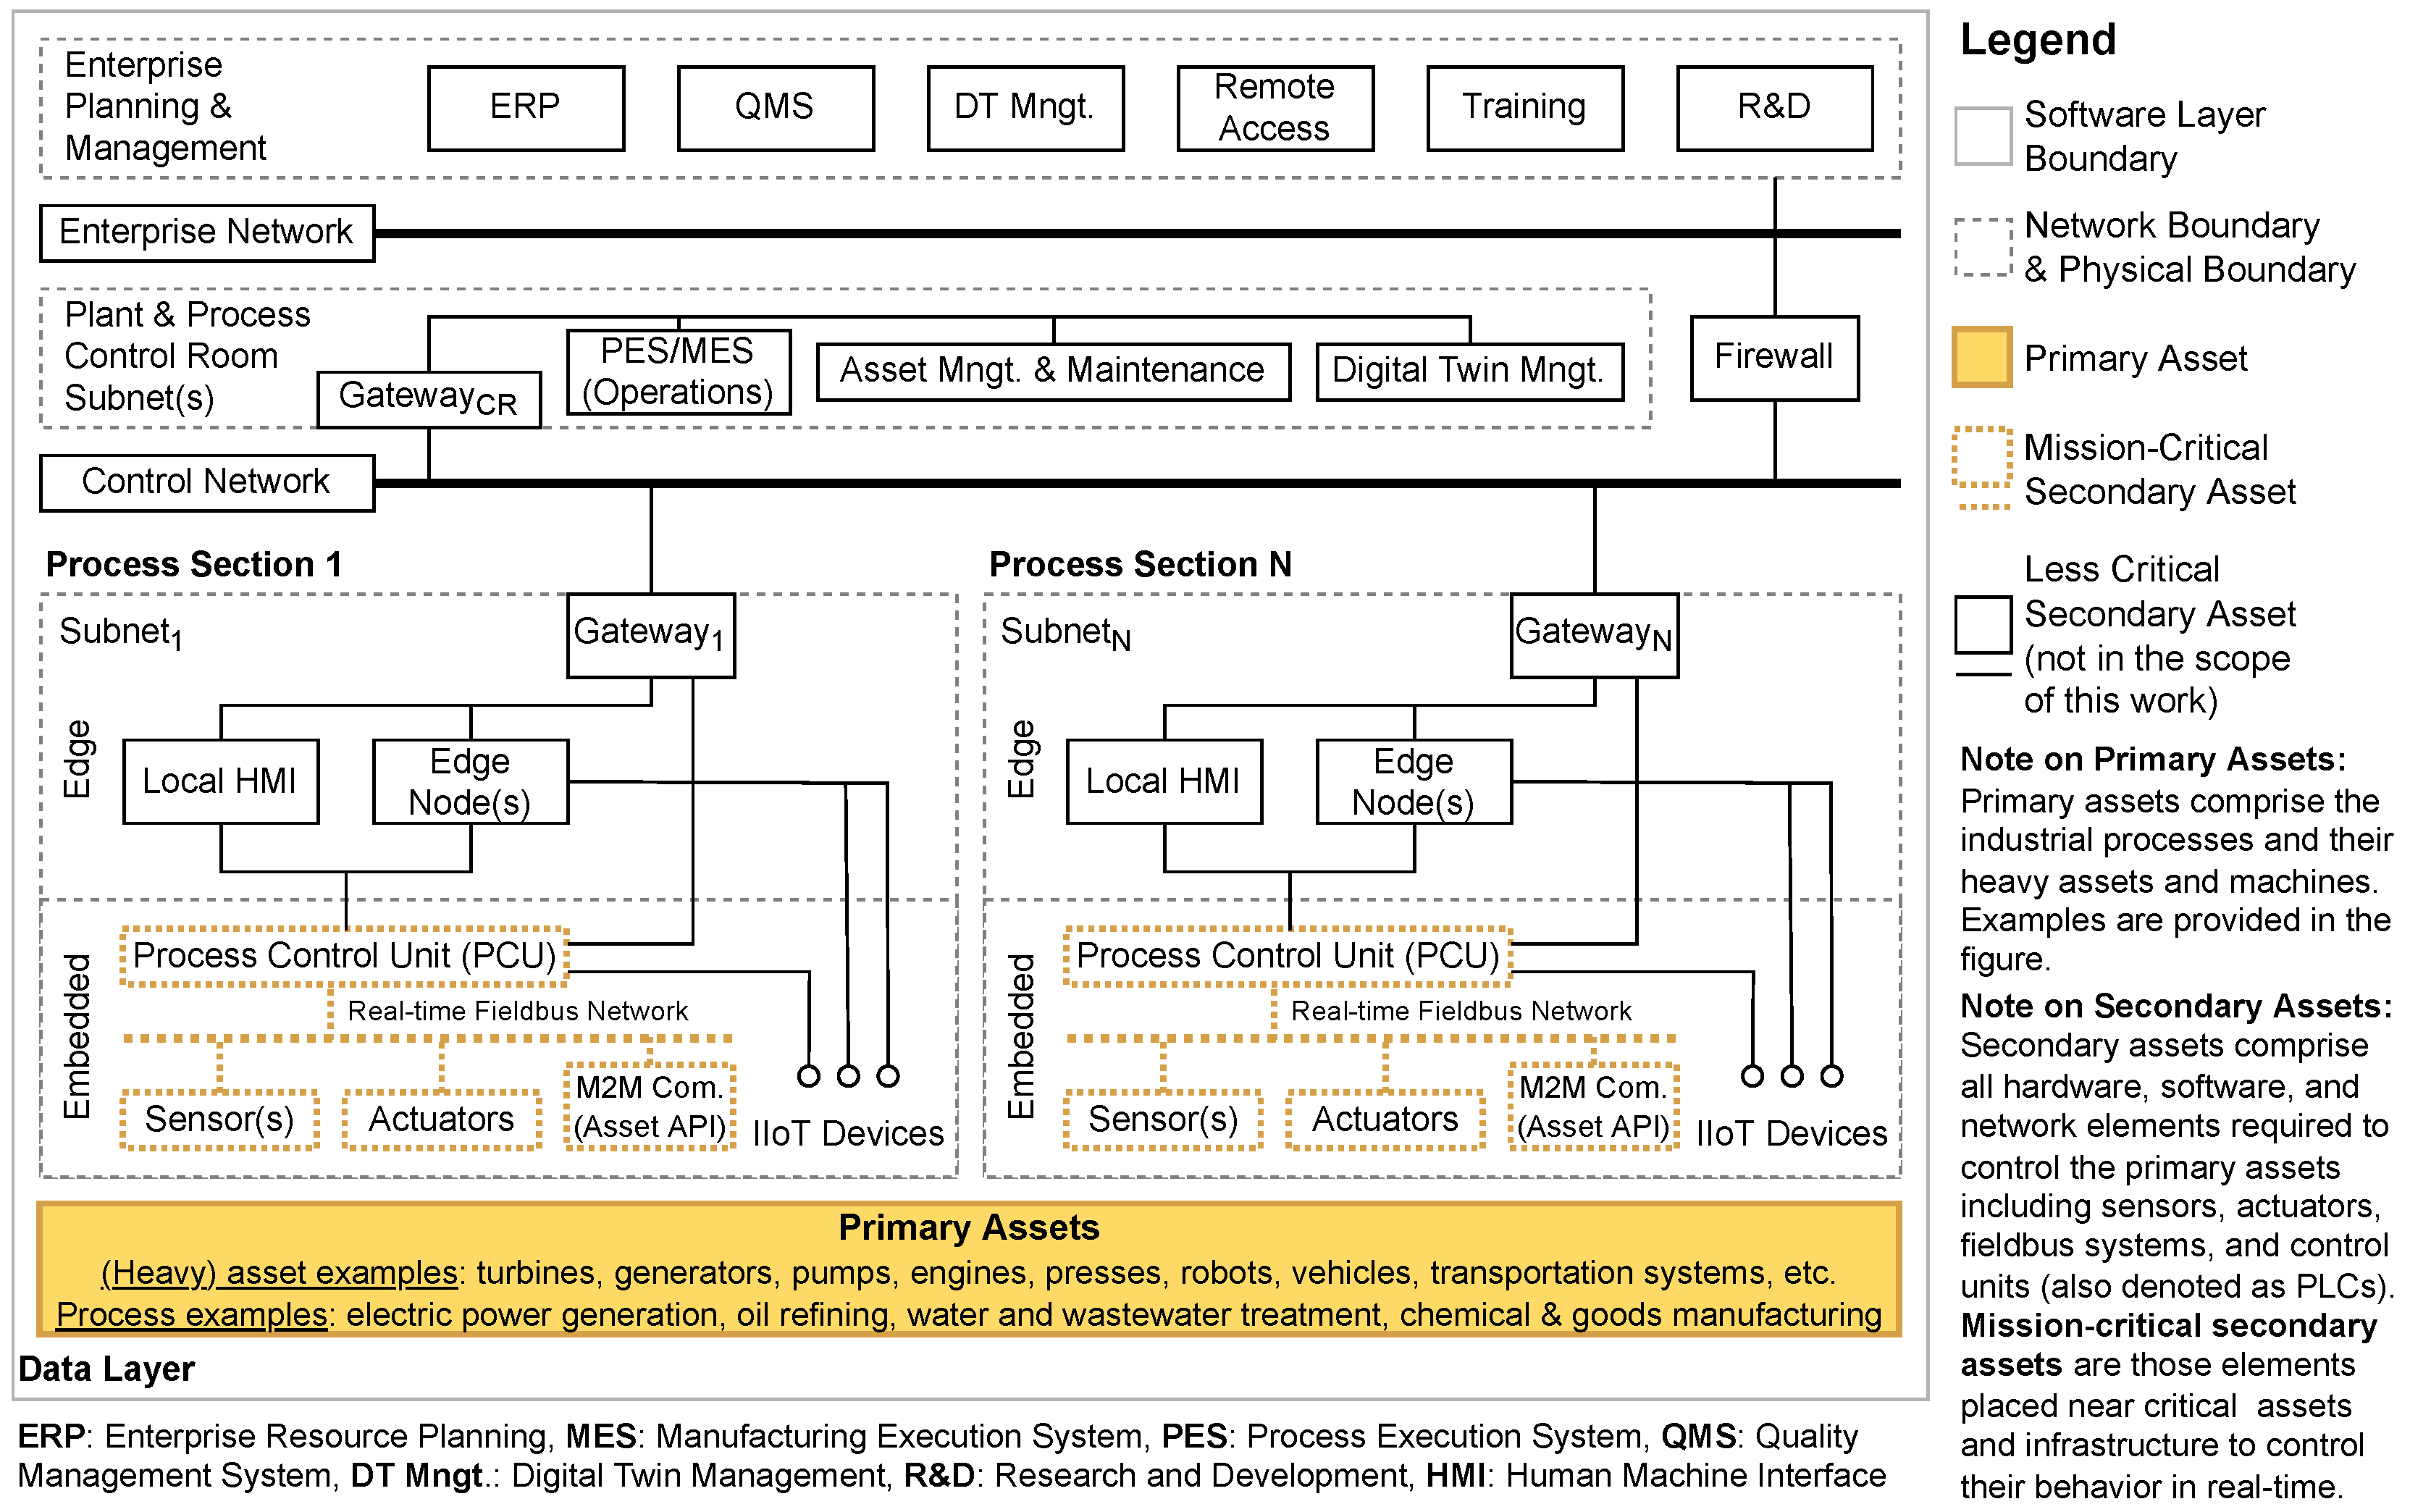
Modern industrial environments are CPSs, usually organized as distributed control systems (DCSs). A DCS employs a central supervisory control loop at the plant level to coordinate a group of localized controllers and machines that work together to manage the entire industrial process. DCSs are generally modularized to minimize the impact of single faults on the overall system. Modern DCSs are also connected to the enterprise network to supply business operations with a comprehensive view of the industrial process. Figure 4 illustrates the physical infrastructure layout of a modern DCS. It comprises the three characteristic layers: the enterprise, plant, and process levels [21].
The process level is modularized into multiple sections. Each process section hosts primary assets (PAs) and secondary assets (SAs). The PAs comprise heavy machinery and equipment to interact with processes in the physical world. The SAs represent all the necessary OT devices like sensors, network elements, control units, and actuators to manage, operate, and control the PAs and their associated processes.
Devices designed for OT are usually special-purpose-built. They run specialized software and various heterogeneous (and even proprietary) network and bus protocols. OT devices have a much longer lifespan than those used in IT, as they are built to withstand industrial environments for many years if not decades. Due to their integral role in critical infrastructure and process control, OT devices must operate continuously without failure, often 24/7.
OT devices and systems are not updated as often as their IT counterparts. In some cases, updates may not be supported at all, making OT devices more susceptible to software vulnerabilities. Accessing them can be challenging, given that they are installed in remote or harsh locations. Additionally, they may be controlled by partners or vendors. Any modifications to OT devices, including simple software updates, generally require a complex approval process as they can have cascading effects on the industrial process and system safety.
Safety-critical and mission-critical OT devices are embedded systems (as highlighted by the dotted elements on the embedded layer in Figure 4) that are increasingly part of networked systems that interact with each other to provide added-value functions on the system level. This interaction occurs via networks that are either private to the system (i.e., the control network and process section subnets), or linked to an IT cloud (i.e., the enterprise network), or both. One of the main challenges with these networks is ensuring cybersecurity. This means protecting the network and connected devices from malicious attacks that aim to alter their intended behavior. It is important to note that not all secure systems are safety-critical, but all safety-critical systems must be secure. Otherwise, intruders could compromise the built-in safety features. However, functional safety and cybersecurity have evolved independently in most industry sectors (e.g., IEC 61508 and IEC 62443 in the automation sector; ISO26262 and ISO/SAE 21434 in the automotive sector) since highly specialized knowledge is required to meet the requirements of the individual standards. Due to the increasing connectivity requirements, integrated design approaches are emerging to tackle the needs of safety- and security-critical systems. Two typical integrated design approaches are defense-in-depth and zonal architectures. Defense-in-depth proposes using multiple successive and diverse vertical layers, while zones cluster the system or a single layer into groups with similar security requirements. Each layer and zone provides failure and attack prevention/detection to shield and control a sub-system instead of the entire system. This eases the overall design since the individual sub-systems are smaller and can be designed for their specific security and safety needs. These needs are defined during risk assessment and classified by safety-integrity and security levels. Besides safety and security requirements, such a modularization aligns with the fault-tolerance idea of separating the production process into multiple process sections (e.g., production cells) to mitigate failure propagation due to single section and equipment failures. Figure 4 shows the resulting modularization into subnets/zones and layers. Access to the control network, i.e., the plant-level backbone network, shall only be granted through gateways [16,46,78,79,80].
In addition to OT equipment, process-level subnets include IIoT devices and edge nodes. Unlike OT devices, IIoT devices have a substantially shorter lifespan. They typically communicate via standard IT protocols and support monitoring and control capabilities at a low cost. Edge nodes provide extensive connectivity and offer relatively high computational and memory capabilities on-premise. Edge nodes enable offloading services and information requests from other process sections and DCS layers, including the cloud. In addition, edge nodes can take over computing tasks such as processing, storage, caching, and load balancing on data sent and received. These characteristics can enhance several aspects, including data protection (by processing sensitive data onsite instead of in the cloud), responsiveness (due to lower latency at the edge compared to higher layers and the cloud), and traffic management (by enforcing precise control over mission-critical traffic flows as they move through the industrial network) [81,82].
The plant level regards the management and operation of plant processes. The critical component is the Process-Execution System (PES), which provides a centralized overview of process conditions and equipment states. Depending on the process, the PES may receive dozens or even hundreds of process variables and heavy asset and machinery setpoints. Observations may lead to automatic or manual set point adjustments or confirm the process is in control. Aside from the operations services, asset management and maintenance ensure the plant processes’ continued and optimal service over time.
The enterprise level is about decision making and business operations and planning. In this regard, enterprise resource planning (ERP) software provides critical information on supply chains, cash flows, customer orders, and production processes. Decision makers use this information to determine production timing and quantities. The quality management system (QMS) supports coordinating and directing organization activities to meet customer and regulatory needs and continuously improve overall effectiveness and efficiency.

2.4. Modern Industrial Software Architectures

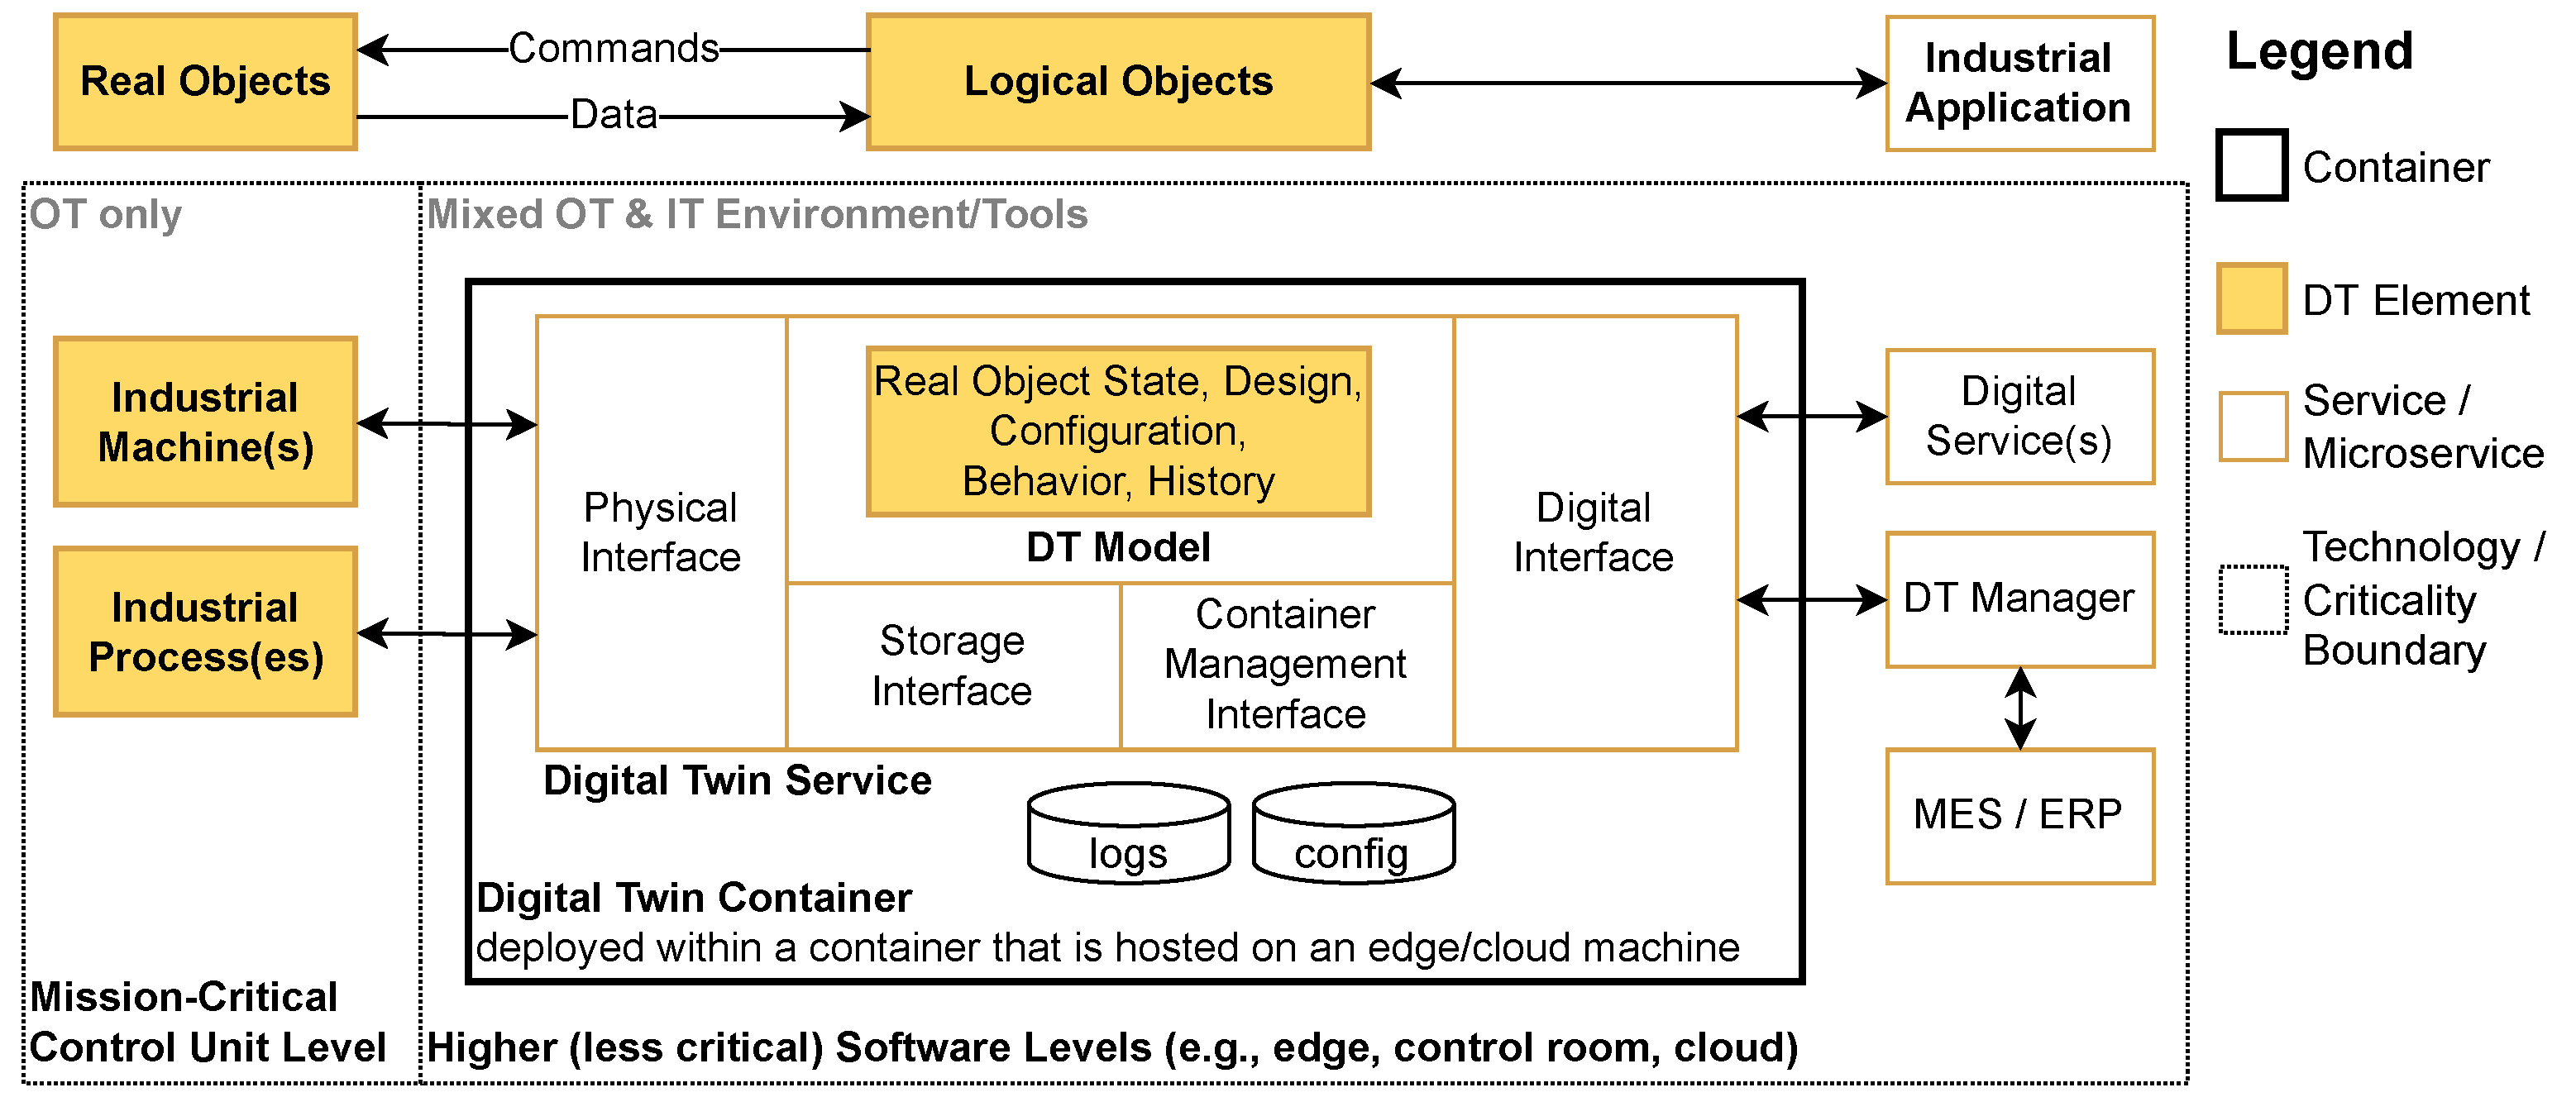
In recent years, industries and researcher initiatives have established several multi-layer reference architectures and frameworks [44,70,78,83,84,85,86] in a joint venture to foster interoperability, standards, and other baselines across all software layers. With Figure 2b, we already explained the typical layers that can be found in industrial software systems that support the DT principle. In this section, we present a recently published architectural design by Bellavista et al. [29]. They proposed a containerized DT service intended for edge computing [87]. Their concept makes DT services adaptive to changing needs by supporting their (re-)deployment in IT cloud and OT edge environments. To that aim, they structure the DT service according to microservice patterns, allowing DT lifecycle management through the exploitation of orchestration solutions. In the software architecture shown in Figure 4, the DT container serves as the host for the DT service, which is composed of multiple microservices. The DT service contains and manages the DT model of its associated real objects, e.g., representing industrial machine and process state, design, configuration, and behavior. Interaction with external entities is enabled via four interfaces. The physical interface manages the communication with the real objects, while the digital interface enables communication with digital services operating industrial applications (i.e., the logical objects). The DT service uses the storage and container interface to self-manage its migration between the cloud and edge.
The presented containerized DT approach relies on IT tools (e.g., Docker, Kubernetes, and Istio). As outlined at the beginning of this section, the usage of these technologies limits their applicability to the edge layer, which is also indicated by the technology boundaries shown in Figure 5. Nevertheless, we intentionally presented the approach in more detail for several reasons. To begin with, we subsequently use the clear architectural representation to position our approach. In addition, they demonstrated that a microservice-based design can effectively increase the adaptivity and manageability of industrial software services and components, such as DTs. Finally, the example showcases the present capabilities of IT-driven solutions to expand across cloud and edge settings. However, it also highlights their notable constraints in extending the DT principle to mission-critical OT environments.

3. Requirements for DT-Enhanced Embedded Control Software

Based on the design space and research agenda described in Section 1 and the state-of-the-art analysis in Section 2, we can define the following set of requirements for the envisioned SWF that shall run on resource-constrained embedded OT control units for mission-critical CPS control:
R1 
Primary Asset Closed-Loop Control: The SWF shall support sub-millisecond real-time closed-loop control of primary assets
R2 
Primary Asset Monitoring Fidelity: The SWF shall support logical objects that reflect primary asset states at a sub-millisecond time scale.
R3 
Secondary Asset Monitoring Fidelity: The SWF shall support logical objects that reflect secondary asset states at a sub-millisecond time scale.
R4 
Secondary Asset Closed-Loop Control: The SWF shall support sub-second parameter-based self-adaptation of primary and secondary asset parameters.
R5 
Secondary Asset Management: The SWF shall support architecture-based self-adaptation of both mission-critical and non-critical control unit services.
R6 
Servitization: The SWF shall provide interfaces that allow access to the primary and secondary asset logical objects’ monitoring and adaptation services for integration and use at all CPS layers.

4. Design of a DT-Enhanced Self-Adaptive Software Framework for Mission-Critical Industrial Process Control

In this section, we discuss our solution for a DT-enhanced control service designed with the aim to improve the autonomy and adaptability of CPS in operating and managing their mission-critical physical space and cyberspace. We introduce the service software architecture to establish an explicit map between architecture elements and their corresponding MAPE-K elements. Then, we present our SA DT model and explain relevant implementation aspects of the model and the control service. Finally, we conclude this section by discussing the applied design patterns and approaches.

4.1. Software Architecture of the DT-Enhanced Control Services

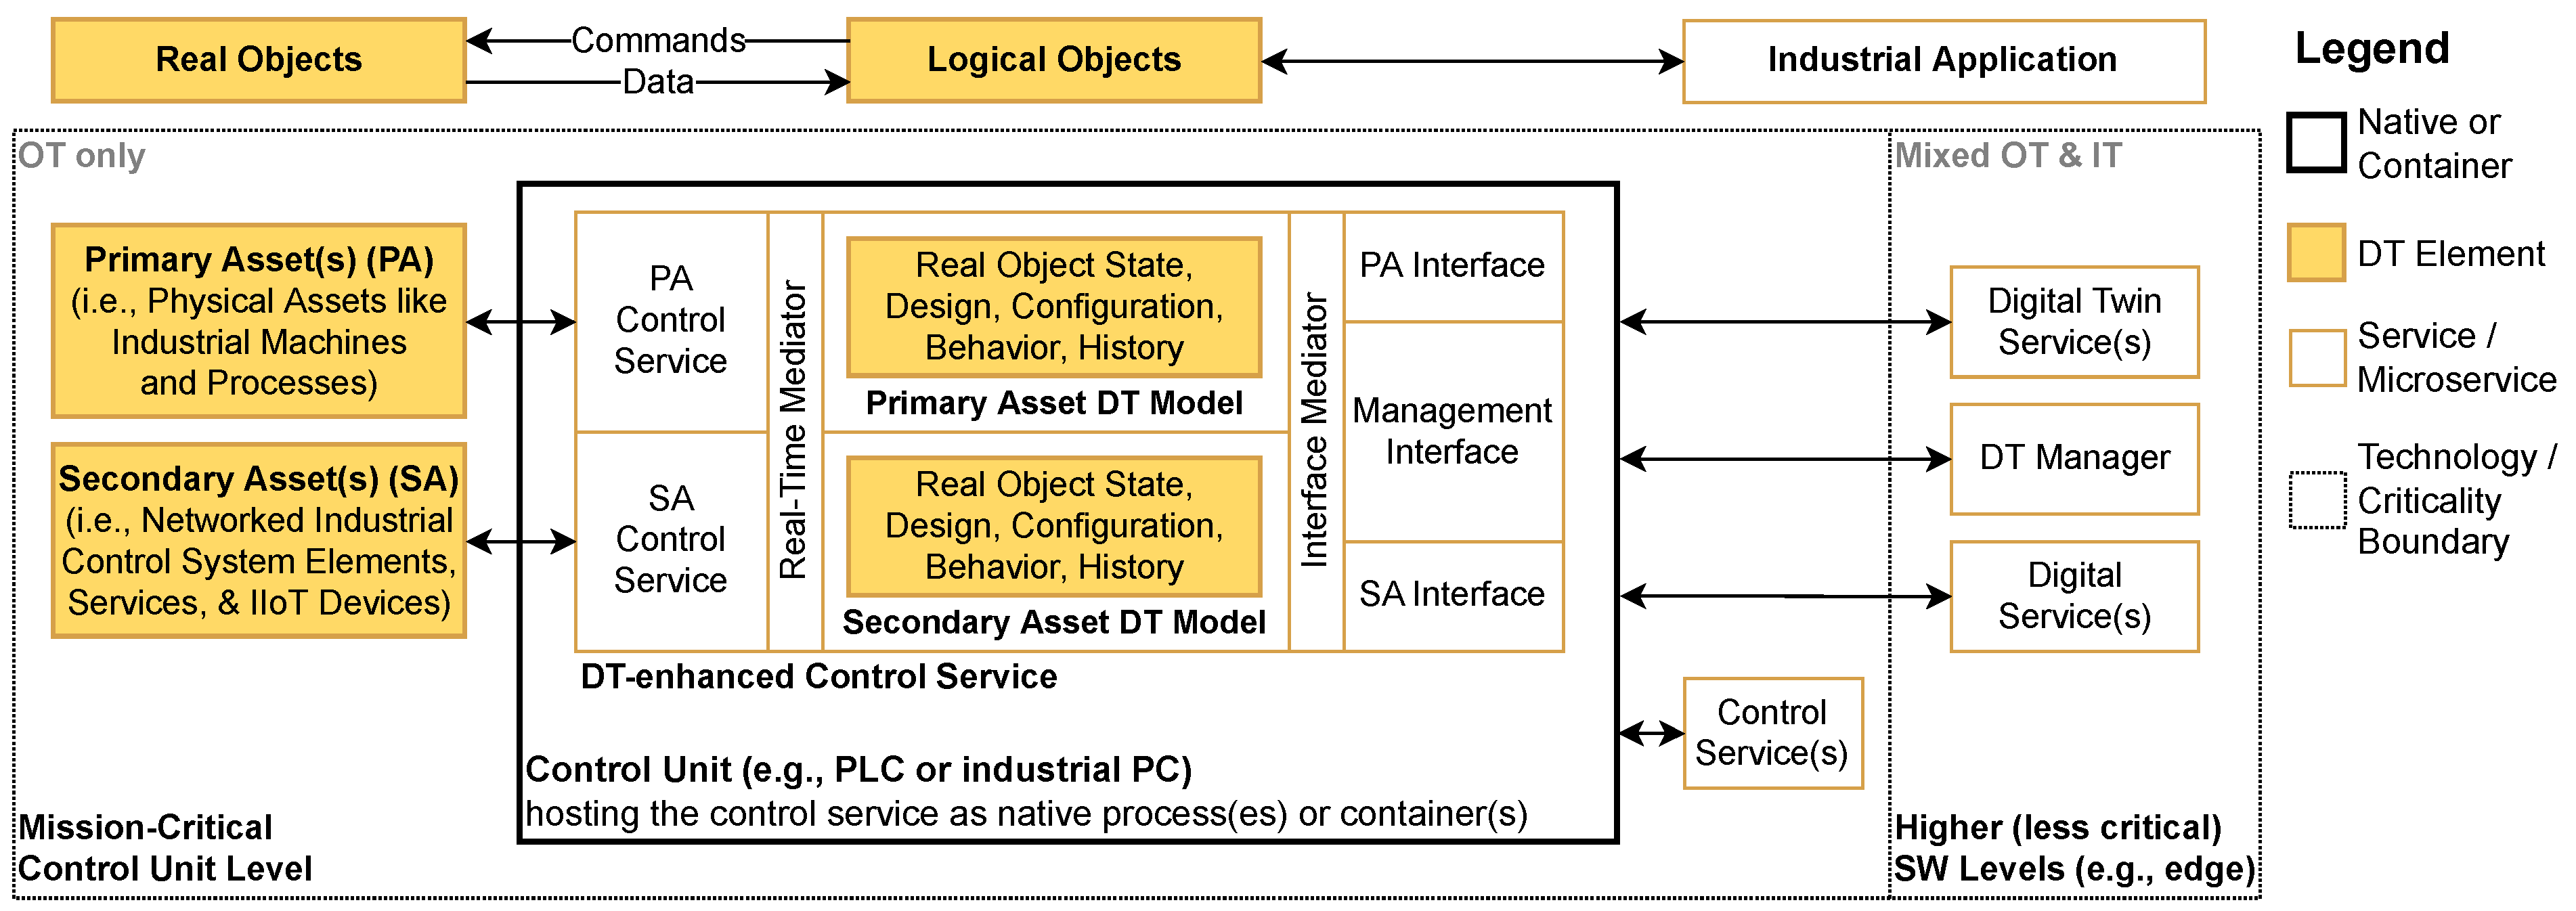
Figure 6 shows the software architecture of the DT-enhanced control service. The service is structured into several microservices designed to support various configurations to compose the overall service, such as the following.
  • All microservices run as native processes hosted by the control unit.
  • All microservices are hosted within a container (similar to the containerized DT) that runs on the control unit.
  • A mixed configuration where some microservices run as native processes and others within a container environment.
The DT-enhanced control service manages two DT models: the primary asset (PA) DT model and the secondary asset (SA) DT model. The PA DT model can reflect industrial machines and processes as logical objects. The SA DT model supports creating logical objects that can reflect the state, design, configuration, structure, and behavior of IT and OT elements (i.e., the entire ICT infrastructure), which Section 2 explains in more detail. Two mediator services moderate (i.e., synchronize) the access to these logical objects. The real-time mediator provides deterministic read/write access to the logical objects required for mission-critical real-time PA and SA control. In contrast, the interface mediator does not need to meet real-time constraints and exposes, besides read/write access to logical objects, various management interfaces (typically a command–response API) for reconfiguration and orchestration.
Interaction with external entities is enabled via three interfaces. The management interface discloses management, reconfiguration, and orchestration capabilities to external services. The two asset interfaces reveal access to PA and SA data and services. All interfaces support reconfigurable software-based (and, depending on the network interface, hardware-based) traffic shaping. Traffic shaping, or packet shaping, is a technique for managing network congestion. It controls the data transfer by prioritizing the processing of packets according to packet-specific quality-of-service (QoS) properties. Traffic shaping is required to classify and prioritize mission-critical traffic over less critical traffic [68,88].
All three interfaces must use the mediator services to interact with the local control services, which is necessary to guarantee system integrity during data and service manipulation and orchestration. In addition, such a design enables the implementation of a script engine on top of the mediators to provide the following features:
  • Practitioners can dynamically interact with the system using a well-defined command-line interface.
  • Practitioners can use scripts to automate tasks that can be verified beforehand, lowering the risk of errors.
  • Practitioners can use scripts to define context-aware tasks for autonomous execution by, e.g., transferring script execution to the SA control service.
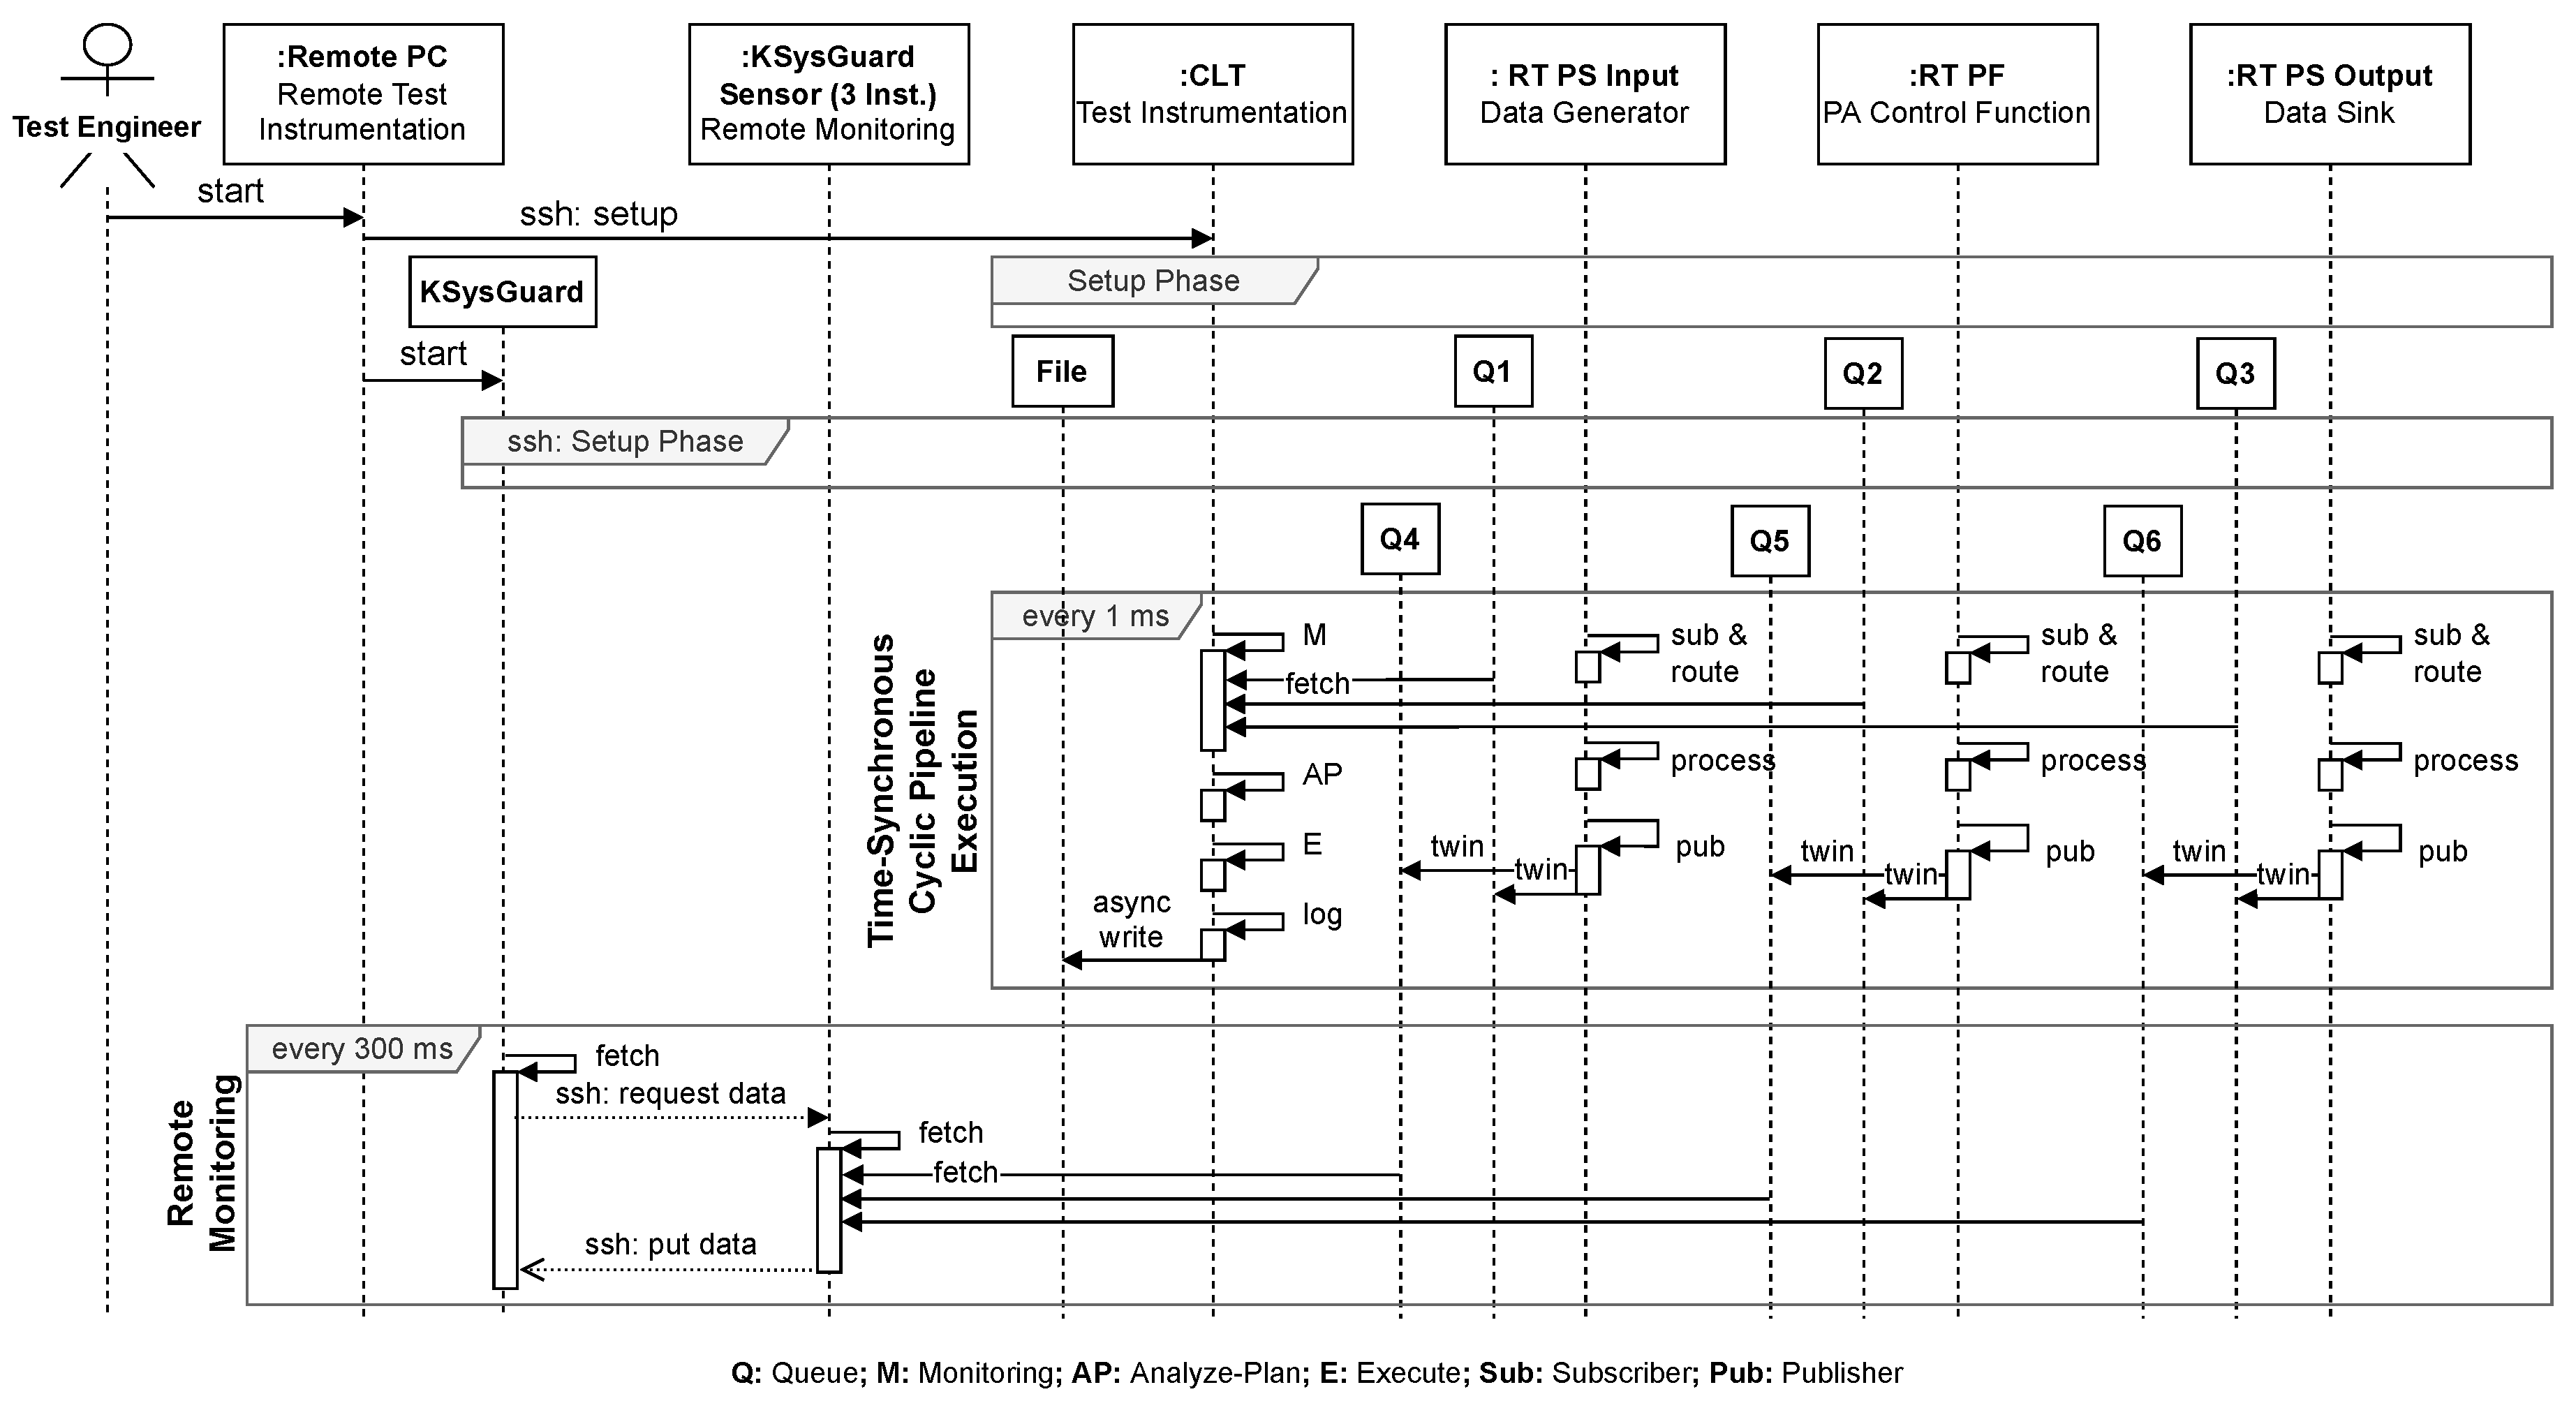
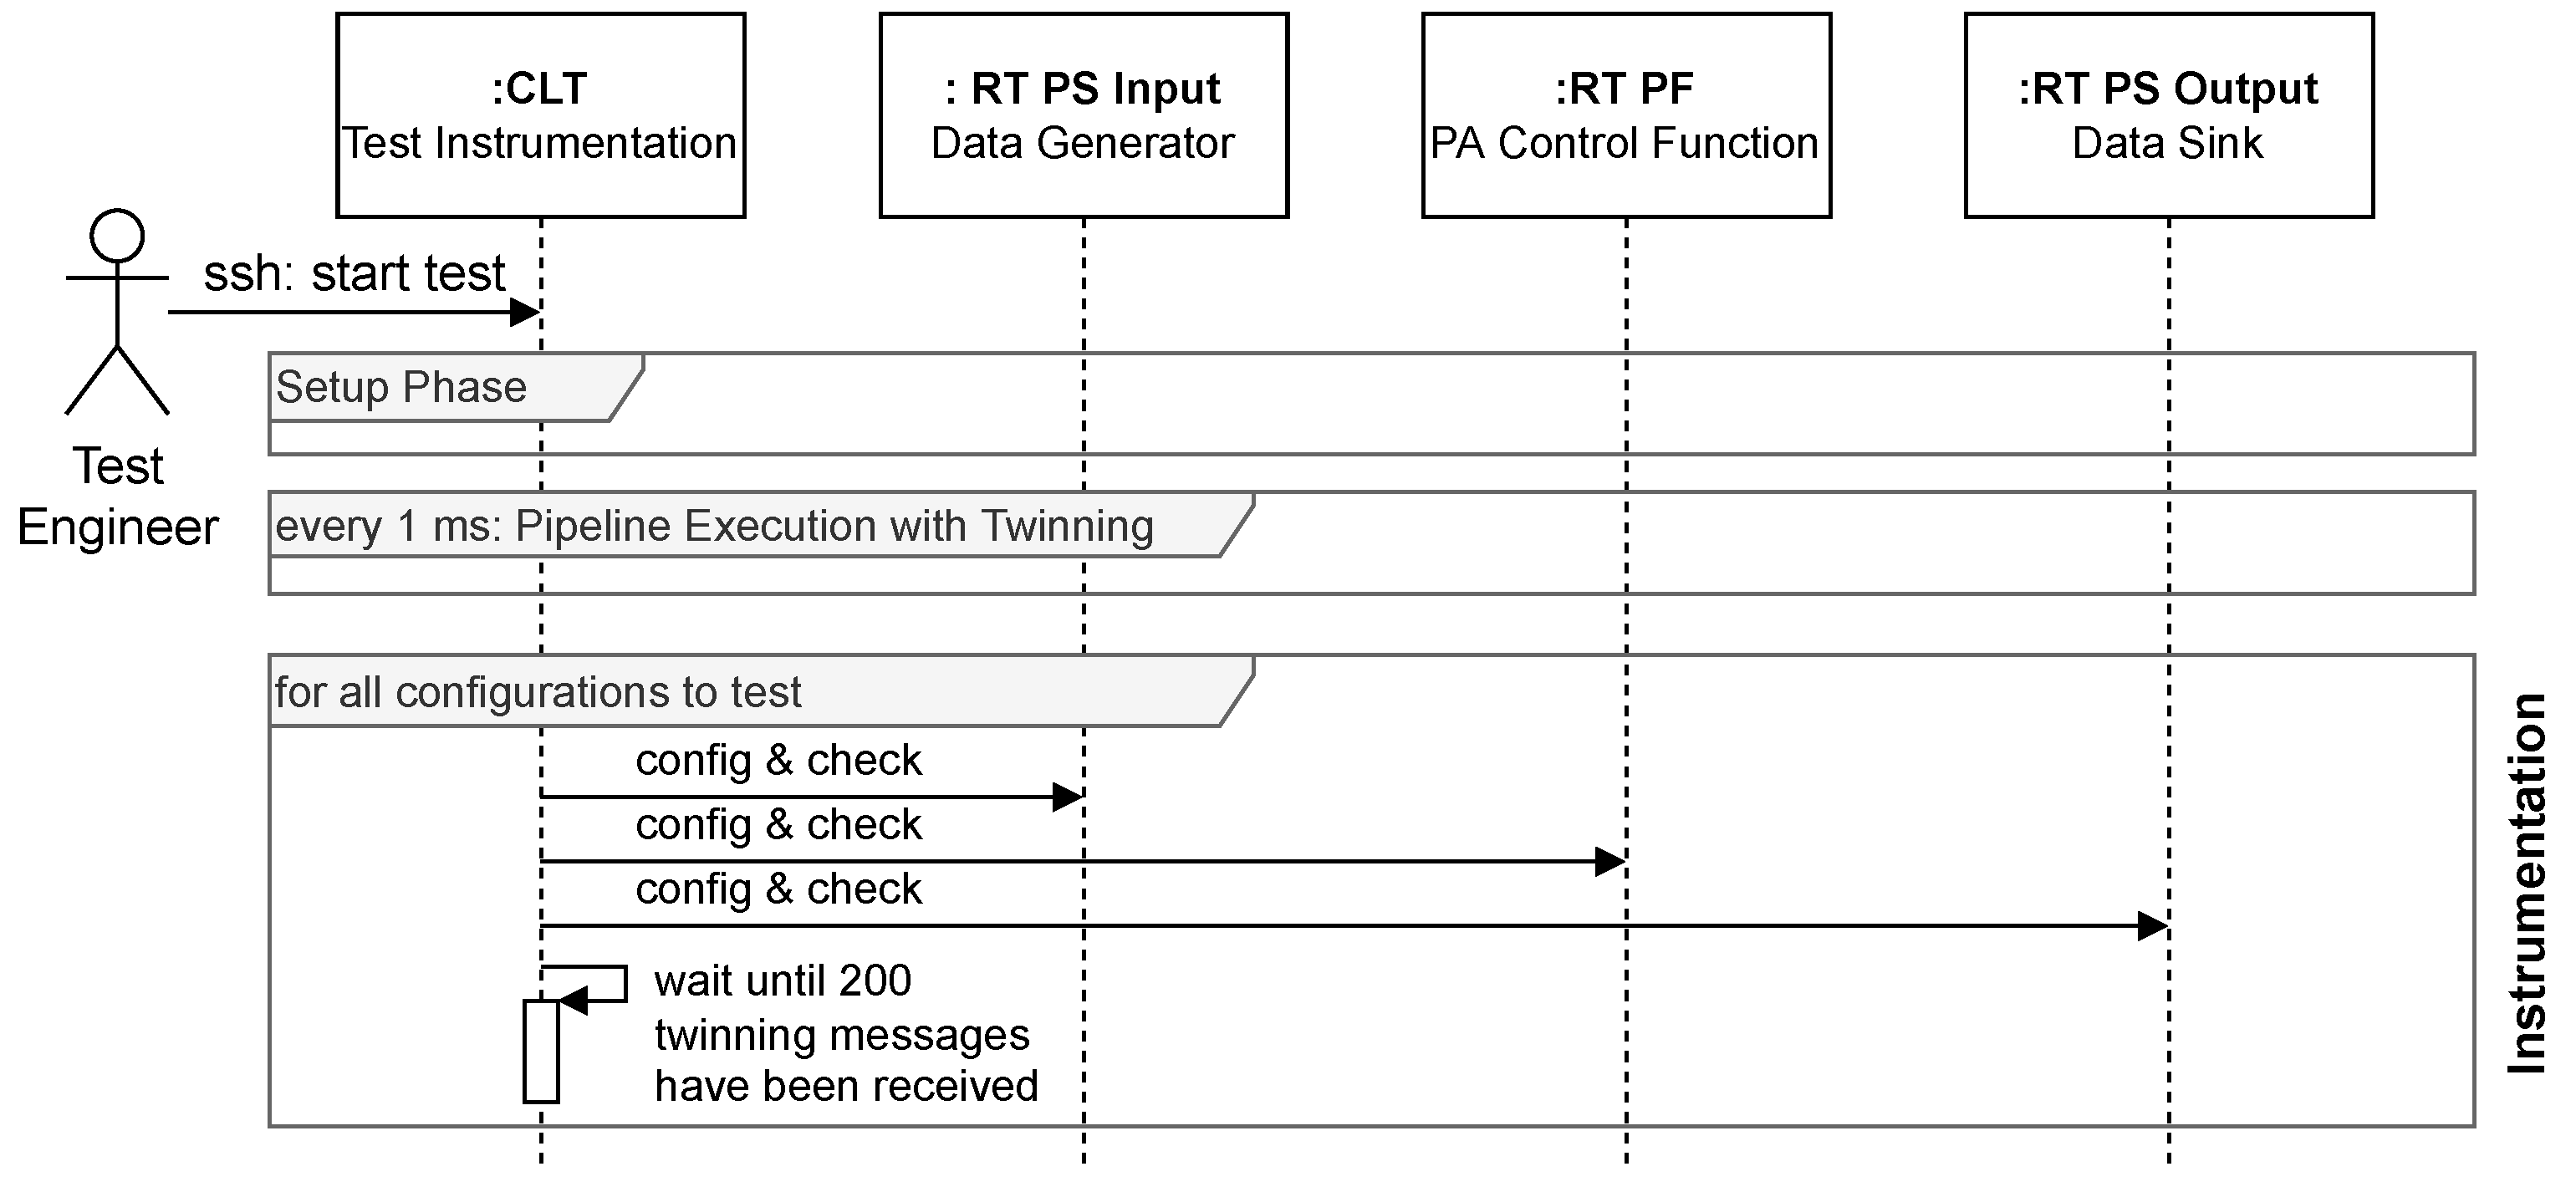
In this work, we demonstrate the feasibility of this approach by showing the proposed script engine via a command line tool (CLT) for test and service orchestration, as Section 5 describes in more detail. In addition, the script engine and mediator functions can be integrated, for example, into function plan (FUP) elements for programmable logic controller (PLC) programming. Such FUP elements would enable the convenient implementation of real-time-capable and context-aware self-adaptation mechanisms in real-world plants.
We refer the interested reader to Dobaj et al. [21], where we use design patterns to discuss multiple aspects of microservice-based architectures for the industrial Internet of Things. In addition, we propose a dedicated architecture and data flow that facilitate system evolution at all software layers. We particularly emphasize the importance of evolution at the communication layer to make the system resilient against protocol changes and to allow the dynamic integration of communication protocol stacks at runtime. In addition, we discuss the benefits of modern publisher–subscriber machine-to-machine communication protocol standards such as MTConnect, OPC UA, and DDS.

4.2. DT-Enhanced Context-Aware Self-Adaptation

Figure 7 shows the one-on-one mapping of the DT-enhanced control service architecture elements to their corresponding MAPE-K elements. The DT models represent the knowledge bases, the control services implement the analysis and plan steps, and all other components provide monitoring and execution capabilities. In particular, the PA control service uses sensors and actuators to interact with its PAs. Similarly, the SA control service uses probes, effectors, and management interfaces to interact with its SAs. The information gathered through PA and SA monitoring is fed into the DT model and made accessible through logical objects. These logical objects reflect the operating context of the control service’s physical space and cyberspace. Since all microservices can access the logical objects via the mediator interfaces, they can use this information (i.e., analyze and plan) for context-aware decision-making. Notably, the DT-enhanced control service is also self-aware since the software probes sense the states of the microservices, the host operating systems, and the host system hardware.
The DT-enhanced control service adaptation and self-adaptation capabilities are designed according to the hierarchical control pattern [39] with one knowledge repository per MAPE loop to support fully autonomous operation alongside hierarchical co-operation and orchestration. In the hierarchical control pattern context, the DT-enhanced control service responsibilities are threefold:
1.
The PA and SA control services are responsible for the autonomous monitoring and control of its associated PAs and SAs under normal operating conditions (R1, R2, R3, R4);
2.
The PA and SA control services (or an additional local management service) are responsible for managing the autonomous adaptation and self-adaptation of system properties in reaction to uncertainties (see Figure 1b) in physical space and cyberspace (R1, R2, R3, R4, R6); and
3.
The PA and SA control services co-operate with external managing systems to ensure the reliable (i.e., self-protected) and context-aware orchestration of system adaptations across CPS software and system layers (R1, R2, R3, R4, R5, R6).

4.3. The Secondary Asset Digital Twin for Enhanced Management and Control

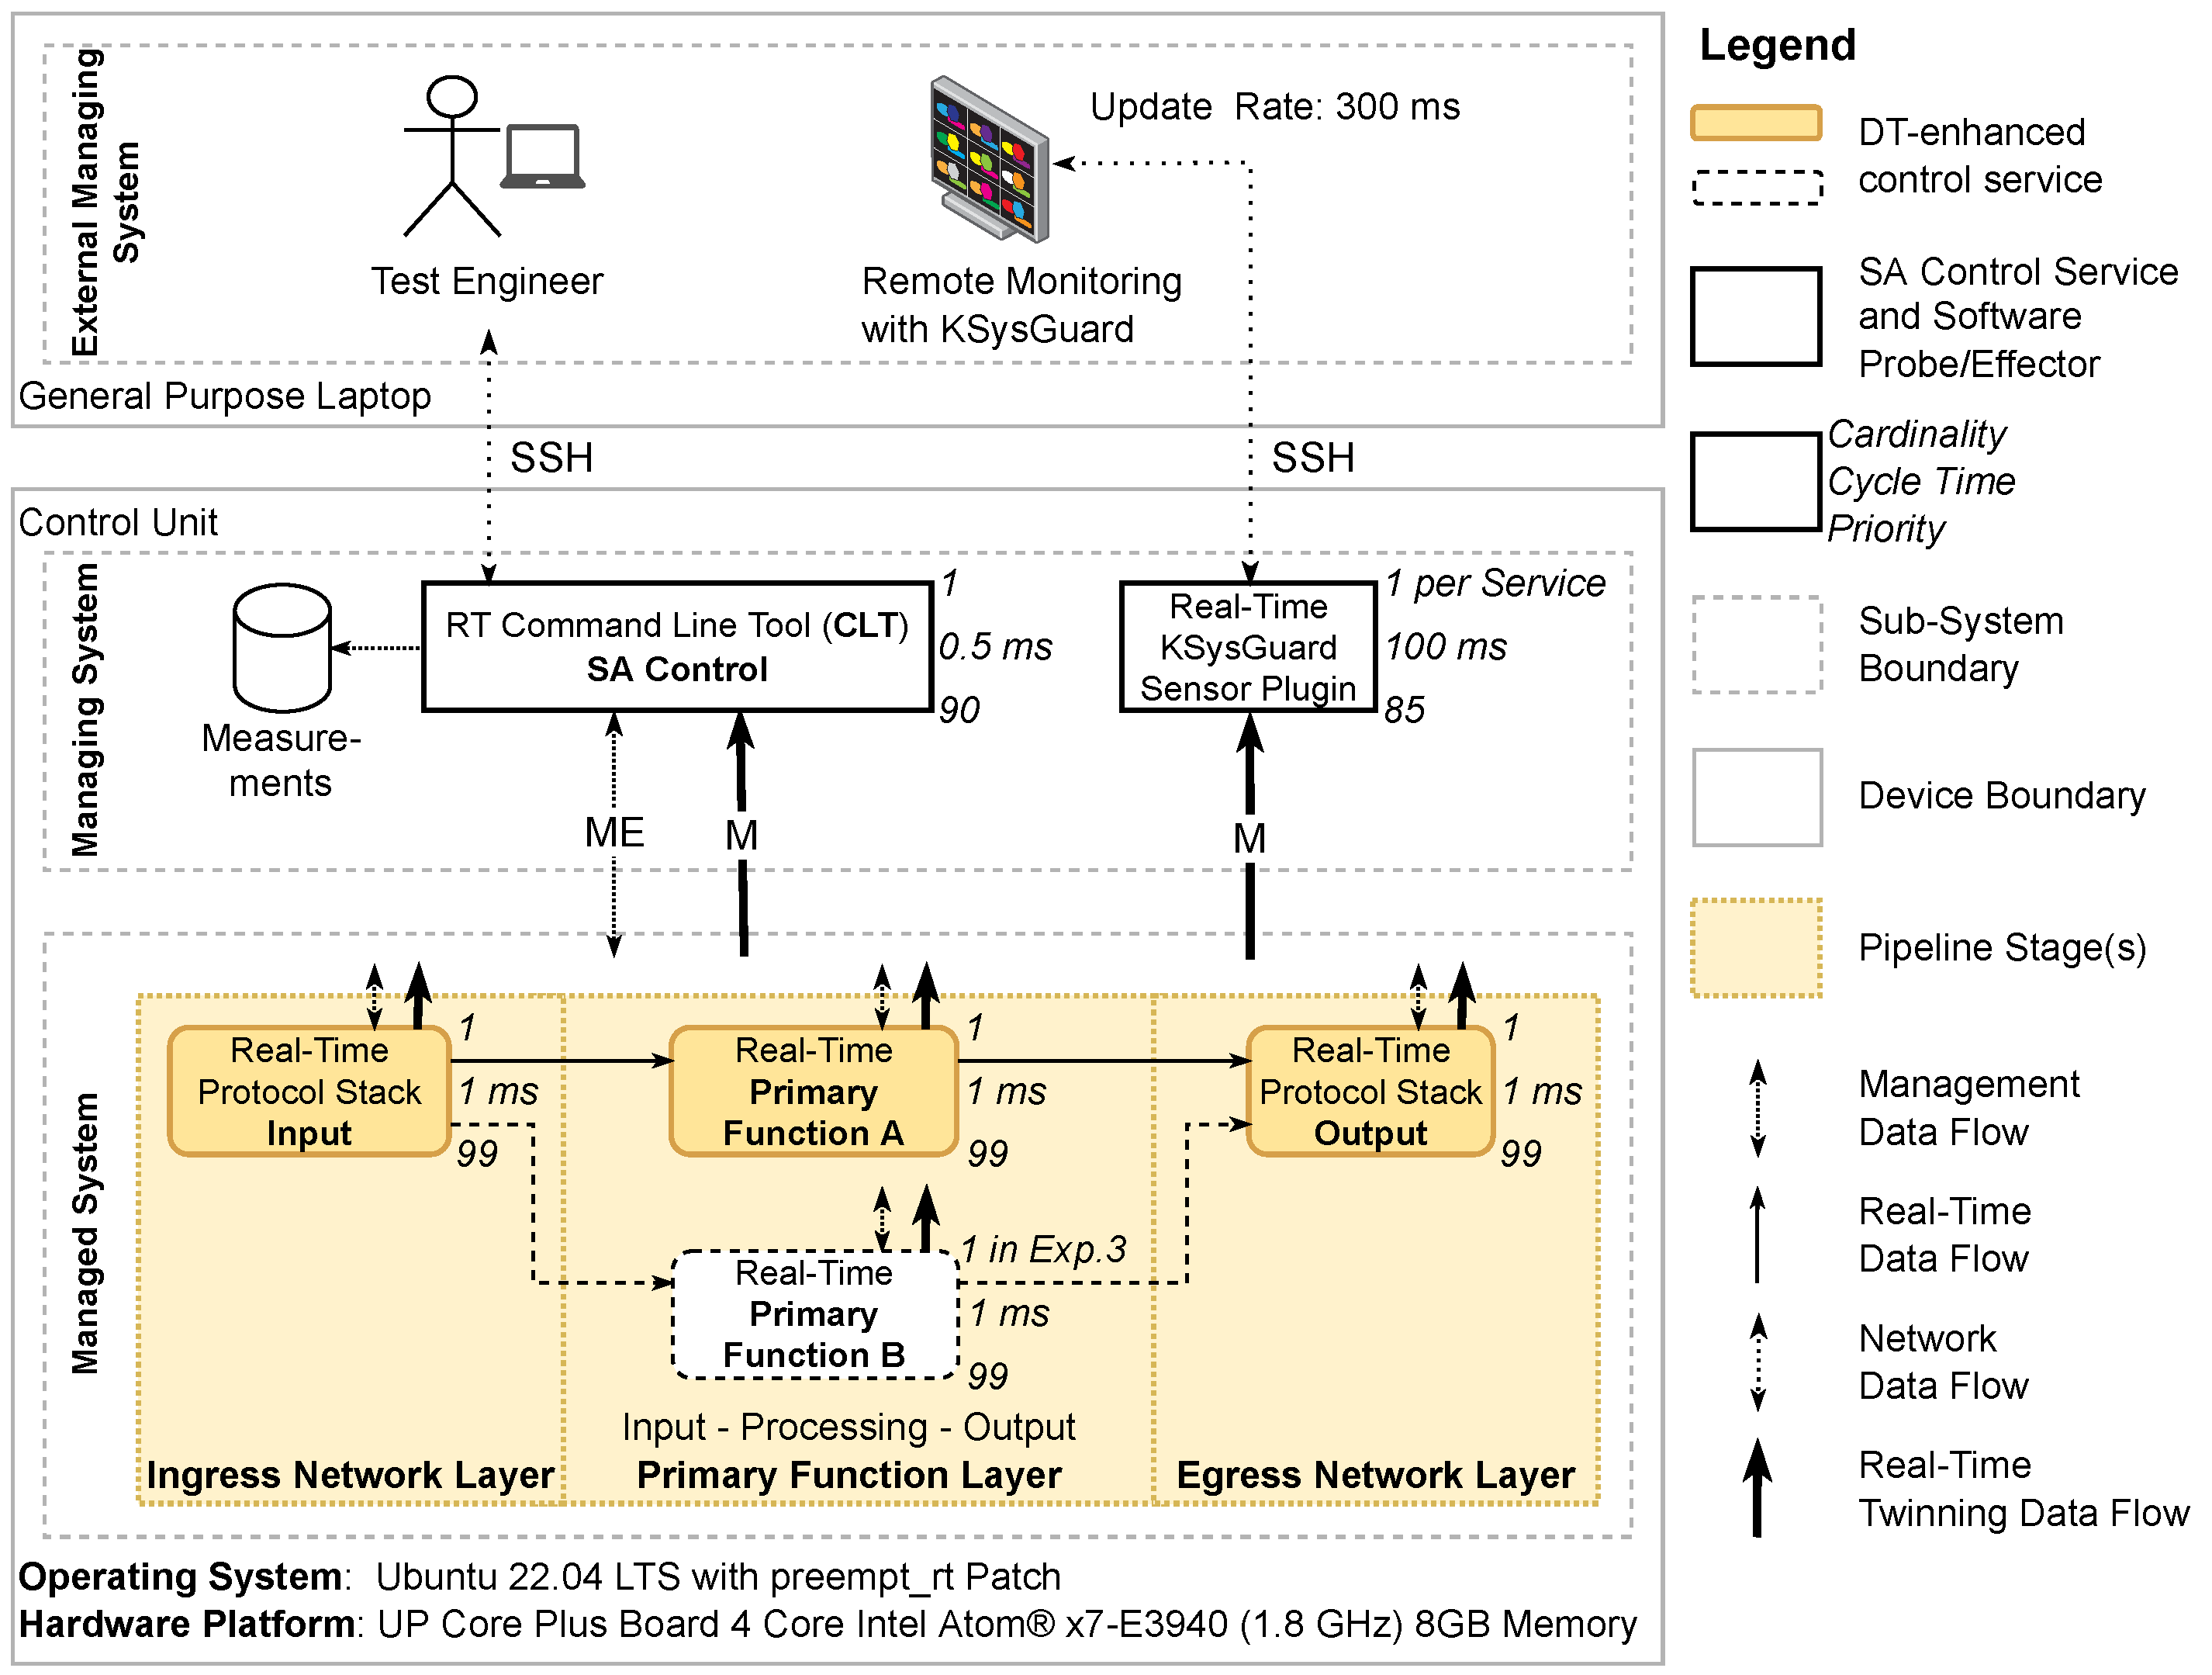
Figure 8 shows the data flow diagram of our proposed SWF, which also represents the SA DT model we use to accurately reflect the SWF structure, design, data flow, timing, configuration, and behavior during runtime. In this section, we establish a mapping between the diagram elements and their corresponding architectural elements shown in Figure 5 and Figure 7. We also clarify how the SWF uses the SA DT model to perform parameter-based and architecture-based adaptations.
Structure and Data Flow. Before establishing the mapping, we explain the data flow diagram elements and structure shown in Figure 8. The boxes with rounded corners represent software services. Each service is implemented as a single operating system process. The boxes with a top and bottom line represent storage elements. Storage elements are implemented as shared memory objects maintained by an associated process. The boxes with sharp corners represent services that interact with the SWF, such as third-party applications. The lines with arrows indicate the flow of data.
The SWF services are strictly separated into two criticality levels: the support services at the top and the mission-critical real-time services at the bottom. The mission-critical services interact with critical infrastructure and are responsible for the time-synchronous, cyclic, and real-time processing of mission-critical data. To that aim, these services are structured into three consecutive pipeline stages and a network layer. The left and right layers represent the network layer, which can host local applications and different protocol stacks to interact with industrial devices (see [17,21] for design details). The cyclic real-time processing stages are located between these network layers, and data are passed between stages from left to right.
1.
The input processing stage implements the subscriber pattern. The subscriber reads and receives messages from the network layers and performs routing and traffic shaping to optimize the data flow through the pipeline stages.
2.
The primary function-processing stage implements the intended system functionality, which is, in the first place, the autonomous control of the PAs. To that aim, the PA control service processes the received data and updates the software representation (i.e., the logical object) of the PA. The SA control service operates similarly alongside the PA control service. The states of both the PAs and SAs are stored in their respective storage elements. Read and write access to these storage elements is implemented using highly efficient (wait-free) read–acquire and write–release operations, which ensures that both services can easily and efficiently access information about their operational context in physical and cyberspace via the PA and SA storage, respectively. Read and write access to the PA and SA storage elements can be considered deterministic if caching effects are negligible.
3.
The output processing stage implements the publisher pattern. It reads data from the PA and SA storage elements to create and publish messages to registered subscribers.
The support services assist the mission-critical services to help them achieve their goals. Since the support services can subscribe to PA and SA twinning data, they can also operate fully autonomously in the given operational context. However, they do not directly interact with critical infrastructure, making them less crucial than their mission-critical counterparts. In particular, the support services responsible are twofold. First, they manage the communication with external entities; second, they execute and coordinate requests from external entities. To that aim, the management support services (represented as a single manager service in Figure 8) use the twinning information to check if external requests can be performed in the current operational context. If so, the support services orchestrate the adaptation in coordination with the PA and SA control services and report the final result.
General Mapping. Let us restate that any software services and secondary equipment, such as sensors, actuators, and network and control devices, are categorized as SAs. In contrast, machines, mechanical components, and physical processes are categorized as PAs. Hence, the data flow diagram elements can be mapped as follows: The states and data-storage elements hold the current and historic state and the configuration of their real objects (i.e., the PAs and SAs). The ingress and egress network layers represent the critical OT communication links to interact with the primary and secondary assets. There is a one-on-one mapping between the PA and SA control services.
Managing SA DT Models. As stated, the data flow model represents the DT model of the DT-enhanced control service itself and reflects its design, structure, and behavior. The configuration (config) storage elements hold the configuration of the DT-enhanced control service and its sub-services. The SA control service and the manager service implement the software probes and effectors required for self-monitoring and self-adaptation. Section 4.4 explains the model describing the service timings and their data throughput characteristics. In order to create a DT model for the managed SAs, it is essential to integrate the data flow model with details about their network protocols and configuration. Software probes can acquire the necessary data from the services hosted at the network layer, and software effectors can manage potential adaptations.
Mediator Mapping. The support services implement the interface mediator, whereas each interface implements a command–response protocol and a data streaming protocol according to the publisher–subscriber pattern. To that aim, the three interface services maintain sessions with external services, and the manager service interacts with the real-time orchestrator and orchestrates the execution of local commands. The real-time mediator algorithm is implemented through the cyclic processing pipeline, which defines the sequences to access and modify critical data, which also includes the modification of configuration changes represented by the bidirectional management data flows. The most crucial part is to ensure freedom from interference through the strict separation of mission-critical from less critical services and data. In our implementation, we guarantee this separation by encapsulating services within processes combined with a proper (i.e., well-separated and linearly aligned) memory layout of the shared memory storage elements for data exchange. We use a mixture of (primarily lockless queuing-based) non-blocking and wait-free synchronization mechanisms that are optimized for minimal contention.
What parameter-based adaptations are supported, and how are they implemented? The SA DT model distinguishes two types of parameter-based adaptations: deterministic and non-deterministic. Local and external services can trigger both types. However, only mission-critical services have the permission to carry out deterministic adaptations by altering data in storage elements. Non-deterministic parameter adaptations usually involve various steps, such as non-deterministic operations like memory allocation and interactions with external services and devices. After the completion of a non-deterministic parameter adaptation, the manager service informs critical services about relevant changes so that they can update their representation deterministically.
From an implementation perspective, both parameter adaptation types are implemented similarly. Parameters to control a specific property of the DT-enhanced control service are encapsulated within their corresponding logical object. Two instances per logical object are maintained: an active one and a passive one. Deterministic adaptations can directly alter the properties of the active logical object. In contrast, a non-deterministic adaptation sequence performs four steps. First, all adaptations are performed, but only the configuration of the passive logical object is updated. Second, the mission-critical services are notified that changes are available. Depending on the complexity of the changes, mission-critical services may either swap the active and passive real objects or perform additional management steps before executing the logical object swap.
What architecture-based adaptations are supported, and how are they implemented? The SA DT model supports four fundamental architecture-based adaptations: create and terminate a service and establish and tear down a communication link. Our most important design goal was to ensure that each architecture-based adaptation can be applied to every data flow diagram element without causing system interruptions and downtime even under high load conditions (e.g., during the execution of multiple sub-millisecond real-time control services). To that aim, we implemented the concept of containerized microservices by encapsulating each storage and service element as an individual logical object. Each logical object is represented by a standard operating system process that comprises at least one low-priority thread per element. This low-priority thread is responsible for coordinating adaptations with the manager service. Additional threads with higher priority can be added to the same process or spawned in another process to implement the intended logical object functionality. All architecture-based adaptations include non-deterministic actions. Therefore, they follow a comparable adaptation procedure to the one used in non-deterministic parameter-based adaptations.

4.4. The Timing Model of the Cyclic Real-Time Processing Pipeline

Figure 9 depicts the detailed timing model of the cyclic real-time processing pipeline shown in Figure 8. The timing model is also integrated into the SA DT model and used to monitor and adapt the DT-enhanced control service’s timing behavior. The model indicates that each cycle comprises three main stages: management, primary function, and twinning. These stages are further broken down into sub-stages. Each stage and sub-stage gets assigned a certain percentage of processing time per cycle, subsequently denoted as the cycle portion. All cycle portions can be configured using deterministic parameter-based adaptation.
The management stage is the only stage that can maintain a state across multiple cycles. Therefore, it utilizes a detailed state machine consisting of several steps. Each step is considered atomic and must be completed within one cycle portion. To ensure that this requirement is met, the state machine takes into account the worst-case execution time for each atomic step and verifies beforehand if enough processing time is available. This provides two essential benefits. The management stage can perform complex and processing-intensive tasks that mission-critical tasks otherwise cannot execute, thereby reducing synchronization efforts and simplifying the overall adaptation workflow. Additionally, the management stage can act as a safety buffer that can be customized to compensate for large jitter spikes. The progress of individual management steps can be guaranteed if the available cycle portion is greater than the maximum required portion of the longest atomic step. The management stage implements the three stages of the cyclic real-time processing pipeline in the described stateful manner. The function sub-stage implements the management actions, whereas the input and output sub-stages use the publisher–subscriber services to communicate with the manager service at the support service layer.
The primary function stage implements the three stages of the cyclic real-time processing pipeline in a stateless manner, which means that all steps must be completed within the available cycle portion. The input and output sub-stages use the publisher–subscriber services to interact with services hosted at the network layer. The cycle portions assigned to the input and output sub-stages must be equal to guarantee maximum data throughput without creating backpressure at the output sub-stage. The function sub-stage implements the asset control functions (i.e., the primary intended function of the system) and can consume the remaining cycle portion.
The twinning stage is split into two sub-stages. The process sub-stage, in the first phase, gathers all measurement data and state information of the active processing cycle to compute essential key performance indicators (KPIs) in its second phase. The KPIs thereby obtained offer valuable insights about the device and service health and the usage of resources and cycle portions. In the output sub-stage, we publish all data, state information, and KPIs in a single message to the registered subscribers. Our implementation captures over 300 states within one cycle, allowing the creation of real objects that accurately reflect the data flow and service states in real time. We use these real objects to continuously check invariants at runtime to identify software system anomalies quickly. Our DT-enhanced control service also classifies the processed KPIs using a traffic light system, allowing their easy integration into a dashboard without domain knowledge and pre-processing.

5. Service-Oriented Instrumentation and Self-Adaptation of the DT-Enhanced Control Service

This section describes four vital aspects of this work: First, we explain the experimental setup and some of its implementation details. Second, we demonstrate a specific instantiation of the DT-enhanced control service model. Third, we provide further details about the service-oriented instrumentation, adaptation, and self-adaptation capabilities and their implementation aspects. Finally, we explain how we ensure data validity.

5.1. Experiment Setup: Hardware Setup and Software Configuration of the DT-Enhanced Control Service

Figure 10 shows the hardware and software setup that we used in the subsequently explained experiments. We do not publish the measurement results obtained on our industry partner’s platform to ensure experiment reproducibility. Instead, we executed the experiments on industrial-grade embedded devices that are commonly available and share at least the same processing unit and (some) time-sensitive network interfaces. The light solid boxes indicate that two devices were used in the experiments. The top box represents a general-purpose laptop, and the bottom box is the industrial control unit running the software framework under test (SUT).
The laptop runs Ubuntu 20.04 LTS and was used for interactive experiment instrumentation. It represents the external management system as shown in Figure 7. For remote monitoring, it executes the KSysGuard application that maintains one secure socket shell (SSH) connection per sensor plugin. A sensor plugin provides a (streaming) remote monitoring interface that allows fine-grained (i.e., per data point) access to Digital Twin data. On request, it reveals all available data points and provides meta-information about these data points. The testing engineer used an SSH connection to start a command line tool (CLT) on the control unit for interactive remote experiment instrumentation.
As an embedded control unit, we used the UP Core Plus Board [89] featuring an Intel Atom x7-E3940 that operates at a frequency of 1.8 GHz and has access to 8 GB system memory. Extension boards are available to provide time-sensitive network interfaces (i.e., via the i210 chip) for accurate time-synchronization and real-time data transmission. As an operating system, we used real-time Ubuntu [90], i.e., Ubuntu 22.04 LTS with preempt_rt patch. The most significant difference performance-wise between the industrial platform of our partner and the off-the-shelf UP Core Plus Board used is that the standard UEFI only offers some configuration settings to tweak the Intel Atom CPU for optimal real-time performance. We used the standard UEFI to ensure maximum reproducibility in the presented experiments.
All services on the embedded control unit implement the DT-enhanced control service architecture as shown in Figure 6, allowing us to use every service’s twinning information in the subsequent experiment analysis phase. For simplicity, we did not use a super fine-graned microservice structure, where every element shown in Figure 8 is encapsulated within a process. Instead, every DT-enhanced control service (i.e., every service shown in Figure 10) is encapsulated within one process. These services can be structured into two sub-systems, as shown in Figure 7: the managing system at the top and the managed system at the bottom.
The managing system has three responsibilities. First, it provides remote orchestration and monitoring interfaces via SSH connections to the external managing system. Second, it interprets received remote commands and manages and orchestrates their device-local execution. Third, it implements the analyze–plan steps for MAPE-based self-adaptation on the level of the control unit. For that purpose, the CLT implements a command line interface that provides fine-grained access to all monitoring and adaptation functions, which the test engineer uses for experiment instrumentation and automation. In particular, we implemented a scripting language and a script engine to provide fine-graned service-oriented command and response interfaces to all elements shown in Figure 8. To manage the local command execution, the CLT uses the twinning and orchestration capabilities provided by the service interfaces of the managed system.
The working principle of the CLT and the sensor plugin are similar. Both are designed to offer a self-descriptive interface to support and demonstrate the servitization principle in a simple manner. The services receive commands via the standard input and send responses via the standard output, enabling bidirectional interaction with human actors or other applications. Both services support commands to query information about their interfaces, behavior, structure, and available data points and services. In addition, they provide continuous monitoring features and adaptation commands. Next, we explain some of the servitization features using examples.
The KSysGuard application, for example, provides customizable dashboards to visualize data points received via the standard output. Appendix B provides some of the dashboards we used for debugging and experimental observation. These particular dashboards are configured with a 300 ms update interval. Data points can be structured into a hierarchy of categories that are represented within a tree. In addition, data points have descriptive meta-information such as description, data type, data range, unit, min, max, and more. The sensor plugins on request provide all this information, and the KSysGuard application uses it to enrich its dashboard. Besides remote monitoring and visualization, the sensor plugin can be used for integration testing to observe invariants and other system properties. Overall, the sensor plugin principle can support the self-organized dynamic composition of services based on contracts [91].
The CLT can read commands from the command line or scripts. Scripts contribute to the infrastructure-as-code paradigm [92,93] by the following means: They can be version-controlled and enable the flexible definition of complex orchestration sequenced. They can also be tested and support the reproducible creation of environments through reliable deployment, reconfiguration, and adaptation of the CPS.
A noteworthy property of our setup is its support for the dynamic reconfiguration of the MAPE loop. The CLT implements the MAPE loop in our setup to control and manage the secondary assets. To that aim, the MAPE loop uses the command interface of the script engine. Reusing the script engine allows us to describe the behavior of the MAPE steps via a list of commands. Consequently, the CLT can execute multiple MAPE loops, and the behavior of these loops can be adjusted at runtime by simply updating their associated lists via the CLT interface.
The managed system implements the data flow model shown in Figure 8 and can be structured into three layers: the ingress network layer, the primary function layer, and the egress network layer. Each network layer hosts a DT-enhanced control service that simulates incoming and outgoing traffic, respectively. The primary function layer’s responsibility is to implement the primary intended functions for CPS closed-loop control. More particularly, the Real-Time Protocol Stack Input service (RT PS input service) acts as a data generator responsible for network load simulation and sends messages to the Real-Time Primary Function service (RT PF service). The RT PF service processes and then forwards all received messages to the Real-Time Protocol Stack Output service (RT PS output service). These three services thereby implement the behavior of a real-time closed-loop software stack that controls and interacts with its physical environment. All services operate at a cycle time of 1 ms under the real-time first-in–first-out (FIFO) scheduling policy at priority 99. Each service offers a management interface or instrumentation and the PA and SA interfaces for twinning and adaptation. Considering the overall structure, the experiment setup implements the hierarchical control pattern with knowledge repositories as per MAPE loop as of [39], Figure 9.

5.2. Experimental Execution: Instrumentation and Self-Adaptation

The system sequence diagram in Figure 11 shows the steps that are common among all experiments. In addition, it reveals further details about the infrastructure and the service interactions to implement the behavior described above. All experiments are fully automated and can be structured in three phases: setup, experiment, and persistency and analysis.
Setup phase. The test engineer starts a script that contains the entire test description/automation. This script establishes an SSH connection to the control unit and starts and configures all four DT-enhanced control service instances (i.e., CLT, RT PS Input, RT PF, and RT PS Output). After this setup phase, all managed services execute the cyclic processing pipeline and publish/twin their states into their associated Q1, Q2, and Q3 queues. Next, the KSysGuard application is started on the Remote PC, which establishes multiple SSH connections, each associated with a KSysGuard sensor service for remote monitoring. After the KSysGuard setup phase, all managed services publish/twin their states into their associated Q4, Q5, and Q6 queues.
Experimental phase. After the successful setup, the experiment starts. The subsequent sections explain the experiment-specific steps. Here, we describe the cyclic sequences used for measurement and orchestration in all experiments. Every 1 ms, the CLT fetches the twinning information from all queues for subsequent use in its analyze–plan (AP) and log steps. Each measurement entry created in the log step is cycle-accurate across the services to accurately reflect the overall system behavior. Measurement data are asynchronously written into a file. Every 300 ms, the KSysGuard requests sensor information. For that purpose, the sensor services fetch the most recent twinning states from their associated queues and generate a response by writing the requested sensor values to the standard output.
Persistency and analysis phase. After the experiment is successfully executed, all services are terminated, and the measurement files are copied to the remote PC (i.e., the laptop) for further analysis. During the experiment phase, the twinning mechanisms are used to obtain a cycle-accurate view of all control unit services. We intentionally did not calculate a moving average to ensure that all potential effects and side effects are visible with a 1 ms time resolution. Since we are using the twinning mechanisms, an essential feature deeply integrated into the SWF, the influence of the measurement-related effects is minimized. During the execution of the experiment, we observed model and SWF invariants via remote monitoring dashboards. In the subsequent analysis, we followed a similar but more accurate approach. We created multiple interactive high-resolution time series plots with the Plotly library for Python. We used these interactive plots to check and compare the observed system behavior against the data flow model. In addition, we checked all build-in error states to identify potential failures. We can confirm that no violations of invariants occurred during any of the experiments.

6. Experiment 1: Twinning Fidelity and Real-Time Control Characteristics

The experiment intends to validate the requirements R1, R2, and R3. Therefore, the experimental goal is to analyze the SWF’s performance characteristics concerning its real-time control capabilities and its PA and SA twinning (i.e., monitoring) fidelity from the point of view of a software engineer in the context of designing a CPS control function supporting DTs. The experimental hypothesis is that the SWF can provide sub-millisecond real-time closed-loop control and simultaneous sub-millisecond PA and SA twinning in a real-world configuration. For hypothesis testing, the SWF’s throughput characteristics of the cyclic processing pipeline on the primary function layer shall be evaluated under various load conditions. Experimental and data validity is ensured according to the statement in Section 5.2.

6.1. Experimental Design

Section 5 describes the general experimental setup and its instrumentation. Table 3 gives an overview of the experimental factors and dependent variables. Any elements not explained here are introduced in Section 4 and Section 5. The system sequence diagram in Figure 12 shows the experiment-specific sequence diagram. The experiment is designed to determine the maximum end-to-end throughput characteristics of the cyclic processing pipeline, which defines the maximum number of data the primary function layer (i.e., the RT PF service) can process under certain load conditions. Suppose the RT PF service cannot process all received messages under certain load conditions. In that case, the service can drop messages at various processing steps (observable via message drop counters) and store messages for later processing (observable via backpressure counters). The RT PS input and output services are configured to not limit the maximum end-to-end throughput characteristics of the RT PF service. The RT PF service load is primarily determined using the following timing and data flow factors:
  • Service cycle time;
  • Cycle portions per pipeline state and sub-stage;
  • The number of messages received, to be processed, and to be sent per cycle;
  • The size per received, processed, and sent message.
One timing factor and one data flow factor are modified to reduce the number of experiments. All others are kept constant during the experiment, as defined in Table 3. The cycle time of all services is set to 1 ms, and the cycle portions are kept constant during all experiments. Only the sub-portions of the primary function (as shown in Figure 9) are modified. These sub-portions represent the timing factor, i.e., factor1. To obtain a configuration with maximum end-to-end throughput, the PF input portion P F i n p u t . p o r t i o n must equal the PF output portion P F o u t p u t . p o r t i o n . For maximum load, the PF function portion P F f u n c t i o n . p o r t i o n must be configured to consume the remaining PF portion P F p o r t i o n . The following equations express these invariants:
P F i n p u t . p o r t i o n = P F o u t p u t . p o r t i o n
P F p o r t i o n = P F i n p u t . p o r t i o n + P F f u n c t i o n . p o r t i o n + P F o u t p u t . p o r t i o n
The payload size of a single message is set to 1500 bytes and remains constant in the experiment. This value was chosen to obtain relevant and realistic maximum message throughput characteristics since a payload of 1500 Byte corresponds to the maximum size of an EtherCAT frame, which is also equal to the maximum payload size of an Ethernet packet, according to IEEE 802.3. In short, receiving single messages larger than 1500 bytes is impossible. Hence, transferring more data per cycle requires sending/receiving more messages per cycle. The number of received, processed, and sent messages represents the second factor, i.e., factor2.
Summing up, this experiment evaluates the impact of and the dependency between two factors to determine the maximum end-to-end throughput characteristics of the cyclic processing pipeline. Therefore, one factor at a time is modified, resulting in the following number of measurement cycles:
= [ N u m b e r o f m e a s u r e m e n t i n t e r v a l s ] = [ N u m b e r o f f a c t o r 1 c o n f i g u r a t i o n s ] [ N u m b e r o f f a c t o r 2 c o n f i g u r a t i o n s ] = 6 19 = 114
At least 200 consecutive cycles of all running services in each interval are simultaneously measured using the provided twinning mechanism. For the experiment execution, all services are started only once, and the individual factors are modified using the provided runtime reconfiguration mechanisms.

6.2. Results and Analysis

The analysis of results is structured into two parts. First, Section 6.2.1 analyzes the timing and cycle usage characteristics. Second, Section 6.2.2 analyzes the data flow characteristics.

6.2.1. Timing and Cycle Usage Characteristics

The timing and cycle usage characteristics of the service under test (i.e., the RT PF service) must reflect the processing behavior described in Section 4.3. Figure 9 shows the reference model for the subsequent analysis and validation of the measured cycle portions. All figures in this section have the following structure:
  • Columns and legend: All figures are structured into six columns, each representing the six possible configurations of factor1. Each column’s legend and heading indicate the configuration shown in a specific column. The PF input portion represents factor1. The Equations (1) and (2) define the dependencies between the PF input, function, and output sub-portions. Each column is structured into a top and a bottom diagram. The bottom diagram shows the discrete measurement values, whereas the top diagram shows the distribution of these measurements as a histogram.
  • Y-Axis: Factor2 is plotted along the y-axis and shows the configured number of messages that shall be processed per cycle.
  • X-Axis: The dependent variable under investigation is plotted along the x-axis. Each plotted x-axis sample represents a measurement result calculated in the twinning state of a single execution cycle. In other words, no moving-average algorithm is applied.
  • Annotations: Each figure is annotated with vertical lines or boxes to indicate relevant properties of the reference model.
Figure 13 shows the accumulated cycle usage of all RT PF service-processing steps. The green dashed line indicates that the maximum average cycle usage is limited to 100%. The red dashed line indicates the maximum peak cycle usage and the safety margin t s a f e t y m a r g i n as shown in Figure 9. This line indicates the buffer available to compensate for unexpected jitter peaks. The results show that for all configurations, the cycle usage remains below 100%, indicating that all real-time constraints are met and that no jitter peaks have occurred. For all configurations, the service under testing consumes nearly 100% of the cycle time, indicating a high service load. The histograms indicate that the average service load is higher for configurations with a smaller input portion. The maximum cycle usage is independent of factor2.
Figure 14 shows the jitter portion representing the amount of processing time not usable due to jitter. A positive jitter (i.e., greater than 0%) means the task is scheduled after its pre-calculated cycle starting point. The green dashed line indicates the expected average jitter. The orange line indicates the maximum average jitter to provide a desirable reconfiguration experience, where at least one atomic configuration step can be executed within a single management portion. The red dashed line indicates the maximum peak jitter, which is equivalent to the maximum available safety margin to compensate for the jitter. The histograms indicate that the average jitter portion across all tests is about 2%, corresponding to an average jitter of 20 μ s. The histograms also indicate a higher average jitter and jitter variability for configurations with a larger input portion, which effectively reduces the usable cycle portion. This observation correlates with the measurements shown in Figure 13.
Before the execution of the test, we expected an average jitter of 5%. We define a 15% safety margin to compensate for unexpected jitter peaks. The management tasks are executed within the usable portion of this safety margin. Figure 15 shows the cycle portion consumed by management tasks. To ensure these tasks’ continuous progress, we define that the maximum average jitter shall not be higher than 10%, which dedicates a minimum average usable portion of 5% to the management tasks. The indicators in Figure 14 and Figure 15 show that the service under testing operates within these constraints for all configurations, which shall result in a decent reconfiguration/management experience, where at least one atomic management step can be executed each cycle.
Figure 16 shows the PF input portions. For all configurations, the maximum PF input portion is about 8% higher than the configured input portion. This is due to the fact that the input processing starts immediately after all management tasks are processed. Since the average management portion is about 7%, the PF input step can consume the remaining 8% of the management portion/safety margin.
Figure 17 shows the portions of the PF function. The results indicate that the PF function consumes, on average, the configured cycle portions, which correspond to 60%, 50%, 40%, 30%, 20%, and 10% from left to right.
Figure 18 shows the portions of the PF output function. The results indicate that, at its maximum, the PF output portion is about 3% higher than the configured cycle output portions, which corresponds to 5%, 10%, 15%, 20%, 25%, and 30% from left to right. The PF output consumes less than the maximum reserved/configured cycle portion if no more messages have to be processed within the active cycle. The results show that the number of messages that can be processed per cycle increases from left to right with the increasing PF input and output portions (note Equation (1), which defines that the output portion must be equal to the input portion).
Figure 19 shows the cycle portion consumed by the SA twinning. The green dashed line indicates the cycle portion reserved for twinning. The orange dashed line indicates the maximum acceptable average twinning portion, which is obtained by adding the 5% expected jitter to the reserved 15% twinning portion. The histograms show that the measured twinning portions are quite distributed but largely remain below the 15% limit. The observed distribution is dedicated to implementation aspects. For example, several system statistics are read and parsed from the Linux filesystem, which may introduce unpredictable latencies. The fact that the 15% limit is exceeded means that the twinning already consumes the processing time of the consecutive cycle, which is observable as a jitter that exceeds the green dashed line in Figure 14. The subsequent cycle starts immediately without putting the real-time thread to sleep in such a case.

6.2.2. Data Flow Characteristics

The data flow characteristics of the service under test (i.e., the RT PF service) reflect the data flow described in Section 4.3. Figure 8 shows the reference model for the subsequent analysis and validation of the measured data-flow statistics. All figures in this section and the appendix have the same structure as described at the beginning of Section 6.2.2.
Figure 20 shows the backpressure per cycle, indicating the number of messages that are queued for subsequent processing. Such queuing occurs if messages cannot be processed within the current cycle and shall be stored for later processing. The green area indicates configurations with zero backpressure, meaning that all received messages can be fully processed and sent within one cycle. A positive backpressure is the main indicator showing that the maximum throughput ratio of the service under test is reached. A negative backpressure indicates that queued messages are processed in the current cycle. Appendix A presents the following complementary data flow statistics:
  • Figure A1 shows the number of received messages per cycle.
  • Figure A2 shows the number of messages dropped during the receiving (i.e., input) step. Such a drop can occur due to backpressure in the subsequent processing stages and due to routing decisions. The experiment described in Section 7 uses both the routing and the backpressure mechanisms.
  • Figure A3 shows the number of messages sent per cycle.
  • Figure A1 shows the number of messages dropped during the send (i.e., output) step. Such a drop can occur due to backpressure at the message destination and due to routing decisions. The experimental results in Section 7.2 illustrate how the backpressure propagates through the system.
The SA twinning mechanisms record over 50 data flow counters per cycle, which can significantly support debugging, testing, and optimization activities.

6.3. Interpretation

Figure 21 summarizes the results of the data flow characteristics analyzed in Section 6.2.1. In particular, it shows the maximum end-to-end throughput characteristics of the cyclic processing pipeline, i.e., the maximum amount of (general and twinning) messages for those configurations in which all messages can be processed entirely. The figure is structured as three diagrams. Each diagram shows the throughput characteristics of twinning messages and PA messages. The PA messages are denoted as general messages in the diagrams since PA messages may also carry general information that is not dedicated to PA control.
Diagram (a)
This diagram shows the maximum amount of messages that can be fully processed per cycle. This figure is derived from Figure 20 and shows the dependency between the factors under investigation. Factor1 is plotted along the x-axis. Factor2 is plotted along the y-axis.
Diagram (b)
This diagram shows the corresponding effective throughput ratios, i.e., the amount of message payload that can be processed per second.
Diagram (c)
This diagram shows the corresponding throughput ratios considering the overhead the implemented protocol header introduced. The protocol header provides the information required to provide certain functionalities like error handling, twinning, routing, and traffic shaping. The protocol header in the tested implementation is not optimized for size and comprises 250 bytes. A first investigation showed that the header size could be relatively easily reduced below 70 bytes if all twinning features of the framework are activated. If only the most essential features are activated, the header size can be reduced below 30 bytes. A further reduction in the header size requires a more elaborate investigation.
Figure 21 shows that the SWF can be flexibly configured between two boundary use cases (UCs), namely
(UC-1)
A use case supporting low message-throughput ratios while providing a large cycle portion for the execution of the intended (i.e., primary) functionality. The experiment evaluated such a use case with the input and output portion set to 5%, which reserves 60% of the cycle for the execution of the primary function. In this configuration, two twinning messages and one general message are processed.
(UC-2)
A use case supporting high message throughput ratios while providing a smaller cycle portion for the execution of the intended (i.e., primary) functionality. The experiment evaluated such a use case with the input and output portion set to 30%, which reserves 10% of the cycle for primary function execution. In this configuration, 2 twinning messages and 18 general messages are processed.
Summing up, the timing analysis of the overall cycle usage and the individual pipeline stages confirms that the SWF properly implements the cyclic processing pipeline and the data flow model introduced in Section 4.3 and Section 4.4. The measured end-to-end throughput characteristics show that the SWF offers a range of configurations that support the simultaneous processing and distribution of general and twinning messages. In short, the experiment confirms that the SWF provides sub-millisecond real-time closed-loop control and the simultaneous sub-millisecond PA and SA twinning in a variety of representative real-world configurations.

7. Experiment 2: Context-Aware Self-Adaptation Characteristics

This experiment intends to validate the requirement R4. Therefore, the experiment’s goal is to analyze the SWF’s parameter-based self-adaptation characteristics concerning its closed-loop timings from the point of view of a software engineer in the context of designing a CPS control system that uses context and state information to adjust to uncertainties such as failures and misconfigurations at runtime. The experiment’s hypothesis is that the SWF allows context-aware closed-loop CPS service self-adaptation. The PA and SA twinning information (i.e., the real objects) is used as a feedback source (i.e., knowledge) and the parameter-based adaptation mechanisms as shown in Section 4.2 for adaptation. For hypothesis testing (i.e., testing of self-adaptive system characteristics), we follow the guidelines of [59]. The experiment represents uncertainty (i.e., the reason why self-adaptation is necessary) in the form of sudden message bursts, which is representative of, e.g., the following situations: device and service misconfiguration, software bugs, hardware failures, security attacks (e.g., denial of service attack), and network device failures. Experimental and data validity is ensured according to the statement in Section 5.2.

7.1. Experimental Design

Section 5 describes the general experimental setup and its instrumentation. Table 4 gives an overview of the experiment factors and dependent variables. Any elements not explained here are introduced in Section 4 and Section 5. The system sequence diagram in Figure 22 shows the experiment-specific steps.
In this experiment, the MAPE-based closed-loop self-adaptation characteristics are assessed. A particular focus is on the evaluation of the twinning characteristics determined by the monitoring (M) and execution (E) elements shown in Figure 7. For demonstration purposes, we configured a simple trigger condition to represent the analyze–plan (AP) steps implemented by the CLT. As noted earlier, the definition of sophisticated AP steps is subject to future work. For example, Krug et al. [94] describe a smarter analysis approach and demonstrate the usage of moving average convergence–divergence (MACD) indicators for message burst prediction. Figure 11 shows the CLT’s MAPE steps and the twinning data flow between the services. Figure 22 reveals details of the analyze–plan (AP) steps and shows two update commands that are part of the execute step.
1.
Monitor: At the end of every cycle, all services (i.e., the data sources (SRCs)) twin their state into their corresponding queues. The CLT subsequently fetches these states. The latency between twinning and fetching is denoted as [ S R C ] t o [ C L T ] latency.
2.
Analyze and Plan: The CLT checks the trigger condition, which is activated if the backpressure counter of the RT PF service is greater than 500 for more than 2 ms. The latency between the state fetching and the positive evaluation of the trigger condition is denoted as [ C L T ] t o [ T R G ] latency.
3.
Execute: The countermeasure shall be executed on a positive trigger condition. In this experiment, the countermeasure shall reduce the message throughput to reduce the service load. Therefore, the CLT reconfigures the routing mechanisms of the RT PS input service to drop all messages that are not classified as critical. In other words, best-effort traffic routing is deactivated, which is achieved via updating the message delivery state of the RT PF service. The service reconfiguration time is denoted as [ T R G ] t o [ R S T ] latency and is equivalent to the execution time of the update command. An update command consists of several sub-commands to immediately check the system integrity by evaluating if the requested command could be successfully executed.
To evaluate said latency characteristics, the RT PS Input service is configured to generate 4 critical messages and 30 non-critical messages per cycle. The critical messages represent control messages, and the non-critical messages represent message bursts. Each message carries a payload of 1500 bytes. If best-effort traffic routing is active, all services operate at maximum load to achieve the maximum throughput. The critical messages are prioritized over the best-effort messages. If critical messages cannot be processed, they are queued for later processing, and the corresponding failure counter is incremented to indicate the violation of real-time processing constraints (i.e., that messages classified as critical must be processed within the configured timeframe, which corresponds to 1 ms in this experiment). Best-effort messages that cannot be processed are also queued or dropped without affecting failure counters. The number of queued messages is observed as backpressure. The number of dropped messages is observed via drop counters. Faults are injected via best-effort message bursts that are periodically triggered by activating best-effort traffic routing. The cycle time and cycle portions are kept constant during testing.

7.2. Results and Analysis

Our analysis of the results is based on two time-series figures and one box plot. Figure 23 shows an excerpt of the experiment demonstrating the overall system reaction (i.e., the system’s self-adaptation) to artificially simulated repeated message bursts. Figure 24 displays a time series diagram with a higher x-axis resolution, providing insights into a single adaptation sequence between seconds 11 and 13. Both figures are structured into the following three diagrams:
Diagram (a)
This diagram shows the time series data of the RT PS input service that acts as a data generator. The service simulates a continuous message burst and sends all messages to the RT PF service.
Diagram (b)
This diagram shows the time series data of the RT PF service that processes the received data and forwards them to the RT PS output service.
Diagram (c)
This diagram shows the time series data of the RT PS output service that processes the received data and simulates data forwarding.
The diagrams are designed to exhibit the backpressure propagation during message bursts and the system’s reaction to it. The diagrams explicitly illustrate the dependent variables, while the spikes due to message bursts implicitly indicate the experimental factor:
  • x-axis: Execution time in seconds.
  • Primary y-axis: The backpressure is plotted along the primary y-axis on the left. The primary y-axis scaling is different between the plots.
  • Secondary y-axis: The number of messages sent per cycle is plotted along the secondary y-axis on the right side. The secondary y-axis scaling is synchronized between the plots.
Types of Backpressure. Before analyzing the data flow and backpressure propagation, we first explain the different types of observable backpressure and begin with a short recap of the three pipeline stages shown in Figure 8. The primary function stage does not support backpressure. However, the input and output stages support the backpressure concept: (a) If the input stage receives more than it can process, then the data remain in the receive queue, causing so-called receiving backpressure. (b) Suppose the input stage processes and forwards more data to the primary function stage than the primary function can consume. In that case, the data remain in the input queue, causing so-called input backpressure. (c) Suppose the output stage cannot process all publisher events (i.e., data sending) to all registered subscribers. In that case, the data remain in the output queue, causing so-called output backpressure.
Backpressure Propagation. Backpressure, as indicated by the name, propagates backward in a queuing-based system. In this experiment, each stage is configured to support a maximum backpressure of 1024 messages. Hence, backpressure propagates backward along the data flow only if this limit is reached (i.e., the buffer/queue is filled). Let us make it more specific:
(a)
If the received backpressure reaches its limit, then messages received via the network are rejected, which results in an increase in backpressure at the message sender. end
(b)
If the input backpressure reaches its limit, the input stage can no longer forward messages, which propagates backward and immediately results in an increasing received backpressure.
(c)
In contrast, output backpressure does not propagate backward to the primary function stage because the primary function does not maintain a queue. Instead, the output stage must actively pull data from the storage elements of the primary function stage. Nonetheless, output backpressure may propagate to the input stage if messages are directly routed to the output stage. This is indicated by the data flow between the subscriber and publisher services in Figure 8.
Illustrated Backpressure. Each diagram in the Figure 23 and Figure 24 illustrates a single backpressure type: diagram (a) shows the receive-backpressure, diagram (b) shows the input-backpressure, and diagram (c) shows the receive-backpressure. During the experiment, there is no backpressure backpropagation. However, we can observe received backpressure and input backpressure. No output backpressure is created. Next, we discuss the forward data flow through all pipeline stages in detail.
Input Service. The RT PS input service shall simulate the network behavior of a persistent message burst. In other words, some connected device floods the network with messages that are received and processed by the device under test. We configure the input service to simulate such a behavior. Therefore, the service shall generate four critical messages representing common control messages. In addition, the input service shall generate the maximum possible number of non-critical messages per cycle to simulate the message burst. Figure 23a and Figure 24a show that the input service can generate, on average, about 17 messages per cycle if the PF service does not accept best-effort messages (i.e., the PF service processes and sends only the four critical messages and drops the best-effort messages). The message generation ratio drops to about 13 messages per cycle if the PF service accepts best-effort messages for processing (i.e., the PF service processes and sends four critical messages and all best-effort messages). Received backpressure is observable if more messages are generated than the input service can process and forward.
Primary Function Service. Figure 23b and Figure 24b show that the PF service can process four critical messages and on average about eight best-effort messages. This results in processing, on average, about 12 messages per cycle if best-effort routing is active (i.e., best-effort messages shall be processed). When comparing this observation to Figure 21a, we would expect a maximum message ratio of 10 messages per cycle. However, experiment 1 analyzed the maximum delivery ratio that can be guaranteed. The current experiment shows that the system supports a higher average throughput/message ratio if message delays can be accepted. During a message burst, the input backpressure (nearly) linearly increases. The primary function can only process an average of 12 messages per cycle. At the same time, the input service sends, on average, 13 messages per cycle, causing an average increasing input backpressure ratio of one message per cycle. After about 500 ms, the input backpressure increases to 500, which activates the trigger condition and results in the parameter-based reconfiguration of the primary function routing mechanism to drop all non-critical messages. This can be observed via the drop in the send counter and the rapidly decreasing input backpressure. The backpressure decreases at a ratio of about 15 messages per cycle and processes the 500 messages in less than 35 ms. Figure 24a,b show a negative correlation between their backpressure counters because of the following reason: The received backpressure only increases if the input service is under a high load and cannot process all generated messages. Hence, the input service can send fewer messages to the primary function servicer. Consequently, the input backpressure remains constant or decreases.
Output Service. Figure 23c and Figure 24c show that the output services can process and publish all its received messages. During the experiment, no output backpressure is generated.
MAPE Timing. Figure 25 shows a box plot of the MAPE loop’s timing characteristics. We explained the individual characteristics in Section 7.1. Each column in Figure 25 has its individual y-axis, scaled in microseconds, and shows the latency results for the execution of a single MAPE step:
1.
M: The [ S R C ] t o [ C L T ] latency corresponds to the monitoring step and denotes the latency between the twinning at the service side (i.e., the source) and the processing of the twinned data by the CLT.
2.
AP: The [ C L T ] t o [ T R G ] latency corresponds to the analyze–plan steps and denotes the time the CLT requires to evaluate the trigger condition shown in Figure 22.
3.
E: The [ T R G ] t o [ R S T ] latency corresponds to the execute step and denotes the time to execute the series of commands and invariant checks required to reconfigure the message routing of the primary function service.
4.
MAP: The [ S R C ] t o [ T R G ] latency shows the accumulated latency of the monitor, analyze, and plan steps.
5.
MAPE: The [ S R C ] t o [ R S T ] latency shows the accumulated latency of the entire MAPE loop.

7.3. Interpretation

The monitoring timing analysis shows that PA and SA states can be twinned at a maximum latency of approximately 6 ms, whereas the median is near 1 ms. The parameter-based adaptation shows a maximum latency of approximately 64 ms. The results show a maximum end-to-end latency of approximately 69 ms, which is the maximum time required to execute all MAPE-K steps, including all invariant checks after the actual adaptation. The observed system behavior shows that the implemented data flow model is robust against message bursts and that message bursts do not result in the violation of real-time constraints. In short, the experiment confirms that the SWF supports the twinning of PA and SA states to establish a context-aware MAPE loop for CPS service self-adaptation.

8. Experiment 3: Service Update and Reconfiguration Characteristics

This experiment intends to validate the requirement R5. Therefore, the experiment’s goal is to analyze the SWF’s architecture-based service update and the SWF’s parameter-based service reconfiguration characteristics concerning its timing and the availability of the system during the adaptation process from the point of view of a software engineer in the context of designing a CPS control system that shall support zero-downtime updates and the reconfiguration of CPS real-time control services. The experiment’s hypothesis is that the SWF supports the updating and reconfiguration of real-time CPS control services without causing service interruption and downtime. For hypothesis testing, the A/B service deployment process as described in [31,36] shall be implemented, and the timings of the individual update and reconfiguration steps shall be measured. Experimental and data validity is ensured according to the statement in Section 5.2.

8.1. Experimental Design

Section 5 describes the general experimental setup and its instrumentation. Table 5 gives an overview of the experiment factors and dependent variables. Any elements not explained here are introduced in Section 4 and Section 5. The system sequence diagram in Figure 26 shows the experiment-specific steps. The sequence diagram is kept minimalistic and shows only the relevant interactions between the individual services that shall also be observable in the measurement results. The experiment is fully automated and is started by the test engineer. In the setup phase, the CLT starts and configures all services. Each service implements the cyclic processing pipeline and data flow model described in Section 4.3. The RT PS Input service acts as a data generator and sends a single message per cycle to the RT PF service. The RT PF A service receives the message, processes it, and sends it to the RT PS output service. The RT PF A service is the service that shall be updated, i.e., replaced by the RT PF B service. Note that the state transfer between services A and B is not part of this evaluation and will be subject to future work. Still, we provide a short description due to its importance in the overall process.
Table 5 summarizes the experimental configuration chosen to evaluate the timings and the service behavior during the update and reconfiguration process. The reconfiguration process itself is the factor under evaluation. The process can be divided into three four phases:
1.
In the first phase, the RT PF B service is deployed and configured. This phase consists of steps s [ 02 ] to s [ 05 ] . The experiment is designed to evaluate the adaptation capabilities of the SWF. In order to avoid any blurring effects, the PF B service remains unchanged, unlike in an actual A/B testing situation. Instead, PF B is a replica of PF A with the same complexity, execution time, inputs, and outputs as defined by the constant factors shown in Table 5.
2.
In the second phase, the RT PF B service is linked to the RT PS unput and output services, resulting in the side-by-side operation of services A and B. Note that the side-by-side operation represents the observation phase to compare the service behavior in an A/B testing scenario. At the end of the second phase, both services receive the same input messages and send their output messages to the RT PS output service. This phase consists of steps s [ 07 ] and s [ 08 ] .
3.
Notes on the state transfer: If implemented, the state transfer between A and B would be executed next, resulting in service B taking over the responsibilities of service A. As noted, the evaluation of the state transfer a subject of future work. But we outline its underlying mechanism and expected timing characteristics. In principle, the state transfer is similar to updating the publisher and subscriber configurations (see steps s [ 7 ] and s [ 8 ] ) with one extra step. Hence, the time required for a state transfer is comparable to steps s [ 7 ] and s [ 8 ] . In particular, the state transfer consists of the following steps. First, the manager creates a new shared-memory logical object, which is denoted logical object B. Logical object B, at first, is a copy of the PF A service’s configuration and data elements (i.e., logical object B is a copy of logical object A). In the second step, the manager appends all elements required by the PF B service, such as variables, inputs, and outputs, to logical object B. Third, the publisher service is configured to perform a memory copy at the end of each cycle to transfer the state from logical object A to logical object B. The copy operation ensures that logical object B seamlessly obtains all the state information from logical object A. At this stage, service A is still the active service executing asset control. The publisher service is responsible for ensuring system integrity during side-by-side operations. To that aim, the publisher is configured (a) to perform the necessary twinning for A/B testing and (b) not to forward output signals of service B that interfere with service A’s output signals. The engineering team is responsible for creating an automation script that properly configures all relevant services, such as logical object B and the publisher. The twinning data are used for the (manual or automated) validation of service B behavior. If service B operates as intended, the publisher is reconfigured to block all signals of service A and simultaneously forward all signals of service B. At this stage, service B seamlessly becomes the active service and service A becomes the passive service. If the system operates as intended, the manager can terminate service A. Otherwise, the manager service or an operator can trigger a rollback by reconfiguring the publisher to its old state and terminating service B. Additional details about the described sequence can be found in our previous works [6,31].
4.
In the last phase, the RT PF A service is terminated if the RT PF B service operates as intended, which leaves the system in the desired post-update state.
During and between these phases, all service states are continuously monitored, providing the necessary context to implement automated failure-detection and rollback mechanisms, such as the MAPE-K approach demonstrated in Section 7. In this experiment, the observing (i.e., monitoring) steps are used only for demonstration. Table 6 describes the intention and details of the individual process steps in the present experiment. The table also shows the results of the duration measurement of each step.
Notes on distributed orchestration: Local service updates and reconfigurations may affect or depend on other local and remote services. Hence, service updates may result in a complex chain of distributed system alterations. This may include the deployment and termination of services, the reconfiguration of input and output signals, and the update of MAPE elements and rules across different criticality layers in the system. To ensure the proper coordination of these alterations, the SWF is designed according to the hierarchical control pattern with knowledge repositories for each MAPE loop as per Weyns et al. [39]. Our previous work [31] provides detailed insights into the architectural requirements, the individual design aspects of the different system layers, and the hierarchical coordination of A/B testing in a distributed OT environment. As noted in Section 1.3, the empirical evaluation focuses on the embedded systems layer. Hence, the detailed investigation of distributed orchestration is a subject of future work.

8.2. Results and Analysis

Figure 27 shows the experiment results and is structured as four diagrams:
Diagram(a)
This diagram shows the time series data of the RT PS input service that acts as a data generator and sends messages to the RT PF service.
Diagram(b)
This diagram shows the time series data of the RT PF service A that processes the received data and forwards them to the RT PS output service.
Diagram(c)
This diagram shows the time series data of the RT PF service B that implements the same functional behavior as service A. Service A shall be replaced with service B.
Diagram(d)
This diagram shows the time series data of the RT PS output service that processes the received data from A and B and simulates data forwarding.
The time series diagrams show the cycle usage and data flow between the services during the entire update and reconfiguration process:
  • Primary y-axis: The cycle usage is plotted along the primary y-axis on the left.
  • Secondary y-axis: The number of messages received per cycle is plotted along the secondary y-axis on the right side.
  • Annotations: Each colored area represents the execution time of its corresponding process step, as indicated by the alternating labels at the top and bottom left side of each colored area.
The individual steps shown in Figure 27 are described in the previous sections. In the remainder of this section, we focus on analyzing interesting observations. First, Table 7 compares the observed system behavior before and after the update process, i.e., before step s [ 02 ] and after step s [ 10 ] .
Second, we analyze the individual steps during the updating process. The results show that the startup of service B does not affect the RT PS input and output services but has significant side effects on the RT PF A service, which can be observed at the beginning of step s [ 02 ] . Our subsequent analysis of the implementation reveals that the observed side effects correlate with the allocation and initialization of shared memory elements (i.e., several queues and configurations per pipeline stage). During this phase, cache, bus, and memory contention are high, which may result in the observed side effects. An improved memory-allocation sequence could reduce these side effects.
The subscription of service B to all messages of the RT PS input service in step s [ 07 ] has the following effects:
  • The cycle usage of the RT PS input service increases slightly because of the additional message that is sent to service B.
  • The cycle usage of service B increases by about 8% once the link between the RT PS input service and service B is established because service B starts to process the data received.
  • Once the link between the services is established, the cycle usage of service A slightly increases.
  • The newly established link does not affect the RT PS output service.
The subscription of the RT PS output service to all messages of service B in step s [ 08 ] has the following effects:
  • Step s [ 08 ] does not affect service A or the RT PS input service.
  • Once the link between the services is established, the cycle usage of service B decreases.
  • After the successful subscription of the RT PS output service, the output service receives two messages, i.e., one message from each service.
The RT PF A service is terminated in step s [ 10 ] , reducing the number of messages received by the RT PS output service by one. All other effects of this step are described in Table 7.

8.3. Interpretation

This experiment confirms that the SWF supports the updating and reconfiguring of real-time CPS control services without causing real-time constraint violations, service interruption, and downtime. The most important lesson of this experiment is that significant side effects can occur during the service startup phase. In particular, the high CPU cache, bus, and memory contention during memory allocation and initialization must be reduced to minimize the potential of cycle time violations under high load conditions. In short, the experiment confirms that the SWF supports the deployment, update, and A/B testing of real-time CPS services without causing system interruption and downtime.

9. Discussion

9.1. Research Agenda: Coverage of Research Questions and Requirements

Table 8 summarizes the requirements and research question coverage based on the interpretation of the conducted experiments.
We can therefore state that our concept covers all the requirements and provides answers to all our research questions. Even though the experimental scope of the present work is limited to the control layer and the experimental setup is limited to the laboratory scale, we claim that we can trust these results. This is because the experimental setup is representative of real mission-critical industrial setups, as are the short cycle times and hard real-time constraints that we fulfilled. In particular, it can be assumed that commercial industrial-grade software and hardware platforms offer similar or higher performance at the control layer. Furthermore, the timing requirements and resource constraints are less stringent in any layer above the embedded control layer, so the SWF and the implemented self-adaptive system models remain applicable.

9.2. Design Space: Self-Adaptive Software Models to Realize DevOps for Smart CPS

Section 1 states the two main research questions addressed by the case study presented in this work. In this section, we discuss how the demonstrated experiments can answer these questions. To structure our discussion, we refer to the design space and the AdEpS model shown in Figure 1 and to the outline of this work’s contributions provided in Table 1.
In this work, we argue that modern software systems—such as CPS-, cloud-, and service-oriented systems—must be designed for technical sustainability to satisfy short- and long-term stakeholder concerns in today’s dynamic industrial environments. We further argue that technical sustainability can be achieved by adhering to DevOps principles. While DevOps is a well-established concept in the IT domain, it is de facto not implemented in the CPS, OT, or embedded system domains. Its transfer to these domains is considered a challenging problem. We propose implementing the AdEpS model (Adaptation and Evolution processes for Sustainability) to address this challenge.
To achieve that aim, we follow an architectural approach and propose self-adaptive system design models for the integrated management of CPS adaptation and evolution processes. The evolution processes address the development/engineering-centric uncertainties, while the adaptation processes mitigate the operations/runtime-centric uncertainties illustrated in Figure 1b.
Our approach addresses goal uncertainty through a microservice-based design. This design implements the MAPE-K pattern for decentralized control and supports parameter-based and architecture-based adaptation mechanisms to realize runtime adaptation and evolution at all CPS layers without causing system interruptions and downtime (see the design models in Table 1). We use embedded and interconnected logical objects as knowledge repositories to integrate and coordinate the adaptation processes. In addition, these logical objects provide a unified service-oriented interface to all MAPE-K elements for humans and machines alike. Hence, these logical objects can provide the context- and self-awareness to implement self-protection mechanisms to mitigate environmental uncertainty and change-enactment uncertainty, which is confirmed via the empirical experiments summarized in Table 1. Self-protection mechanisms are essential to ensure the reliable execution of both machine- and human-driven change processes.
As demonstrated by the experiments, our approach supports four DevOps capabilities that are essential to support the IPS2 use cases relevant to our industrial case study (see Table 1 C1 to C4 and U1 to U4):
  • Reliable remote asset monitoring is supported by the logical objects’ monitoring capabilities. Their service-oriented nature enables the dynamic subscription to asset information at runtime, which supports the dynamic composition of monitoring and alerting mechanisms.
  • Reliable remote asset optimization relies on asset monitoring to drive, e.g., a machine-learning model that predicts the optimal operational parameters. The machine-driven parameter-based adaptation of CPS services, i.e., their logical objects, enables the adjustment of the runtime parameters based on the predicted parameter set without causing system downtime.
  • Reliable remote asset commissioning and maintenance is driven by monitoring, self-protection, and architecture-based adaptation mechanisms. During commissioning and maintenance work, engineers typically reconfigure the underlying software system. This involves parametric changes (e.g., update of control parameters) and architectural changes (e.g., new input signal, software update, new communication link). Let us anticipate that logical objects can be used in future scenarios to pre-validate such changes in test environments. However, due to model uncertainty [41], it can only be guaranteed that testing (and simulation) can cover some aspects of the operational CPS and its environment. Hence, any reconfiguration and deployment of software and hardware in an operational environment are accompanied by change-enactment uncertainties and environmental uncertainties. In order to avoid unforeseen disruptions, it is of utmost importance to ensure the reliable execution of any adaptation to the CPS through self-protection mechanisms. In addition to self-protection, our approach also provides capabilities to mitigate model uncertainty through runtime experimentation (i.e., CE). The support for CE allows engineers to validate changes in the real operational environment before their actual deployment, which brings about the following two benefits. First, it can reduce unexpected interruptions and limited service quality. Second, engineers can use the data obtained during runtime experimentation to update their models to reflect the observations better, effectively mitigating model uncertainty. In addition, interruption-free CE fosters the vision of self-evolving computing systems [15] that rely on runtime experiments to validate system changes proposed by their machine-driven evolutionary engine.

9.3. Summary

Summing up, the conducted experiments demonstrate that our DT-enhanced architectural approach promotes the implementation of DevOps capabilities for CPSs and embedded systems. Logical objects play a central role since they provide service-oriented access to the MAPE-K elements, which is required to implement reliable and effective change processes across CPS layers and lifecycle phases. Based on the AdEpS model, we discussed the sources of uncertainty that our approach can address. In short, our work demonstrates that DevOps capabilities can be feasibly implemented for mission-critical high-availability CPS, and these capabilities not only enhance the technical sustainability of CPS but also promote the implementation of modern industrial use cases. Our design models’ architectural nature (i.e., technology- and protocol-agnosticism) makes them transferable to other types of smart software systems operating on the embedded system layer or above.

10. Conclusions and Future Work

This article proposes a holistic technical concept for implementing an electronic control architecture that enables smart CPS to autonomously adapt both their physical space and cyberspace to varying requirements and uncertainties in their operational context and during runtime. This is achieved through a DT-enhanced control service for resource-constrained embedded devices that control high-availability mission-critical CPS. In an experimental setup that reflects actual electronic controls and communication interfaces used in modern mission-critical CPS, we showed that our concept achieves sub-millisecond real-time twinning (i.e., monitoring) of the CPS’s physical and cyberspace. Consequently, our concept can be applied to sub-millisecond real-time control of both the physical and virtual electronic controls underlying the physical assets of the CPS.
From an application perspective, this concept represents a significant step toward transferring DevOps to CPS and, more generally, embedded systems. DevOps facilitates these systems’ continuous adaptation to emergent needs and uncertainties, like changing user requirements and changes in their operational context. These properties are essential to address the dynamic nature and uncertainties of modern industrial environments such as Industrial Product–Service Systems. The key to this achievement is a microservice-based design for orchestrating natively deployed embedded services. A secondary asset Digital Twin model complements the design (a) to reflect the operational cyberspace for context- and self-aware decision-making and adaptation and (b) to provide service-oriented access to the CPS’s MAPE-K elements. This enables zero-downtime architecture-based and parameter-based service adaptation for continuous deployment (CD) and continuous experimentation (CE) in CPS.
In order to achieve the required levels of criticality, the concept includes self-protection features through zero-downtime parameter-based self-adaptation. This enables emerging industrial applications, including
  • Reliable and dynamically reconfigurable remote monitoring;
  • Reliable, interactive, and automated remote commissioning and maintenance;
  • Reliable, interactive, and automated software deployment; and
  • Reliable, interactive, and automated runtime experiments (i.e., A/B testing) to validate changes in the operational environment before their deployment to production.
Future perspectives include transferring the experimental implementation to real CPS to confirm performance and criticality measurements. The application layer’s performance can be evaluated in such settings, and the results can be used to propose further applications. Furthermore, in-depth investigations of A/B testing of control functions, the potential of the side-by-side operation to increase system safety and fault tolerance, and security aspects of the system design are promising extensions to this research. A visionary opportunity is the development of machine-driven evolutionary engines [15] that use runtime experiments (i.e., A/B testing) to validate evolution steps in the real operational environment to implement autonomous self-evolving computing systems that continuously improve their safety, fault tolerance, and security levels.

Author Contributions

Conceptualization, J.D. and G.M.; methodology, J.D., G.M. and A.R.; software, J.D.; validation, J.D. and M.E.; formal analysis, J.D. investigation, J.D.; resources, J.D., G.M. and M.E.; data curation, J.D.; writing—original draft preparation, J.D.; writing—review and editing, A.R. and G.M.; visualization, J.D.; supervision, G.M.; project administration, G.M.; funding acquisition, G.M. and M.E. All authors have read and agreed to the published version of the manuscript.

Funding

This research was funded by Andritz Hydro GmbH, which has been supported by the Austrian Research Funding Agency FFG. Supported by TU Graz Open Access Publishing Fund.

Data Availability Statement

Simulation data can be made available upon request by the corresponding author.

Acknowledgments

Apart from the fund providers, the authors kindly thank the research team members and reviewers for their critical comments and suggestions.

Conflicts of Interest

The authors declare no conflict of interest.

Abbreviations

The following abbreviations are used in this manuscript:
APIapplication programming interface
BEbest-effort
CLTcommand line tool
CPSCyber-Physical System
CUcontrol unit
DevOpsDevelopmentOperation
DTDigital Twin
FIFOfirst-in–first-out
IIoTIndustrial Internet of Things
IoTInternet of Things
IPS2Industrial Product-Service System
ITInformation Technology
LOlogical object
MAPE-Kmonitor-analyze-plan-execute-knowledge
OLSordinary least squares
OTOperation Technology
PAprimary asset
PFprimary function
PFPprimary function portion
PSprotocol stack
Rrequirement
REreliable
RQresearch questions
RTreal time
ROreal object
SAsecondary asset
SCADAsupervisory control and data acquisition
SSHsecure socket shell
SWFsoftware framework
UCuse case

Appendix A. Experiment 1

Figure A1. PF received counter of the RT PF service, showing the number of received messages per cycle.
Machines 11 00973 g0a1
Figure A2. PF received drop counter of the RT PF service, showing the number of messages dropped during the receiving step due to e.g., backpressure and routing decisions.
Machines 11 00973 g0a2
Figure A3. PF sending counter of the RT PF service, showing the number of messages sent per cycle.
Machines 11 00973 g0a3
Figure A4. PF sending drop counter of the RT PF service, showing the number of messages dropped during the send step due to e.g., backpressure at the message destination.
Machines 11 00973 g0a4

Appendix B. Screenshots

Figure A5. Screenshot of the KSysGuard dashboard during experiment 1.
Machines 11 00973 g0a5
Figure A6. Screenshot of the KSysGuard dashboard during experiment 2.
Machines 11 00973 g0a6

References

  1. Baheti, R.; Gill, H. Cyber-physical systems. Impact Control. Technol. 2011, 12, 161–166. [Google Scholar]
  2. Jazdi, N. Cyber physical systems in the context of Industry 4.0. In Proceedings of the 2014 IEEE International Conference on Automation, Quality and Testing, Robotics, Cluj-Napoca, Romania, 22–24 May 2014; pp. 1–4. [Google Scholar]
  3. Aheleroff, S.; Mostashiri, N.; Xu, X.; Zhong, R.Y. Mass personalisation as a service in industry 4.0: A resilient response case study. Adv. Eng. Inform. 2021, 50, 101438. [Google Scholar] [CrossRef]
  4. Meier, H.; Roy, R.; Seliger, G. Industrial Product-Service Systems—IPS 2. CIRP Ann. 2010, 59, 607–627. [Google Scholar] [CrossRef]
  5. Brissaud, D.; Sakao, T.; Riel, A.; Erkoyuncu, J.A. Designing value-driven solutions: The evolution of industrial product-service systems. CIRP Ann. 2022, 71, 553–575. [Google Scholar] [CrossRef]
  6. Dobaj, J.; Riel, A.; Macher, G.; Egretzberger, M. A Method for Deriving Technical Requirements of Digital Twins as Industrial Product-Service System Enablers. In Systems, Software and Services Process Improvement; Yilmaz, M., Clarke, P., Messnarz, R., Wöran, B., Eds.; Springer International Publishing: Cham, Switzerland, 2022; Volume 1646, Communications in Computer and Information Science; pp. 378–392. [Google Scholar] [CrossRef]
  7. Römer, K.; Mattern, F. Towards a unified view on space and time in sensor networks. Comput. Commun. 2022, 28, 1484–1497. [Google Scholar] [CrossRef]
  8. Weyns, D.; Andersson, J.; Caporuscio, M.; Flammini, F.; Kerren, A.; Löwe, W. A research agenda for smarter cyber-physical systems. J. Integr. Des. Process. Sci. 2021, 25, 27–47. [Google Scholar] [CrossRef]
  9. Weyns, D.; Caporuscio, M.; Vogel, B.; Kurti, A. Design for sustainability = runtime adaptation ∪ evolution. In Proceedings of the 2015 European Conference on Software Architecture Workshops, Dubrovnik/Cavtat, Croatia, 7–11 September 2015; pp. 1–7. [Google Scholar]
  10. Becker, C.; Chitchyan, R.; Duboc, L.; Easterbrook, S.; Mahaux, M.; Penzenstadler, B.; Rodriguez-Navas, G.; Salinesi, C.; Seyff, N.; Venters, C.; et al. The Karlskrona manifesto for sustainability design. arXiv 2014, arXiv:1410.6968. [Google Scholar]
  11. Taing, N.; Wutzler, M.; Springer, T.; Cardozo, N.; Schill, A. Consistent unanticipated adaptation for context-dependent applications. In Proceedings of the 8th ACM International Workshop on Context-Oriented Programming, Rome, Italy, 17–22 July 2016; pp. 33–38. [Google Scholar]
  12. Grieves, M.; Vickers, J. Digital Twin: Mitigating Unpredictable, Undesirable Emergent Behavior in Complex Systems. In Transdisciplinary Perspectives on Complex Systems; Kahlen, F.J., Flumerfelt, S., Alves, A., Eds.; Springer International Publishing: Cham, Switzerland, 2017; pp. 85–113. [Google Scholar] [CrossRef]
  13. Pahl, C.; Jamshidi, P.; Weyns, D. Cloud architecture continuity: Change models and change rules for sustainable cloud software architectures. J. Softw. Evol. Process. 2017, 29, e1849. [Google Scholar] [CrossRef]
  14. Tavčar, J.; Horvath, I. A review of the principles of designing smart cyber-physical systems for run-time adaptation: Learned lessons and open issues. IEEE Trans. Syst. Man Cybern. Syst. 2018, 49, 145–158. [Google Scholar] [CrossRef]
  15. Weyns, D.; Bäck, T.; Vidal, R.; Yao, X.; Belbachir, A.N. The vision of self-evolving computing systems. J. Integr. Des. Process. Sci. 2022, 26, 351–367. [Google Scholar] [CrossRef]
  16. Riel, A.; Kreiner, C.; Macher, G.; Messnarz, R. Integrated design for tackling safety and security challenges of smart products and digital manufacturing. CIRP Ann. 2017, 66, 177–180. [Google Scholar] [CrossRef]
  17. Dobaj, J.; Schuss, M.; Krisper, M.; Boano, C.A.; Macher, G. Dependable mesh networking patterns. In Proceedings of the 24th European Conference on Pattern Languages of Programs, Irsee, Germany, 3–7 July 2019; Boldt, T., Ed.; ACM: New York, NY, USA, 2019; pp. 1–14. [Google Scholar] [CrossRef]
  18. Avizienis, A.; Laprie, J.C.; Randell, B.; Landwehr, C. Basic concepts and taxonomy of dependable and secure computing. IEEE Trans. Dependable Secur. Comput. 2004, 1, 11–33. [Google Scholar] [CrossRef]
  19. Siqueira, F.; Davis, J.G. Service Computing for Industry 4.0: State of the Art, Challenges, and Research Opportunities. ACM Comput. Surv. 2022, 54, 1–38. [Google Scholar] [CrossRef]
  20. McManus, H.; Hastings, D. A framework for understanding uncertainty and its mitigation and exploitation in complex systems. IEEE Eng. Manag. Rev. 2006, 34, 81. [Google Scholar] [CrossRef]
  21. Dobaj, J.; Iber, J.; Krisper, M.; Kreiner, C. A Microservice Architecture for the Industrial Internet-Of-Things. In Proceedings of the 23rd European Conference on Pattern Languages of Programs, Irsee, Germany, 4–8 July 2018; ACM: New York, NY, USA, 2018; pp. 1–15. [Google Scholar] [CrossRef]
  22. Qu, M.; Yu, S.; Chen, D.; Chu, J.; Tian, B. State-of-the-art of design, evaluation, and operation methodologies in product service systems. Comput. Ind. 2016, 77, 1–14. [Google Scholar] [CrossRef]
  23. Humble, J.; Molesky, J. Why Enterprises Must Adopt Devops to Enable Continuous Delivery. Cut. IT J. 2011, 24, 6–12. [Google Scholar]
  24. Ebert, C.; Gallardo, G.; Hernantes, J.; Serrano, N. DevOps. IEEE Softw. 2016, 33, 94–100. [Google Scholar] [CrossRef]
  25. Leite, L.; Rocha, C.; Kon, F.; Milojicic, D.; Meirelles, P. A Survey of DevOps Concepts and Challenges. ACM Comput. Surv. 2020, 52, 1–35. [Google Scholar] [CrossRef]
  26. Damjanovic-Behrendt, V.; Behrendt, W. An open source approach to the design and implementation of Digital Twins for Smart Manufacturing. Int. J. Comput. Integr. Manuf. 2019, 32, 366–384. [Google Scholar] [CrossRef]
  27. Minerva, R.; Lee, G.M.; Crespi, N. Digital Twin in the IoT Context: A Survey on Technical Features, Scenarios, and Architectural Models. Proc. IEEE 2020, 108, 1785–1824. [Google Scholar] [CrossRef]
  28. Wang, Z.; Gupta, R.; Han, K.; Wang, H.; Ganlath, A.; Ammar, N.; Tiwari, P. Mobility Digital Twin: Concept, Architecture, Case Study, and Future Challenges. IEEE Internet Things J. 2022, 9, 17452–17467. [Google Scholar] [CrossRef]
  29. Bellavista, P.; Bicocchi, N.; Fogli, M.; Giannelli, C.; Mamei, M.; Picone, M. Requirements and design patterns for adaptive, autonomous, and context-aware digital twins in industry 4.0 digital factories. Comput. Ind. 2023, 149, 103918. [Google Scholar] [CrossRef]
  30. Lwakatare, L.E.; Karvonen, T.; Sauvola, T.; Kuvaja, P.; Olsson, H.H.; Bosch, J.; Oivo, M. Towards DevOps in the embedded systems domain: Why is it so hard? In Proceedings of the 2016 49th Hawaii International Conference On System Sciences (Hicss), Koloa, HI, USA, 5–8 January 2016; pp. 5437–5446. [Google Scholar]
  31. Dobaj, J.; Riel, A.; Krug, T.; Seidl, M.; Macher, G.; Egretzberger, M. Towards digital twin-enabled DevOps for CPS providing architecture-based service adaptation & verification at runtime. In Proceedings of the 17th Symposium on Software Engineering for Adaptive and Self-Managing Systems, Pittsburgh, PA, USA, 18–23 May 2022; Schmerl, B., Maggio, M., Cámara, J., Eds.; ACM: New York, NY, USA, 2022; pp. 132–143. [Google Scholar] [CrossRef]
  32. Directorate-General for Research and Innovation. Industry 5.0—Towards a Sustainable, Human-Centric and Resilient European Industry. Available online: https://research-and-innovation.ec.europa.eu/knowledge-publications-tools-and-data/publications/all-publications/industry-50-towards-sustainable-human-centric-and-resilient-european-industry_en (accessed on 1 October 2023).
  33. Aheleroff, S.; Huang, H.; Xu, X.; Zhong, R.Y. Toward sustainability and resilience with Industry 4.0 and Industry 5.0. Front. Manuf. Technol. 2022, 2, 951643. [Google Scholar] [CrossRef]
  34. Xu, X.; Lu, Y.; Vogel-Heuser, B.; Wang, L. Industry 4.0 and Industry 5.0—Inception, conception and perception. J. Manuf. Syst. 2021, 61, 530–535. [Google Scholar] [CrossRef]
  35. Zizic, M.C.; Mladineo, M.; Gjeldum, N.; Celent, L. From industry 4.0 towards industry 5.0: A review and analysis of paradigm shift for the people, organization and technology. Energies 2022, 15, 5221. [Google Scholar] [CrossRef]
  36. Quin, F.; Weyns, D.; Galster, M.; Silva, C.C. A/B Testing: A Systematic Literature Review. arXiv 2023, arXiv:2308.04929. [Google Scholar]
  37. Haberfellner, R.; de Weck, O.; Fricke, E.; Vössner, S. Process Models: Systems Engineering and Others. In Systems Engineering: Fundamentals and Applications; Springer International Publishing: Cham, Switzarland, 2019; pp. 27–98. [Google Scholar] [CrossRef]
  38. Dobaj, J.; Krisper, M.; Macher, G. Towards Cyber-Physical Infrastructure as-a-Service (CPIaaS) in the Era of Industry 4.0. In Systems, Software and Services Process Improvement; Walker, A., O’Connor, R.V., Messnarz, R., Eds.; Communications in Computer and Information Science; Springer International Publishing: Cham, Switzerland, 2019; Volume 1060, pp. 310–321. [Google Scholar] [CrossRef]
  39. Weyns, D.; Schmerl, B.; Grassi, V.; Malek, S.; Mirandola, R.; Prehofer, C.; Wuttke, J.; Andersson, J.; Giese, H.; Göschka, K.M. On Patterns for Decentralized Control in Self-Adaptive Systems. In Software Engineering for Self-Adaptive Systems II; de Lemos, R., Giese, H., Müller, H.A., Shaw, M., Eds.; Lecture Notes in Computer Science; Springer: Berlin/Heidelberg, Germany, 2013; Volume 7475, pp. 76–107. [Google Scholar] [CrossRef]
  40. La Iglesia, D.G.D.; Weyns, D. MAPE-K Formal Templates to Rigorously Design Behaviors for Self-Adaptive Systems. ACM Trans. Auton. Adapt. Syst. 2015, 10, 1–31. [Google Scholar] [CrossRef]
  41. Schneider, G.F.; Wicaksono, H.; Ovtcharova, J. Virtual engineering of cyber-physical automation systems: The case of control logic. Adv. Eng. Inform. 2019, 39, 127–143. [Google Scholar] [CrossRef]
  42. Kuehner, K.J.; Scheer, R.; Strassburger, S. Digital twin: Finding common ground—A meta-review. Procedia CIRP 2021, 104, 1227–1232. [Google Scholar] [CrossRef]
  43. Tao, F.; Zhang, H.; Liu, A.; Nee, A.Y. Digital twin in industry: State-of-the-art. IEEE Trans. Ind. Inform. 2018, 15, 2405–2415. [Google Scholar] [CrossRef]
  44. Cimino, C.; Negri, E.; Fumagalli, L. Review of digital twin applications in manufacturing. Comput. Ind. 2019, 113, 103130. [Google Scholar] [CrossRef]
  45. Bayer, B.; Dalmau Diaz, R.; Melcher, M.; Striedner, G.; Duerkop, M. Digital twin application for model-based doe to rapidly identify ideal process conditions for space-time yield optimization. Processes 2021, 9, 1109. [Google Scholar] [CrossRef]
  46. Dobaj, J.; Macher, G.; Ekert, D.; Riel, A.; Messnarz, R. Towards a security–driven automotive development lifecycle. J. Softw. Evol. Process. 2021. [Google Scholar] [CrossRef]
  47. Malik, P.K.; Sharma, R.; Singh, R.; Gehlot, A.; Satapathy, S.C.; Alnumay, W.S.; Pelusi, D.; Ghosh, U.; Nayak, J. Industrial Internet of Things and its applications in industry 4.0: State of the art. Comput. Commun. 2021, 166, 125–139. [Google Scholar] [CrossRef]
  48. Silvestri, L.; Forcina, A.; Introna, V.; Santolamazza, A.; Cesarotti, V. Maintenance transformation through Industry 4.0 technologies: A systematic literature review. Comput. Ind. 2020, 123, 103335. [Google Scholar] [CrossRef]
  49. Leng, J.; Zhou, M.; Xiao, Y.; Zhang, H.; Liu, Q.; Shen, W.; Su, Q.; Li, L. Digital twins-based remote semi-physical commissioning of flow-type smart manufacturing systems. J. Clean. Prod. 2021, 306, 127278. [Google Scholar] [CrossRef]
  50. Mitzutani, I.; Ramanathan, G.; Mayer, S. Semantic data integration with DevOps to support engineering process of intelligent building automation systems. In Proceedings of the 8th ACM International Conference On Systems for Energy-Efficient Buildings, Cities, and Transportation (BuildSys), Coimbra, Portugal, 17–18 November 2021; pp. 294–297. [Google Scholar] [CrossRef]
  51. Mitzutani, I.; Ramanathan, G.; Mayer, S. Integrating Multi-Disciplinary Offline and Online Engineering in Industrial Cyber-Physical Systems through DevOps. In Proceedings of the 11th International Conference on the Internet of Things (IOT), St. Gallen, Switzerland, 8–12 November 2021; pp. 40–47. [Google Scholar] [CrossRef]
  52. Humble, J.; Farley, D. Continuous Delivery: Reliable Software Releases through Build, Test, and Deployment Automation; Pearson Education: London, UK, 2010. [Google Scholar]
  53. Rodríguez, P.; Haghighatkhah, A.; Lwakatare, L.E.; Teppola, S.; Suomalainen, T.; Eskeli, J.; Karvonen, T.; Kuvaja, P.; Verner, J.M.; Oivo, M. Continuous deployment of software intensive products and services: A systematic mapping study. J. Syst. Softw. 2017, 123, 263–291. [Google Scholar] [CrossRef]
  54. Yaman, S.G.; Munezero, M.; Münch, J.; Fagerholm, F.; Syd, O.; Aaltola, M.; Palmu, C.; Männistö, T. Introducing continuous experimentation in large software-intensive product and service organisations. J. Syst. Softw. 2017, 133, 195–211. [Google Scholar] [CrossRef]
  55. Boschert, S.; Heinrich, C.; Rosen, R. Next generation digital twin. In Proceedings of the TMCE 2018, Las Palmas de Gran Canaria, Spain, 7–11 May 2018; Volume 2018, pp. 7–11. [Google Scholar]
  56. Salehie, M.; Tahvildari, L. Self-adaptive software: Landscape and research challenges. ACM Trans. Auton. Adapt. Syst. TAAS 2009, 4, 1–42. [Google Scholar] [CrossRef]
  57. van Solingen, R.; Basili, V.; Caldiera, G.; Rombach, H.D. Goal Question Metric (GQM) Approach. In Encyclopedia of Software Engineering; Marciniak, J.J., Ed.; Wiley: New York, NY, USA, 2002. [Google Scholar] [CrossRef]
  58. Wohlin, C.; Runeson, P.; Höst, M.; Ohlsson, M.C.; Regnell, B.; Wesslén, A. Experimentation in Software Engineering; Springer: Berlin/Heidelberg, Germany, 2012. [Google Scholar] [CrossRef]
  59. Gerostathopoulos, I.; Vogel, T.; Weyns, D.; Lago, P. How do we Evaluate Self-adaptive Software Systems?: A Ten-Year Perspective of SEAMS. In Proceedings of the 2021 International Symposium on Software Engineering for Adaptive and Self-Managing Systems (SEAMS), Madrid, Spain, 18–24 May 2021; pp. 59–70. [Google Scholar] [CrossRef]
  60. Grieves, M. Digital twin: Manufacturing excellence through virtual factory replication. White Pap. 2014, 1, 1–7. [Google Scholar]
  61. Kritzinger, W.; Karner, M.; Traar, G.; Henjes, J.; Sihn, W. Digital Twin in manufacturing: A categorical literature review and classification. IFAC-PapersOnLine 2018, 51, 1016–1022. [Google Scholar] [CrossRef]
  62. Singh, M.; Fuenmayor, E.; Hinchy, E.P.; Qiao, Y.; Murray, N.; Devine, D. Digital twin: Origin to future. Appl. Syst. Innov. 2021, 4, 36. [Google Scholar] [CrossRef]
  63. Papazoglou, M.P.; Georgakopoulos, D. Service-oriented computing. Commun. ACM 2003, 46, 25–28. [Google Scholar] [CrossRef]
  64. Beugnard, A. A software engineering perspective on digital twin: Many candidates, none elected. In Proceedings of the DigitalTwin 2023, Gif-sur-Yvette, France, 11–13 October 2023. [Google Scholar]
  65. Murray, G.; Johnstone, M.N.; Valli, C. The convergence of IT and OT in critical infrastructure. In Proceedings of the 15th Australian Information Security Management Conference, Perth, Australia, 5–6 December 2017; pp. 149–155. [Google Scholar] [CrossRef]
  66. Ehie, I.C.; Chilton, M.A. Understanding the influence of IT/OT Convergence on the adoption of Internet of Things (IoT) in manufacturing organizations: An empirical investigation. Comput. Ind. 2020, 115, 103166. [Google Scholar] [CrossRef]
  67. Giannelli, C.; Picone, M. Editorial “Industrial IoT as IT and OT Convergence: Challenges and Opportunities”. IoT 2022, 3, 259–261. [Google Scholar] [CrossRef]
  68. Tian, S.; Hu, Y. The role of opc ua tsn in it and ot convergence. In Proceedings of the 2019 Chinese Automation Congress (CAC), Hangzhou, China, 22–24 November 2019; pp. 2272–2276. [Google Scholar]
  69. Patera, L.; Garbugli, A.; Bujari, A.; Scotece, D.; Corradi, A. A layered middleware for ot/it convergence to empower industry 5.0 applications. Sensors 2021, 22, 190. [Google Scholar] [CrossRef]
  70. Joshi, R.; Didier, P.; Holmberg, C.; Jimenez, J.; Carey, T. The Industrial Internet of Things Connectivity Framework. Industry IoT Consortium 2022. Available online: https://www.iiconsortium.org/iicf/ (accessed on 18 October 2023).
  71. Baron, C.; Louis, V. Towards a continuous certification of safety-critical avionics software. Comput. Ind. 2021, 125, 103382. [Google Scholar] [CrossRef]
  72. Combemale, B.; Wimmer, M. Towards a Model-Based DevOps for Cyber-Physical Systems. In Software Engineering Aspects of Continuous Development and New Paradigms of Software Production and Deployment; Bruel, J.M., Mazzara, M., Meyer, B., Eds.; Lecture Notes in Computer Science; Springer International Publishing: Cham, Switzerland, 2020; Volume 12055, pp. 84–94. [Google Scholar] [CrossRef]
  73. Hugues, J.; Hristosov, A.; Hudak, J.J.; Yankel, J. TwinOps—DevOps meets model-based engineering and digital twins for the engineering of CPS. In Proceedings of the 23rd ACM/IEEE International Conference on Model Driven Engineering Languages and Systems: Companion Proceedings, Virtual Event, Canada, 16–23 October 2020; Guerra, E., Iovino, L., Eds.; ACM: New York, NY, USA, 2020; pp. 1–5. [Google Scholar] [CrossRef]
  74. Ugarte Querejeta, M.; Etxeberria, L.; Sagardui, G. Towards a DevOps Approach in Cyber Physical Production Systems Using Digital Twins. In Computer Safety, Reliability, and Security. SAFECOMP 2020 Workshops; Casimiro, A., Ortmeier, F., Schoitsch, E., Bitsch, F., Ferreira, P., Eds.; Lecture Notes in Computer Science; Springer International Publishing: Cham, Switzerland, 2020; Volume 12235, pp. 205–216. [Google Scholar] [CrossRef]
  75. Hasselbring, W.; Henning, S.; Latte, B.; Mobius, A.; Richter, T.; Schalk, S.; Wojcieszak, M. Industrial DevOps. In Proceedings of the 2019 IEEE International Conference on Software Architecture Companion (ICSA-C), Hamburg, Germany, 25–26 March 2019; pp. 123–126. [Google Scholar] [CrossRef]
  76. Kostromin, R.; Feoktistov, A. Agent-Based DevOps of Software and Hardware Resources for Digital Twins of Infrastructural Objects. In Proceedings of the The 4th International Conference on Future Networks and Distributed Systems (ICFNDS); ACM: New York, NY, USA, 2020; pp. 1–6. [Google Scholar] [CrossRef]
  77. Mertens, J.; Denil, J. The Digital Twin as a Common Knowledge Base in DevOps to Support Continuous System Evolution. In Computer Safety, Reliability, and Security. SAFECOMP 2021 Workshops; Habli, I., Sujan, M., Gerasimou, S., Schoitsch, E., Bitsch, F., Eds.; Springer International Publishing: Cham, Switzerland, 2021; Volume 12853, Lecture Notes in Computer Science; pp. 158–170. [Google Scholar] [CrossRef]
  78. Meissner, H.; Ilsen, R.; Aurich, J.C. Analysis of Control Architectures in the Context of Industry 4.0. Procedia CIRP 2017, 62, 165–169. [Google Scholar] [CrossRef]
  79. DesRuisseaux, D. Practical overview of implementing IEC 62443 security levels in industrial control applications. Schneider Electric 2018. Available online: https://www.se.com/uk/en/download/document/998-20186845/ (accessed on 13 November 2020).
  80. Sharpe, R.; van Lopik, K.; Neal, A.; Goodall, P.; Conway, P.P.; West, A.A. An industrial evaluation of an Industry 4.0 reference architecture demonstrating the need for the inclusion of security and human components. Comput. Ind. 2019, 108, 37–44. [Google Scholar] [CrossRef]
  81. Fogli, M.; Giannelli, C.; Stefanelli, C. Edge-powered in-network processing for content-based message management in software-defined industrial networks. In Proceedings of the ICC 2022-IEEE International Conference on Communications, Seoul, Republic of Korea, 16–20 May 2022; pp. 1438–1443. [Google Scholar]
  82. Fogli, M.; Giannelli, C.; Stefanelli, C. Joint Orchestration of Content-Based Message Management and Traffic Flow Steering in Industrial Backbones. In Proceedings of the 2022 IEEE 23rd International Symposium on a World of Wireless, Mobile and Multimedia Networks (WoWMoM), Belfast, UK, 14–17 June 2022; pp. 325–330. [Google Scholar]
  83. Redelinghuys, A.J.H.; Basson, A.H.; Kruger, K. A six-layer architecture for the digital twin: A manufacturing case study implementation. J. Intell. Manuf. 2020, 31, 1383–1402. [Google Scholar] [CrossRef]
  84. Aheleroff, S.; Xu, X.; Zhong, R.Y.; Lu, Y. Digital Twin as a Service (DTaaS) in Industry 4.0: An Architecture Reference Model. Adv. Eng. Inform. 2021, 47, 101225. [Google Scholar] [CrossRef]
  85. European Commission: Smart Grid Coordination Group. Smart Grid Reference Architecture. Available online: https://energy.ec.europa.eu/publications/smart-grid-reference-architecture_en (accessed on 23 May 2020).
  86. Plattform Industry 4.0. The Reference Architectural Model Industrie 4.0 (RAMI 4.0)—An Introduction. Available online: https://www.plattform-i40.de/IP/Redaktion/EN/Downloads/Publikation/rami40-an-introduction.html (accessed on 23 May 2020).
  87. Shi, W.; Dustdar, S. The promise of edge computing. Computer 2016, 49, 78–81. [Google Scholar] [CrossRef]
  88. Lo Bello, L.; Steiner, W. A Perspective on IEEE Time-Sensitive Networking for Industrial Communication and Automation Systems. Proc. IEEE 2019, 107, 1094–1120. [Google Scholar] [CrossRef]
  89. UP – Bridge the Gap. UP Core Plus Specifications. Available online: https://up-board.org/upcoreplus/specifications/ (accessed on 23 July 2023).
  90. Canonical. Real-Time Ubuntu Is Now Generally Available. Canocial 2/14/2023. Available online: https://canonical.com/blog/real-time-ubuntu-is-now-generally-available#:~:text=14%20February%202023%2C%20London%3A%20Canonical,guarantee%20within%20a%20specified%20deadline (accessed on 23 July 2023).
  91. McKinley, P.K.; Sadjadi, S.M.; Kasten, E.P.; Cheng, B.H. Composing adaptive software. Computer 2004, 37, 56–64. [Google Scholar] [CrossRef]
  92. Artac, M.; Borovssak, T.; Di Nitto, E.; Guerriero, M.; Tamburri, D.A. DevOps: Introducing infrastructure-as-code. In Proceedings of the 2017 IEEE/ACM 39th International Conference on Software Engineering Companion (ICSE-C), Buenos Aires, Argentina, 20–28 May 2017; pp. 497–498. [Google Scholar]
  93. Hüttermann, M. Infrastructure as code. In DevOps for Developers; Springer: Berlin/Heidelberg, Germany, 2012; pp. 135–156. [Google Scholar]
  94. Krug, T.; Dobaj, J.; Macher, G. Enforcing Network Safety-Margins in Industrial Process Control Using MACD Indicators. In Systems, Software and Services Process Improvement; Yilmaz, M., Clarke, P., Messnarz, R., Wöran, B., Eds.; Communications in Computer and Information Science; Springer International Publishing: Cham, Switzerland, 2022; Volume 1646, pp. 401–413. [Google Scholar] [CrossRef]
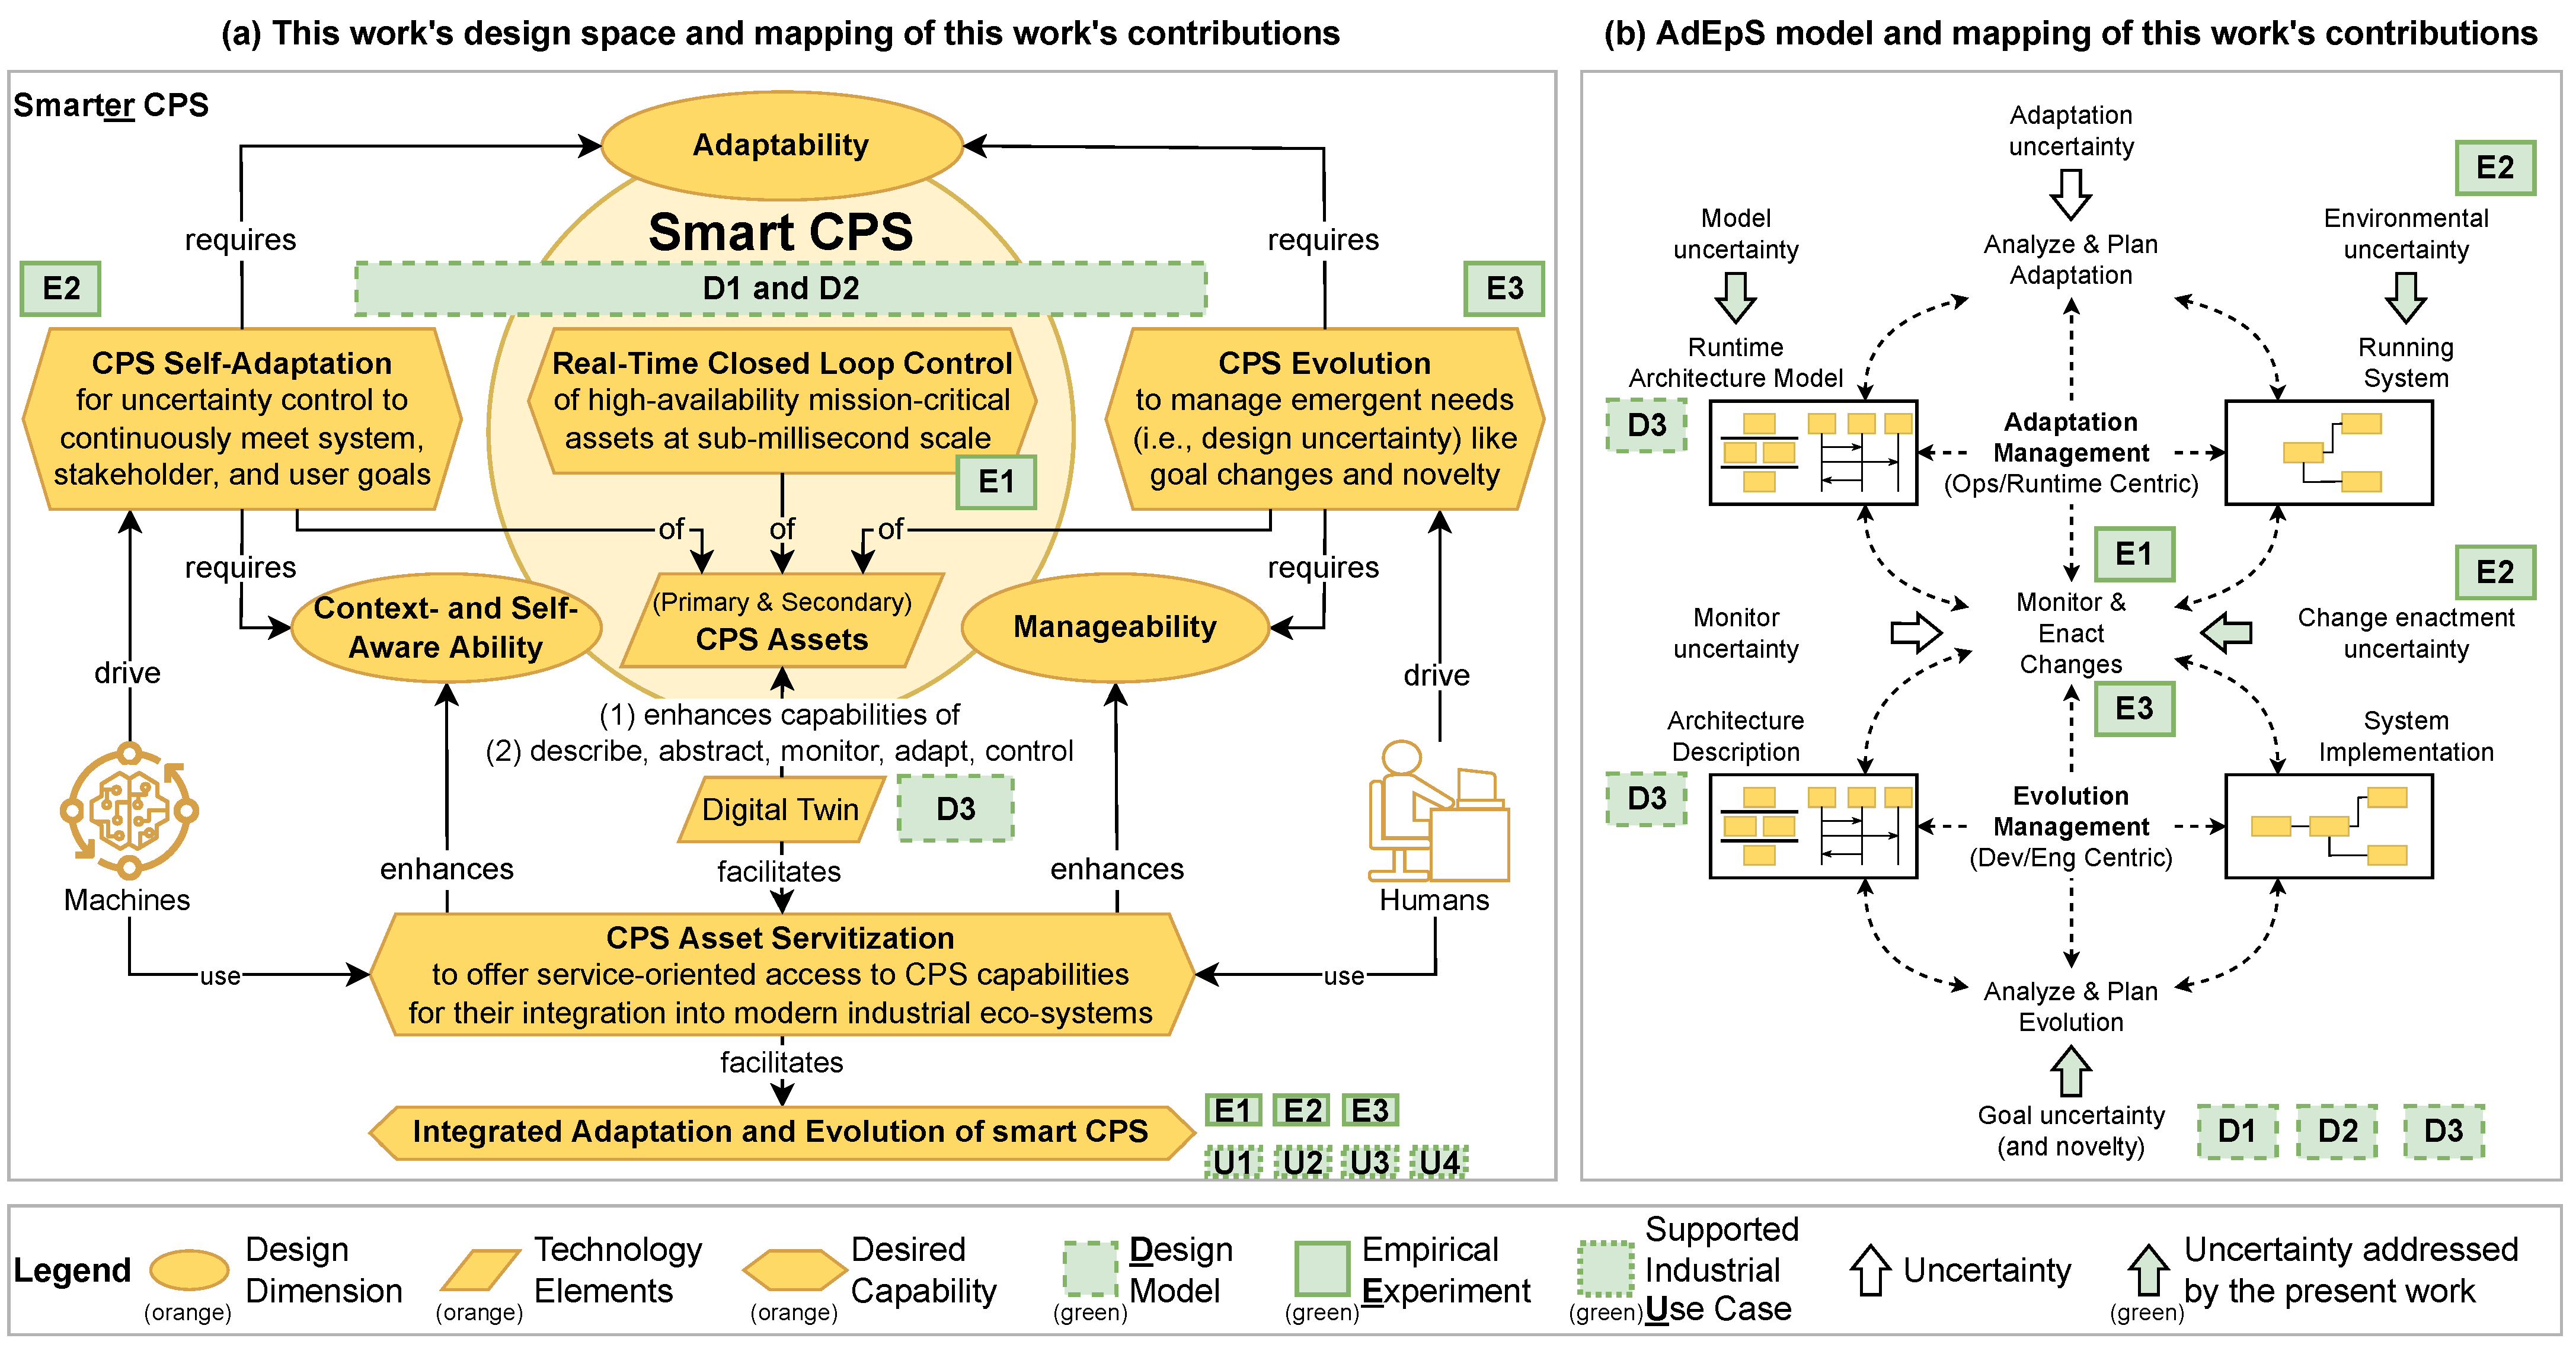
Figure 1. Visual breakdown of work: (a) shows a pseudo ontology of this work’s design space and (b) the AdEpS model as of [9], which we use to map our contributions. The green labels indicate our contributions, and Table 1 briefly describes them. Table 2 explains the uncertainty types.
Machines 11 00973 g001
Figure 2. (a) Digital Twin concept. (b) Concept of a typical industrial software architecture supporting DTs (adapted from [27]).
Machines 11 00973 g002
Figure 3. Characteristics of DevOps in the web domain and obstacles in the embedded systems domain [30].
Machines 11 00973 g003
Figure 4. Target environment. Typical CPS architecture of a modern distributed control system.
Machines 11 00973 g004
Figure 5. Representation of the containerized DT and its mapping to the DT concept (adapted from [29]). The logical object (i.e., the DT model) manages the properties associated with its linked real objects by communicating with their MCUs and PCUs. The physical and digital interfaces manage the communications. The storage interface retrieves container status and history. The container management interface exposes the state and configuration of the DT container to other services.
Machines 11 00973 g005
Figure 6. Representation of the DT-enhanced control service design proposed by Dobaj et al. [31]. We explicitly aligned the architecture to the DT container [29] shown in Figure 5. The PA and SA DT models manage the properties of their associated assets. The PA and SA interfaces disclose asset-specific data and services. The management interface exposes the adaptation capabilities for hierarchical (self-)management.
Machines 11 00973 g006
Figure 7. Mapping of the DT-enhanced control services to its corresponding MAPE-K elements. The sub-system boundaries show the realization of the hierarchical control pattern. The SA control service manages its associated SAs. The software probes and effectors enable self-awareness and self-adaptation. External systems can use the exposed interfaces for hierarchical management.
Machines 11 00973 g007
Figure 8. SA DT model showing the data flow model of the cyclic real-time processing pipeline at the control unit level.
Machines 11 00973 g008
Figure 9. SA DT model specifying the timing constraints for the individual pipeline stages and sub-stages.
Machines 11 00973 g009
Figure 10. Representation of the evaluation platform hardware and software configuration.
Machines 11 00973 g010
Figure 11. System sequence diagram showing the system behavior and interactions that are similar between all experiments.
Machines 11 00973 g011
Figure 12. System sequence diagram showing the test instrumentation of experiment 1.
Machines 11 00973 g012
Figure 13. Cycle Usage of the RT PF service.
Machines 11 00973 g013
Figure 14. Jitter portion of the RT PF service.
Machines 11 00973 g014
Figure 15. Management portion of the RT PF service.
Machines 11 00973 g015
Figure 16. PF input portion of the RT PF service.
Machines 11 00973 g016
Figure 17. PF function portion.
Machines 11 00973 g017
Figure 18. PF output portion of the RT PF service.
Machines 11 00973 g018
Figure 19. Twinning portion of the RT PF service.
Machines 11 00973 g019
Figure 20. Backpressure per cycle (Backpr. pC) of the RT PF service.
Machines 11 00973 g020
Figure 21. End-to-end throughput characteristics of the cyclic processing pipeline under different load conditions.
Machines 11 00973 g021
Figure 22. System sequence diagram of the context-aware self-adaptation sequence of experiment 2.
Machines 11 00973 g022
Figure 23. Timeseries diagram showing the periodic adaptation of the routing algorithm to cope with message bursts.
Machines 11 00973 g023
Figure 24. Time-series diagram showing the system behavior during a single message burst interval.
Machines 11 00973 g024
Figure 25. Box plot of the MAPE loop timings during parameter-based self-adaptation.
Machines 11 00973 g025
Figure 26. System sequence diagram showing the A/B service deployment process described in [31].
Machines 11 00973 g026
Figure 27. Observed service update and reconfiguration process.
Machines 11 00973 g027
Table 1. Outline of this work and its contributions. The label column links to the labels in Figure 1.
TypeLabelSectionDescription
Method Section 1.2Design space for the structured engineering of sustainable and smart CPSs
Agenda Section 1.3Research agenda and methodology of the presented industrial case study
Analysis Section 2State-of-the-art analysis of Digital Twins in modern industrial environments
Requirements Section 3Requirements for Digital Twin-enhanced embedded control software
Design ModelD1Section 4DT-enhanced control service for resource-constrained embedded devices
D2Microservice-based design for the orchestration of native embedded services
D3Secondary asset DT model to manage and reflect the ICT properties and states of the CPSs
ServitizationSection 5Description of the experiment setup and the practical implementation of the CPS asset servitization
Emperical ExperimentsE1Section 6Sub-millisecond real-time twinning for context- and self-monitoring of CPS asset properties
E1Section 6Sub-millisecond rel-time closed-loop control of CPS assets
E2Section 7Self-protection: Zero-downtime parameter-based self-adaptation of CPS assets to mitigate environmental and change-enactment uncertainty during CD and CE
E3Section 8Zero-downtime architecture- and parameter-based asset adaptation to enable CD and CE in CPS
Demonstrated DevOps Capabilities to facilitate CD and CEC1Section 6, Section 7 and Section 8Reliable and reconfigurable remote monitoring of CPS assets and services (see E1, E2, E3)
C2Section 7Reliable parameter-based remote adaptation of CPS services and communication properties (see E2)
C3Section 8Reliable remote software deployment and updating (i.e., architecture-based adaptation of CPS services and communication links) (see E3)
C4Section 8Reliable runtime experiments (i.e., A/B testing) to test architecture and parameter changes (see E3)
Discussion of Supported Industrial Use CasesU1Section 9Reliable remote asset monitoring (enabler: C1)
U2Reliable remote asset optimization (enabler: C1, C2)
U3Reliable remote asset commissioning (enabler: C1, C2, C3, C4)
U3Reliable remote asset maintenance (enabler: C1, C2, C3, C4)
Conclusion Section 10Conclusion and future work
Table 3. Factors and dependent variables of experiment 1.
TypeNameValue
Constants: TimingCycle time1 ms
Management portion15%
Primary function portion70%
Twinning portion15%
Constants: Data flowPA message payload size1500 Byte
Number of twinned SA states per cycle317
Size per twinned SA states4 Byte
Number twinning messages per cycle2
Factor1: TimingPF input portion [ 05 , 10 , 15 , 20 , 25 , 30 ] %
PF function portion [ 60 , 50 , 40 , 30 , 20 , 10 ] %
PF output portion [ 05 , 10 , 15 , 20 , 25 , 30 ] %
Factor2: Data flowNumber of PA messages per cycle [ 1 . . 19 ]
Dependent variablesAll constants, factors, and cycle portionsAll dependent variables are measured per cycle leveraging the SA state twinning mechanism.
Overall cycle usage
Jitter (in percentage of the cycle time)
Backpressure
Various other dataflow statistics
Table 4. Factors and dependent variables of experiment 2.
TypeNameValue
Constants: TimingCycle time1 ms
Management portion15%
Primary function portion70%
Twinning portion15%
PF input portion20%
PF function portion30%
PF output portion20%
Constants: Data flowPA message payload size1500 Byte
Number of twinned SA states per cycle317
Size per twinned SA states4 Byte
Number twinning messages per cycle2
Number of critical PA messages per cycle4
Number of best-effort PA messages per cycle30
Constants: CLT trigger conditionif (backpressure[RT PS Input] > 50) for more than 3 ms, then activate countermeasure
Factor: Fault-injectionPeriod between the activation of best-effort message bursts 3.5  s
Dependent variablesMAPE loop latencies
Messages sent per cycle
Backpressure per service
Table 5. Factors and dependent variables of experiment 3.
TypeNameValue
Constants: TimingCycle time1 ms
Management portion15%
Primary function portion70%
Twinning portion15%
PF input portion20%
PF function portion30%
PF output portion20%
Constants: Data flowPA message payload size1500 Byte
Number of twinned SA states per cycle317
Size per twinned SA states4 Byte
Number twinning messages per cycle2
Number of PA messages per cycle1
Factor: A/B deployment processPhase 1: Deploy PF B (PF B is a replica of PF A with the same complexity, execution time, inputs, and outputs, as defined by the constant factors above).
Phase 2: Run PF B aside PF A
Phase 3: Termiante PF A
Dependent variablesCycle usage
Messages received per cycle
Execution time per update and reconfiguration step
Table 6. Service update and reconfiguration process, including measured execution times.
StepNameDurationDescription
s[01]Observe4.98 sMeasure system behavior before the start of the update process.
s[02]Start B *6.51 sCLT starts service B.
s[03]Connect to B0.54 sCLT establishes a management connection to service B.
s[04]Configure B2.85 sCLT configures the timing and cycle portions of service B.
s[05]Setup twinning of B0.84 sCLT establishes the monitoring (i.e., twinning).
s[06]Observe5.96 sMeasure system behavior before linking B to the input and output services.
s[07]Link Input to B6.34 sCLT registers service B as subscriber to all messages published by the RT PS input service. Therefore, the CLT must update the configurations of both services, requiring the execution of several reconfiguration commands. The CLT uses twinning information to validate service invariants to ensure system integrity after each reconfiguration.
s[08]Link B to Output6.46 sSimilar to s [ 07 ] , but the RT PS Output service subscribes to all published messages of B.
s[09]Observe5.17 sMeasure system behavior when B is running side-by-side with A.
s[10]Terminate A**0.50 sCLT terminates service A, which deregisters itself from all subscriptions.
s[11]Observe5.37 sMeasure system behavior after update process completion.
SumAll steps45.2 s
Observe steps only21.2 s
No observe steps24.3 s
* B refers to the RT PF B service. ** A refers to the RT PF A service.
Table 7. Comparison of system behavior before and after the update.
ServiceComparision
RT PS Input The update process does not affect the number of messages to be processed in each cycle. The cycle usage in the first phase after the update is equal to the cycle usage before the update. However, after approximately one second, the cycle usage increases by about 5%. A subsequent investigation has shown a software bug in the subscriber deregistration sequence. As a consequence, the RT PS input service executes several retries to send data to the no-longer-running RT PF A service. This observation does not invalidate the experiment results. Instead, it highlights the robustness of the implementation, showing that individual service failures do not propagate through the system but are observable via the twinning mechanisms.
RT PF A vs. B The update process does not affect the cycle usage and the number of messages to be processed per cycle.
RT PS Output The update process does not affect the cycle usage and the number of messages to be processed per cycle.
Table 8. Relationships between experiments, requirements, and research questions.
RequirementRQExperimentProperties
R1 Primary Asset Closed-Loop ControlRQ2Exp.1 (Section 6)Figure 13 and Figure 14 confirm that the closed-loop cycle-time remains below 1 ms.
R2 Primary Asset Monitoring FidelityRQ1Exp.1 (Section 6)Figure 19, Figure 20 and Figure 21 confirm that the logical objects support the sub-millisecond twinning of primary asset data.
R3 Secondary Asset Monitoring FidelityRQ1Exp.1 (Section 6)Figure 19, Figure 20 and Figure 21 confirm that the logical objects support the sub-millisecond twinning of secondary asset data.
R4 Secondary Asset Closed-Loop ControlRQ2Exp.2 (Section 7)Figure 23 and Figure 24 illustrate that the logical objects support context- and self-aware parameter-based self-adaptation capabilities to provide self-protection mechanisms for mitigating environmental and change-enactment uncertainties. Figure 25 shows that the MAPE loop worst-case execution time for reliable (i.e., continuous self-monitoring and invariant checking) parameter-based self-adaptation is below 70 ms.
R5 Secondary Asset ManagementRQ2
RQ3
Exp.3 (Section 8)Figure 27 demonstrates how parameter-based and architecture-based adaptation can be combined with the logical objects’ capabilities to monitor and orchestrate service deployment and runtime experimentation, demonstrating that the software framework effectively supports CD and CE for CPS at the embedded system layer.
R6 ServitizationRQ3Section 5 Exp. Setup and InstrumentationFigure 10 shows that the experimental setup provides dedicated interfaces for local and remote monitoring, orchestration, automation, control, and adaptation. The effectiveness and service-oriented nature of these interfaces is demonstrated in all experiments.
RQ1 Context- and Self-Aware Ability, RQ2 Adaptability, RQ3 Manageability.
Disclaimer/Publisher’s Note: The statements, opinions and data contained in all publications are solely those of the individual author(s) and contributor(s) and not of MDPI and/or the editor(s). MDPI and/or the editor(s) disclaim responsibility for any injury to people or property resulting from any ideas, methods, instructions or products referred to in the content.