Abstract
The processing of aerial images taken by drones is a challenging task due to their high resolution and the presence of small objects. The scale of the objects varies diversely depending on the position of the drone, which can result in loss of information or increased difficulty in detecting small objects. To address this issue, images are either randomly cropped or divided into small patches before training and inference. This paper proposes a defect detection framework that harnesses the advantages of slice-aided inference for small and medium-size damage on the surface of wind turbine blades. This framework enables the comparison of different slicing strategies, including a conventional patch division strategy and a more recent slice-aided hyper-inference, on several state-of-the-art deep neural network baselines for the detection of surface defects in wind turbine blade images. Our experiments provide extensive empirical results, highlighting the benefits of using the slice-aided strategy and the significant improvements made by these networks on an ultra high-resolution drone image dataset.
1. Introduction
Renewable energy sources are widely recognized for their versatile benefits, making them a top priority for countries aiming to protect the environment and combat climate change [1]. Unlike fossil fuels, they curb CO2 emissions, crucial for reducing global warming [2]. By adopting these resources, energy security is enhanced while reducing dependence on external fossil fuels. Domestic availability of renewable energy minimizes vulnerability to supply disruptions and price fluctuations, promoting energy autonomy. As a result, countries are likely to invest in renewables such as wind turbines and solar panels [3].
Wind turbines convert wind energy into electricity, reducing climate-altering gases while enhancing energy mix, security, and sustainability [4]. They use wind motion to generate electricity without combustion, aiding the clean energy transition. Wind turbine blades optimize energy harvesting, affecting efficiency and production. Research has shown that blades contribute up to 25% of the energy production of wind turbines [5]. Maintaining blade health is crucial for optimal generation while reducing downtime and costs [6]. Traditionally, wind turbine inspections have been manual and demanding, especially offshore, leading to increased maintenance costs and operational interruptions [7]. Advancements in sensor technologies, such as acoustic, vibration, ultrasonic, and strain sensors, have improved wind turbine maintenance and condition monitoring [8,9,10,11]. Additionally, the incorporation of visual sensors for surface inspection is expected to yield positive outcomes.
There is a demand for improved safer blade inspection approaches with the aim of enhancing efficiency and cost effectiveness. The optimal solution will balance sensor reliability, accuracy, and affordability. Implementing an efficient and cost effective approach empowers wind farm operators to optimize energy generation while reducing maintenance costs. Technological innovation, particularly Unmanned Aerial Vehicles (UAVs), represents a forefront embraced by developed nations for diverse purposes. UAVs excel in aerial inspection, showing potential for wind turbine blade inspection. UAV-based methods offer efficiency advantages, allowing for inspection of 10–12 turbines daily, with potential for 15–20 with full automation, surpassing conventional techniques [12]. This transition could enhance inspection efficiency, reduce costs, and increase energy production with minimal operational disruption.
Automated inspection of energy assets such as wind turbine blades benefits from drone technology and remote image monitoring, yielding cost savings, climate change mitigation, and enhanced safety. Despite advancements in deep learning, object detection remains challenging due to low image resolution, occlusion, background complexity, and small object scale. Deep learning involves training and inference stages. In training, models learn to detect anomalies through optimization techniques on a dataset containing defect instances. Successful training enables models to detect defects in new images by applying acquired patterns. Generalization allows models to apply knowledge to new data, underscoring the need for careful dataset curation, architecture selection, and optimization for accurate results.
Aerial images have ultra high-resolution; however, the scale of objects within them can vary depending on the drone’s position. When the drone is far from the target, recognizing small objects within the image can become difficult. Processing ultra high-resolution images can be challenging due to the increase in irrelevant background information. In the context of deep learning detection methods such as convolutional neural networks (CNN), this can result in suboptimal training of the classifier, leading to low detection accuracy [13]. Ultra high-resolution data sources, including high-definition (HD) 4K and 8K cameras, require new techniques for analysis. Common practices to deal with small objects in ultra high-resolution images include randomly cropping images or re-scaling before passing them to the model for training and inference [14,15,16]. However, this does not solve the problem, and certain objects can be poorly represented during model training. Alternatives include dividing the images into smaller patches and then using them directly for training and inference [17]. Figure 1 shows an overview of wind turbine blade (WTB) surface defect inspection using drones and the associated challenges of ultra high-resolution images, making them quite detailed and large.
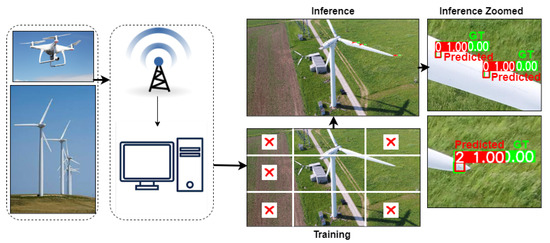
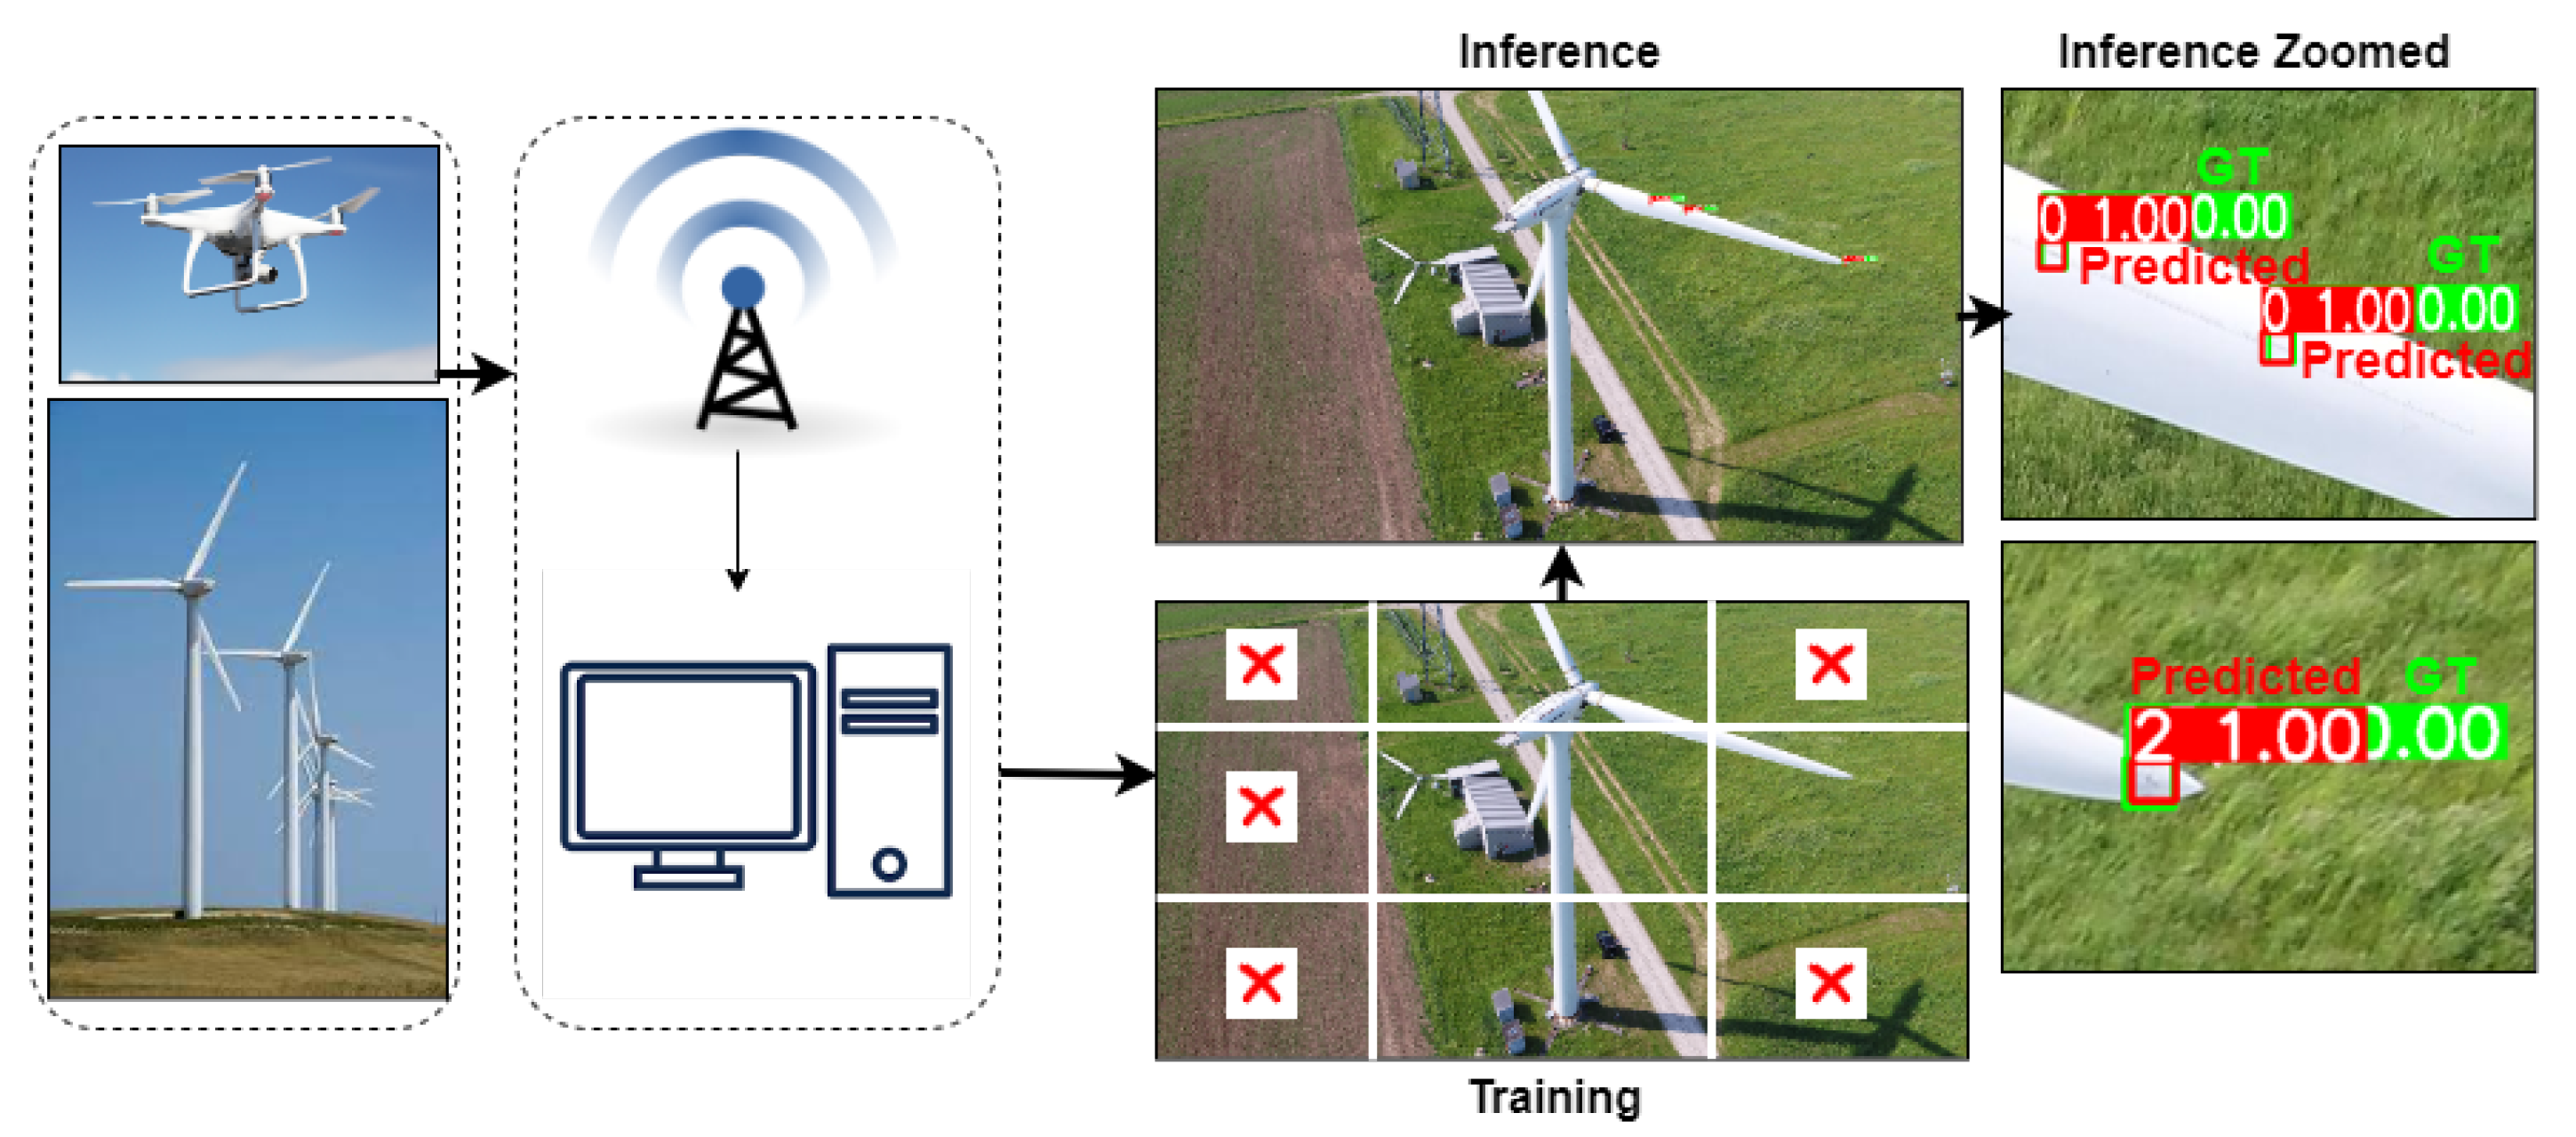
Figure 1.
Drones can be used to monitor the surface condition of wind turbine blades. When transmitting image data to servers via 4G/5G technology, defect detection models often have to deal with ultra high-resolution images. Our framework performs training on image patches. Patches devoid of any relevant content are discarded during dataset preprocessing. During inference, a robust strategy is necessary to allow small defects to be detected.
2. Related Work
Wind turbine blade (WTB) analysis encompasses a spectrum of techniques for defect detection. Traditional approaches involve image processing techniques and hand-crafted features. Wang and Zhang used Haar-like features with cascaded classifiers to detect WTB surface cracks, focusing on differentiating cracks from non-cracks [18]. Similarly, Huang and Wang extended Haar-like features and employed the parallel Jaya K-means algorithm for more precise surface crack detection [19]. Deng and Guo combined an improved Lévy flight strategy with the log-Gabor filter for defect identification [20]. To detect large-scale WTB cracks efficiently, Peng et al. proposed an analytic method utilizing UAV-captured images [21]. Alternatively, Ruiz and Magda converted wind turbine operation signals into grayscale images, utilizing multichannel texture features for pattern recognition [22].
Deep learning methods have revolutionized defect detection in WTBs. Shihavuddin et al. introduced a feature pyramid network coupled with offline data augmentation for processing higher resolution images, training various Faster-RCNN detectors on different private datasets [23]. Subsequent studies explored models such as Yolov3 and EfficientDet, demonstrating promising results [24]. CNNs have displayed superior performance over traditional descriptors, especially with the added advantage of ensemble classifiers [25,26]. Foster et al. categorized WTB defects by utilizing image patches for training and inference [17]. Sarkar et al. mitigated the challenges around blurry images using a super-resolution CNN model with Laplacian variance preprocessing [27]. Other deep learning networks that have been used to improve detection performance for wind turbine blade defects include [28,29,30,31].
Ultra high-resolution drone-captured images present challenges in processing due to varying object scales and computational demands. A common practice involves dividing these images into smaller patches for more efficient analysis [13,19,26,32,33]. This strategy reduces computational load, enhances object clarity, and augments dataset size, thereby enhancing model performance. Data challenges are evident in the proprietary nature of WTB data. While datasets such as Blade30 and DTU-Drone provide publicly available resources, annotations for defect detection tasks are often lacking [34,35]. The ownership of industrial datasets restricts public access and data sharing.
Generally, there is a reasonable collection of works in the literature focusing on detecting WTB defects (sometimes referred to as damage) from drone-captured images. However, there is a glaring inconsistency in the training methodology and categories used in these works. We note that benchmarking the performance of WTB surface defect detectors is currently challenging due to the confidentiality of data [25,26] as well as to annotations that are not publicly available even when the data are available [17,23].
Based on the findings in previous studies, it is evident that utilizing drones for detecting WTB surface defects is both cost-effective and efficient. However, this inspection method presents numerous difficulties, such as processing ultra high-resolution images, detecting small objects, and accounting for changes in object scale as the drone changes position. In light of these current challenges, in this paper we make the following contributions:
- We propose a defect detection framework that is capable of incorporating a realistic slice-aided inference strategy for object detection in ultra high-resolution images.
- We present a benchmark comparison of our framework on several state-of-the-art deep learning detection baselines and slicing strategies for WTB inspection.
- We provide an extensive evaluation on an ultra high-resolution drone image dataset, demonstrating significant improvements in the detection of small- and medium-size WTB defects.
3. Proposed Framework
The proposed framework is illustrated in Figure 2. This section discusses the dataset, types of wind turbine blade surface defects, and dataset annotation, followed by preprocessing and details of the proposed detection framework.
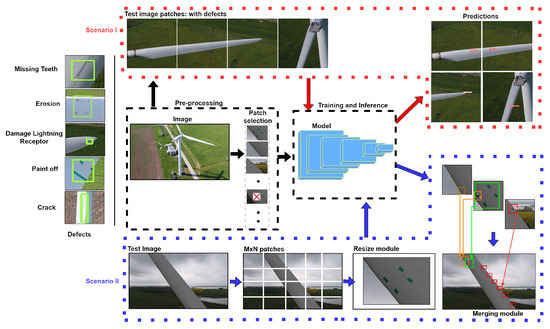
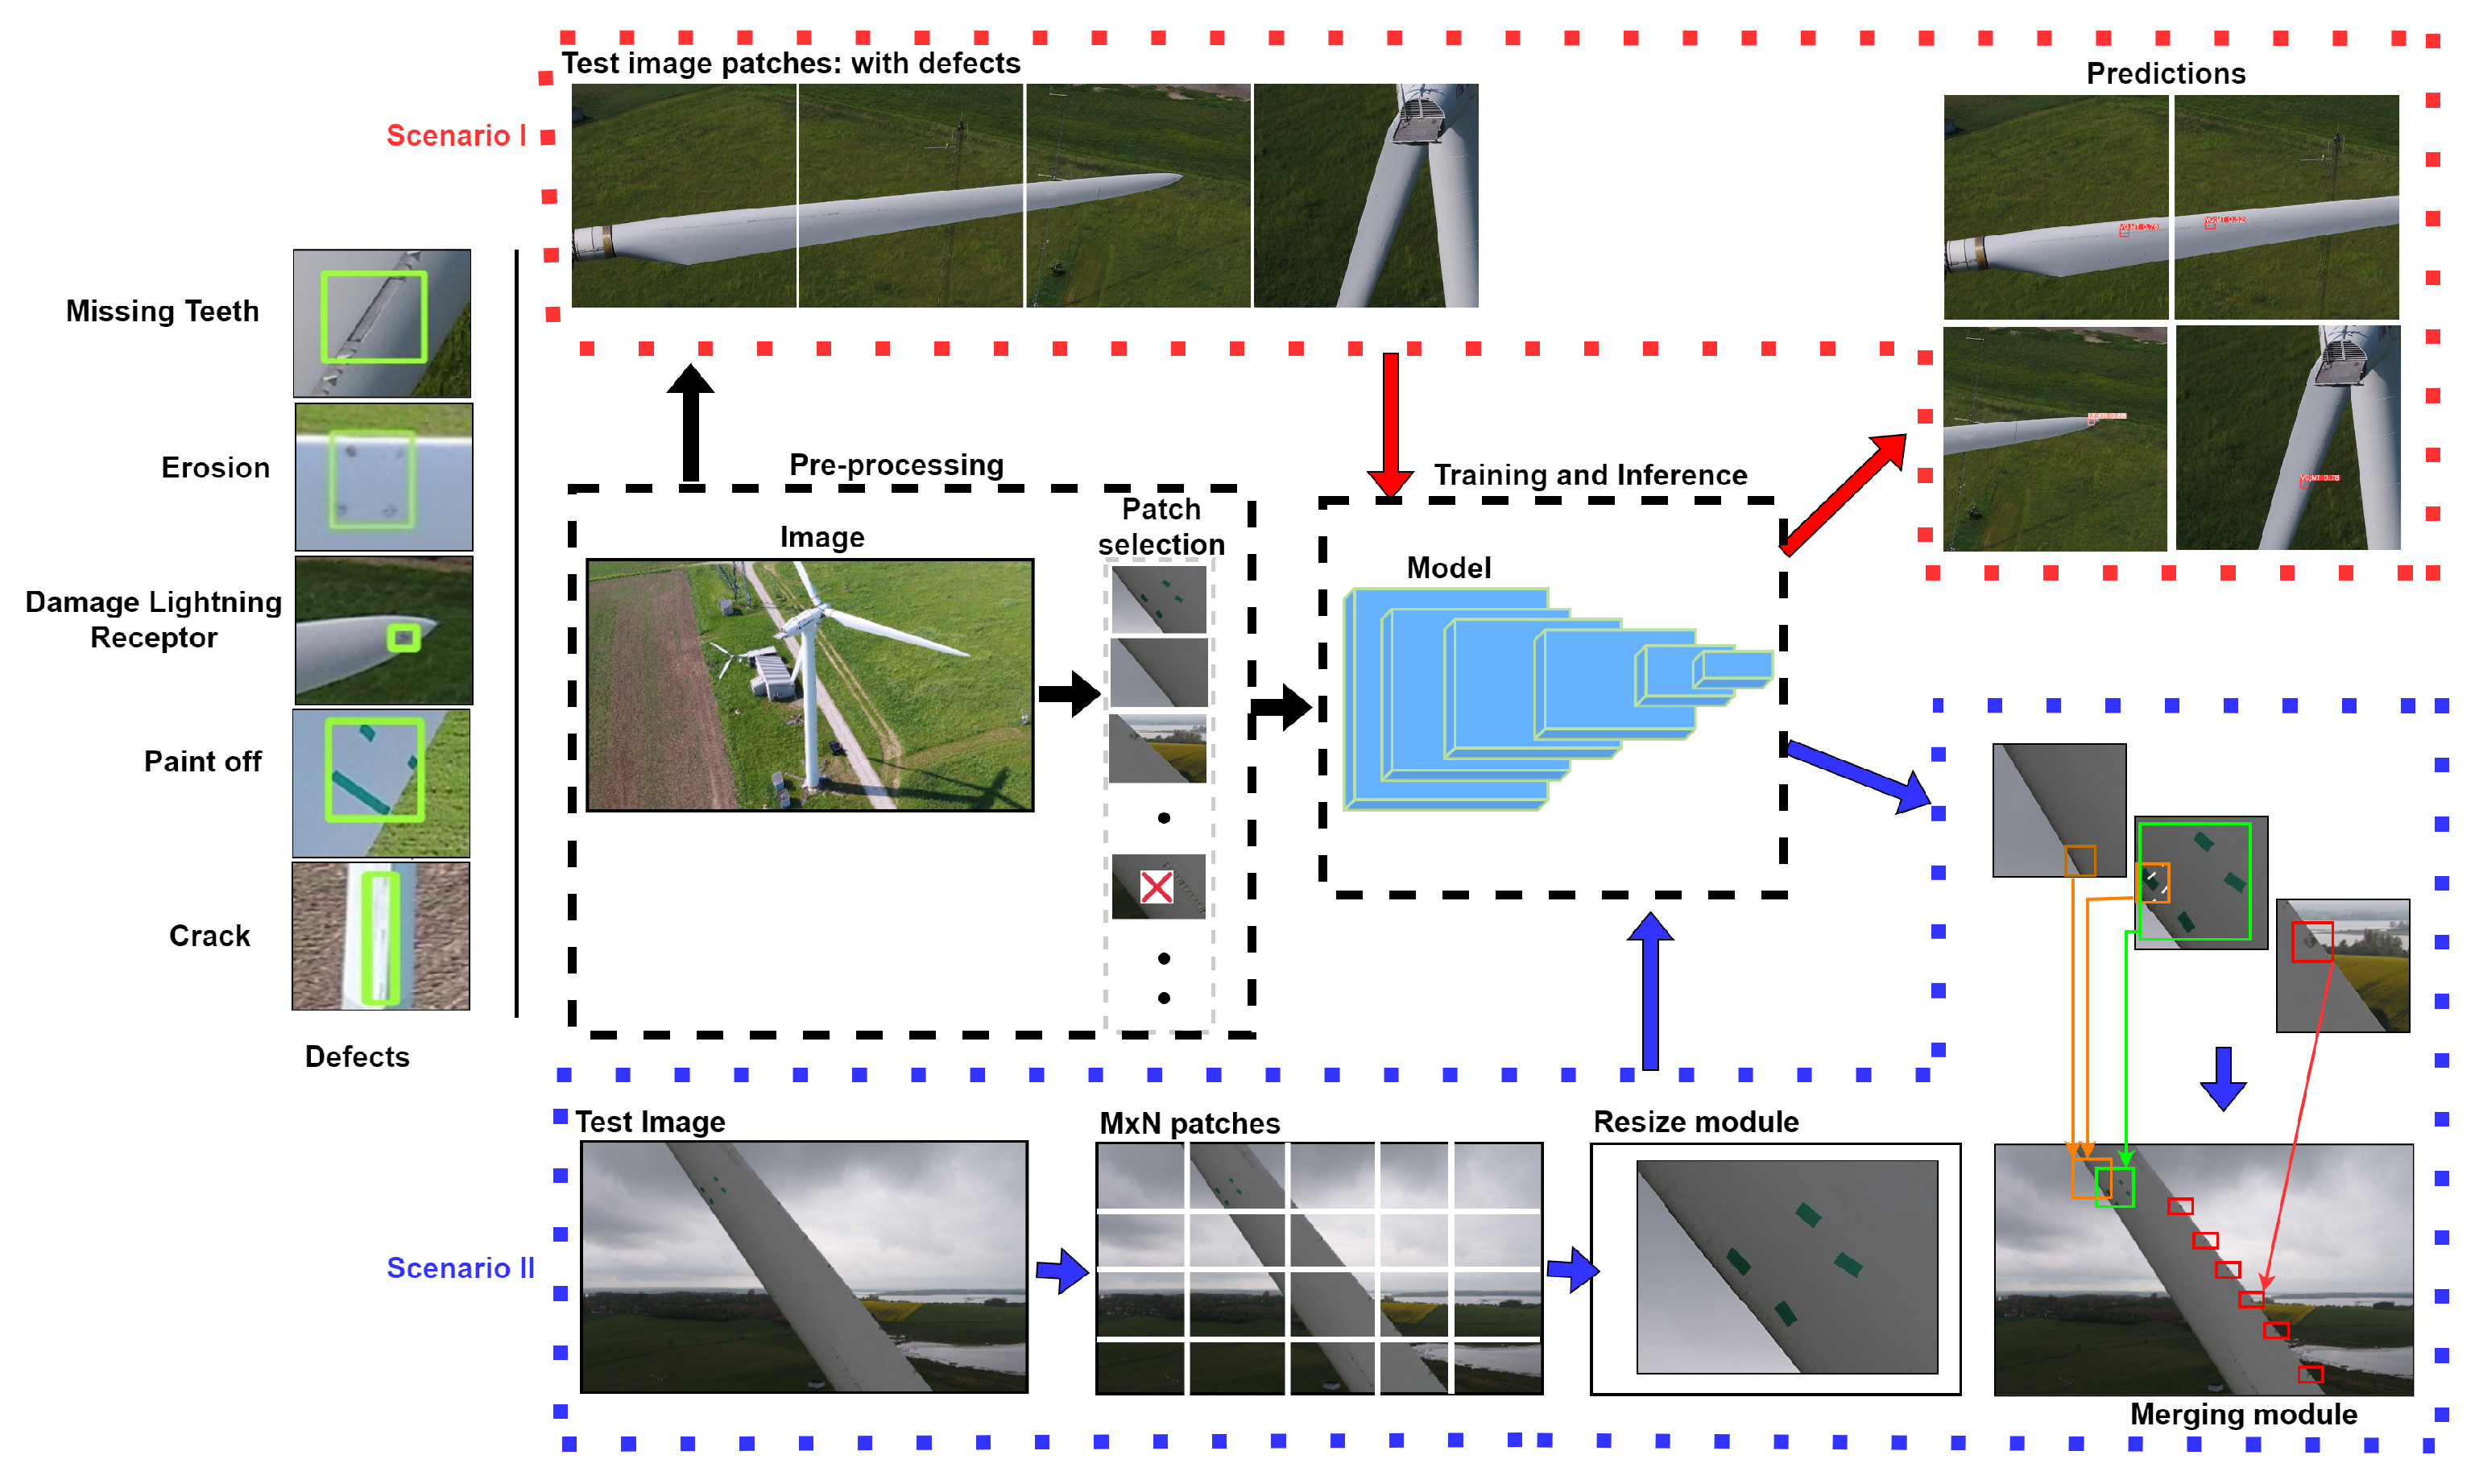
Figure 2.
Proposed framework for wind turbine blade surface defect detection. On the left side are various types of surface defects present in the DTU dataset. The right side of the figure illustrates the workflow, starting with dataset preprocessing and training (indicated by black arrows). Two inference scenarios are presented: Scenario I (indicated by red arrows) involves inference using image patches, while Scenario II (indicated by blue arrows) involves inference using an original test image’s resolution. In the preprocessing step, ultra high-resolution images are divided into patches, which are subsequently fed into the training process.
3.1. Dataset
In this paper, we use the DTU-Drones inspection images of wind turbine blades [35] from the Technical University of Denmark (DTU), which is a publicly available (https://data.mendeley.com/datasets/hd96prn3nc/2, accessed on 2 April 2022) dataset containing 589 ultra high-resolution images captured between 2017 to 2018 under varying environmental conditions. High-resolution typically refers to images with dimensions of pixels, whereas ultra high-resolution starts at pixels. The images we use here have a resolution of pixels, firmly placing them in the ultra high-resolution category [36]. Because DTU does not provide surface defect bounding boxes, we initiated an annotation process after conducting a study of the different types of wind turbine blade surface defects noticeable in the database. A number of recent works have used this dataset for the same purpose [17,23,37]; however, they did not disclose their annotations publicly for wider use, and reached different interpretations of the surface defect types. For better reproducibility and benchmarking, our annotations are made available at: https://github.com/imadgohar/DTU-annotations (accessed on 3 May 2023).
3.2. Wind Turbine Blade Surface Defects
The defect identification process involved a comprehensive evaluation of existing research pertaining to the detection of surface defects in wind turbine blades. By utilizing publicly available datasets (Section 3.1) and conducting a literature search, we identified and categorized various types of surface defects for our study. A total of 324 images were selected based on five types of surface defects discussed in this study, encompassing a diverse range of surface damage or defects amounting to a total of 889 instances with more than one defect per image. In particular, we defined five distinct types of surface defects, as illustrated in Figure 2 (left side).
These include the following:
- Missing Teeth (MT): this surface defect refers to the absence of teeth in the vertex generating panel, which is a crucial component of the wind turbine blade. Identifying the presence or absence of teeth is essential for ensuring optimal performance.
- Erosion (ER): erosion represents a type of surface defect in which the surface of the wind turbine blade undergoes gradual deterioration due to environmental factors or prolonged exposure to natural elements. Although erosion does not pose immediate problems, it necessitates regular maintenance.
- Damage Lightning Receptor (DA): the lightning receptor plays a vital role in safeguarding the wind turbine blade against lightning strikes. Identifying any surface damage to the lightning receptor is crucial for assessing its functionality and ensuring effective protection.
- Crack (CR): surface cracks in wind turbine blades are considered critical defects, as they can lead to structural instability and potentially result in catastrophic failure. Detecting and localizing surface cracks is essential for prompt maintenance and preventing further damage.
- Paint-Off (PO): paint-off refers to the loss or peeling of the protective paint layer on the wind turbine blade’s surface. While not directly problematic, it signifies the need for maintenance to preserve the blade’s integrity.
3.3. Dataset Annotation
The dataset was annotated with precise attention to detail, focusing specifically on the defective part(s) of the wind turbine blade. To facilitate this process, we employed an open-source manual image labeling tool [38]. The annotation procedure involved localizing the regions of interest corresponding to each defect type. When annotating the dataset, particular emphasis was placed on accurately identifying the specific areas within the wind turbine blades that exhibited missing teeth in the vertex generating panel, erosion, damage to the lightning receptor, cracks, and surface paint-off. These surface defects were localized within their respective regions, providing a detailed annotation of the defective parts.
3.4. Pre-Processing
Prior to the learning phase, a series of preprocessing steps were performed to ensure that the processing and model training of ultra high-resolution images remained manageable under limited resources while maintaining the details present in the image. Motivated by the work of [17], we conducted an empirical analysis to systematically evaluate the implications of different patch sizes on our research. Notably, the specific patch sizes not only proved compatible with our object detection models, they exhibited a notable performance advantage when compared to other patch sizes. We used an automatic method to pick out image patches having at least one defect. Patches showing only background or no defects were taken out of the dataset. After patching, we divided the dataset into different parts for training, testing, and validation to facilitate the subsequent experimental investigations. No online (or on-the-fly) or offline augmentation was applied prior to the utilization of data samples during the model training and inference operations.
3.5. Detection Framework
In this section, we describe in detail the detection framework for handling ultra high-resolution images. Figure 2 shows the complete proposed training and inference pipeline for detection of WTB surface defects from ultra high-resolution images. The proposed detection framework is outlined in two phases, namely, training and inference. Let represent an ultra high-resolution image in the training partition of the database , where preprocessing produces a set of non-overlapping image patches,
where b is the set of bounding boxes associated with each image patch p and , as set in Section 4.1. A model is trained with a set of image patches that constitutes the overall training set
such that .
For the purpose of evaluation and benchmarking, we trained three baseline neural network architectures YOLOv5 [39] that leverage a compact yet effective architecture with a deep CNN backbone consisting of 21 convolutional layers (CSPDarknet21). We incorporated a feature pyramid network (PANet) and multiple detection heads for efficient object detection. Anchor boxes and a composite loss function are essential elements of our training process, and non-maximum suppression is applied during inference to refine results. In comparison, RetinaNet [40] adopts a one-stage design, emphasizing efficiency, and employs anchor boxes for region proposals. It utilizes a backbone CNN (ResNet50) in conjunction with a Feature Pyramid Network (FPN) to capture multi-scale features, which is crucial for detecting objects of various sizes, along with Faster-RCNN [41], a two-stage model consisting of a Region Proposal Network (RPN), for generating proposals, and RoI Align layers for feature extraction from these proposals; it utilizes ResNet50 as backbone. While this architecture excels in terms of accuracy, it may require additional computational resources. These neural network architectures are used for training the models on surface defect detection. The images were preprocessed as discussed in Section 3.4 before training. All models were trained using the standard multi-class cross-entropy loss
where and are the ground truth label and the softmax probabilities for the i-th class of C total classes, respectively.
3.6. Inference Strategies
In the second phase, the inference process is carried out using two different strategies, denoted as Scenario I and Scenario II, each designed to evaluate the performance of the proposed method under distinct conditions. Figure 3 graphically illustrates both scenarios; the evaluation of the method’s performance under these conditions can provide insights into the practical applicability of the proposed framework.
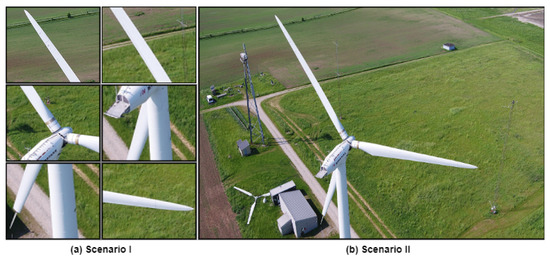
Figure 3.
Visual example demonstrating the difference between Scenario I, where the model is trained and tested on preprocessed image patches, and Scenario II, where the model is tested directly on raw ultra high-resolution images, representing two distinct evaluation scenarios for the proposed method.
3.6.1. Scenario I: Patch-Based Inference
Scenario I involves constructing the test set through the utilization of image patches, as elaborated in Section 3.4. In this framework, individual patches are presented to the trained model for inference. In essence, Scenario I entails a structure wherein the model is trained using image patches and subsequently evaluated on similar image patches (not identical, but sharing the same patch size) during testing. This configuration aligns with the traditional paradigm of machine learning model training. Nonetheless, it is pertinent to recognize that Scenario I may partition extended defects, resulting in the generation of separate bounding boxes within distinct image patches, which might not correspond to practical feasibility. While the patch-based inference process offers prompt processing, it necessitates additional postprocessing steps for consolidating and recognizing corresponding image patches.
3.6.2. Scenario II: Slice-Aided Inference
In contrast, Scenario II introduces an enhanced level of realism by employing unprocessed ultra high-resolution images for the test set. This avoids the need for manual preprocessing. An internal preprocessing mechanism intrinsic to the testing process is employed instead, as demonstrated in Equation (4). This setup has its merits, notably, allowing direct use of ultra high-resolution images for prediction and aggregating multiple detected defects in the original image rather than treating them separately, which better reflects the challenges in real-world scenarios.
To implicitly handle the processing of an ultra high-resolution image during the inference time (particularly for Scenario II), standard resizing or fixed cropping methods are poor choices for two reasons: (1) small objects can become almost unnoticeable after such transformations, and might go undetected; and (2) the precision between overlapping objects may be severely impacted after the original image is resized.
To this end, we adopted the slice-aided hyper-inference technique [42] in a manner that benefits both small and medium size objects in ultra high-resolution raw images. Specifically, at inference time, an ultra high-resolution image in the test partition is first divided into patches, i.e., .
To minimize the likelihood of disjointed surface defects, boundaries are relaxed by sampling patches in an overlapping manner, specifically, a sliding window concept that samples repeatedly while keeping the overlap percentage between two adjacent windows (). The patches are then resized to square patches of size pixels before performing patch-level model inference. Succinctly, the inference is carried out as follows:
where is the set of output bounding boxes and denotes the resize module which resizes patch to width W. Finally, the detected defect boxes from all patches that surpass the detection threshold are merged by non-maximum suppression (NMS) based on the box confidence scores. NMS is applied when overlapping boxes have an IoU , a predefined matching threshold.
4. Experiments
Experiments were conducted using the DTU images [35] dataset. The following sections describe the results based on the two scenarios described in Section 3.6. The class-wise mean average precision and comparison of small, medium, and large objects are shown for both scenarios.
4.1. Evaluation Details
Settings. To evaluate the performance of the two methods, the dataset was partitioned into three segments, i.e., training, validation, and testing, with a distribution ratio of 70:15:15, respectively. In training and during inference in Scenario I, we opted to partition the original ultra high-resolution images into discrete patches with dimensions of 1024, as shown in Table 1(a). This patch size makes it easy to manage the training process under limited resources while retaining the details present in the image, as discussed in Section 3.4. In Scenario II, after careful experimentation, it was determined that setting the patch width W to 800 yields the best performance, as shown in Table 1(b). Additionally, the variables V, , and were introduced to represent the overlap, threshold non-maximum suppression, and threshold detection, respectively. An empirical evaluation was conducted to assess the accuracy of the YOLOv5 base model with the aim of identifying the optimal parameter settings that maximize the accuracy for subsequent experiments. The evaluation process involved systematic variations of V, , and , and their impact on model accuracy was measured. After extensive empirical evaluation, the parameters , , and resulted in a maximum average precision (mAP) at a confidence threshold of 0.50, and as such were subsequently selected for further experiments.

Table 1.
Comparison of patch sizes for training and inference using YOLOv5 as the base model. The table presents a comparison of patch sizes used for training and inference experiments. (a) Scenario I: the table displays results obtained from the validation set; K is the patch resolution and the number of samples corresponds to the training set used in the experiments. (b) Scenario II: W represents window size; the results were obtained from the validation set with parameters V = 0.1, = 0.5, and = 0.001.
4.2. Performance Metric
To evaluate our model, the performance of the evaluated models was measured on the test partition using the mean average precision (mAP). We observed this metric at the standard 0.5 IoU threshold (denoted as mAP@.50) used in most object detection reporting and at a more comprehensive average over a range of 0.5–0.95 IoU thresholds at intervals of 0.05 (denoted as mAP@.5-.95). In the context of the COCO challenge [43] for small, medium, and large objects, we considered mAP.5-.9 () for small objects, mAP.5-.9 () for medium objects, and mAP.5-.9 () for large objects.
4.3. Training Configurations
For all experiments, training used a batch size of 8 and the Stochastic Gradient Descent (SGD) optimizer with a learning rate of for Faster-RCNN and RetinaNet and 10 for YOLOv5, in keeping with common practice. Baseline models were sourced from the Detectron2 [44] and Ultralytics [39] libraries. All the experiments were performed on an Intel i5 machine with a single NVIDIA RTX 3060 GPU.
4.4. Results and Discussion
4.4.1. Overall Results
In Table 2, the YOLOv5 model seems to be stable in terms of performance, with the largest difference recorded as 1.7 points for the “large” object size. While the difference in performance for Faster-RCNN is more noticeable, a significant increase in performance for “small” and “medium” objects is recorded, with improvements of 13.2 and 6.2 points, respectively. However, the “large” objects encounter a significant performance decline of −13.3 points, showing that the model is sensitive to changes in scenarios and has substantial discrepancies across various objects sizes. For RetinaNet, the performance of the model is more noticeable for “small” and “medium” objects, with respective gains of 4.8 and 6.8 points. However, in the case of “large” objects the performance drops by −15.5 points, a similar performance to Faster-RCNN. In conclusion, when comparing the detection performance of small, medium, and large objects based on Scenarios I and II, it is evident that for small and medium objects the proposed framework (Scenario II) is able to improve the performance of the Faster-RCNN and RetinaNet baselines by a significant margin. Interestingly, YOLOv5 performs slightly better for medium and large objects and slightly worse for small objects.
Table 2.
mAP@.5-.95 for Scenario I and Scenario II for small, medium, and large objects using the DTU test set.
Table 3 compares the overall performance of the baseline models for Scenarios I and II on two widely used metrics. In terms of mAP@.50, YOLOv5 demonstrates a higher value of 81.3 in Scenario I, which increases to 85.1 for Scenario II. Similarly, Faster-RCNN shows improvements from 73.2 to 83.4 when shifting from Scenario I to Scenario II, while RetinaNet displays an mAP@.50 value of 70.6, which slightly decreases to 70.4 in Scenario II. Considering the mAP@.5-.95 metric, YOLOv5, Faster-RCNN, and RetinaNet manifest improvements from Scenario I to Scenario II, with values rising from 41.7 to 44.2, from 37.8 to 43.1, and from 32.9 to 37.9, respectively. The results show that RetinaNet performs well, with higher mean average precision across diverse IoU thresholds, indicating that the proposed framework (Scenario II) outperforms the standard setup used in existing works (Scenario I) on all baselines, possibly due to its ability to improve the detection of small and medium objects in ultra high-resolution drone-captured images.
Table 3.
Overall mAP@.5 and mAP@.5-.95 for Scenario I and Scenario II on the DTU test set.
4.4.2. Class-Wise Results
Table 4 reveals further insights. For YOLOv5, the performance of the CR class improves by with our proposed framework (Scenario II), while there are decreases in the MT and DA classes. For Faster-RCNN, marked improvements in the ER, DA, and CR classes are observed on our proposed framework, while for RetinaNet all classes improve except for the DA class. Samples in the DA class are typically small defects on the WTB surface, which see good performance under the slice-aided setup.
Table 4.
Class-wise mAP@.5-.95 for Scenario I and Scenario II on DTU test set.
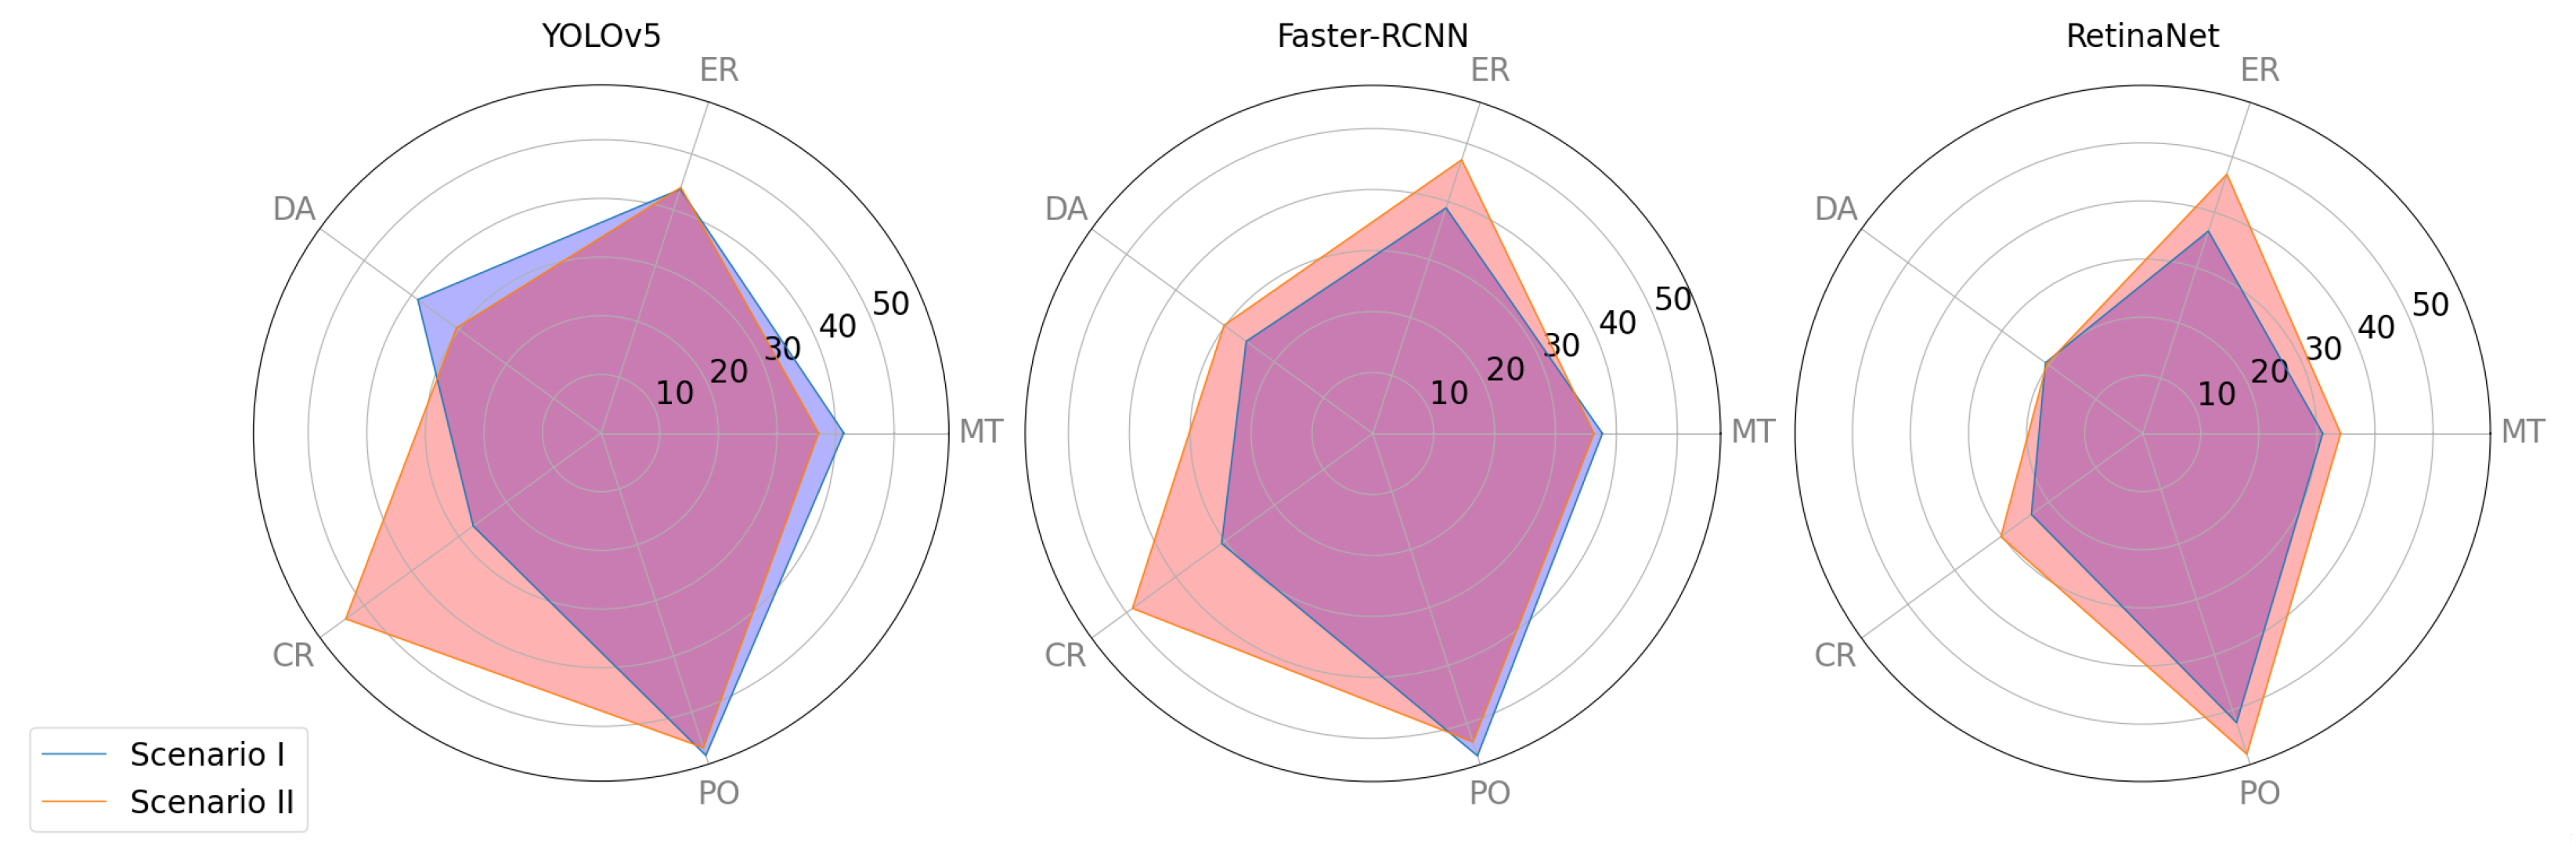
Figure 4 serves as a visual representation illustrating the disparities on a class-wise basis between Scenario I and Scenario II concerning the proposed methodologies. A perceptible observation is that YOLOv5 demonstrates greater consistency, as evident from its marked improvement solely in the CR class within Scenario II. Conversely, Faster-RCNN exhibits enhanced reliability under Scenario II, as manifested by its performance enhancements across three distinct classes. Notably, the RetinaNet model demonstrates superior performance, as all of its classes exhibit commendable results when exposed to Scenario II conditions. This exceptional performance can be attributed to the utilization of the focal loss function, which effectively addresses class imbalance within the dataset. To enhance model performance across all classes using alternative models, it is advisable to systematically tackle the issue of class imbalance within the dataset, as this helps to reduce the impact of having an unequal number of instances in different classes.
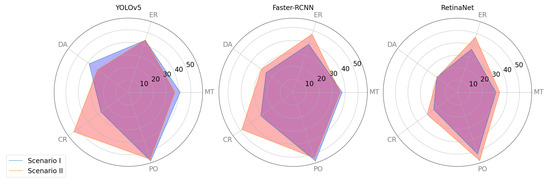
Figure 4.
Comparison of IOU@0.5-.95 for YOLOv5, Faster-RCNN, and RetinaNet on different classes in the wind turbine blade dataset; the overlapping area is shown in purple.
4.4.3. Visual Comparisons
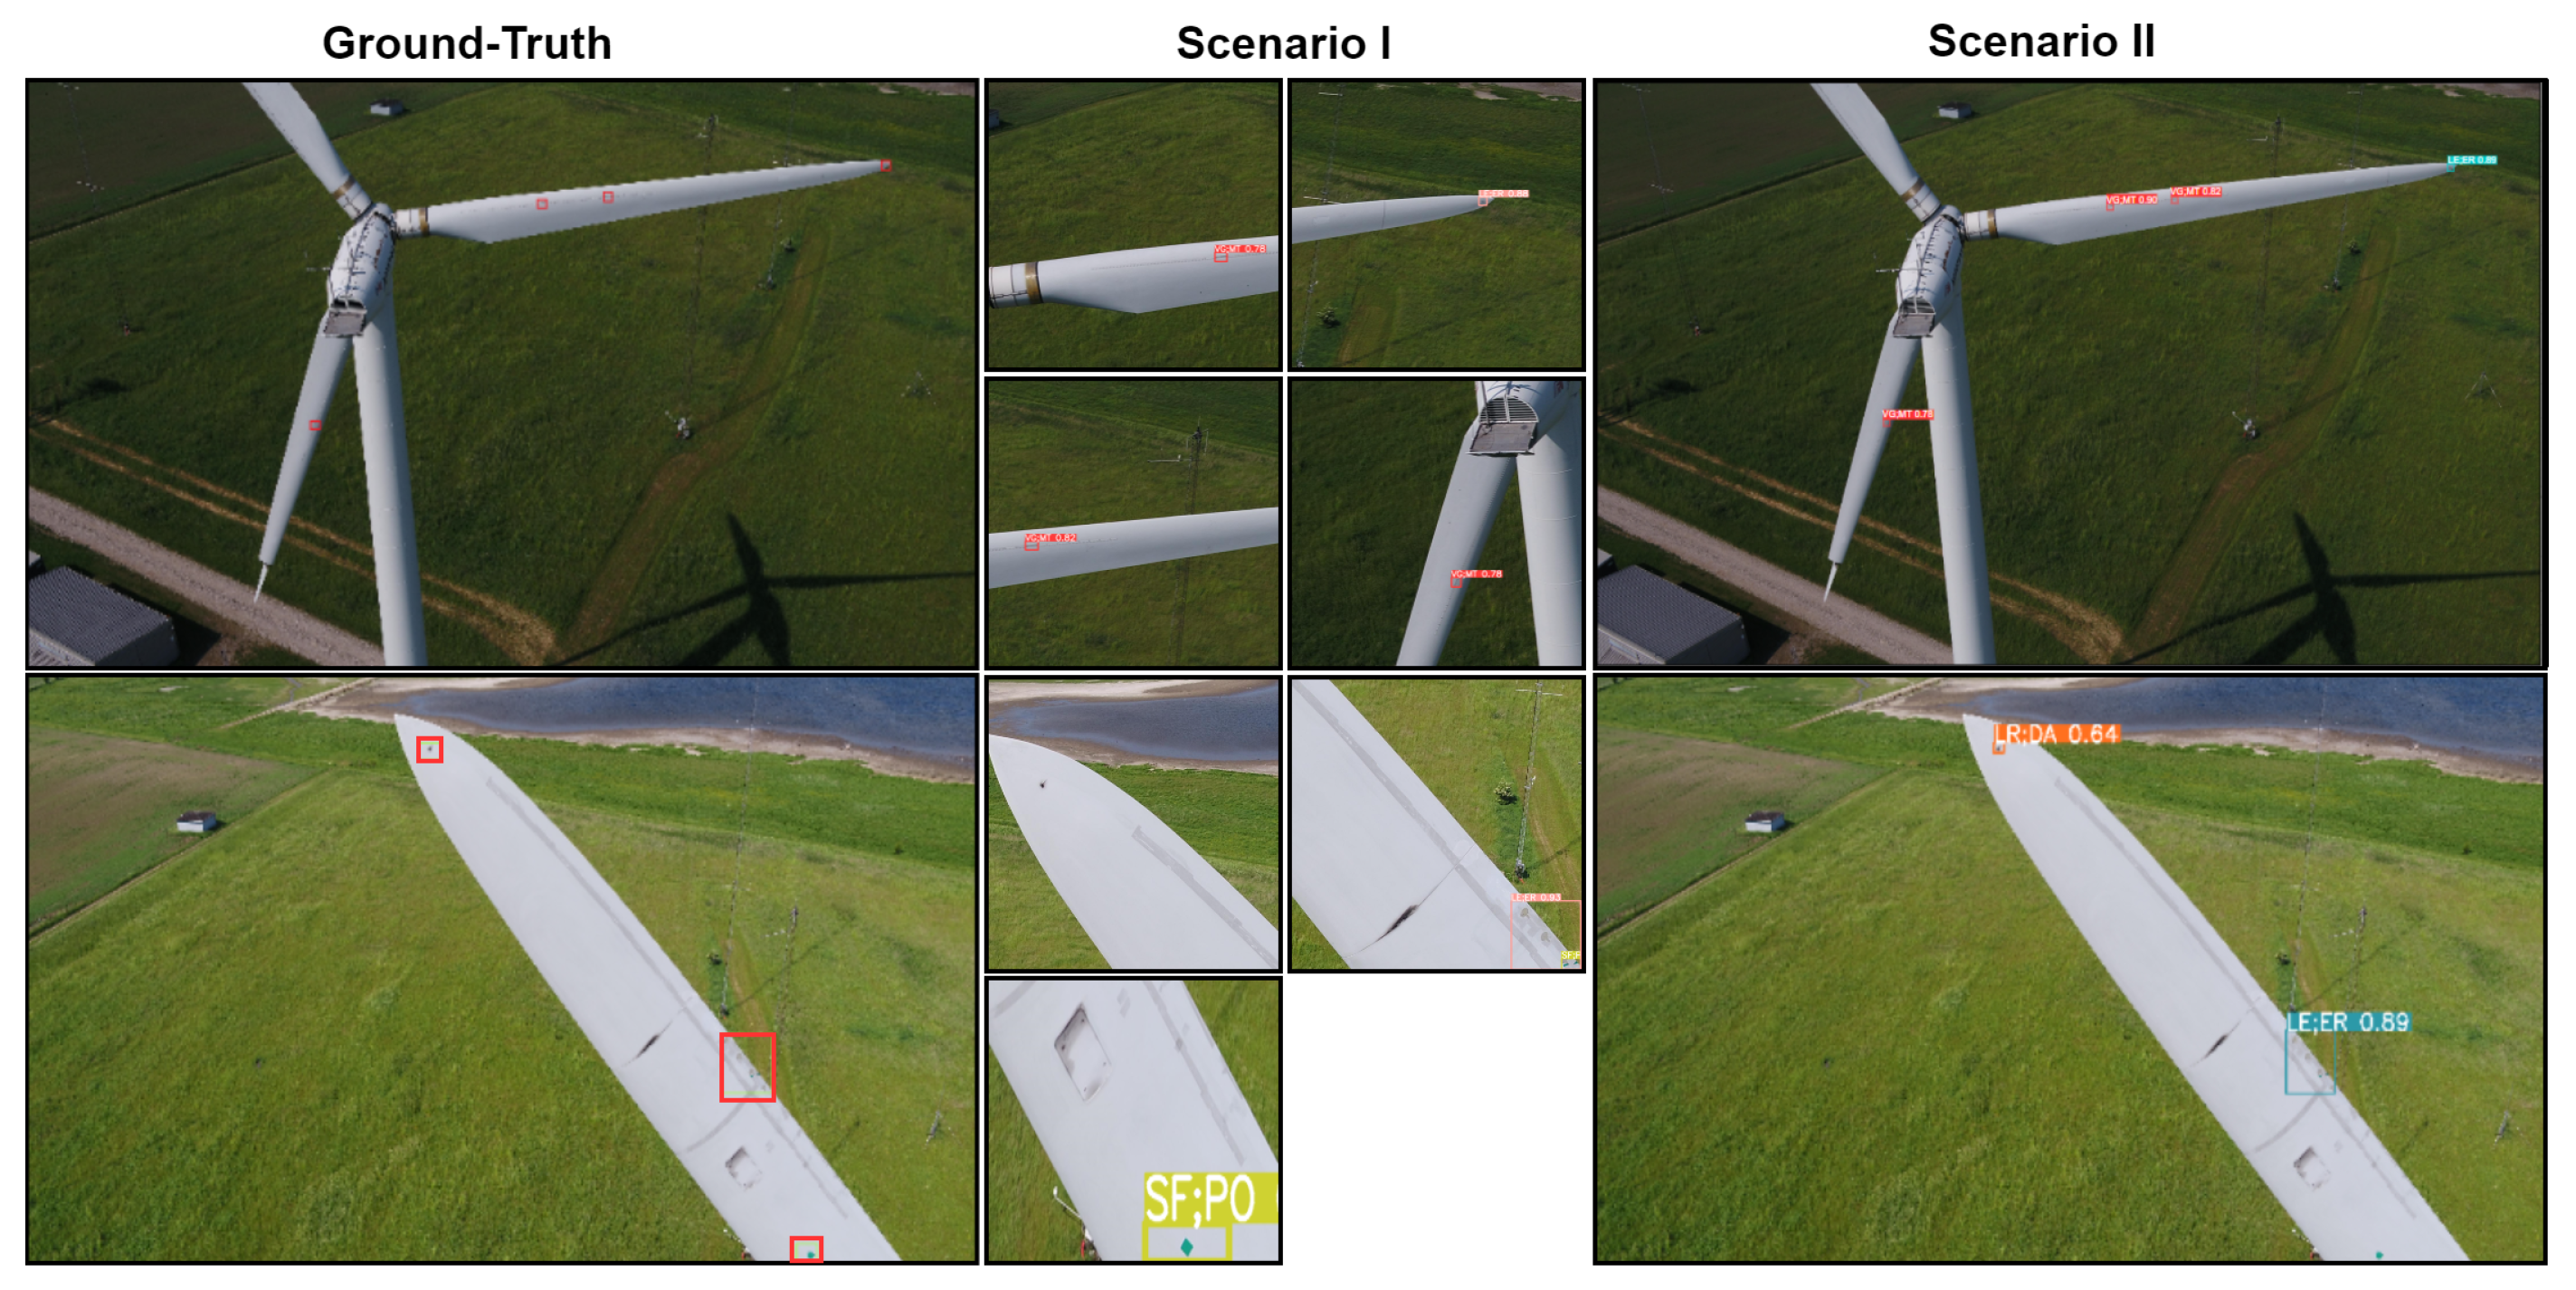
In Figure 5, we present a visual comparison of selected outcomes extracted from Scenarios I and II utilizing a single trained baseline model. In this case, our attention is directed toward small objects obtained from the dataset. Through meticulous observation, our proposed framework demonstrates a heightened capacity for pinpointing defects in scenarios where the detection capability in Scenario I might be insufficient or lead to potential oversights. This is particularly evident in Figure 5, specifically, the second row, second column, where the model in Scenario I fails to detect a DA defect entirely. In contrast, the very same defect is successfully detected in Figure 5, second row, third column; within a 1024-pixel context, it remains undetected, yet within a 800-pixel framework (as exemplified by the dimensions in Scenario II), the defect becomes noticeable. These challenges can be effectively addressed by strategically employing a multi-scale image processing approach. It is imperative to acknowledge that failure instances persist within both scenarios, particularly when confronted with certain defect classes that pose inherent difficulties in terms of localization. This is demonstrated in Figure 5, where the PO defect in the second row, third column is positioned at the extremity of the image. In this case, the model in Scenario II encounters difficulty in accurately identifying the defect positioned at the image’s far corner. This situation highlights the intricate difficulties faced in drone-captured images.
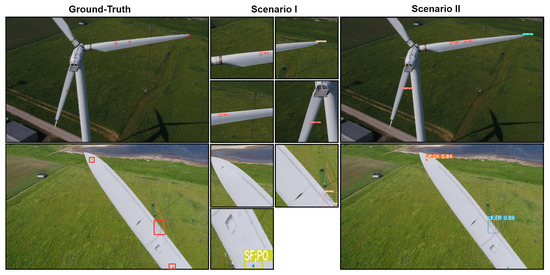
Figure 5.
Visual comparison of inference strategies, illustrating prediction results for different scenarios.
4.4.4. Efficiency
Due to the propensities of slice-aided inference, we expect longer inference times for a full-size image. For Scenario II, we recorded an average of 0.418 s/patch on the YOLOv5 (or 27.6 s per full-size image), though we note that this can be further optimized through the selective processing of patches.
In terms of inference speed, a comparison between the two scenarios highlights the superiority of Scenario I. This divergence arises from the inherent efficiency of patch-based processing in Scenario I, in contrast to the relatively slower performance of Scenario II, which is attributed to its comprehensive consideration of predictions based on the original ultra high-resolution images.
The complexity of object detection models is evident in the number of parameters that they use. YOLOv5 is the most straightforward, with 7.2 million parameters, RetinaNet has around 32 million parameters, and Faster-RCNN has roughly 38 million parameters.
5. Discussion
In this study, we have compared two different ways of analyzing our proposed defect detection method. First, we investigated Scenario I, where we used patches of images for both training and testing. We found that while this method is fast, it can miss defects that span multiple patches, leading to separate detections for one defect, which is not ideal. In addition, while aerial images have ultra high-resolution, the scale of objects within them can vary depending on the drone’s position. When the drone is far from the target, recognizing small objects within the image can become very difficult. Common practices to deal with small objects in ultra high-resolution images include randomly cropping images or rescaling before passing them to the model for training and inference.
However, this does not solve the problem, as objects may continue to be poorly represented during model training. Alternatives include dividing the images into smaller patches and then using them directly for training and inference. To address this, we introduced Scenario II, where we tested our proposed method on the original ultra high-resolution images without any preprocessing. We found that in Scenario II the model was able to find defects that were missed in Scenario I, especially in cases where the defects were small or spanned multiple patches. In terms of the models we used, YOLOv5 showed stable performance across both scenarios, with slight improvements in Scenario II for medium and large objects. Faster-RCNN had more noticeable changes, performing much better on small and medium objects in Scenario II, although its performance dropped for larger objects. RetinaNet showed similar behavior to Faster-RCNN, improving on small and medium objects in Scenario II while struggling with larger ones. The detailed comparisons in Table 3 reveals that the proposed approach in Scenario II results in consistently improved performance for YOLOv5, Faster-RCNN, and RetinaNet across different metrics. These results suggest that our proposed method has the potential to enhance the detection of defects in real-world scenarios, especially for smaller objects. Our method is designed to work with ultra high-resolution images, no matter how large or small the wind turbine appears in the images. The image is taken as input and the learned features are used to detect and locate wind turbine blade surface defects within it. This approach involves making use of the features learned from the images to effectively detect surface defects of wind turbine blades regardless of their size, and can be applied in both on-shore and off-shore operations, requiring only an image of the blade.
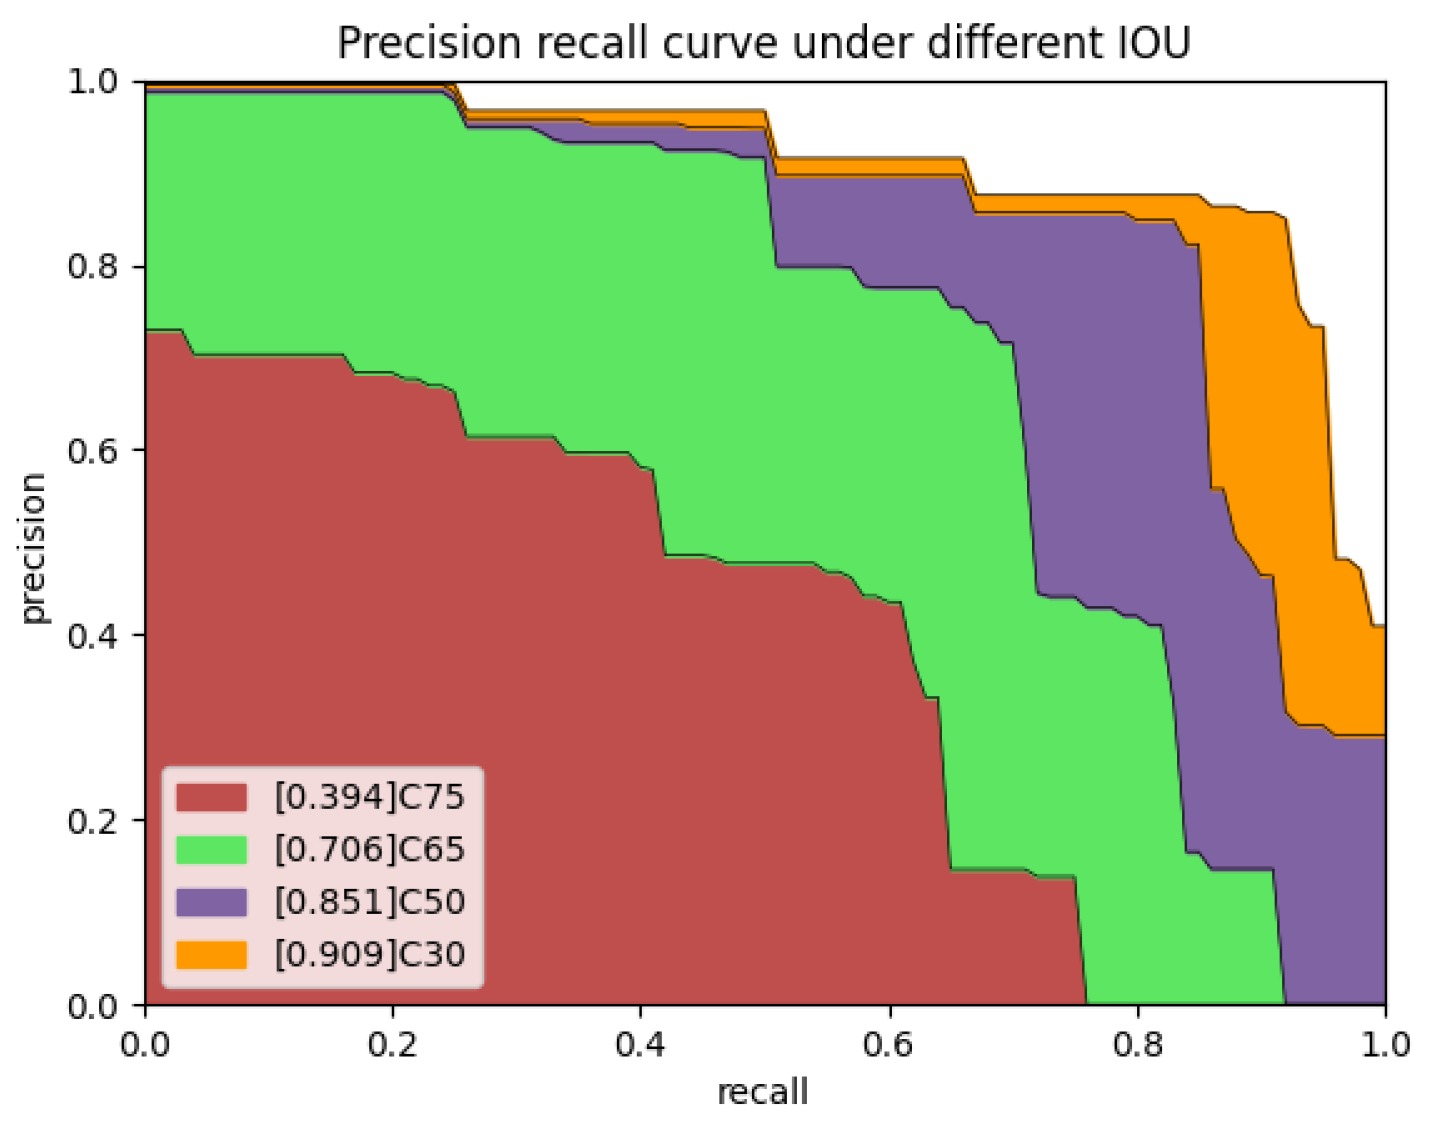
Figure 6 shows the precision–recall curve on the DTU test set. This graph illustrates how effectively our method performs in detecting wind turbine blades surface defects. It measures two important aspects: precision, which reflects the accuracy of our detections, and recall, which indicates how well the method finds all of the relevant wind turbine blade surface defects in the images. The curve provides insights into our method’s performance under different conditions, as it considers various IoU (Intersection over Union) thresholds. These thresholds, denoted as C75 (IoU threshold of 0.75), C65 (IoU threshold of 0.65), C50 (IoU threshold of 0.5), and C30 (IoU threshold of 0.3), allow the method’s robustness and trade-offs to be assessed at different levels of precision and recall. These findings underline the importance of considering different test scenarios in order to optimize defect detection accuracy and efficiency.

Figure 6.
Precision recall curve under different IOU values.
6. Conclusions
In conclusion, in this paper we have introduced a comprehensive framework customized to address the complex task of detecting defects on the surface of WTBs through analysis of ultra-high resolution images. Through empirical and qualitative comparisons of two distinct scenarios, this study highlights the importance of small object detection and the need for a specialized setup involving slice-aided inference. The results of our experiments demonstrate the effectiveness of slice-aided inference, especially when complemented by efficient resizing and merging modules, in enhancing the detection of small objects in ultra high-resolution images. Looking ahead, possible directions for further investigation encompass the creation of context-driven approaches capable of adjusting the proposed slice-aided inference strategy to accommodate a range of complex and varied scenarios. Such enhancements could lead to even more refined defect detection capabilities, thereby advancing the applicability of the proposed framework to a wider array of real-world situations.
Author Contributions
Conceptualization, J.S., A.H. and I.G.; Methodology, J.S.; Software, W.K.Y. and C.Y.; Validation, A.H., J.S. and C.Y.; Data curation, I.G. and C.Y.; Writing—original manuscript preparation, I.G.; Writing—review and editing, J.S. and A.H. All authors have read and agreed to the published version of the manuscript.
Funding
This work was supported by HWUM JWS 2021 funding and the UK Royal Academy of Engineering under Research Fellowship Scheme RF/201718/17128.
Institutional Review Board Statement
Not applicable.
Informed Consent Statement
Not applicable.
Data Availability Statement
For better reproducibility and benchmarking, our annotations are made available at: https://github.com/imadgohar/DTU-annotations (accessed on 3 May 2023).
Conflicts of Interest
The authors declare no conflict of interest.
Abbreviations
The following abbreviations are used in this manuscript:
| DTU | Technical University of Denmark |
| WTB | Wind Turbine Blade |
| CNN | Convolutional Neural Network |
| DNN | Deep Neural Network |
| UAV | Unmanned Aerial Vehicle |
| HD | High Definition |
| YOLO | You Look Only Once |
| mAP | Mean Average Precision |
References
- Alharbi, F.R.; Csala, D. Gulf cooperation council countries’ climate change mitigation challenges and exploration of solar and wind energy resource potential. Appl. Sci. 2021, 11, 2648. [Google Scholar] [CrossRef]
- Ikram, M.; Sroufe, R.; Zhang, Q.; Ferasso, M. Assessment and prediction of environmental sustainability: Novel grey models comparative analysis of China vs. the USA. Environ. Sci. Pollut. Res. 2021, 28, 17891–17912. [Google Scholar] [CrossRef]
- Yousefi, H.; Abbaspour, A.; Seraj, H. Worldwide development of wind energy and co2 emission reduction. Environ. Energy Econ. Res. 2019, 3, 1–9. [Google Scholar]
- Woofenden, I. How a Wind Turbine Works; Wind Energy Technologies Office: Washington, DC, USA, 2016. [Google Scholar]
- Adeyeye, K.A.; Ijumba, N.; Colton, J. The Effect of the Number of Blades on the Efficiency of a Wind Turbine. In IOP Conference Series: Earth and Environmental Science; IOP Publishing: Bristol, UK, 2021; Volume 801, p. 012020. [Google Scholar]
- Aminzadeh, A.; Dimitrova, M.; Meiabadi, M.S.; Sattarpanah Karganroudi, S.; Taheri, H.; Ibrahim, H.; Wen, Y. Non-Contact Inspection Methods for Wind Turbine Blade Maintenance: Techno–Economic Review of Techniques for Integration with Industry 4.0. J. Nondestruct. Eval. 2023, 42, 54. [Google Scholar]
- Du, Y.; Zhou, S.; Jing, X.; Peng, Y.; Wu, H.; Kwok, N. Damage detection techniques for wind turbine blades: A review. Mech. Syst. Signal Process. 2020, 141, 106445. [Google Scholar]
- Solimine, J.; Niezrecki, C.; Inalpolat, M. An experimental investigation into passive acoustic damage detection for structural health monitoring of wind turbine blades. Struct. Health Monit. 2020, 19, 1711–1725. [Google Scholar]
- Panagiotopoulos, A.I.; Tcherniak, D.; Fassois, S.D. Damage detection on an operating wind turbine blade via a single vibration sensor: A feasibility study. In Proceedings of the European Workshop on Structural Health Monitoring, Palermo, Italy, 6–9 July 2020; Springer: Berlin/Heidelberg, Germany, 2020; pp. 405–414. [Google Scholar]
- Ye, G.; Neal, B.; Boot, A.; Kappatos, V.; Selcuk, C.; Gan, T.H. Development of an ultrasonic NDT system for automated in-situ inspection of wind turbine blades. In Proceedings of the EWSHM-7th European Workshop on Structural Health Monitoring, Nantes, France, 8–11 July 2014. [Google Scholar]
- Liu, Z.; Liu, X.; Wang, K.; Liang, Z.; Correia, J.A.; De Jesus, A.M. GA-BP neural network-based strain prediction in full-scale static testing of wind turbine blades. Energies 2019, 12, 1026. [Google Scholar] [CrossRef]
- Deign, J. Fully Automated Drones Could Double Wind Turbine Inspection Rates. Wind Energy Update 2016. Available online: https://analysis.newenergyupdate.com/wind-energy-update/fully-automated-drones-could-double-wind-turbine-inspection-rates (accessed on 28 August 2023).
- Qi, W. Object detection in high resolution optical image based on deep learning technique. Nat. Hazards Res. 2022, 2, 384–392. [Google Scholar] [CrossRef]
- Kang, T.; Park, S.; Choi, S.; Choo, J. Data augmentation using random image cropping for high-resolution virtual try-on (viton-crop). arXiv 2021, arXiv:2111.08270. [Google Scholar]
- Yang, R.; Wang, R.; Deng, Y.; Jia, X.; Zhang, H. Rethinking the random cropping data augmentation method used in the training of CNN-based SAR image ship detector. Remote Sens. 2020, 13, 34. [Google Scholar] [CrossRef]
- Geras, K.J.; Wolfson, S.; Shen, Y.; Wu, N.; Kim, S.; Kim, E.; Heacock, L.; Parikh, U.; Moy, L.; Cho, K. High-resolution breast cancer screening with multi-view deep convolutional neural networks. arXiv 2017, arXiv:1703.07047. [Google Scholar]
- Foster, A.; Best, O.; Gianni, M.; Khan, A.; Collins, K.; Sharma, S. Drone Footage Wind Turbine Surface Damage Detection. In Proceedings of the 2022 IEEE 14th Image, Video, and Multidimensional Signal Processing Workshop (IVMSP), Nafplio, Greece, 26–29 June 2022; pp. 1–5. [Google Scholar]
- Wang, L.; Zhang, Z. Automatic detection of wind turbine blade surface cracks based on UAV-taken images. IEEE Trans. Ind. Electron. 2017, 64, 7293–7303. [Google Scholar] [CrossRef]
- Wang, L.; Zhang, Z.; Luo, X. A two-stage data-driven approach for image-based wind turbine blade crack inspections. IEEE/ASME Trans. Mechatron. 2019, 24, 1271–1281. [Google Scholar] [CrossRef]
- Deng, L.; Guo, Y.; Chai, B. Defect detection on a wind turbine blade based on digital image processing. Processes 2021, 9, 1452. [Google Scholar] [CrossRef]
- Peng, L.; Liu, J. Detection and analysis of large-scale WT blade surface cracks based on UAV-taken images. IET Image Process. 2018, 12, 2059–2064. [Google Scholar] [CrossRef]
- Ruiz, M.; Mujica, L.E.; Alferez, S.; Acho, L.; Tutiven, C.; Vidal, Y.; Rodellar, J.; Pozo, F. Wind turbine fault detection and classification by means of image texture analysis. Mech. Syst. Signal Process. 2018, 107, 149–167. [Google Scholar] [CrossRef]
- Shihavuddin, A.; Chen, X.; Fedorov, V.; Nymark Christensen, A.; Andre Brogaard Riis, N.; Branner, K.; Bjorholm Dahl, A.; Reinhold Paulsen, R. Wind turbine surface damage detection by deep learning aided drone inspection analysis. Energies 2019, 12, 676. [Google Scholar] [CrossRef]
- Shihavuddin, A.; Rashid, M.R.A.; Maruf, M.H.; Hasan, M.A.; ul Haq, M.A.; Ashique, R.H.; Al Mansur, A. Image based surface damage detection of renewable energy installations using a unified deep learning approach. Energy Rep. 2021, 7, 4566–4576. [Google Scholar]
- Yu, Y.; Cao, H.; Yan, X.; Wang, T.; Ge, S.S. Defect identification of wind turbine blades based on defect semantic features with transfer feature extractor. Neurocomputing 2020, 376, 1–9. [Google Scholar]
- Yang, X.; Zhang, Y.; Lv, W.; Wang, D. Image recognition of wind turbine blade damage based on a deep learning model with transfer learning and an ensemble learning classifier. Renew. Energy 2021, 163, 386–397. [Google Scholar] [CrossRef]
- Sarkar, D.; Gunturi, S.K. Wind turbine blade structural state evaluation by hybrid object detector relying on deep learning models. J. Ambient Intell. Humaniz. Comput. 2021, 12, 8535–8548. [Google Scholar]
- Ran, X.; Zhang, S.; Wang, H.; Zhang, Z. An Improved Algorithm for Wind Turbine Blade Defect Detection. IEEE Access 2022, 10, 122171–122181. [Google Scholar] [CrossRef]
- Zou, L.; Cheng, H. Research on wind turbine blade surface damage identification based on improved convolution neural network. Appl. Sci. 2022, 12, 9338. [Google Scholar] [CrossRef]
- Helbing, G.; Ritter, M. Deep Learning for fault detection in wind turbines. Renew. Sustain. Energy Rev. 2018, 98, 189–198. [Google Scholar]
- Zhang, J.; Cosma, G.; Watkins, J. Image enhanced mask r-cnn: A deep learning pipeline with new evaluation measures for wind turbine blade defect detection and classification. J. Imaging 2021, 7, 46. [Google Scholar] [CrossRef]
- Iyer, A.; Nguyen, L.; Khushu, S. Learning to identify cracks on wind turbine blade surfaces using drone-based inspection images. arXiv 2022, arXiv:2207.11186. [Google Scholar]
- Zhang, C.; Yang, T.; Yang, J. Image recognition of wind turbine blade defects using attention-based MobileNetv1-YOLOv4 and transfer learning. Sensors 2022, 22, 6009. [Google Scholar] [CrossRef]
- Yang, C.; Liu, X.; Zhou, H.; Ke, Y.; See, J. Towards accurate image stitching for drone-based wind turbine blade inspection. Renew. Energy 2023, 203, 267–279. [Google Scholar] [CrossRef]
- Shihavuddin, A.; Chen, X. DTU—Drone Inspection Images of Wind Turbine; Mendeley Data: Amsterdam, The Netherlands, 2018. [Google Scholar] [CrossRef]
- Zhang, K.; Li, D.; Luo, W.; Ren, W.; Stenger, B.; Liu, W.; Li, H.; Yang, M.H. Benchmarking ultra-high-definition image super-resolution. In Proceedings of the IEEE/CVF International Conference on Computer Vision, Nashville, TN, USA, 20–25 June 2021; pp. 14769–14778. [Google Scholar]
- Leng, J.; Mo, M.; Zhou, Y.; Gao, C.; Li, W.; Gao, X. Pareto Refocusing for Drone-view Object Detection. IEEE Trans. Circuits Syst. Video Technol. 2022, 33, 1320–1334. [Google Scholar] [CrossRef]
- Tzutalin. LabelImg. Free Software: MIT License; MIT: Cambridge, MA, USA, 2015. [Google Scholar]
- Jocher, G.; Chaurasia, A.; Stoken, A.; Borovec, J.; Kwon, Y.; Fang, J.; Michael, K.; Montes, D.; Nadar, J.; Skalski, P.; et al. ultralytics/yolov5: V6. 1-TensorRT, TensorFlow Edge TPU and OpenVINO Export and Inference. Zenodo. 2022. Available online: https://zenodo.org/record/6222936 (accessed on 6 May 2023).
- Lin, T.Y.; Goyal, P.; Girshick, R.; He, K.; Dollár, P. Focal loss for dense object detection. In Proceedings of the IEEE International Conference on Computer Vision, Venice, Italy, 22–29 October 2017; pp. 2980–2988. [Google Scholar]
- Ren, S.; He, K.; Girshick, R.; Sun, J. Faster r-cnn: Towards real-time object detection with region proposal networks. Adv. Neural Inf. Process. Syst. 2015, 28, 1–9. [Google Scholar] [CrossRef] [PubMed]
- Akyon, F.C.; Altinuc, S.O.; Temizel, A. Slicing aided hyper inference and fine-tuning for small object detection. In Proceedings of the 2022 IEEE International Conference on Image Processing (ICIP), Bordeaux, France, 16–19 October 2022; pp. 966–970. [Google Scholar]
- Lin, T.Y.; Maire, M.; Belongie, S.; Hays, J.; Perona, P.; Ramanan, D.; Dollár, P.; Zitnick, C.L. Microsoft coco: Common objects in context. In Proceedings of the Computer Vision–ECCV 2014: 13th European Conference, Zurich, Switzerland, 6–12 September 2014; Proceedings, Part V 13. Springer: Berlin/Heidelberg, Germany, 2014; pp. 740–755. [Google Scholar]
- Wu, Y.; Kirillov, A.; Massa, F.; Lo, W.Y.; Girshick, R. Detectron2. 2019. Available online: https://github.com/facebookresearch/detectron2 (accessed on 3 June 2023).

Disclaimer/Publisher’s Note: The statements, opinions and data contained in all publications are solely those of the individual author(s) and contributor(s) and not of MDPI and/or the editor(s). MDPI and/or the editor(s) disclaim responsibility for any injury to people or property resulting from any ideas, methods, instructions or products referred to in the content. |
© 2023 by the authors. Licensee MDPI, Basel, Switzerland. This article is an open access article distributed under the terms and conditions of the Creative Commons Attribution (CC BY) license (https://creativecommons.org/licenses/by/4.0/).