1. Introduction
Machinery using “fibre friction” to transfer the tractive force from a drive to a traction element (which can be a flat or V-belt, steel rope or a conveyor belt) is commonly used in practice. Tensile force ratio (F
N/Fo [N]) in both sides of the traction element, girded with an angle λ [deg] via the driving element, is described by the so-called Euler’s formula [
1]. This states that the magnitude of the transmitted circumferential force F [N] is directly proportional to the size of the so-called outrunning force Fo [N] acting in the traction element on the outrunning side of the driven sheave (or a drum), angle of wrap λ [deg] and coefficient of friction f
T [-] in the contact surface of the driven end propulsion elements.
If the tension element is a flat belt, V-belt [
2,
3,
4], or a conveyor belt [
5,
6], then the coefficient of friction f
T [-] is expressed by shear friction µ [-] in the contact surfaces of interlocking members.
Kulinowski et al. in [
7] state that there is a lack of information in the literature on deeper research into the coefficient of friction between the belt and the drum in an industrial facility provided under real conditions, which may imply that the phenomenon of driving force transmission from the drum surface to the belt has not been thoroughly explored.
In belt conveyor drive systems, the driving force is transferred from the drum to the conveyor belt due to friction coupling [
8]. Friction coupling conditions depend on parameters such as belt tension force, drum wrap angle, and friction coefficient between the belt cover and the drive drum surface, which is described in articles [
9,
10,
11].
In recent years, many scholars have carried out research on sliding friction between a rope and friction lining. Shirong [
12] carried out a sequence of experiments to explore the coefficient of friction and ultimate friction force between the rope and friction lining, and the probability of friction coefficient distribution.
If the traction element is a steel rope, the friction coefficient in the groove of a sheave f
T [-] can be calculated according to [
13].
An experimental system was developed by Uchiyama et al. [
14], that allows for direct measurement of friction at the tendon-pulley interface, and the results were interpreted by the use of a theoretical model for the friction of a cable around a fixed pulley.
Some researchers have experimentally studied the contact between a grooved pulley and V or V-ribbed belts [
15,
16].
To identify the contact stiffness and the coefficient of friction between the ribbed V-belt and the pulley, Cepon et al. [
17] designed two experimental settings. The friction coefficient was identified at various initial belt tensions and relative velocities between the belt and the pulley.
Wang et al. in [
18] analysed the effects of hoisting parameters (effective load, acceleration and deceleration) on dynamic contact characteristics between the rope and friction lining in a deep coal mine. Research on friction transmission in a mining friction hoist is also the subject of various studies [
19,
20,
21].
Hrabovsky and Michalik in the article [
22] describe the construction design and implemented equipment with which it is possible to determine, in the laboratory, the value of the rope friction coefficient in the given type of traction sheave grooves.
In a study [
23], Shirong examined, using experimental techniques simulating friction conditions of hoisting a load, the coefficients of friction between a steel rope and a polyvinylchloride (PVC) lining.
Chaplin in an article [
24] discusses the inevitable attrition of steel rope in service with an overview of the consequences in terms of inspection and replacement criteria. Similarly, Peterka et al. in [
25] deal with the inevitable wear of the steel rope in operation, specifically describing damage to the rope occurring during a short period of the steel rope operation used in the lifting system.
The designers of various mine hoisting machines require from the manufacturers a guaranteed appropriate and stable value of a friction coefficient at different pressures between a rope and friction lining under different external conditions (drought, moisture, icing, etc.). The KOEPPE mining lifting system or the friction hoist winch work with a traction sheave, where the grooves of the pulley rim are lined. The KOEPPE Mine hoisting system or the friction hoist winch work with a traction pulley, where the grooves of the pulley rim are lined. Kresak et al. in the paper [
26] define that the liner must ensure a higher coefficient of friction between the rope and the tow pulley because the KOEPPE mining lifting system or the friction hoist winch works with the tow pulley.
In [
27], Hrabovsky et al. present experimental devices used to detect pulling forces on both sides of the final length of a cable belted in a pulley groove and to verify the phenomenon defined by the name fibre friction.
In [
28], Chang et al. state that the surface wear and corrosion affect the service performance of steel wire rope. In this paper, the friction and wear properties of steel ropes with different corrosion types were investigated. The results show that the corrosion had a strong influence on the coefficient of friction of the wire rope.
In another study [
29], Guo et al. investigate the creeping behaviours between hoisting rope and friction lining in the process of deep coal mine friction transmission. The authors’ results show that increases in the terminal mass ratio, terminal mass, maximum acceleration, and maximum speed cause expanding trends of overall ranges of the maximum creeping velocity, respectively. Less creep is beneficial to improve the friction transmission safety, service life of friction lining and good anti-slip properties.
In another study [
30], Childs and Cowburn applied changes in pressure contact, and thus in active arc extent, with torque. These changes have been monitored and used for measurements of belt tensions and surface roughness to study the adhesive sliding friction of belts. In their study, it is shown that the design of the belt (either the woven fabric substrate or embossing of flat belts or the fibre reinforcement of raw-edge V-belts) has also been proved to influence the friction coefficient.
2. Materials and Methods
The technical standard [
13] (pp. 43–44) gives relations to calculate the coefficient of friction for grooves designed for a V-belt, semi-circular, and semi-circular notched belt. This calculated value of the friction coefficient for the given groove type, according to the formulas stated in [
13,
31], is influenced by the dihedral angle γ [deg], notch angle β [deg], and coefficient of friction µ [-]. The coefficient of friction in the groove, calculated according to [
13], acquires a specific (minimum of all possible values) numerical value that is determined for the shear friction coefficient µ = 0.1 [
13]. The coefficient of friction does not take into account the operating state of the contact surfaces of the carrying cable and the groove walls, as is the case of the conveyor belt and the lining of the drive drum [
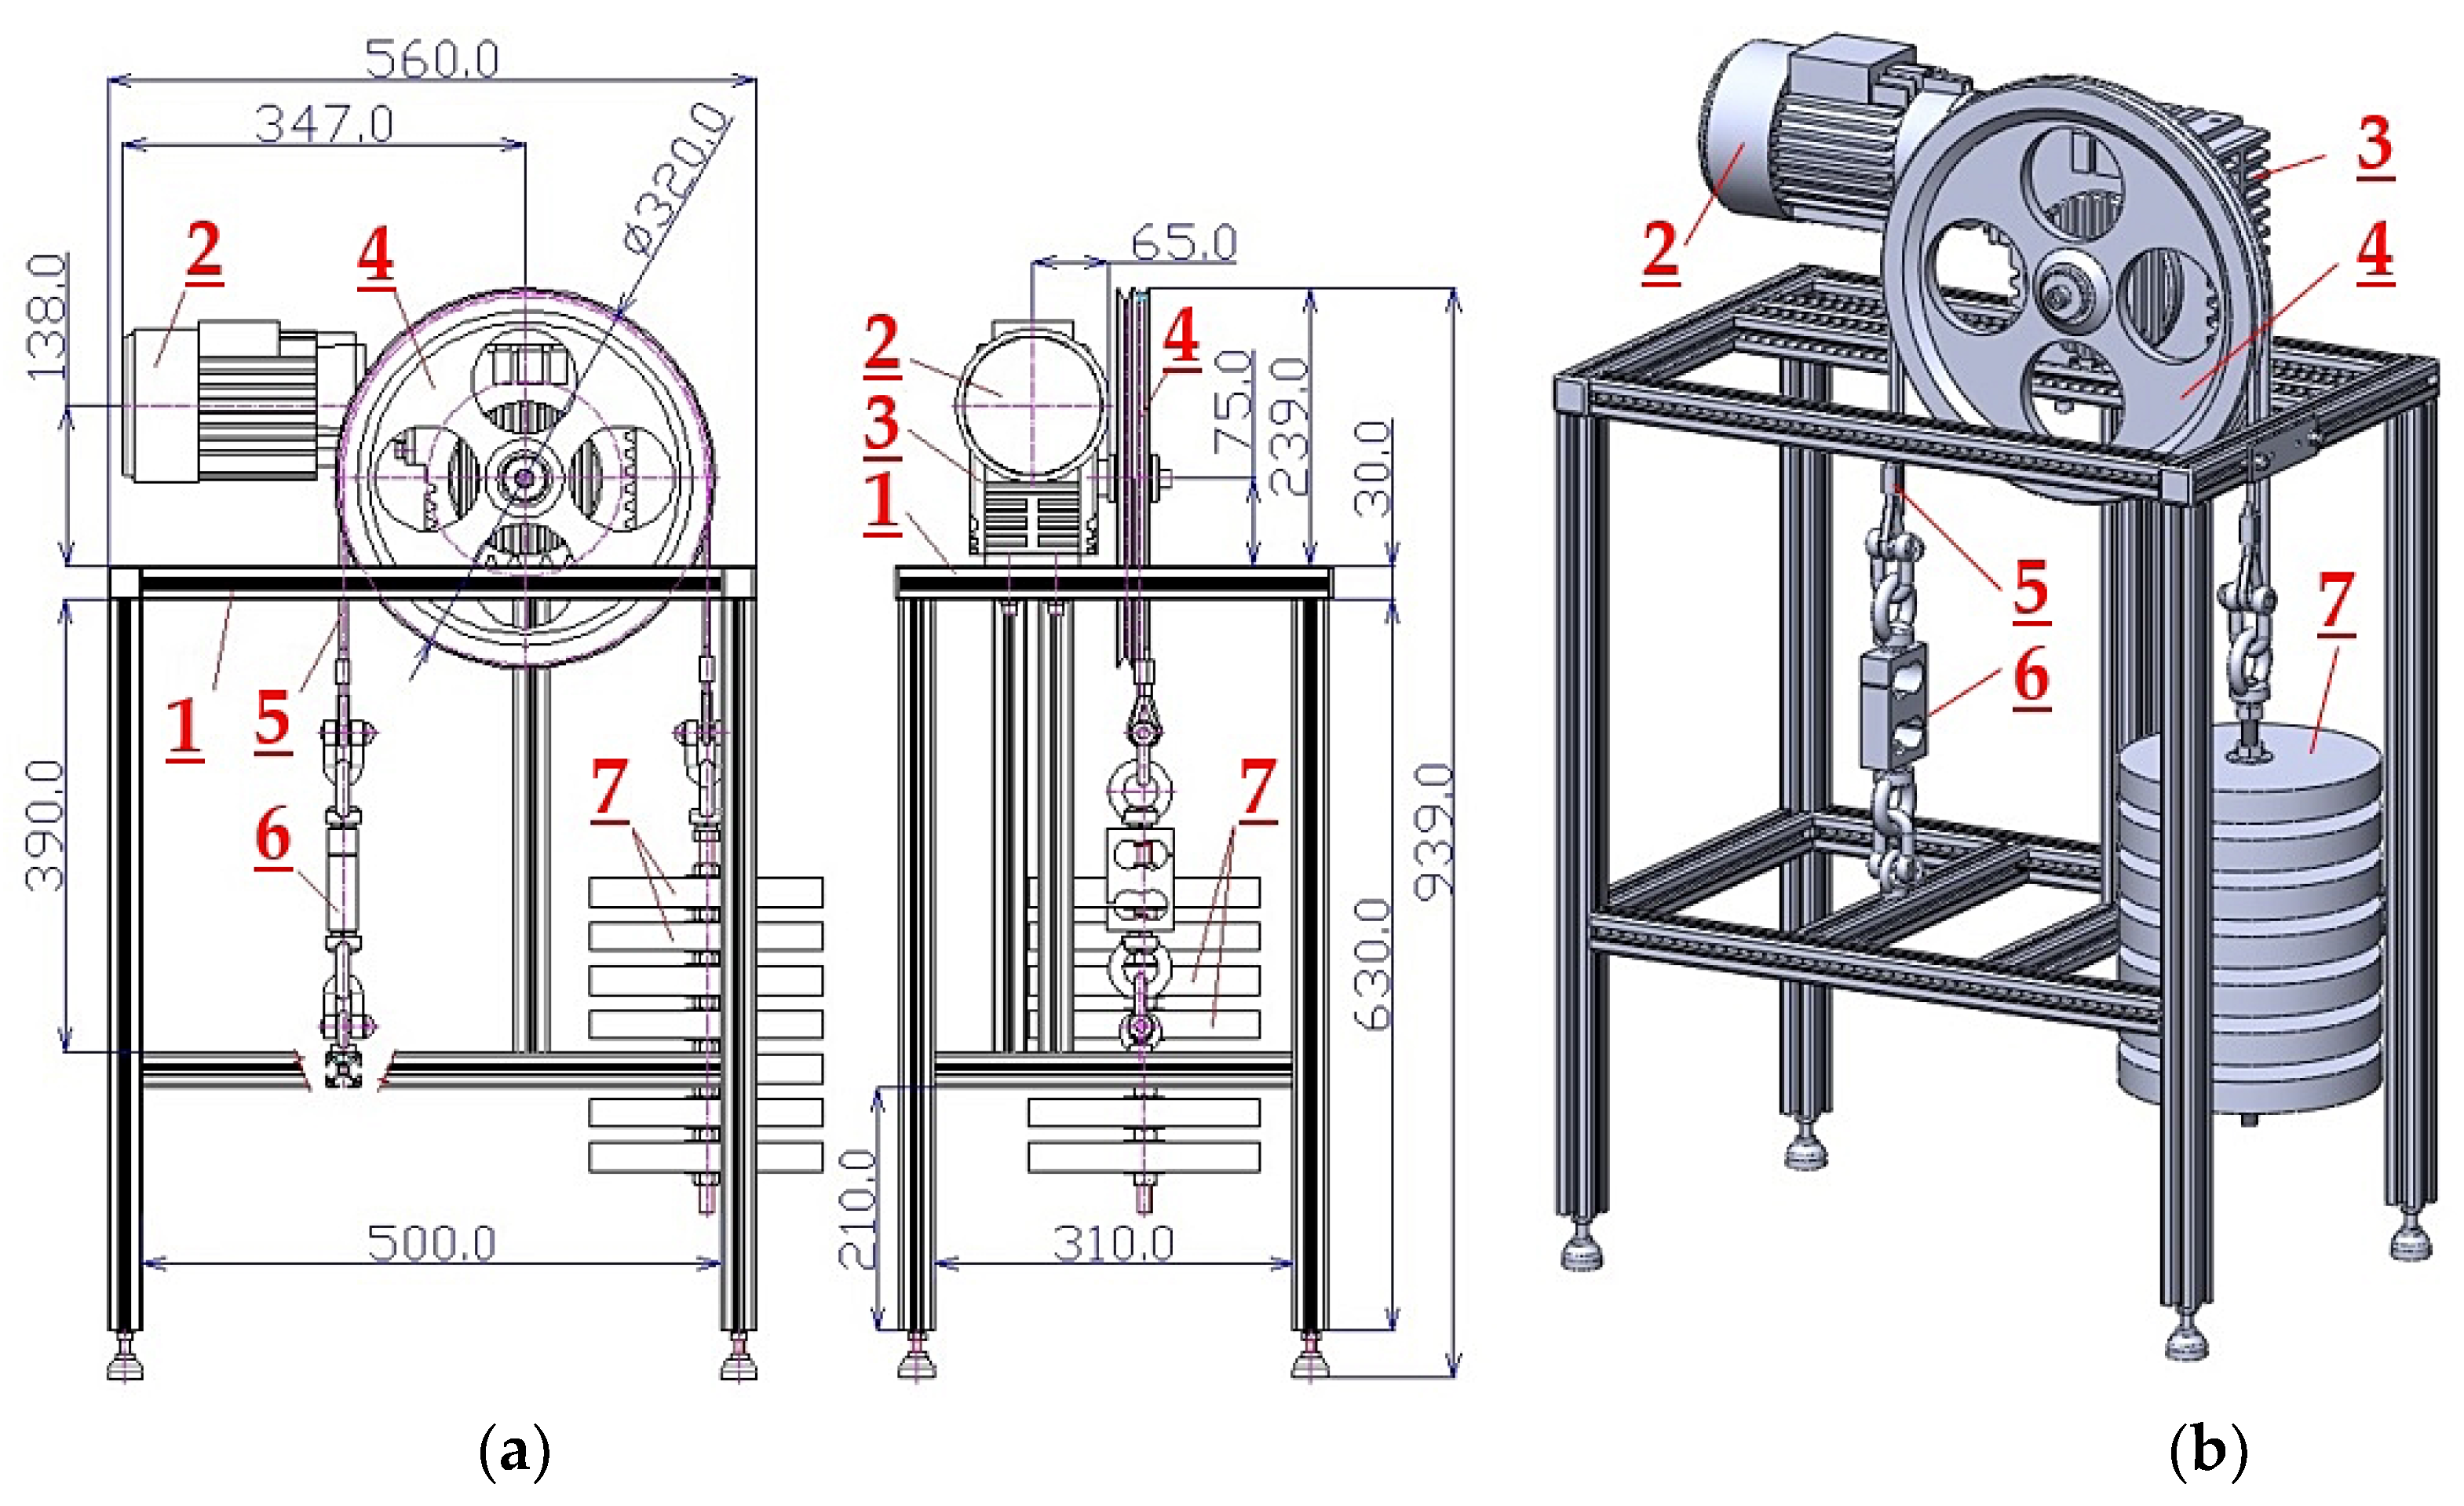
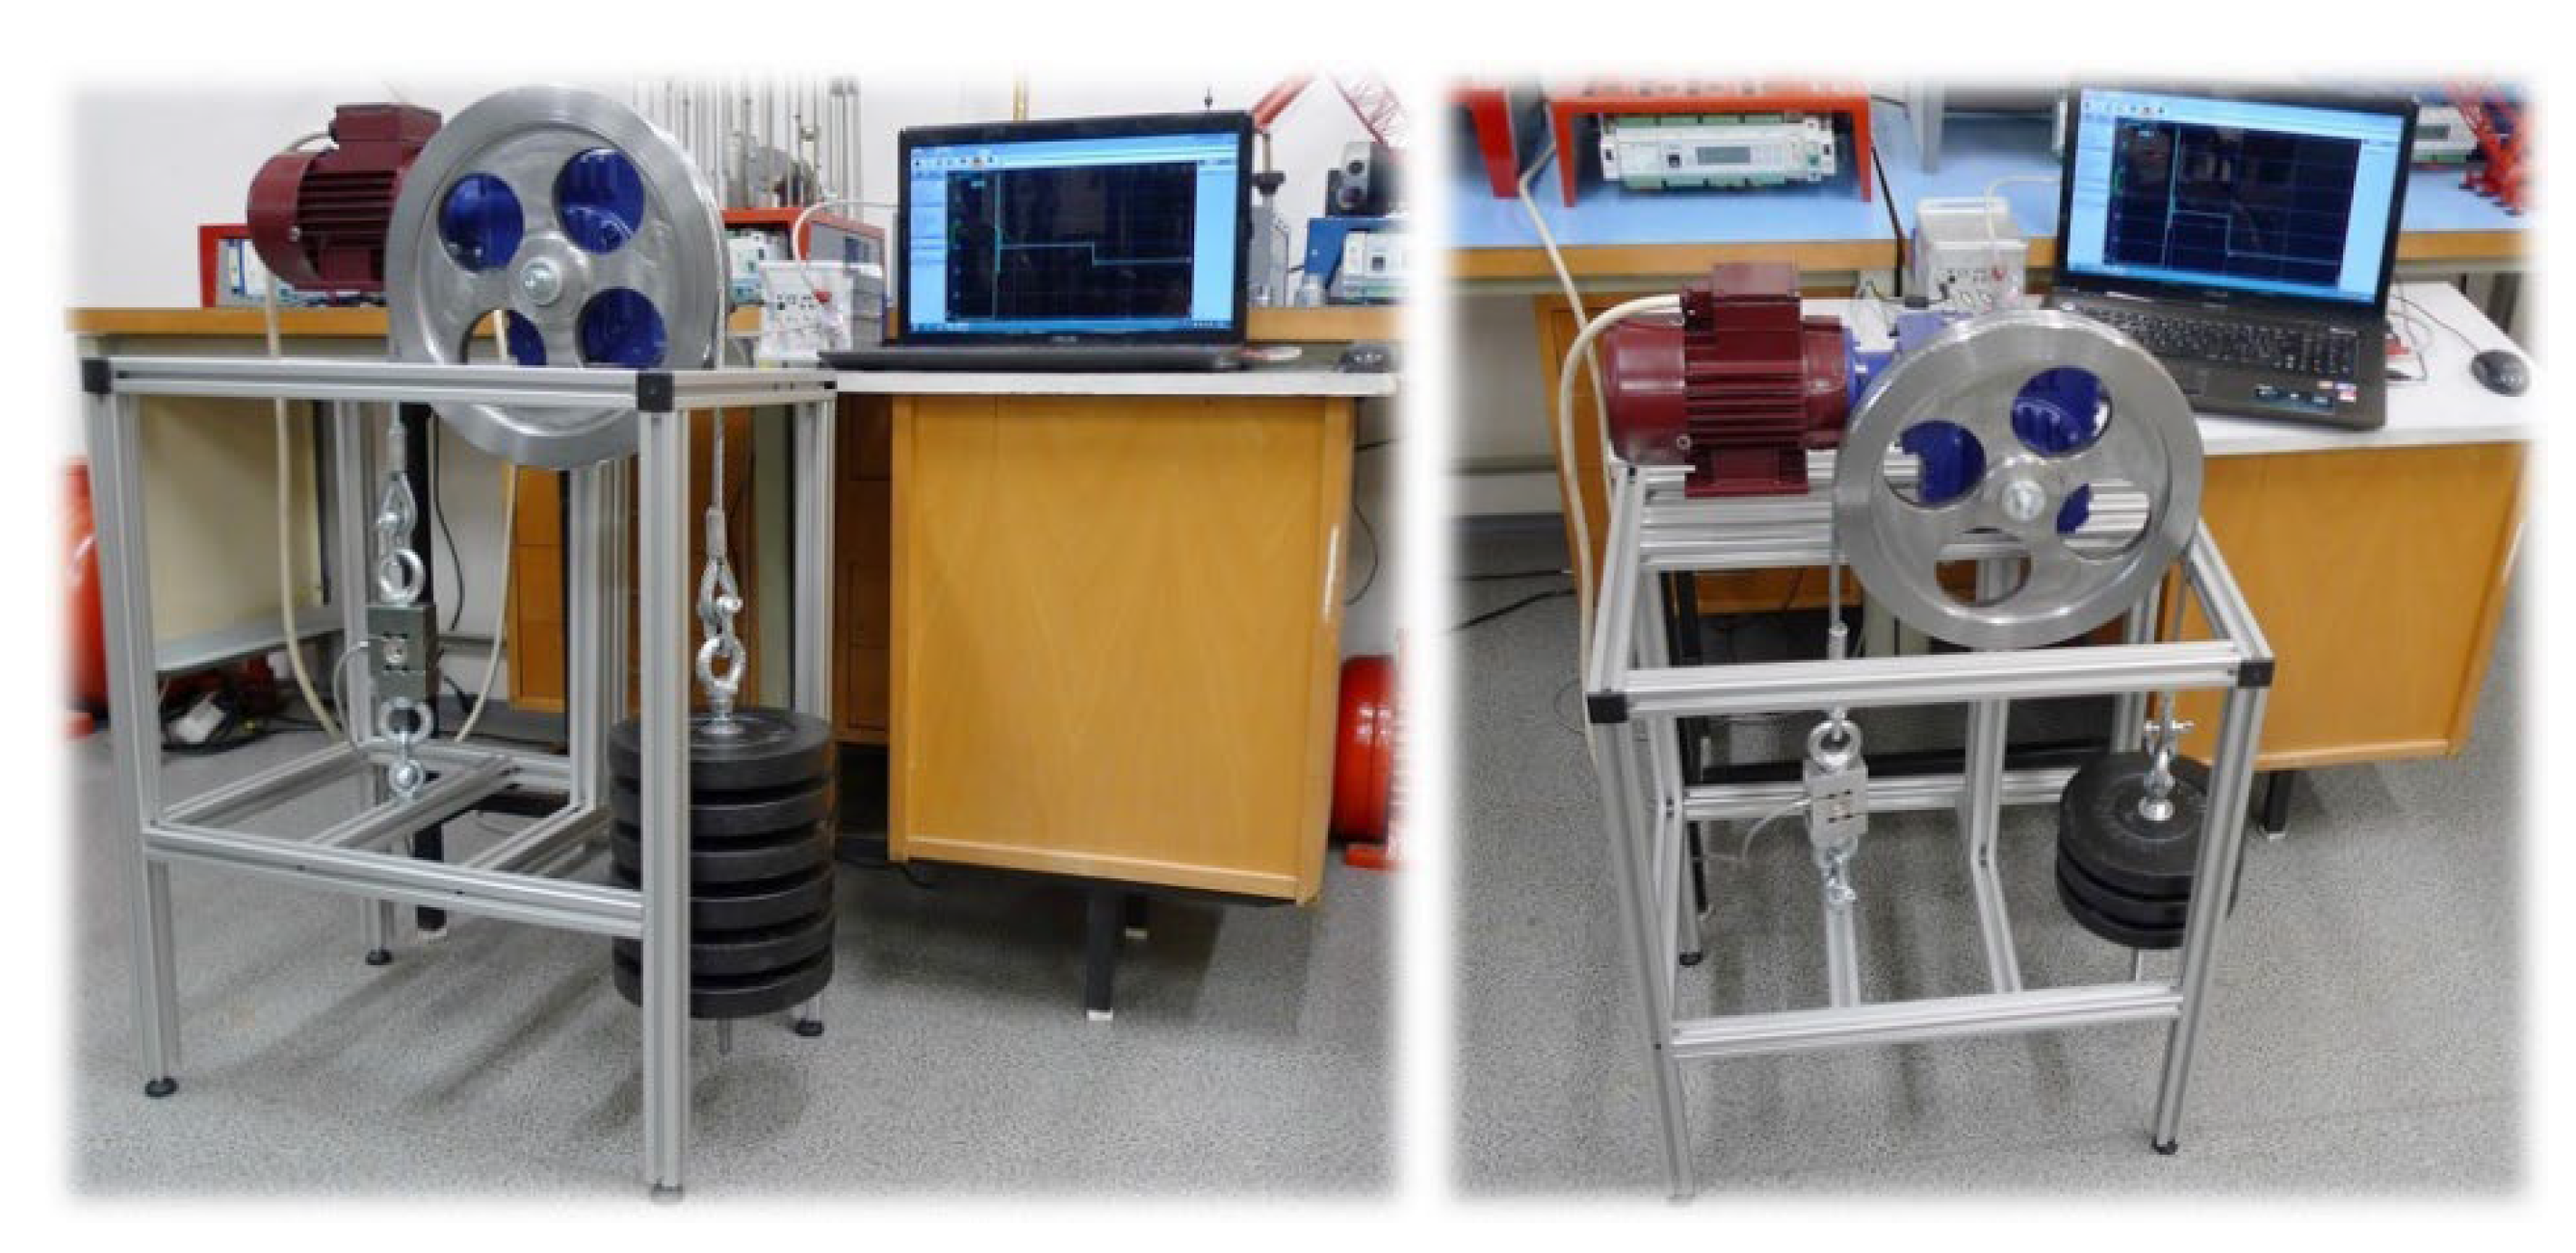
32]. To determine the actual value of the friction coefficient in the semi-circular and V-shaped grooves of a rope sheave, a laboratory machine was designed and constructed (see
Figure 1) on which the amount of tensile force F
Mi(i) [N]) can be determined for that side of the rope that is approaching the sheave.
This laboratory device, see
Figure 1, designed and built in the Department of Machine and Industrial Design at the Faculty of Mechanical Engineering, VSB-Technical University of Ostrava), has a rope sheave
4, placed to the gearbox output shaft
3 (fixed by bolts to the aluminium frame structure
1), driven by electro-gearbox. This electro-gearbox is assembled from a worm gearbox
3 (type aC-63 [
33], gear ratio i
p = 31.5) and electromotor
2 (type 4AP71-4 [
33], performance P
e = 370 W, revolutions n
e = 1370 min
−1, rating moment M
e = 2.58 N·m).
The V-shaped (with the dihedral angle γ = 35 deg) or semi-circular grove (with the dihedral angle γ = 40 deg) of the rope sheave
4 having the pitch diameter of the grooves D = 320 mm for the laboratory machine is the wrapped (angle of wrap λ = 180 deg) steel rope
5 with a nominal diameter d
L = 6 (or 8) mm, rope type according to [
34] 6 (8) 6 × 7 + WSC 1960 B sZ.
The end of rope
5 is on the approaching side of the sheave
4 fixed using the strain gauge load sensor (type RSCC 500 kg [
35])
6 mounted to the frame structure
1. To the end of rope
5 on the departing side of the rope sheave
4, the weight is suspended
7.
On a laboratory machine, see
Figure 1, to obtain the actual value of the friction coefficient of the rope in the semi-circular or V-shaped groove of the rope sheave under two operating limits (clean and dry and with groove walls contaminated with the oil), the following experimental measurements were carried out:
(a) with not rotating (i.e., no electricity was supplied to the terminals of the driving electric motor 2) rope sheave 4, to the right side of the rope, the tensile force Gz [N] was gradually increased. The instantaneous magnitude of the tensile force Gz is defined by the number of weights nz [ks], with the one-piece weight of mz [kg], which are suspended on a rope 5 at any given moment.
Due to the resistance that is put up to the steel rope
5 when it slides over a rounded surface (angle of wrap λ [deg]) rope sheave groove
4 (i.e., fibre friction), there is a decrease in the magnitude of the tensile force in the left side of the rope, dropping to the force F
M1(i) [N]. According to the mathematically modified Euler’s relation (1) [
1], the theoretical magnitude of the acting tensile force F
M1T [N] can be calculated for the left side of the rope if f
T [-] is the friction coefficient in the groove of the rope sheave.
From the experimental measurements, at a known magnitude of the tensile force on the right side of the rope
5 (i.e., the weightiness of weights G
z [N]), the applied force F
M1(i) [N] was recorded for the left side of the rope
5, which was detected by a strain gauge sensor
6. By modifying the relationship (1), at known values of λ [deg], G
z [N] and F
M1T [N], the coefficient of friction f
Mi = f
T [-] was calculated in the V-shaped groove of the rope sheave, see [
27].
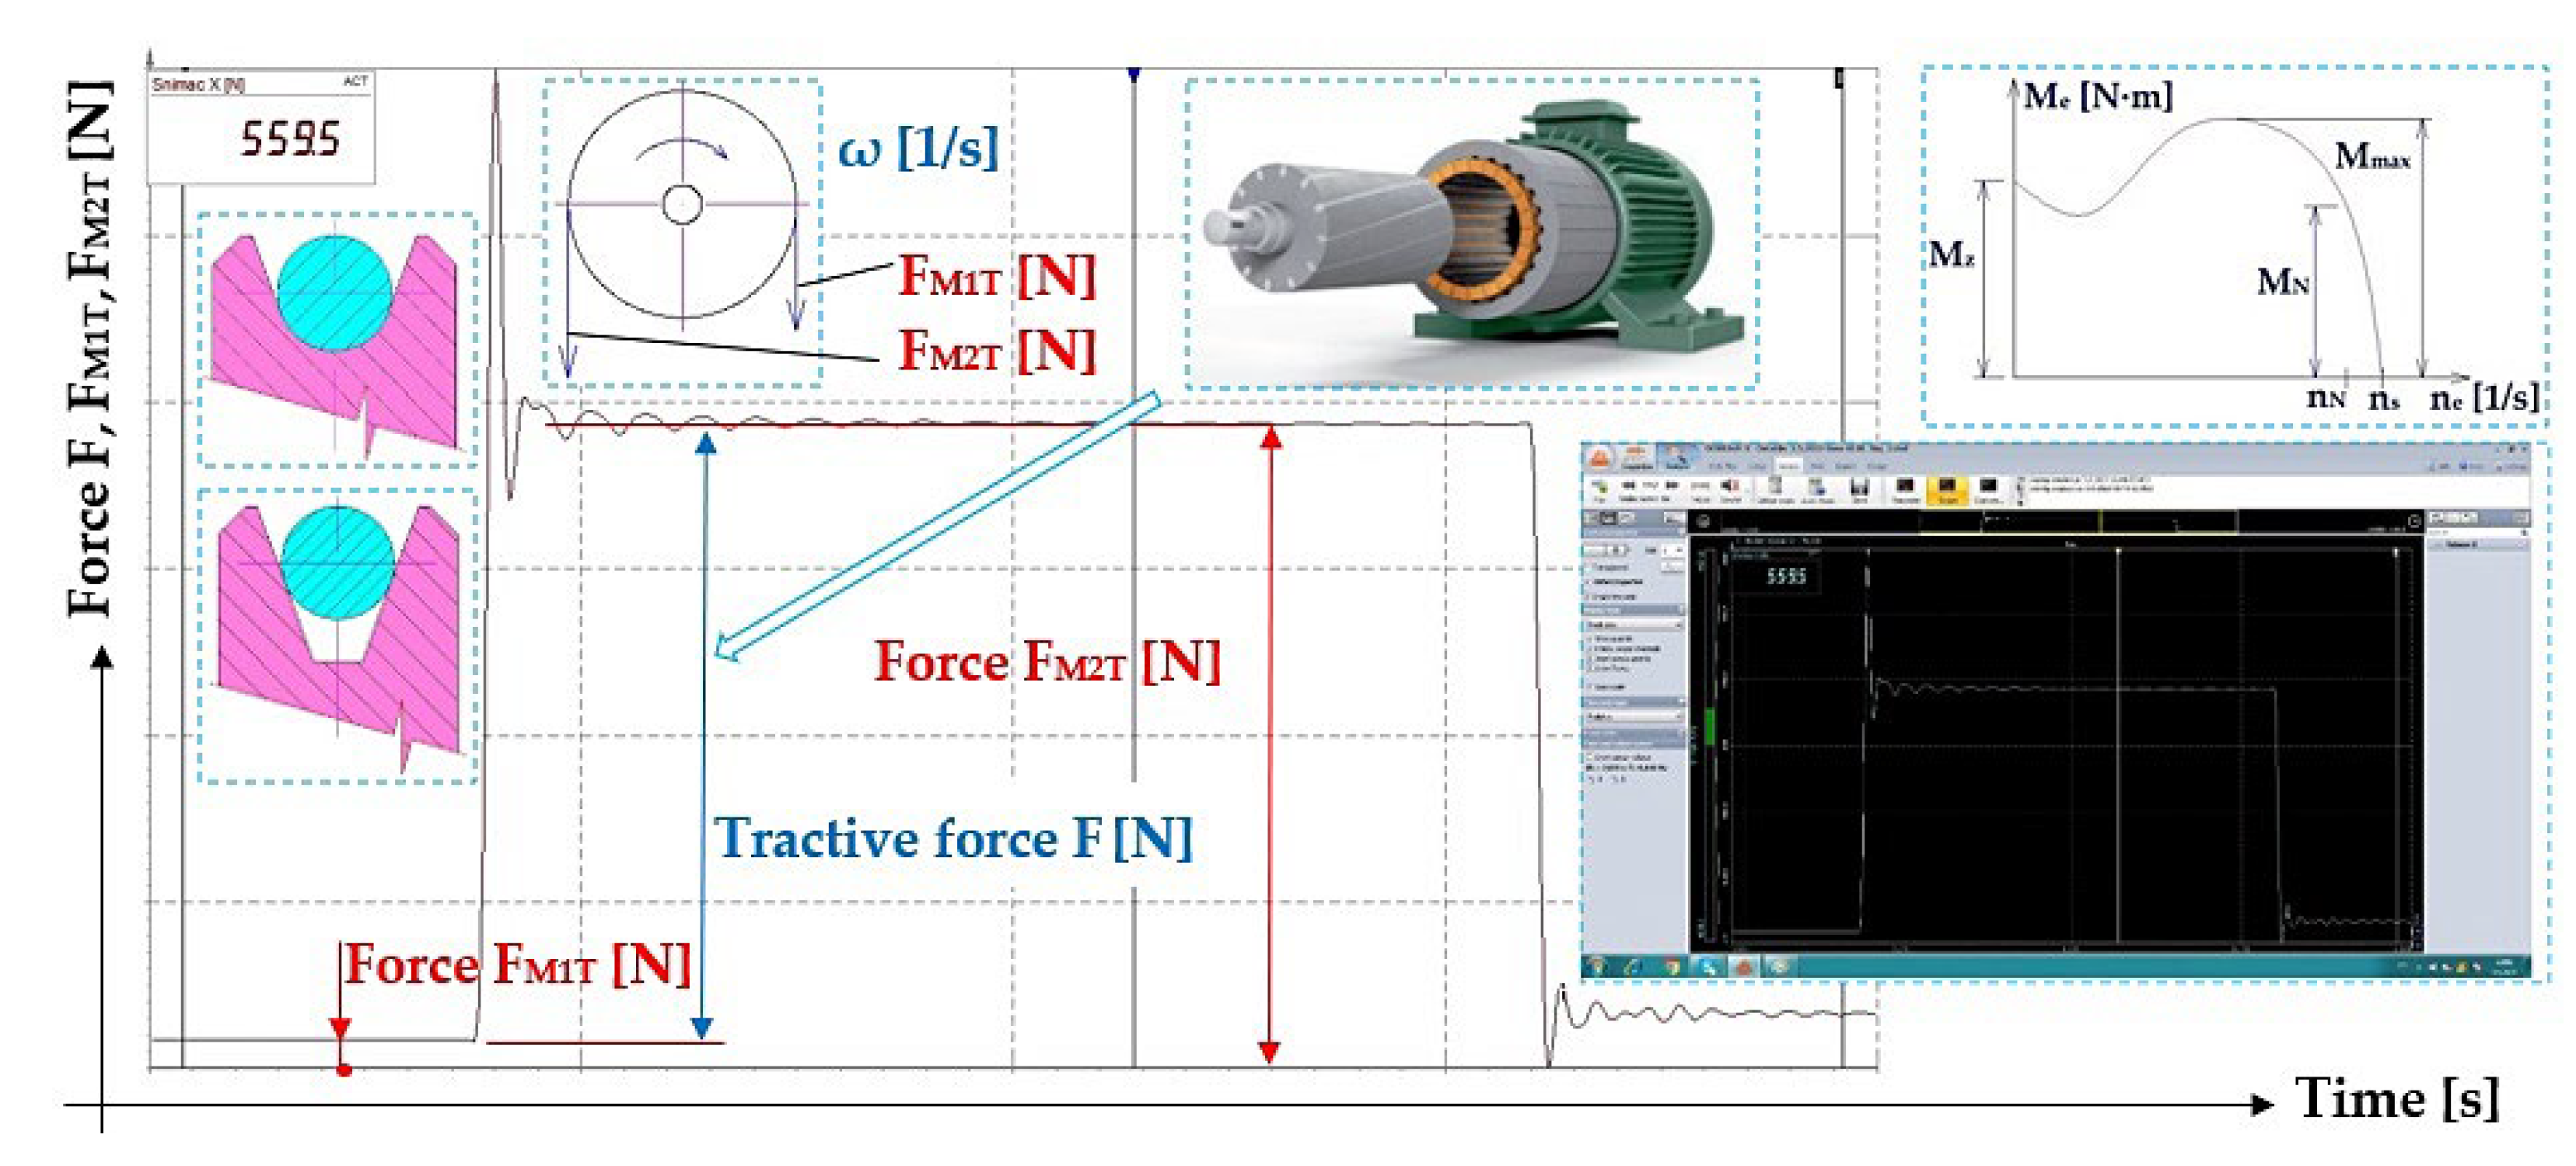
When the rope sheave 4 starts to rotate in the desired direction, and the tensile force Gz [N] gradually increases on the right (i.e., departing) side of the rope, the instantaneous magnitude of the generated force FM2(i) [N] was recorded in the left (i.e., approaching) side of the rope 5 to the rope sheave 4 of the laboratory machine.
Due to the resistance that is put up to the steel rope
5 when the rope is skidding on a rounded surface (angle of wrap λ [deg]) of the rope sheave groove
4 (fibre friction), at a known magnitude of the gravitational force G
z [N] in the right side of the rope when the electro motor is revolving
2 reaching the rated engine speed n
e [min
−1], the magnitude of the force F
M2(i) [N] acting in the left side of the rope is growing. According to the relationship (2), it is possible to calculate the theoretical magnitude of the acting tensile force F
M2T [N] on the left side of the rope.
From the provided experimental measurements, at a known magnitude of tensile force on the right side of the rope 5 (i.e., weights Gz [N]), the applied force FM2(i) [N] was recorded for the left side of the rope 5, which was detected using a strain gauge sensor 6. From a mathematically modified relationship (2), there were, at known values of λ [deg], Gz [N] and FM2(i) [N], the values of friction coefficient f2(i) [-] calculated, and these were listed in the tables stated below.
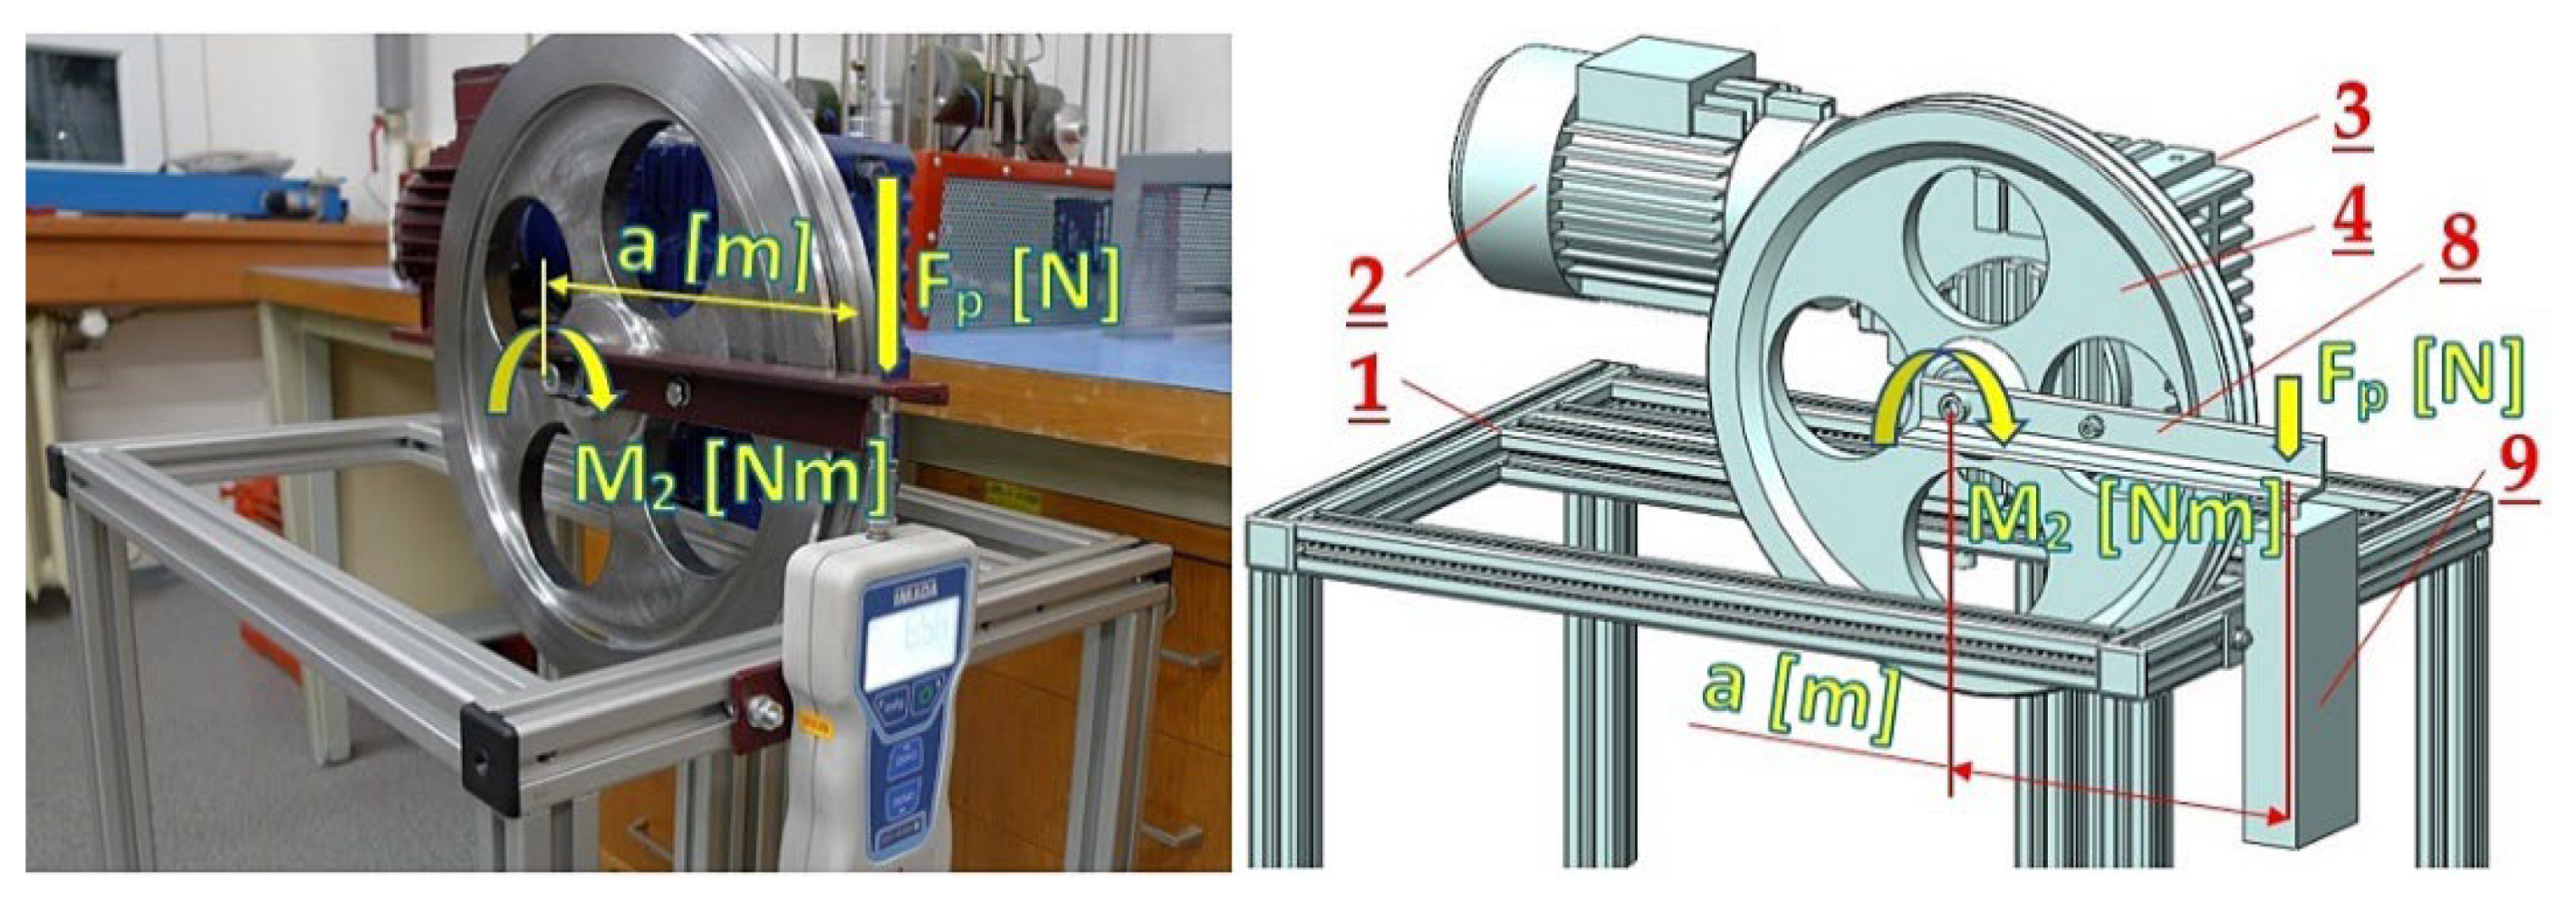
To obtain the most accurate value of the applied torque M
2(i) [N·m] on the shaft of the rope sheave 4 when starting the drive (i.e., when the sheave starts to spin) of the laboratory device, additional experimental measurements were carried out. In these experimental measurements, the lever
8 with the arm length of a [m], see
Figure 2, is mechanically fixed to the rope sheave
4.
The end part of lever
8 was positioned by rotating the rotor of the electric motor manually
2 to be in contact with the tip of the force gauge
9 (type IMADA DST-1000 [
36]). To the terminals, connected to the star, of the electric motor
2 for the laboratory device drive, AC voltage 3 × 380 V was supplied, exciting the actual moment of engagement M
2(i) [N·m]. Moment M
2(i) [N·m] on the shaft of the sheave
4 generated, via lever
8 on the sensor tip of the force gauge
9 (type IMADA DST-1000 [
36]), pushing force F
p(i) [N]. Actual torque M
2(i) [N·m] for the drive of the laboratory device was determined as the product of the measured magnitude of force F
p(i) [N] obtained using a force gauge
9 and lever arm a = 212 mm
8. For n = 10 repeated measurements, the values of the measured force F
p(i) [N] and calculated torque M
2(i) [N·m] are listed in
Table 1.
Theoretical torque magnitude M
2T [N·m] (
Figure 3) acting on the shaft of the rope sheave
4 can be expressed using the relationship (3), for the revolving rotor of the electric motor
2 with the rated engine speed of n
e = 22.8 s
−1, if the gear ratio i
p [-] for the gearbox
3 is known, together with rated torque M
e [N·m] of the electric motor
2 and overall efficiency of the drive η
c [-].
From
Figure 3 it can be found that the instantaneous magnitude of the tensile force acting on the left side of the rope
5 (i.e., approaching force) F
N [N] in the sheave is given by the sum of the instantaneous value of the tractive force F [N] on the perimeter of the rope sheave groove and the magnitude of the tensile force in the right side of the rope F
o [N] (i.e., departing force of rope sheave
4), which corresponds to the instantaneous weightiness of the weight G
z (i.e., a given number of weights suspended in the departing side of the rope sheave).
The instantaneous magnitude of circumferential force F [N] in the groove of the rope sheave is proportional to the diameter of the rope sheave D [m] and the torque size M2(i) [N·m] on the shaft of the rope sheave 4. If the driving electric motor 2 rotates at rated speed ne [min−1], the magnitude of torque M2T [N·m] on the shaft of the rope sheave 4 describes the relationship (3). The theoretical magnitude of the tractive force on the circumference of the rope sheave groove can be expressed by F = 2·M2T/D [N].
At the starting moment (ne = 0 min−1) of the driving electric motor 2, the electromotor generates the engagement torque Mz [N·m]. The theoretical magnitude of the tractive force at the perimeter of the rope sheave groove can be expressed as F = 2·Mz·ip/D [N].
3. Results
Rope
5 with the diameter d
L [m], guided by a rope disc groove
4, was during experimental measurements carried out on a laboratory machine (see
Figure 1) loaded on the right side of the rope by a predefined weight G
z [N]. The loose end of rope
5 was fixed to the right side of the rope using strain gauge sensor
6 [
36]. Connecting an electric motor 2 to electricity, on the perimeter of the rope sheave groove
4 circumferential force was generated, which showed a tendency to carry the rope due to friction
5 via the groove of the sheave
4. As the left side of rope
5 is fixed to frame
1 of the laboratory machine, the friction force grows (at the moment the electric motor starts to revolve) in the contact area of the rope and the groove walls. At the moment when the amount of the circumferential force in the groove of the rope sheave reaches the value of the friction force, the rope sheave begins to rotate (stable rope rubs the walls of the moving sheave walls). The value of tractive force F
M2(i) [N] acting on the right side of the rope were monitored during the experiment by a strain gauge sensor
6, recorded using measuring apparatus DS NET and displayed using DEWESoft software on the display and then stored on the disk of a PC [
18]. From the values obtained by measuring the tensile forces on both sides of the rope F
M2(i) [N] and G
z [N] (see
Table 2) and the angle of wrap λ [deg] provided to the rope by a sheave groove and using the Euler’s formula the coefficient of friction f
2(i) [-] was calculated.
In the following
Section 3.1,
Section 3.2,
Section 3.3,
Section 3.4,
Section 3.5,
Section 3.6,
Section 3.7 and
Section 3.8, obtained values of tensile forces for both sides of the rope F
M2(i) [N] and G
z [N] carried out for different rope diameter d
L [m], rope sheave groove type, and contamination status of the contact surfaces of the groove and rope are presented. Values recorded in measurements are presented in the figures, see
Section 3.1,
Section 3.2,
Section 3.3,
Section 3.4,
Section 3.5,
Section 3.6,
Section 3.7 and
Section 3.8. Nevertheless, due to the space limitation of this paper, these are listed for only one series of measurements. In the case of interest or need, we can submit complete data and graphic recordings for the measured tensile forces F
M2(i) [N] on the left side of the rope.
3.1. Tensile Force in ϕ6 mm Rope, Semi-Circular Groove, Dry Surface
Table 2 presents the measured values of tensile forces F
M2(i) [N] on the approaching side of the rope
5 (d
L = 6 mm) to the sheave
4, where the surface of the semi-circular groove in contact with the steel rope is dry and clean.
By using Student’s t-distribution, following the procedure described in [
37], the arithmetic mean of the friction coefficient f
2 [-] was calculated for n = 5 under the same conditions for the repeated measurement for f
2(i) [-]. Also, the limiting error χ
a,n = t
α,n·
s [-] was calculated, where t
α,n [-] is Student’s t-distribution coefficient, α [-] risk (for α = 5% is t
α,n = t
5%,5 = 2.78) and
s [-] sampling standard deviation.
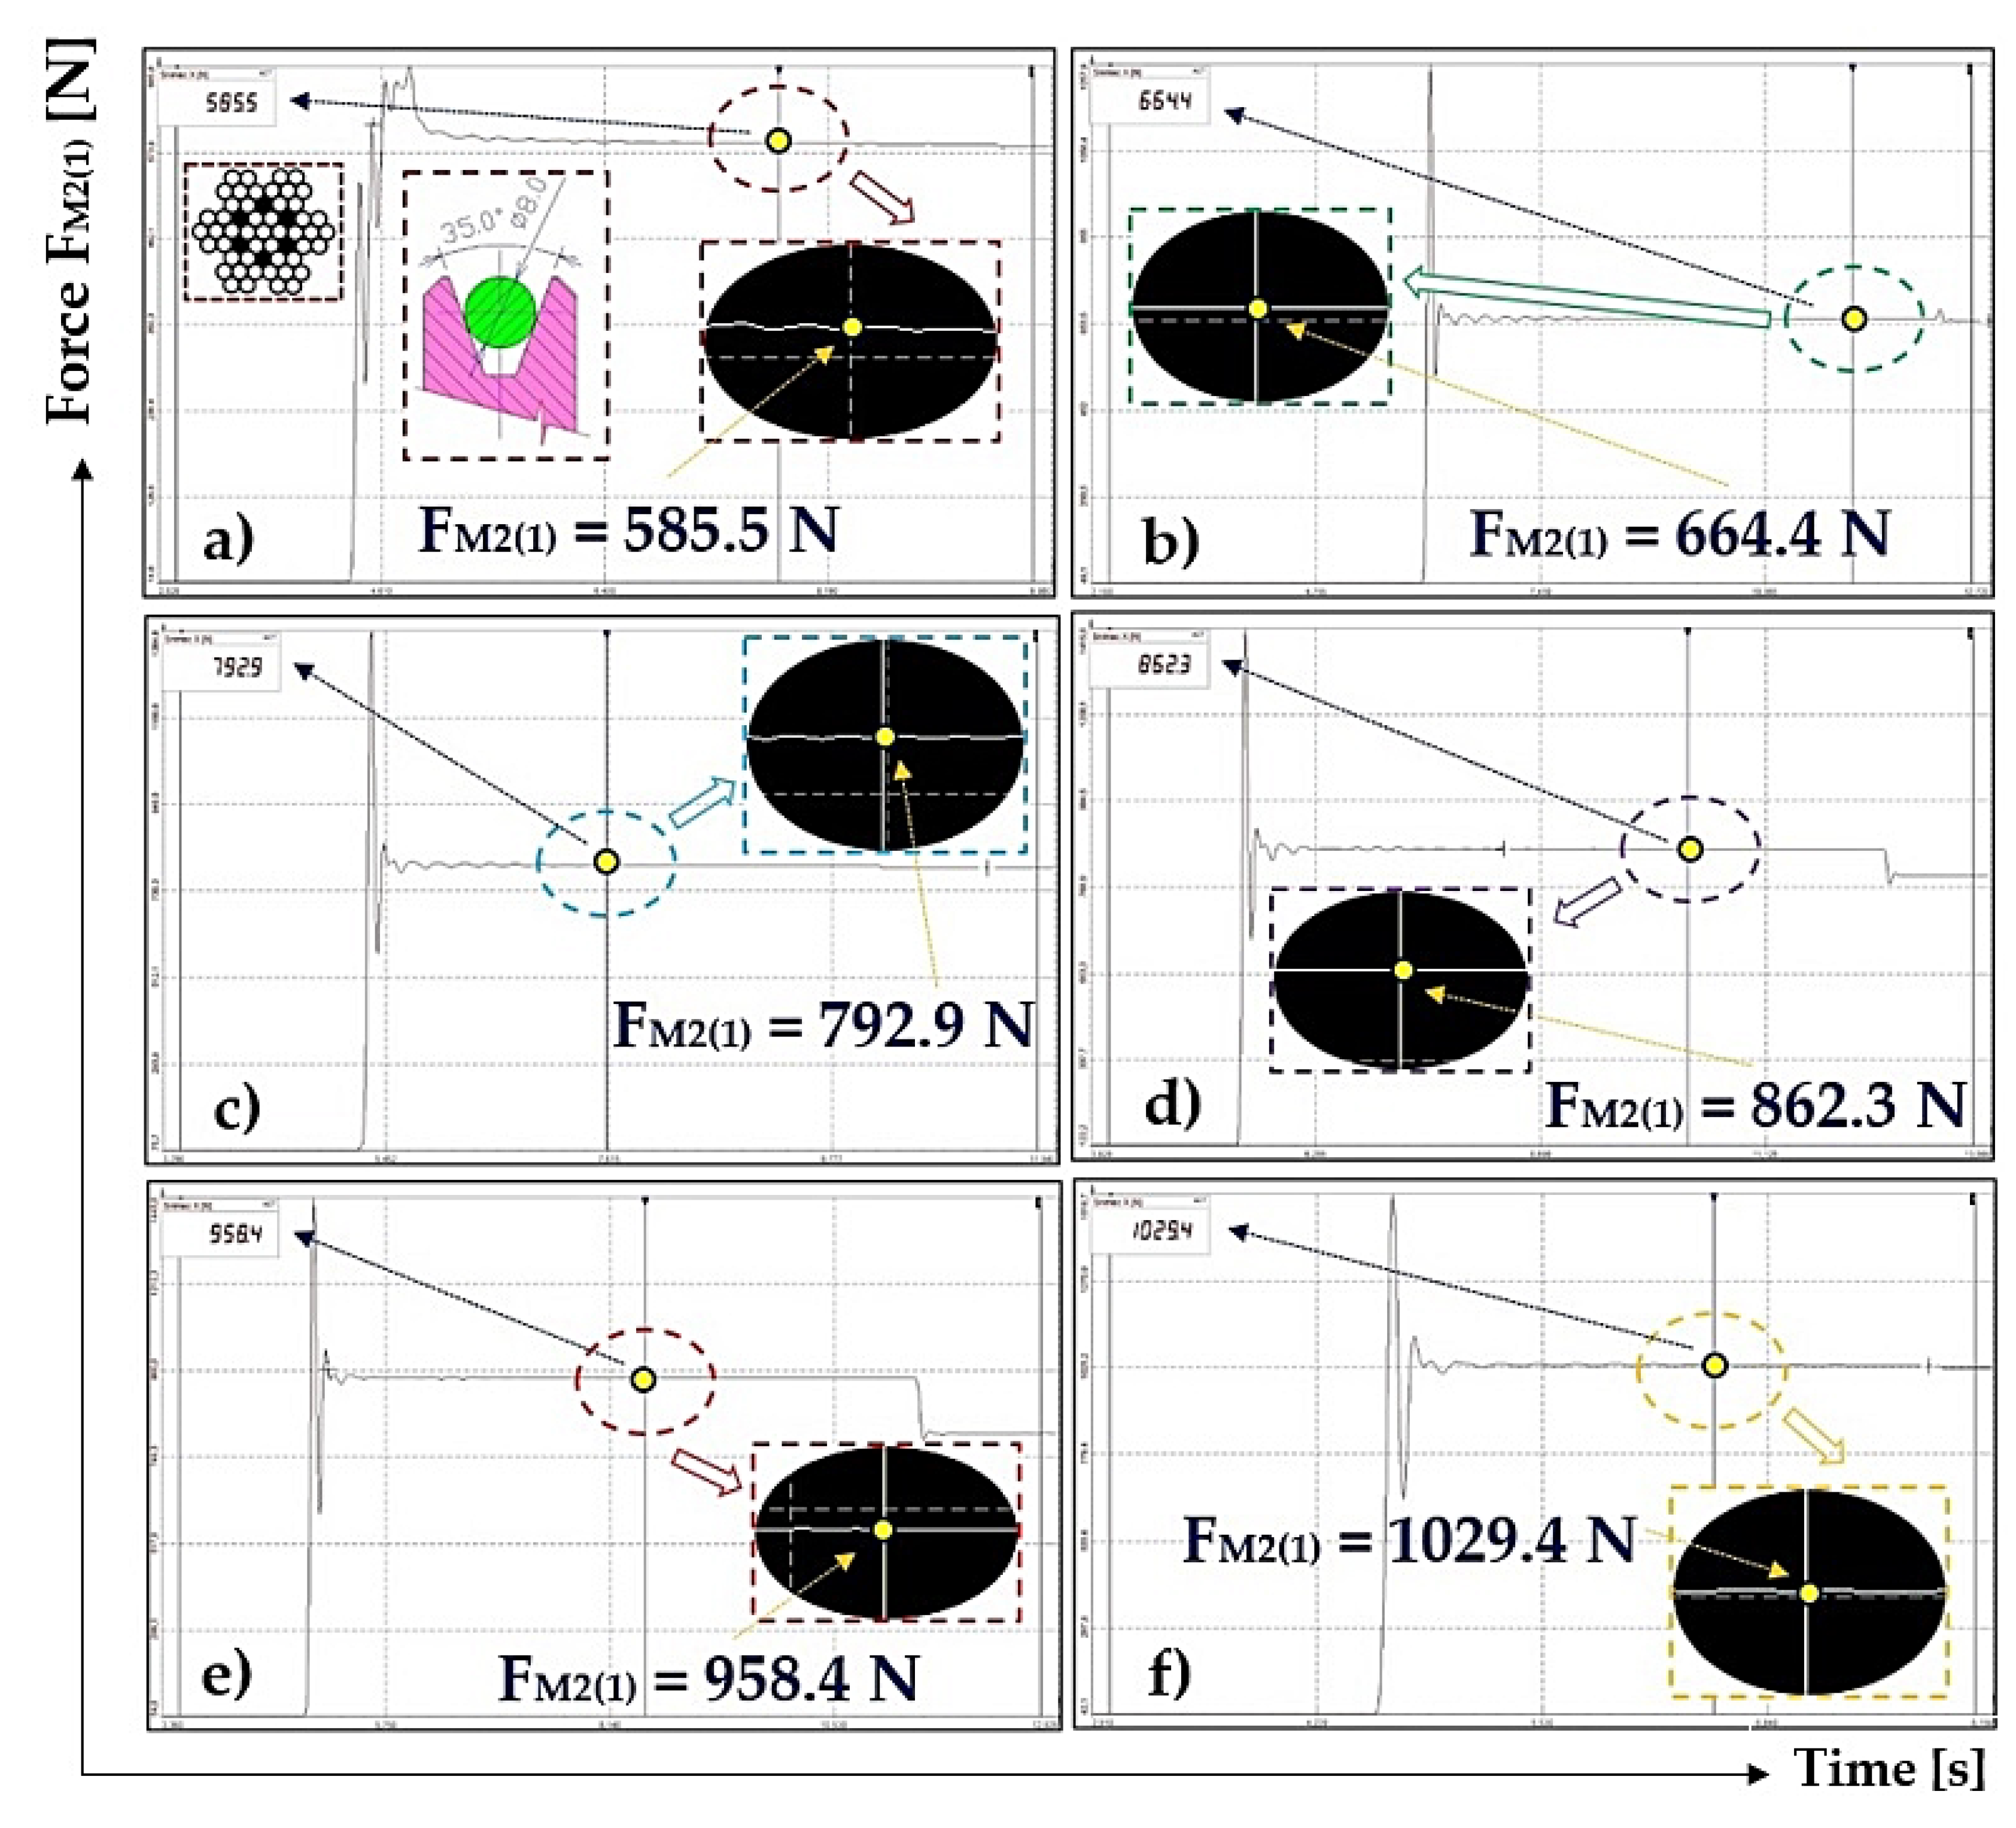
Figure 4 presents recordings from performed laboratory measurements of tensile force
FM2(1) [N], provided on a laboratory machine using measuring strain gauge apparatus DS NET and software DEWESoft X2 SP5 [
27].
Records of all other measured values FM2(i) [N] in this and the following tables are archived by the authors of the article and can be provided for further use on request.
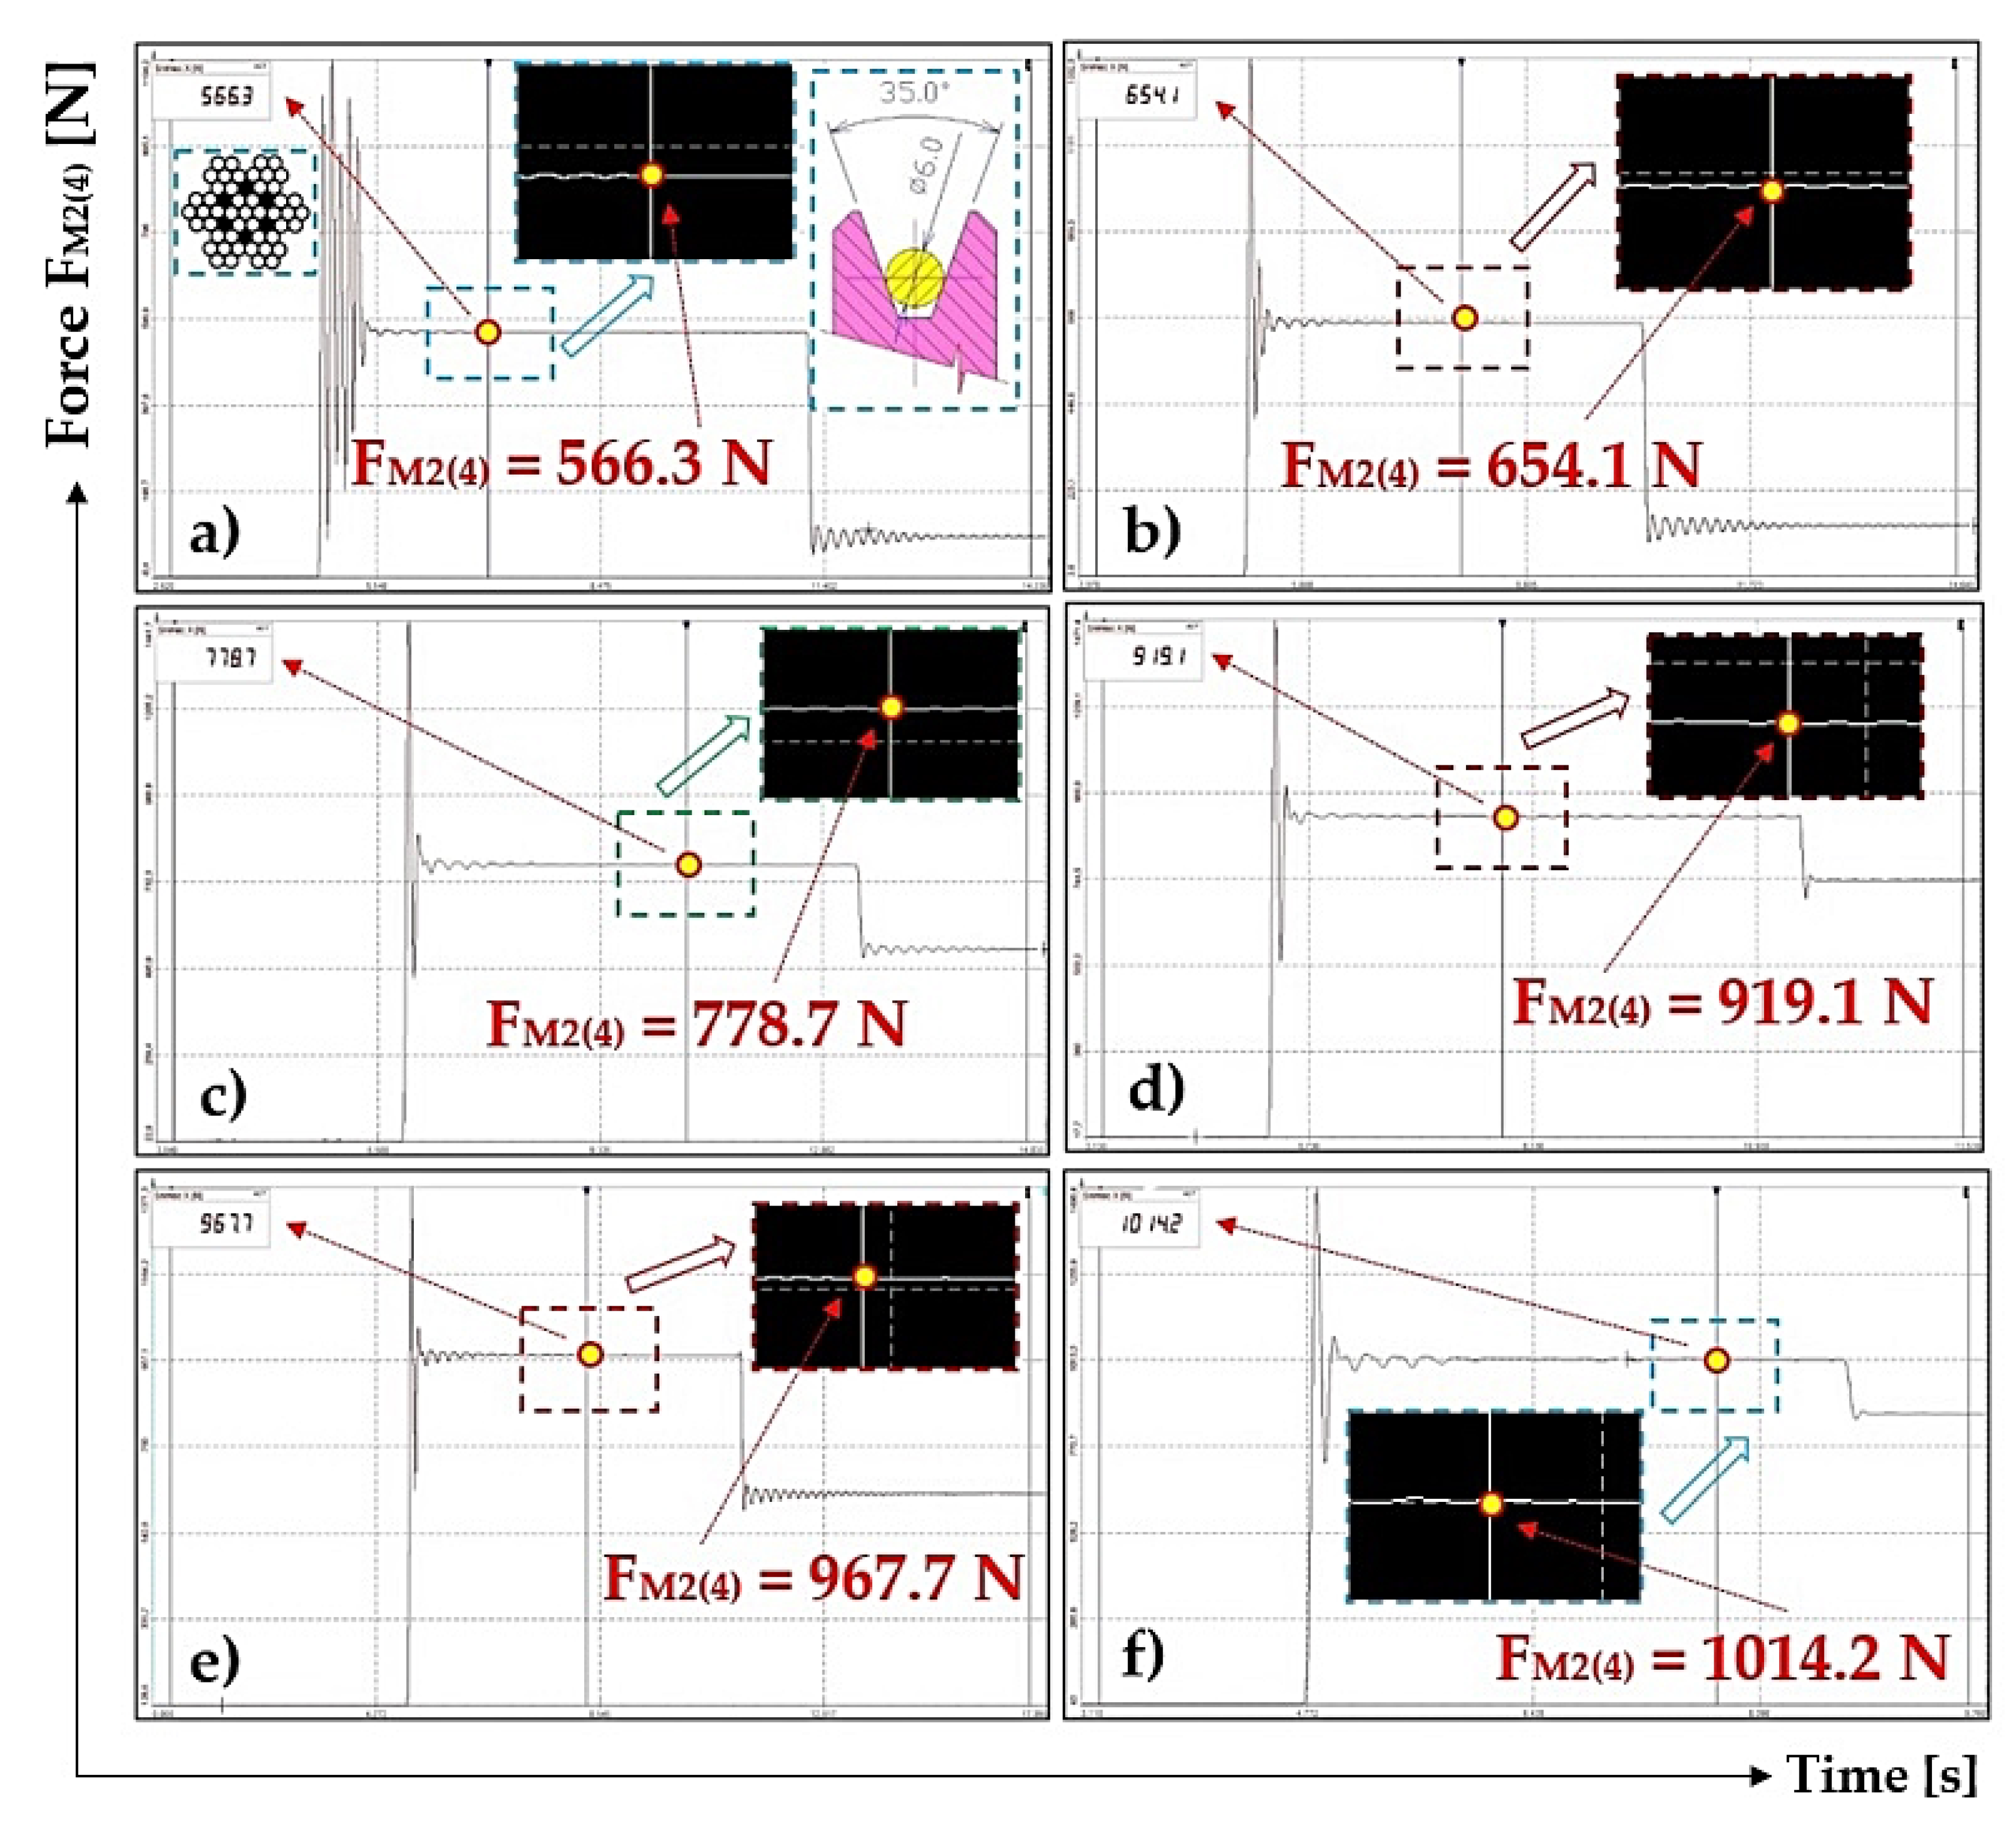
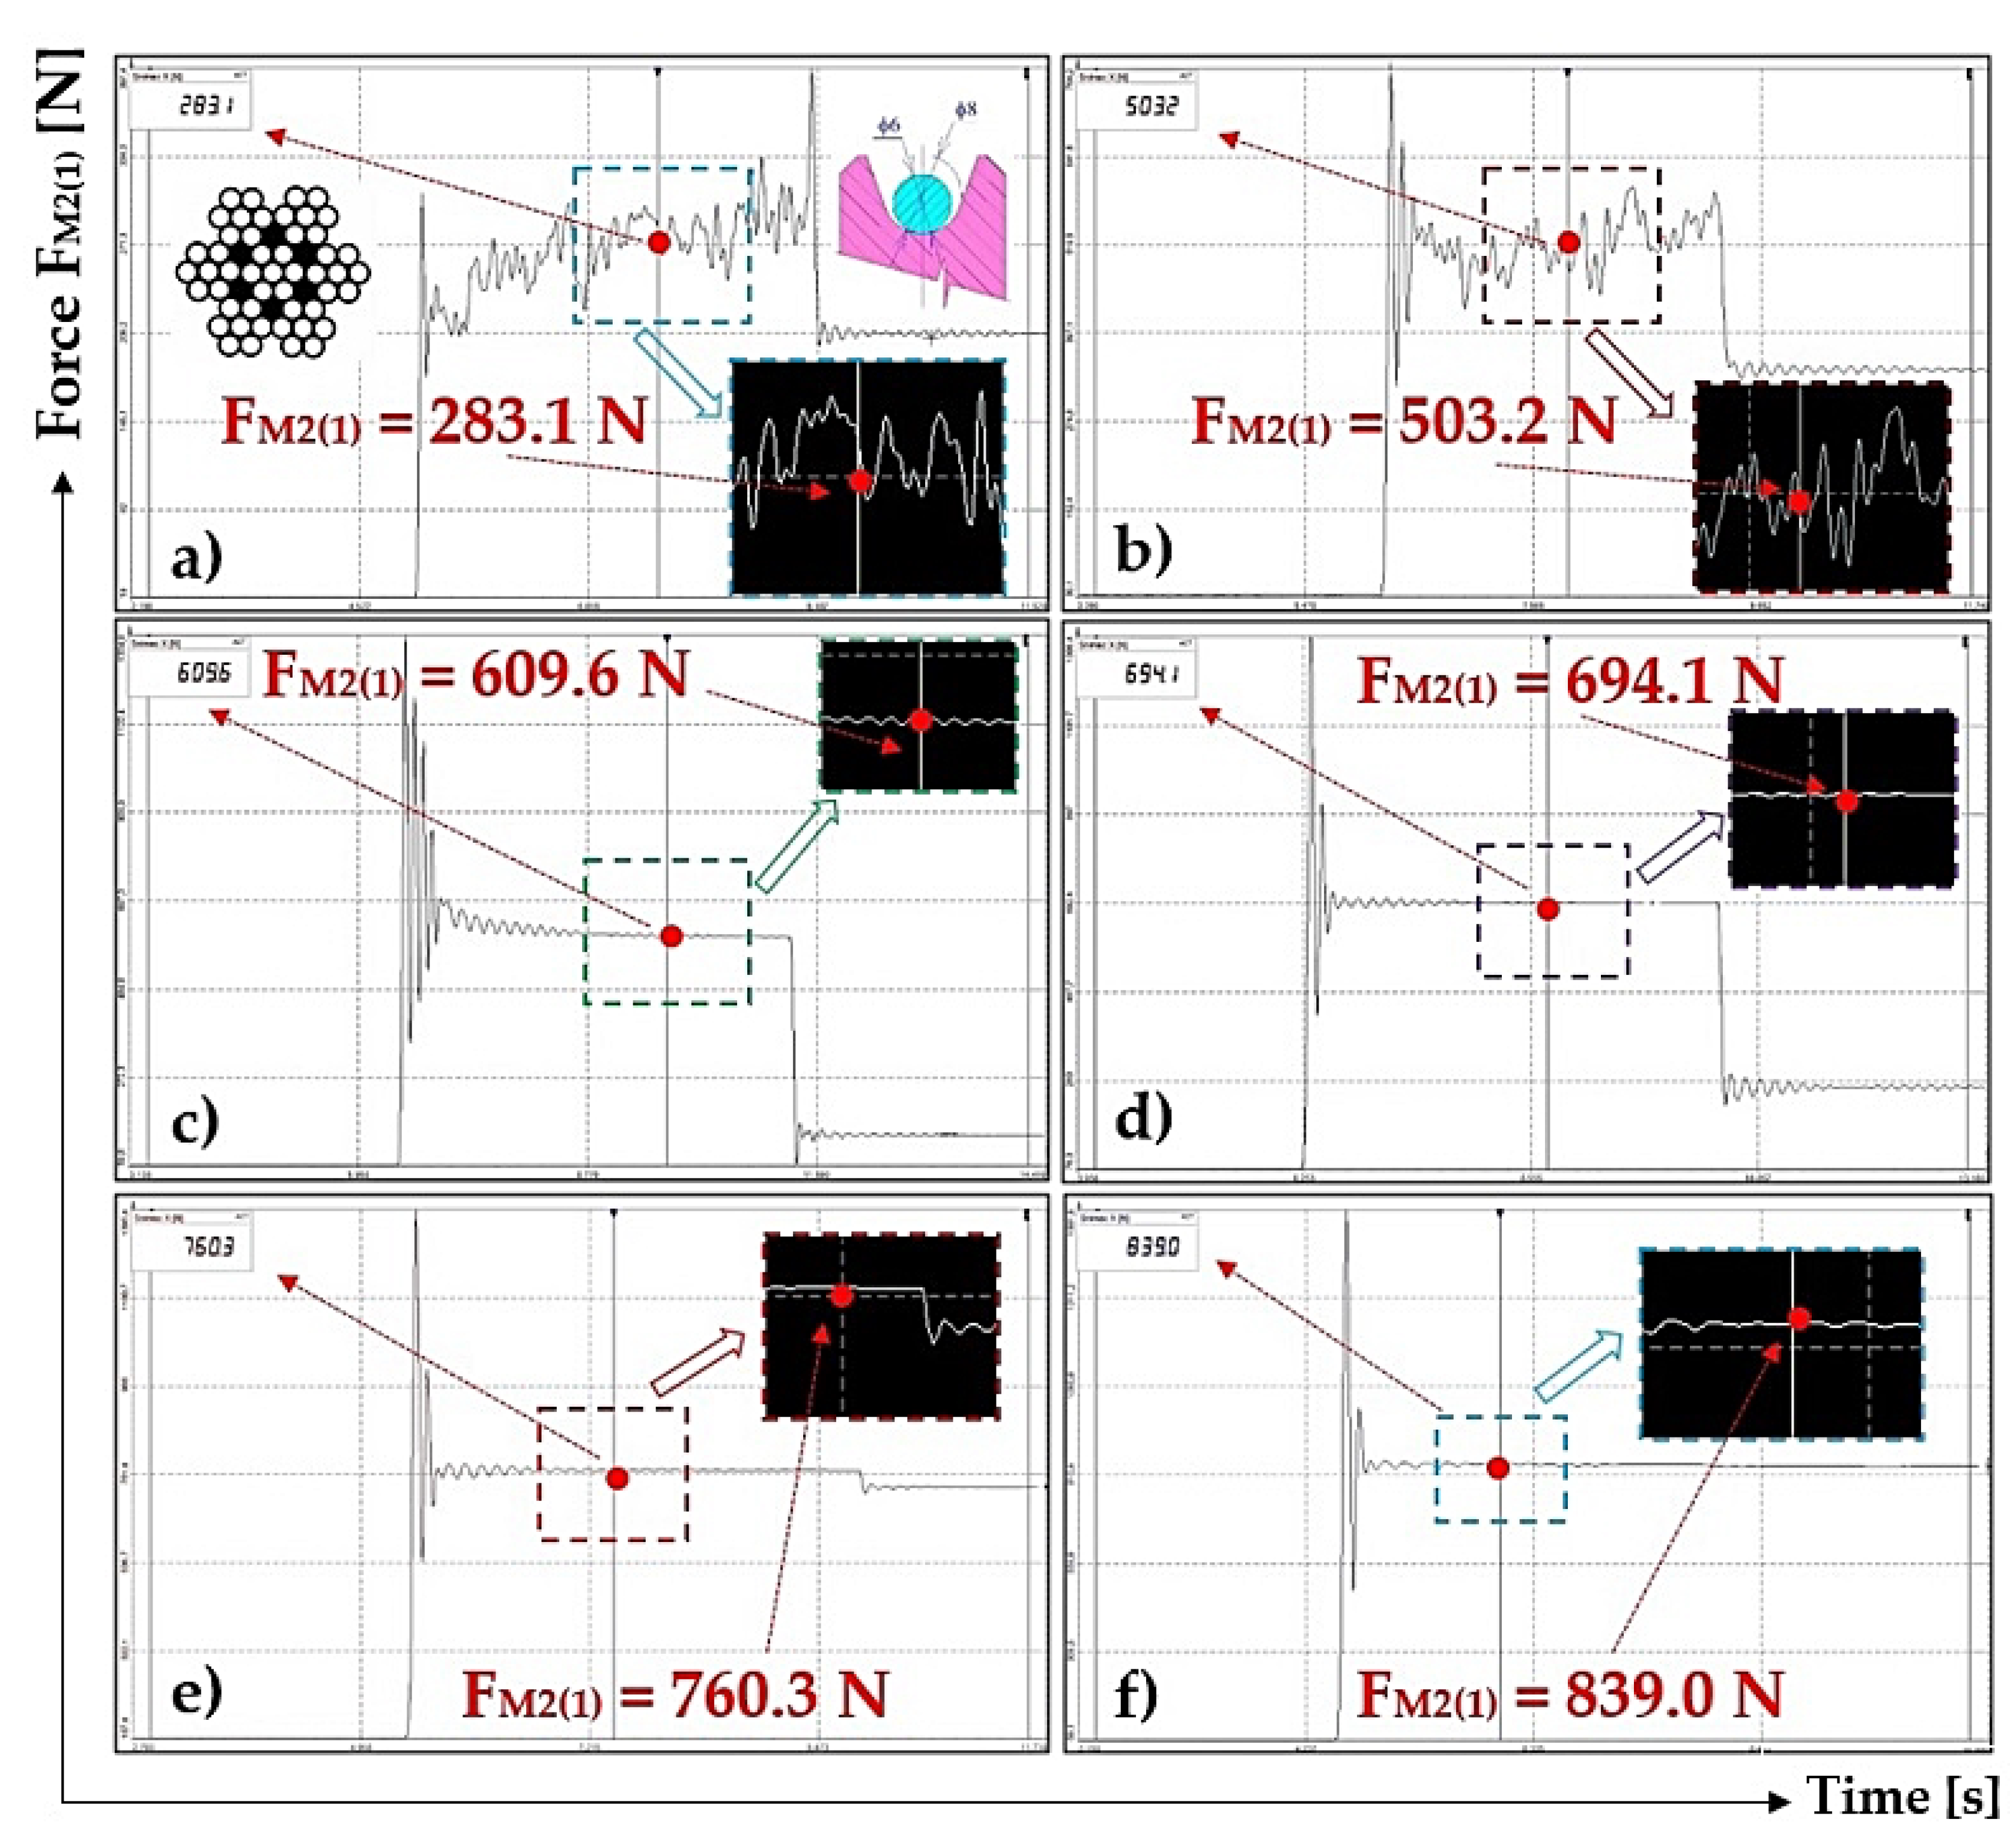
3.2. Tensile Force in ϕ8 mm Rope, Semi-Circular Groove, Dry Surface
Table 3 presents the measured values no. 1 to 5 of tensile forces F
M2(i) [N] on the approaching side of the rope
5 (diameter d
L = 8 mm) to the rope sheave
4, of which the semi-circular groove is dry and clean.
Table 4 shows measured values from no. 6 to 10 of tensile forces F
M2(i) [N] on the side of the rope
5 (diameter d
L = 8 mm) approaching the rope sheave
4, of which the semi-circular groove is dry and clean.
By using the Student’s t-distribution, using the procedure stated in [
37], the arithmetic mean of friction coefficient f
2 [-] has been calculated for n = 10 under the same conditions repeated measurements of values f
2(i) [-]. The results are given in
Table 4. The extreme error χ
a,n [N] was also calculated (for the risk α = 5%, the Student’s distribution coefficient is t
5%,10 = 2.26 [
5]).
3.3. Tensile Force in ϕ6 mm Rope, Semi-Circular Groove, Surface Contaminated with Oil
Table 5 displays measured values of tensile forces F
M2(i) [N] for the approaching side of the rope
5 (d
L = 6 mm) to the sheave
4, of which the semi-circular groove is dirty with oil. Gear oil SAE 80W, GL-4 [
38], produced by the Lavio company, was used for this measurement.
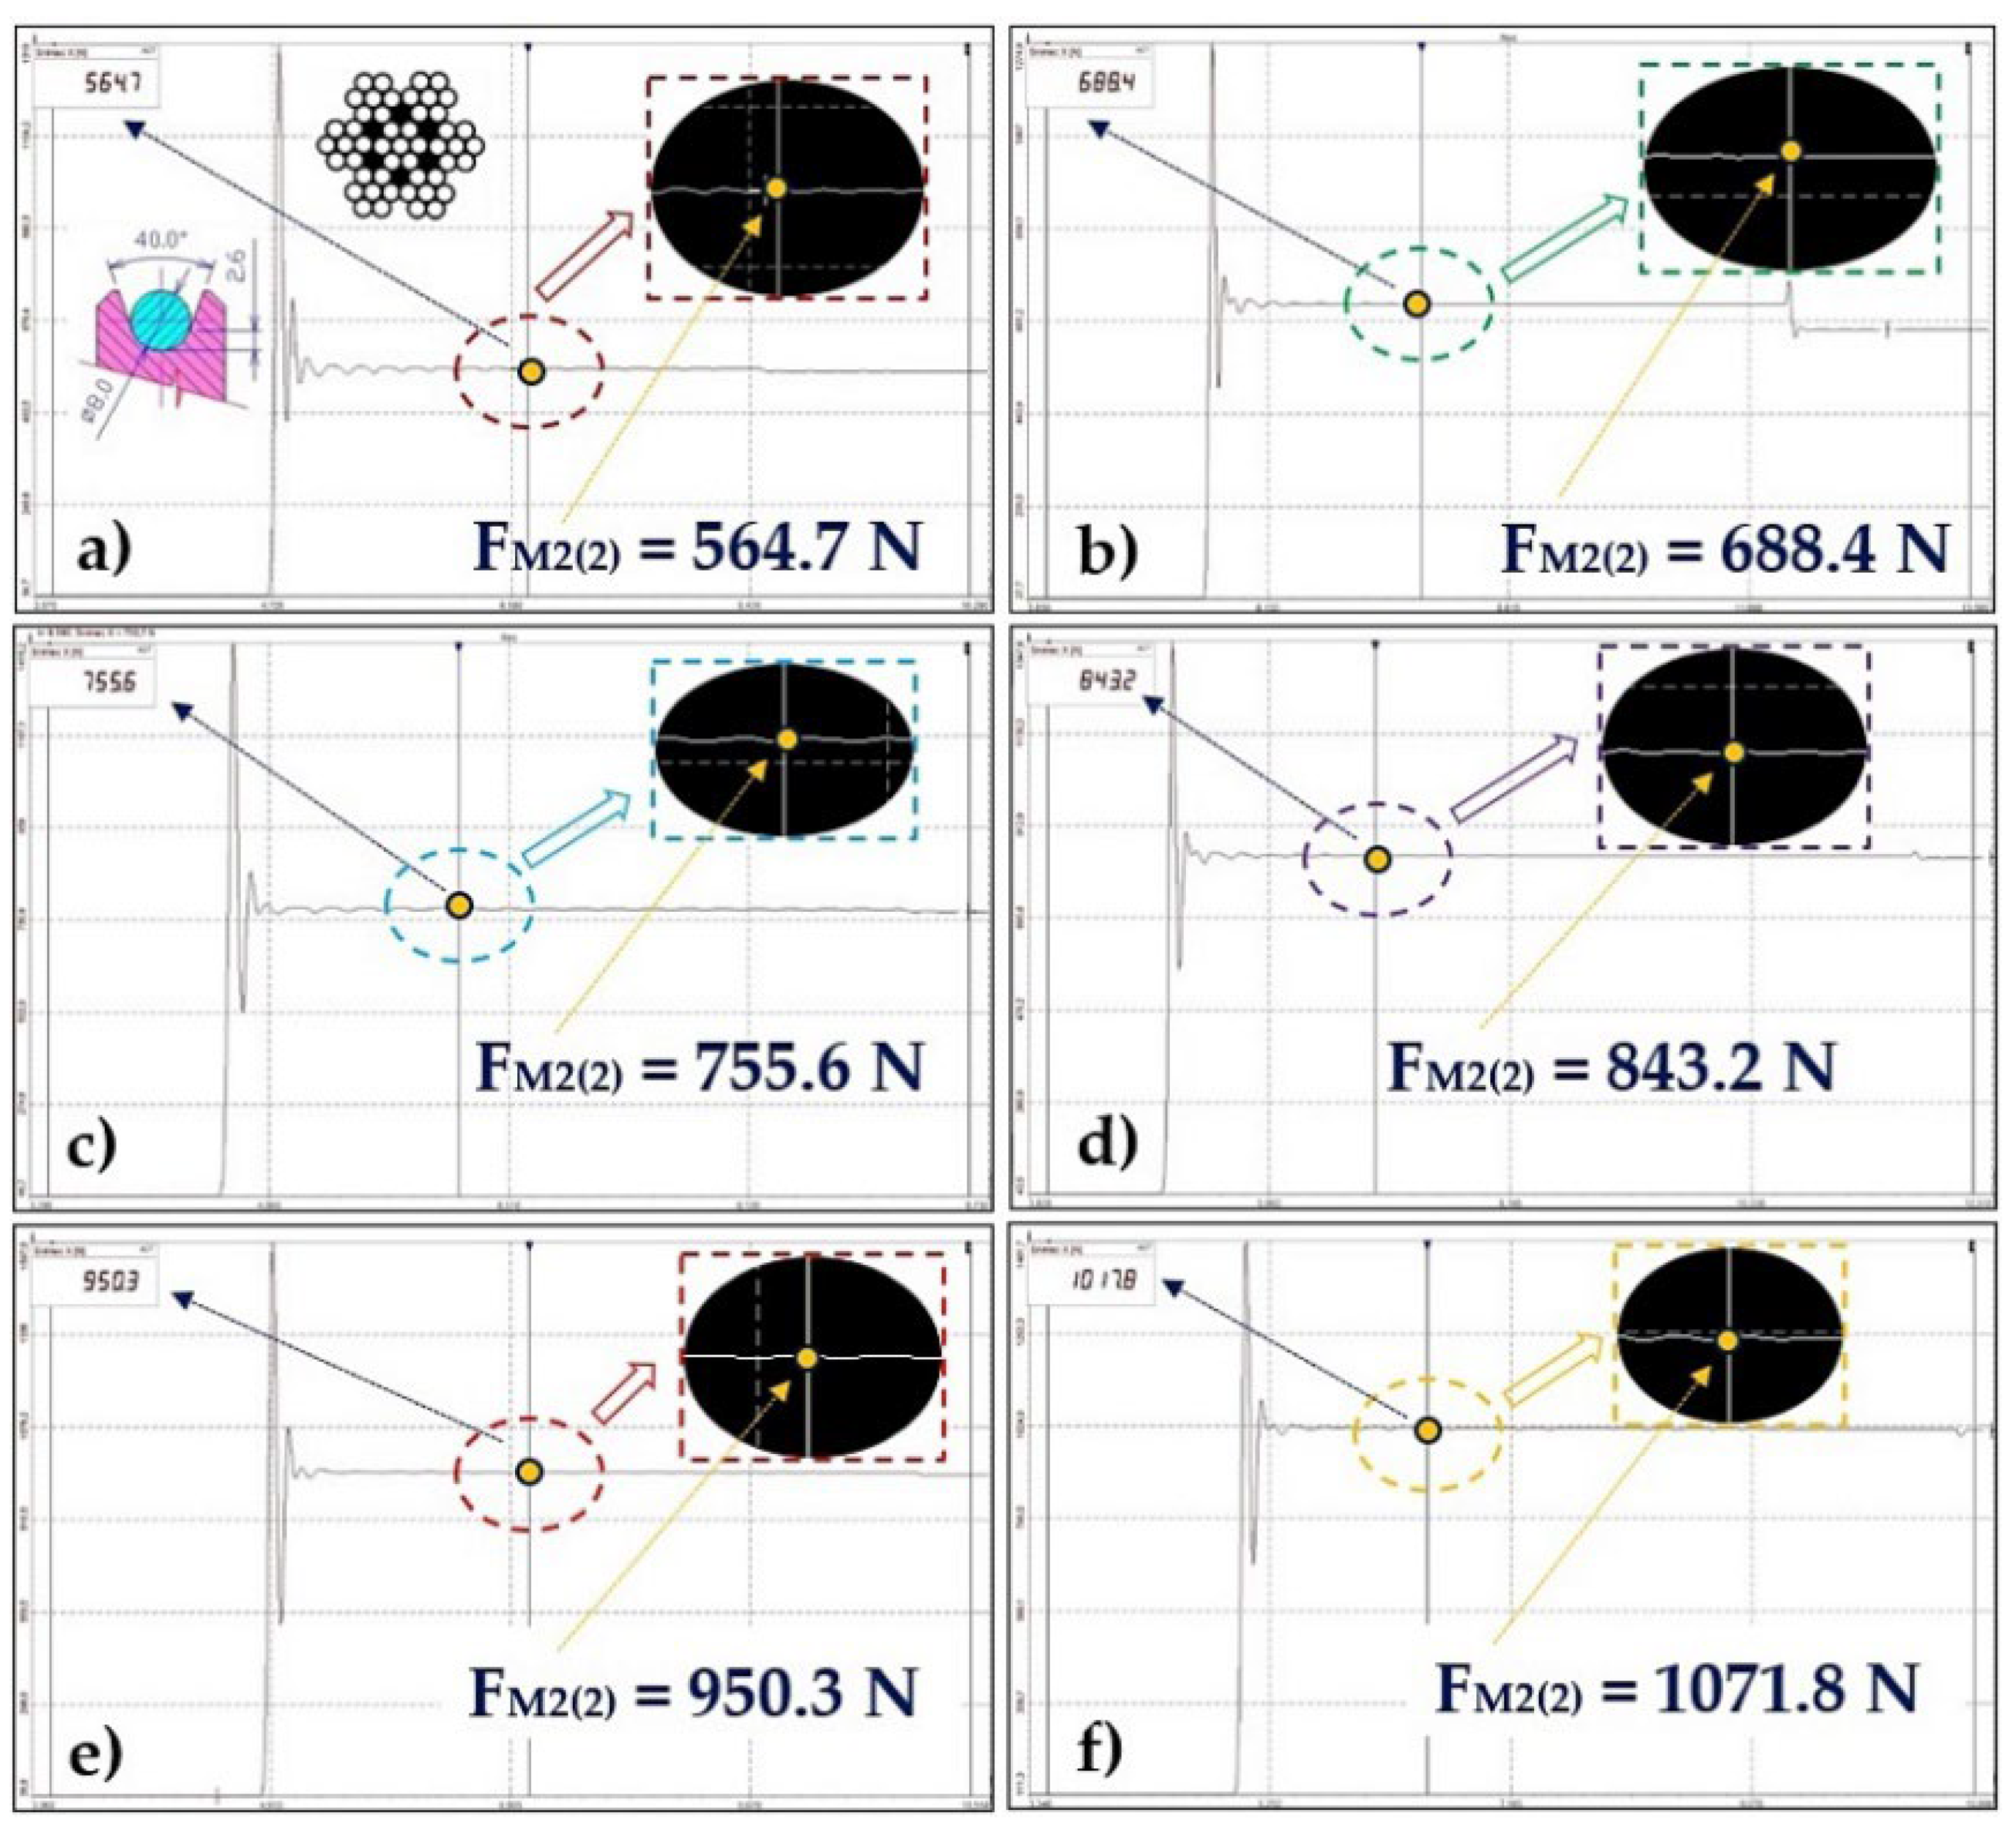
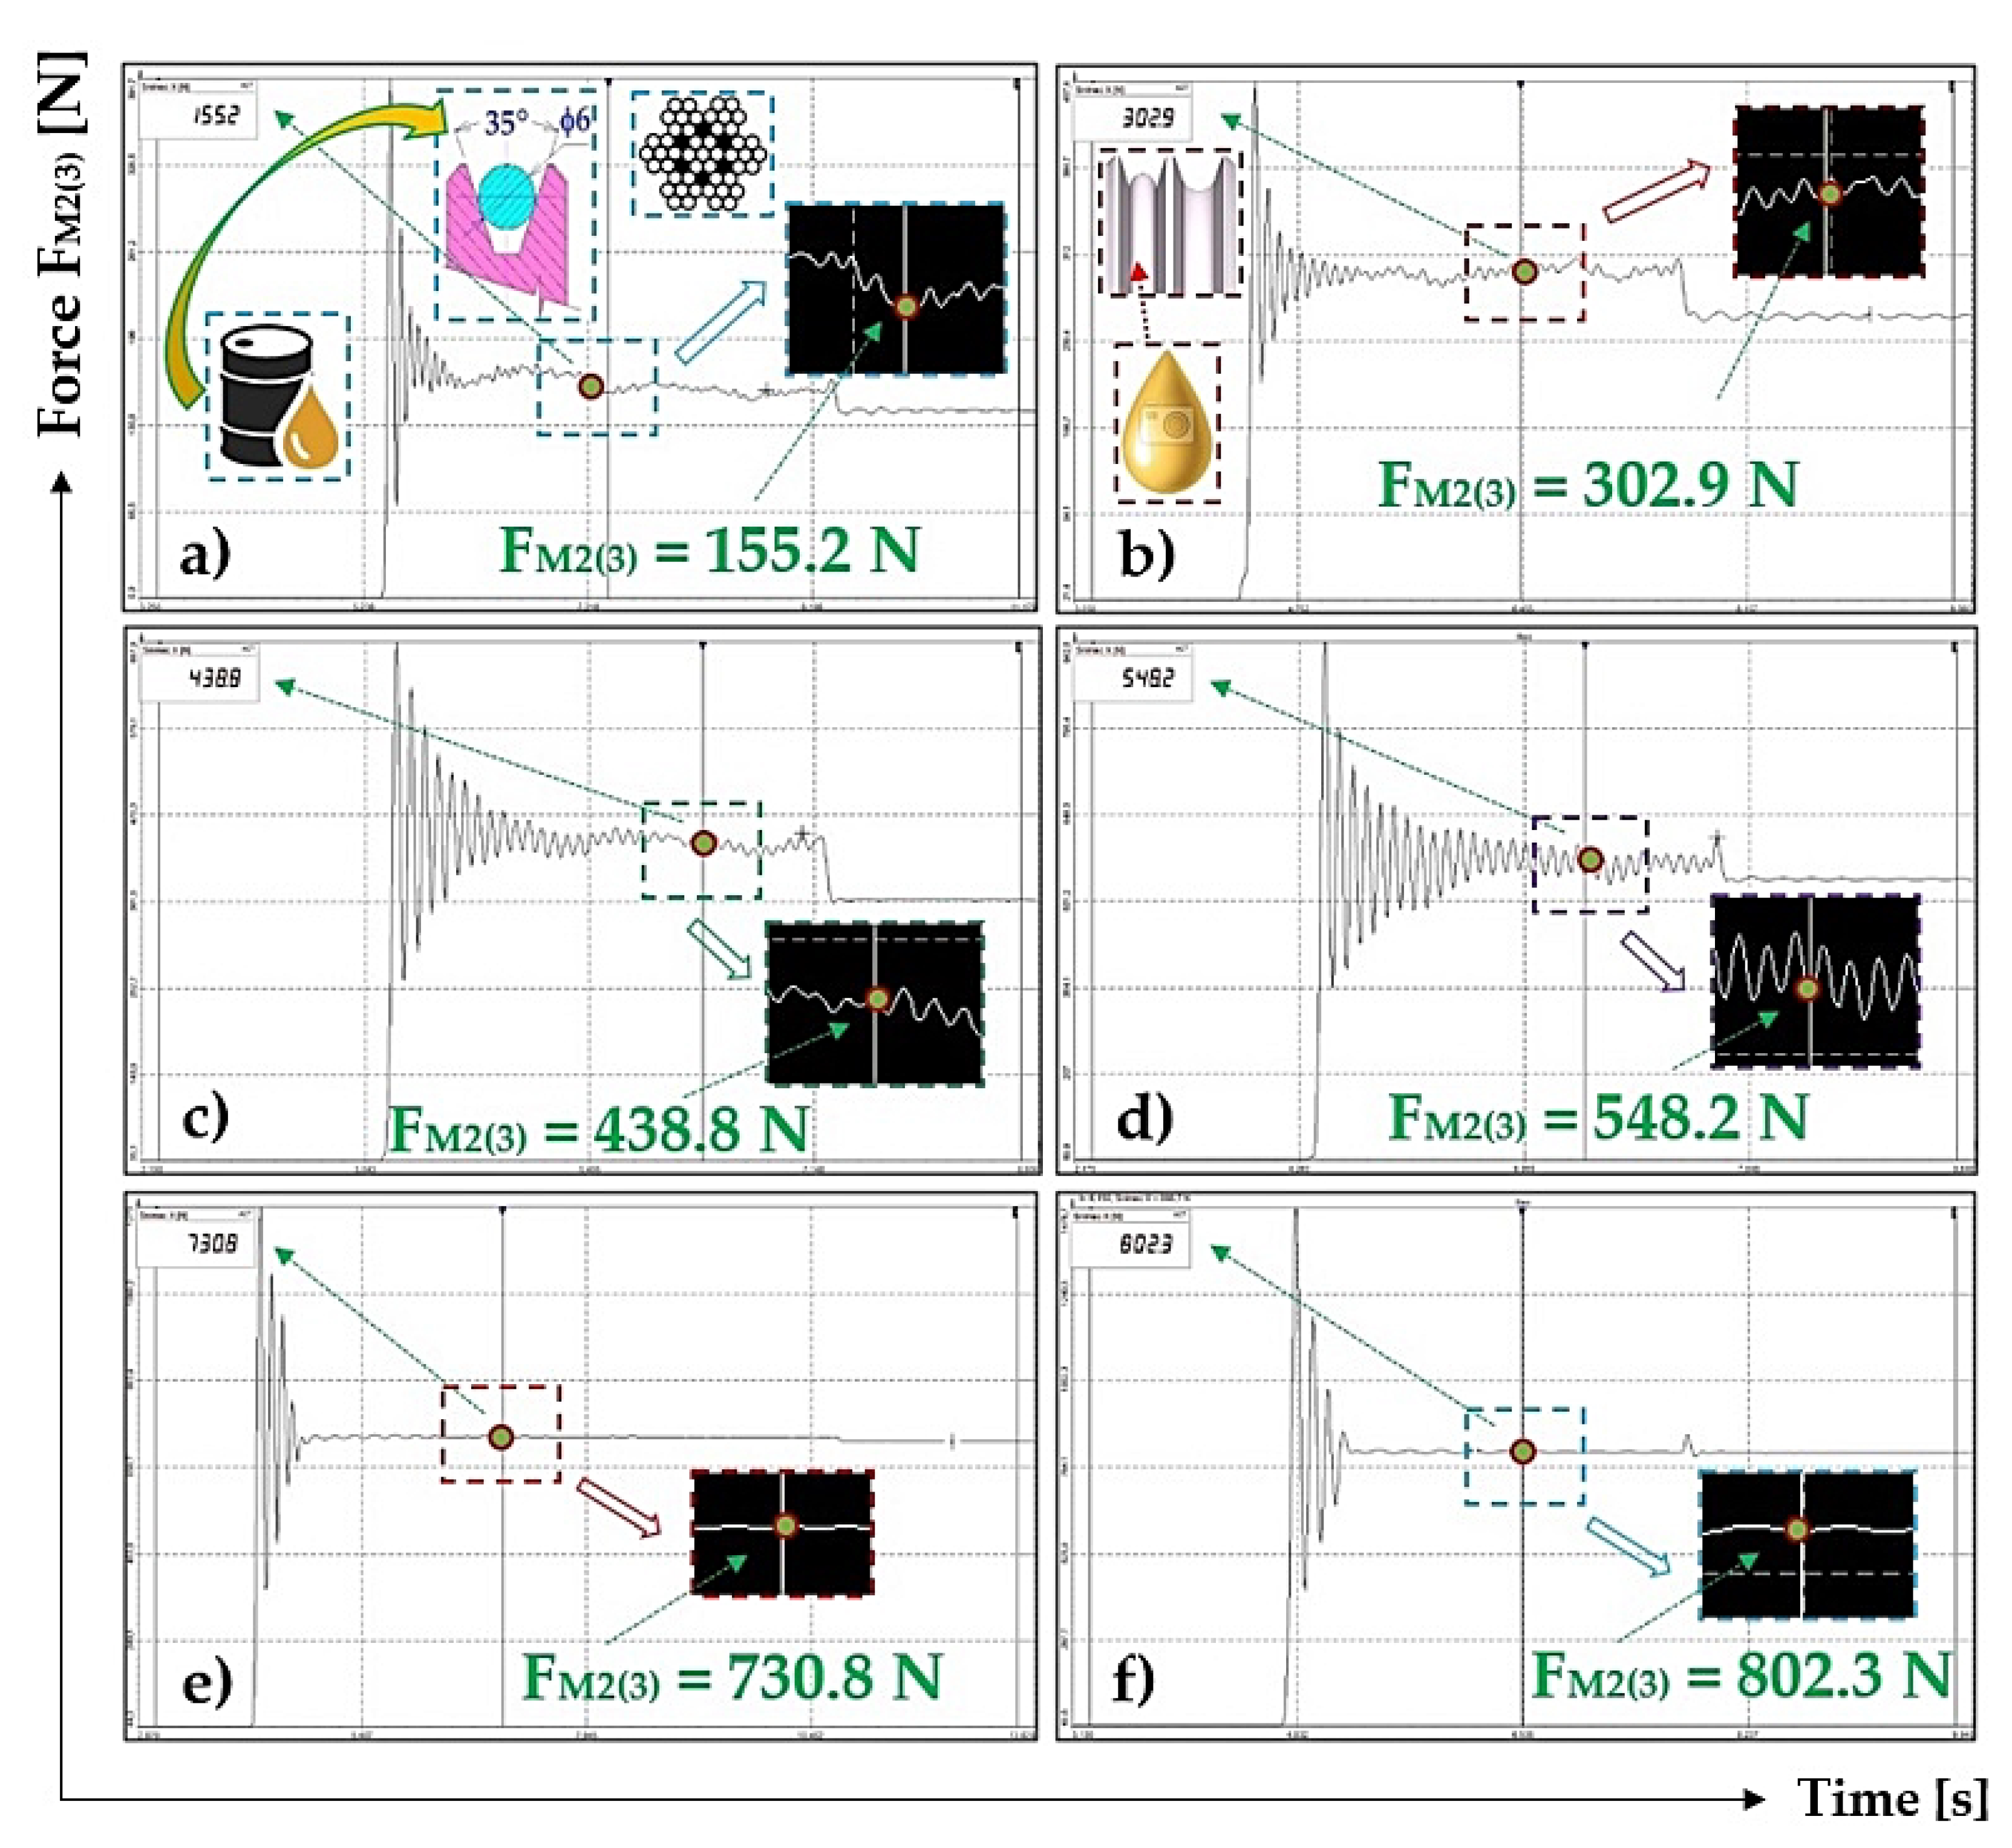
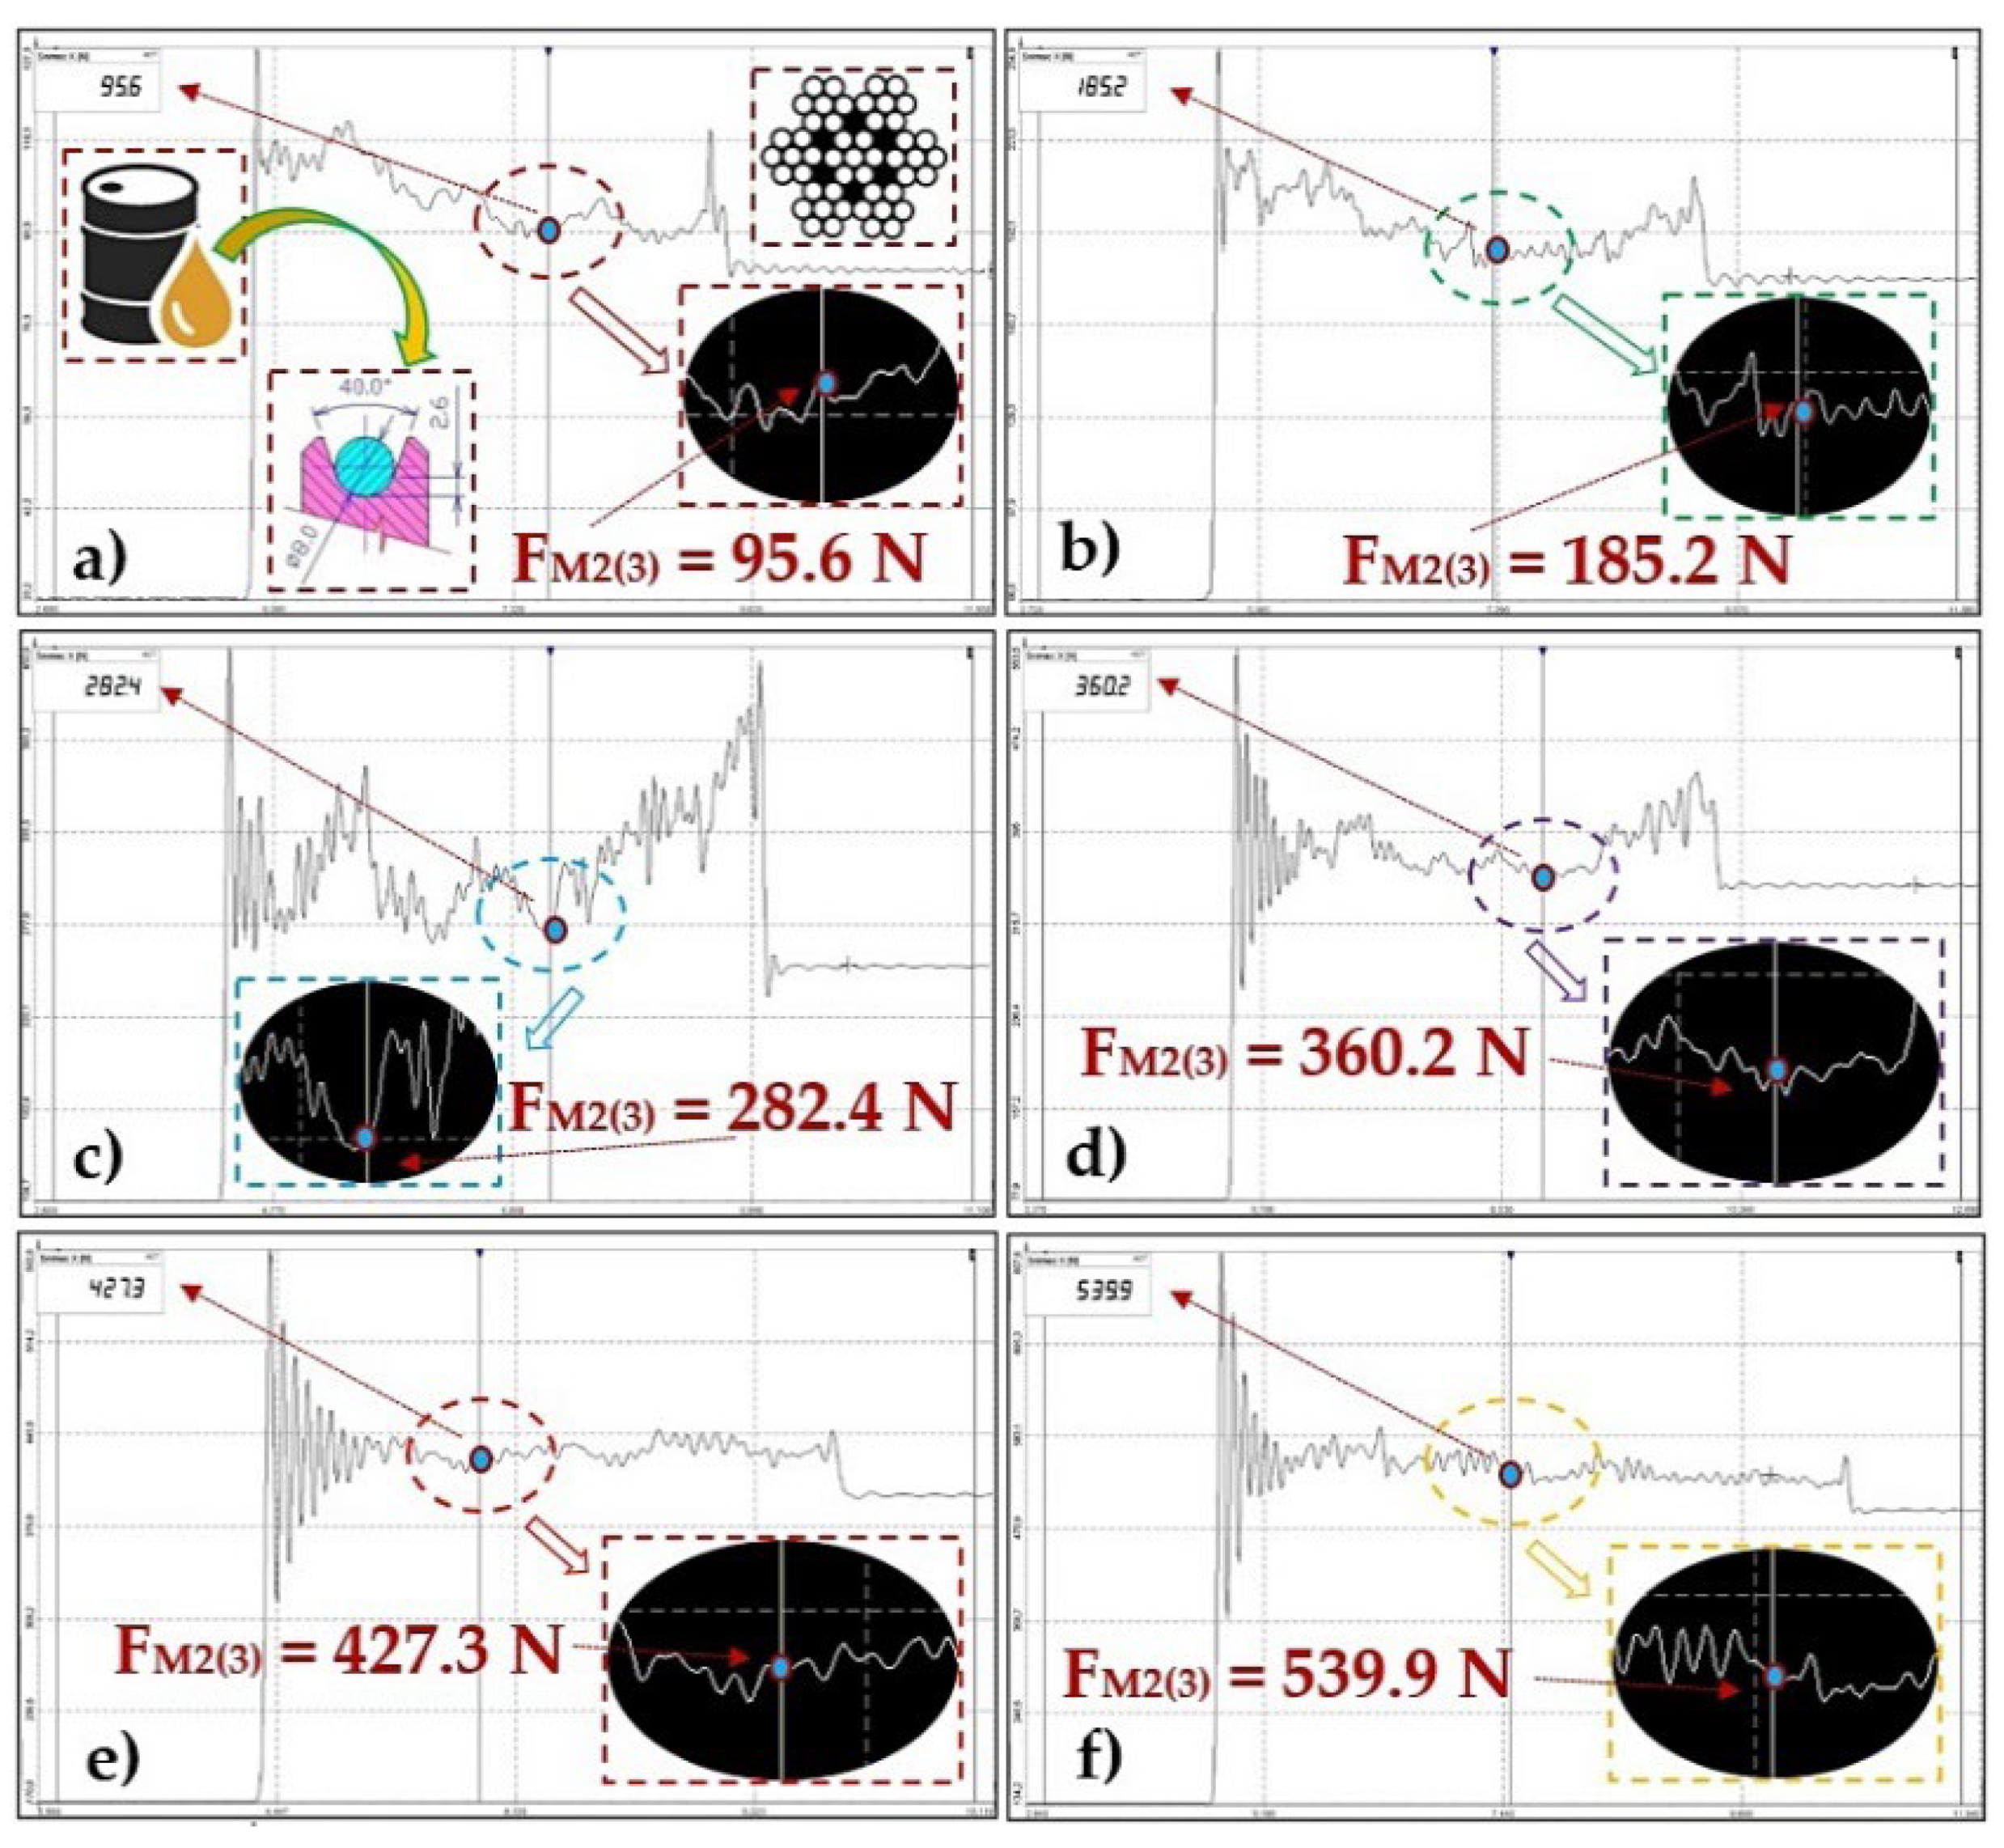
Figure 6.
Measured tensile forces FM2(i) [N] for ϕ6 mm rope, semi-circular groove, contaminated with oil (for weight of weights Gz [N] (a) 49 N, (b) 98 N, (c) 147 N, (d) 196 N, (e) 245 N, (f) 294 N).
Figure 6.
Measured tensile forces FM2(i) [N] for ϕ6 mm rope, semi-circular groove, contaminated with oil (for weight of weights Gz [N] (a) 49 N, (b) 98 N, (c) 147 N, (d) 196 N, (e) 245 N, (f) 294 N).
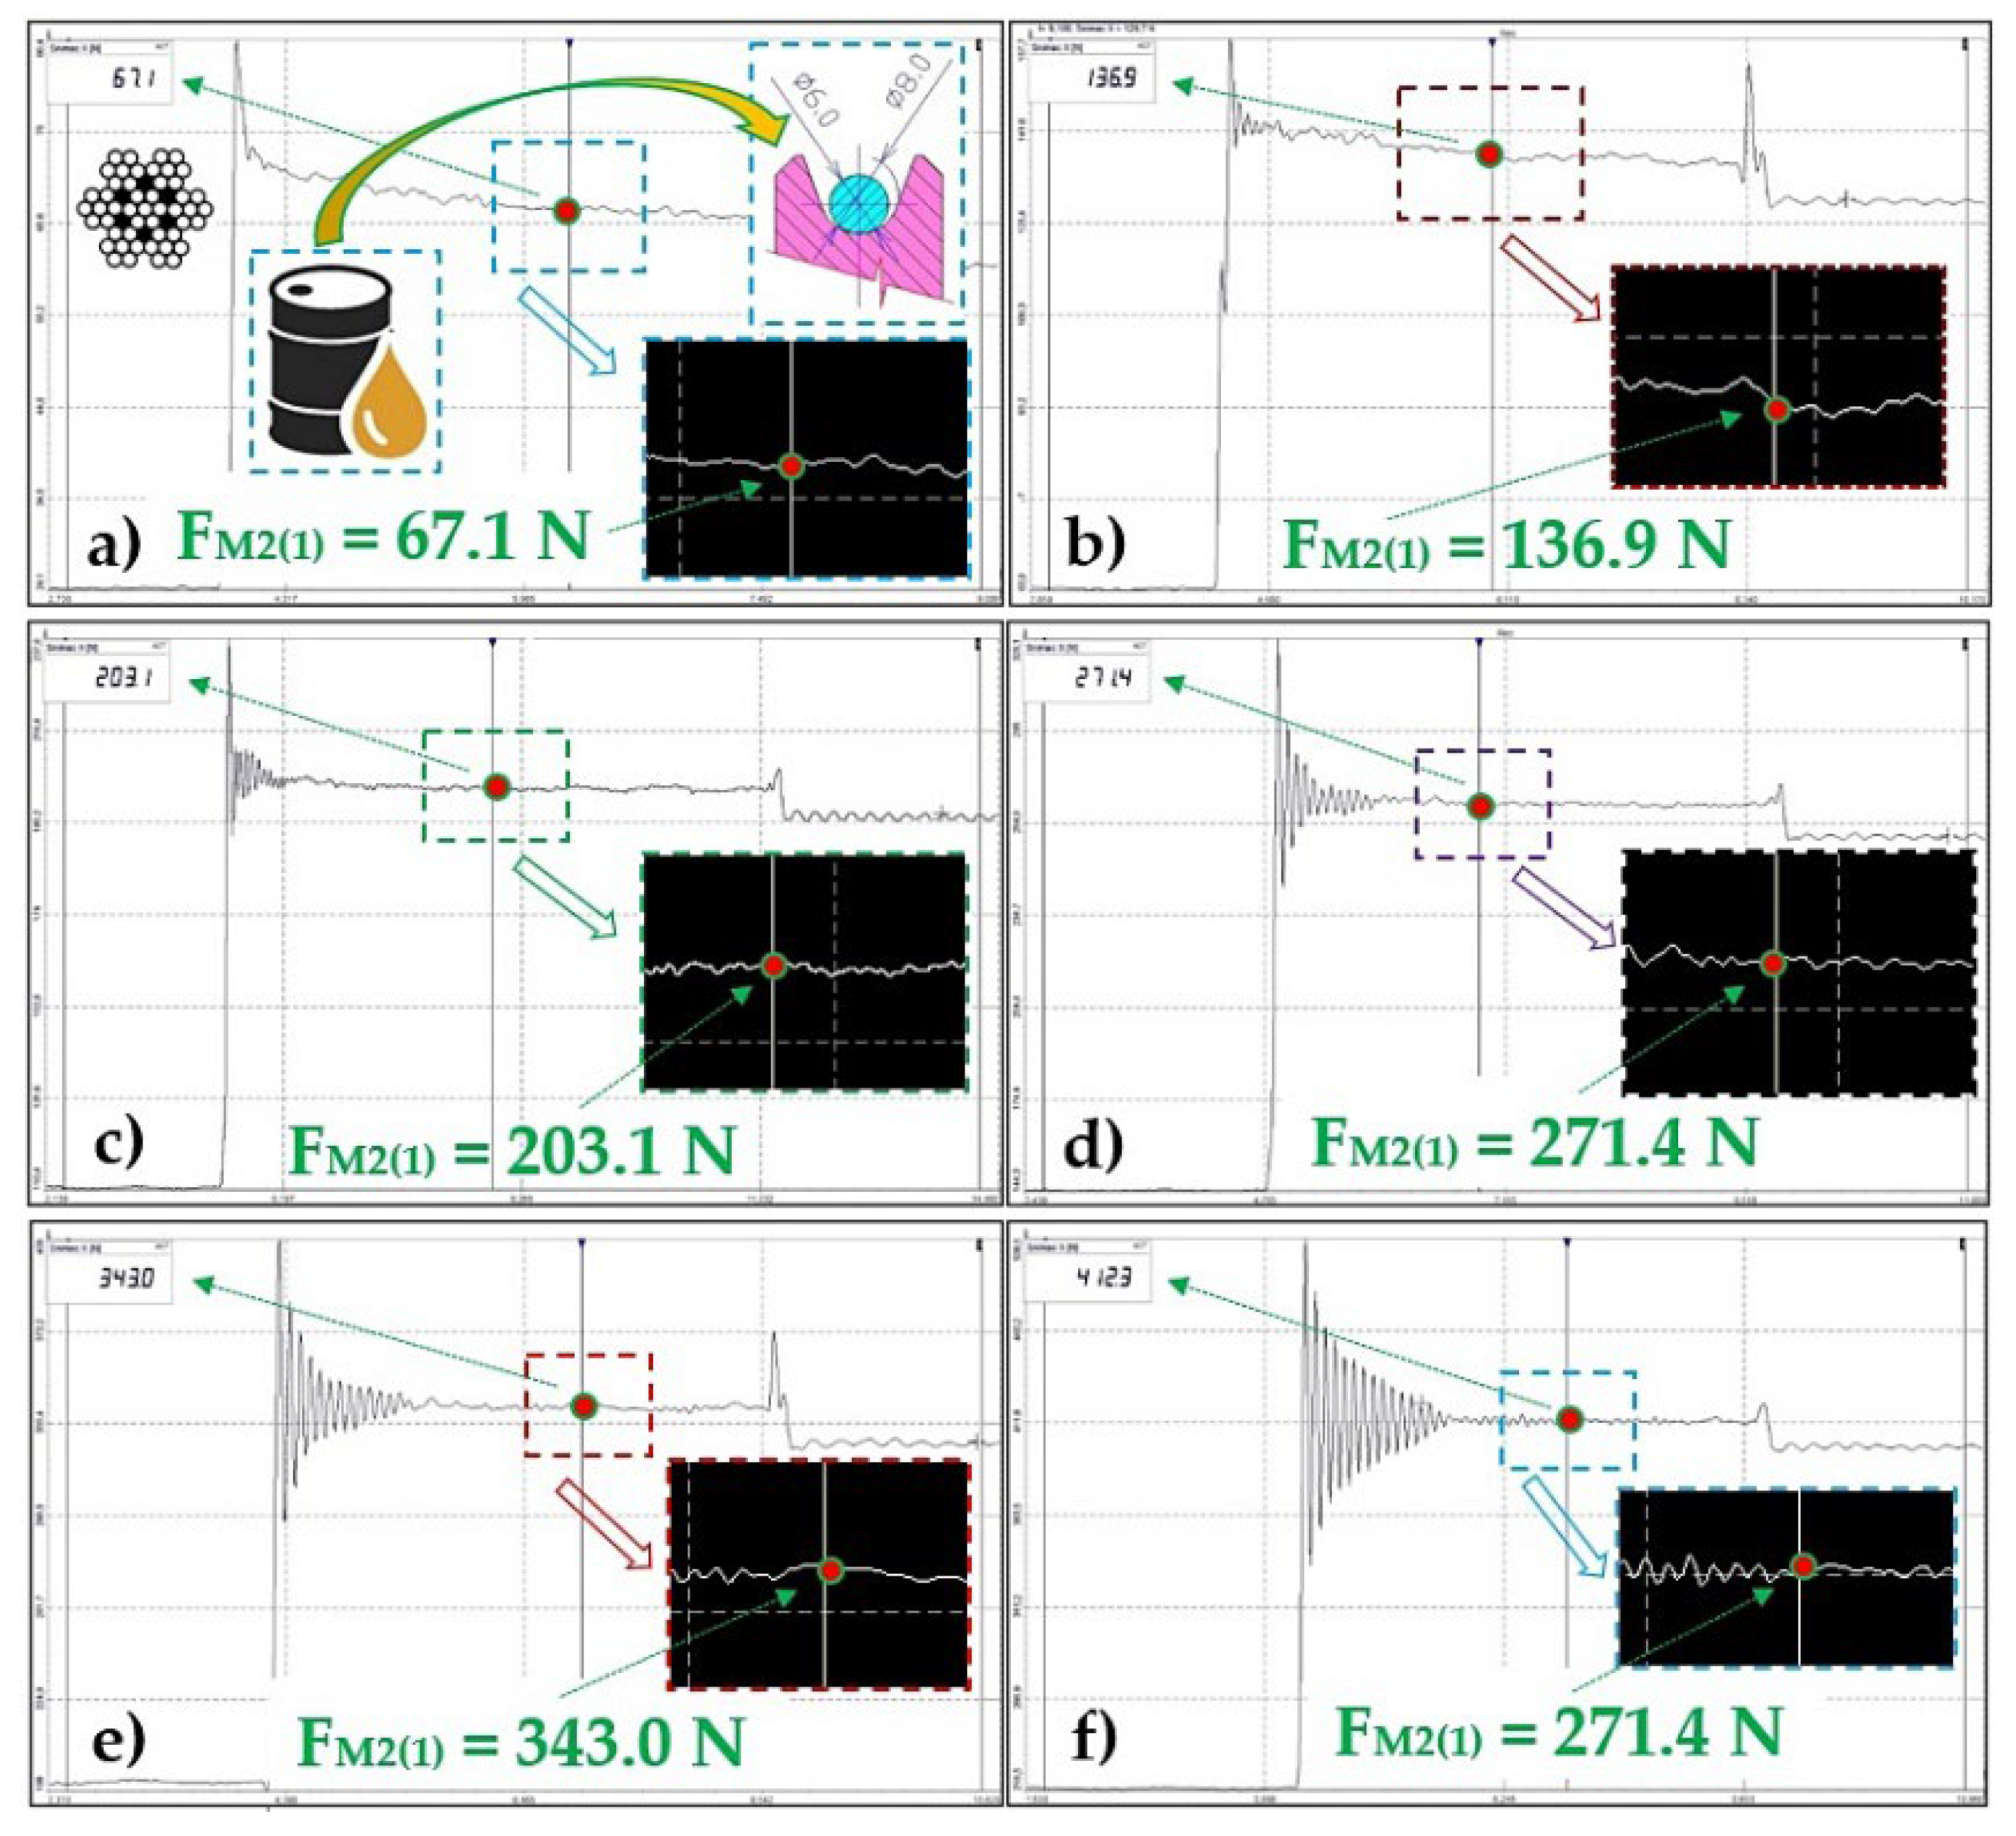
3.4. Tensile Force in ϕ8 mm Rope, Semi-Circular Groove, Surface Contaminated with Oil
Table 6 shows values measured for tensile forces F
M2(i) [N] in rope side
5 (d
L = 8 mm) approaching the rope sheave
4, of which the semi-circular groove is dirty with oil.
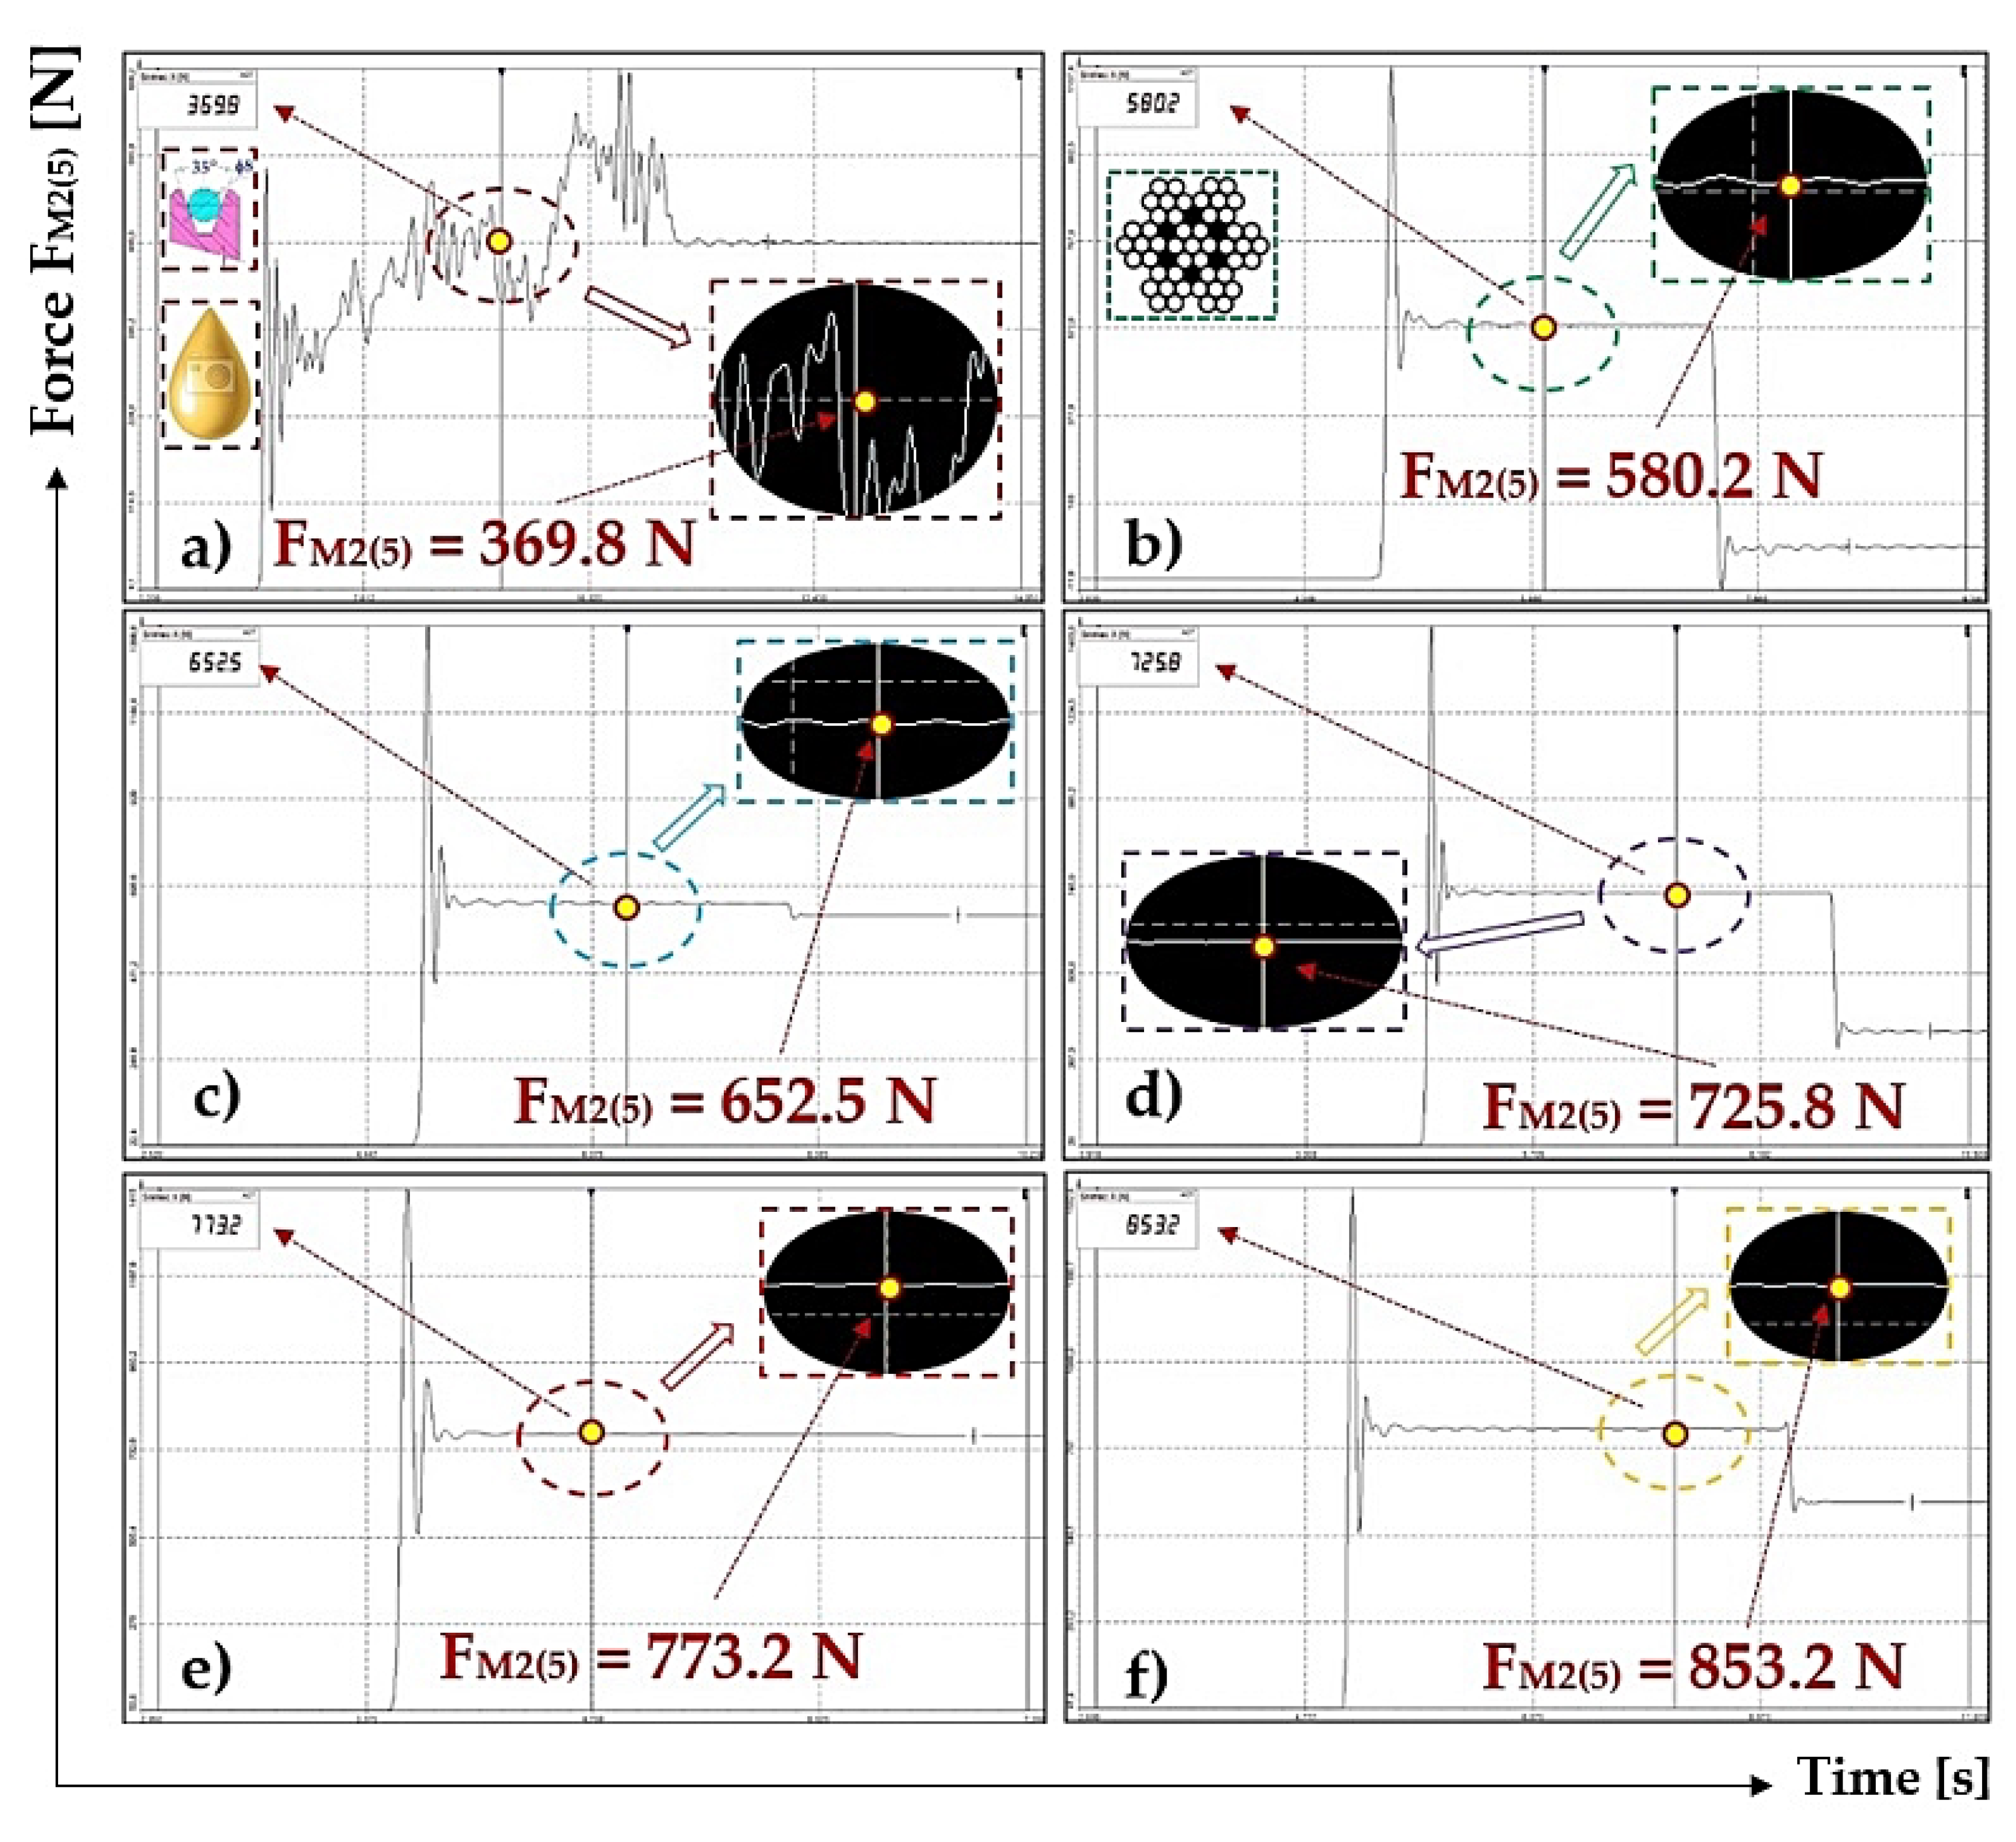
Figure 7.
Tensile forces FM2(i) [N] measured for ϕ8 mm rope, semi-circular groove, contaminated with oil (for weight of weights Gz [N] (a) 49 N, (b) 98 N, (c) 147 N, (d) 196 N, (e) 245 N, (f) 294 N).
Figure 7.
Tensile forces FM2(i) [N] measured for ϕ8 mm rope, semi-circular groove, contaminated with oil (for weight of weights Gz [N] (a) 49 N, (b) 98 N, (c) 147 N, (d) 196 N, (e) 245 N, (f) 294 N).
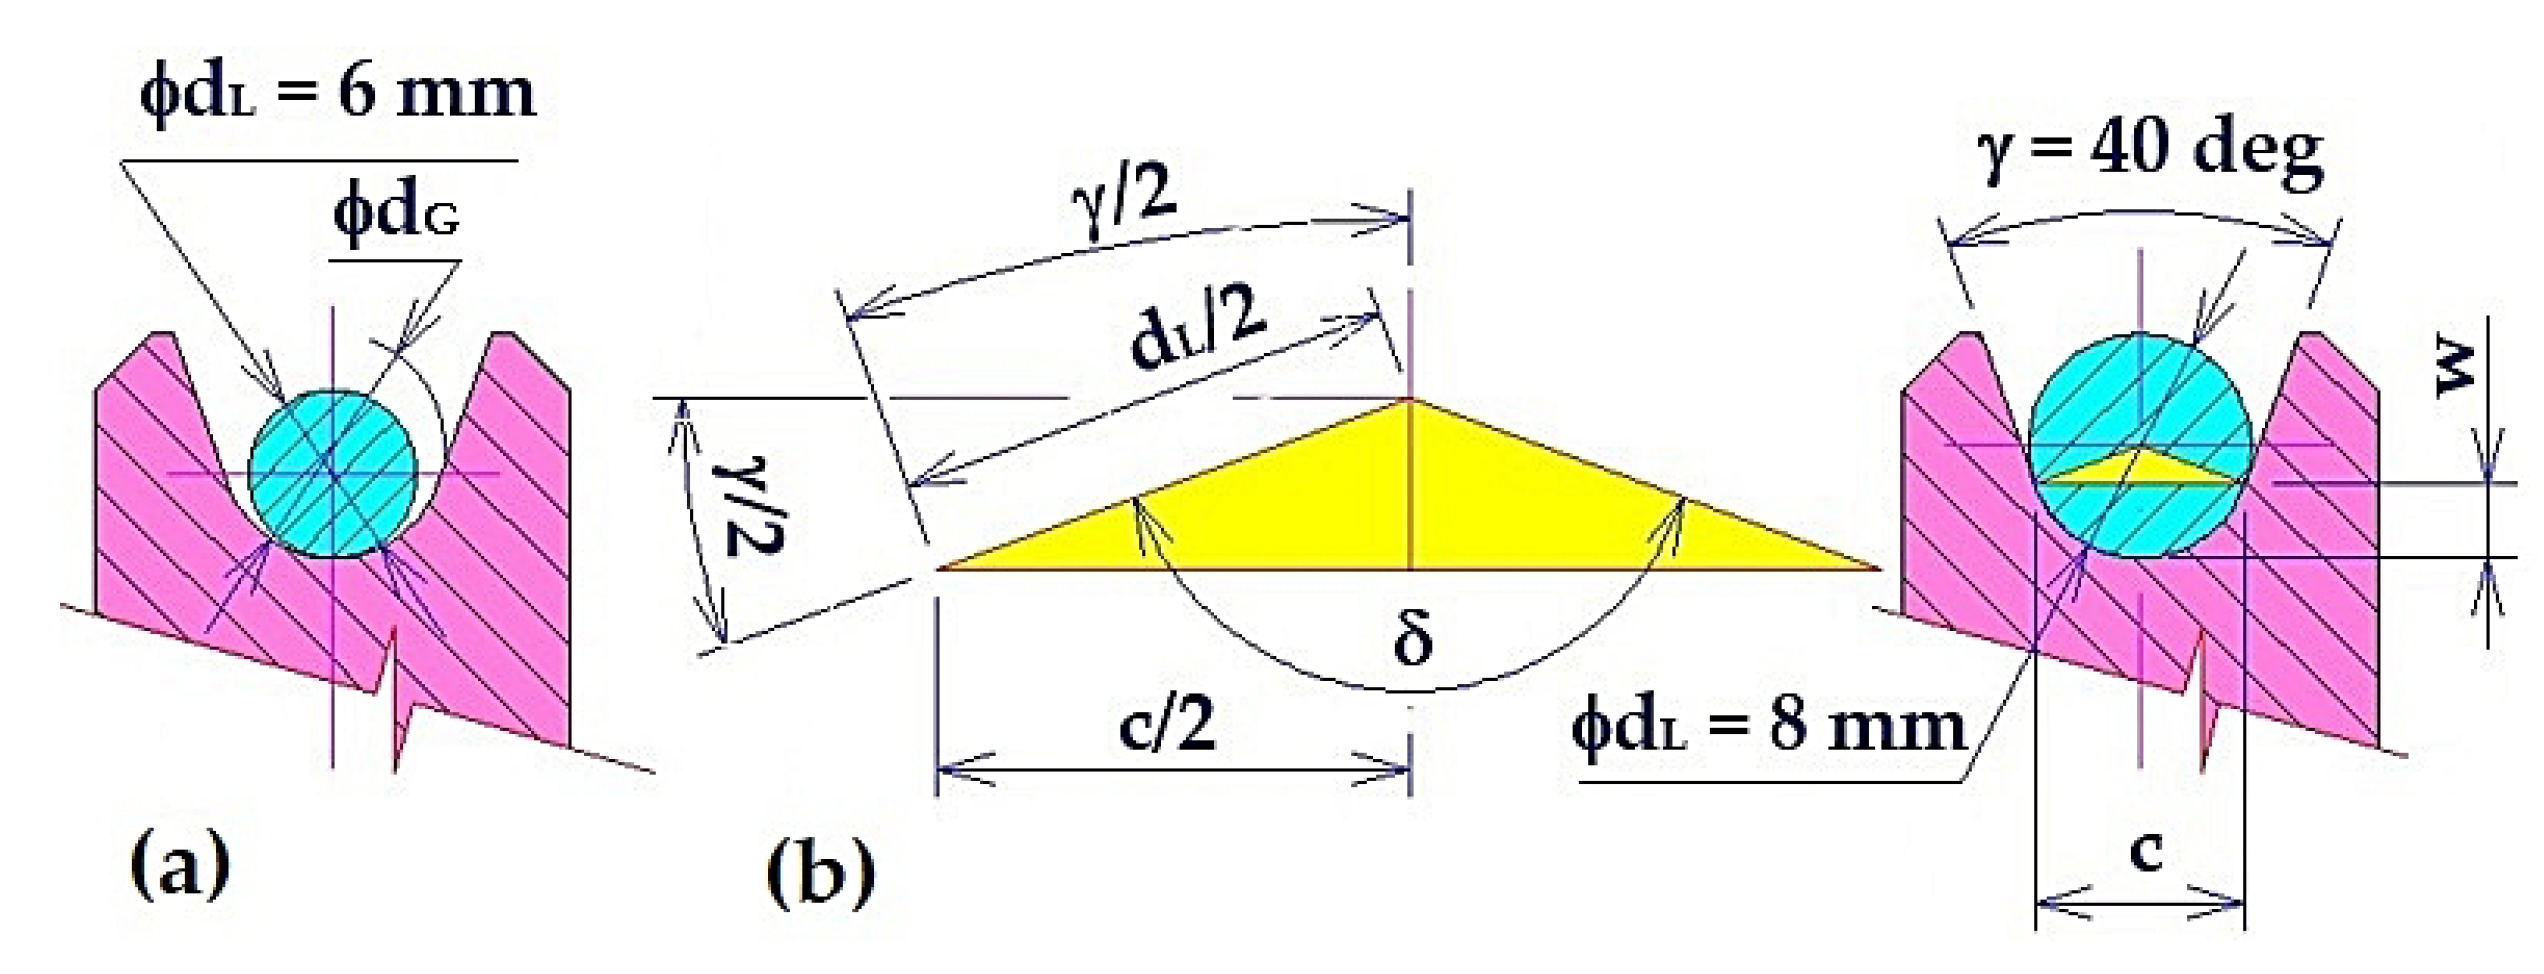
The semi-circular groove of rope pulley
4 is designed with the bottom diameter d
G = 8 mm, see
Figure 8a. Experimentally obtained values of the friction coefficient f
(i) [-] in the semi-circular groove of rope d
L = 6 mm, see
Table 6, done on a laboratory machine, reached lower magnitudes than the value (f
T = 0.12) given in the relevant standard [
13]. The rope ϕd
L = 6 mm is in pointwise contact with the bottom of the groove surface ϕd
G = 8 mm.
For the rope of ϕ8 mm, see
Figure 8b, the experimental values of friction coefficient done for semi-circular groove f
(i) [-] reached higher values that the value given in the standard [
13]. The ϕ8 rope is showing 40.28% contact of its circumference with the groove surface ϕd
G = 8 mm. Angle δ [deg] and the length of the rope circumference contact with the groove o [m] can be expressed by the relationship (4).
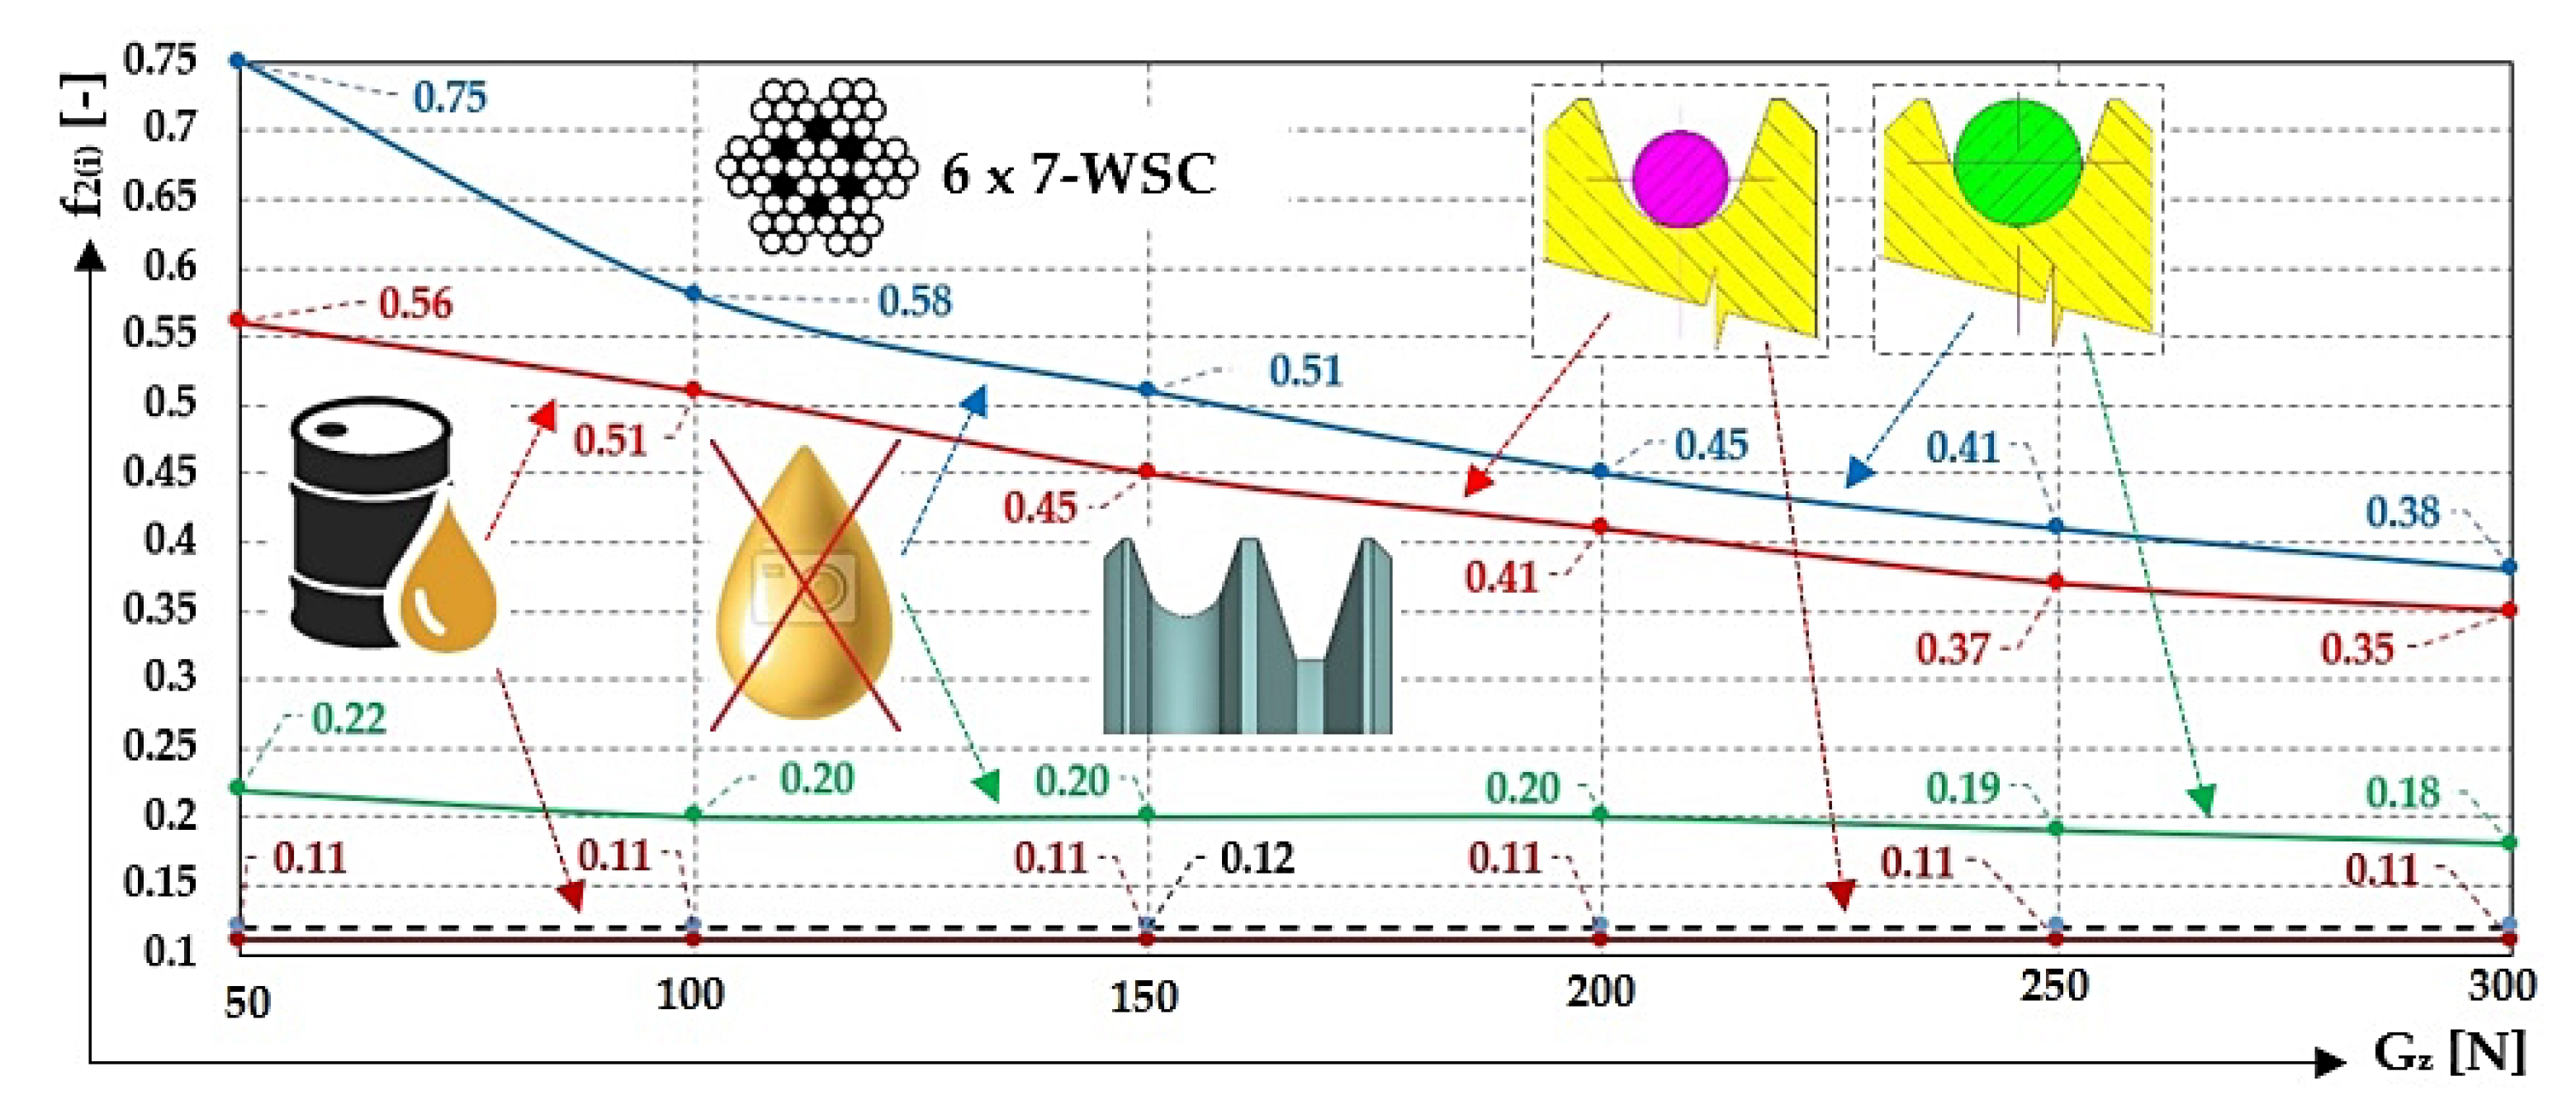
Figure 9 presents calculated values of friction coefficient f
2 [-] (see
Table 2,
Table 4,
Table 5 and
Table 6) for the semi-circular groove, of which the surface is clean and contaminated with oil, done for the rope sheave with the friction coefficient f
T [N] specified in the standard [
13].
3.5. Tensile Force in ϕ6 mm Rope, V-Shaped Groove, Dry Surface
Table 7 displays values measured for tensile forces F
M2(i) [N] on the side of the rope
5 (d
L = 6 mm) approaching the rope sheave
4, of which the V-shaped groove is dry and clean.
3.6. Tensile Force in ϕ8 mm Rope, V-Shaped Groove, Dry Surface
Table 8 shows values measured for tensile forces
FM2(i) [N] done for the side of the approaching rope
5 ϕ8 mm to the rope sheave
4, of which the V-shaped groove is dry and clean.
3.7. Tensile Force in ϕ6 mm, V-Shaped Groove, Surface Contaminated with Oil
Table 9 displays values
FM2(i) [N] measured for the approaching side of rope
5 with the diameter of
dL = 6 mm to the rope sheave
4, of which the V-shaped groove is contaminated with oil.
3.8. Tensile Force in ϕ8 mm Rope, V-Shaped Groove, Surface Contaminated with Oil
Table 10 lists the values of tensile forces F
M2(i) [N] measured on the side of rope
5 (d
L = 8 mm) approaching the rope sheave
4, of which the V-shaped groove is contaminated with oil.
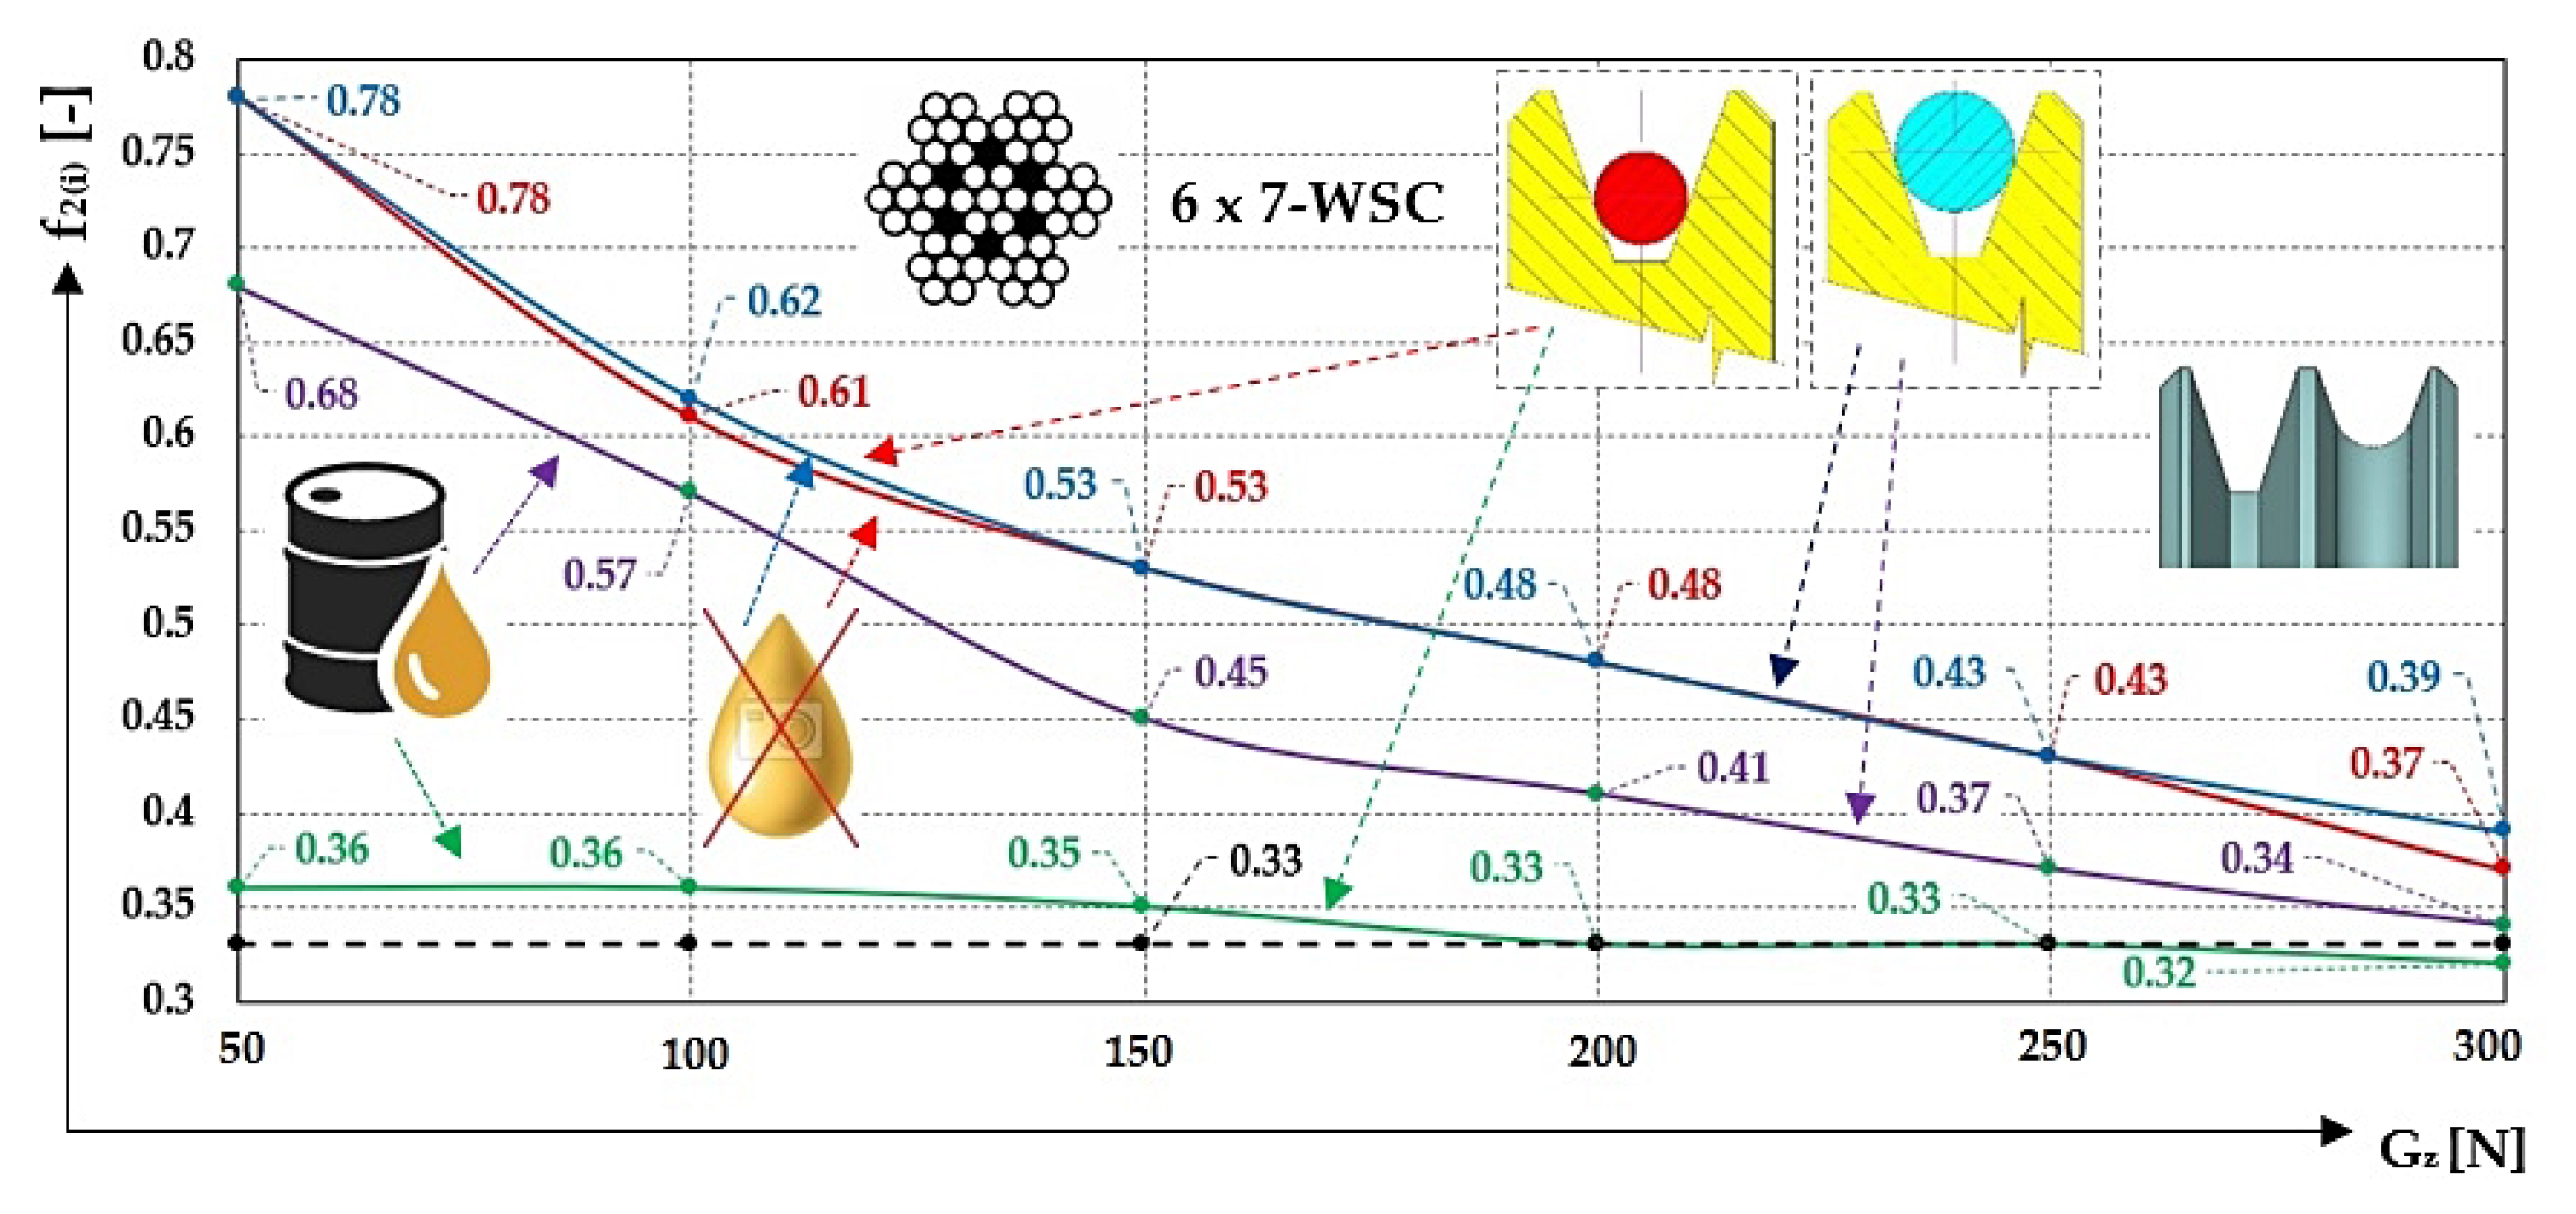
Figure 14 calculated values of friction coefficients f
2 [-] (see
Table 7,
Table 8,
Table 9 and
Table 10) for the V-shaped groove, of which the surface is clean and contaminated with oil, for the rope sheave with the friction coefficient f
T [N] stated in the standard [
13].
3.9. Numerically Calculated Magnitude of Tensile Force in ϕ8 mm Rope, Semi-Circular Groove, Dry Surface
For measurements provided on the laboratory device (see
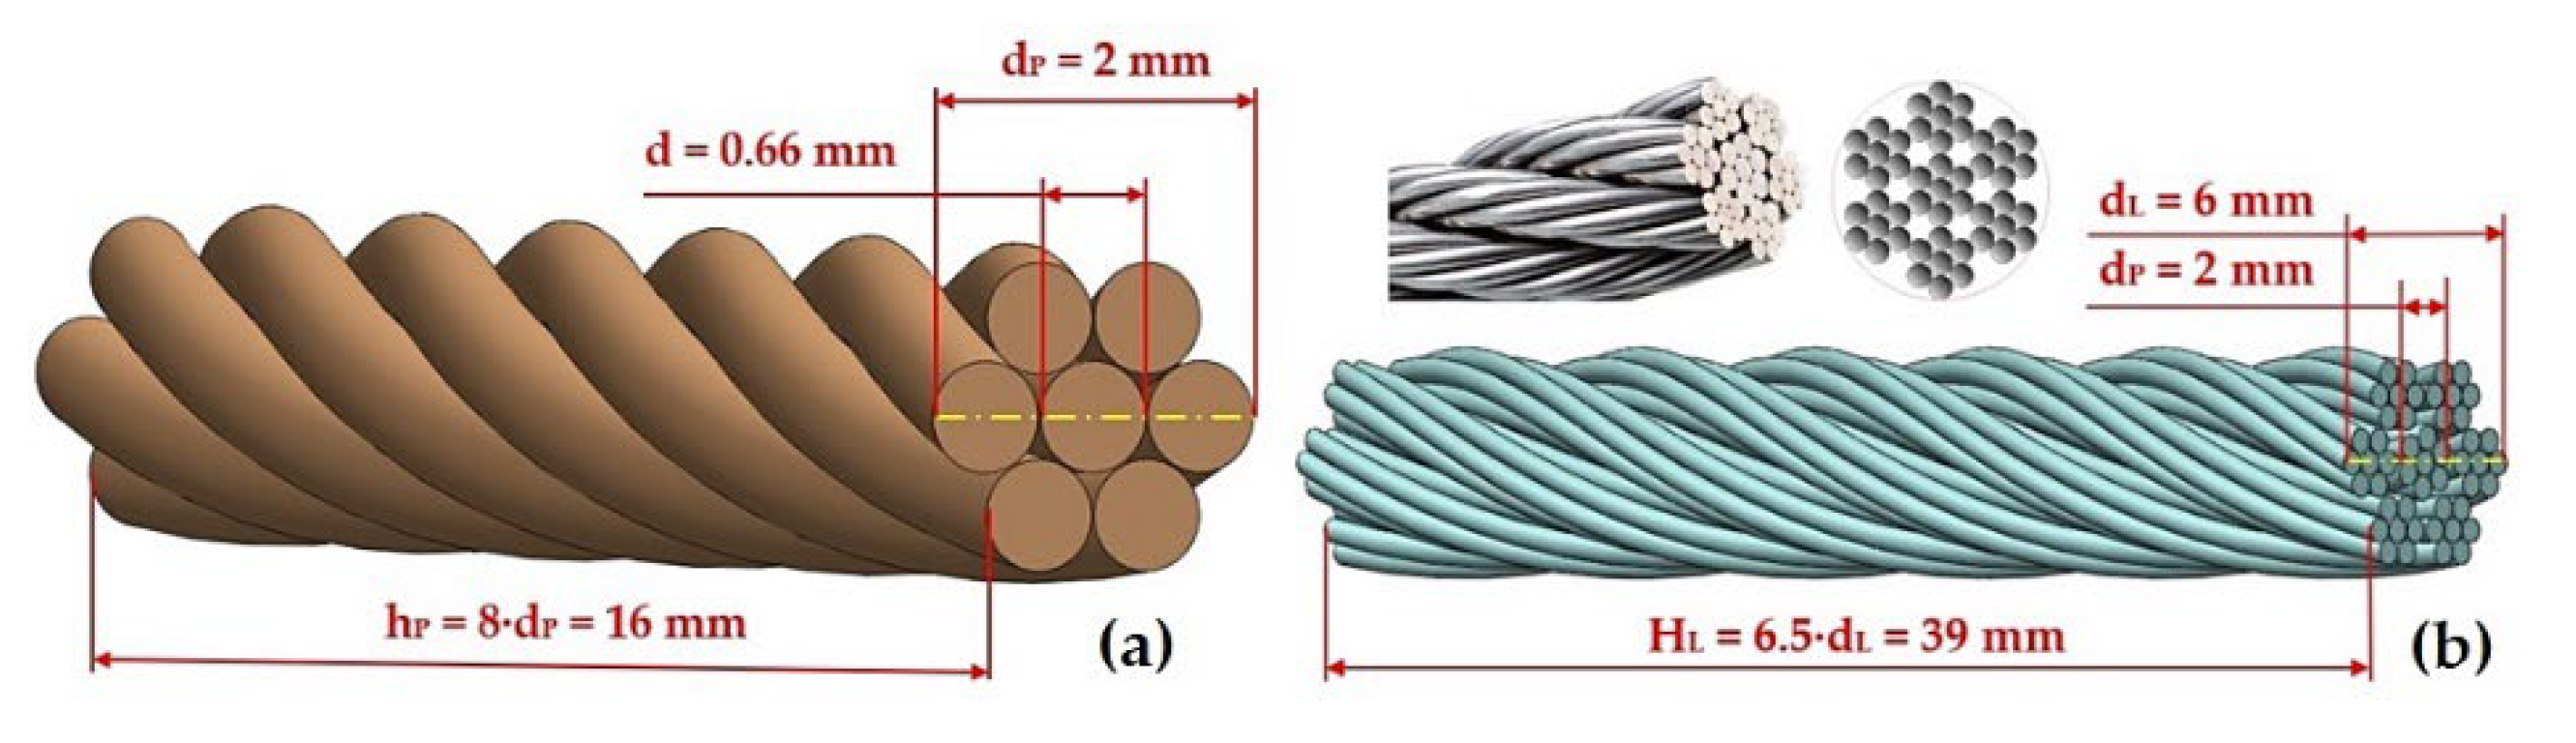
Figure 1), ropes with diameters d
L = 6 and 8 mm were used, and the construction was 6 × 7 + WSC 1960 B sZ [
34]. It is a six-strand, right ordinary laid (cross laid) rope. Wires with diameter d [mm] in the rope strand, see
Figure 15, are wound in the helix (rising from right to left) with winding height (which is the parallel distance with the longitudinal axis of the rope) of wires in the strand h
P = 8 ÷ 12·d
P [m], where d
P [m] is the diameter of the rope strand [
39]. All strands in the role are wound helically, rising from left to right, and the height of the strand winding in the rope is H
L = 6.5 ÷ 8·d
L [m] [
39].
To verify the correctness of the results obtained via experimental measurements, numerical analysis was carried out using the finite element method (FEM) using Ansys Workbench 2020 R2 software [
40]. Numerical analysis was used to determine the friction coefficient f
N [-], which corresponds to the theoretical force F
M2 [N] calculated using Euler’s formula using the calculated arithmetic mean of the friction coefficient f
2 [-]. The calculation was made only for the rope with diameter d
L = 8 mm and semi-circular groove, see
Section 3.2, as in this case, there was the greatest deviation of the experiment from the standard monitored. The force in the approaching side of the rope F
M2 [N] was measured on the laboratory device at a steady state, i.e., at a constant angular velocity. Therefore, the issue was approached as a static task and all dynamic effects, including self-weight, are neglected in numerical calculation.
The real geometry of the rope has been simplified for the calculation so that the individual wires (diameter dr [m]) in the strand that is wound in the helix around a central wire, are replaced by wires of circular cross-section having an adequate diameter dP [m].
Both the rope and the rope sheave are made of steel, but both components consider a material with slightly different values. Both materials are modelled as homogeneous and isotropic, which is typical in common practice, and both models describe only elastic behaviour because there are only minor distortions. For a rope, an elastic material model is considered, and the values are taken from [
41]. The exact type of steel is not known for the rope sheave, so it is considered to be a standard steel material model. Material parameters are given in
Table 11.
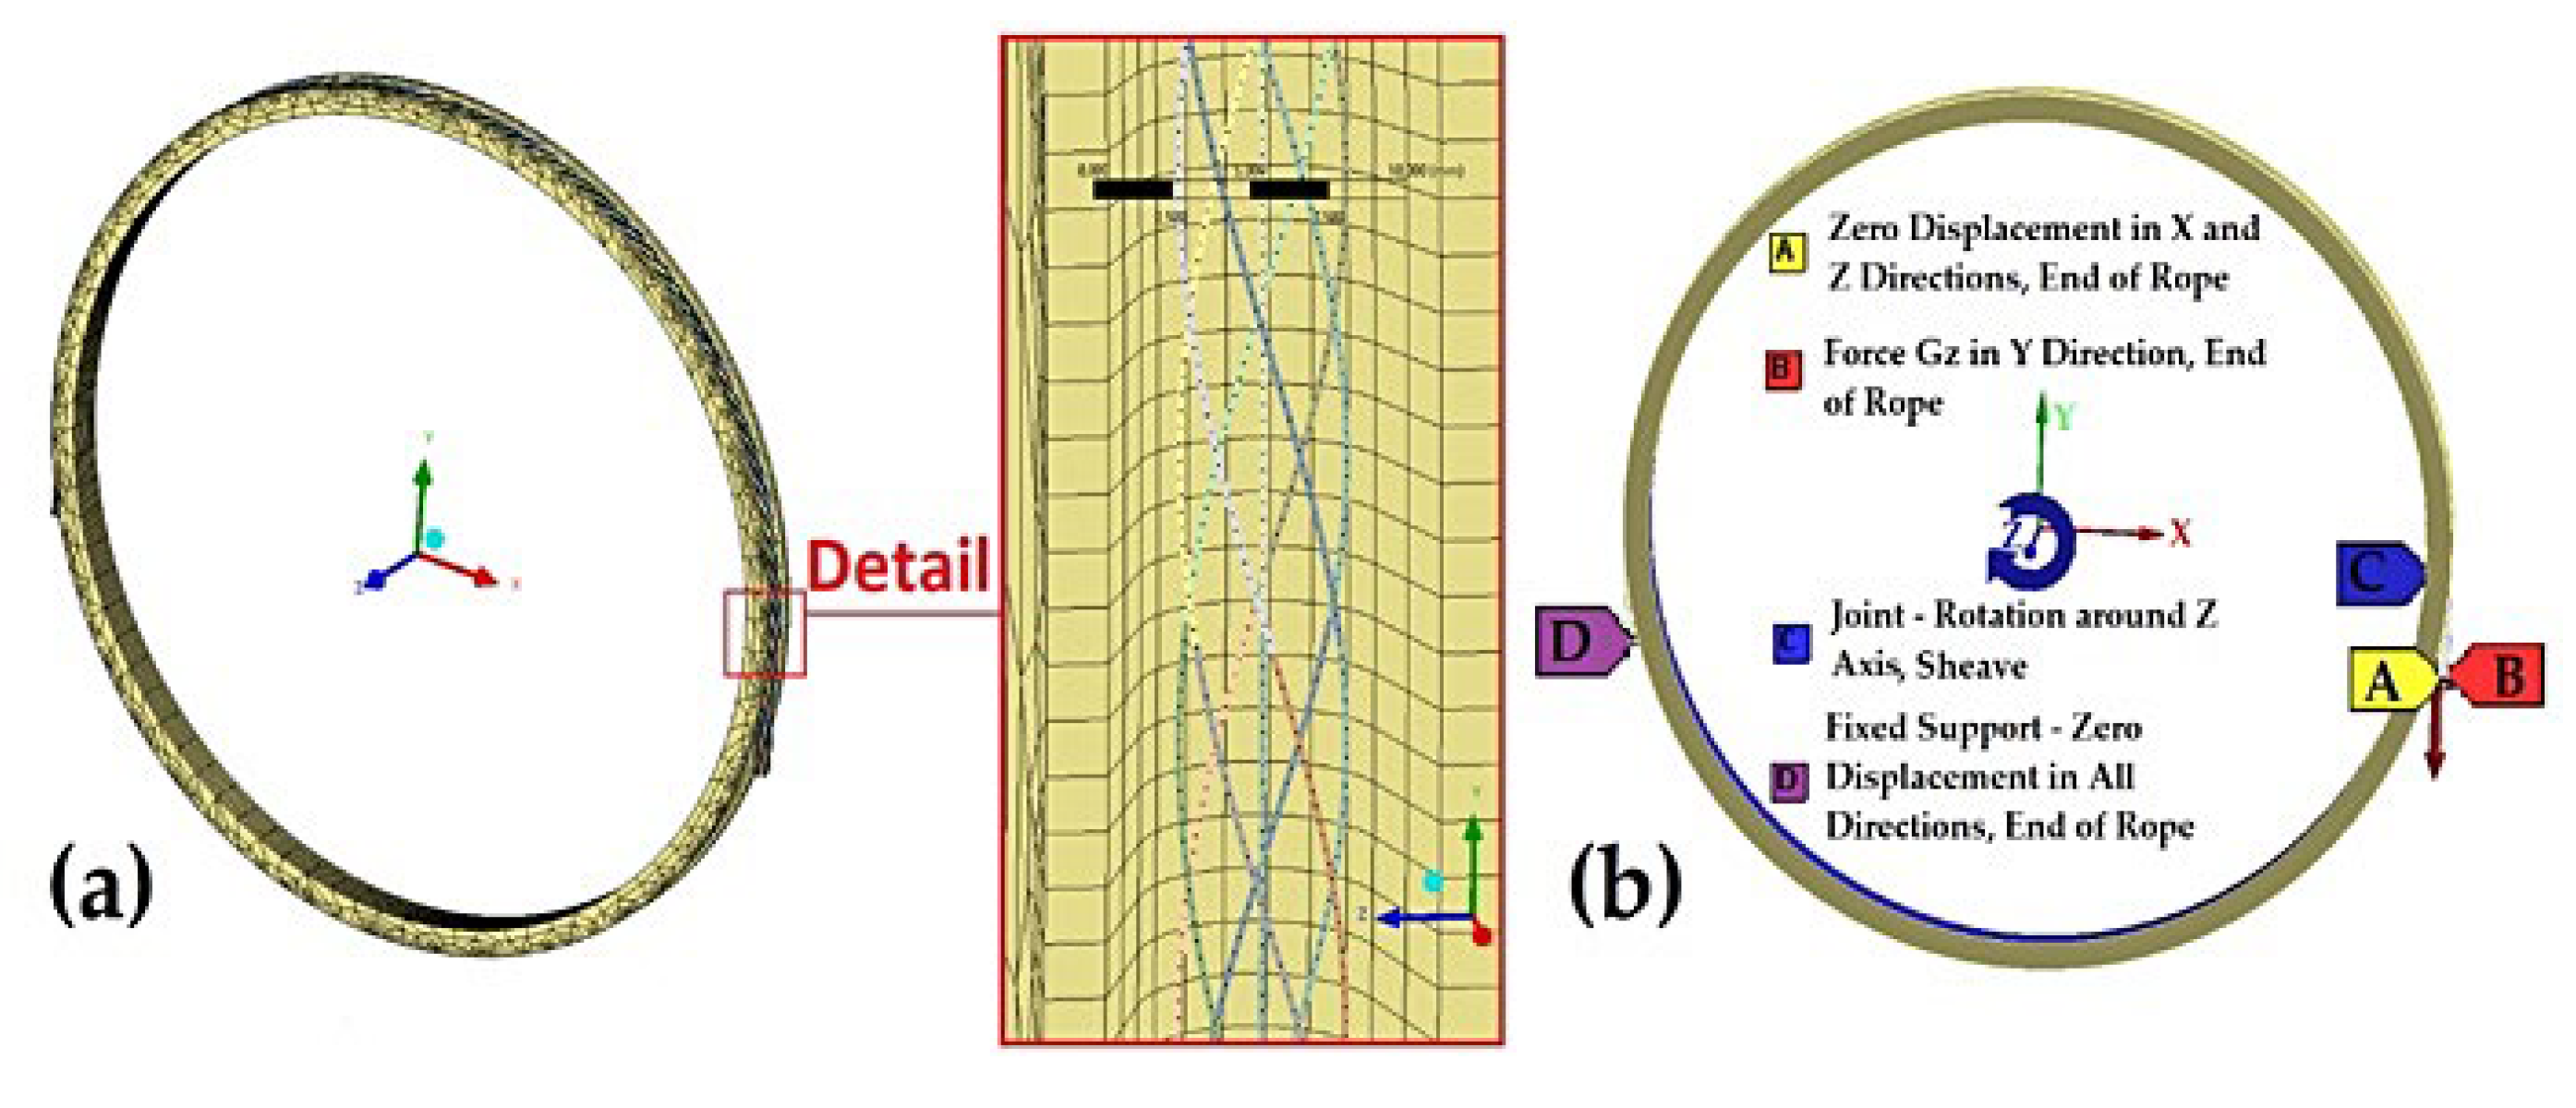
For calculation, the 3D geometry of rope strands is simplified to beams. FEM (= finite element) model is then designed using beam quadratic elements (i.e., the rope) and tetra/hexaedric quadratic elements (i.e., rope sheave). The size of beam elements is 1 mm and the size of elements for semi-circular groove where the groove is in contact with the rope is the size of elements 1.5 mm. FEM (= finite elements) network, illustrated in
Figure 16a. A sensitivity analysis was carried out in such a way that the error of the required quantity (force F
M2 [N]) for two different networks with half the size of the element was lower than 1 %.
Between the individual strands of the rope, the friction contacts having the friction coefficient µ = 0 [-] [
13,
42] are considered. The friction contact between the surface of rope strands and the groove surface of the sheave is also considered, and the friction coefficient is the quantity sought in our analysis.
The end of the approaching rope is fixed (this is where the tensile force is evaluated F
M2 [N]). The end of the departing side of the rope is loaded with the force G
z [N] and there is also a deformation condition preventing transverse displacements. A joint is placed in the inner diameter of the rope sheave, ensuring the rotation around the z-axis in the direction of the departing side of the rope. Rotation of the sheave occurs only after complete loading of the departing side of the rope by force G
z [N]. Boundary conditions are displayed in
Figure 16b.
In
Table 12, there are listed the values of numerical coefficients of friction f
N [-]. A trend to approximate the experimental values f
2 [-] with increasing load force G
z [N] can be observed (see
Table 4).
From
Table 12, it is evident that the numerically determined value of the friction coefficient f
N [-] is lower than the one determined experimentally f
2 [-] (see
Table 4). This deviation can be caused by several factors, e.g., by simplifying the geometric model, in which the wound strands of the rope were simplified to simple wires with a circular cross-section, infill wires were neglected, and also all inaccuracies that are present in reality have been eliminated. Furthermore, the exact material parameters of the tested rope were not used in the calculation, but these were based on [
41]. For the finite element model, the strands of a rope are considered to be beams, which can also influence the result. The above-mentioned limitations of the model thus can cause, both alone and in combination, a deviation from the real values. Nevertheless, the calculated values are significantly closer to the experiment than to the values given by a relevant standard.
4. Discussion
In [
33] (p. 30) the ratio of the traction and rated torque of the electric motor M
z/M
N = k
e = 1.9 can be found. Considering the overall efficiency of the drive η
c = 1, the theoretical torque on the shaft of the rope sheave at the rated speed of the electric motor n
e = 1.370 min
−1 can be calculated using the relationship (3), which acquires the value of M
2T = 81.2 N·m. At the selected pitch diameter of for the sheave groove D = 320 mm, on the circumference of the sheave groove revolving with the rated speed of the electric motor n
e [min
−1] acts the pulling force F = 2·M
2T/D = 507.7 N. At the moment the laboratory machine starts operating (see
Figure 16), the electric motor drives the moment of engagement M
z = k
e·M
N = 1.9·2.6 = 4.9 N·m and on the perimeter of the rope sheave there is a circumferential force F
z = k
e·F = 1.9·507.7 = 964.7 N. Torque magnitude determined by measurements as M
2(i) [N·m] at the moment of staring the drive is indicated in
Table 1. Torque size M
2(i) [N·m] was calculated from the measured force F
p [N] using a force gauge on the lever arm a = 212 mm (see
Figure 2). The real magnitude of the circumferential force in the sheave groove can be obtained by calculating F
(i) = (F
p·D)/2·a [N], see
Table 1, at the moment of starting the rotation of the designed drive on the laboratory machine (
Figure 17). The theoretical momentum in the shaft of the rope sheave at the moment of starting the operation reaches a value of Mz
2T = 154.4 N·m. The mean value of the measured torque on the shaft of the rope sheave taken at the moment of starting the operation is M
2 = 145.2 N·m, which corresponds to 94% of the magnitude for the theoretically calculated torque Mz
2T [N].
From
Figure 9, it can be observed that the smallest deviations of the measured values for f
2(i) [-], concerning the value stated in the standard as f
T [-] [
13], coefficient of friction for the rope in a semi-circular sheave groove, and for the load on the left side of the rope G
z = 294 N, was achieved during experimental measurements when the surface of the semi-circular groove was contaminated with oil. The mean value of friction coefficient f
2 = 0.1 (see
Table 5) in semi-circular groove contaminated with oil for the rope d
L = 6 mm deviates from the standard value (f
T = 0.12) by 16.7%, and for the clean surface of the groove f
2 = 0.34 (see
Table 2) rises by 183.3%. The mean value of friction f
2 = 0.17 (see
Table 6) in the semi-circular groove contaminated with oil for a rope of d
L = 8 mm, it deviates from standard value by 41.7%, for a clean groove surface f
2 = 0.37 (see
Table 4) than by 208.3%.
Form
Figure 14, it is visible that the smallest deviations of the measured values f
2(i) [-], concerning the values stated by relevant standard f
T [-] [
13], the friction coefficient for a rope in a V-shaped sheave groove for the load on the left side of the rope G
z = 294 N was reached in experimental measurements if the surface of the V-shaped groove was contaminated with oil. The mean value of the friction coefficient f
2 = 0.35 (see
Table 9) in the V-shaped groove dirty with oil, for the rope d
L = 6 mm, deviates from the standard value (f
T = 0.33) by 6.1%, and for a clean groove surface f
2 = 0.35 (see
Table 7) also by 6.1%. The mean value of the friction coefficient f
2 = 0.31 (see
Table 10) in a semi-circular groove contaminated with oil for a rope d
L = 8 mm, it deviates from the standard value by 6.1%, for a clean groove surface f
2 = 0.38 (see
Table 8) then by 15.2%.
The biggest difference between the measured f
2 [-] and theoretically calculated value f
T [N] (see [
13]) of the friction coefficient done for the rope sheave groove can be seen in
Table 4. For departing force G
z = 294 N, out of the 10
th measured values of friction coefficient in a semi-circular groove, the mean value f
2 = 0.38 ± 0.01 is calculated. The maximum value f
2max = 0.39 is thus 3.25 times bigger than f
T = 0.12 recommended by the standard [
13].
Due to the high difference measured and recommended by the standard of the value of the coefficient of friction in the semi-circular groove, the measurement was evaluated by a numerical method in the Ansys Workbench 2020 software environment. Using the numerical method, the task concerning the contact of the rope surface with the rope sheave groove for the known magnitude of force G
z [N] on the side of the rope departing from the rope sheave and the FEM method was used to calculate the friction coefficient f
N [-], see
Table 12. The results of the numerical analysis showed that the numerically determined value of friction coefficient f
N [-] is lower than its value f
2 [-] obtained by experimental measurements on the laboratory machine. The value of the friction coefficient f
N [-] for low values of the departing force G
z [N] from the rope sheave is still more approaching vales f
2 [-] experimentally measured than the value calculated according to [
13]. With increasing tensile force values G
z [N] and F
M2(i) [N] on both sides of the rope, the numerically and experimentally obtained values of the friction coefficient (f
N [-] and f
2 [-]) approximate the value of friction coefficient f
T [-] given in the standard [
13].
5. Conclusions
The paper presents a structural design and description of the operation and basic parts of a laboratory machine that was designed and constructed to determine via an experimental method tensile force in a steel rope in an approaching rope side on a rope sheave. The special design of the laboratory machine makes it possible to determine the actual size of the friction coefficient in the groove of the rope sheave by measuring the values of tensile forces in laboratory conditions, for a predefined period.
The paper aimed to compare the value of the coefficient of friction between the steel rope and the types of grooves used in practice, which are made on the perimeter of the rim in driving rope sheaves, used in those drives where the transfer of tensile force to the traction element is provided by friction. The coefficient of friction was calculated from the values measured on the laboratory machine in the semi-circular and V-shaped groove of a rope sheave driven by an electro-gearbox. The values of the friction coefficient recommended by CSN standard [
13], when checking the traction capability in case of “cage loading and emergency braking” or in case of “standing balancing weight”, are the minimum, value of all values possible in practice. Lower values of the coefficient of friction were achieved at higher values of the tensile force acting on the approaching side of the rope from the driving rope sheave. Higher values of the friction coefficient were used to show measurements carried out on a laboratory machine when the contact surfaces condition for the rope sheave groove and the rope surface was dry and clean. The lowest values of friction coefficient were calculated when the contact surfaces of the sheave groove and rope surface were contaminated with oil. In practice, this operating condition is defined by a lubricant which is extruded from the fibrous rope core, or by a lubricant that is applied to the rope surface to limit the corrosion of wires.
From the measured tensile forces developments in the approaching side at known weights hoisted on the end of the rope present on the departing rope side of the driving sheave, and with the known angle of wrap for the rope in sheave, using Euler’s formula the values of friction coefficient were calculated. The drive of our laboratory device created a circumferential force on the circumferential sheave groove during the start of the rotation, the size of which increased the instantaneous value of the tensile force on the rope side approaching the rope sheave. The actual magnitude of the torque on the shaft of the rope sheave was measured on a laboratory machine using an experimental method, the principle of which is presented in
Figure 2.
A unique contribution of this paper is the values listed in the tables, which represent measured tensile forces for different operating conditions of contact areas of groove and rope surface, which is due to the influence of fibre (shear) friction carried in the groove of the rope sheave.
By successive (repeated under the same conditions) laboratory measurements of the tractive force F
M2(i) [N] on the advancing side of the cable on the pulley at a known belting angle λ = 180 deg, it is possible to determine on laboratory equipment (
Figure 1 and
Figure 7) by the indirect method the actual value of the coefficient of friction in a given type of cable groove (semicircular, V-groove) under the operating conditions of surface contamination (clean and dry, contaminated with oil, etc.) of the groove surfaces in contact with the steel cable. The actual value of the friction coefficient obtained by laboratory measurement can be verified with the values theoretically calculated (see [
13]).
A completely new finding in the paper can be considered the determination of friction coefficient in the contact area between the semi-circular groove and the rope surface, expressed by the numerical method of FEM in using the Ansys Workbench 2020 software for the known magnitude of tensile forces for both approaching and departing sides of the rope.


