
Online Monitoring of Surface Quality for Diagnostic Features in 3D Printing


Abstract
:1. Introduction
- Quality assurance (QA) derived from build planning (the use of advanced modeling and simulation to develop a plan for a machine to produce a specific part);
- Build monitoring and inspection (monitoring the build process with sensors while the part is being constructed);
- Feedback control to link the previous pillars together (using data from the build monitoring sensors to iteratively update the build plan).
- -
- -
- -
- -
- The diverse methods available for assessing the quality of images;
- -
- The possibility of using multiple cameras simultaneously to capture images from several sides of the printed object;
- -
- -
- The ease with which cameras can be integrated into equipment;
- -
- The wide variety of image quality characteristics that can be evaluated with cameras (geometric deviations, infill structures, layer shifting, and surface defects, such as voids, overfill, underfill, blobs, cracks, misalignment, warping, detachment (delamination), etc.).
- Surface quality assessment; i.e., the presence of defects, such as voids, cracks, blobs, and misalignment;
- Determination of geometric deviations in the dimensions of a printed object through comparison with the object’s CAD model;
- Determination of the print output parameters, such as layer, height, layer contour, material color, etc.
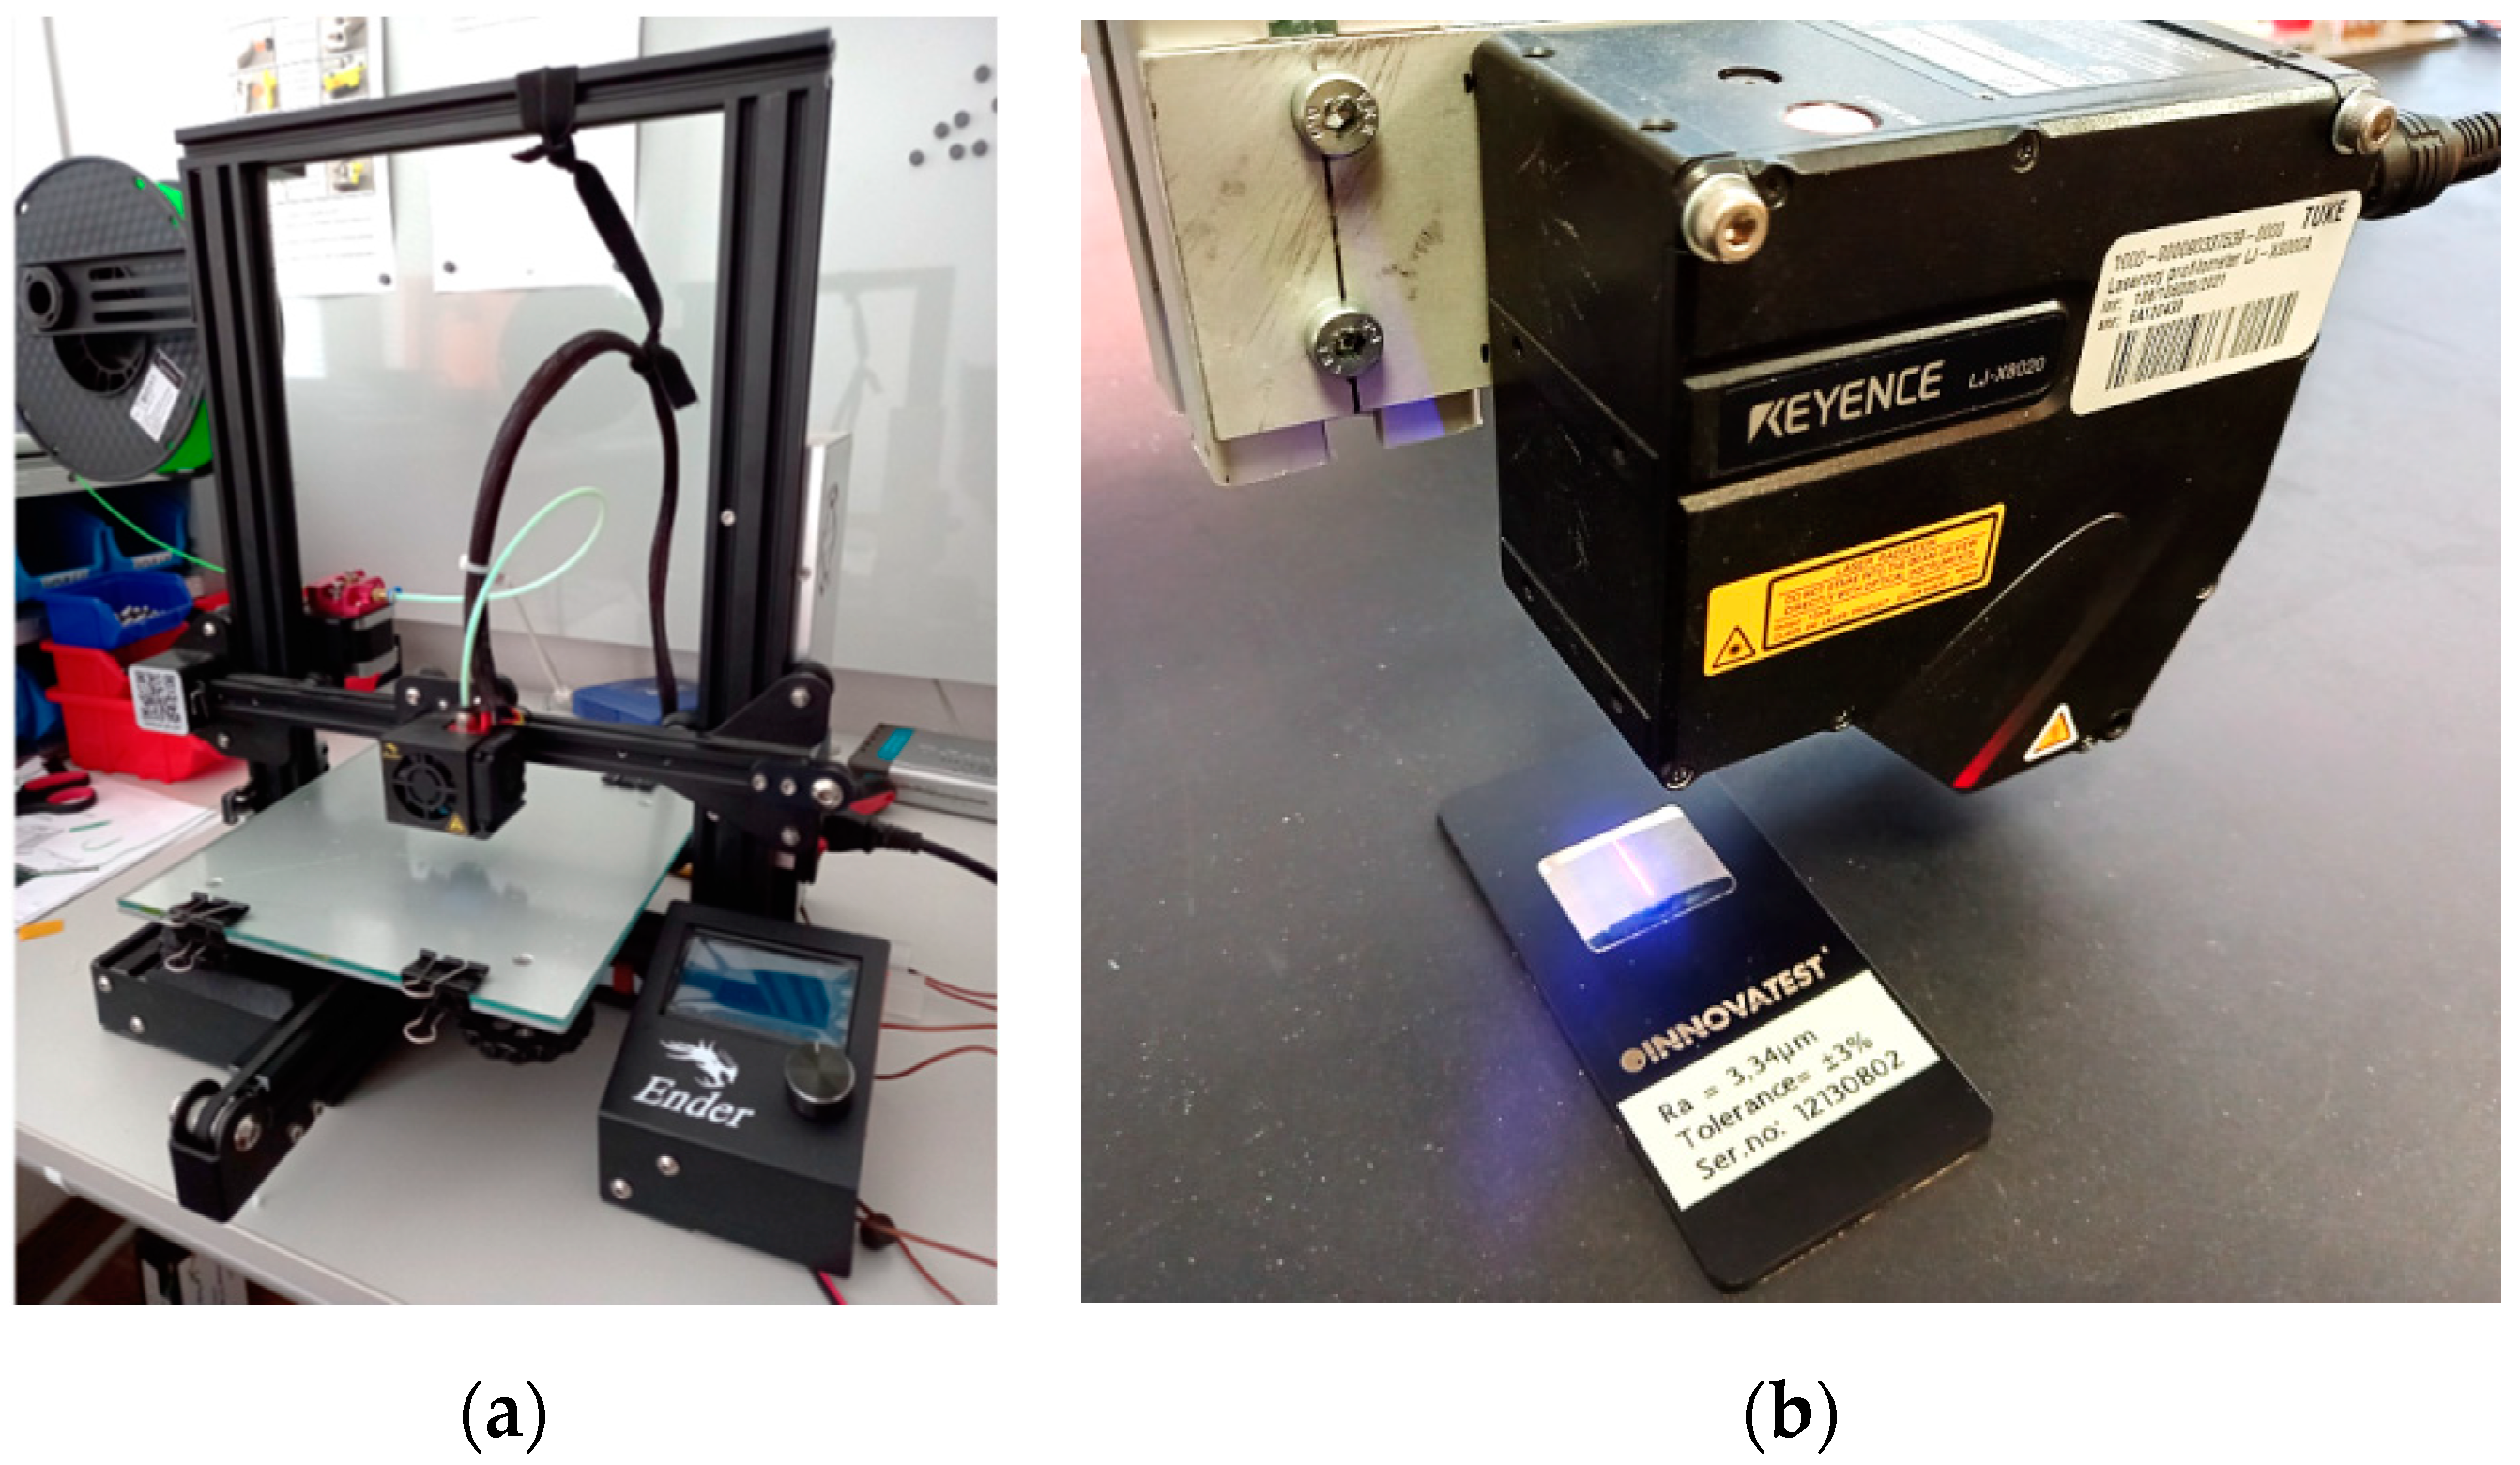
2. Materials and Methods
3. Results and Discussion
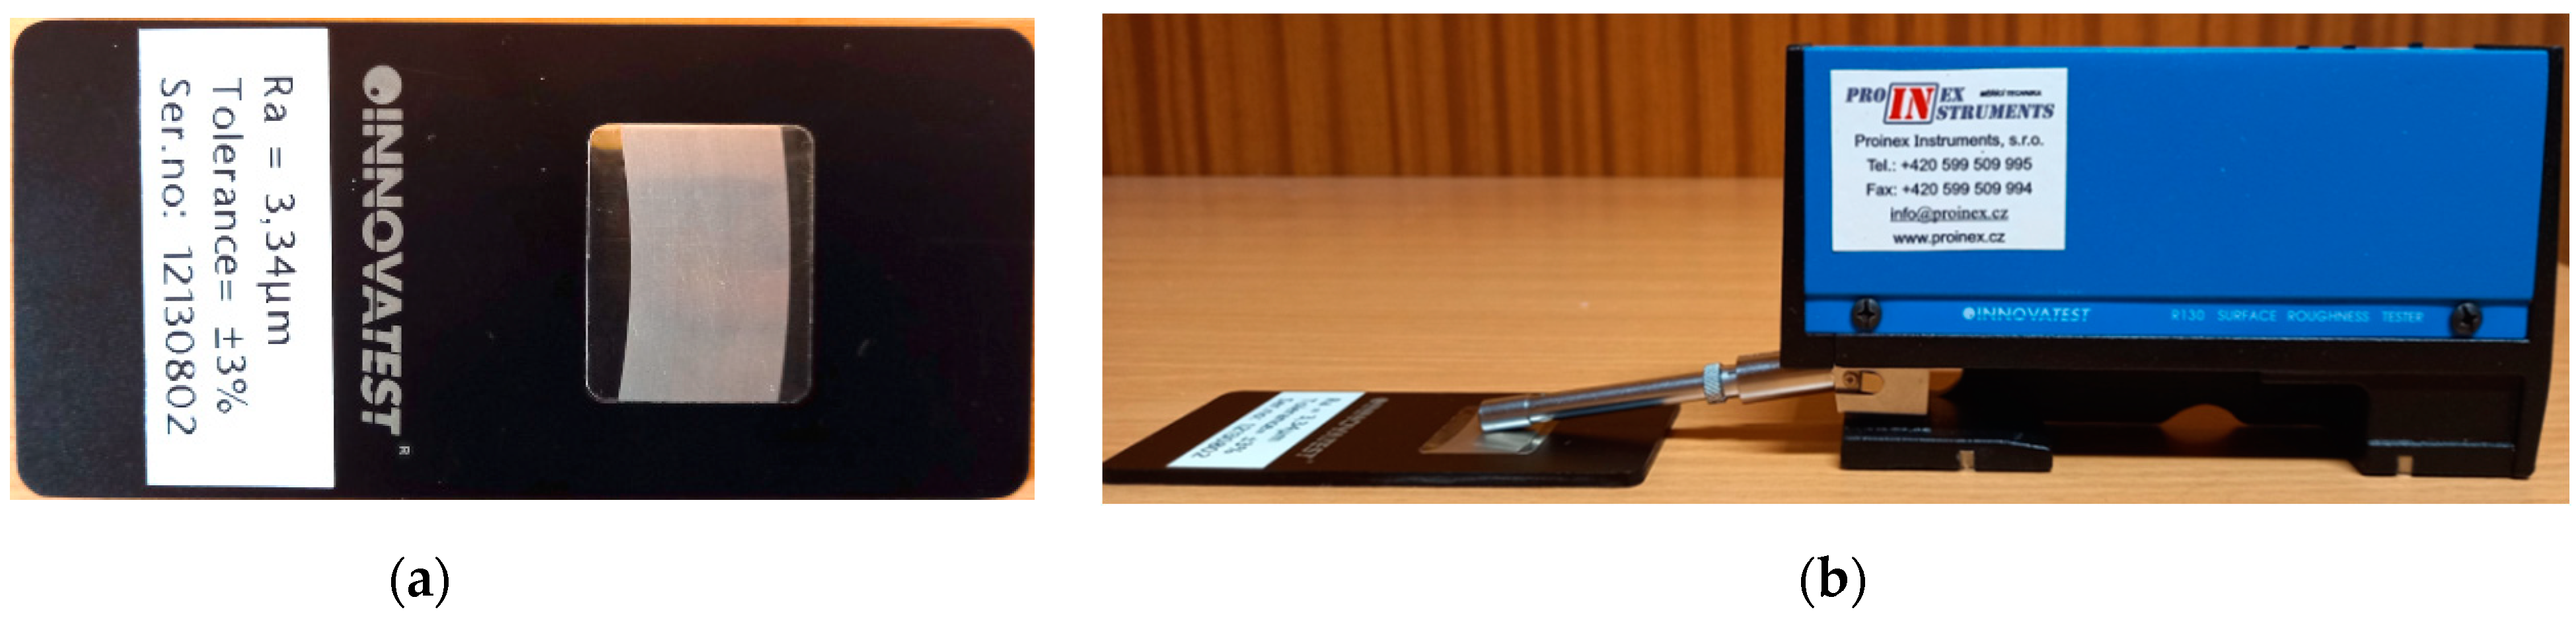
3.1. Calibration of R130 Roughness Tester
- -
- Ra and Rz measurement ranges: 0.03 μm–6.3 μm and 0.2 μm–18.5 μm, respectively;
- -
- Display resolution: 0.01 μm;
- -
- Cut-off: 0.25 mm; 0.8 mm; 2.5 mm;
- -
- ANSI 2RC filter, Sino Age Development Technology, Ltd., Beijing, China.
3.2. Roughness Parameter Measurement on the Metal Reference Specimen with Contact and Non-Contact Methods
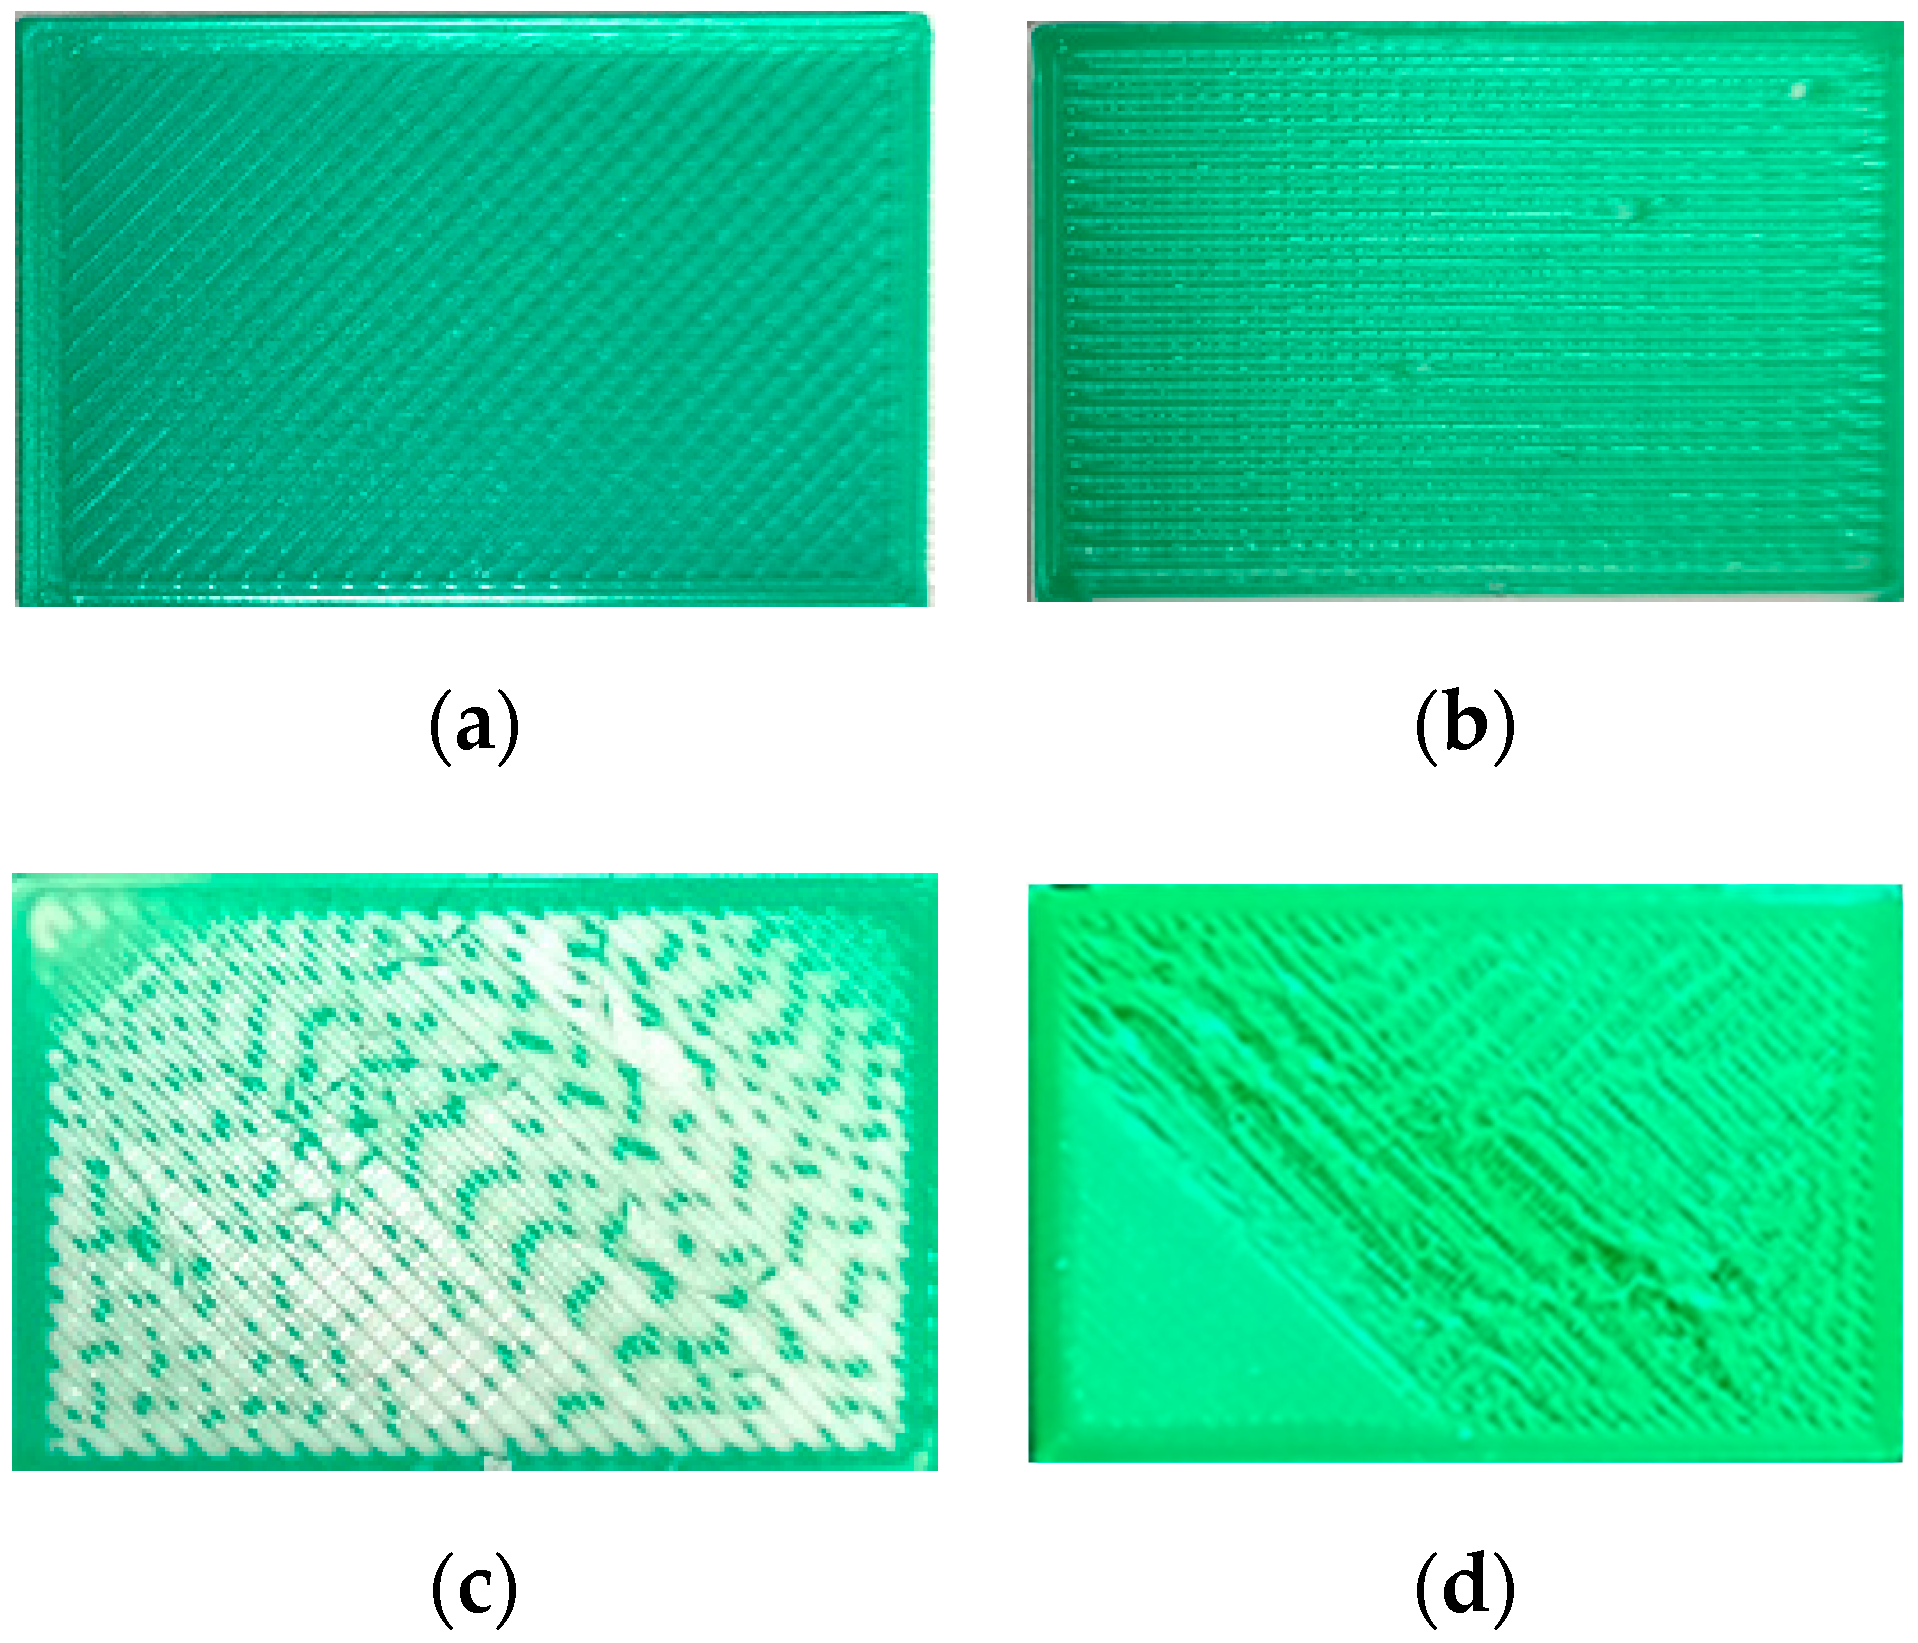
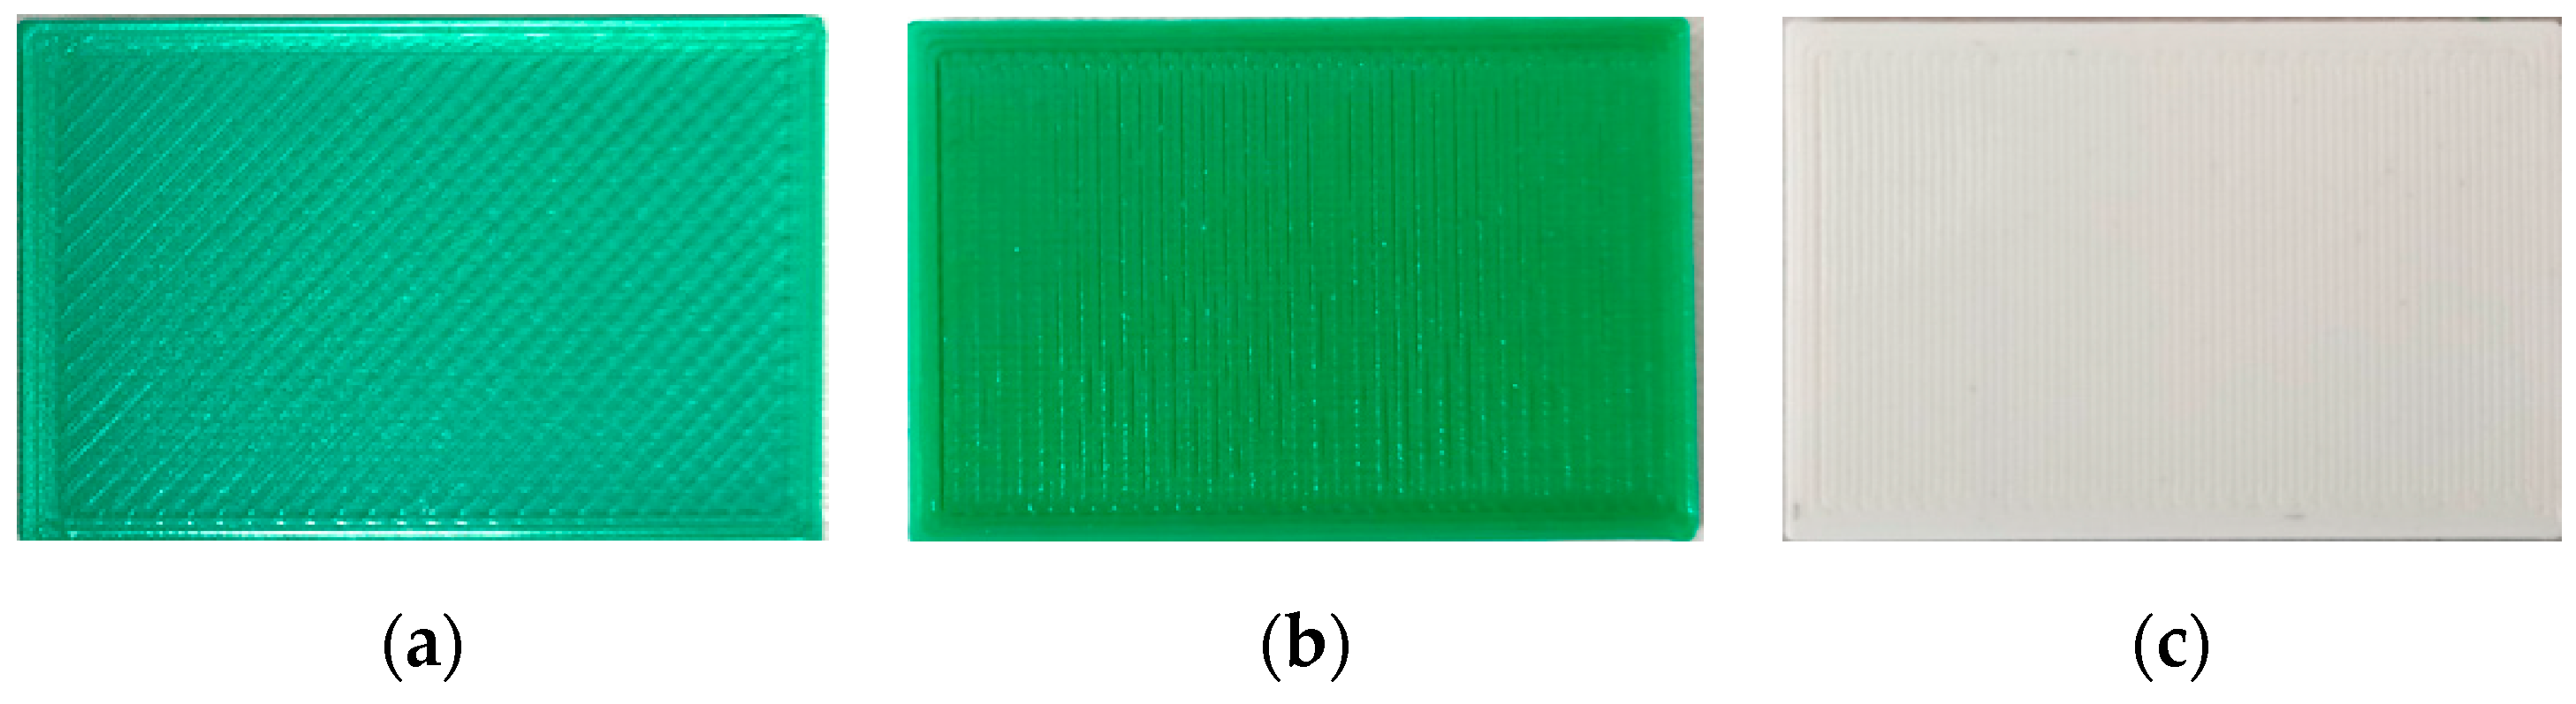
3.3. Roughness Parameter Measurement for the Plastic Samples with Contact and Non-Contact Methods
3.4. Diagnostic Feature Detection Using NI-LabVIEW
- The Configure Statistics [Statistics] block, which includes Range in the time domain and Arithmetic Mean, RMS, Standard Deviation, Variation, Median, Mode, and Summation in the frequency domain.
- The Configure Spectral Measurements block, which includes the signal spectral characteristics Magnitude Peak, Power Spectrum, and Power Spectral Density (PSD) in the frequency domain.
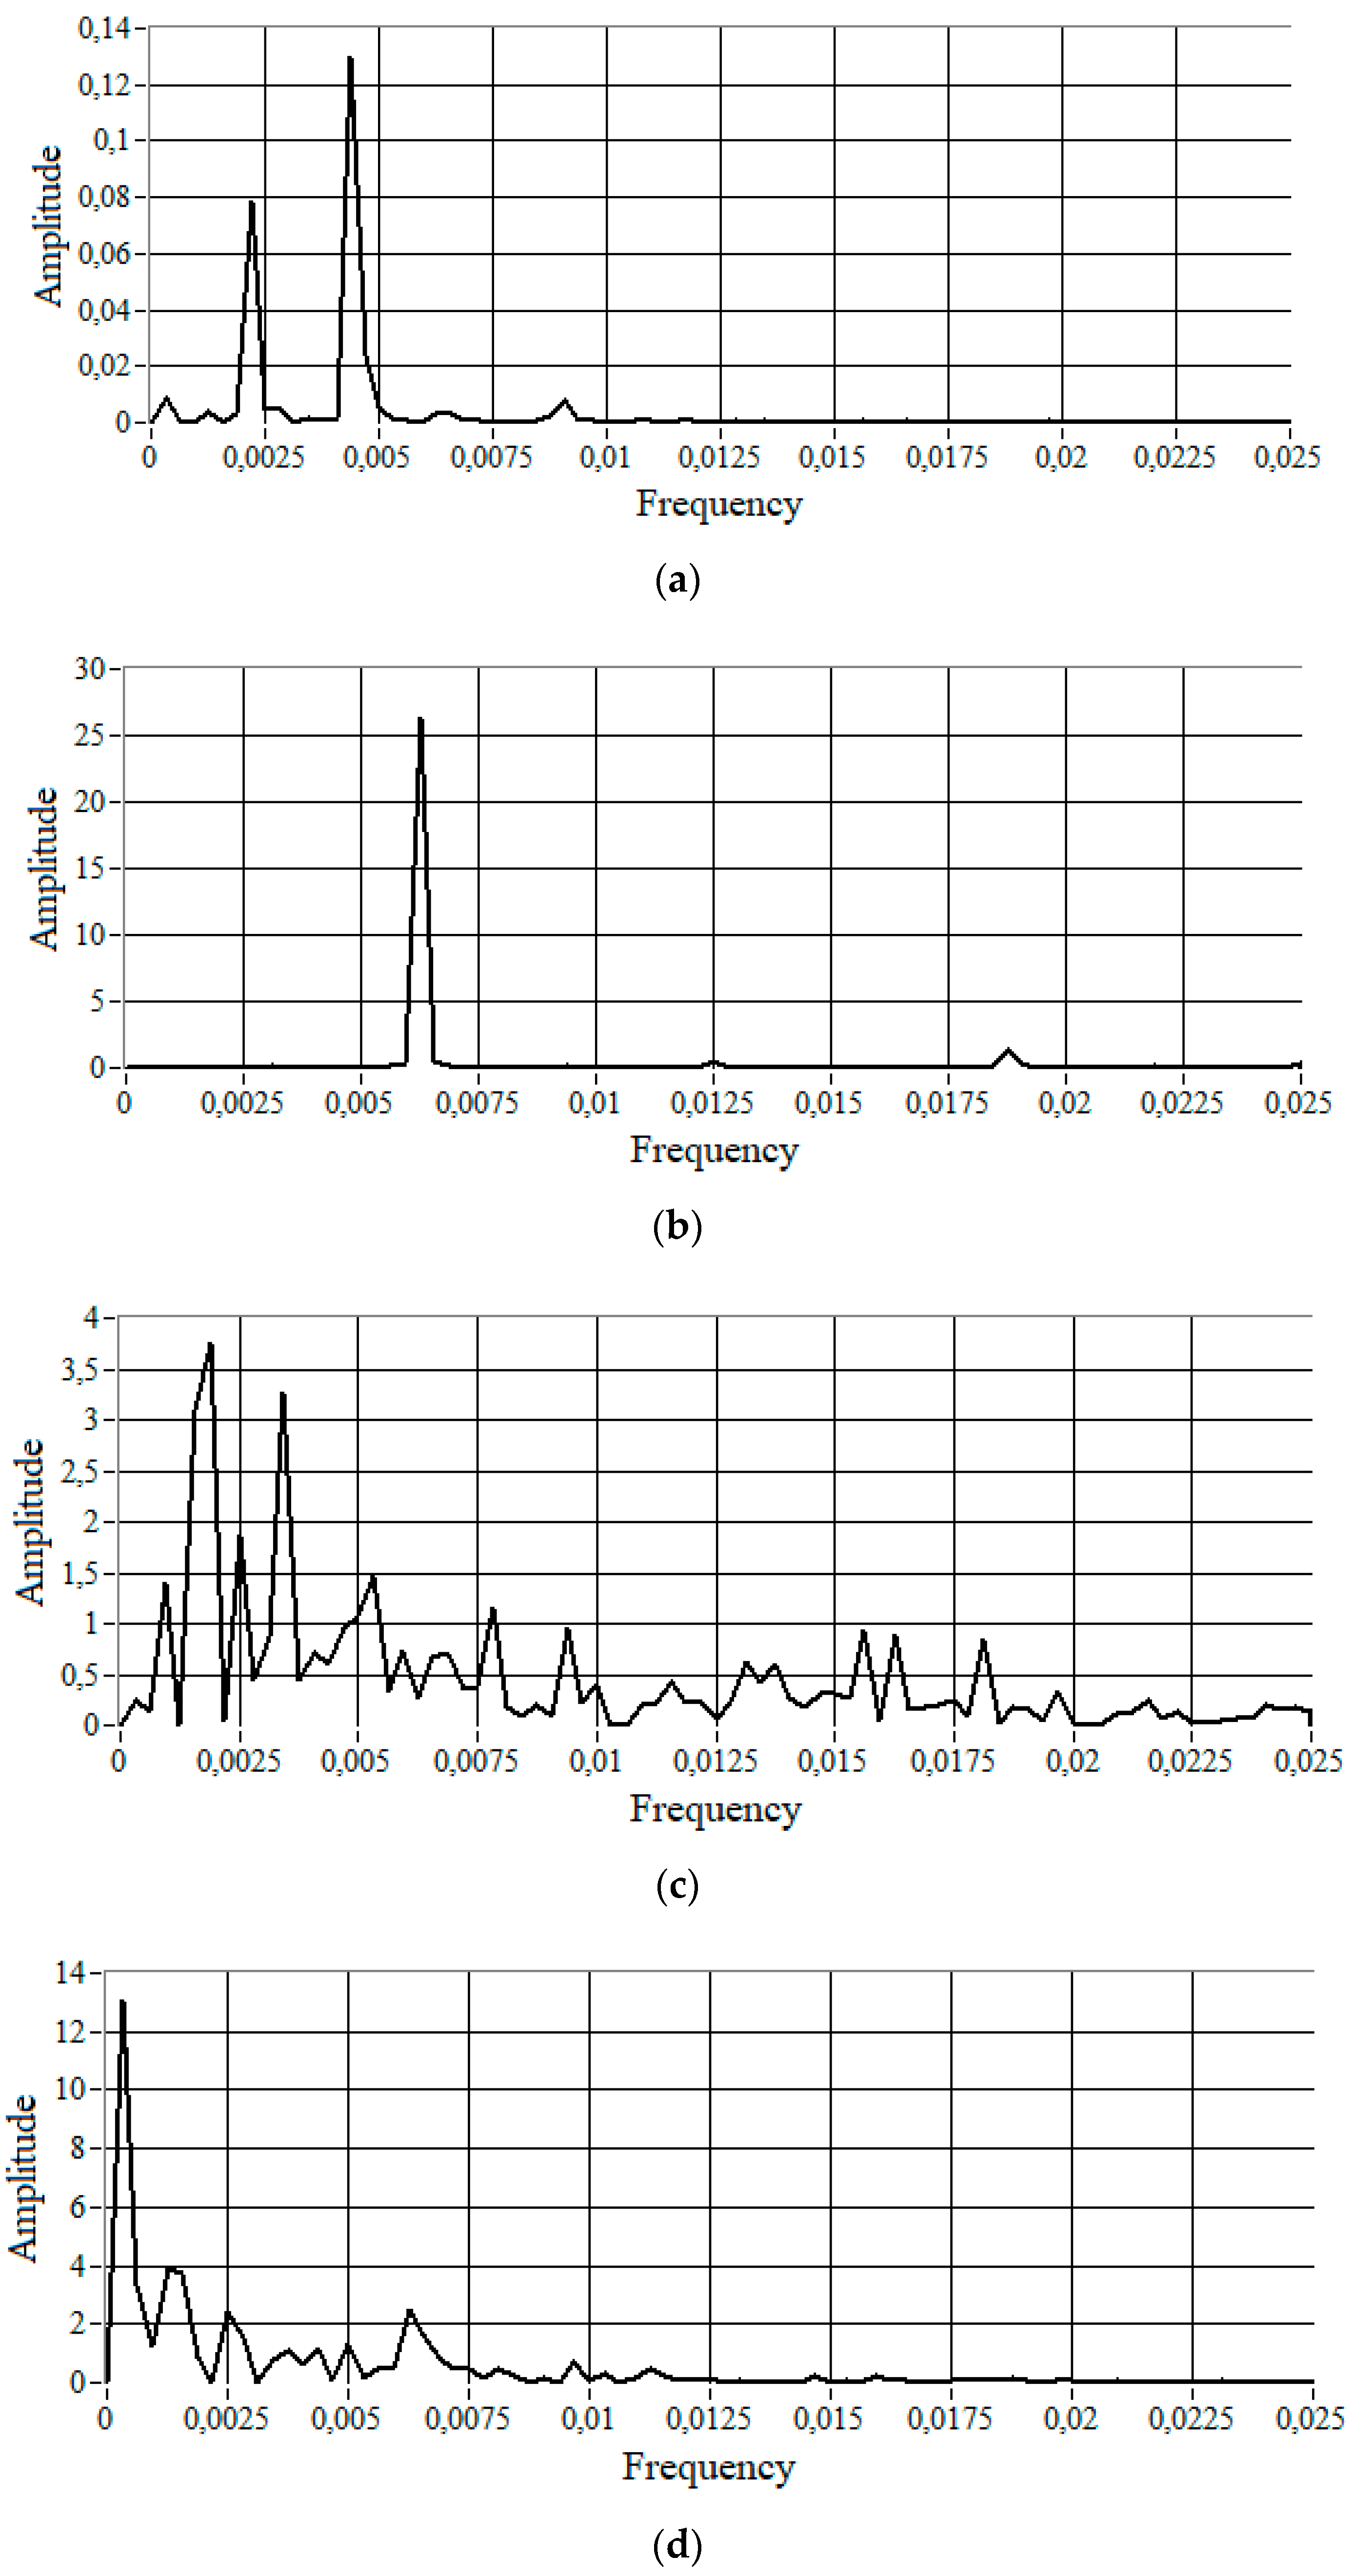
- The PSD for a reference (defect-free) sample (Figure 9a) was characterized by four pronounced harmonics at the following relative frequencies (signal amplitudes are indicated in parentheses):
- f1 = 0.000313 (A = 0,00885618);
- f2 = 7f1 = 0.002188 (A = 0.0781748);
- f3 = 14f1 = 0.004375 (A = 0.129859);
- f4 = 28f1 = 0.009062 (A = 0.00748143).
- The PSD for an under-extrusion-type defect sample (Figure 9b) was characterized by three harmonics at the following frequencies:
- f1/ = 20f1 = 0.00625 (A = 26.376);
- f2/ = 40f1 = 2f1/ = 0.0125 (A = 0.577246);
- f3/ = 60f1 = 3f1/ = 0.01875 (A = 1.41452).
3.5. Discussion
4. Conclusions
Author Contributions
Funding
Institutional Review Board Statement
Informed Consent Statement
Data Availability Statement
Conflicts of Interest
References
- Business Data Platform. Available online: https://www.statista.com (accessed on 22 February 2022).
- Shahrubudin, N.; Lee, T.C.; Ramlan, R. An overview on 3D printing technology: Technological, materials, and applications. Procedia Manuf. 2019, 35, 1286–1296. [Google Scholar] [CrossRef]
- Rahim, T.; Abdullah, A.; Akil, H. Recent developments in fused deposition modeling-based 3D printing of polymer sand their composites. Polym. Rev. 2019, 59, 589–624. [Google Scholar] [CrossRef]
- Kaščak, J.; Gašpár, Š.; Paško, J.; Husár, J.; Knapčíková, L. Polylactic acid and its cellulose based composite as a significant tool for the production of optimized models modified for additive manufacturing. Sustainability 2021, 13, 1256. [Google Scholar] [CrossRef]
- Kaščak, J.; Gašpár, Š.; Paško, J.; Knapčíková, L.; Husár, J.; Baron, P.; Török, J. Design of an atypical construction of equipment for additive manufacturing with a conceptual solution of a printhead intended for the use of recycled plastic materials. Appl. Sci. 2021, 11, 2928. [Google Scholar] [CrossRef]
- Wing, I.; Gorham, R.; Sniderman, B. 3D Opportunity for Quality Assurance and Parts Qualification. Additive Manufacturing Clears the Bar. Available online: https://www2.deloitte.com/content/dam/insights/us/articles/3d-printing-quality-assurance-in-manufacturing/DUP_1410-3D-opportunity-QA_MASTER1.pdf (accessed on 28 February 2022).
- 44 Issues Explained You’re Your Prints Looking Perfect, Not Pathetic. Available online: https://rigid.ink/pages/ultimate-troubleshooting-guide (accessed on 13 March 2022).
- First Layer Problems. Available online: https://3dprintguides.com/2020/04/3d-printing-first-layer-problems/ (accessed on 22 November 2021).
- The Definitive Guide to Solving 3D Printing Problems by Bitlab. Available online: https://bitfab.io/blog/3d-printing-problems/ (accessed on 12 March 2022).
- Fu, Y.; Downey, A.; Yuan, L.; Pratt, A.; Balogun, Y. In situ monitoring for fused filament fabrication process: A review. Addit. Manuf. 2021, 38, 101749. [Google Scholar] [CrossRef]
- Okarma, K.; Fastowicz, J. Improved quality assessment of colour surfaces for additive manufacturing based on image entropy. Pattern Anal. Appl. 2020, 23, 1035–1047. [Google Scholar] [CrossRef] [Green Version]
- Fastowicz, J.; Grudziński, M.; Tecław, M.; Okarma, K. Objective 3D printed surface quality assessment based on entropy of depth maps. Entropy 2019, 21, 97. [Google Scholar] [CrossRef] [PubMed] [Green Version]
- Carlota, V. How to Avoid 3D Printing Problems. Available online: https://www.3dnatives.com/en/how-to-avoid-3d-printing-problems-26102020/ (accessed on 18 March 2022).
- Jin, Z.; Zhang, Z.; Gu, G.X. Autonomous in-situ correction off used deposition modeling printers using computer vision and deep learning. Manuf. Lett. 2019, 22, 11–15. [Google Scholar] [CrossRef]
- Kadam, V.; Kumar, S.; Bongale, A.; Wazarkar, S.; Kamat, P.; Patil, S. Enhancing surface fault detection using machine learning for 3D printed products. Appl. Syst. Innov. 2021, 4, 34. [Google Scholar] [CrossRef]
- Wang, Y.; Huang, J.; Wang, Y.; Feng, S.; Peng, T.; Yang, H.; Zou, J. A CNN-based adaptive surface monitoring system for fused deposition modeling. IEEE/ASME Trans. Mechatron. 2020, 25, 2287–2296. [Google Scholar] [CrossRef]
- 3D Printing First Layer Problems: Troubleshooting and How to Fix. Available online: https://www.elegoo.com/blogs/learn/3d-printing-first-layer-problems-troubleshooting-and-how-to-fix (accessed on 10 August 2021).
- 3D Printer Layer Shifting. Available online: https://all3dp.com/2/layer-shifting-3d-printing-tips-tricks-to-solve-it/ (accessed on 23 May 2021).
- Günaydin, K.; Türkmen, H.S. Common FDM 3D Printing Defects. In Proceedings of the 3rd International Congress on 3D Printing (Additive Manufacturing) Technologies and Digital Industry 2018, Antalya, Turkey, 19–21 April 2018; pp. 368–369. [Google Scholar]
- Liu, J.; Hu, Y.; Wu, B.; Wang, Y. An improved fault diagnosis approach for FDM process with acoustic emission. J. Manuf. Processes 2018, 35, 570–579. [Google Scholar] [CrossRef]
- Wu, H.; Wang, Y.; Yu, Z. In situ monitoring of FDM machine condition via acoustic emission. Int. J. Adv. Manuf. Technol. 2016, 84, 1483–1495. [Google Scholar] [CrossRef]
- Wu, H.; Yu, Z.; Wang, Y. Real-time FDM machine condition monitoring and diagnosis based on acoustic emission and hidden semi-Markov model. Int. J. Adv. Manuf. Technol. 2017, 90, 2027–2036. [Google Scholar] [CrossRef]
- Li, F.; Yu, Z.; Yang, Z.; Shen, X. Real-time distortion monitoring during fused deposition modeling via acoustic emission. Struct. Health Monit. 2019, 19, 412–423. [Google Scholar] [CrossRef]
- Kousiatza, C.; Chatzidai, N.; Karalekas, D. Temperature Mapping of 3D Printed Polymer Plates: Experimental and Numerical Study. Sensors 2017, 17, 456. [Google Scholar] [CrossRef] [PubMed] [Green Version]
- Dinwiddie, R.B.; Love, L.; Rowe, J.C.; Stockton, G.R.; Colbert, F.P. Real-time process monitoring and temperature mapping of a 3D polymer printing process. Proc. SPIE 2013, 8705, 87050L-1–87050L-9. [Google Scholar]
- Ketai, H.; Huan, W.; Huaqing, H. Approach to online defect monitoring in fused deposition modeling based on the ariation of the temperature field. Complexity 2018, 2018, 3426928. [Google Scholar]
- Li, Z.; Zhang, D.; Shao, L.; Han, S. Experimental investigation using vibration testing method to optimize feed parameters of color mixing nozzle for fused deposition modeling color 3D printer. Adv. Mech. Eng. 2019, 11, 1687814019896196. [Google Scholar] [CrossRef]
- Li, Y.; Zhao, W.; Li, Q.; Wong, T.; Wang, G. In-situ monitoring and diagnosing for fused filament fabrication process based on vibration sensors. Sensors 2019, 19, 2589. [Google Scholar] [CrossRef] [Green Version]
- Tlegenov, Y.; Feng, L.W.; Soon, H.G. A dynamic model for current-based nozzle condition monitoring in fused deposition modelling. Prog. Addit. Manuf. 2019, 4, 211–223. [Google Scholar] [CrossRef] [Green Version]
- Kim, C.; Espalin, D.; Cuaron, A.; Perez, M.A.; Macdonald, E.; Wicker, R.B. A study to detect a material deposition status infused deposition modeling technology. In Proceedings of the 2015 IEEE International Conference on Advanced Intelligent Mechatronics (AIM), Busan, Korea, 7–11 July 2015; pp. 779–783. [Google Scholar]
- Kim, C.; Espalin, D.; Cuaron, A.; Perez, M.A.; Macdonald, E.; Wicker, R.B. Unobtrusive in situ diagnostics of filament-fed material extrusion additive manufacturing. IEEE Trans. Compon. Packag. Manuf. Technol. 2018, 8, 1469–1476. [Google Scholar] [CrossRef]
- Zidek, K.; Maxim, V.; Pitel, J.; Hosovsky, A. Embedded vision equipment of industrial robot for inline detection of product errors by clustering-classification algorithms. Int. J. Adv. Robot. Syst. 2016, 13, 4901. [Google Scholar] [CrossRef] [Green Version]
- Zidek, K.; Pitel, J.; Hosovsky, A. Machine learning algorithms implementation into embedded systems with web application user interface. In Proceedings of the IEEE 21st International Conference on Intelligent Engineering Systems 2017 (INES 2017), Larnaca, Cyprus, 20–23 October 2017; pp. 77–81. [Google Scholar]
- Lishchenko, N.; Larshin, V.; Basharov, R. Diagnostics of drilling in numerically controlled machine tools. Russ. Eng. Res. 2016, 36, 77–80. [Google Scholar] [CrossRef]
- Lishchenko, N.; Larshin, V.; Piteľ, J. Detecting systematic and random component of surface roughness signal. Her. Adv. Inf. Technol. 2020, 3, 61–71. [Google Scholar]
- Fastowicz, J.; Bak, D.; Okarma, K. Quality Assessment of 3D Printed Surfaces in Fourier Domain. In Proceedings of the International Conference on Image Processing and Communications, Bydgoszcz, Poland, 13–14 September 2017; pp. 75–81. [Google Scholar]
- MacDonald, E.; Burden, E.; Walker, J.; Kelly, J.; Conner, B.; Patterson, C.; Schmidt, A.; Bader, A. Spatial Frequency Analysis for Improved Quality in Big Area Additive Manufacturing (BAAM). In Proceedings of the ASME 2017 International Mechanical Engineering Congress and Exposition, Tampa, FL, USA, 3–9 November 2017; p. 2. [Google Scholar]
- Mital’, G.; Dobránsky, J.; Ružbarský, J.; Olejárová, Š. Application of laser profilometry to evaluation of the surface of the workpiece machined by abrasive water jet technology. Appl. Sci. 2019, 9, 2134. [Google Scholar] [CrossRef] [Green Version]
- Siklienka, J.Š.M. The effect of a laser beam wavelength on accuracy of surface measurement of unevenness of beechwood by laser beam. Acta Fac. Xylologiae Zvolen 2018, 60, 137–145. [Google Scholar]
- Mitaľ, G. Contactless measurement and evaluation machined surface roughness using laser profilometry. Transf. Inovácií 2021, 43, 19–24. [Google Scholar]
- Kreheľ, R.; Straka, Ľ.; Krenický, T. Diagnostics of production systems operation based on thermal processes evaluation. Appl. Mech. Mater. 2013, 308, 121–126. [Google Scholar] [CrossRef]
- Lednev, V.N.; Sdvizhenskii, P.A.; Asyutin, R.D.; Tretyakov, R.S.; Grishin, M.Y.; Anton, Y.; Stavertiy, A.Y.; Fedorov, A.N.; Pershin, S.M. In situ elemental analysis and failures detection during additive manufacturing process utilizing laser induced breakdown spectroscopy. Opt. Express 2019, 27, 4612–4628. [Google Scholar] [CrossRef]
- Yang, T.; Jin, Y.; Squires, B.; Choi, T.-Y.; Dahotre, N.B.; Neogi, A. In-situ monitoring and ex-situ elasticity mapping of laser induced metal melting pool using ultrasound: Numerical and experimental approaches. J. Manuf. Processes 2021, 71, 178–186. [Google Scholar] [CrossRef]
- Leung, C.L.A.; Marussi, S.; Atwood, R.C.; Towrie, M.; Withers, P.J.; Lee, P.D. In situ X-ray imaging of defect and molten pool dynamics in laser additive manufacturing. Nat. Commun. 2018, 9, 1355. [Google Scholar] [CrossRef] [PubMed] [Green Version]
- Borish, M.; Post, B.K.; Roschli, A.; Chesser, P.C.; Love, L.J.; Gaul, K.T.; Sallas, M.; Tsiamis, N. In-situ thermal imaging for single layer build time alteration in large-scale polymer additive manufacturing. Procedia Manuf. 2019, 34, 482–488. [Google Scholar] [CrossRef]
- Lishchenko, N.; Lazorik, P.; Demčák, J.; Pitel’, J.; Židek, K. Quality control monitoring in 3D printing. In Advances in Design, Simulation and Manufacturing V.; Springer: Cham, Switzerland, 2022; pp. 31–40. [Google Scholar]


| Sensor (Signal) Type | Quality Characteristics |
|---|---|
| Accelerometer | Nozzle clogging Filament jamming Material leakage Extrusion stopping |
| Thermal camera | Nozzle clogging Irregular material flow |
| Acoustic emission | Filament breakage Extruder state Fan activity |
| Current, force, and pressure | Nozzle clogging Sabotage attacks in G-code Extrusion pressure Material flow rate |
| Parameter | Value | Units |
|---|---|---|
| Nozzle diameter | 0.4 | mm |
| Filament size | 1.75 | mm |
| Layer thickness | 0.2 | mm |
| Raster angle | 45.90 | degree |
| Raster width | 0.4 | mm |
| Bed temperature | 60 | °C |
| Printing temperature | 210 | °C |
| Printing speed | 45 | mm/s |
| Infill density | 20 | % |
| Infill flow | 100 | % |
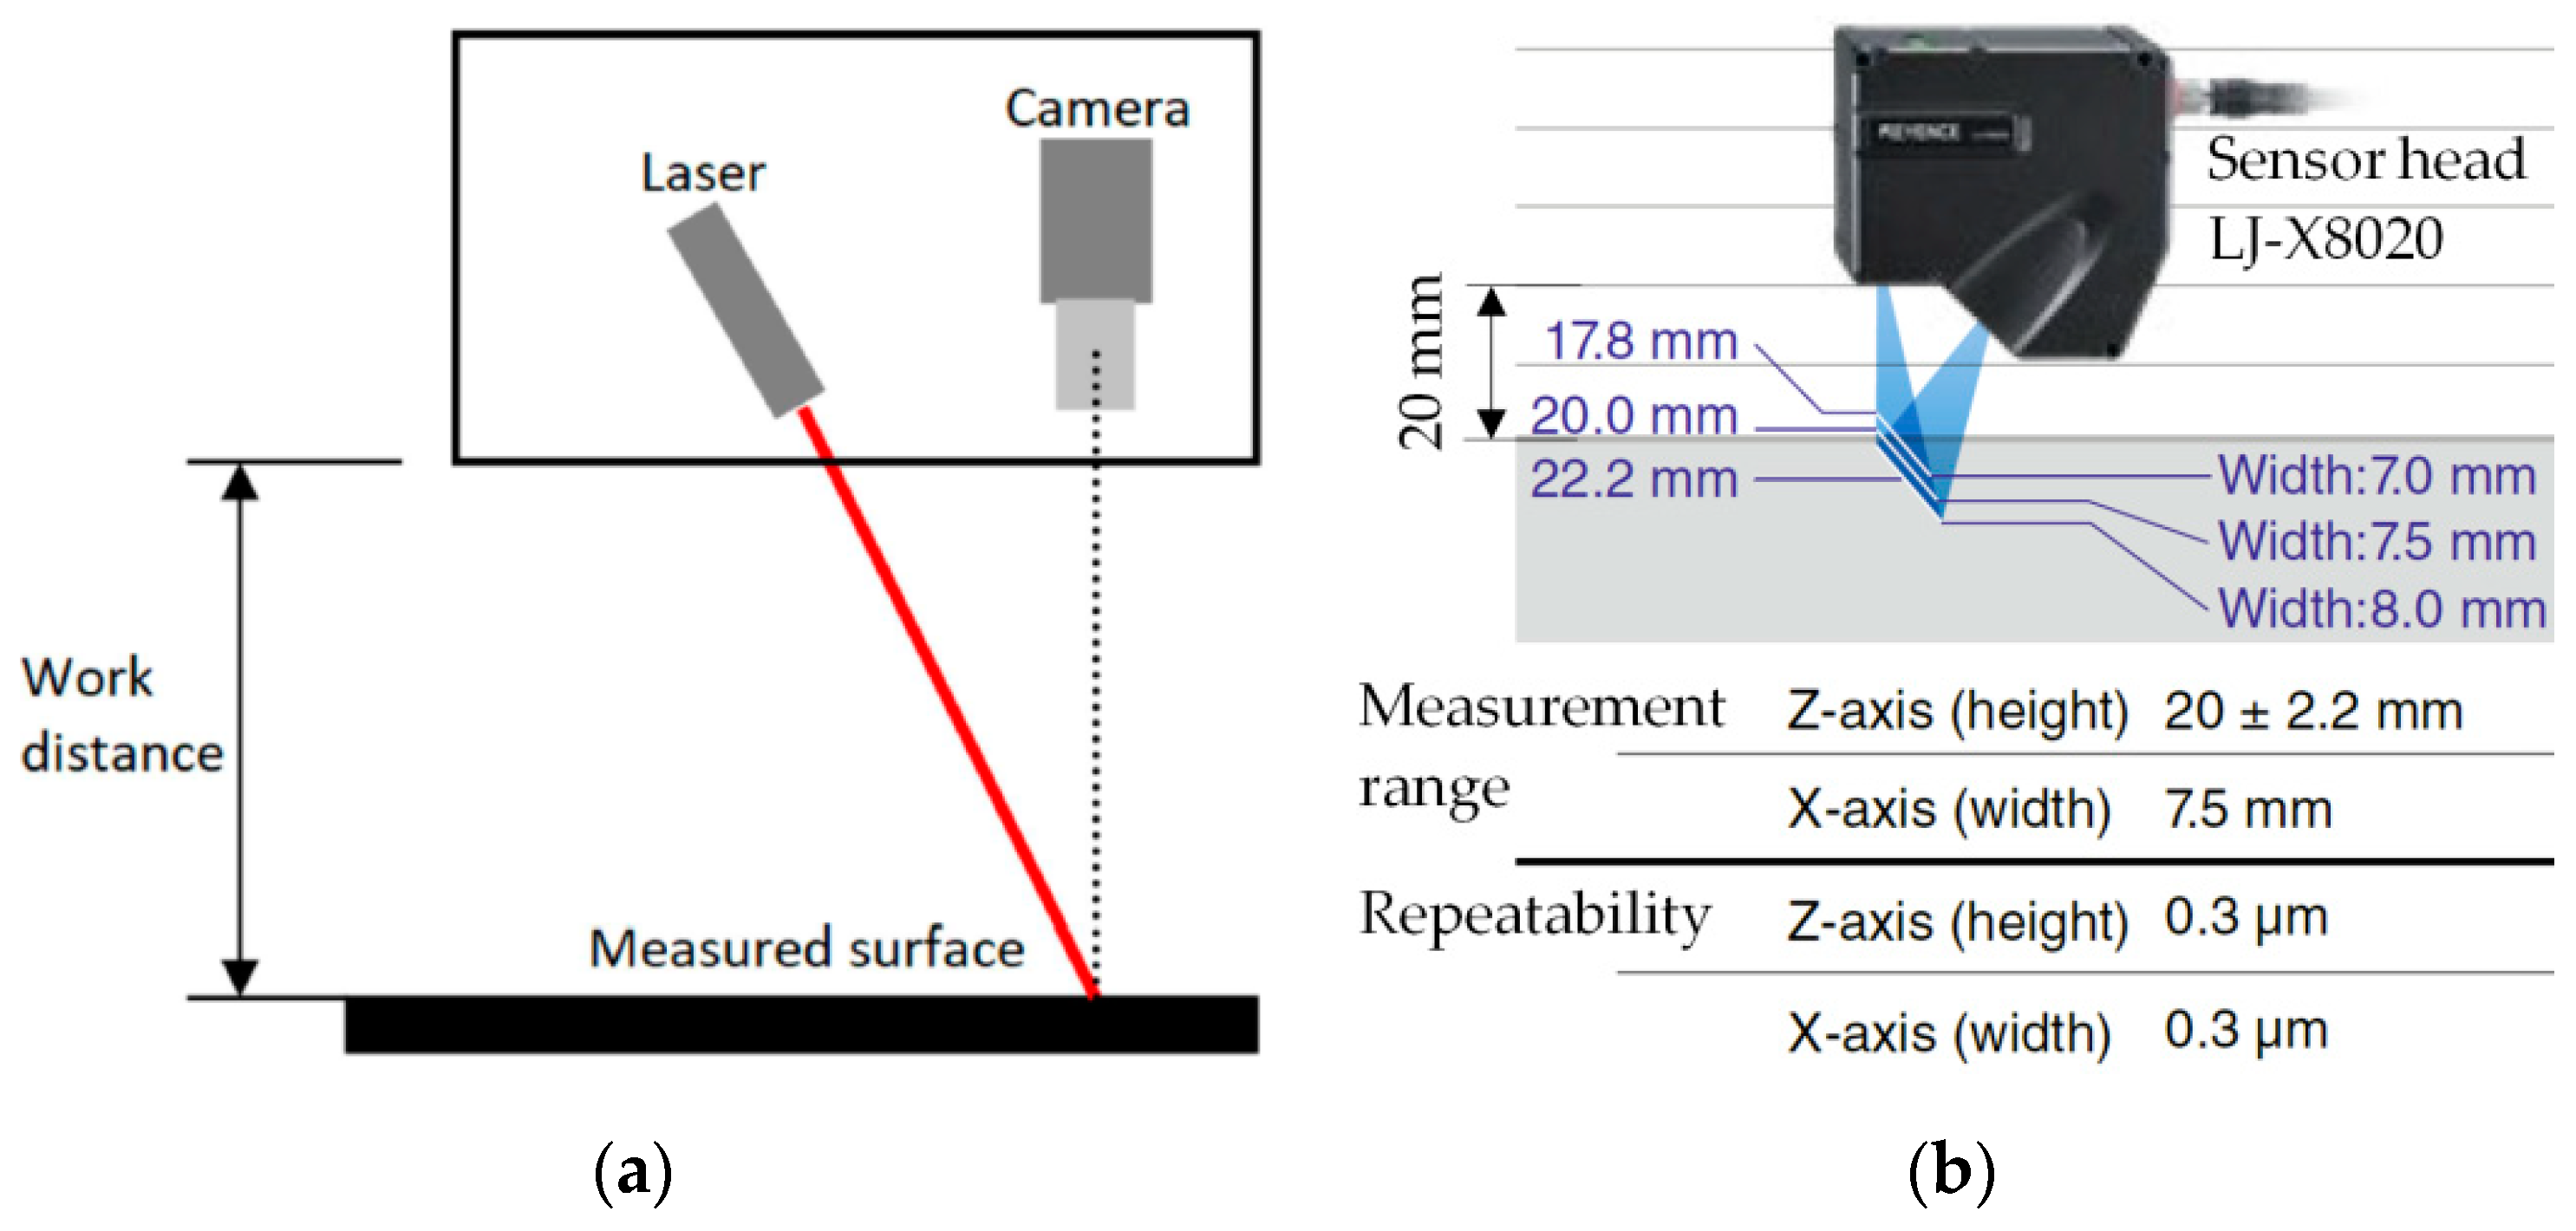
| Specification | Name | Value |
|---|---|---|
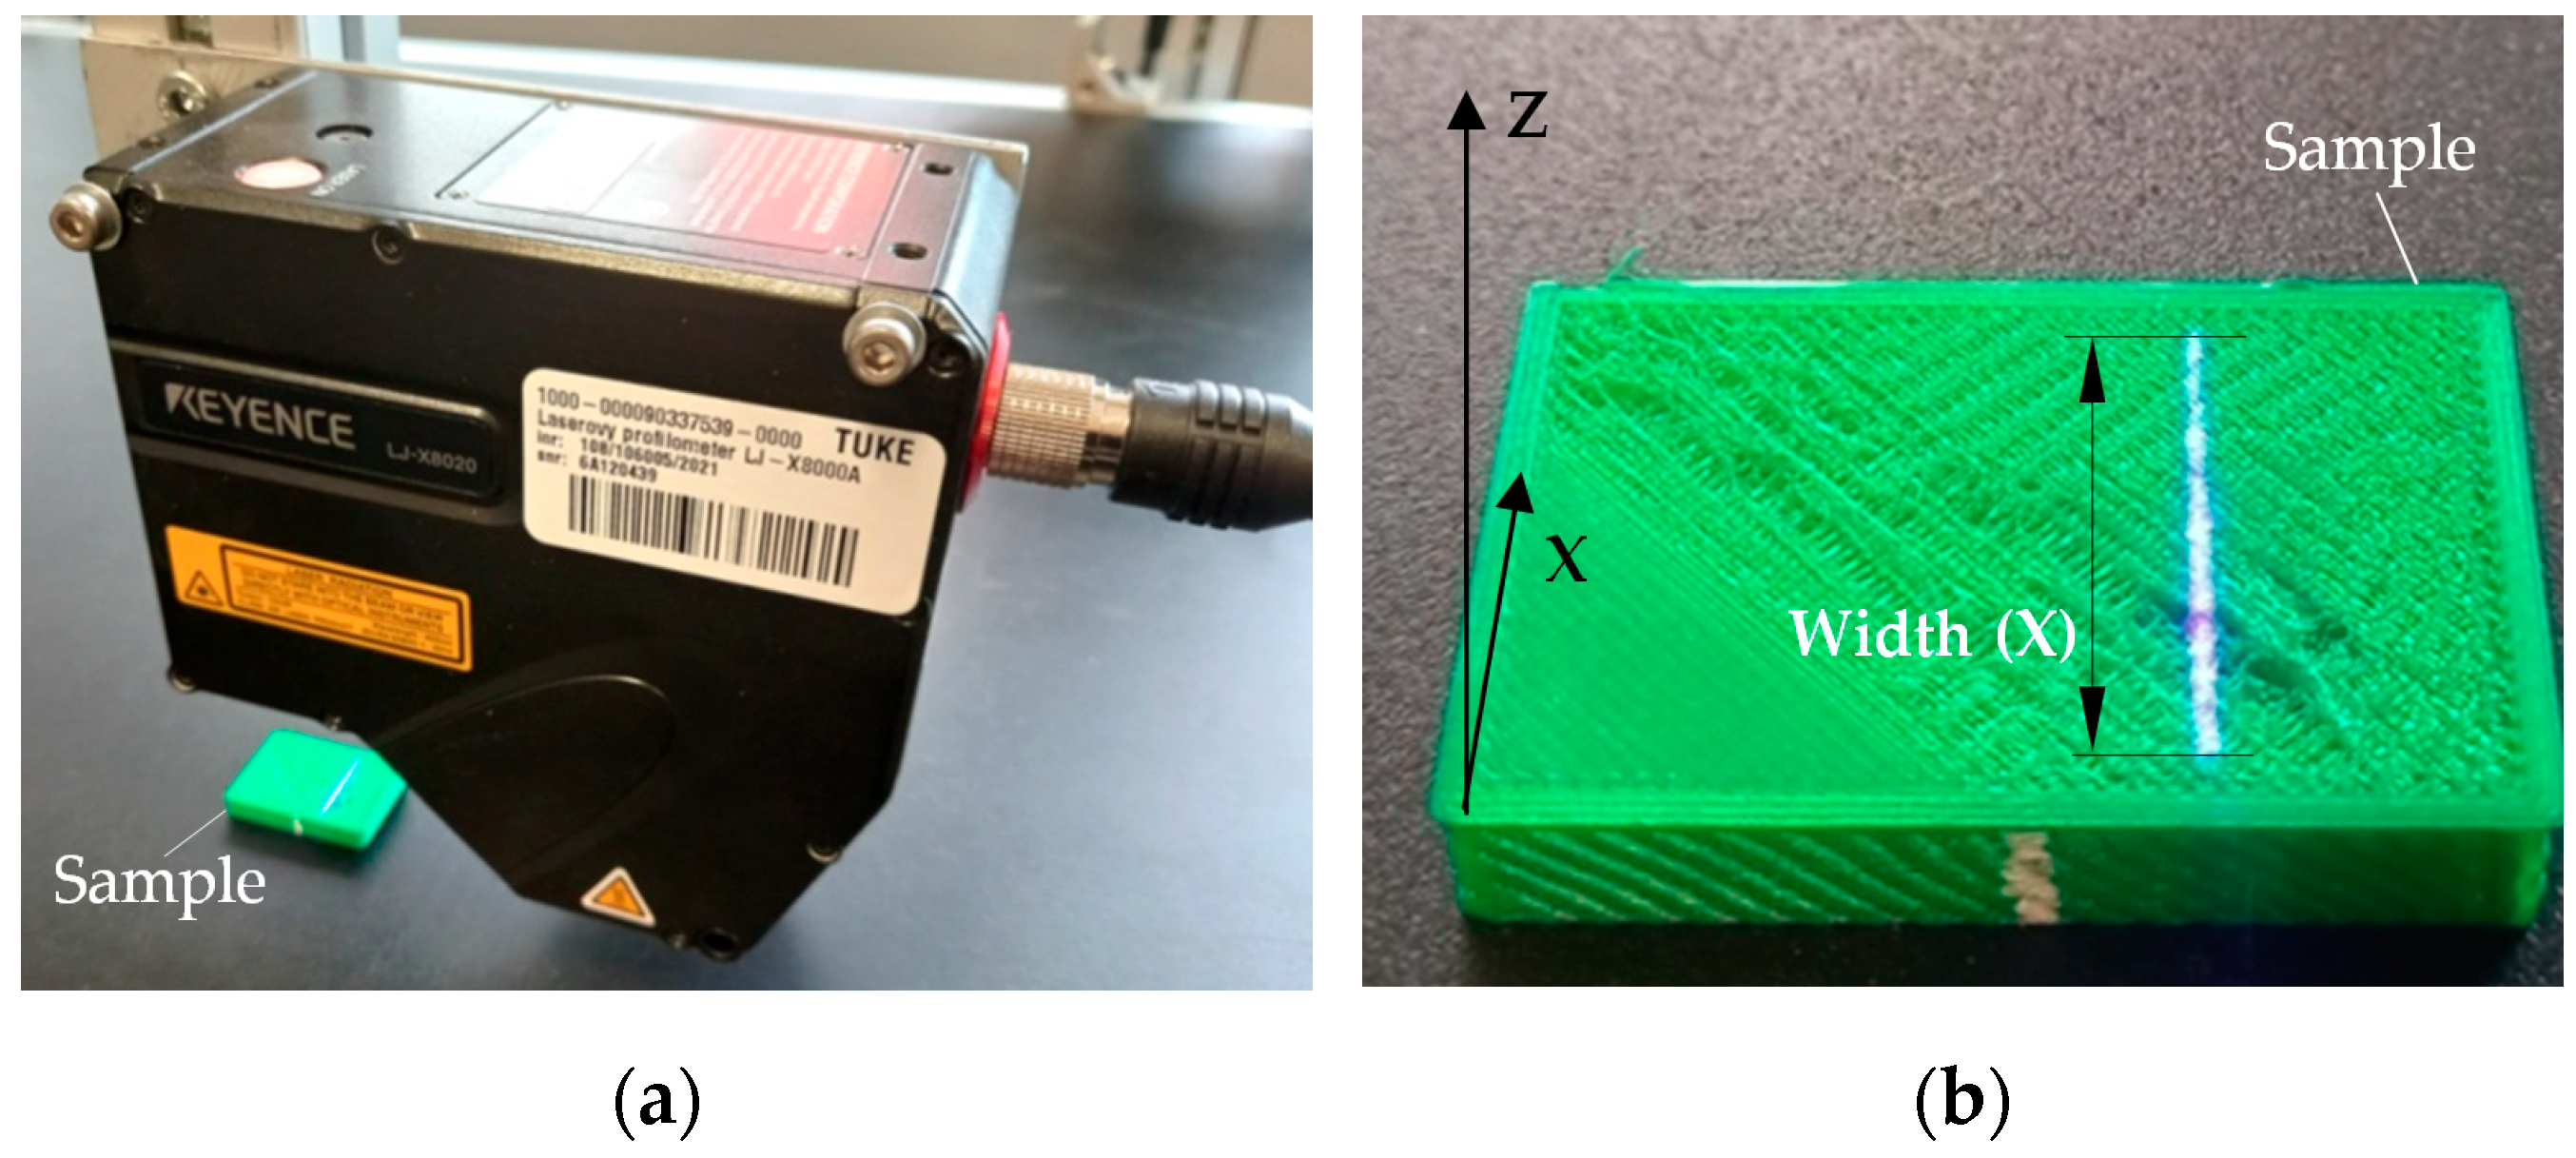
| Reference distance | z-axis (height) | 20 mm |
| Measurement range | x-axis (width), near side | 7 mm |
| x-axis (width), reference distance | 7.5 mm | |
| x-axis (width), far side | 8 mm | |
| Light source | Blue semiconductor Laser wavelength | 405 nm (visible light) |
| Class 2M laser product (IEC60825-1, FDA (CDRH) Part 1040.10) | ||
| Output | 10 mW | |
| Spot size | Approx. 16 mm × 32 µm | |
| Repeatability | z-axis (height) | 0.3 µm |
| x-axis (width) | 0.3 µm | |
| Profile data interval | x-axis (width) | 2.5 µm |
| Profile data count | 3200 points |
| Roughness Parameter | R130 Roughness Tester | LJ-X8020 Laser Profiler |
|---|---|---|
| Ra, μm | 3.24 | 2.684 |
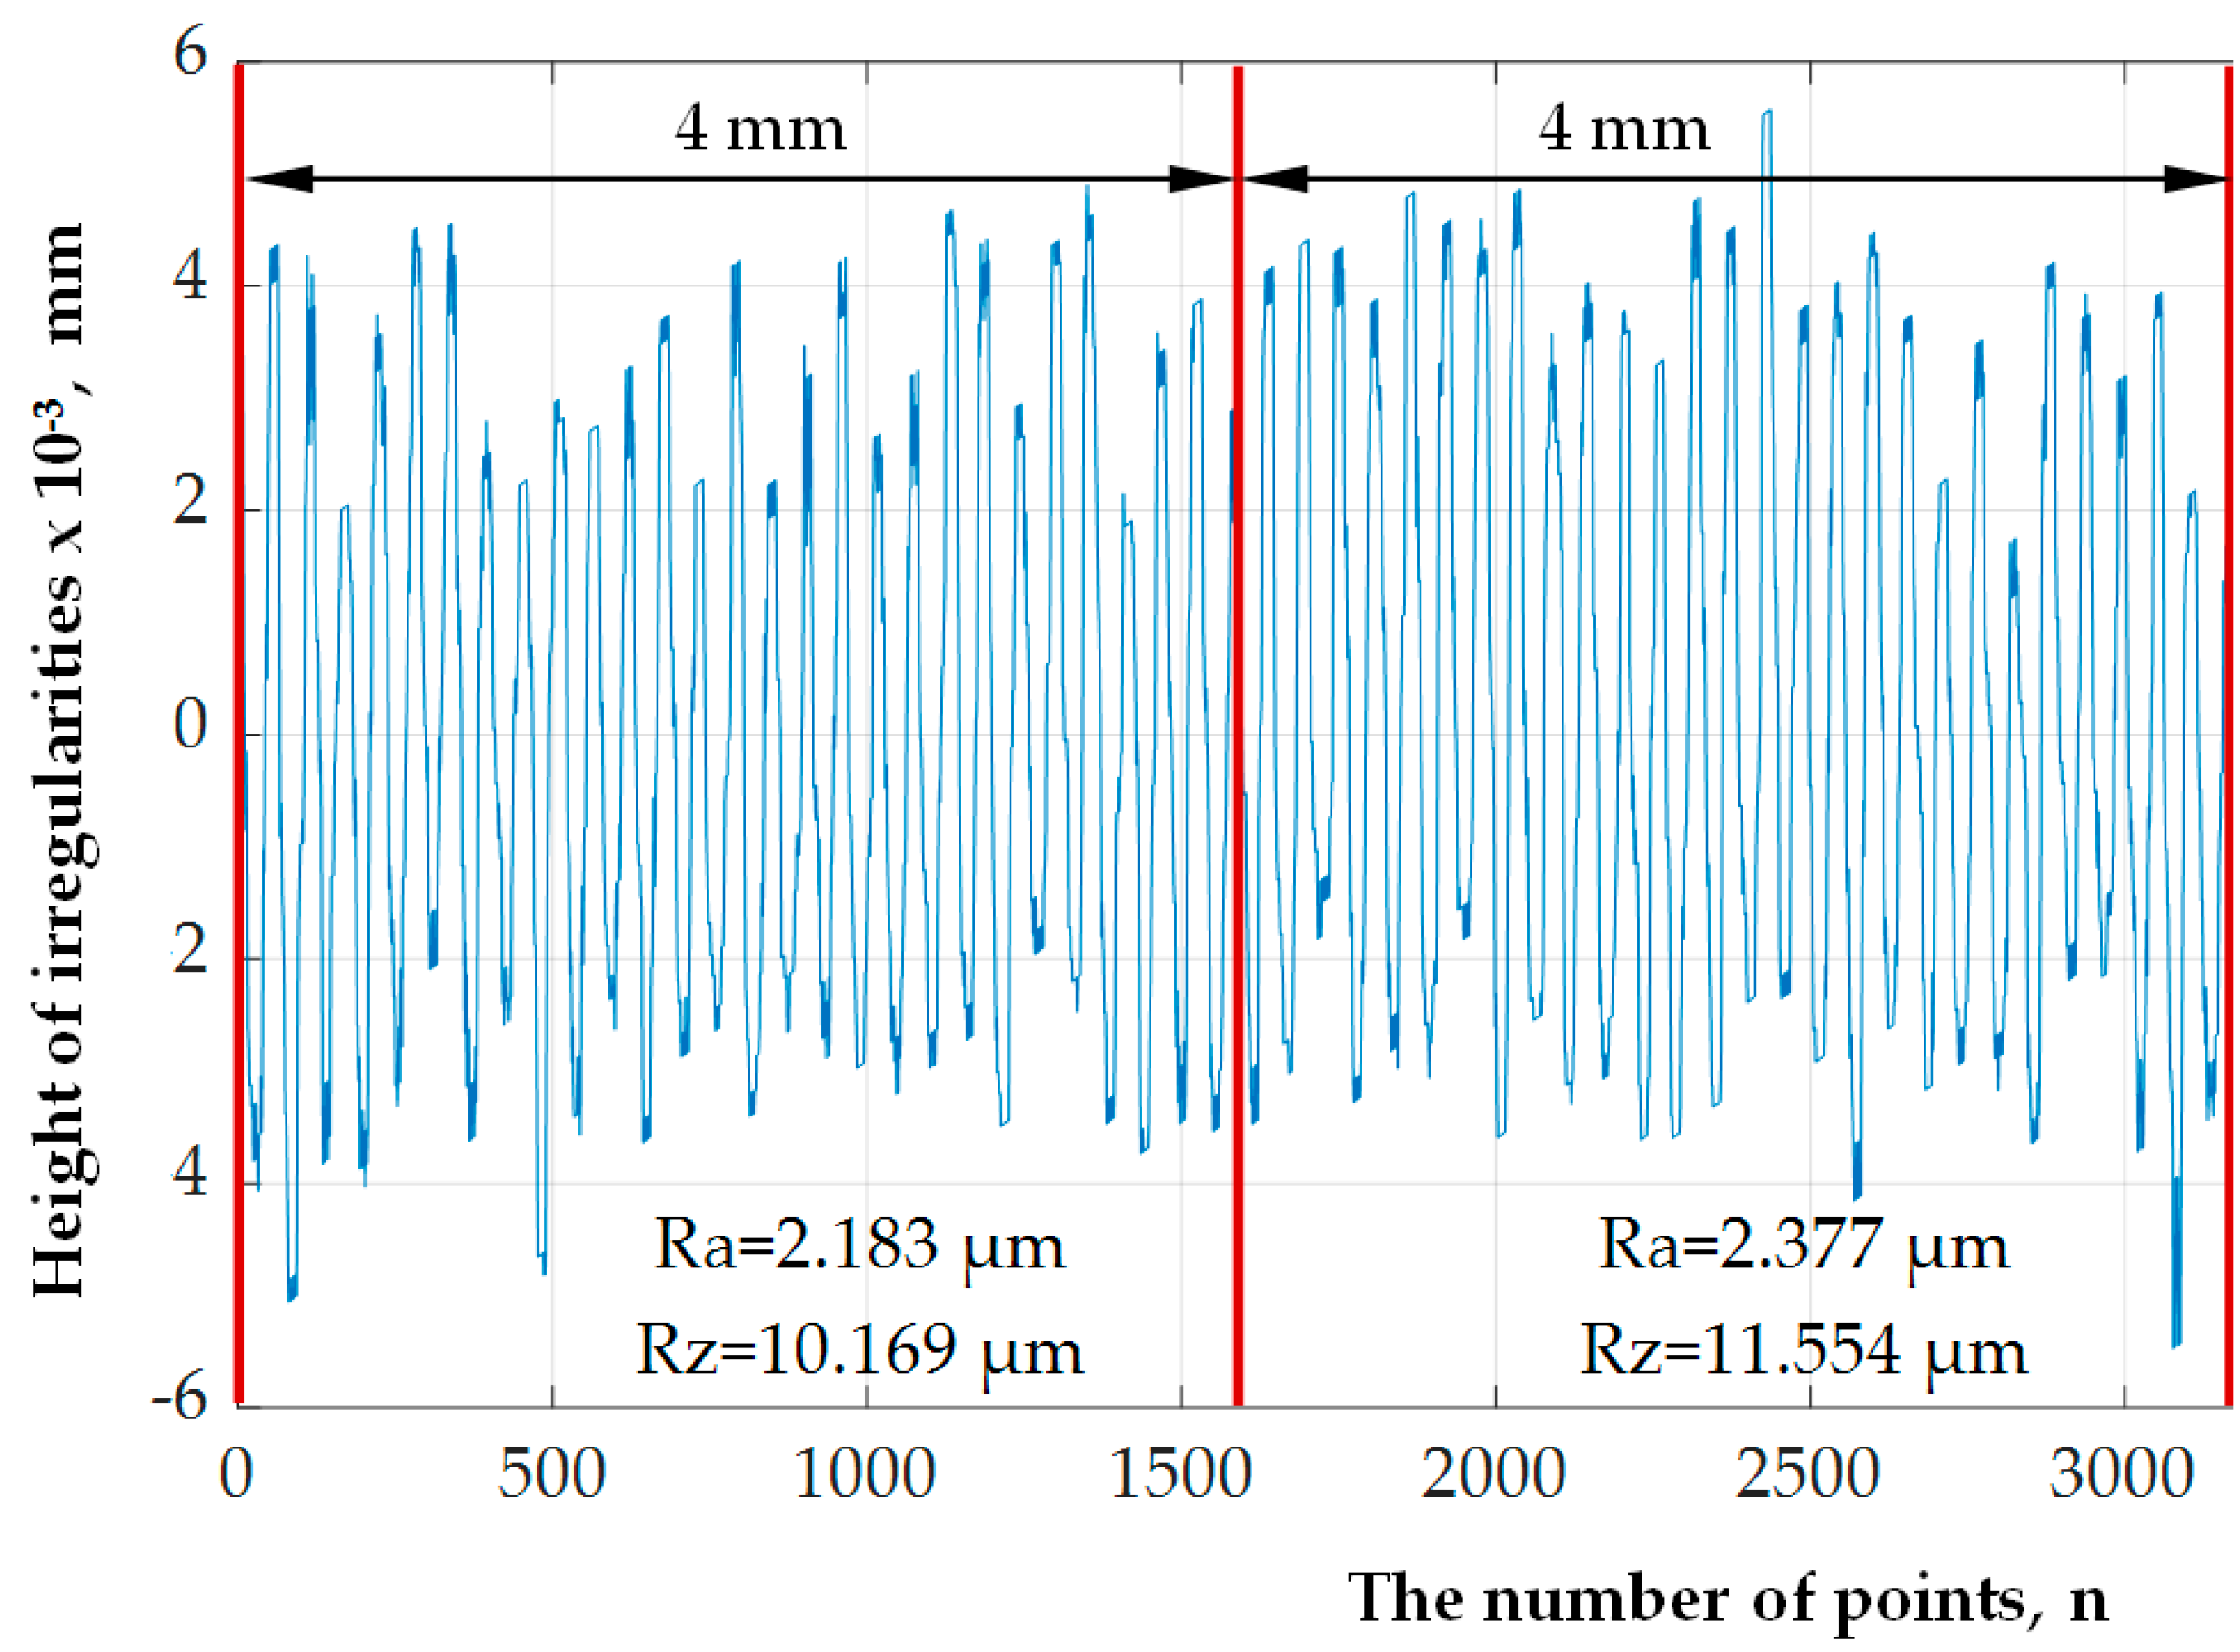
| 3.23 | 2.377 | |
| 3.28 | 2.383 | |
| Average 3.25 | Average 2.481 | |
| Rz, μm | 12.1 | 12.740 |
| 12.3 | 11.554 | |
| 12.1 | 12.800 | |
| Average 12.17 | Average 12.365 |
| Instrument and Error | Ra, μm | Rz, μm |
|---|---|---|
| LJ-X8020 laser profiler | 2.481 | 12.365 |
| R130 roughness tester | 3.250 | 12.170 |
| Difference, % | 23.66 | 1.60 |
| Sample | Ra, µm | Rz, µm | Ra (Ave), µm | Rz (Ave), µm |
|---|---|---|---|---|
| Figure 5a | 5.06 | 24.9 | ||
| 4.27 | 22.3 | 4.51 | 22.8 | |
| 4.20 | 21.2 | |||
| Figure 5b | 9.22 | 25.0 | ||
| 8.97 | 25.0 | 9.17 | 25.0 | |
| 9.32 | 25.0 | |||
| Figure 5c | 6.62 | 24.9 | ||
| 6.54 | 24.9 | 6.45 | 24.9 | |
| 6.18 | 24.9 |
| Sample | Ra, µm | Rz, µm | Ra (Ave), µm Difference | Rz (Ave), µm Difference |
|---|---|---|---|---|
| Figure 5a | 9.155 | 39.903 | 8.119 80.02% | 38.203 67.56% |
| 8.219 | 41.496 | |||
| 6.984 | 33.211 | |||
| Figure 5b | 8.855 | 68.500 | 9.790 6.79% | 44.060 76.24% |
| 10.655 | 36.500 | |||
| 9.859 | 27.200 | |||
| Figure 5c | 14.325 | 57.233 | 13.614 111.07% | 46.108 85.17% |
| 14.135 | 30.464 | |||
| 12.381 | 50.626 | |||
| Average difference | 65.96% | 76.32% |
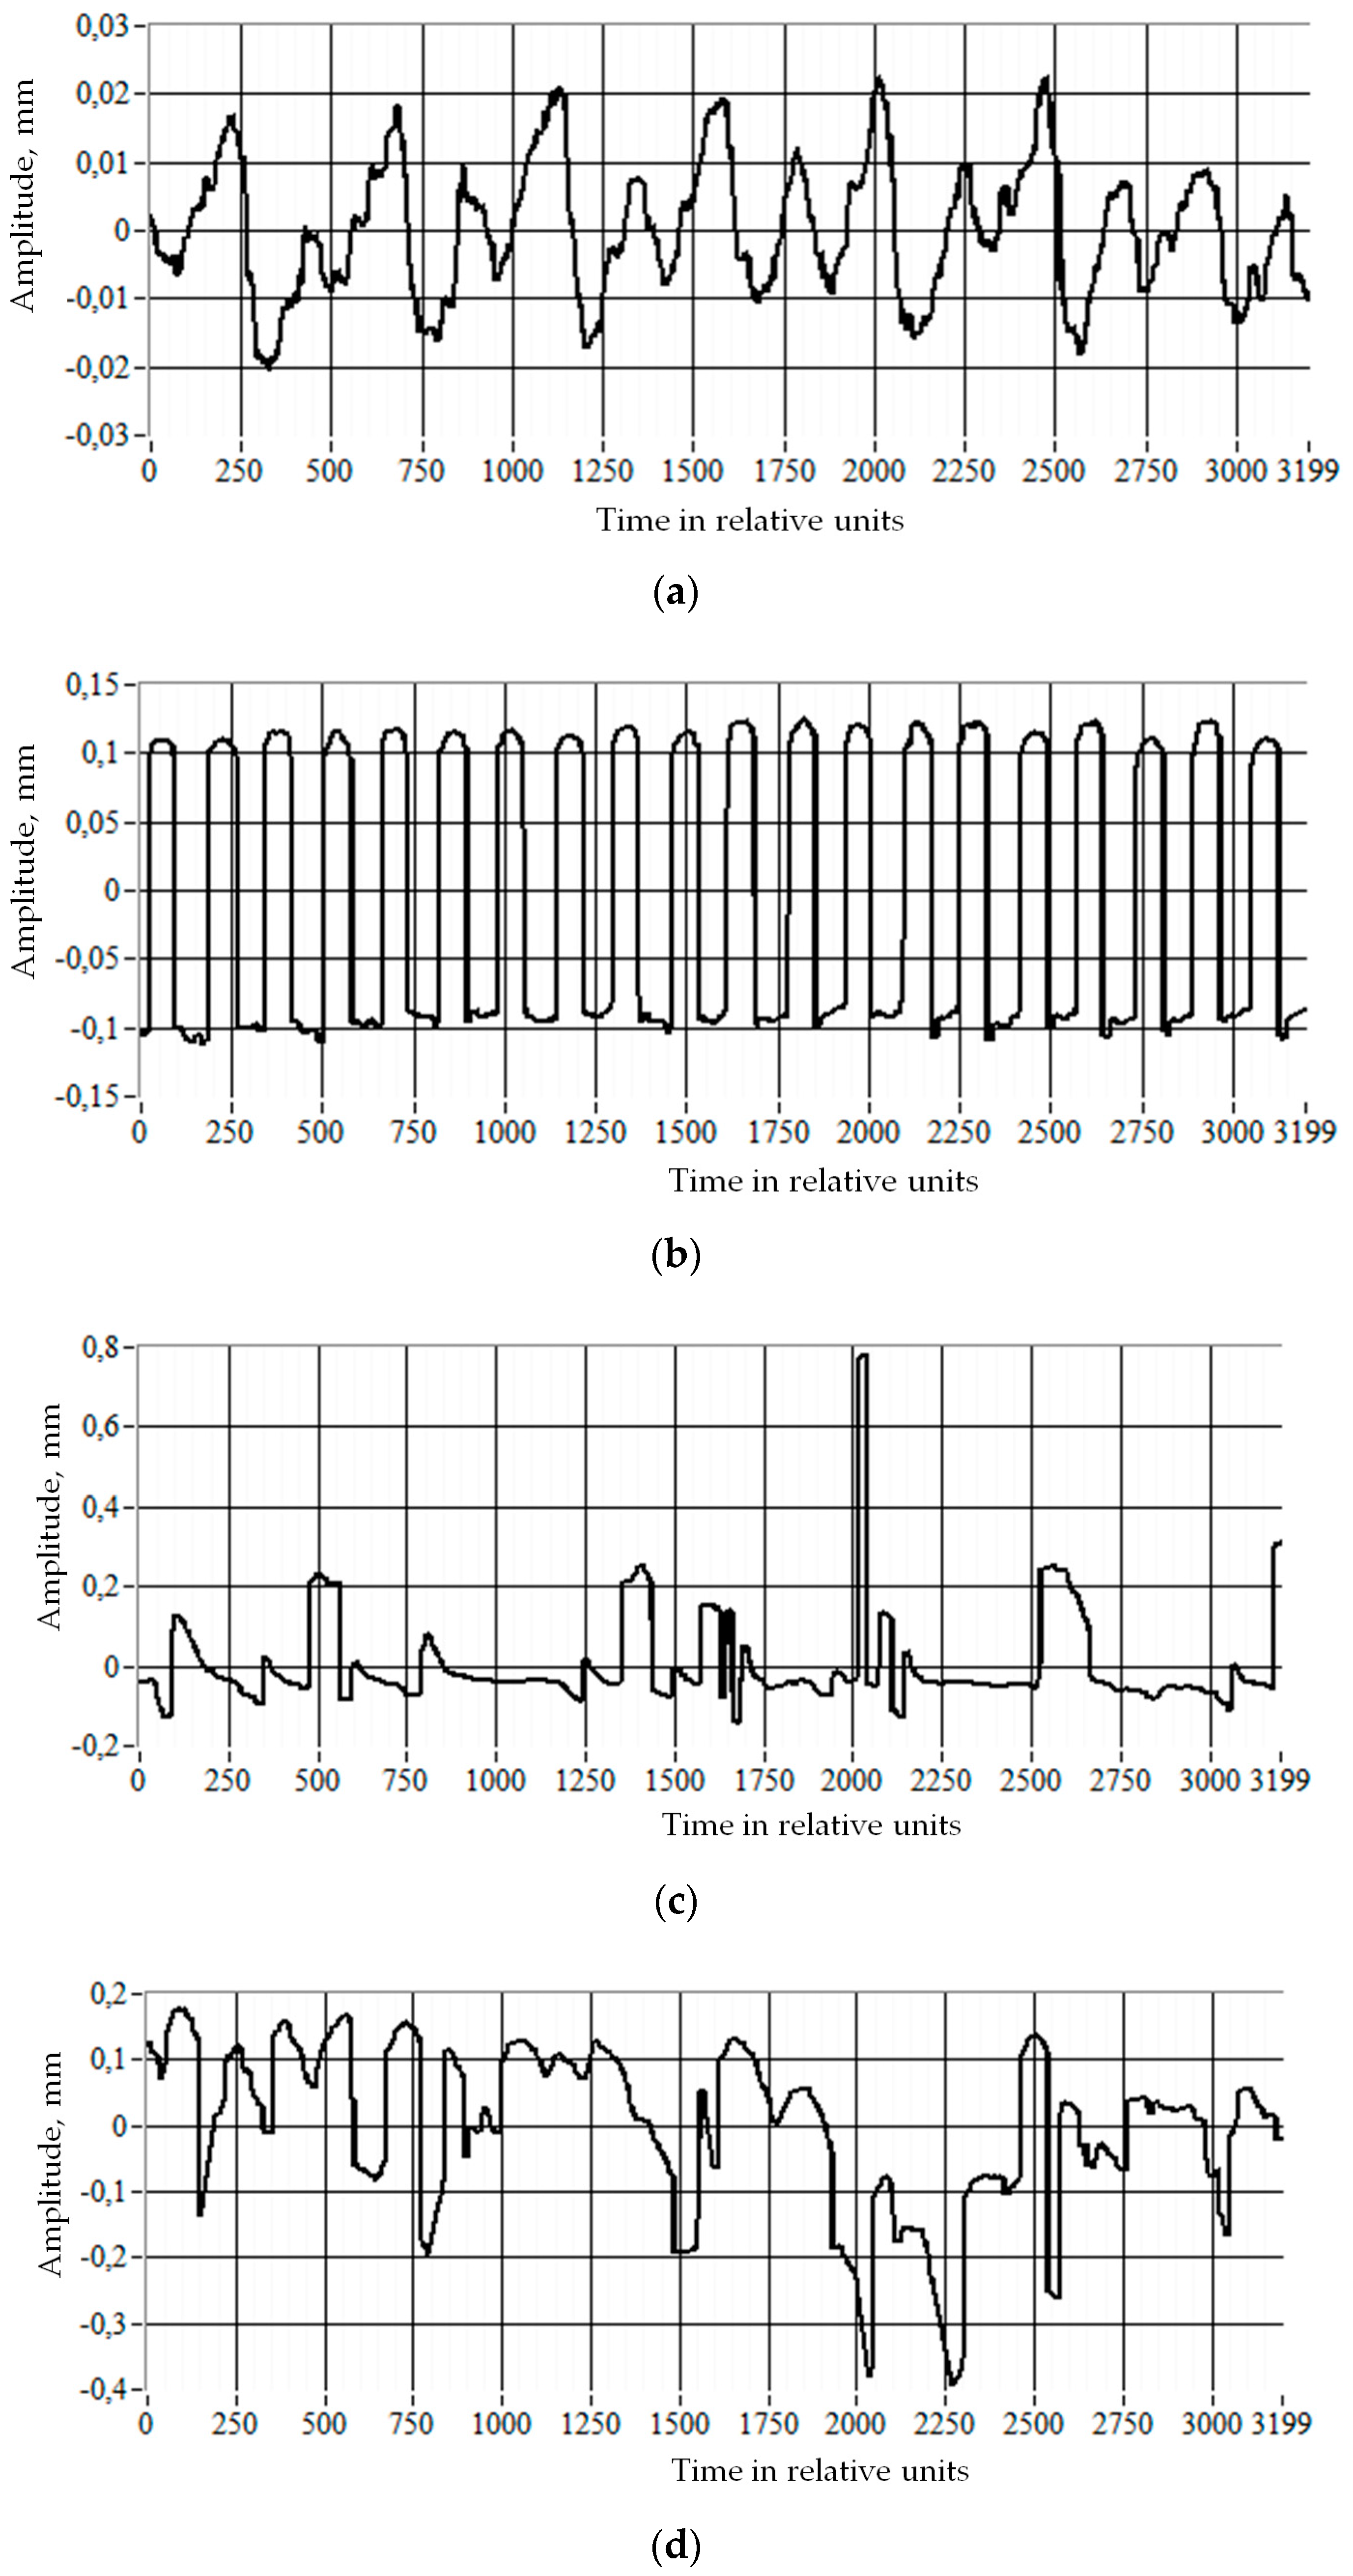
| Diagnostic Sign | The Range- and PSD Signal-Averaged Values for the Plastic Samples in Figure 3 | |||
|---|---|---|---|---|
| Reference | Under-Extrusion | Stringy First Layer | High Roughness | |
| 1 Range | 0.04342(1) | 0.25914(5.97) | 0.65727(15.14) | 0.92944(21.41) |
| 2 Arithmetic Mean | 0.00021(1) | 0.02239(106.62) | 0.03090(147.14) | 0.04158(198.00) |
| 3 RMS | 0.00428(1) | 0.69723(162.90) | 0.36880(86.17) | 0.36570(85.44) |
| 4 Standard Deviation | 0.00428(1) | 0.69709(162.87) | 0.36768(85.91) | 0.36344(84.92) |
| 5 Variance | 1.844 × 10⁻⁵(1) | 0.48677(26,397.5) | 0.13720(7440.34) | 0.14937(8100.32) |
| 6 Median | 3.434 × 10⁻⁷(1) | 0.00030(873) | 0.00020(582) | 0.00049(1426) |
| 7 Mode | 0.00066(1) | 0.13911(210.77) | 0.05692(86.24) | 0.04511(68.35) |
| 8 Summation | 0.33638(1) | 35.8179(106.48) | 49.4540(147.02) | 66.5230(197.76) |
| Sum of ratings | 8 | 28.03 × 10³ | 8.60 × 10³ | 10.20 × 10³ |
Publisher’s Note: MDPI stays neutral with regard to jurisdictional claims in published maps and institutional affiliations. |
© 2022 by the authors. Licensee MDPI, Basel, Switzerland. This article is an open access article distributed under the terms and conditions of the Creative Commons Attribution (CC BY) license (https://creativecommons.org/licenses/by/4.0/).
Share and Cite
Lishchenko, N.; Piteľ, J.; Larshin, V. Online Monitoring of Surface Quality for Diagnostic Features in 3D Printing. Machines 2022, 10, 541. https://doi.org/10.3390/machines10070541
Lishchenko N, Piteľ J, Larshin V. Online Monitoring of Surface Quality for Diagnostic Features in 3D Printing. Machines. 2022; 10(7):541. https://doi.org/10.3390/machines10070541
Chicago/Turabian StyleLishchenko, Natalia, Ján Piteľ, and Vasily Larshin. 2022. "Online Monitoring of Surface Quality for Diagnostic Features in 3D Printing" Machines 10, no. 7: 541. https://doi.org/10.3390/machines10070541
APA StyleLishchenko, N., Piteľ, J., & Larshin, V. (2022). Online Monitoring of Surface Quality for Diagnostic Features in 3D Printing. Machines, 10(7), 541. https://doi.org/10.3390/machines10070541