
Shear Failure Mechanism and Numerical Simulation Analysis of Rock-like Materials with an Embedded Flaw


Abstract
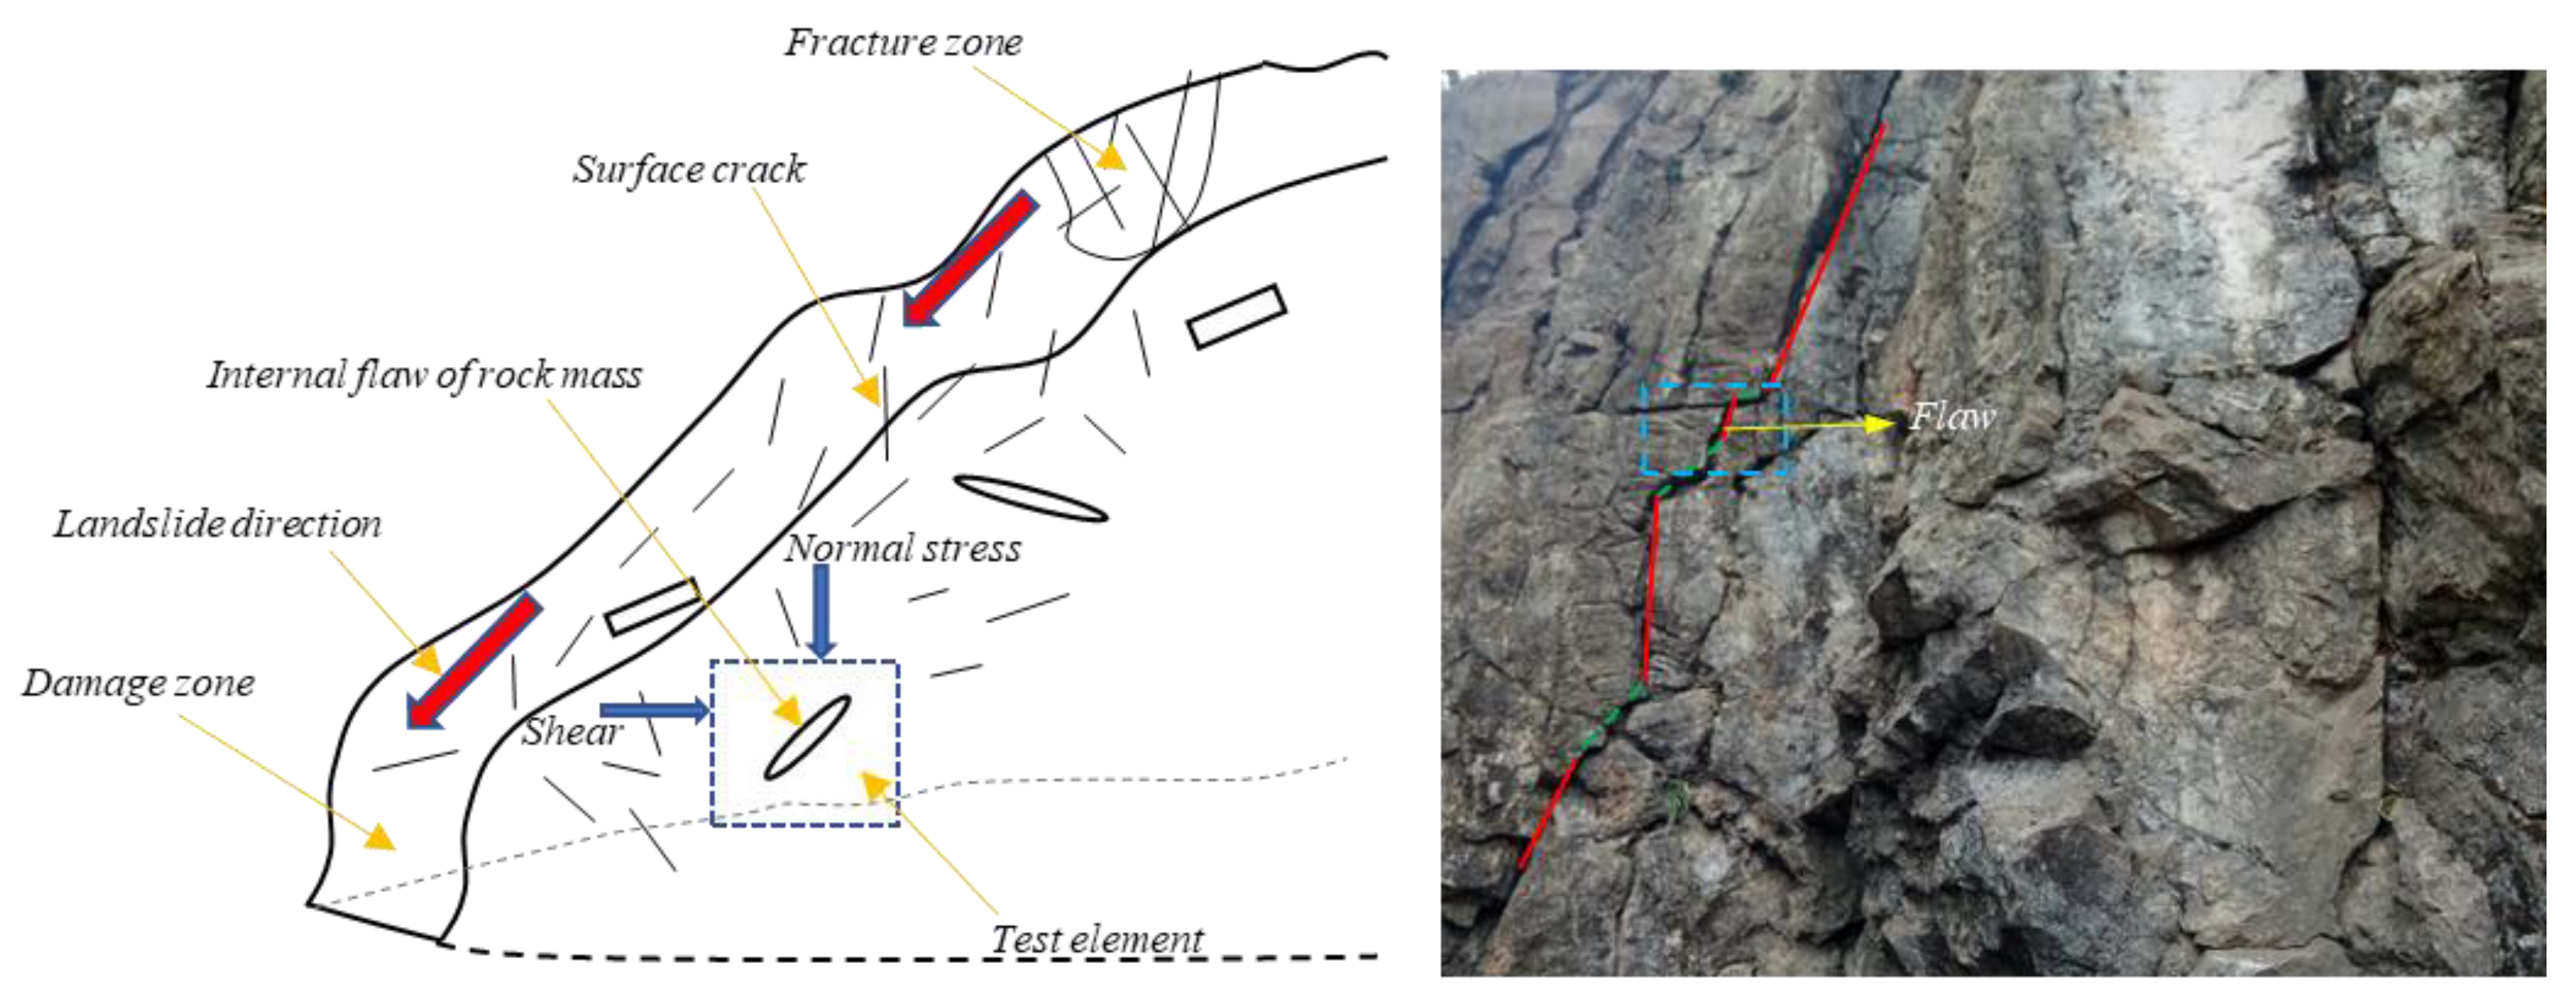
:1. Introduction
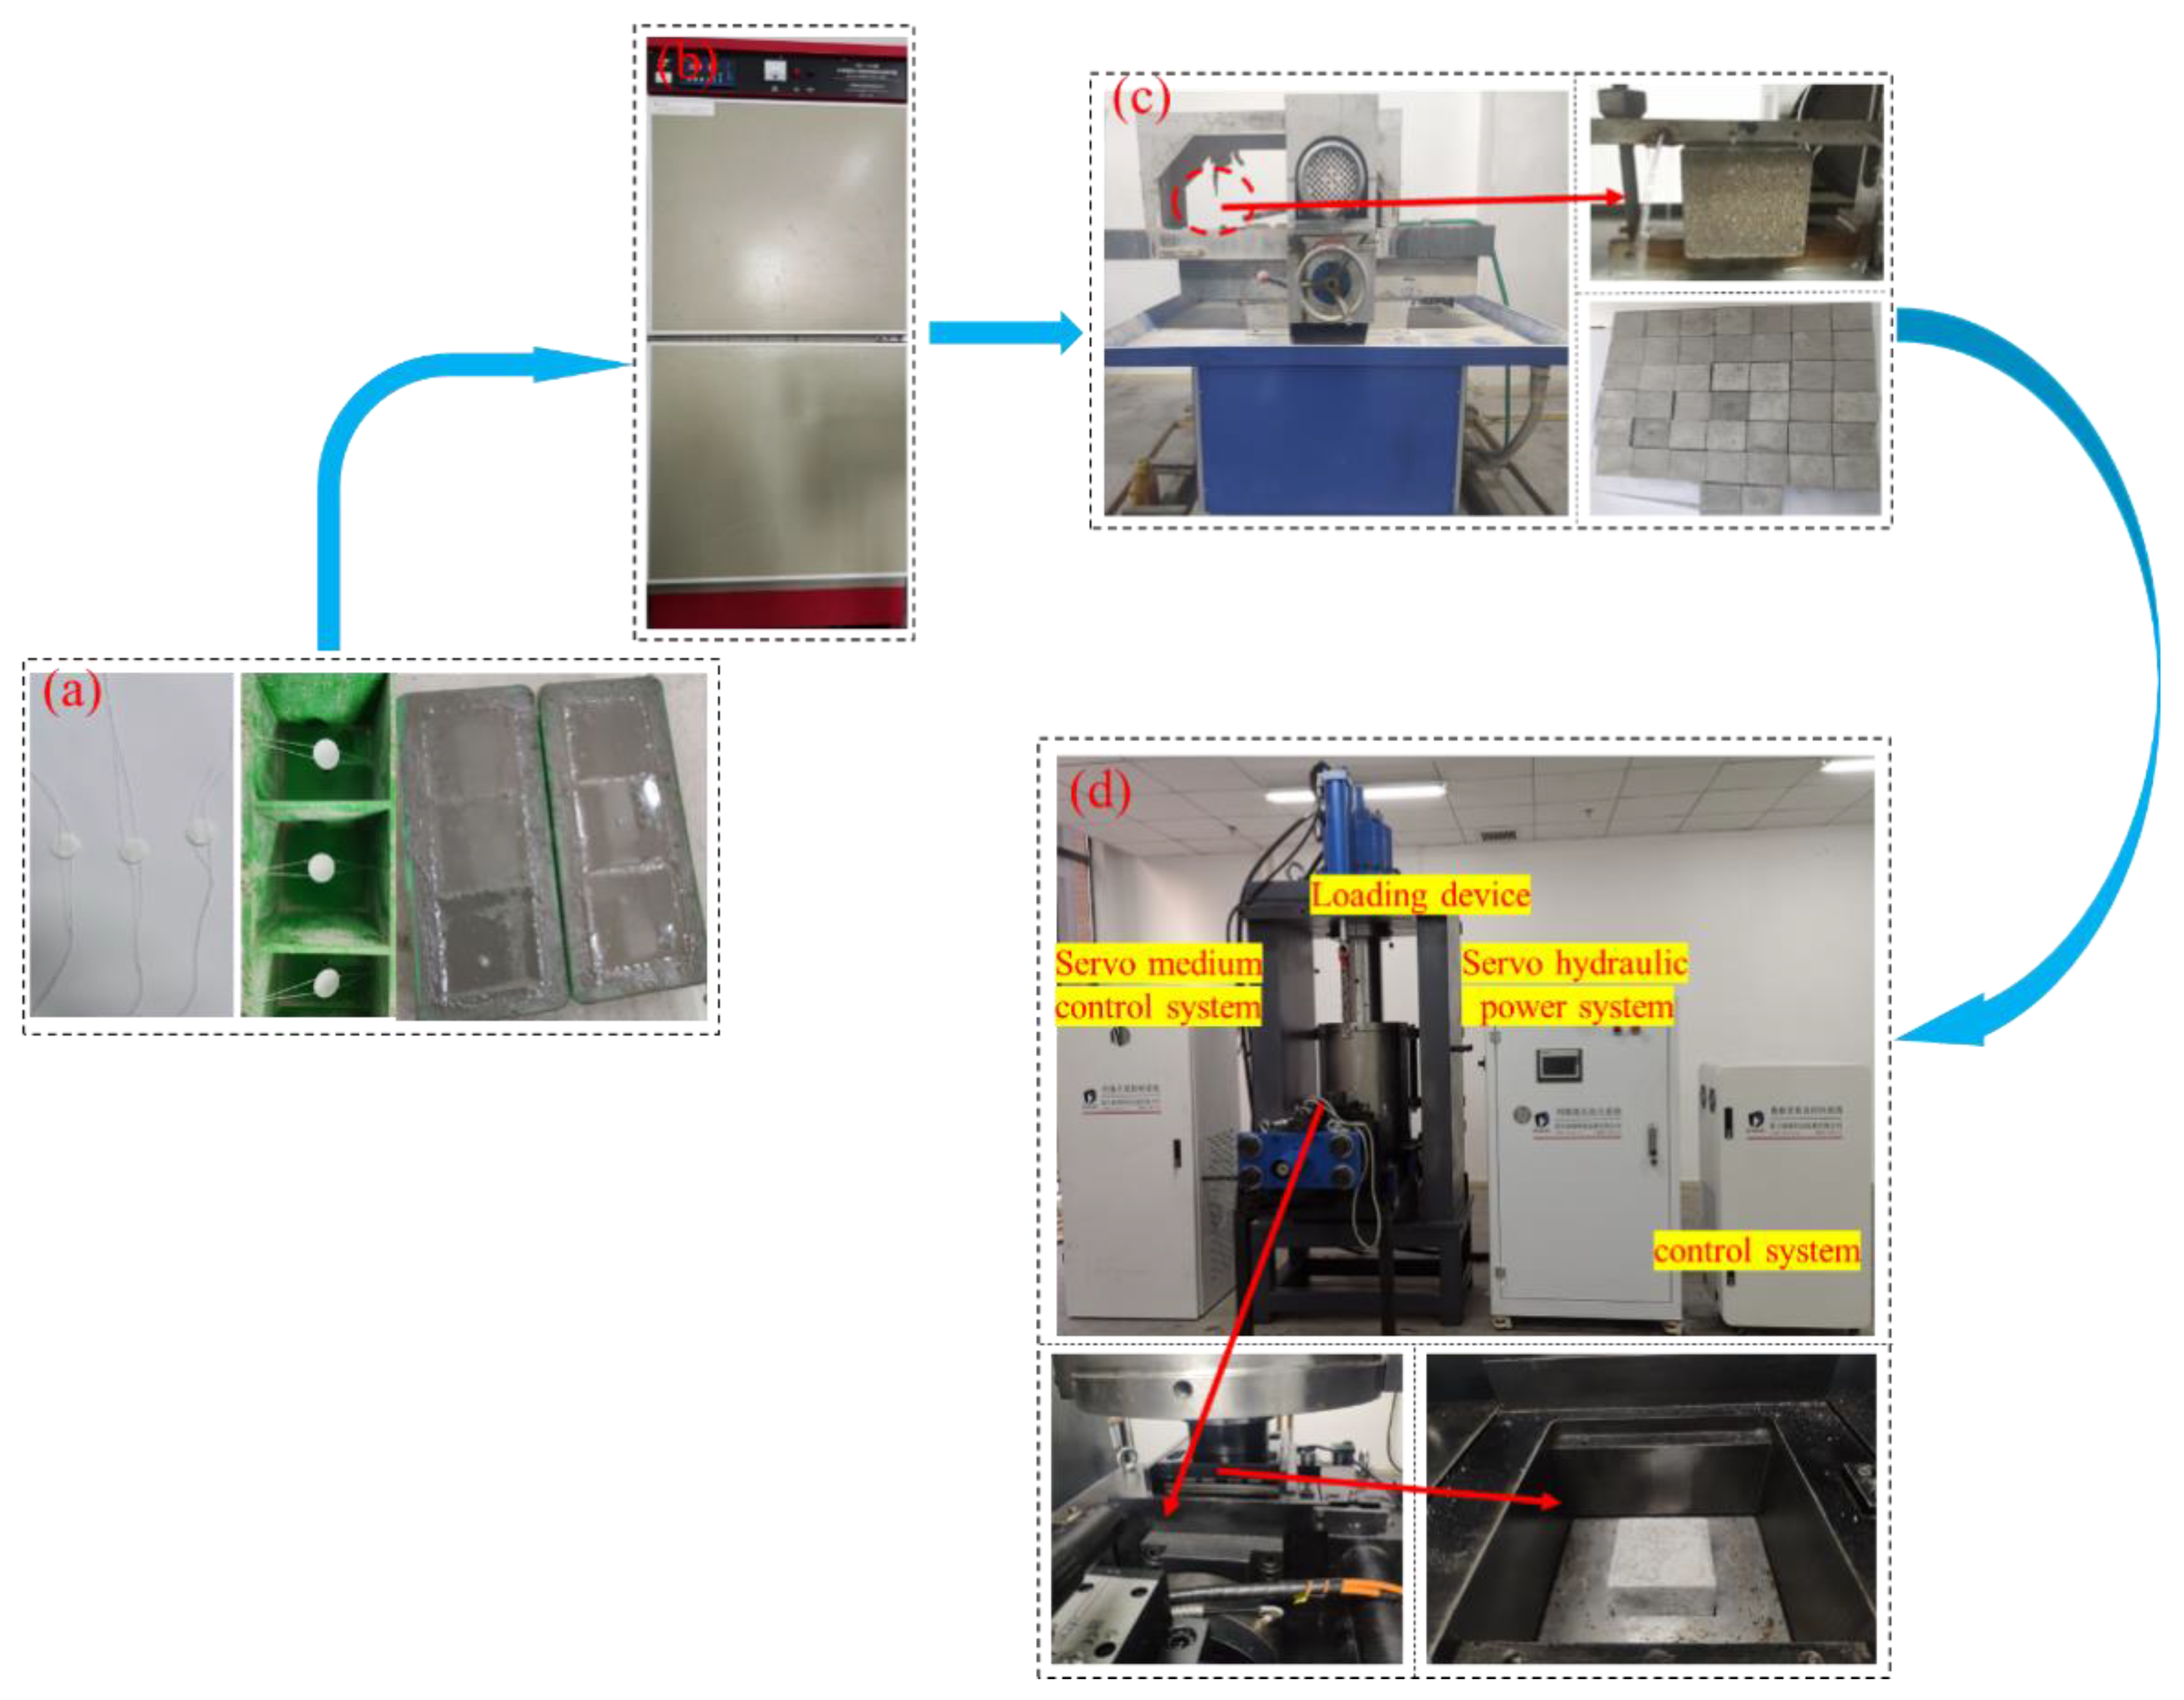
2. Test Preparation
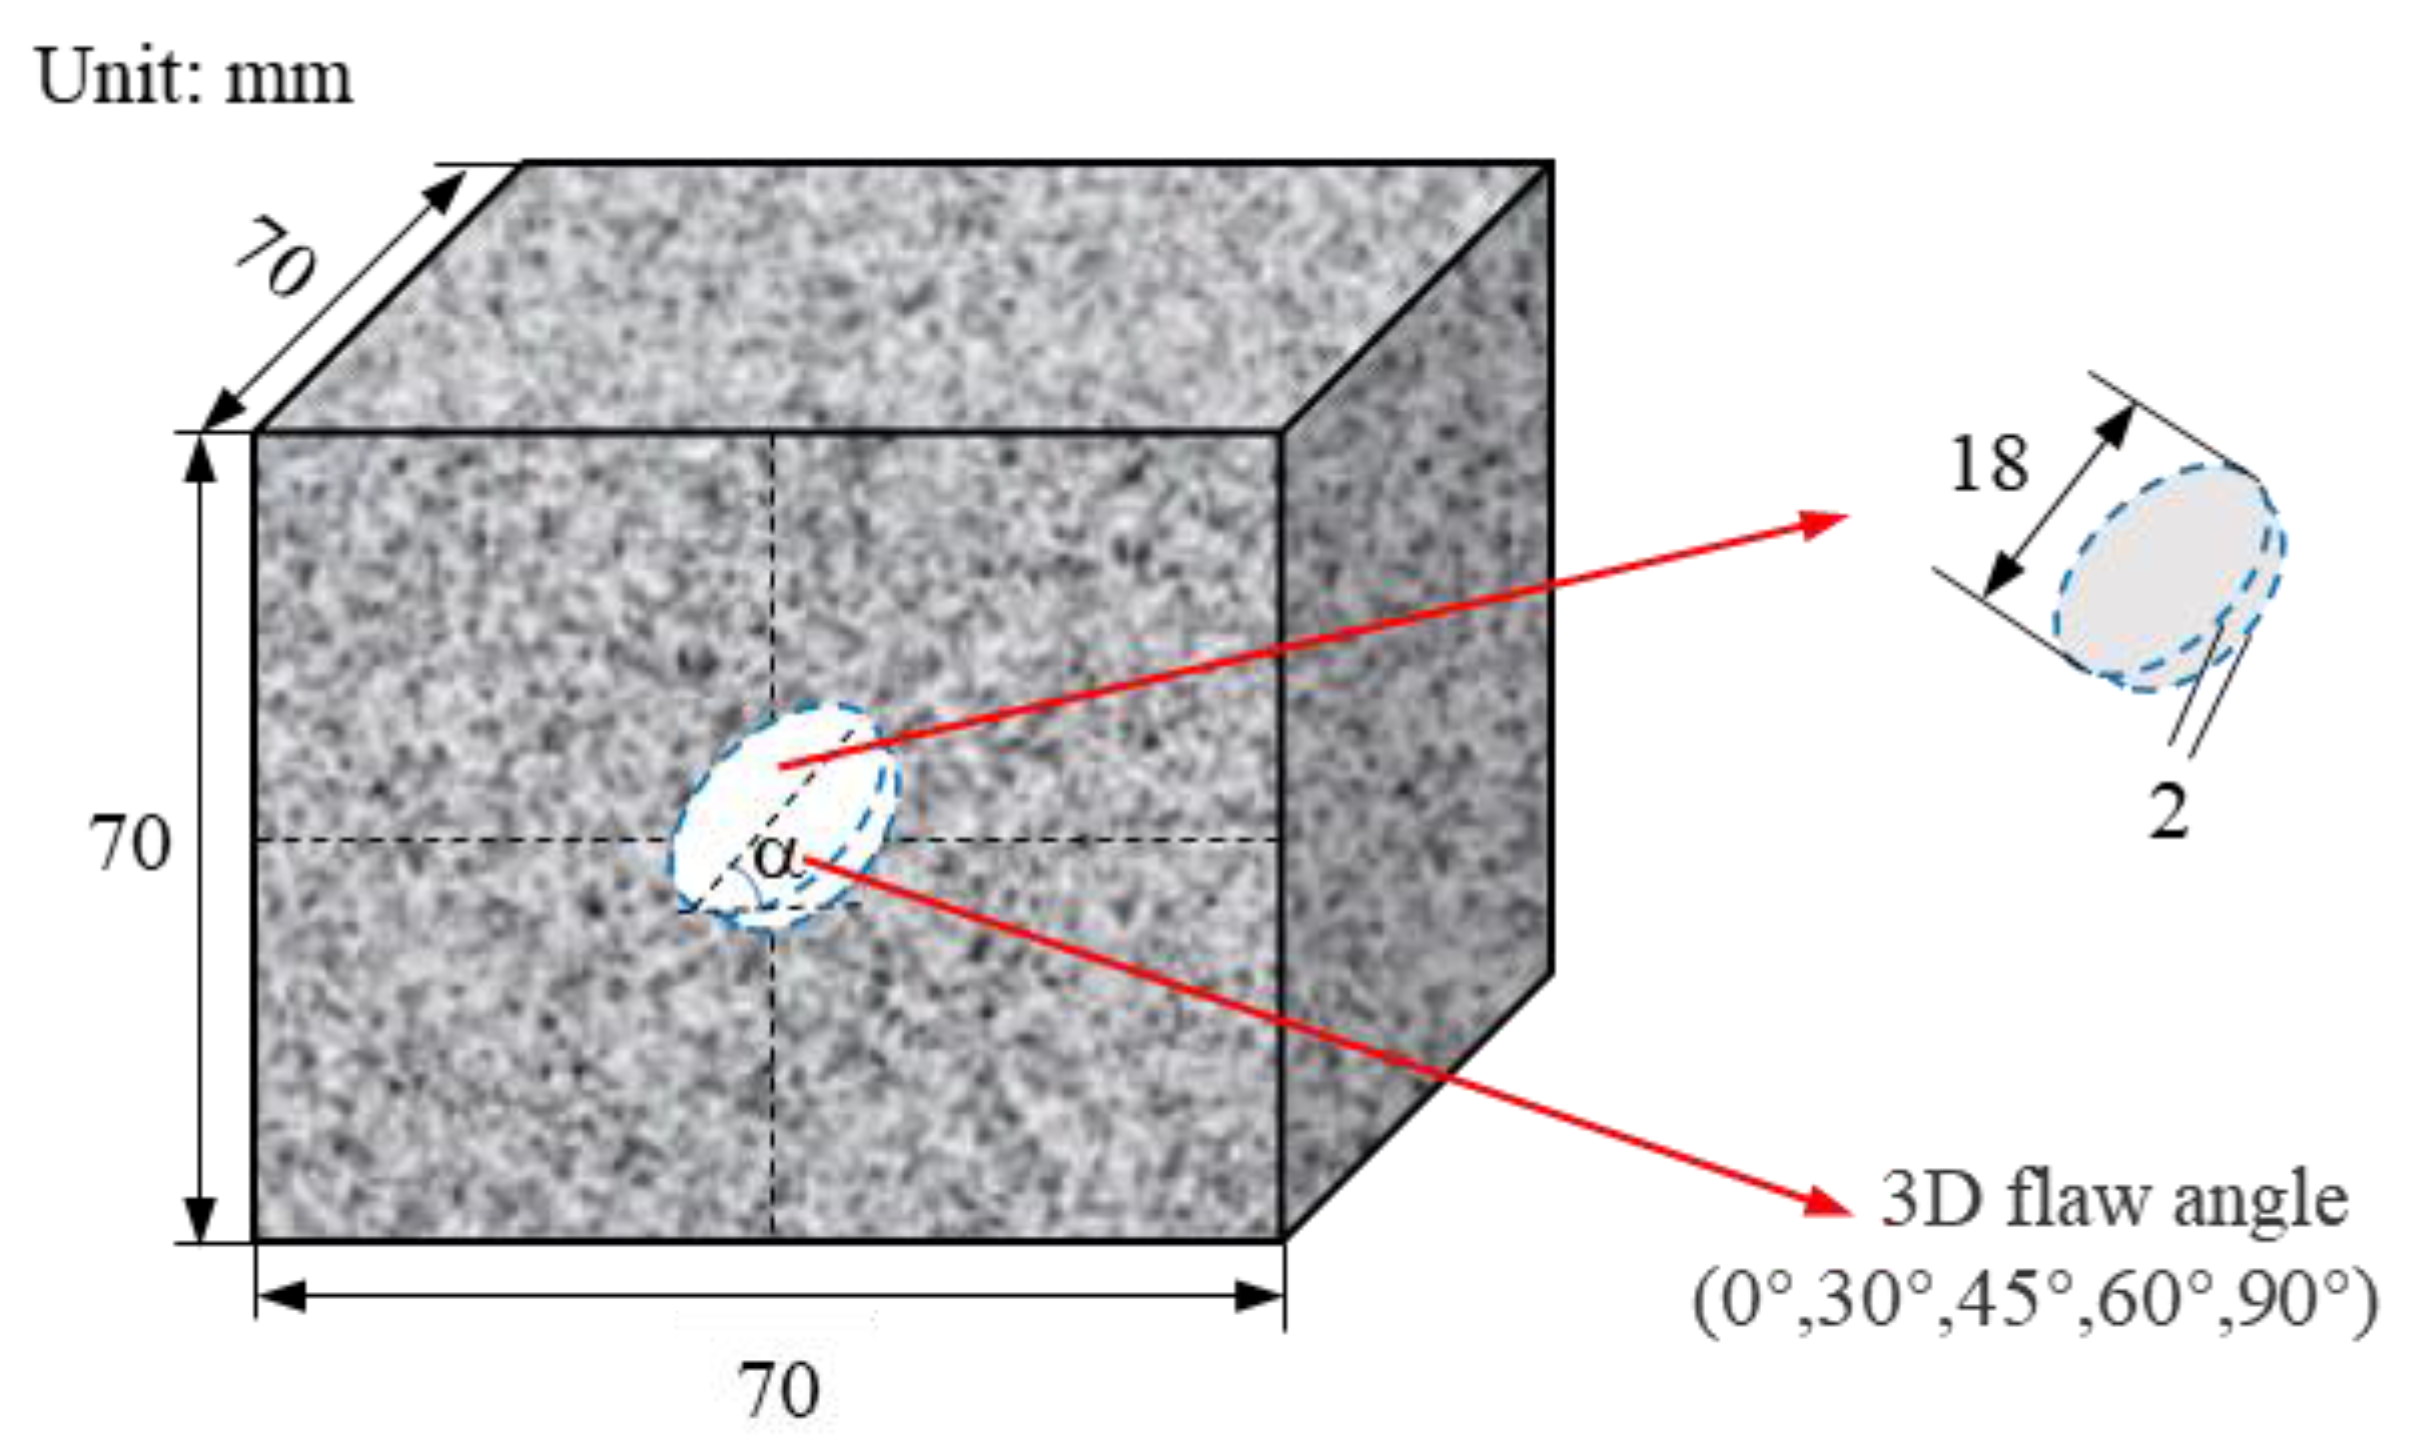
2.1. Samples and Test Instruments
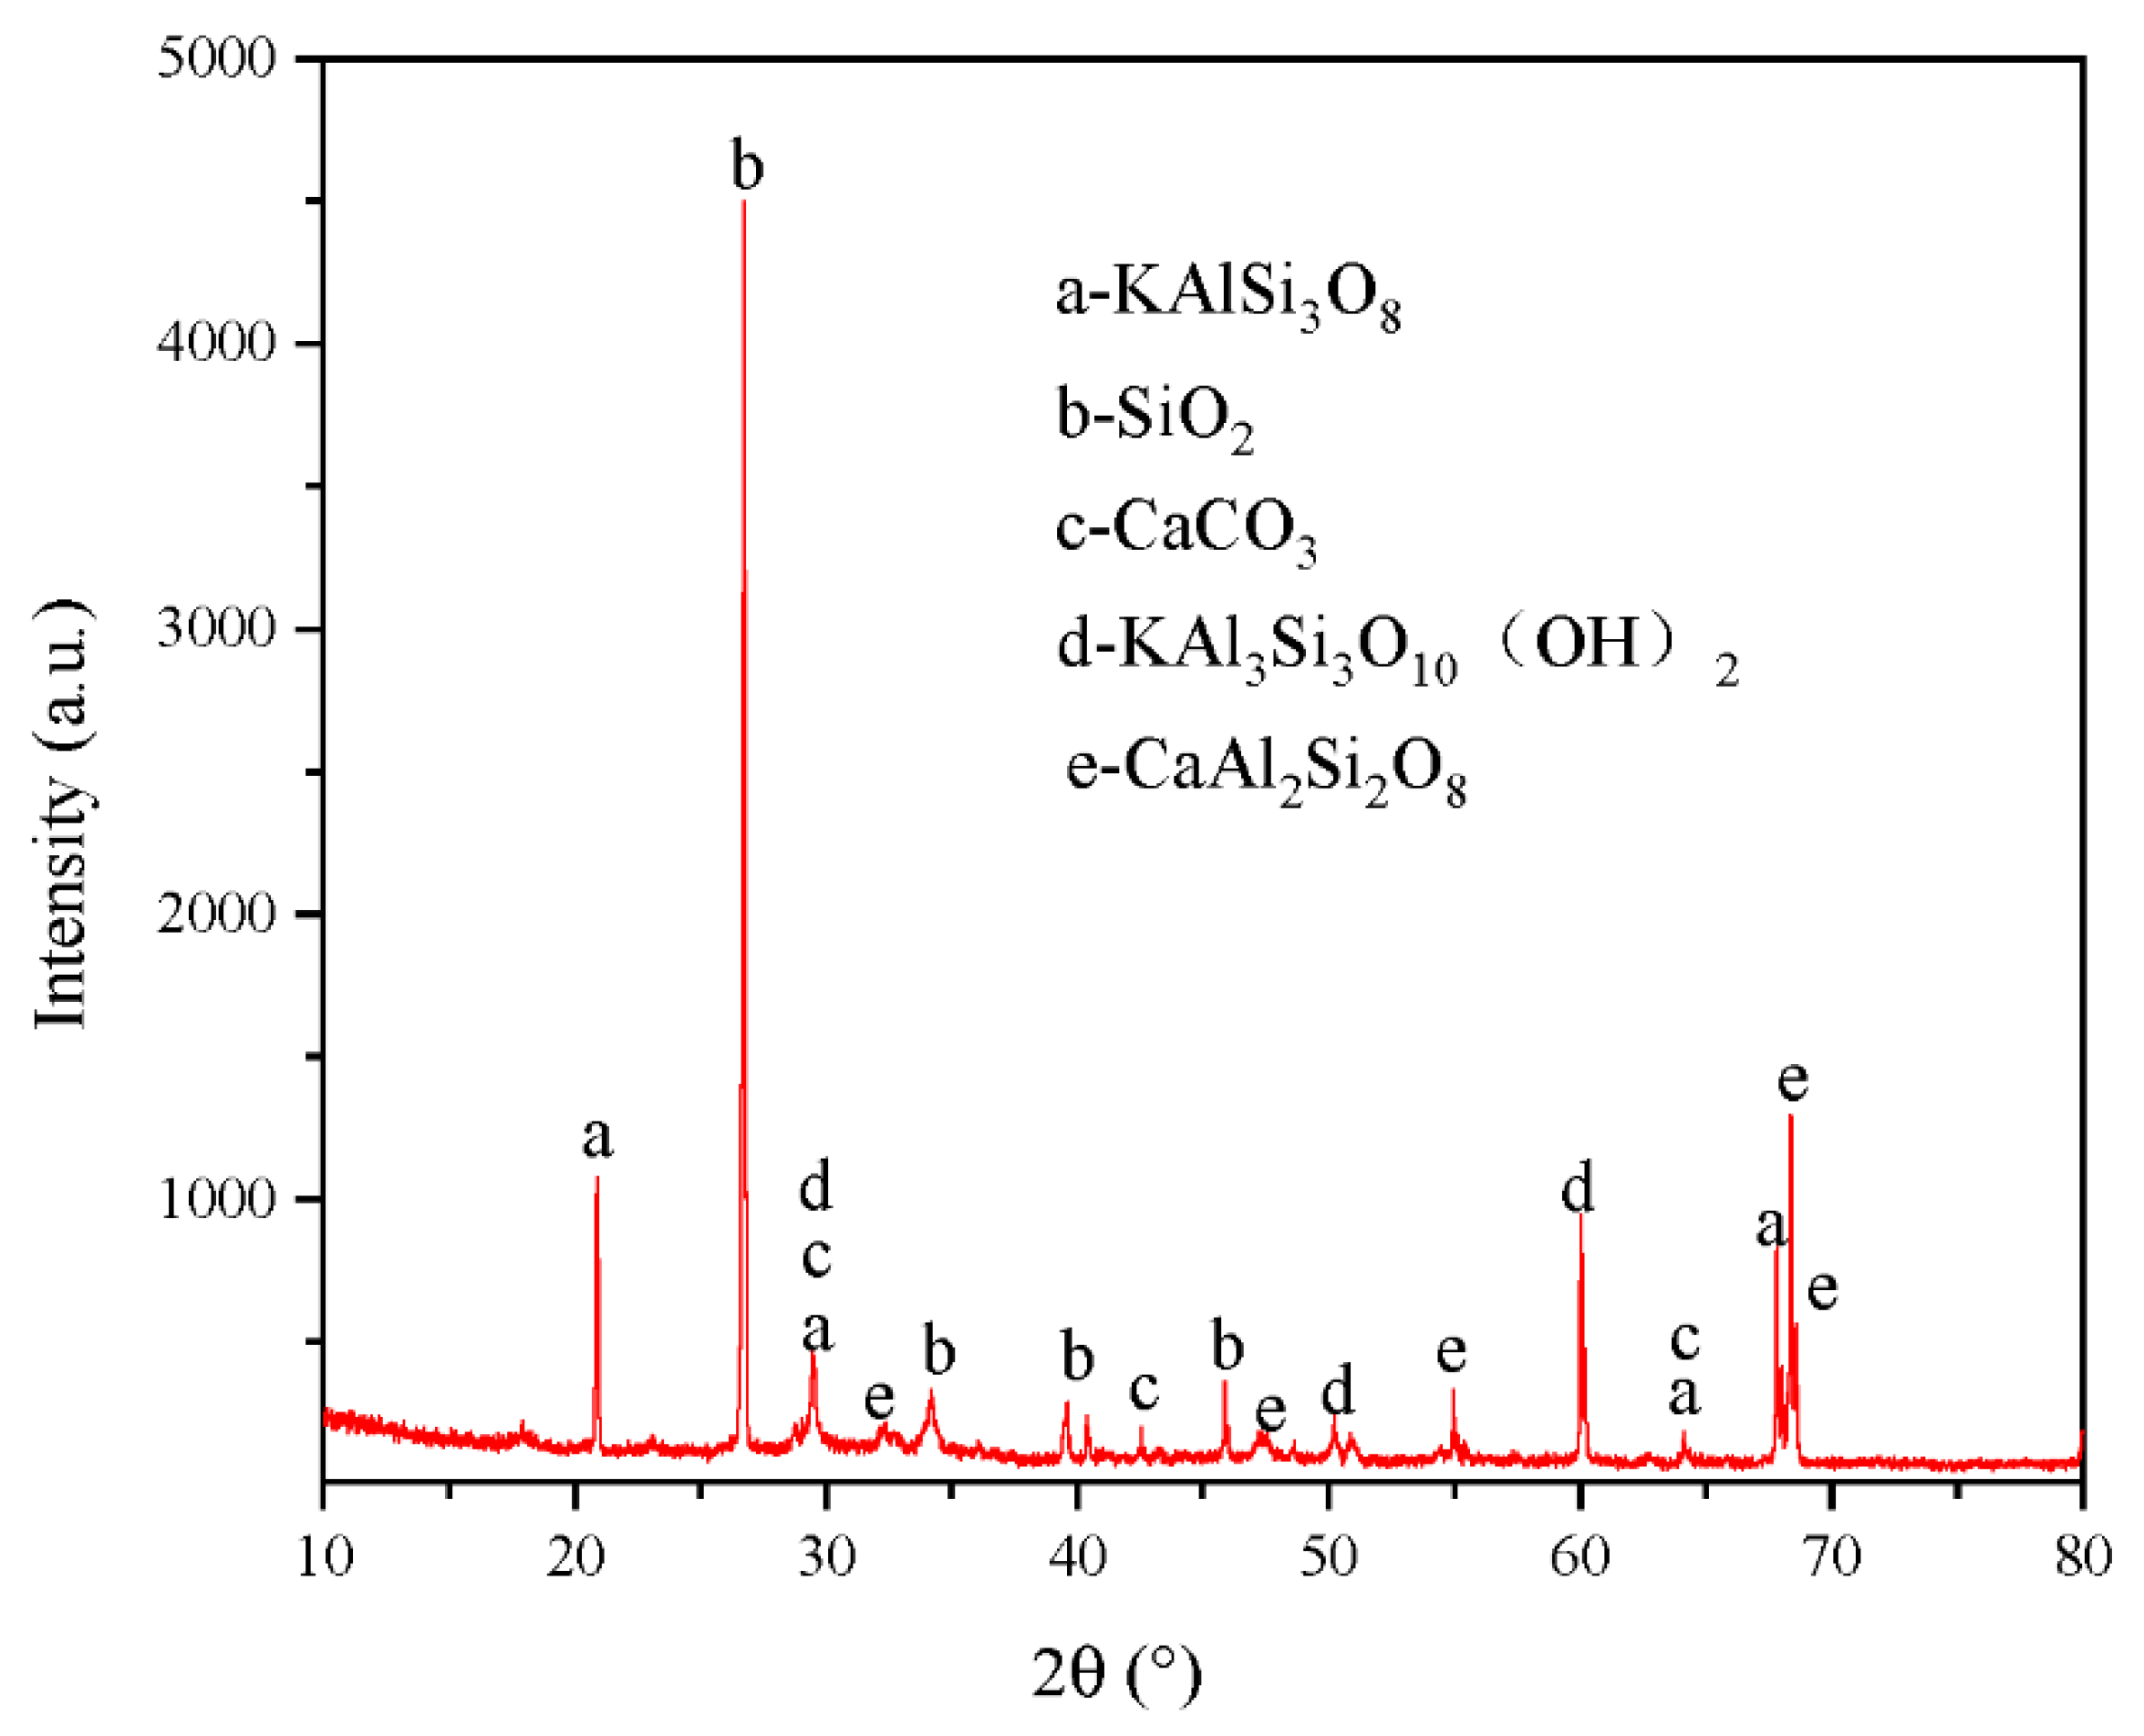
2.2. Physical Properties of Rock-like Specimens
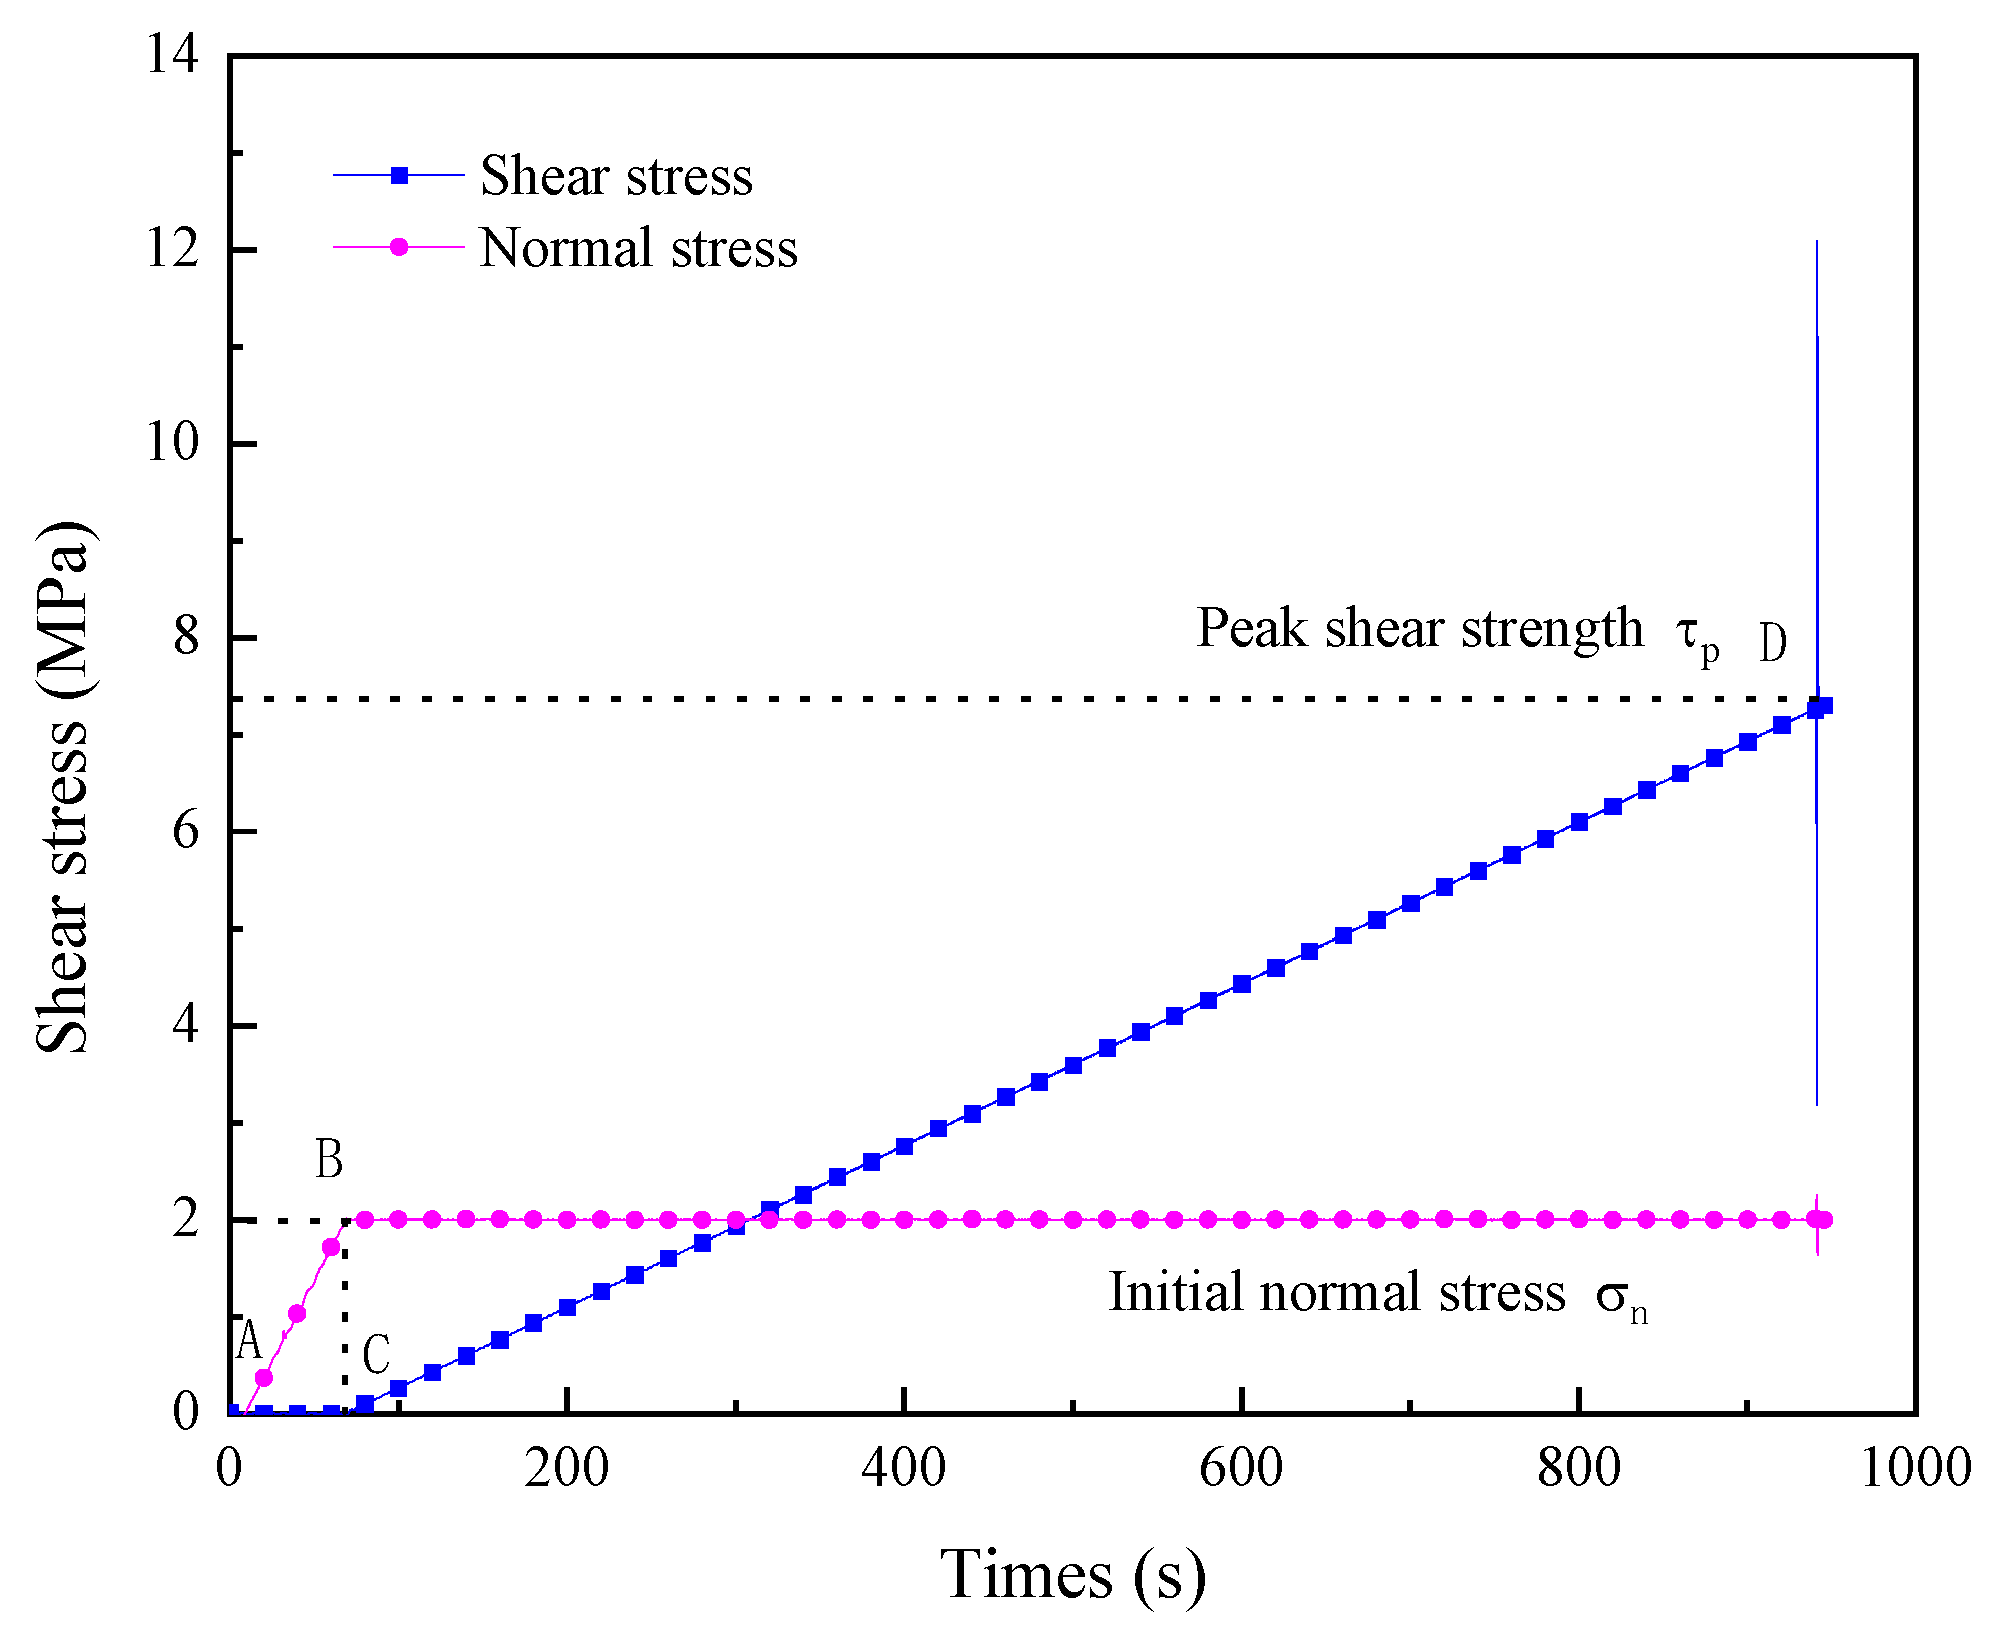
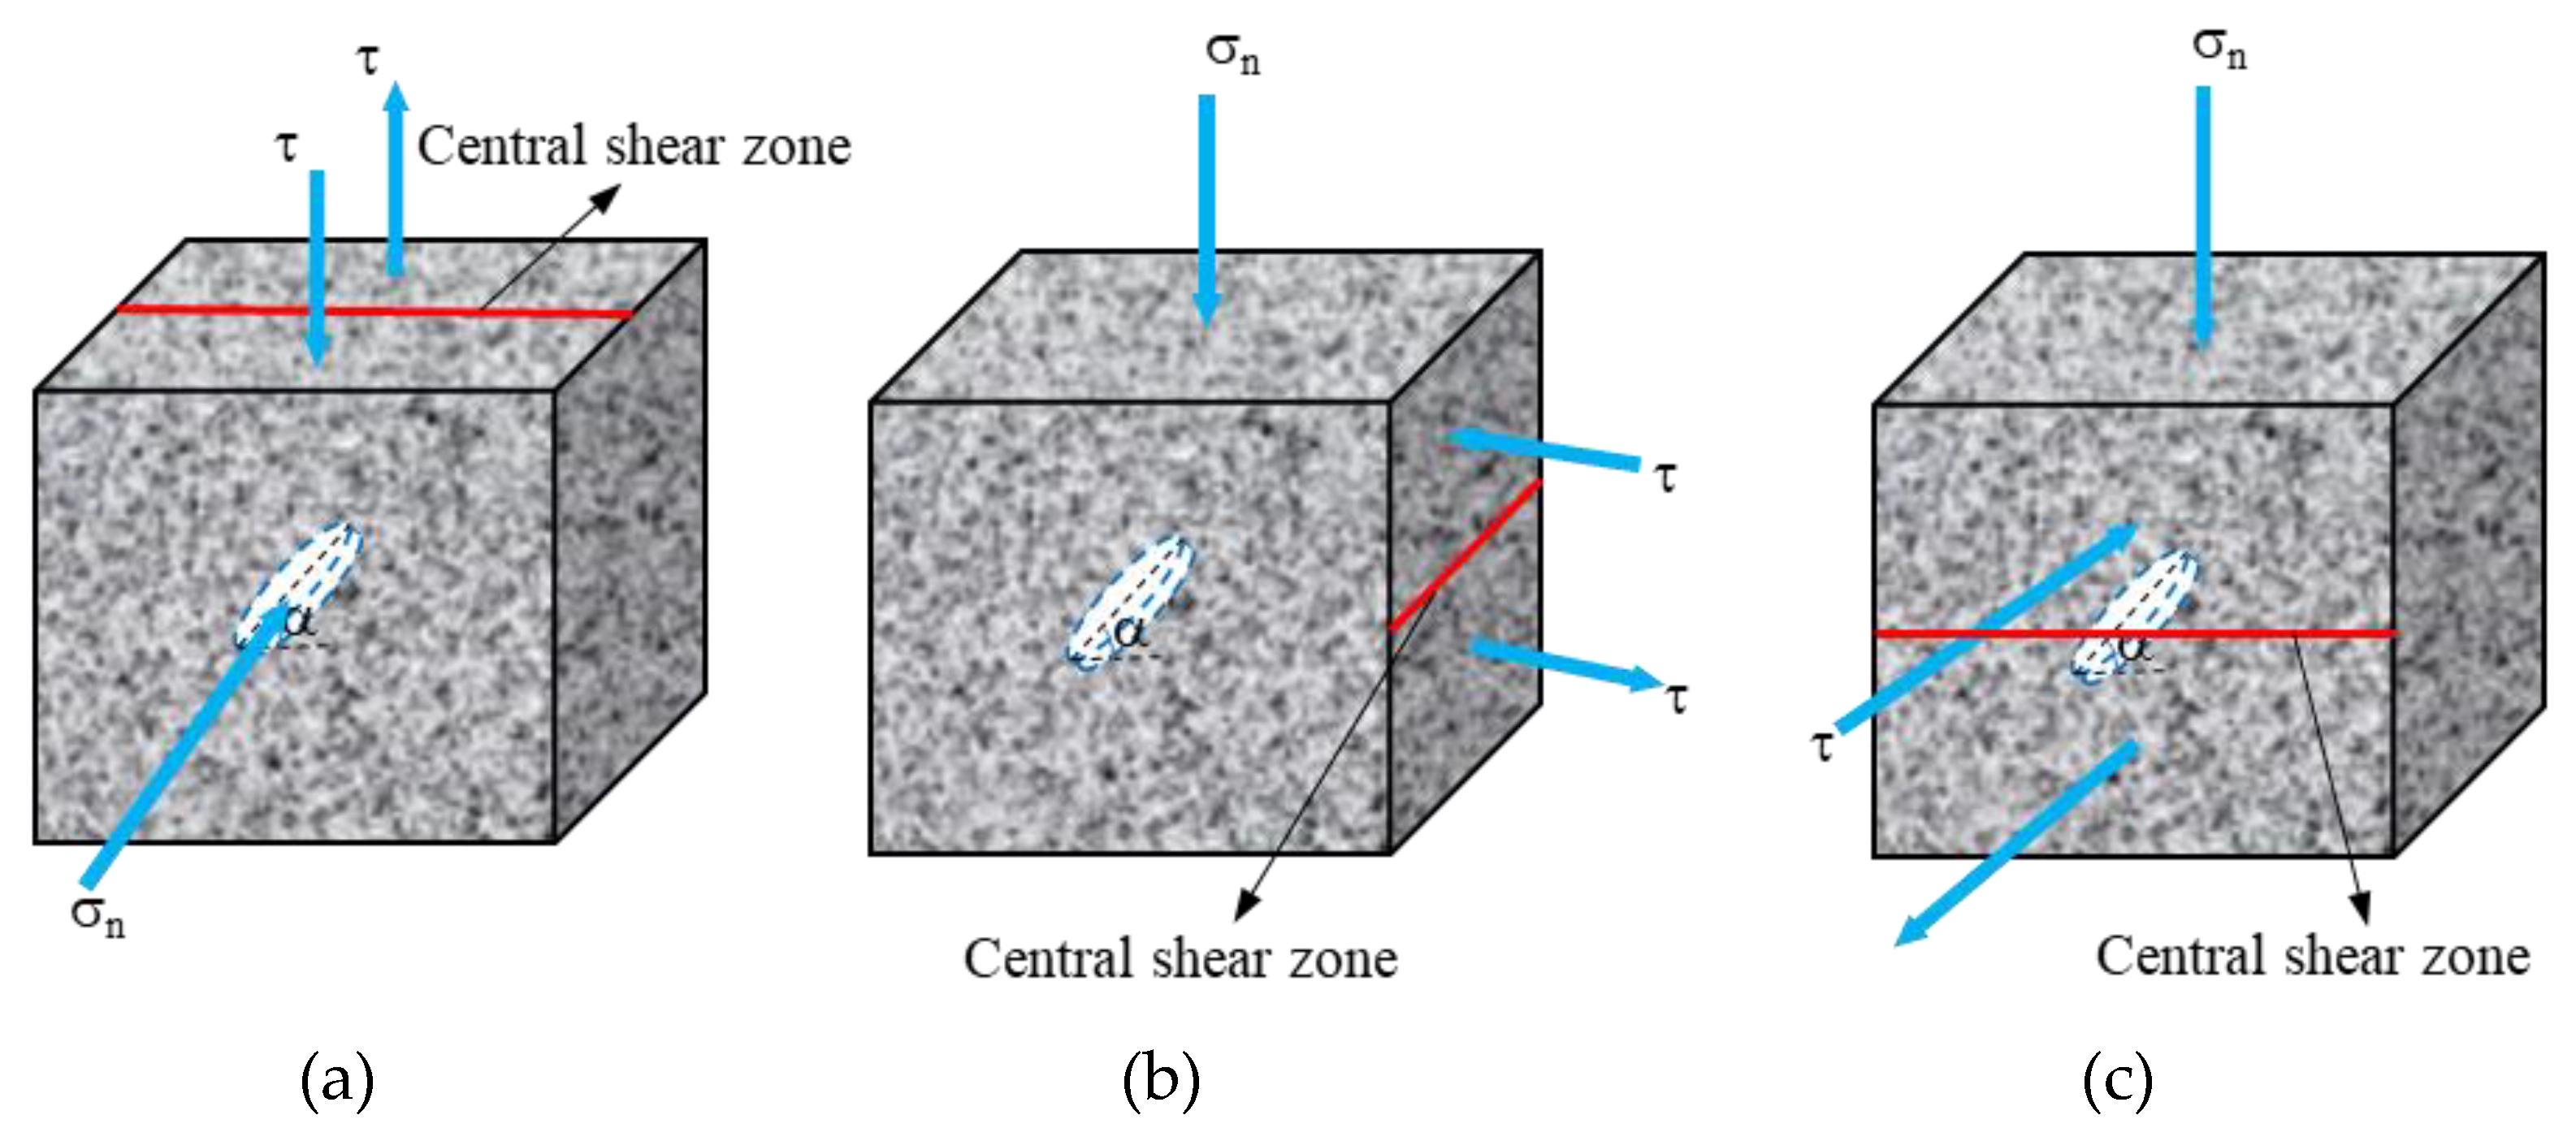
2.3. Experimental Research Program
3. Experiment Results
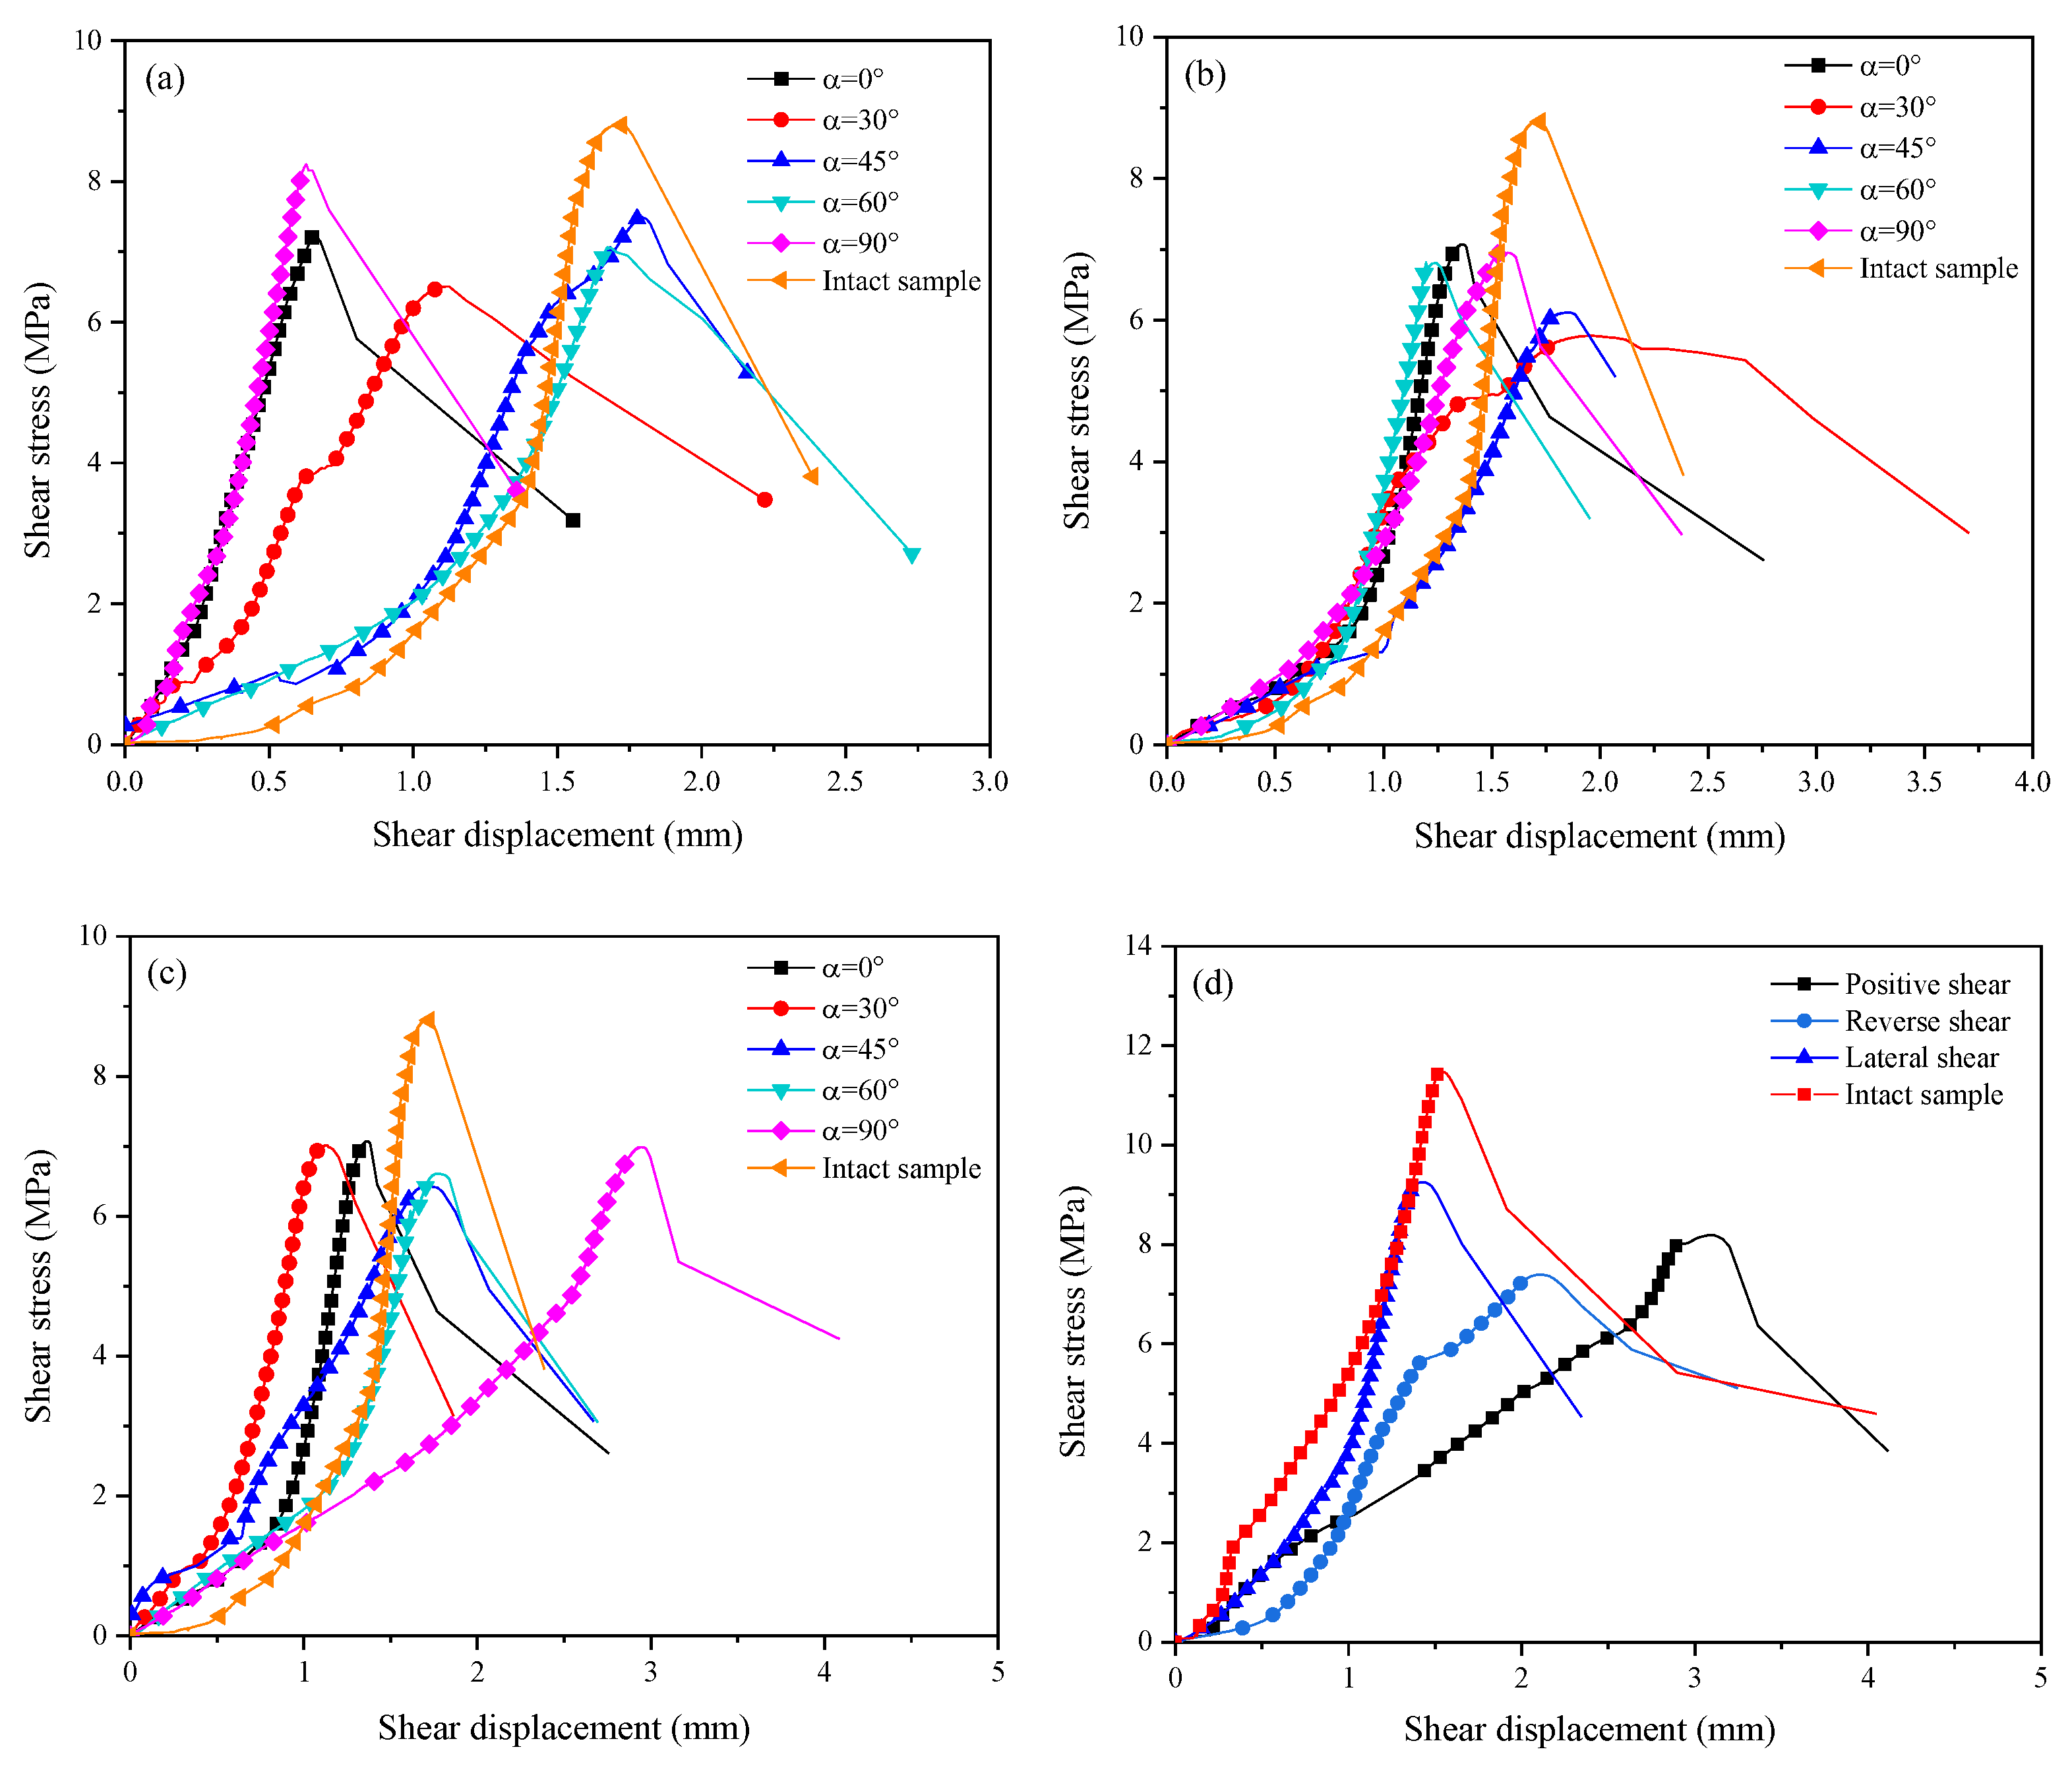
3.1. Shear Displacement-Stress Curve
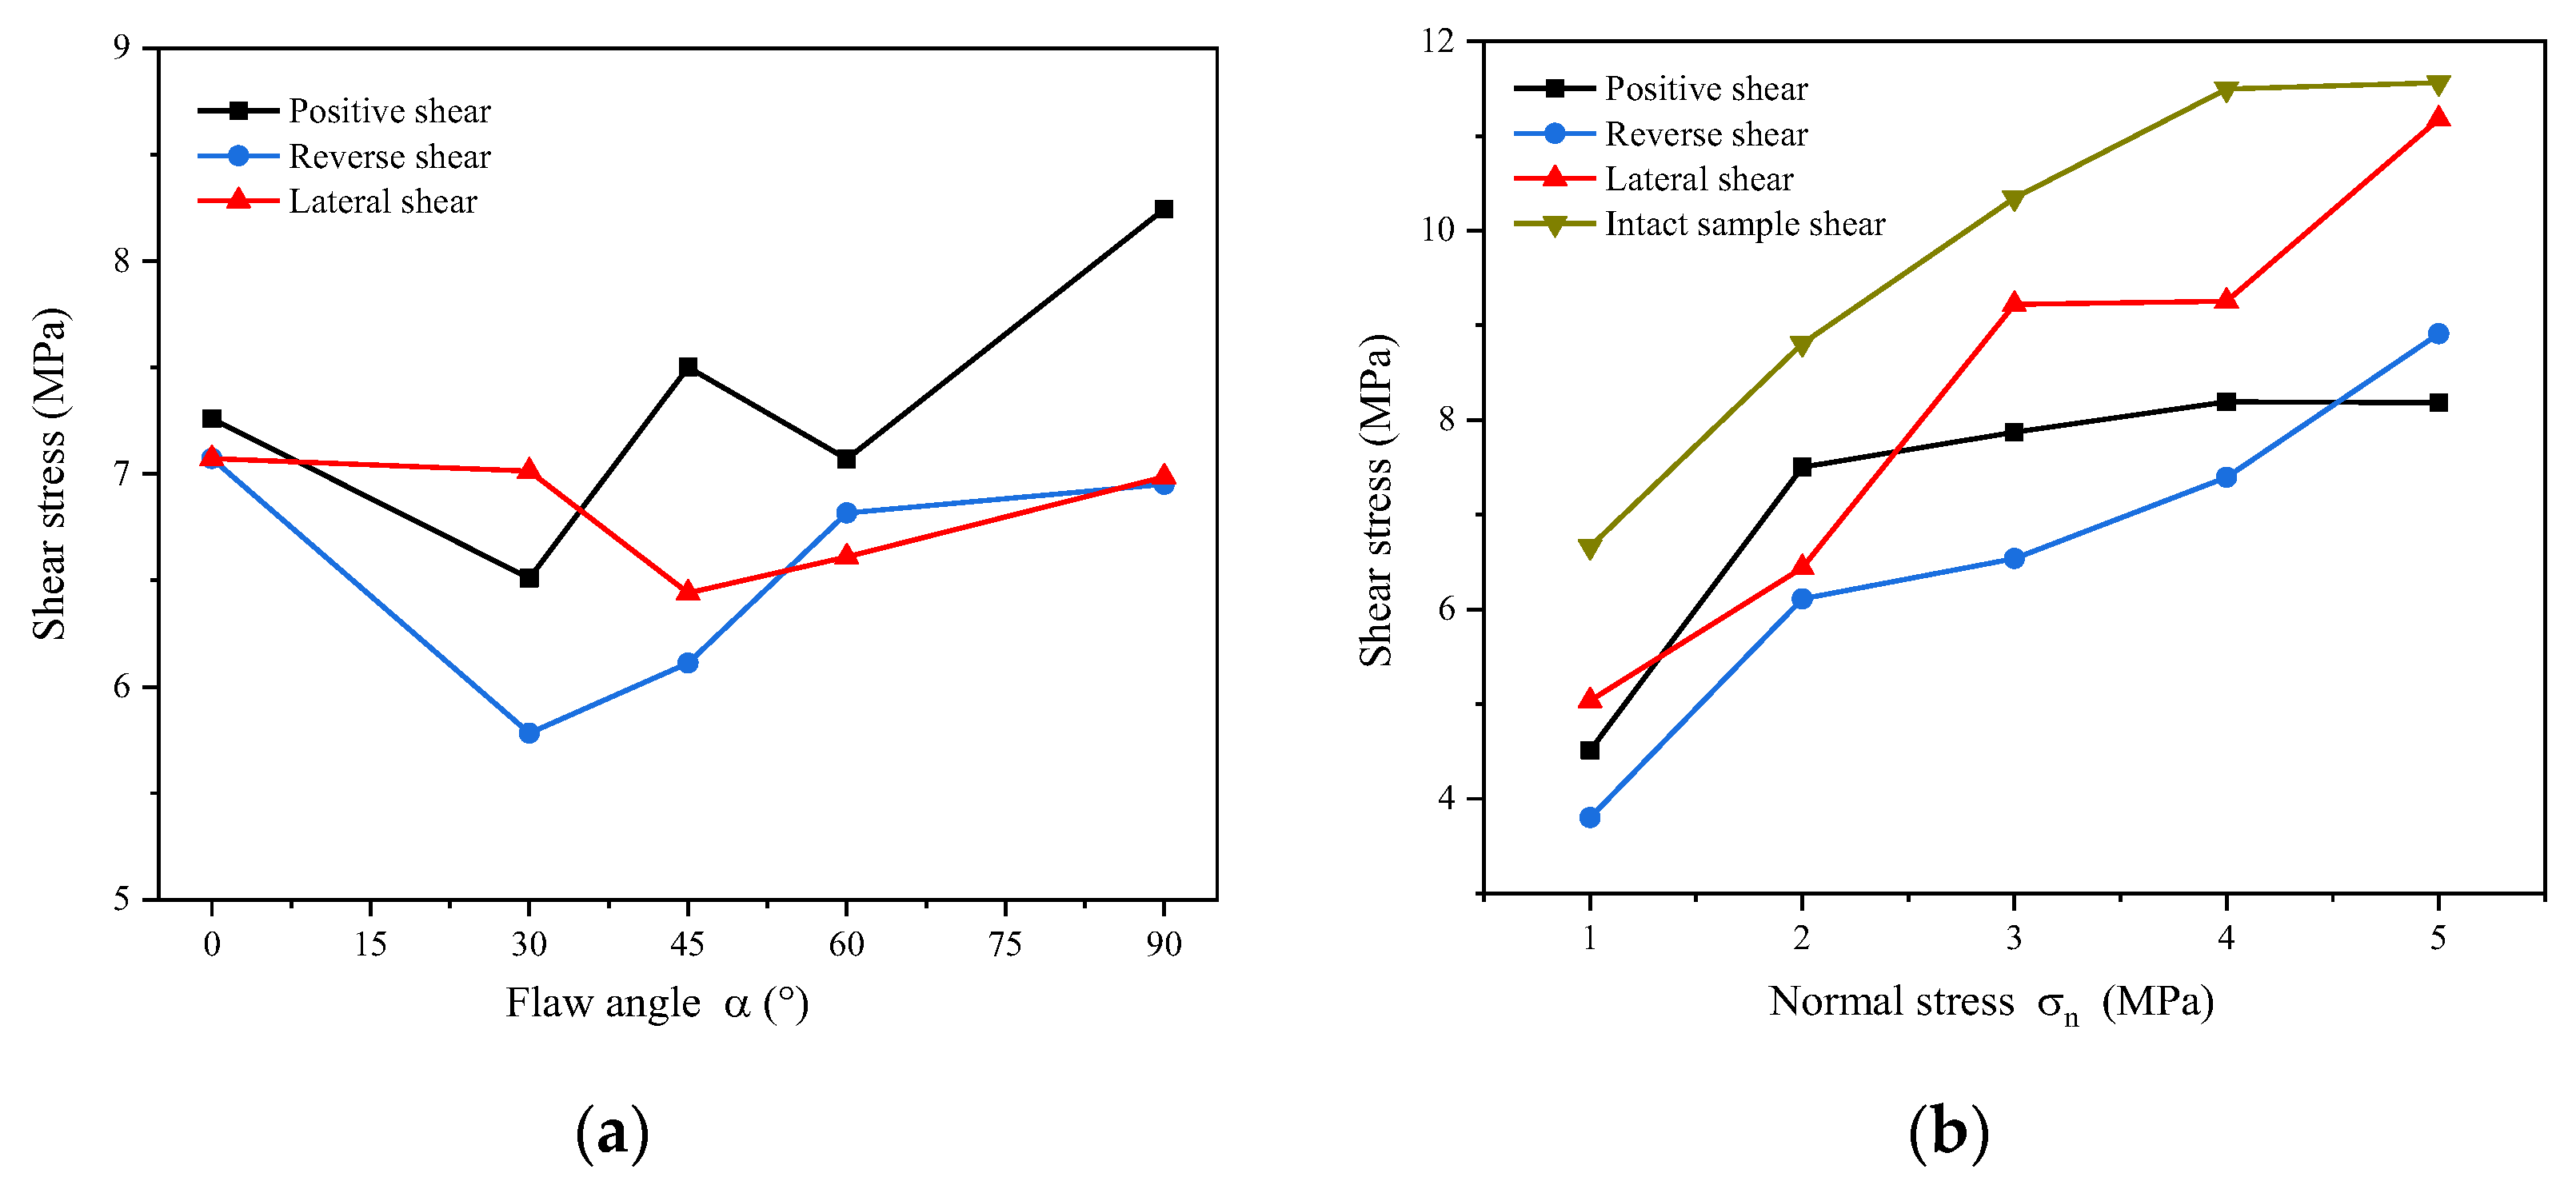
3.2. Strength Characteristics
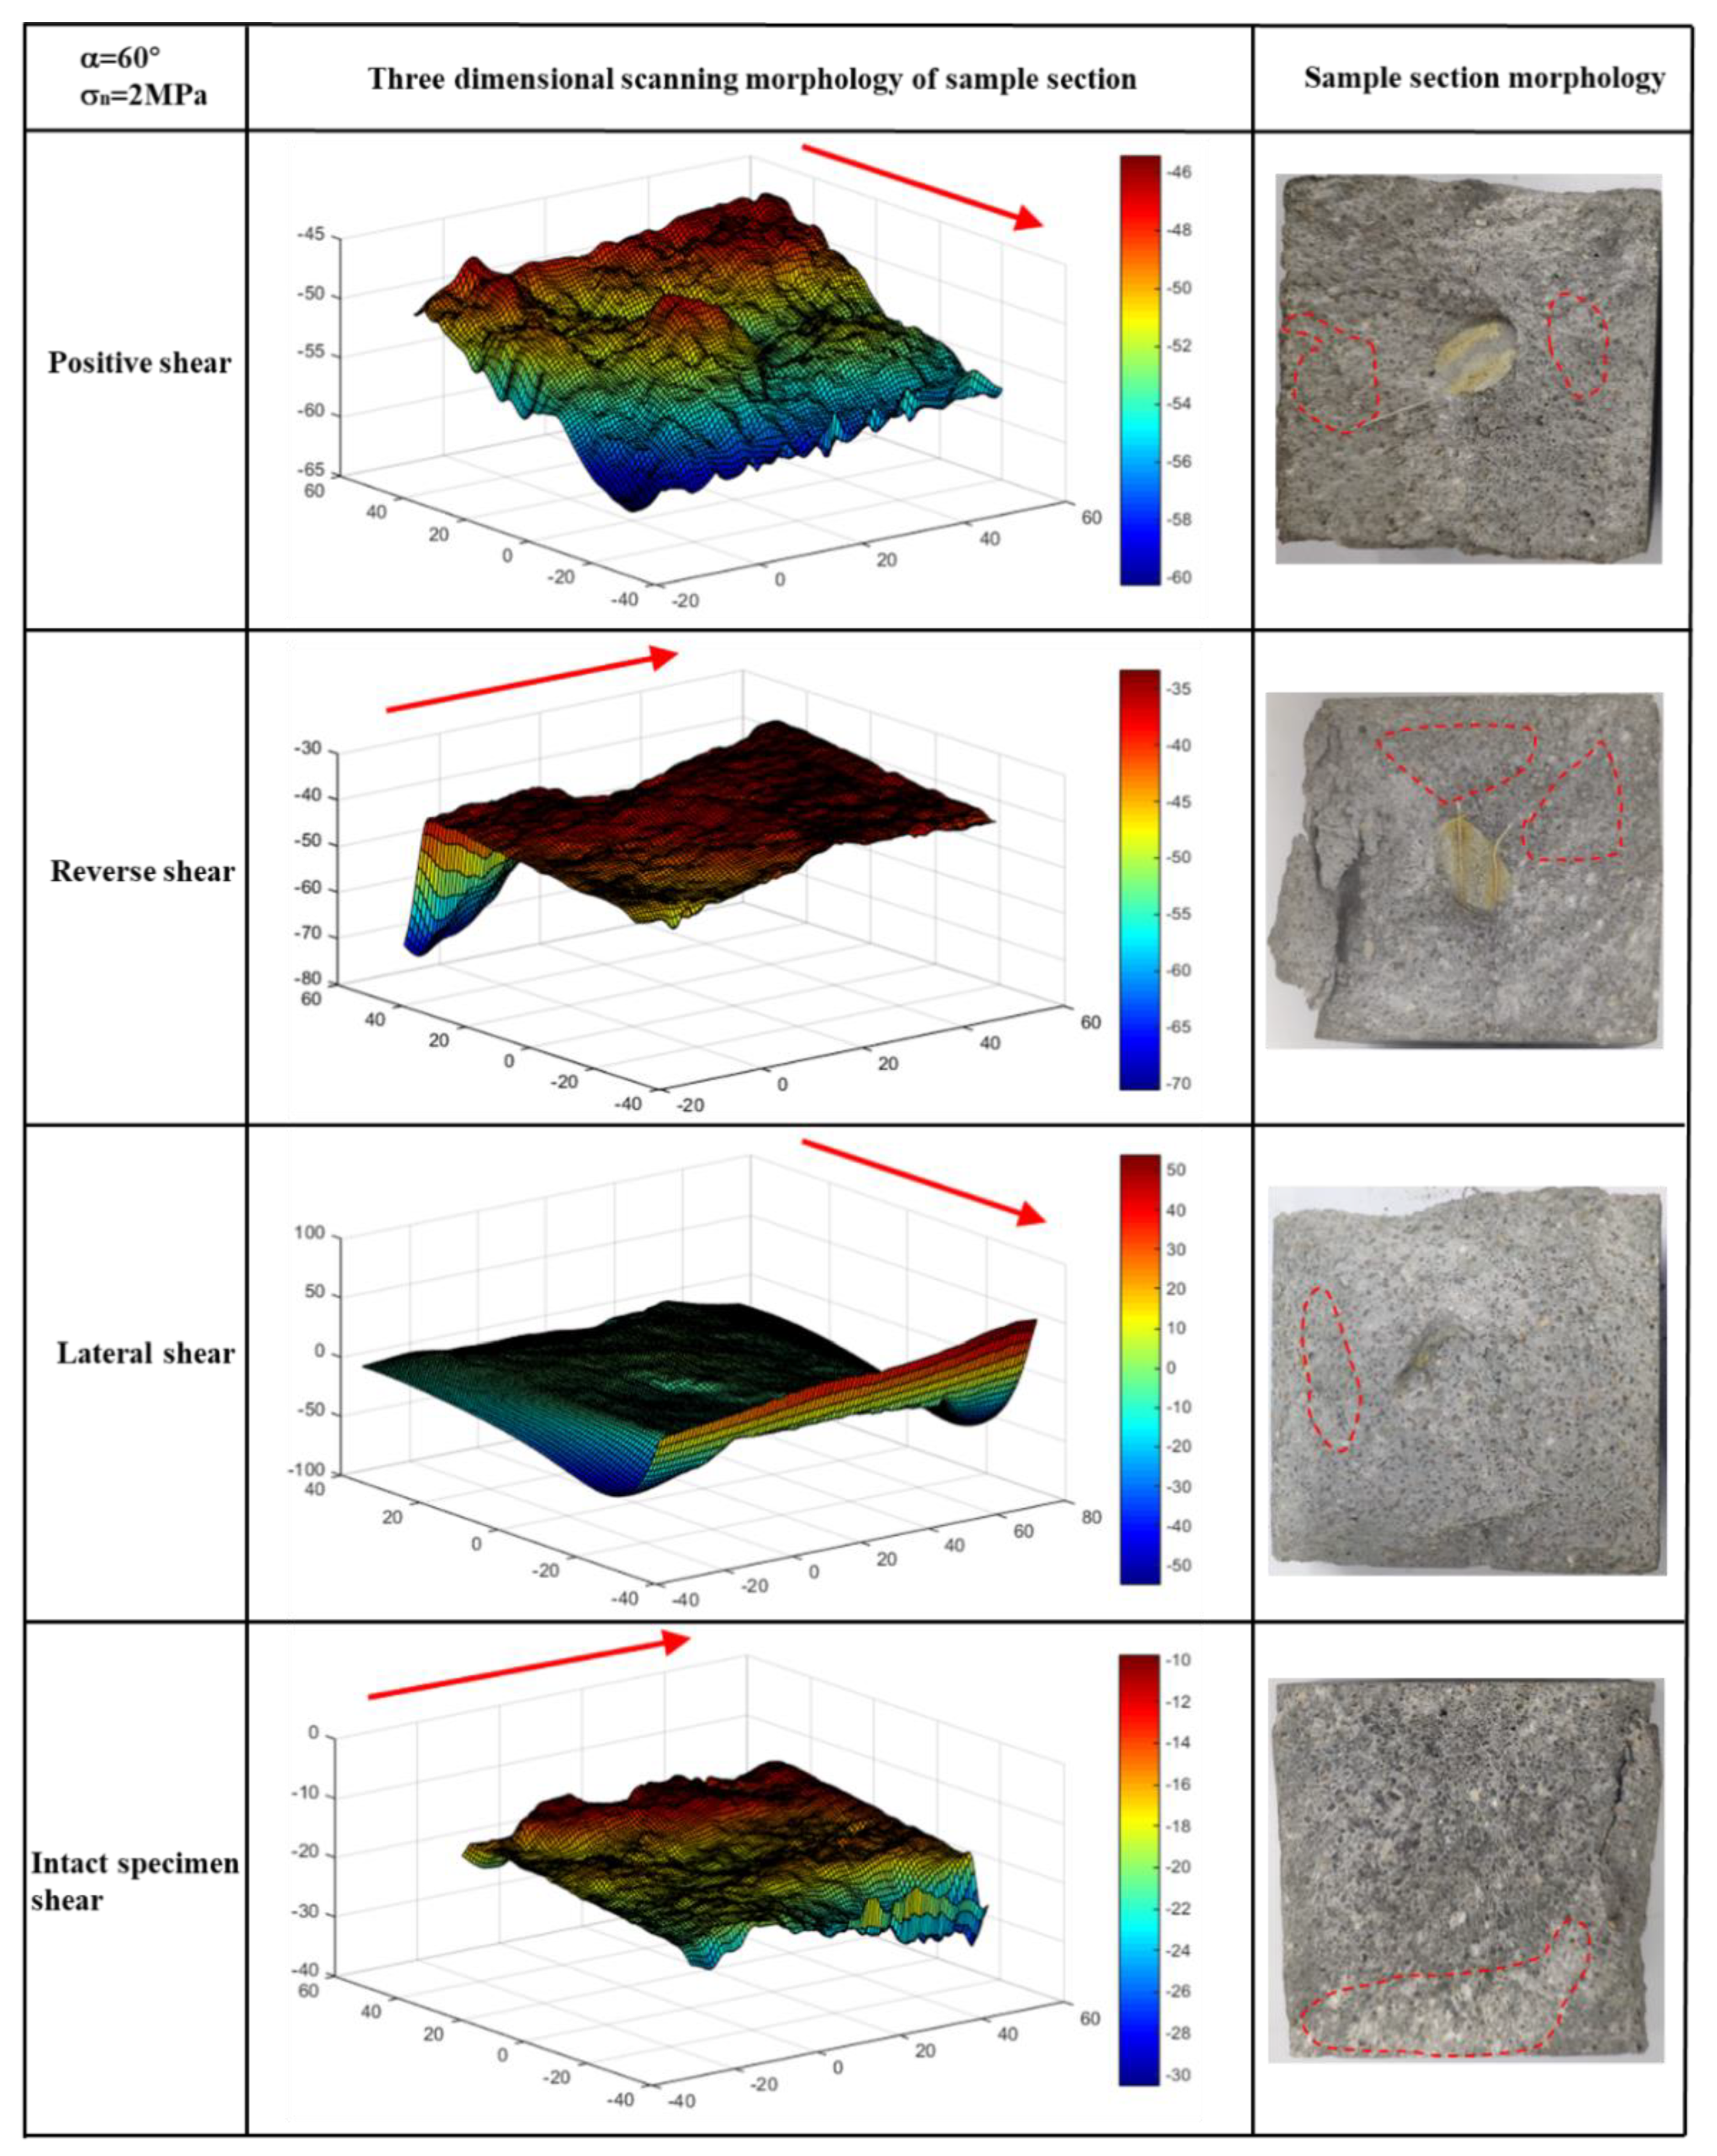
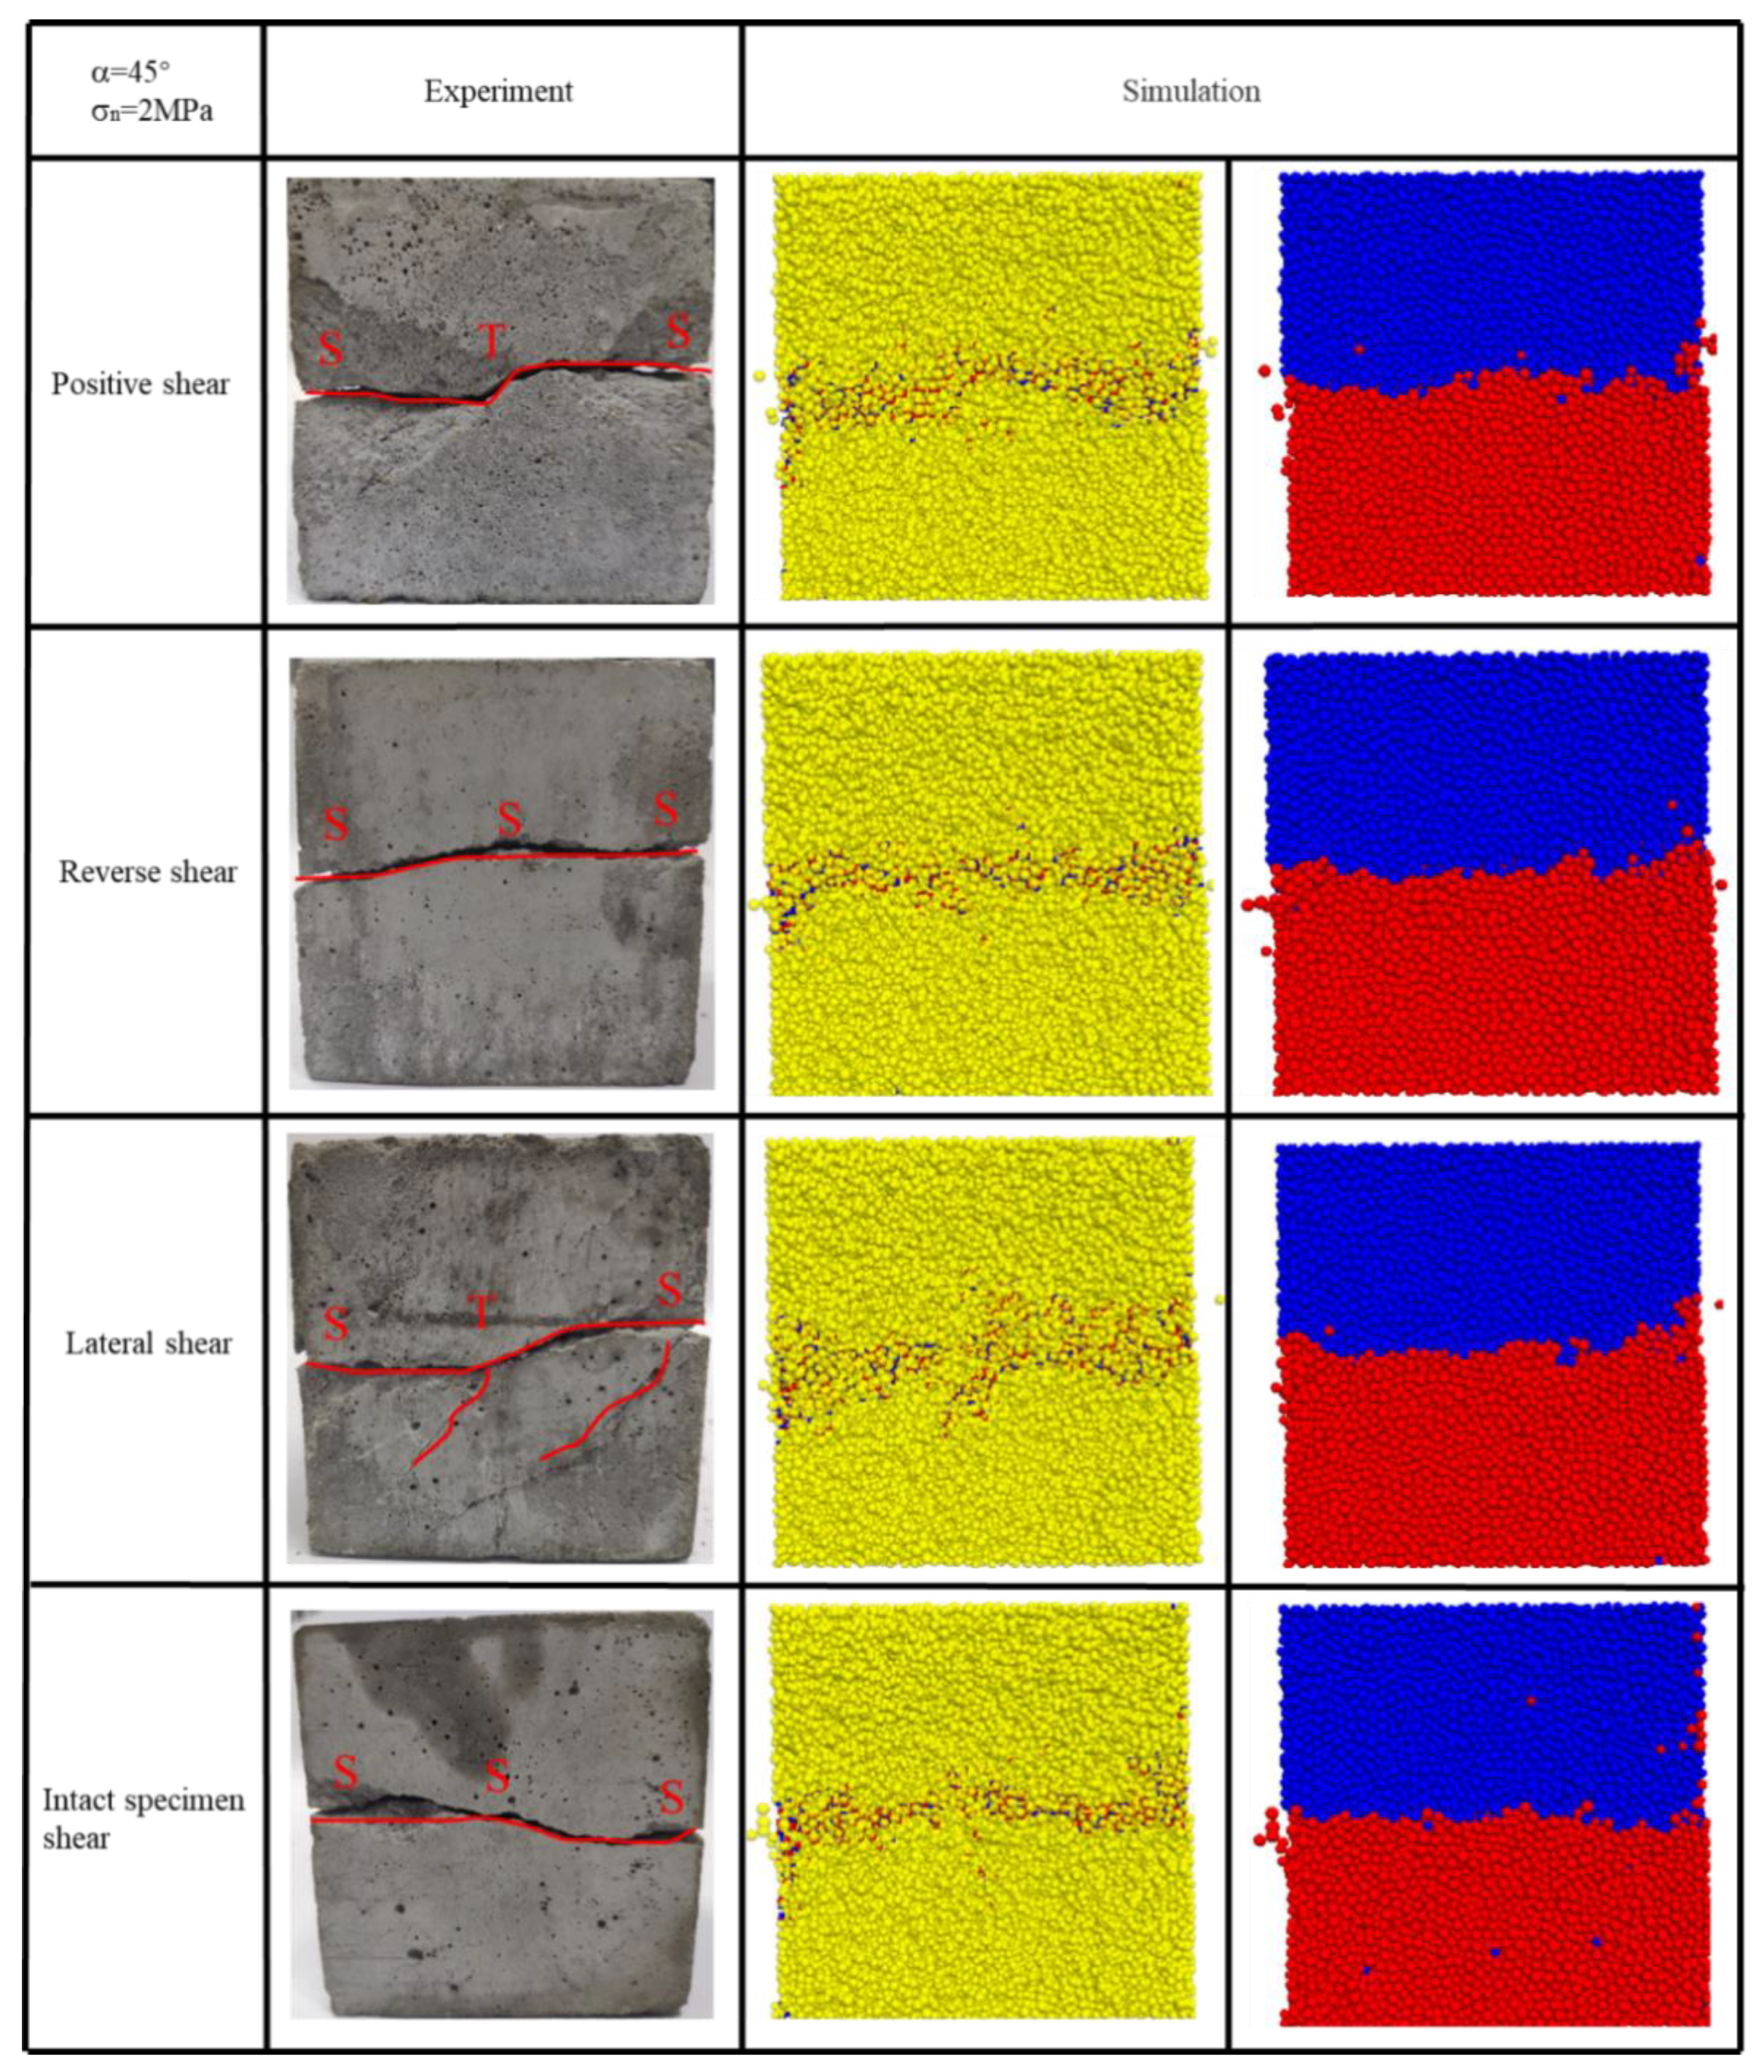
3.3. Analysis of Section Morphology Characteristics
4. Numerical Simulation
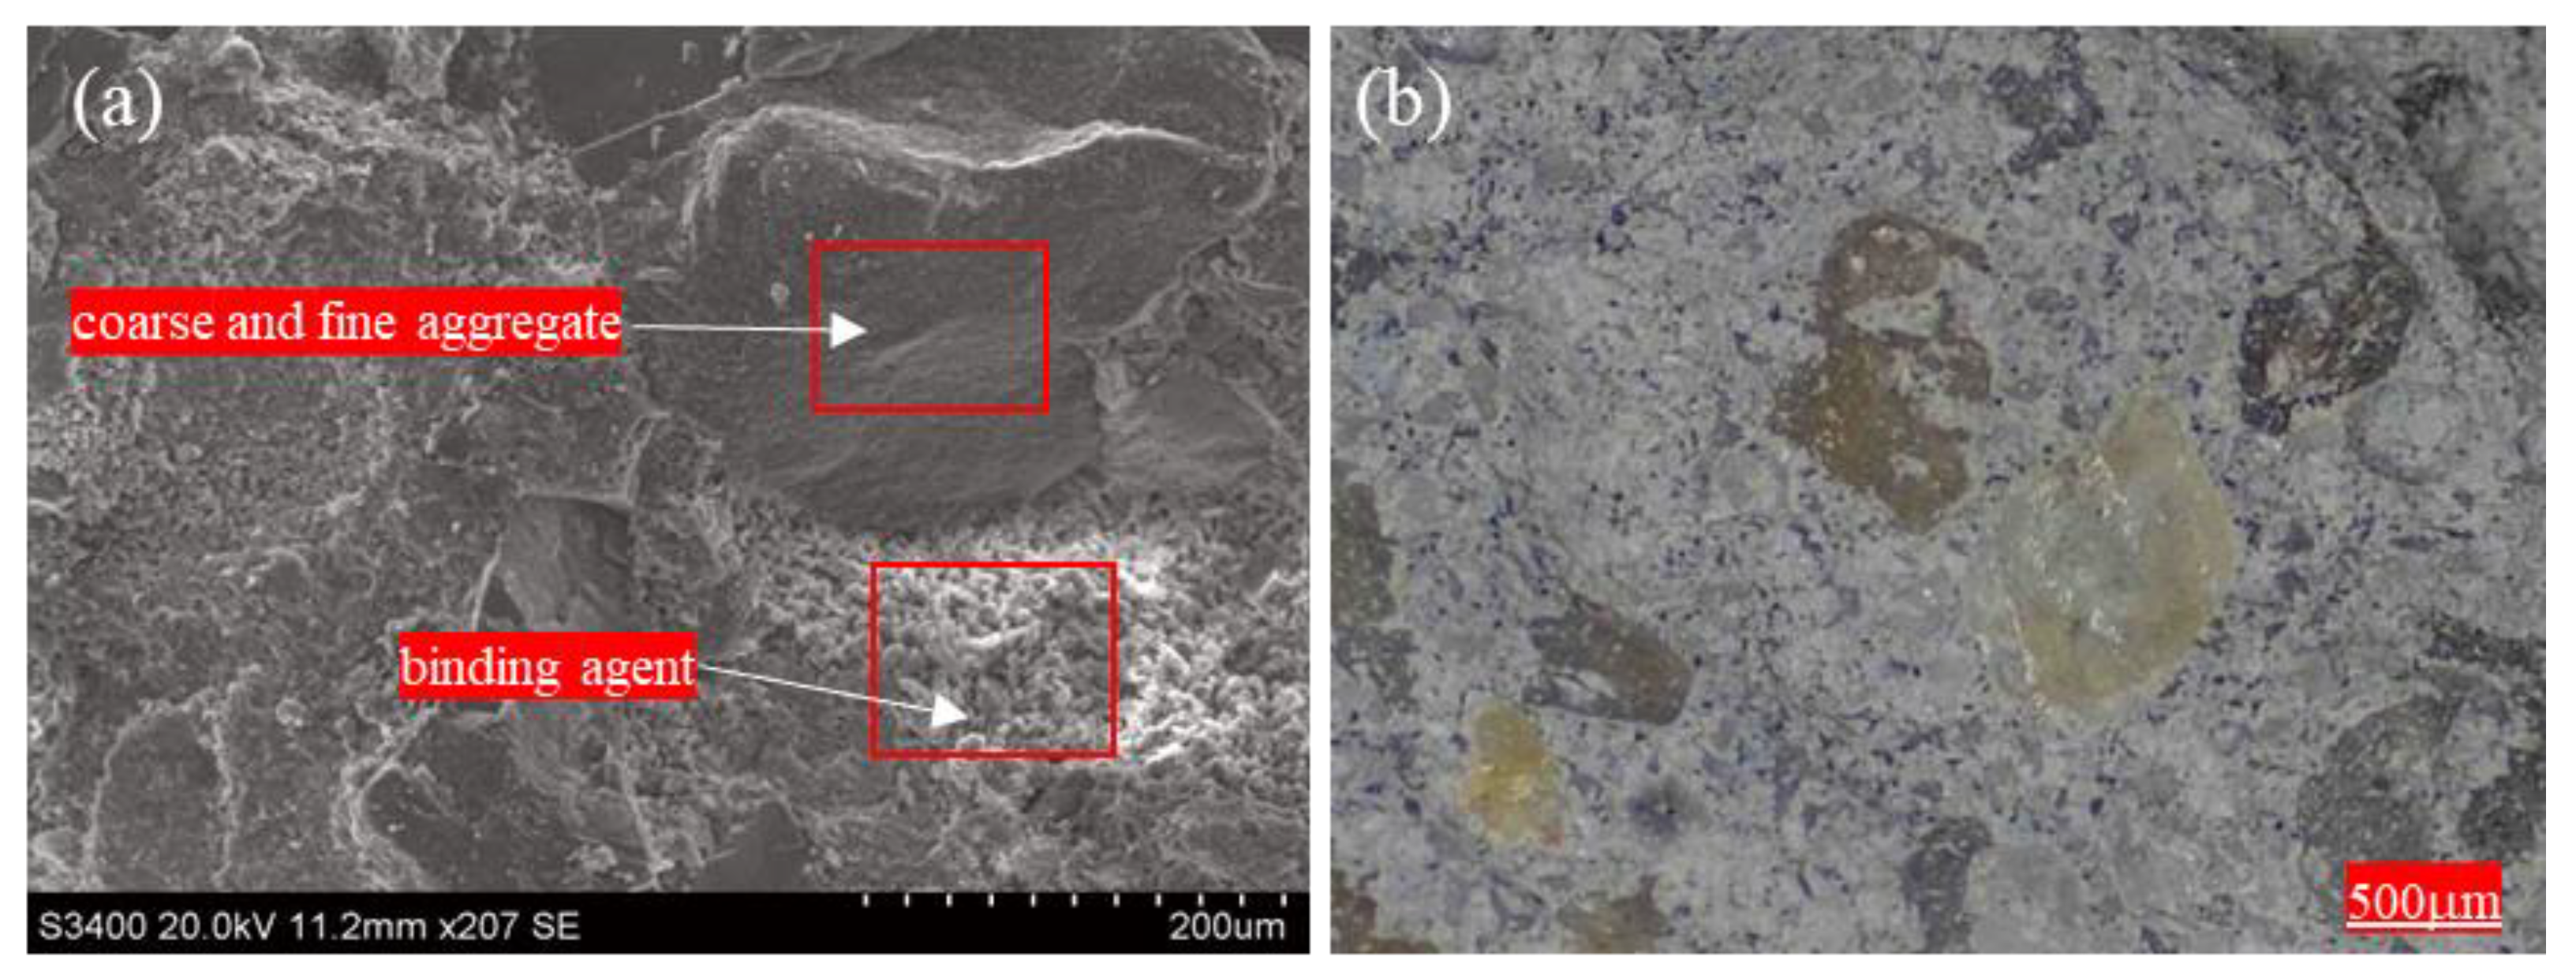
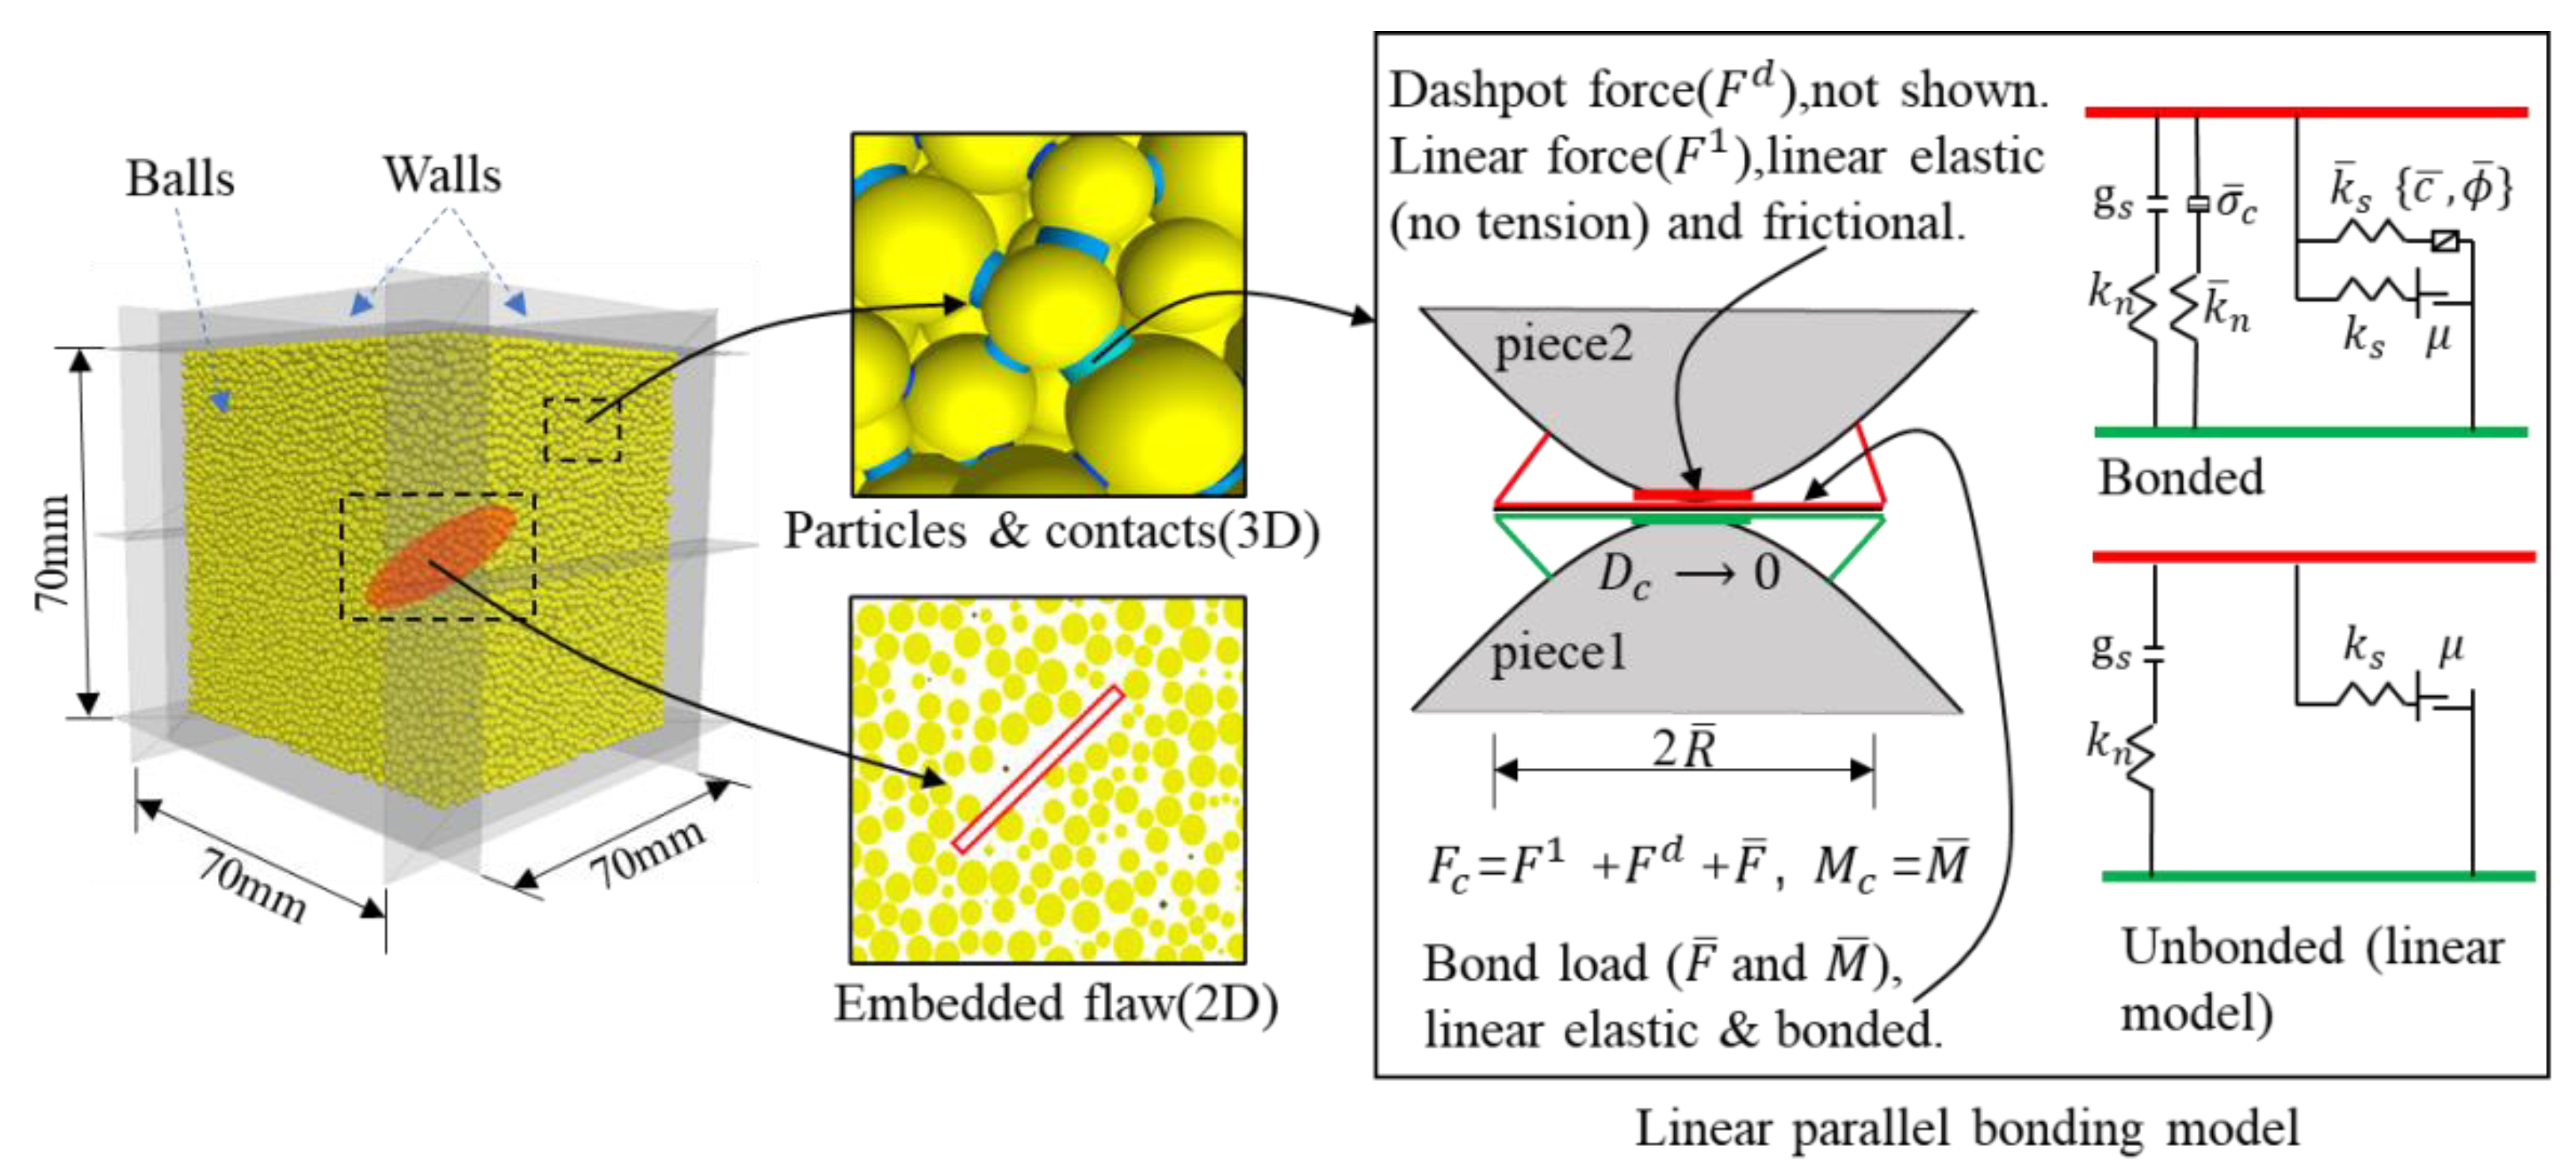
4.1. Microstructure of Rock-like and PFC3D Numerical Model
4.2. Microscopic Parameter Calibration
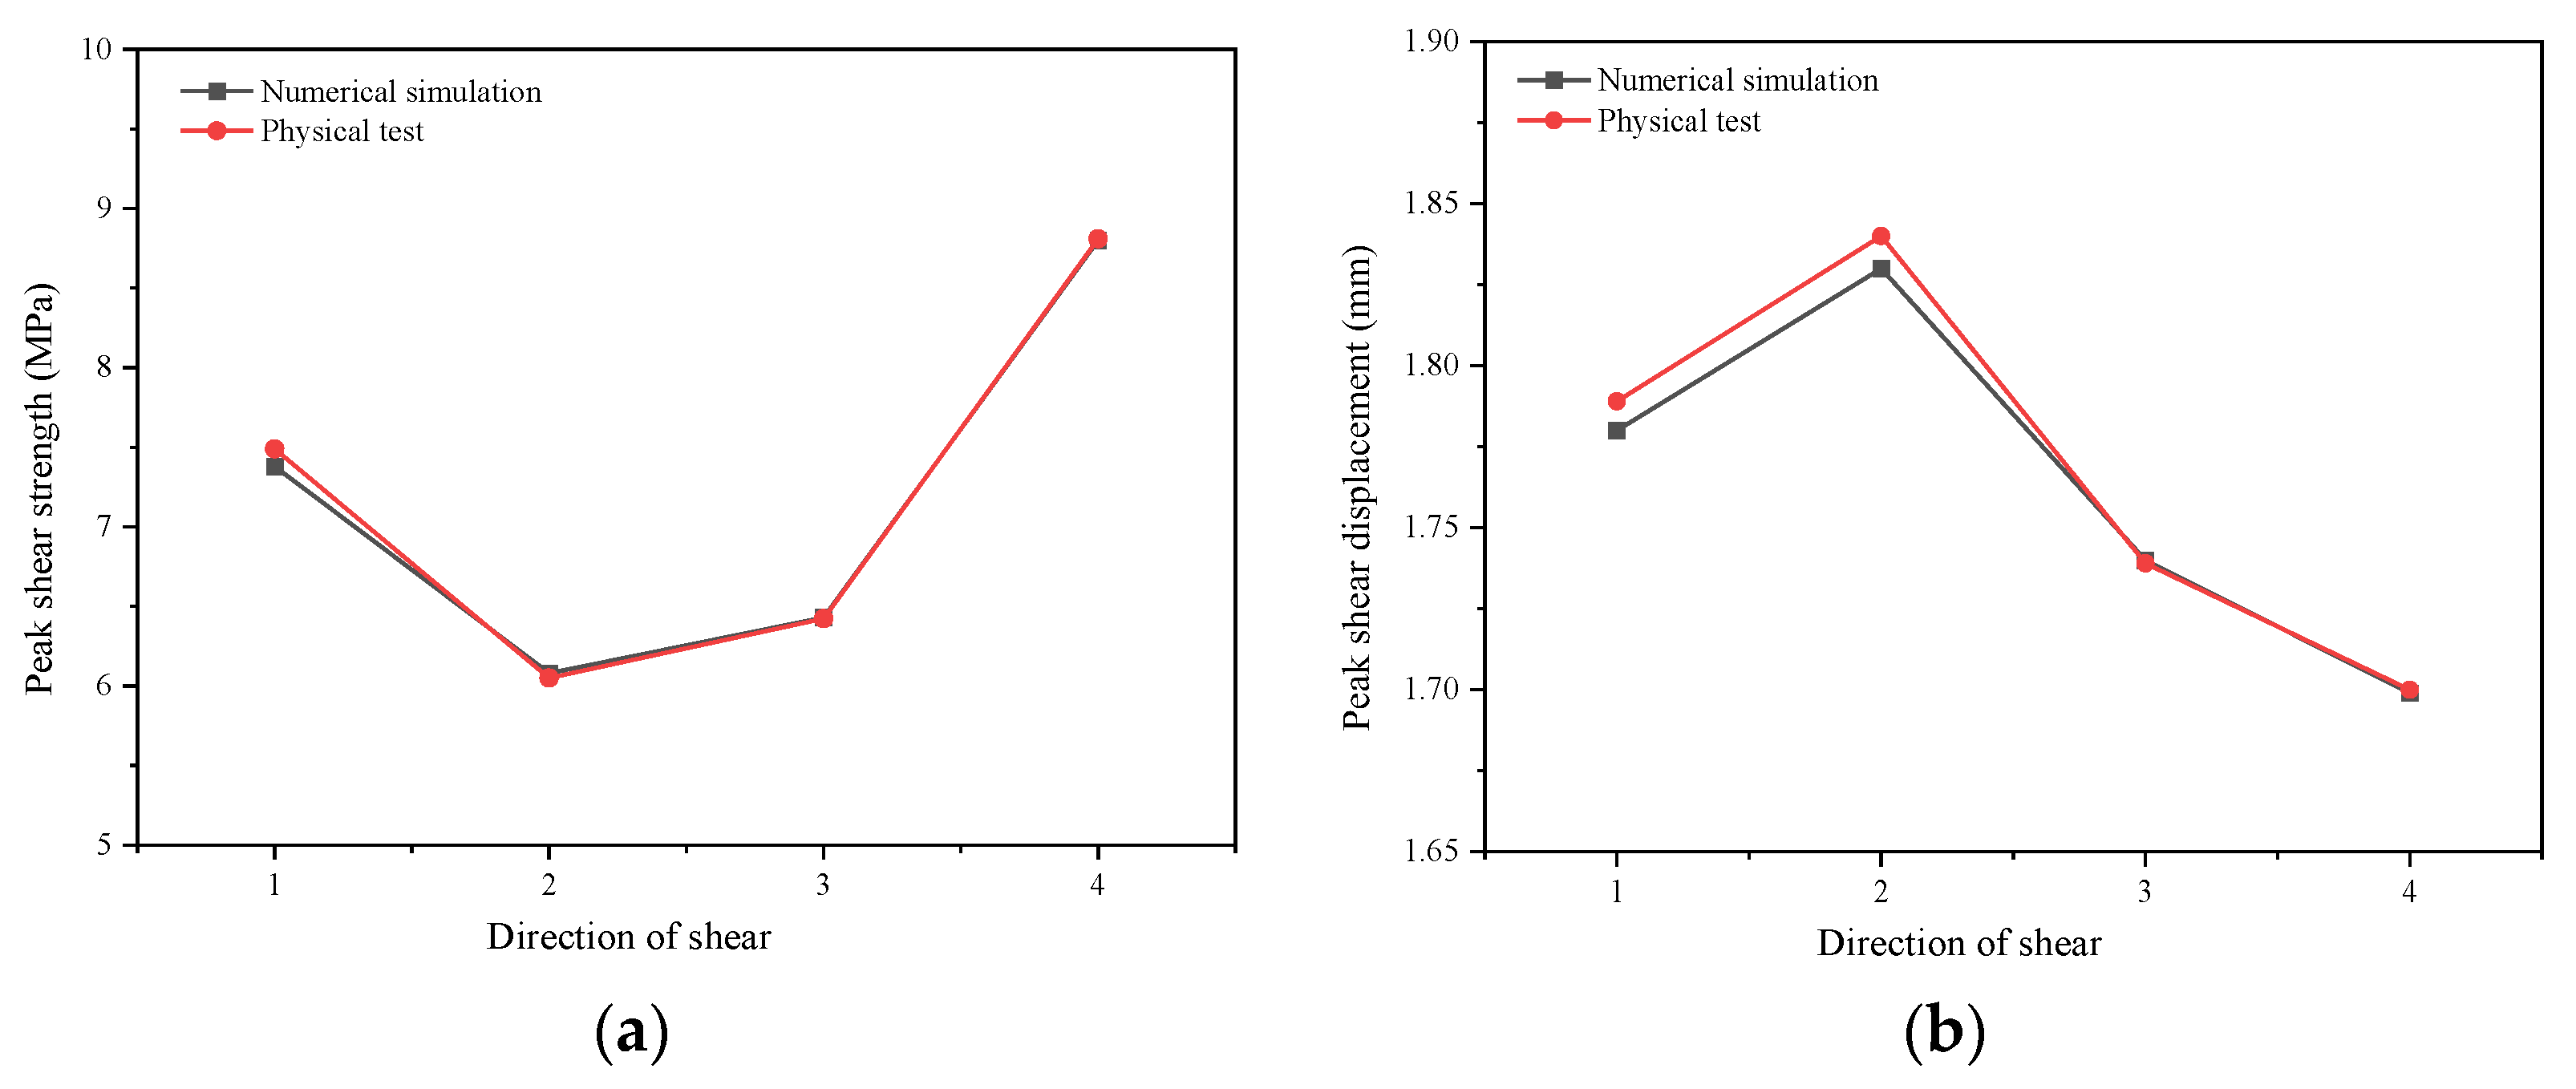
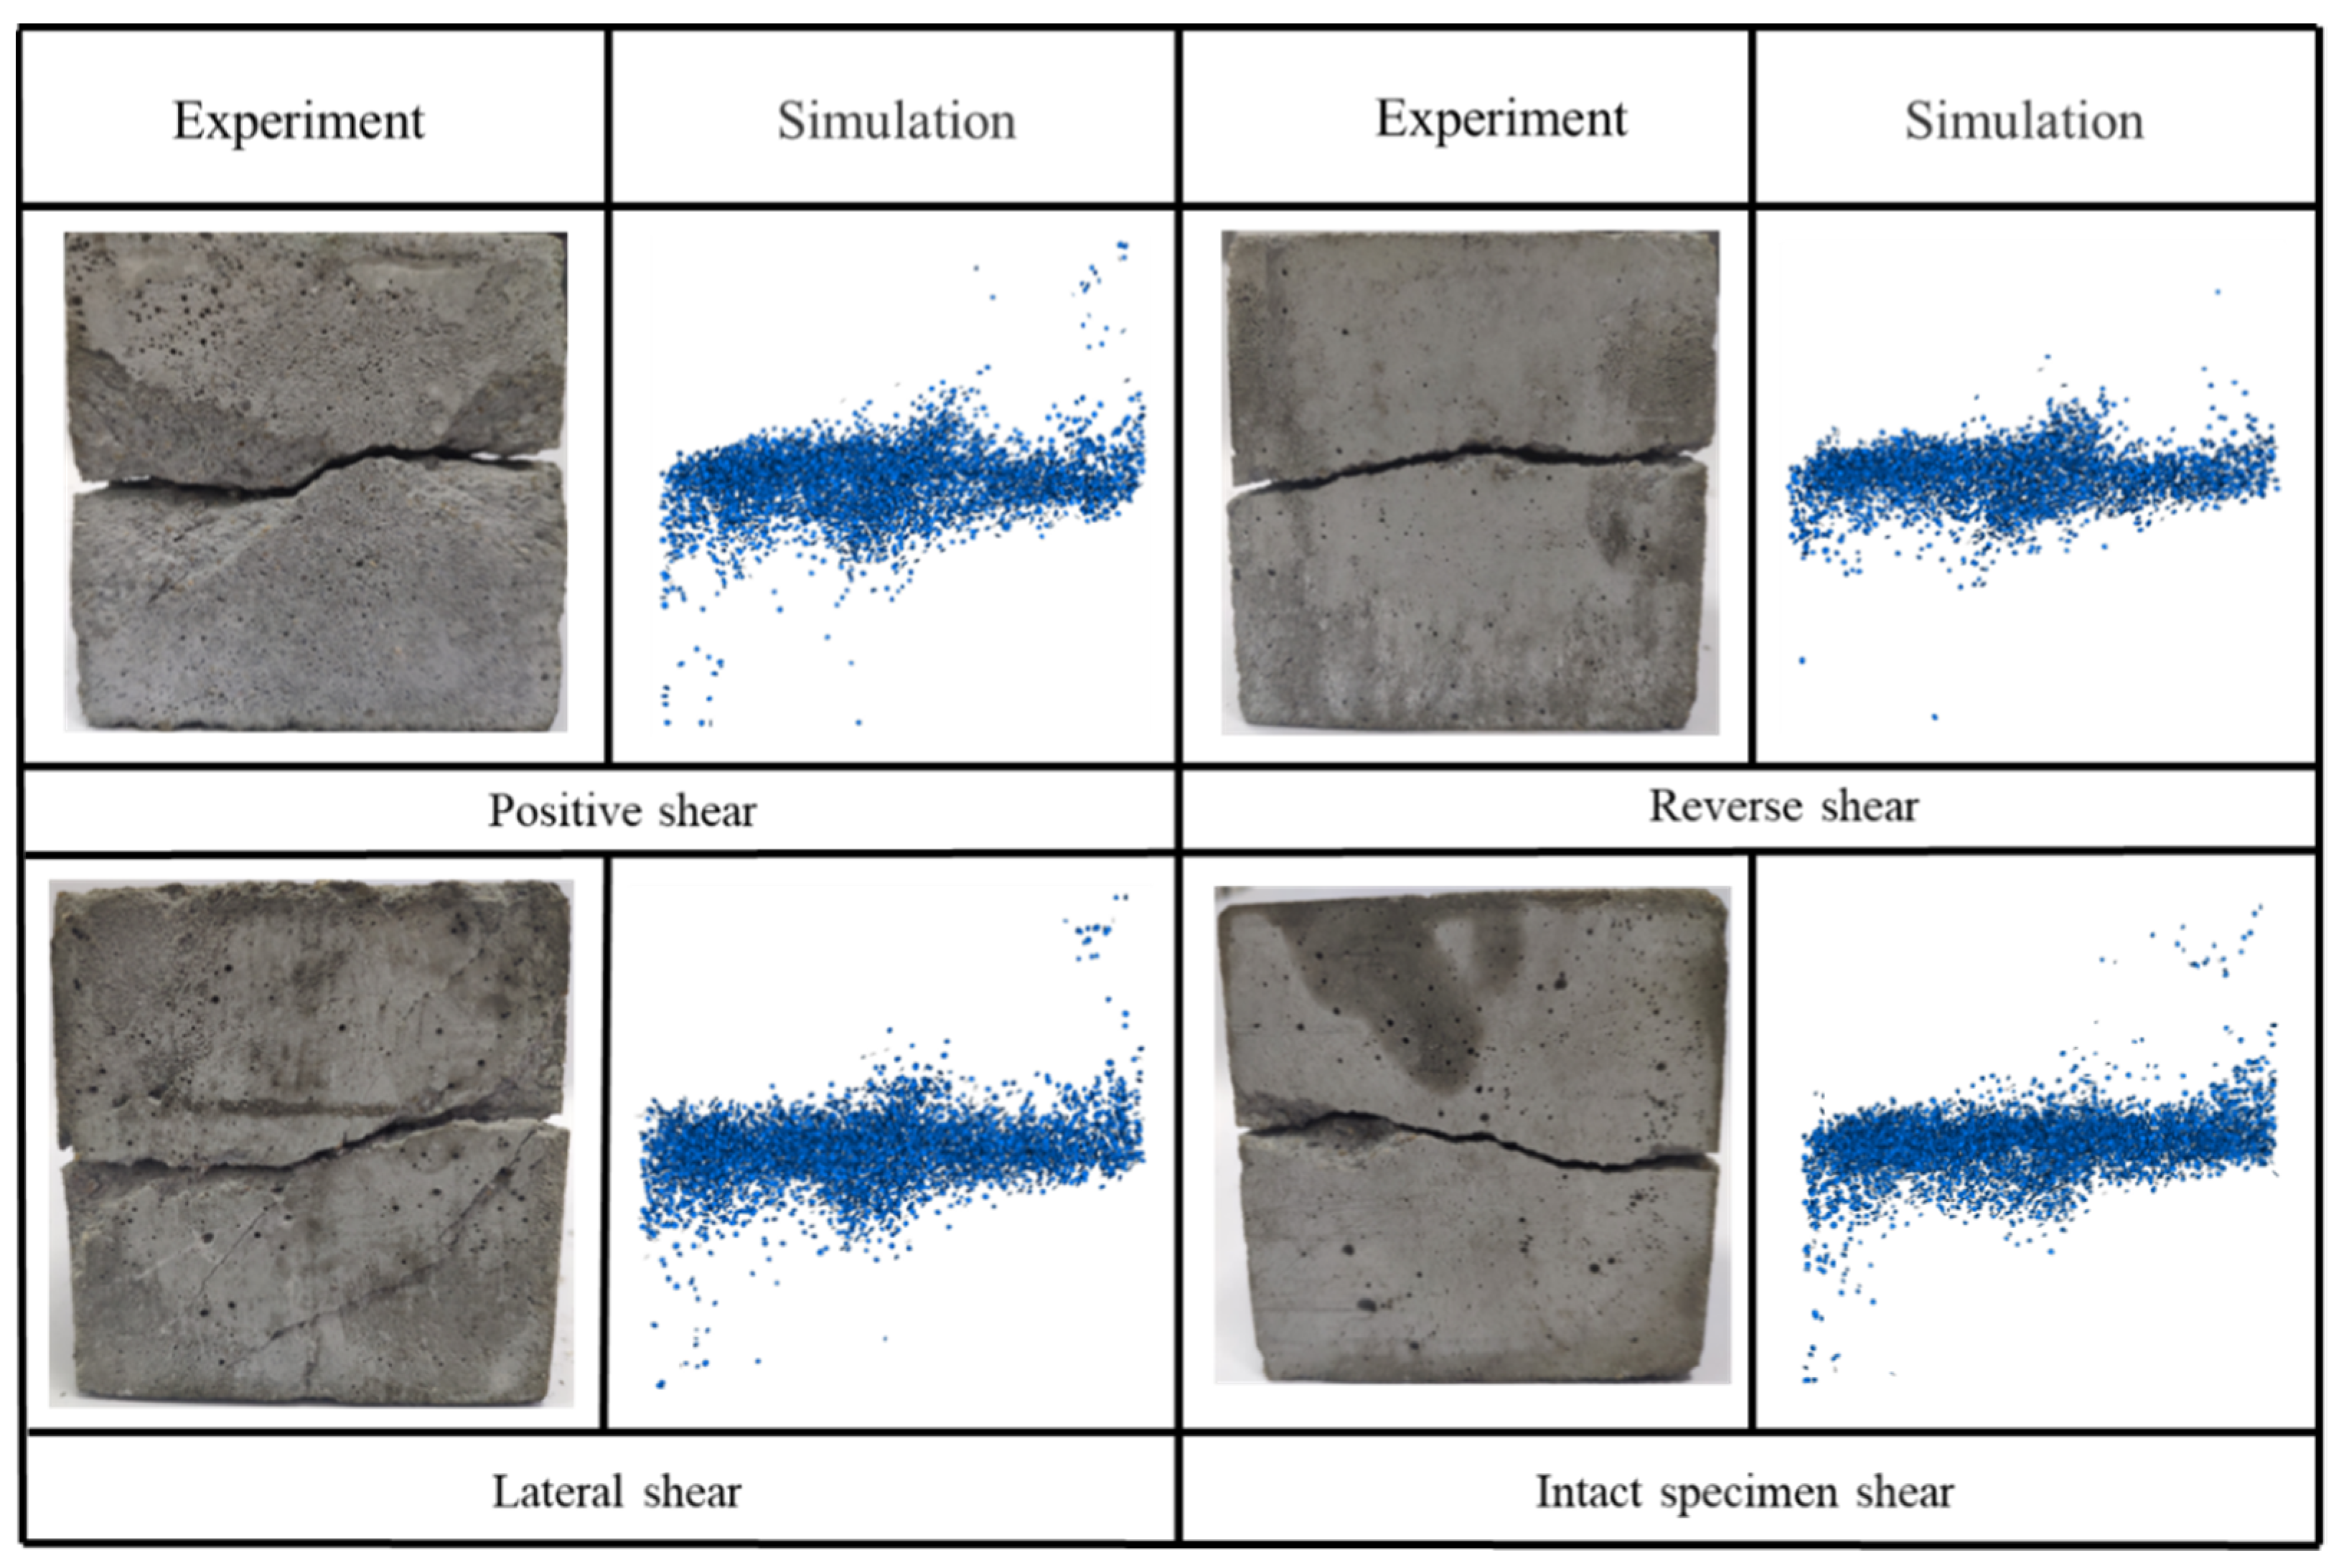
4.3. Verification of Model Results
4.4. Analysis of Numerical Simulation Results
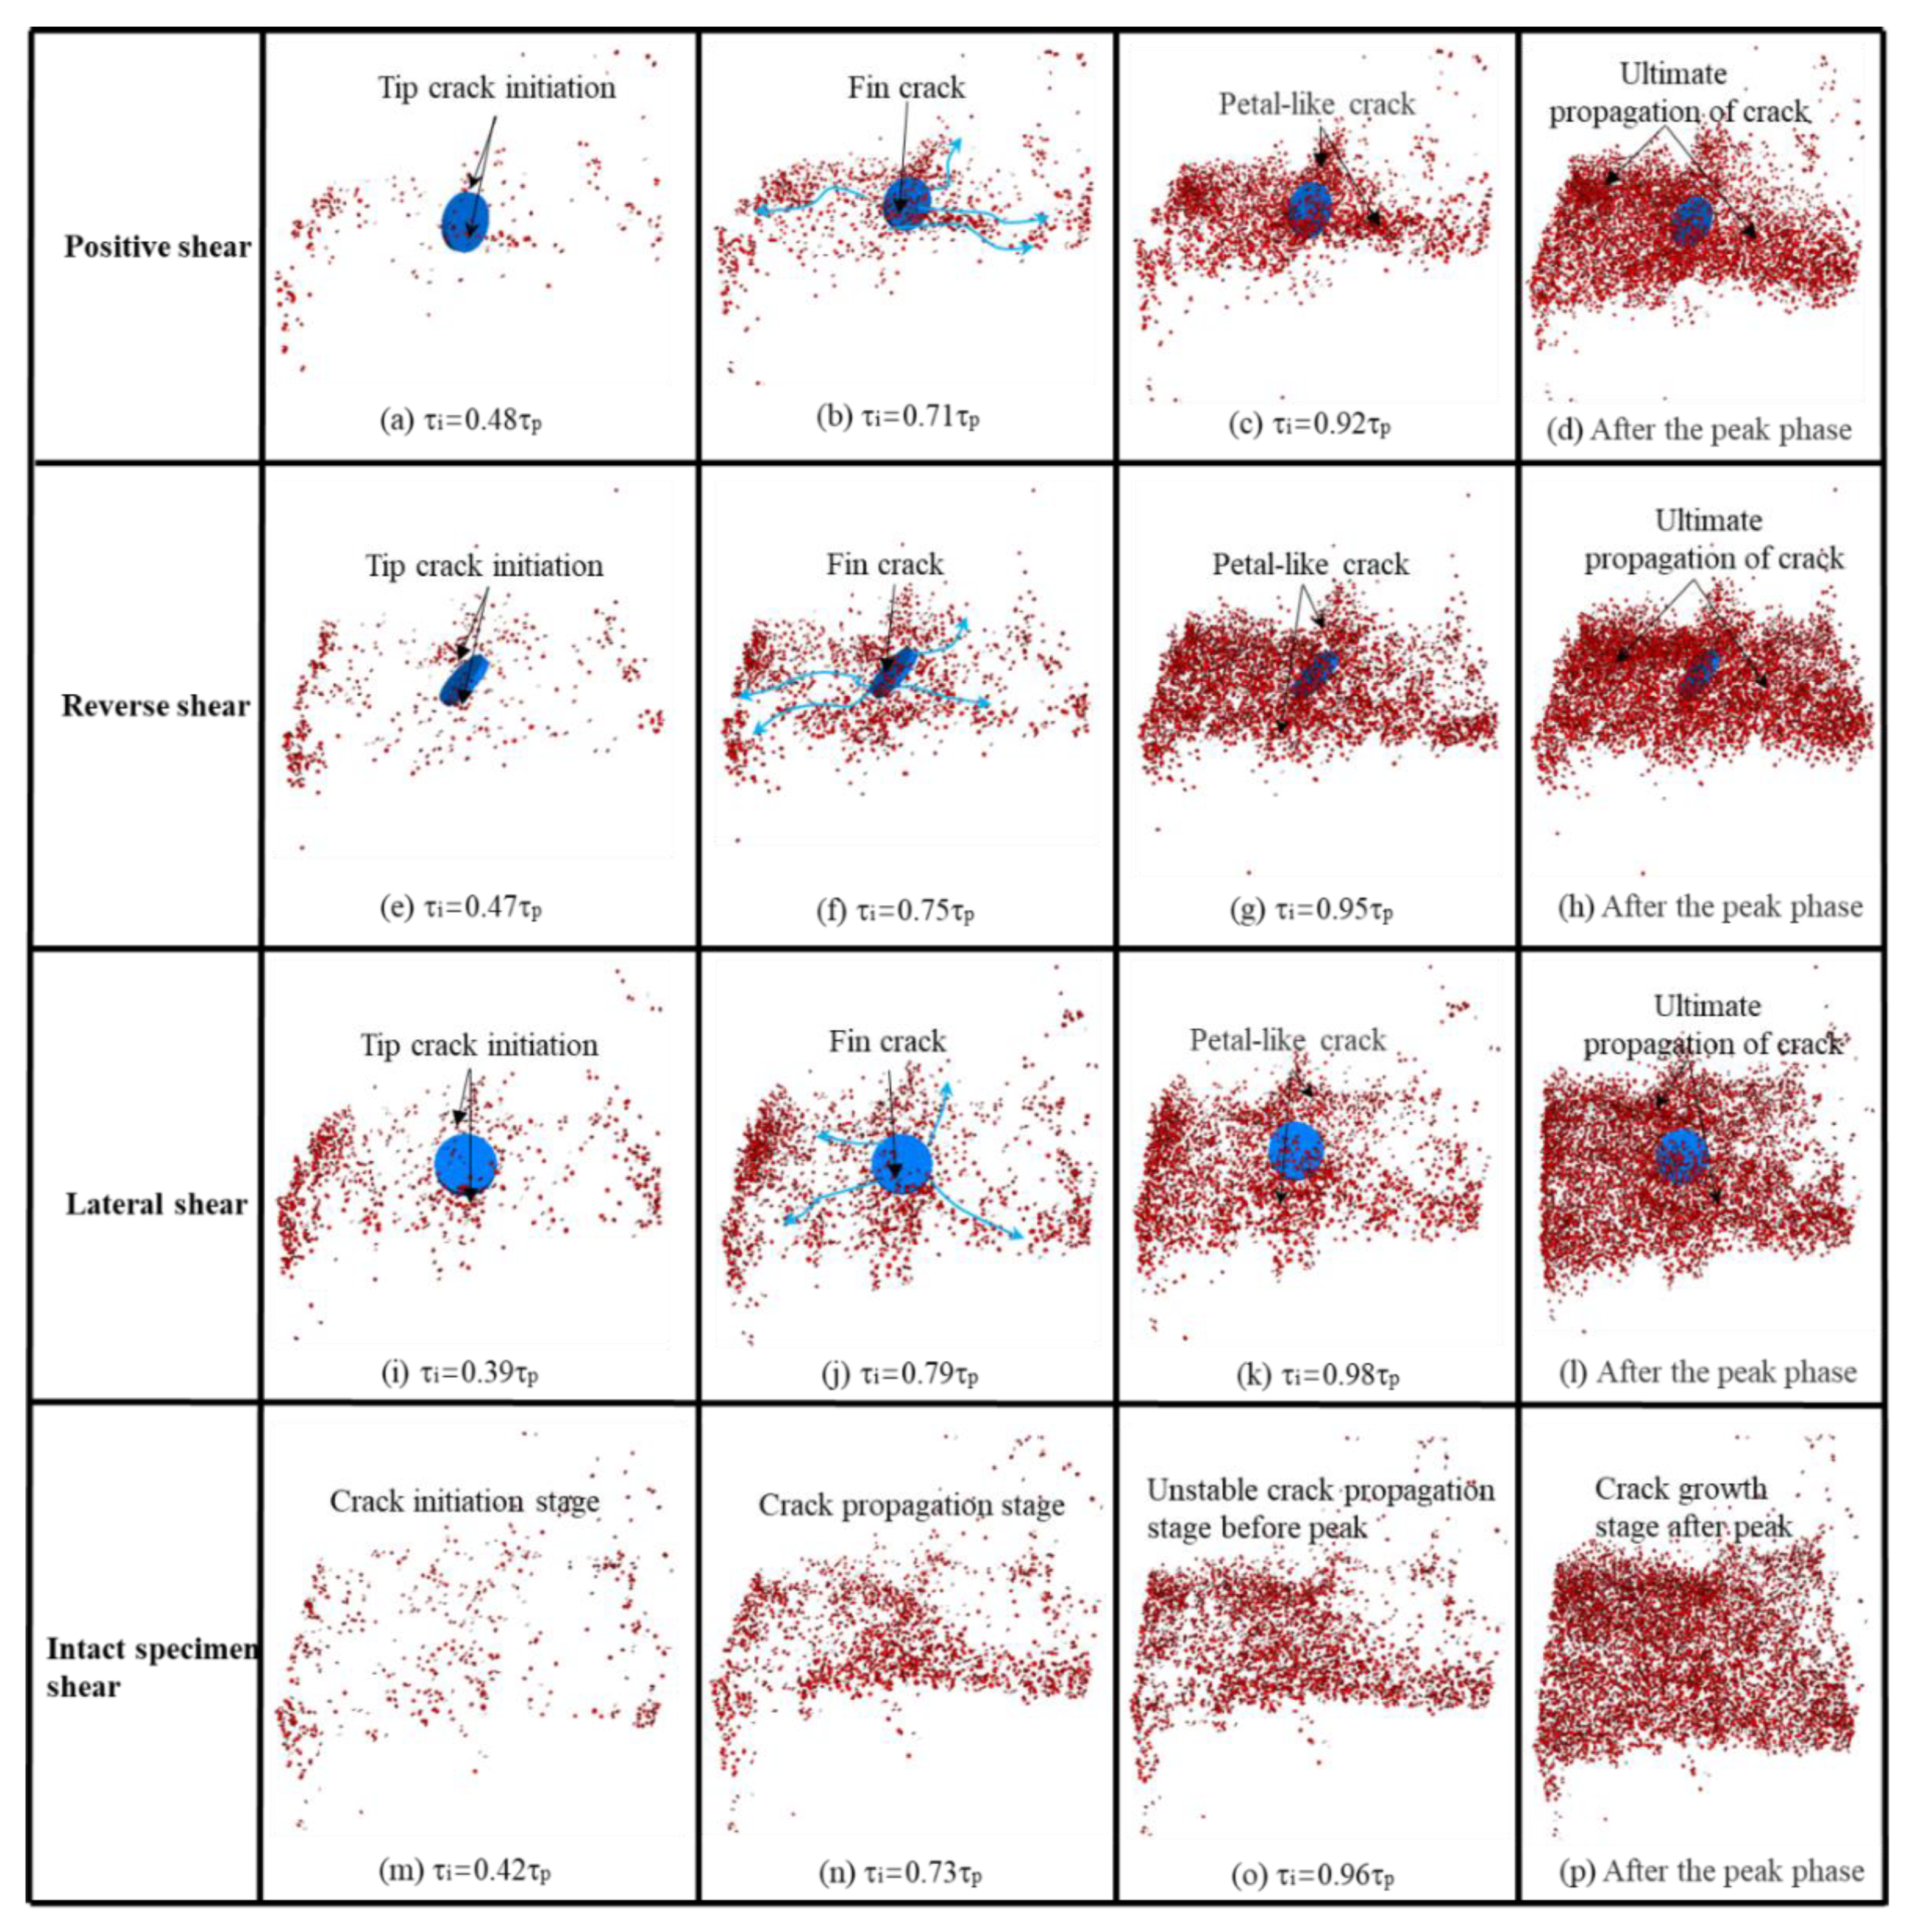
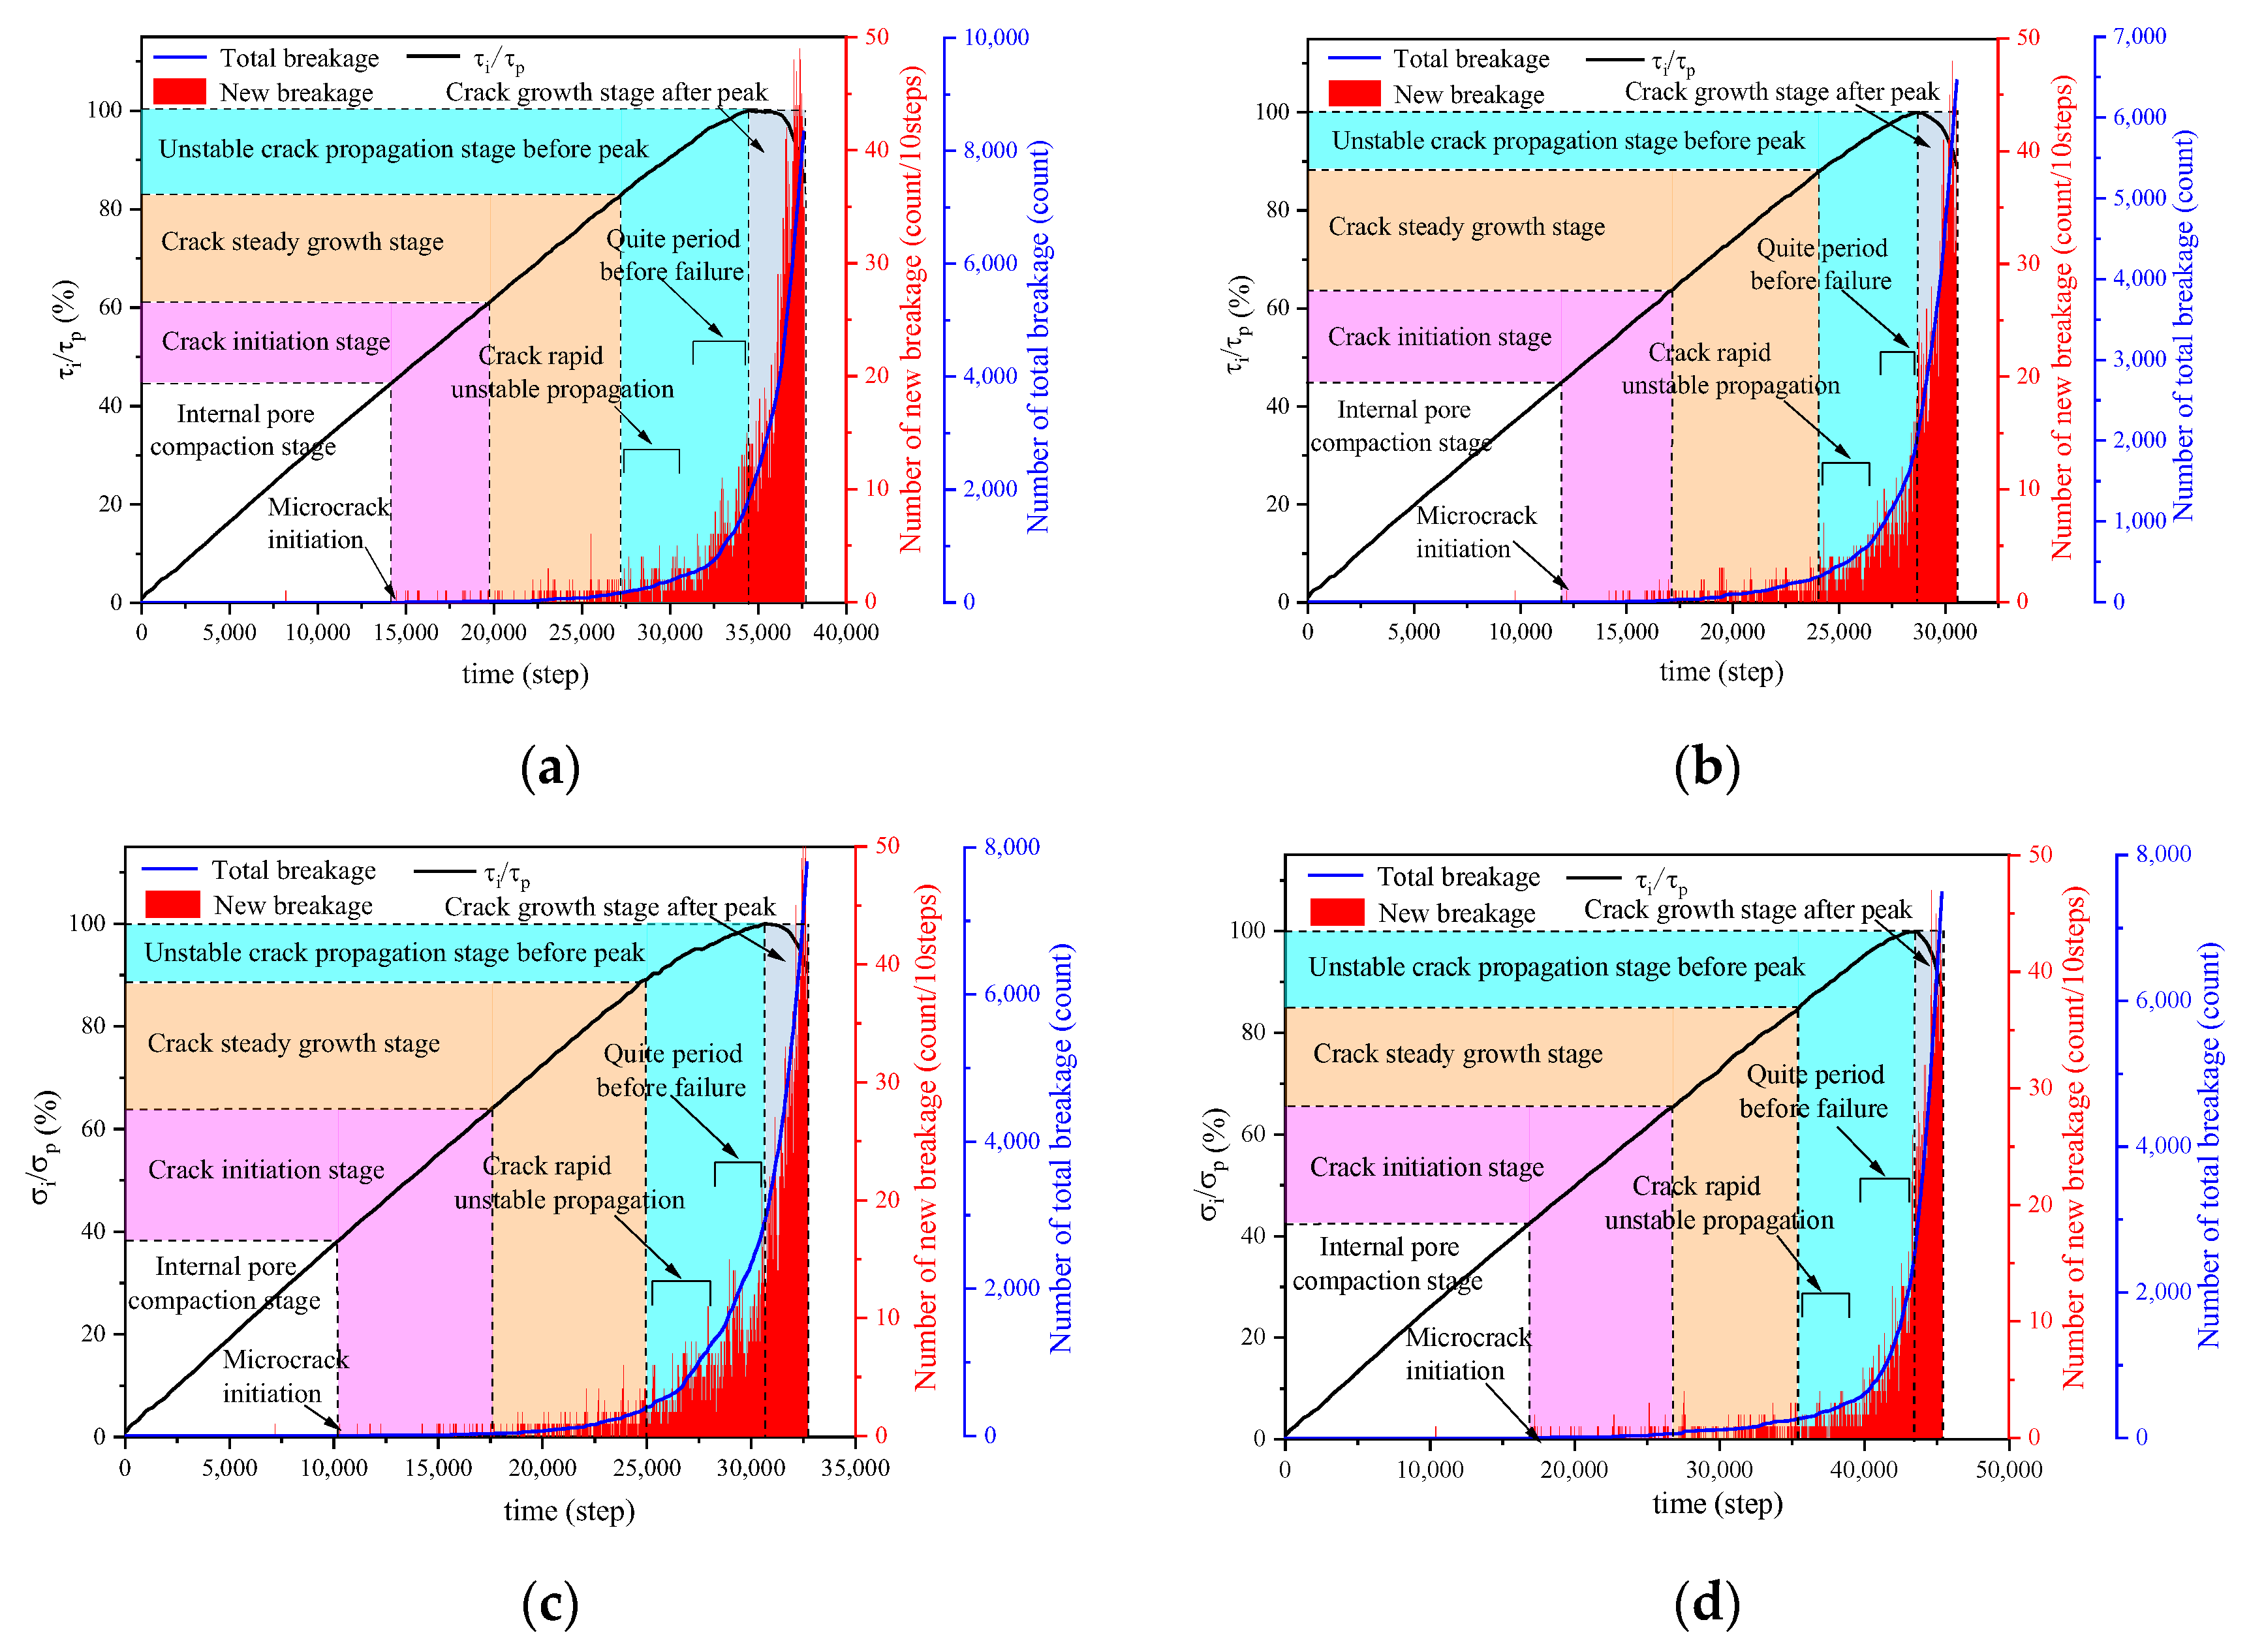
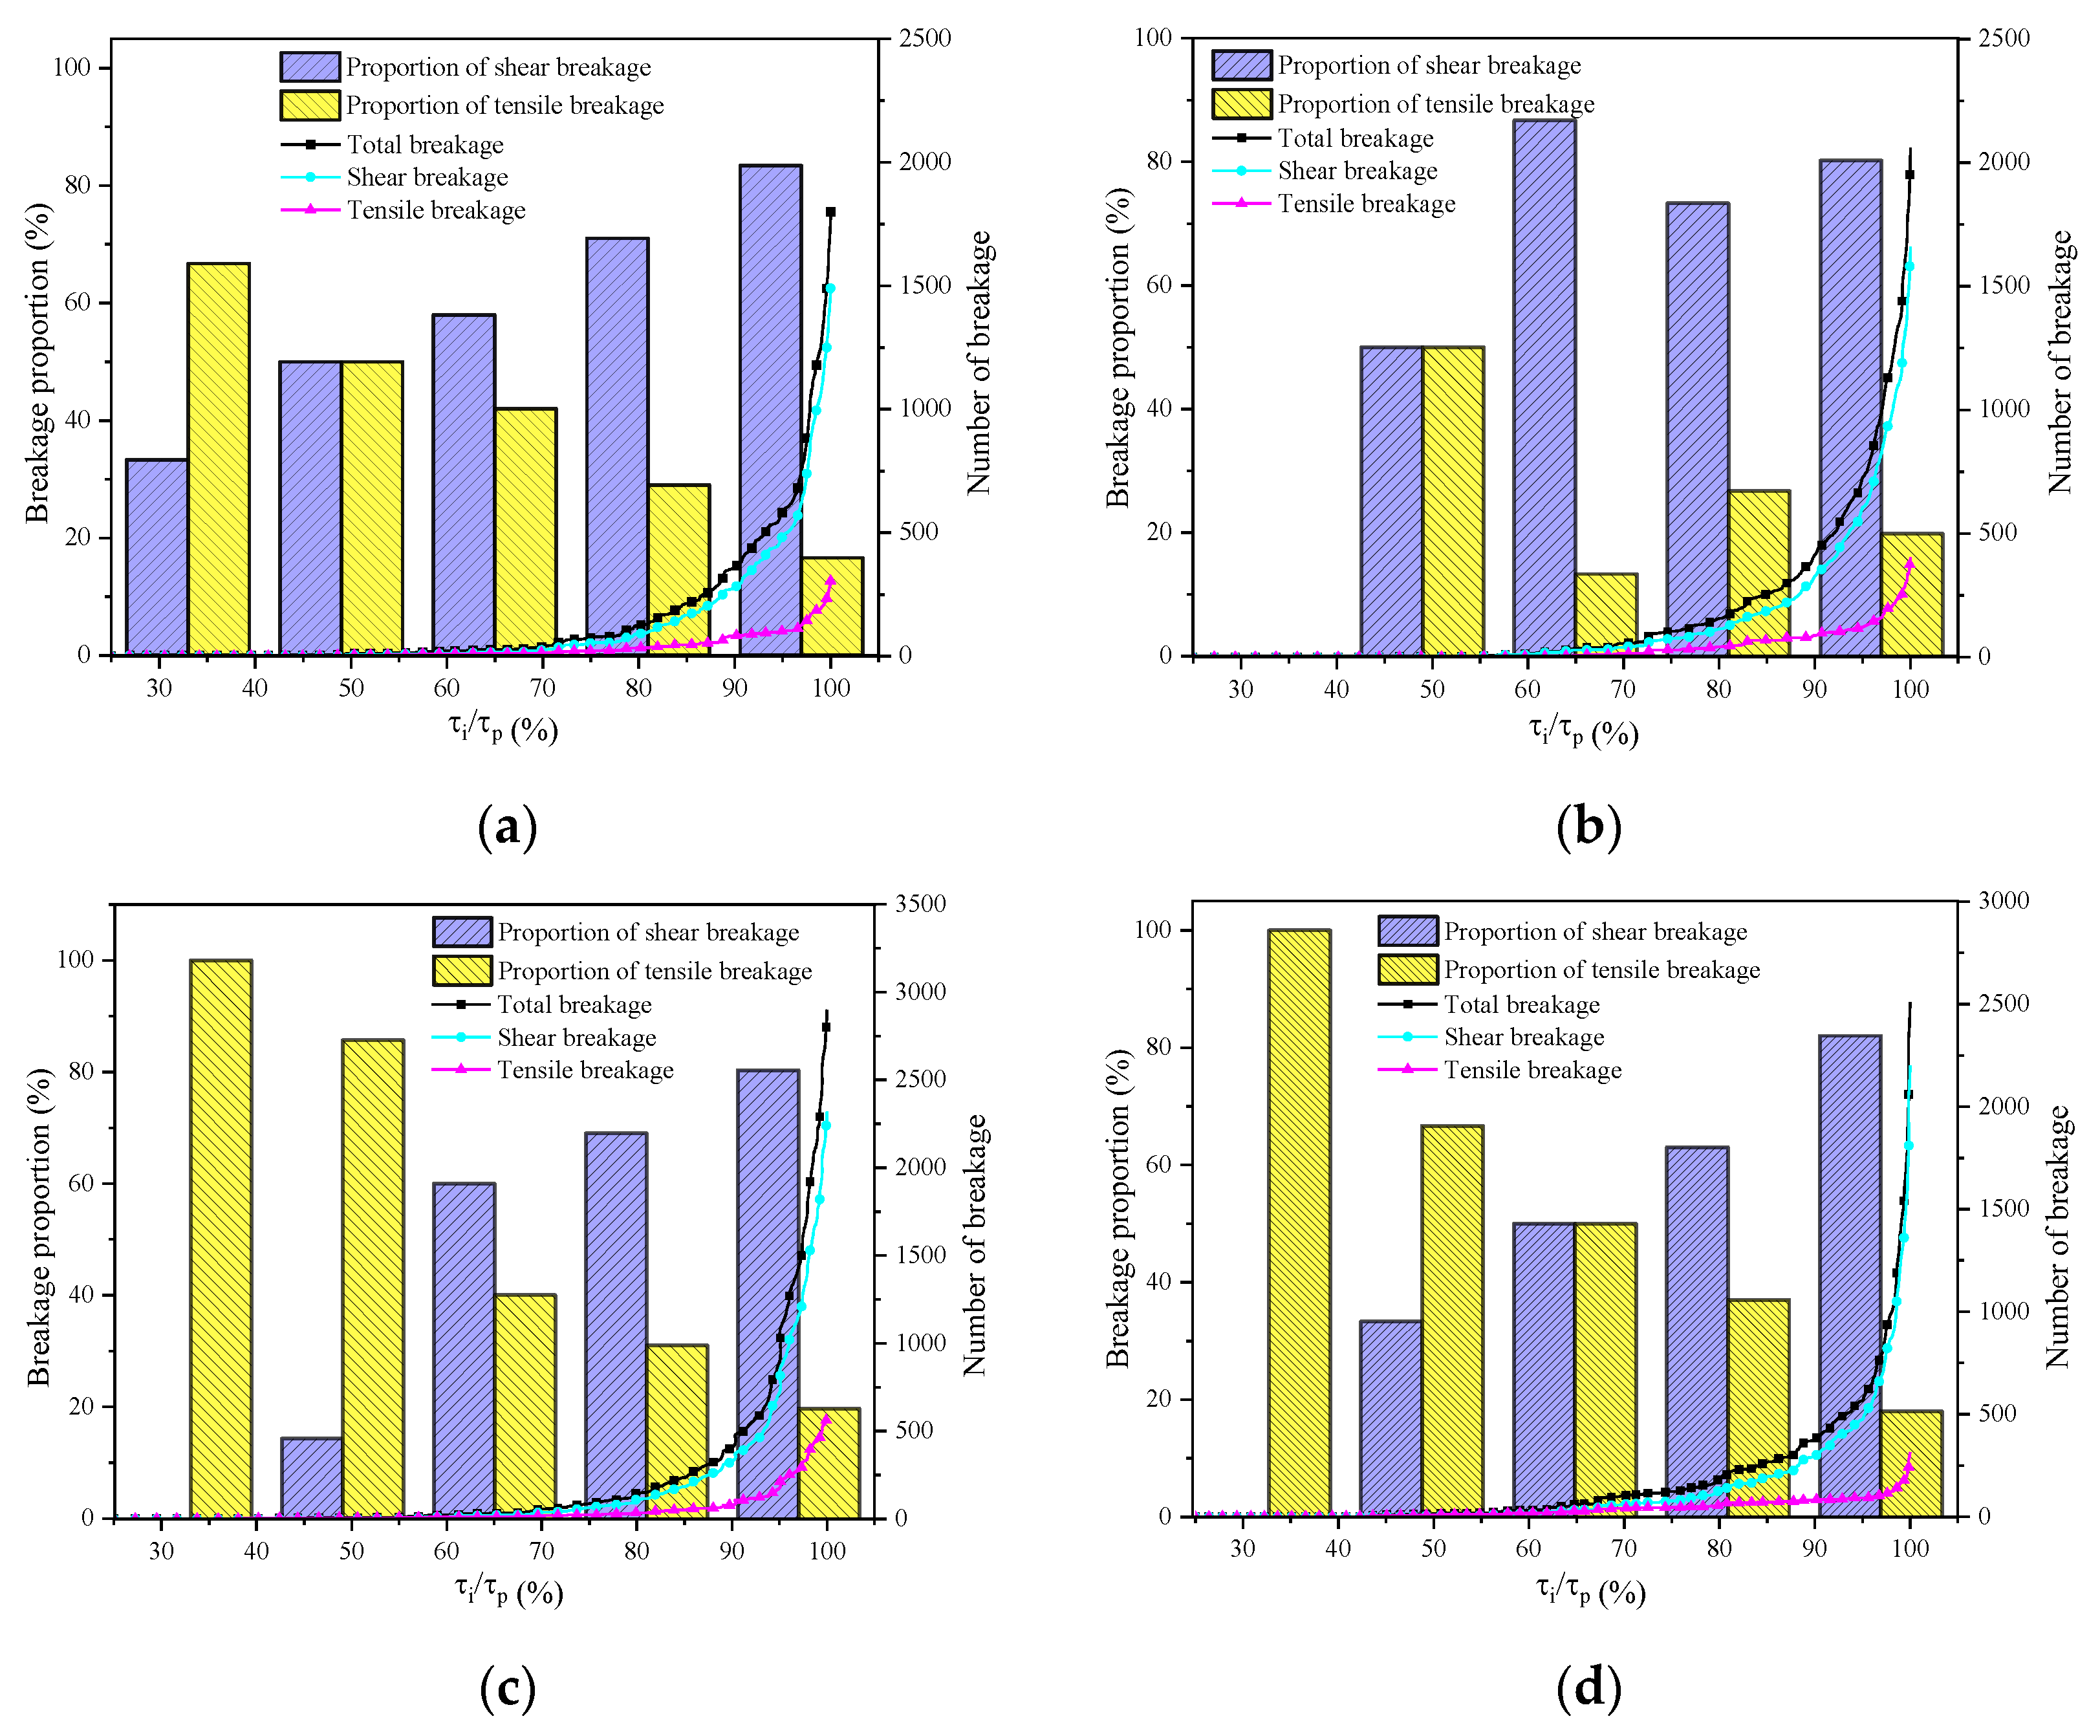
4.4.1. Crack Propagation Process
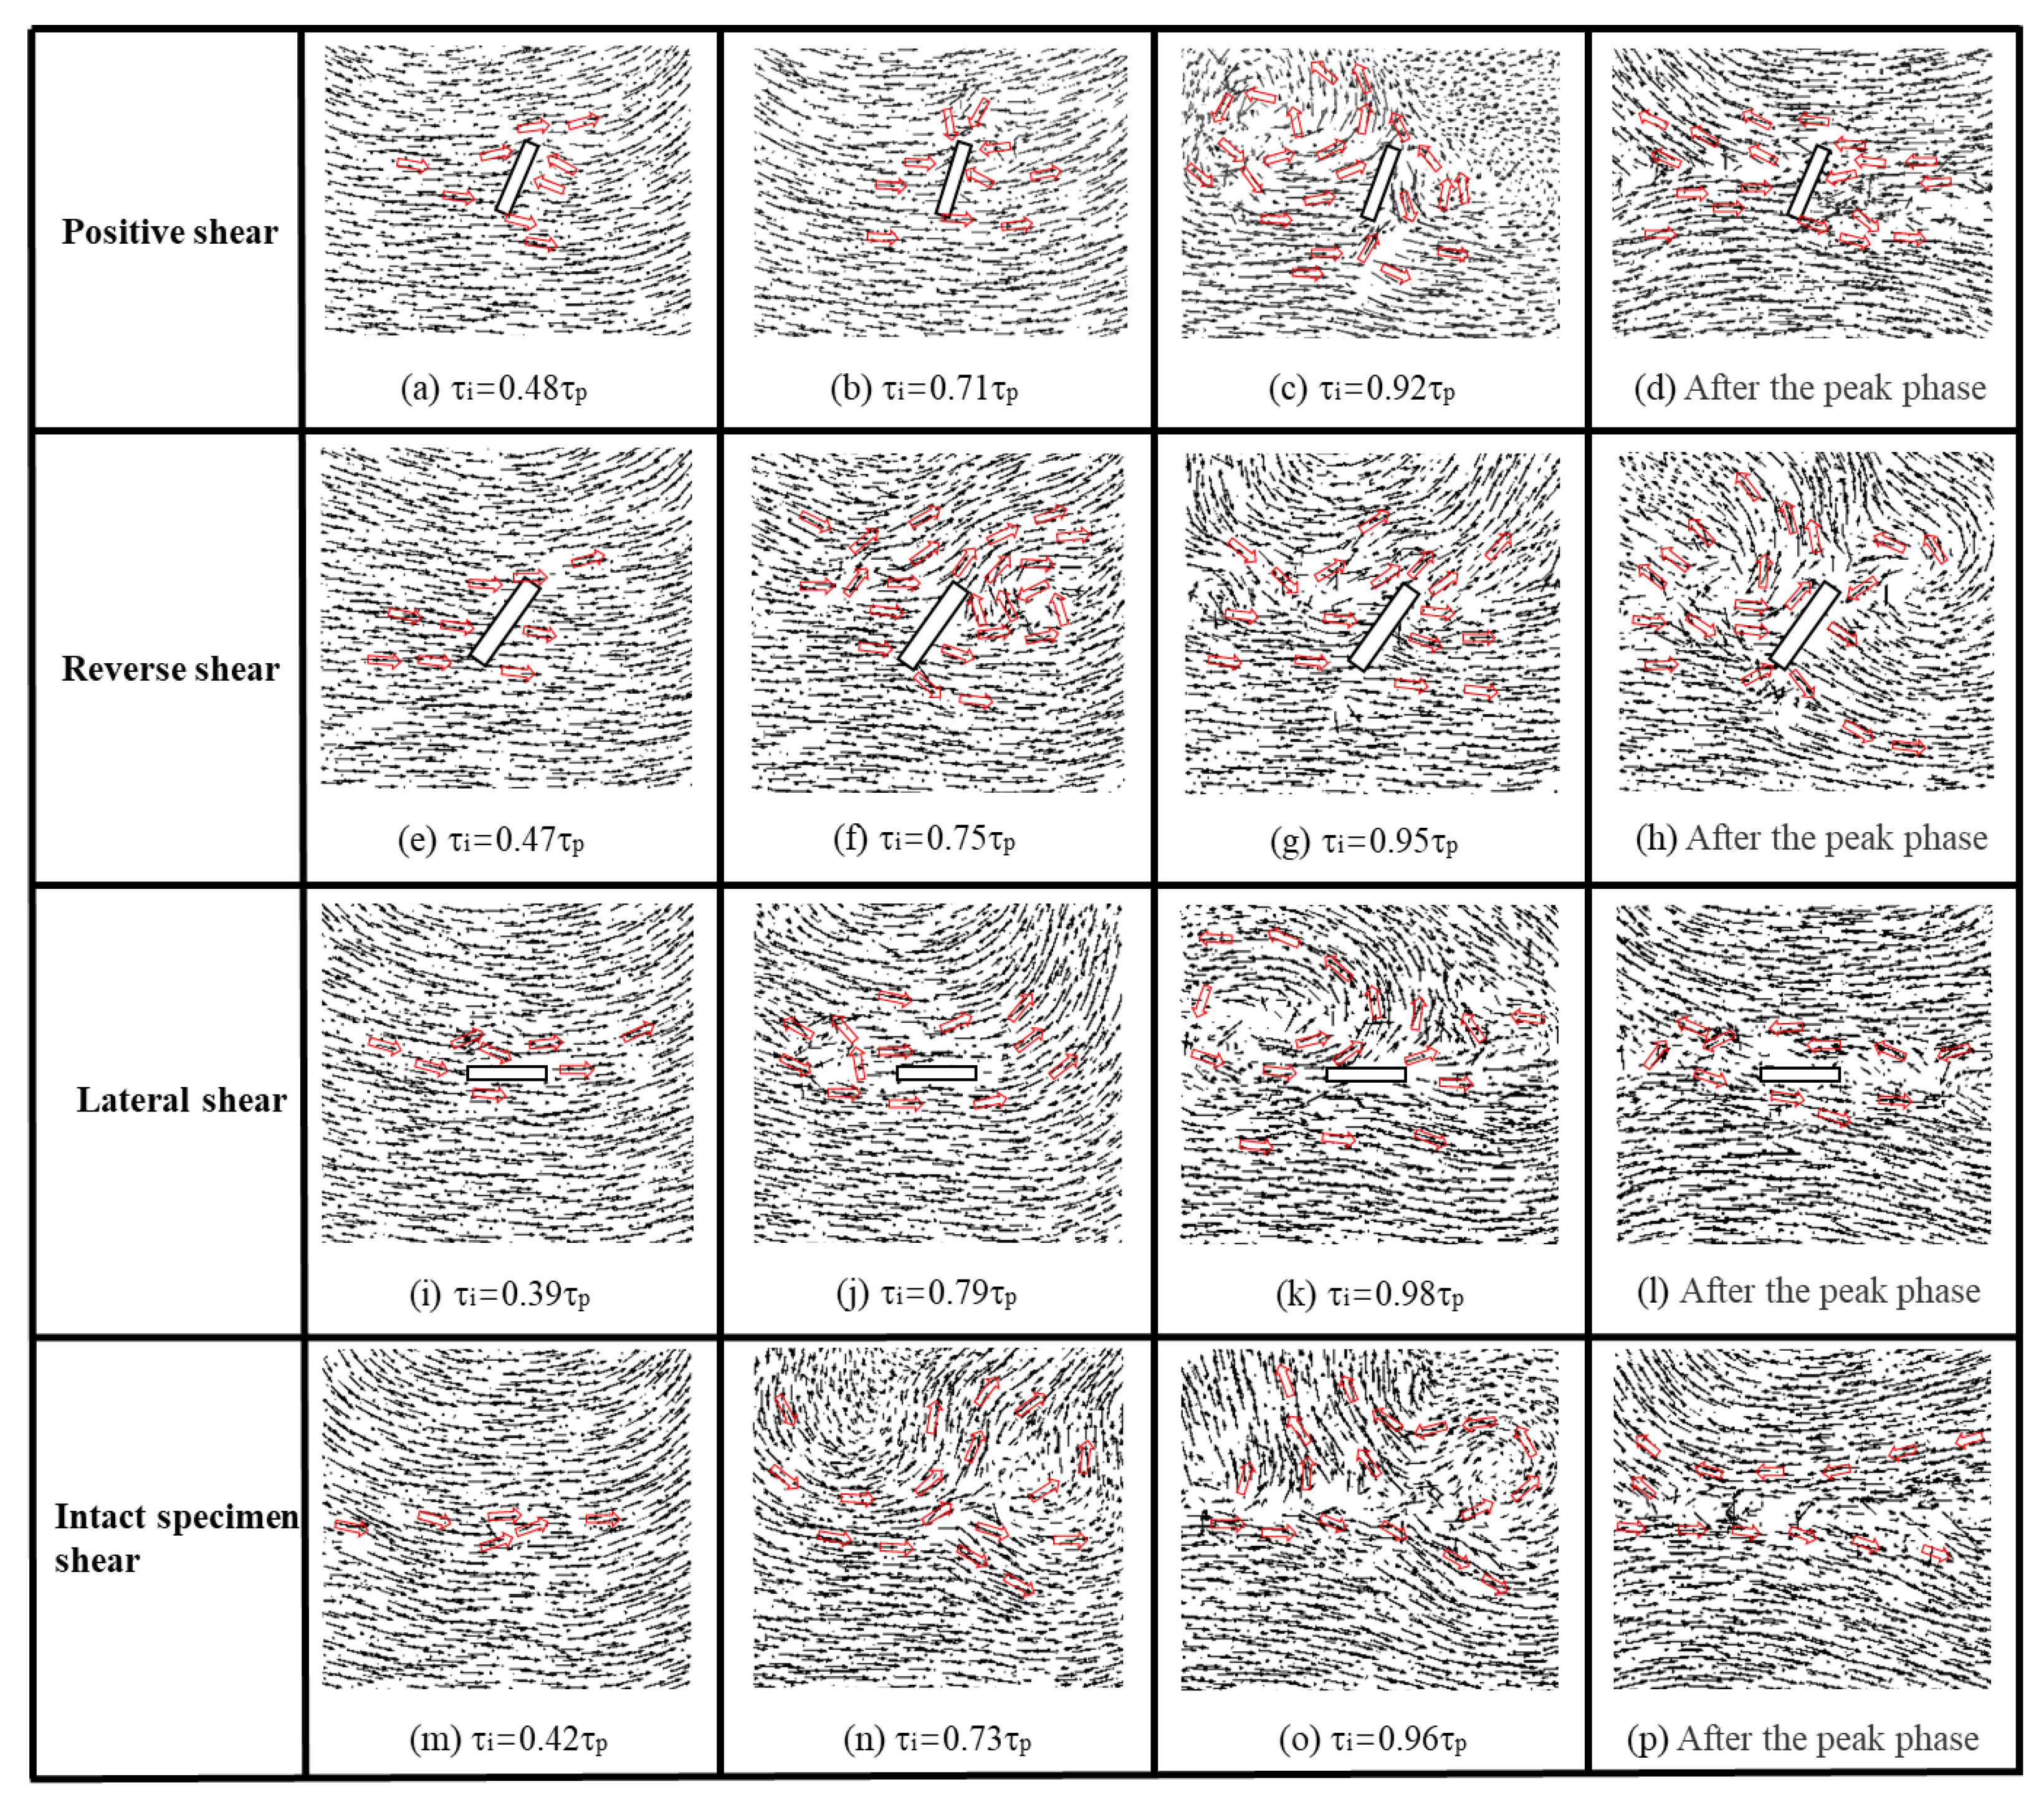
4.4.2. Displacement Field Analysis
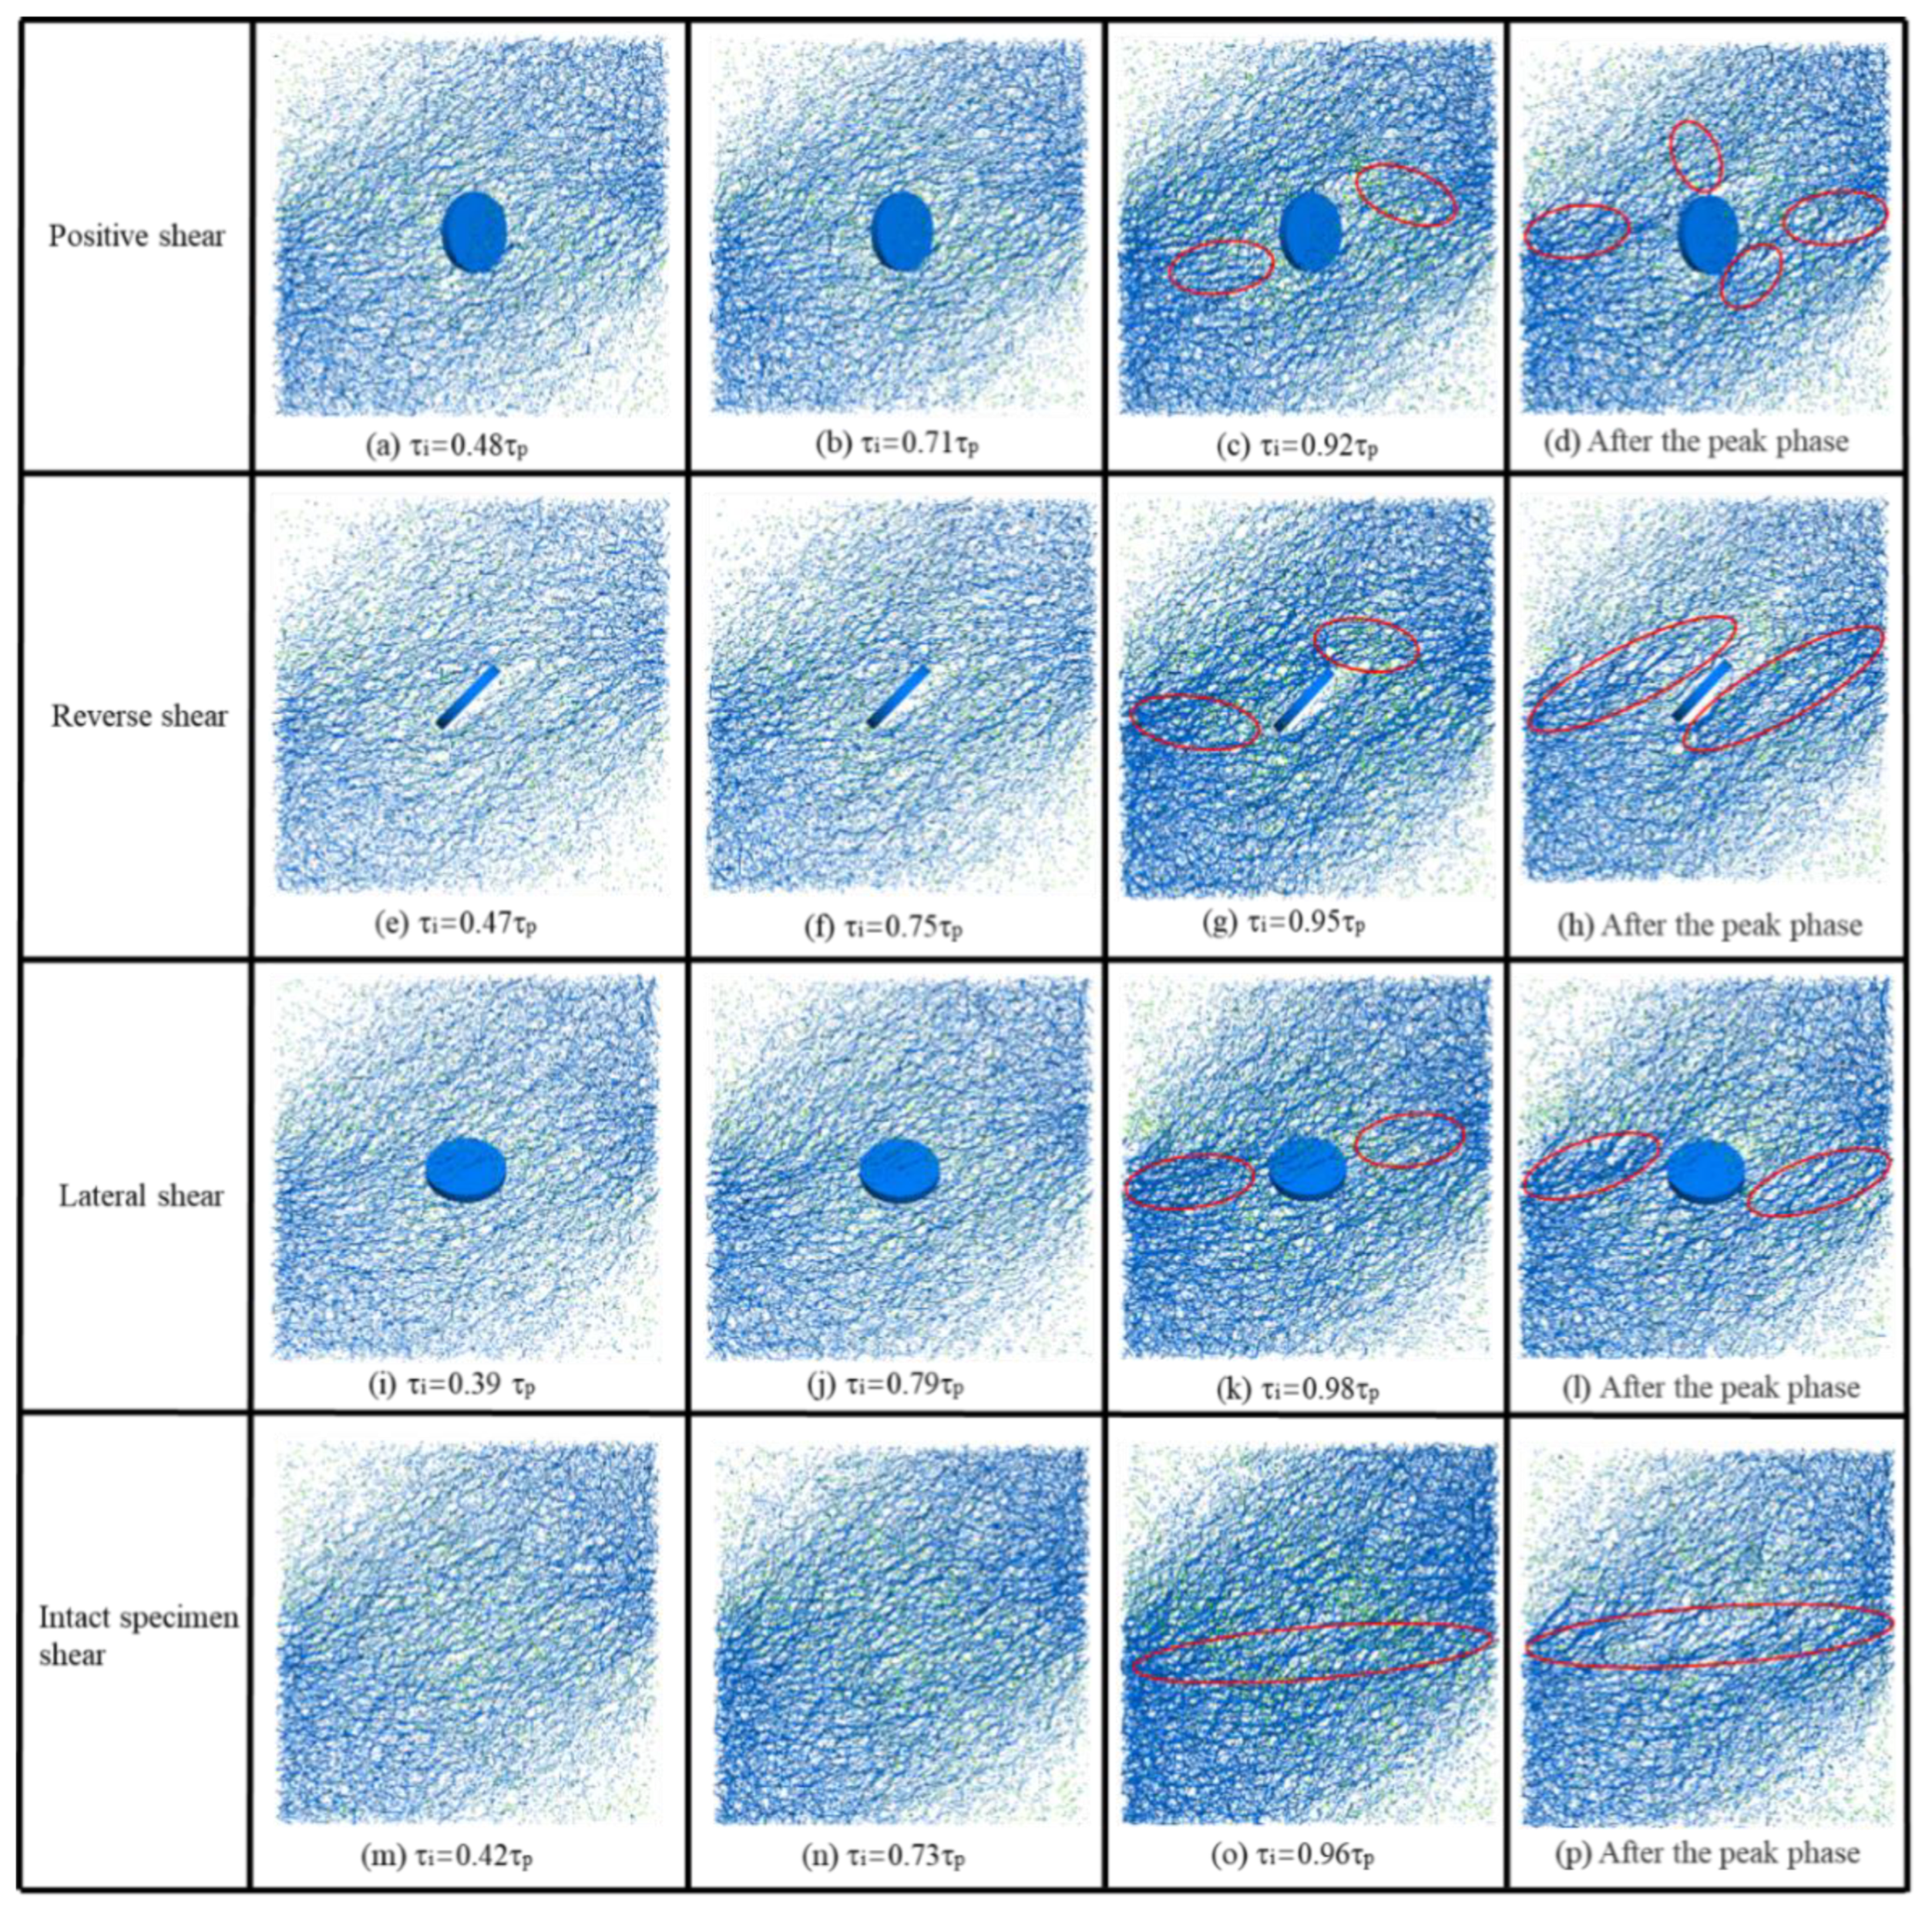
4.4.3. Contact Force Chain Analysis
4.4.4. Failure Mode
5. Conclusions
Author Contributions
Funding
Institutional Review Board Statement
Informed Consent Statement
Data Availability Statement
Conflicts of Interest
References
- Scavia, C. Fracture mechanics approach to stability analysis of rock slopes. Eng. Fract. Mech. 1990, 35, 899–910. [Google Scholar] [CrossRef]
- Brideau, M.A.; Yan, M.; Stead, D. The role of tectonic damage and brittle rock fracture in the development of large rock slope failures. Geomorphology 2009, 49, 103–130. [Google Scholar] [CrossRef]
- Zhao, Y.L.; Liu, Q.; Zhang, C.; Liao, J.; Lin, H.; Wang, Y. Coupled seepage-damage effect in fractured rock masses: Model development and a case study. Int. J. Rock Mech. Min. Sci. 2021, 144, 104822. [Google Scholar] [CrossRef]
- Yu, G.D.; Hu, Q.; Feng, X.W.; Meng, G.Y.; Nie, Y.F. Research on Drilling Rate Optimization of a UCS Identification System While Drilling for Coal Mine Roadway Roofs. Machines 2021, 9, 242. [Google Scholar] [CrossRef]
- Lian, S.L.; Li, J.S.; Gan, F.; Bi, J.; Wang, C.L.; Zheng, K. Investigation of the Shear Mechanical Behavior of Sandstone with Unloading Normal Stress after Freezing–Thawing Cycles. Machines 2021, 9, 339. [Google Scholar] [CrossRef]
- Zhao, Y.L.; Zhang, C.S.; Wang, Y.X.; Lin, H. Shear-related roughness classification and strength model of natural rock joint based on fuzzy comprehensive evaluation. Int. J. Rock Mech. Min. Sci. 2021, 137, 104550. [Google Scholar] [CrossRef]
- Huang, D.; Zhong, Z.; Gu, D.M. Experimental investigation on the failure mechanism of a rock landslide controlled by a steep-gentle discontinuity pair. J. Mt. Sci. 2019, 16, 1258–1274. [Google Scholar] [CrossRef]
- Zhang, S.; Xu, J.H.; Chen, L.; Zhang, M.W.; Sasaoka, T.; Shimada, H.; He, H.Y. Numerical Investigation of Influence of Fluid Rate, Fluid Viscosity, Perforation Angle and NF on HF Re-Orientation in Heterogeneous Rocks Using UDEC T-W Method. Machines 2022, 10, 152. [Google Scholar] [CrossRef]
- Feng, Y.J.; Su, H.J.; Nie, Y.J.; Zhao, H.H. Role of Cyclic Thermal Shocks on the Physical and Mechanical Responses of White Marble. Machines 2022, 10, 58. [Google Scholar] [CrossRef]
- Zhao, Y.; Bi, J.; Wang, C.L.; Liu, P.F. Effect of unloading rate on the mechanical behavior and fracture characteristics of sandstones under complex triaxial stress conditions. Rock Mech. Rock Eng. 2021, 54, 4851–4866. [Google Scholar] [CrossRef]
- Zhao, Y.; Ding, D.; Bi, J.; Wang, C.L.; Liu, P.F. Experimental study on mechanical properties of precast cracked concrete under different cooling methods. Constr. Build. Mater. 2021, 301, 124–141. [Google Scholar] [CrossRef]
- Yang, H.; Lin, H.; Chen, Y.; Wang, Y. Influence of wing crack propagation on the failure process and strength of fractured specimens. Bull. Eng. Geol. Environ. 2022, 81, 71. [Google Scholar] [CrossRef]
- Zhao, Y.; He, P.F.; Zhang, Y.F.; Wang, C.L. A new criterion for a toughness-dominated hydraulic fracture crossing a natural frictional interface. Rock Mech. Rock Eng. 2019, 52, 2617–2629. [Google Scholar] [CrossRef]
- Zhao, Y.; Wang, C.L.; Bi, J. Analysis of fractured rock permeability evolution under unloading conditions by the model of elastoplastic contact between rough surfaces. Rock Mech. Rock Eng. 2020, 12, 5795–5808. [Google Scholar] [CrossRef]
- Prudencio, M.; Van Sint Jan, M. Strength and failure modes of rock mass models with non-persistent joints. Int. J. Rock Mech. Min. Sci. 2007, 44, 890–902. [Google Scholar] [CrossRef]
- Asadizadeh, M.; Hossaini, M.F.; Moosavi, M.; Masoumi, H.; Ranjith, P.G. Mechanical characterization of jointed rock-like material with non-persistent rough joints subjected to uniaxial compression. Eng. Geol. 2019, 260, 105224. [Google Scholar] [CrossRef]
- Meng, F.Z.; Wong, L.N.Y.; Zhou, H.; Wang, Z.Q. Comparative study on dynamic shear behavior and failure mechanism of two types of granite joint. Eng Geol. 2018, 245, 356–369. [Google Scholar] [CrossRef]
- Zhuang, X.; Chun, J.; Zhu, H. A comparative study on unfilled and filled crack propagation for rock-like brittle material. Theor. Appl. Fract. Mech. 2014, 72, 110–120. [Google Scholar] [CrossRef]
- Yin, P.; Wong, R.H.C.; Chau, K.T. Coalescence of two parallel pre-existing surface cracks in granite. Int. J. Rock Mech. Min. Sci. 2014, 68, 66–84. [Google Scholar] [CrossRef]
- Liu, J.H.; Zhao, Y.L.; Tan, T.; Zhang, L.Y.; Zhu, S.T.; Xu, Y.F. Evolution and modeling of mine water inflow and hazard characteristics in southern coalfields of China: A case of Meitanba mine. Int. J. Min. Sci. Technol. 2022. [Google Scholar] [CrossRef]
- Adams, M.; Sines, G. Crack extension from flaws in a brittle material subjected to compression. Tectonophysics 1978, 49, 97–118. [Google Scholar] [CrossRef]
- Wong, R.H.C.; Lin, P. Numerical study of stress distribution and crack coalescence mechanisms of a solid containing multiple holes. Int. J. Rock Mech. Min. Sci. 2015, 79, 41–54. [Google Scholar] [CrossRef]
- Zhao, Y.; Wang, C.L.; Ning, L.; Zhao, H.F.; Bi, J. Pore and fracture development in coal under stress conditions based on nuclear magnetic resonance and fractal theory. Fuel. 2022, 309, 122112. [Google Scholar] [CrossRef]
- Lin, H.; Lei, D.; Zhang, C.; Wang, Y. Deterioration of non-persistent rock joints: A focus on impact of freeze-thaw cycles. Int. J. Rock Mech. Min. Sci. 2020, 135, 104515. [Google Scholar] [CrossRef]
- Tang, Y.; Hang Lin, H.; Wang, Y. Rock slope stability analysis considering the effect of locked section. Bull. Eng. Geol. Environ. 2021, 80, 7241–7251. [Google Scholar] [CrossRef]
- Zhao, Y.L.; Zhang, L.Y.; Wang, W.J.; Tang, J.Z.; Lin, H.; Wan, W. Transient pulse test and morphological analysis of single rock fractures. Int. J. Rock Mech. Min. Sci. 2017, 91, 139–154. [Google Scholar] [CrossRef]
- Zhou, X.P.; Zhang, J.Z.; Wong, L.N.Y. Experimental study on the growth, coalescence and wrapping behavior of 3D cross-embedded flaws under uniaxial compression. Rock Mech. Rock Eng. 2018, 51, 1379–1400. [Google Scholar] [CrossRef]
- Zhao, Y.L.; Wang, Y.Z.; Wang, W.J.; Wan, W.; Tang, J.Z. Modeling of non-linear rheological behavior of hard rock using triaxial rheological experiment. Int. J. Rock Mech. Min. Sci. 2017, 93, 66–75. [Google Scholar] [CrossRef]
- Cao, P.; Liu, T.; Pu, C.; Lin, H. Crack propagation and coalescence of brittle rock-like specimens with pre-existing cracks in compression. Eng Geol. 2015, 187, 113–121. [Google Scholar] [CrossRef]
- Zhao, Y.L.; Zhang, L.Y.; Wang, W.J.; Wan, W.; Li, S.Q.; Ma, W.H.; Wang, Y.X. Creep behavior of intact and cracked limestone under multi-level loading and unloading cycles. Rock Mech. Rock Eng. 2017, 50, 1409–1424. [Google Scholar] [CrossRef]
- Zhao, Y.; Zheng, K.; Wang, C.L.; Bi, J.; Zhang, H. Investigation on model-I fracture toughness of sandstone with the structure of typical bedding inclination angles subjected to three-point bending. Theor. Appl. Fract. Mech. 2022, 119, 103327. [Google Scholar] [CrossRef]
- Liu, Q.; Zhao, Y.L.; Tang, L.M.; Liao, J.; Wang, X.G.; Tao, T.; Chang, L.; Luo, S.L.; Wang, M. Mechanical characteristics of single cracked limestone in compression-shear fracture under hydro-mechanical coupling. Theor. Appl. Fract. Mech. 2022, 119, 103371. [Google Scholar] [CrossRef]
- Zhao, Y.L.; Liu, Q.; Lian, L.; Wang, Y.X.; Tang, L.M. Theoretical and numerical models of rock wing crack subjected to hydraulic pressure and far-field stresses. Arab. J. Geosci. 2020, 13, 926. [Google Scholar] [CrossRef]
- Zhao, Y.L.; Lian, L.; Wang, Y.X.; Liu, Q.; Lin, H.; Chang, L. Crack coalescence patterns and local strain behaviors near flaw tip for rock-like material containing two flaws subjected to biaxial compression. Arab. J. Geosci. 2020, 13, 1251. [Google Scholar] [CrossRef]
- Zhao, Y.; Teng, M.Y.; Bi, J.; Wang, C.L. Experimental study on the shear mechanical behaviour of rock-like materials containing one embedded flaw under unloading normal stress conditions. Eur. J. Environ. Civ. Eng. 2022. [Google Scholar] [CrossRef]
- Dyskin, A.V.; Jewell, R.J.; Joer, H.; Sahouryeh, E.; Ustinov, K.B. Experiments on 3D crack growth in uniaxial compression. Int. J. Fract. 1994, 65, 77–83. [Google Scholar] [CrossRef]
- Dyskin, A.V.; Sahouryeh, E.; Jewell, R.J.; Joer, H.; Ustinov, K.B. Influence of shape and locations of initial 3D cracks on their growth in uniaxial compression. Eng. Fract. Mech. 2003, 70, 2115–2136. [Google Scholar] [CrossRef]
- Erdogan, F.; Sih, G.C. On the crack extension in plates under loading and transverse shear trans. ASME J. Basic Engr. 1963, 85, 519–527. [Google Scholar] [CrossRef]
- Wong, R.H.C.; Huang, M.L.; Jiao, M.R.; Tang, C.A.; Zhu, W.S. The mechanisms of crack propagation from surface 3-D fracture under uniaxial compression. Key Eng. Mater. 2004, 261–263, 219–224. [Google Scholar] [CrossRef]
- Guo, Y.S.H.; Wong, R.H.C.; Chau, K.T.; Wei, S.Z.; Shu, C.L. Crack growth mechanisms from 3-D surface flaw with varied dipping angle under uniaxial compression. Key Eng. Mater. 2007, 353, 2353–2356. [Google Scholar] [CrossRef]
- Knauss, W.G. Observations of crack propagation in anti-plane shear. Int. J. Fract. Mech. 1970, 6, 183–185. [Google Scholar] [CrossRef]
- Germanovich, L.N.; Salganik, R.L.; Dyskin, A.V.; Lee, K.K. Mechanism of brittle fracture of rocks with multiple pre-existing cracks in compression. Pure Appl. Geophys. 1994, 143, 117–149. [Google Scholar] [CrossRef]
- Germanovich, L.N.; Ring, L.M.; Carter, B.J.; Ingraffea, A.R.; Dyskin, A.V.; Ustinov, K.B. Simulation of crack growth and interaction in compression. In Proceedings of the Eighth International Conference on Rock Mechanics, Tokyo, Japan, 25–30 September 1995; Volume 1, pp. 219–226. [Google Scholar]
- Germanovich, L.N.; Carter, B.J.; Dyskin, A.V.; Ingraffea, A.R.; Lee, K.K. Mechanics of 3-D Crack Growth under Compressive Loads. In Proceedings of the Second North American Rock Mechanics Symposium: NARMS*96, Montreal, QC, Canada, 19–21 June 1996; pp. 1151–1160. [Google Scholar]
- Zhou, X.P.; Cheng, H.; Feng, Y.F. An experimental study of crack coalescence behavior in rock-like materials containing multiple flaws under uniaxial compression. Rock Mech. Rock Eng. 2014, 47, 1961–1986. [Google Scholar] [CrossRef]
- Zhao, Y.; Wang, C.L.; Teng, M.Y.; Bi, J. Observation on microstructure and shear behavior of mortar due to thermal shock. Cem. Concr. Compos. 2021, 121, 104106. [Google Scholar] [CrossRef]
- Dzienniak, D. The Influence of the Material Type and the Placement in the Print Chamber on the Roughness of MJF-Printed 3D Objects. Machines 2022, 10, 49. [Google Scholar] [CrossRef]
- Zhu, J.B.; Zhou, T.; Liao, Z.Y.; Sun, L.; Li, X.B.; Chen, R. Replication of internal defects and investigation of mechanical and fracture behavior of rock using 3D printing and 3D numerical methods in combination with X-ray computerized tomography. Int. J. Rock Mech. Min. Sci. 2018, 106, 198–212. [Google Scholar] [CrossRef]
- Zhou, T.; Zhu, J.B.; Xie, H.P. Mechanical and volumetric fracturing behavior of three-dimensional printing rock-like samples under dynamic loading. Rock Mech. Rock Eng. 2020, 53, 2855–2864. [Google Scholar] [CrossRef]
- Zhou, T.; Zhu, J.B.; Ju, Y.; Xie, H.P. Volumetric fracturing behavior of 3D printed artificial rocks containing single and double 3D internal flaws under static uniaxial compression. Eng. Fract. Mech. 2019, 205, 190–204. [Google Scholar] [CrossRef]
- Bi, J.; Zhou, X.P.; Xu, X.M. Numerical simulation of failure process of rock-like materials subjected to impact loads. Int. J. Geomech. 2017, 17, 04016073. [Google Scholar] [CrossRef]
- Bi, J.; Zhou, X.P.; Qian, Q.H. The 3D numerical simulation for the propagation process of multiple pre-existing flaws in rock-like materials subjected to biaxial compressive loads. Rock Mech. Rock Eng. 2016, 49, 1611–1627. [Google Scholar] [CrossRef]
- Han, W.; Jiang, Y.J.; Luan, H.J.; Du, Y.T.; Zhu, Y.G.; Liu, J.K. Numerical investigation on the shear behavior of rock-like materials containing fissure-holes with FEM-CZM method. Comput. Geotech. 2020, 125, 103670. [Google Scholar] [CrossRef]
- Zhang, Z.Y.; Jin, X.G.; Lin, S.Z.; Bi, J. Direct shear behavior of sulfate-exposed shotcrete: Experimental and modelling research. Constr. Build. Mater. 2019, 210, 607–619. [Google Scholar] [CrossRef]
- Kou, M.M.; Liu, X.R.; Tang, S.D.; Wang, Y.T. 3-D X-ray computed tomography on failure characteristics of rock-like materials under coupled hydro-mechanical loading. Theor. Appl. Fract. Mech. 2019, 104, 102396. [Google Scholar] [CrossRef]
- Modiriasari, A.; Bobet, A.; Laura, J.; Nolte, J. Seismic Wave Conversion Caused by Shear Crack Initiation and Growth. Rock Mech. Rock Eng. 2020, 53, 2805–2818. [Google Scholar] [CrossRef]
- Zhao, Y.L.; Zhang, L.Y.; Wang, W.J.; Pu, C.Z.; Wan, W.; Tang, J.Z. Cracking and stress–strain behavior of rock-like material containing two flaws under uniaxial compression. Rock Mech. Rock Eng. 2016, 49, 2665–2687. [Google Scholar] [CrossRef]
- Spetzler, H.; Sondergeld, C.; Sobolev, G.; Salov, B. Seismic and strain studies on large laboratory rock samples being stressed to failure. Tectonophysics 1987, 144, 55–68. [Google Scholar] [CrossRef]
- Su, G.; Shi, Y.; Feng, X.; Jiang, J.; Zhang, J.; Jiang, Q. True-triaxial experimental study of the evolutionary features of the acoustic emissions and sounds of rock burst processes. Rock Mech. Rock Eng. 2018, 51, 375–389. [Google Scholar] [CrossRef]
- Wang, C.L. Identification of early-warning key point for rock-mass instability using acoustic emission/micro seismic activity monitoring. Int. J. Rock Mech. Min. Sci. 2014, 71, 171–175. [Google Scholar] [CrossRef]


| Density (g/cm3) | Uniaxial Compressive Strength (MPa) | Poisson’s Ratio | Cohesion (MPa) | Friction Angle (°) | Wave Velocity (m/s) |
|---|---|---|---|---|---|
| 2.332 | 29.65 | 0.23 | 8.07 | 47.98 | 4050 |
| Direction of Shear | Sample | Flaw Angle α (°) | Initial Normal Stress σn, (MPa) |
|---|---|---|---|
| Positive shear | P-0, P-30, P-45-2, P-60, P-90 | 0, 30, 45, 60, 90 | 2 |
| P-45-1, P-45-3, P-45-4, P-45-5 | 45 | 1, 3, 4, 5 | |
| Reverse shear | R-0, R-30, R-45-2, R-60, R-90 | 0, 30, 45, 60, 90 | 2 |
| R-45-1, R-45-3, R-45-4, R-45-5 | 45 | 1, 3, 4, 5 | |
| Lateral shear | L-0, L-30, L-45-2, L-60, L-90 | 0, 30, 45, 60, 90 | 2 |
| L-45-1, L-45-3, L-45-4, L-45-5 | 45 | 1, 3, 4, 5 | |
| Complete samples | C-1, C-2, C-3, C-4, C-5 | 1, 2, 3, 4, 5 |
| Direction of Shear | Flaw Angle of Sample α (°) | |||||
|---|---|---|---|---|---|---|
| 0 | 30 | 45 | 60 | 90 | ||
| Positive shear | Shear strength τp (MPa) | 7.26 | 6.51 | 7.50 | 7.07 | 8.25 |
| Corresponding shear displacement (mm) | 0.66 | 1.11 | 1.79 | 1.68 | 0.63 | |
| Reverse shear | Shear strength τp (MPa) | 7.07 | 5.78 | 6.11 | 6.81 | 6.95 |
| Corresponding shear displacement (mm) | 1.36 | 1.96 | 1.85 | 1.20 | 1.58 | |
| Lateral shear | Shear strength τp (MPa) | 7.07 | 7.01 | 6.44 | 6.61 | 6.99 |
| Corresponding shear displacement (mm) | 1.36 | 1.12 | 1.71 | 1.77 | 2.94 | |
| Direction of Shear | Normal Stress σn (MPa) | |||||
|---|---|---|---|---|---|---|
| 1 | 2 | 3 | 4 | 5 | ||
| Positive shear | Shear strength τp (MPa) | 4.51 | 7.50 | 7.87 | 8.19 | 8.18 |
| Corresponding shear displacement (mm) | 1.20 | 1.79 | 2.41 | 3.09 | 3.09 | |
| Reverse shear | Shear strength τp (MPa) | 3.80 | 6.11 | 6.54 | 7.40 | 8.91 |
| Corresponding shear displacement (mm) | 1.48 | 1.85 | 2.14 | 2.12 | 3.60 | |
| Lateral shear | Shear strength τp (MPa) | 5.04 | 6.44 | 9.22 | 9.26 | 11.18 |
| Corresponding shear displacement (mm) | 1.19 | 1.71 | 2.04 | 1.43 | 2.20 | |
| Intact sample | Shear strength τp (MPa) | 6.66 | 8.81 | 10.35 | 11.49 | 11.56 |
| Corresponding shear displacement (mm) | 1.39 | 1.70 | 1.77 | 1.54 | 1.28 | |
| Microscopic Parameters | Values | Remarks |
|---|---|---|
| Minimum particle diameter, Rmin (mm) | 0.8 | Microparameter of ball |
| Ratio of maximum and minimum particle radius, Rmax/Rmin | 1.56 | Microparameter of ball |
| Ratio of normal to shear of stiffness of the particle, kn/ks | 2.1 | Microparameter of ball |
| Coefficient of particle friction, μ | 0.5 | Microparameter of ball |
| Particle density, ρ (g/cm3) | 2.35 | Microparameter of ball |
| Parallel bonding radius multiplier, λ | 1.0 | Microparameter of parallel bond |
| Parallel bond modulus, Ec (GPa) | 1.83 | Microparameter of parallel bond |
| Parallel bond tensile strength, σt (Mpa) | 12.4 | Microparameter of parallel bond |
| Parallel bond cohesion, c* (Mpa) | 27 | Microparameter of parallel bond |
| Ratio of normal to shear of stiffness of parallel bond, kn/ks | 2.1 | Microparameter of parallel bond |
| Angle of friction in parallel bond, φ* (°) | 45 | Microparameter of parallel bond |
Publisher’s Note: MDPI stays neutral with regard to jurisdictional claims in published maps and institutional affiliations. |
© 2022 by the authors. Licensee MDPI, Basel, Switzerland. This article is an open access article distributed under the terms and conditions of the Creative Commons Attribution (CC BY) license (https://creativecommons.org/licenses/by/4.0/).
Share and Cite
Teng, M.; Li, J.; Lian, S.; Bi, J.; Wang, C. Shear Failure Mechanism and Numerical Simulation Analysis of Rock-like Materials with an Embedded Flaw. Machines 2022, 10, 382. https://doi.org/10.3390/machines10050382
Teng M, Li J, Lian S, Bi J, Wang C. Shear Failure Mechanism and Numerical Simulation Analysis of Rock-like Materials with an Embedded Flaw. Machines. 2022; 10(5):382. https://doi.org/10.3390/machines10050382
Chicago/Turabian StyleTeng, Mingyang, Jiashen Li, Shuailong Lian, Jing Bi, and Chaolin Wang. 2022. "Shear Failure Mechanism and Numerical Simulation Analysis of Rock-like Materials with an Embedded Flaw" Machines 10, no. 5: 382. https://doi.org/10.3390/machines10050382
APA StyleTeng, M., Li, J., Lian, S., Bi, J., & Wang, C. (2022). Shear Failure Mechanism and Numerical Simulation Analysis of Rock-like Materials with an Embedded Flaw. Machines, 10(5), 382. https://doi.org/10.3390/machines10050382