Abstract
In this study, the failure characteristics of self-made rock with internal flaws under shear were studied and a numerical simulation analysis was carried out. Firstly, based on basic physical and mechanical tests, the shear strength characteristics of rocks with built-in 3D defects were summarized. PFC3D simulation software was used to model the samples with flaws, and the microscopic parameters were calibrated according to the test results. From the simulation results, it was found that the generation mode of microcracks from the flaw tip was different. The microcracks of forward shear and reverse shear were mainly generated from the horizontal direction, while the microcracks of lateral shear gradually increased from the upper and lower ends of the flaw in the opposite direction. When the peak shear strength was reached, the total number of cracks was the largest in lateral shear and the smallest in forward shear. When studying the particle velocity vector field, it was found that when reaching the peak shear strength, the particles on both sides of the prefabricated flaw appeared to be in vortex motion. When α = 45° and σn = 2 MPa, the failure mode of forward shear and lateral shear was shear-tensile-shear (S-T-S), and that of reverse shear and the intact specimen was shear-shear-shear (S-S-S). The lateral shear tensile effect was the most obvious and was mainly concentrated in the middle part of the sample.
1. Introduction
Rock masses in nature are composed of two elements, the structure and the structural plane; the strength and deformation of a rock mass are mainly controlled by the structural plane [1,2,3,4,5,6,7,8,9]. Many flaws have been found in the natural rock masses (Figure 1) [10,11,12,13,14]. In previous studies, scholars have spent a great deal of time on the study of penetrating or semi-penetrating fractures; however, these cannot fully represent the mechanical properties of a rock mass with flaws under the action of external forces [15,16,17]. In nature, fractures in heterogeneous rock masses are mostly three-dimensional flaws, which usually exist in underground caverns and rocky slopes [18,19,20]. With the increase in external load, new cracks first appear at the tip of the pre-existing flaw, expand in other directions, and eventually combine with the adjacent cracks, resulting in the penetration failure of the rock mass [21,22,23,24,25,26]. Therefore, for the safety of rock structure engineering, it is of great significance to understand the mechanism of crack propagation and the failure mode of rock masses with flaws [27,28,29,30,31,32,33,34].
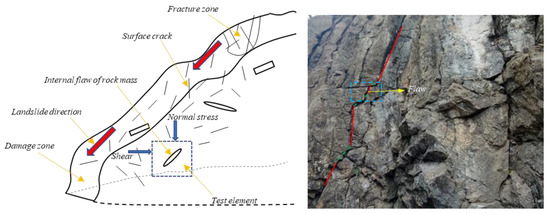
Figure 1.
Stress diagram of high defect rock slope.
Scholars at home and abroad have completed a great deal of research on the mechanical behavior and crack propagation mechanism of rock masses with three-dimensional flaws [35,36,37]. The earliest research on three-dimensional cracks originated from pioneering experiments conducted by Erdogan and Sih, who proposed the hypothesis that rock mass failure results from a fracture along the direction of maximum stress [38]. Wong et al. used PMMA and silica glass materials to make samples with three-dimensional surface flaws and conducted propagation tests. Their results showed that the crack propagation mechanism of the samples was related to the flaw dip angle and depth [39,40]. By making samples with defects in acrylic resin glass, Knauss observed a large number of semicircle coin-like cracks at the front of the defect during shear failure [41]. Due to the difficulty of sample preparation, there are many studies on surface cracks but few on the mechanical properties of samples with internal flaws under external loading.
In recent years, some scholars have used PMMA, gypsum, and other materials to make samples with internal flaws to study the deformation characteristics and strength law of rock masses with flaws under various compressive loads. Germanovich et al. studied the law of crack initiation and propagation in specimens with three-dimensional prefabricated flaws under a compression load [42,43,44]. Zhou et al. studied the process of crack initiation, propagation, and consolidation under uniaxial compression using samples made of PMMA material. Oblique secondary cracks, anti-wing cracks, and open and closed wrapping forms were found for the first time [45]. In order to study the cracking behavior of samples with flaws at different temperatures, Zhao et al. observed the differences in the microscopic properties and mechanical properties of samples made using cement-based materials under thermal shock [46]. With the development of science and technology, many advanced special machines are now used to make samples containing internal flaws [47]. For example, Zhu et al. and Zhou et al. used 3D printing technology to make transparent rock samples with flaws and studied the influence of different defect numbers and inclination angles on the initiation mode, propagation direction, and penetration process of cracks under the action of dynamic and static loads [48,49,50]. In addition to these tests, some scholars have used numerical methods to simulate the internal defects of samples, which is helpful in understanding the mesoscopic crack evolution process of samples under external loads. Bi et al. developed general particle dynamics (GPD) to simulate the expansion process and transmissibility mechanism of samples with 3D defects under biaxial dynamic and static impact [51,52]. Based on the FEM-CZM numerical simulation method, Han et al. studied the influence of the different shapes and spacing of flaws on shear mechanical properties [53].
It can be seen from previous studies that scholars usually use PMMA, gypsum, silica glass, and other materials or 3D printing technology to make samples with flaws for uniaxial and triaxial tests to study the effects of different flaw sizes, shapes, and numbers on the mechanical properties of samples during failure. Because PMMA and other materials cannot guarantee the anisotropy of rock, the rock mass cannot be simulated more truly. Meanwhile, there are few studies on the shear testing of rocks with embedded flaws. Therefore, this study used standard sand, water, and cement to conduct shear tests on samples containing flaws in a certain proportion to study the effects of different shear directions and flaw inclination angles on the mechanical properties of the samples. At the same time, PFC3D was used for the numerical analysis of different shear directions to simulate the fracture evolution process. Research on the three-dimensional fracture mechanics of rock masses has a certain value in engineering applications and as a reference for future scholars to study the shear characteristics of rock masses with flaws.
2. Test Preparation
2.1. Samples and Test Instruments
The use of cement mortar in this test to simulate real rock has two advantages. First, it is easier to form internal flaws in the middle of the sample without destroying the integrity of the sample. Secondly, its physical and mechanical properties are similar to those of real rocks to ensure the anisotropy of the samples [54,55]. Here, we use the term “flaw” to represent the pre-existing defect and “crack” to represent the new defect formed under the action of an external force load [56,57]. In this study, the circular fracture geometric model was used to simulate primary fractures in a rock mass by placing treated mothballs (C10H16O) in cement mortar and curing the fractures. Figure 2 shows the size parameters of the sample and the flaw; the sample size was 70 mm × 70 mm × 70 mm. The geometry of the prefabricated crack was defined as a circular shape with a diameter of 18 mm and a thickness of 2 mm. The design flaw inclination angles α were 0°, 30°, 45°, 60°, and 90° respectively.
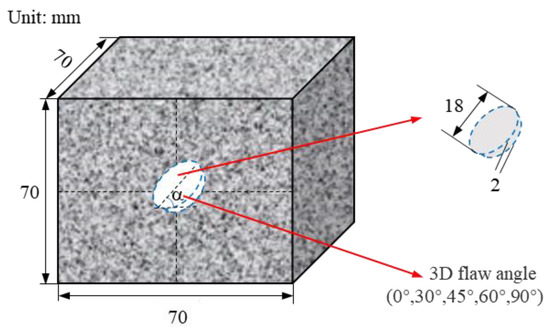
Figure 2.
Sample size and flaw geometric parameters.
Before making the sample, we applied lubricating oil to the inside of the mold and then fixed the treated camphor pellet in the mold according to the required angle through fine cotton thread (as shown in Figure 3a). In this test, an exact ratio of standard sand and Portland cement (water:sand:cement =1:3:0.48) was adopted and the was evenly stirred by a mortar machine to form cement mortar, which was poured into the fixed mothball mold. After being placed at room temperature for 24 h, the samples obtained were removed from the mold and placed in a curing machine box with a constant temperature and humidity for 28 days (Figure 3b). The curing conditions were 20 ± 1 °C and 98% humidity. After completing the conservation of the rock-like samples, it was found through many pre-tests that the effect was the best when the oven temperature was maintained at 50 °C and the samples were continuously baked for 3 h. Finally, we used a grinding machine to smooth the surface of the sample (Figure 3c) in order to reduce the influence of end-face friction on the results. We prepared 3 samples with a flaw inclination of 0°, 30°, 60°, and 90°, 15 samples with a flaw inclination of 45°, and 5 complete rock-like samples. For the purpose of a complete validation test, another set of identical samples was prepared for standby.
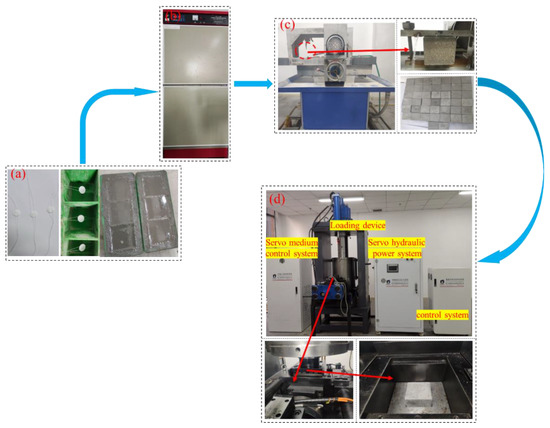
Figure 3.
Sample preparation and shear test equipment: (a) preparation of the samples before pouring; (b) constant temperature and humidity curing box; (c) sample grinding process; (d) mechanical loading equipment.
The equipment used in this test was a DSZ-1000 stress-strain controlled triaxial shear permeability tester (as shown in Figure 3d). The device consists of four parts: a servo medium control system, loading device, servo hydraulic power system, and control system. The maximum normal and tangential loads can reach 1000 kN and 300 kN, respectively, and the maximum normal and tangential displacements are both 50 mm. The shear box of the equipment is fully enclosed, and it has an independent displacement extensor in both the axial and horizontal directions to reduce test errors. The shear surface is connected with the base by a ball bearing to reduce the influence of friction on the test results.
2.2. Physical Properties of Rock-like Specimens
A small part of the sample powder was taken out for X-ray diffraction (XRD) test analysis; it was found (as shown in Figure 4) that the sample was composed of feldspar (KAlSi3O8), quartz (SiO2), calcite (CaCO3), mica (KAl3Si3O10(OH)2), calcium feldspar (CaAl2Si2O8), and other impurities. The content of quartz SiO2 was obviously higher than the other mineral components. These results indicated that the prepared rock-like sample conformed to the basic content of rock; that is, it was composed of a variety of minerals, which is in line with the test requirements.
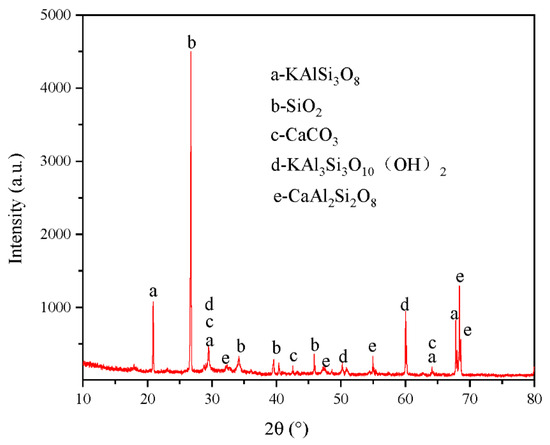
Figure 4.
X-diffraction of the rock-like sample.
Table 1 shows the physical and mechanical parameters of the intact samples. By measuring the velocity of the concrete p-wave, we found that the parameter was consistent with the wave number range of sandstone, further proving that the sample could simulate the real rock well.

Table 1.
Physical and mechanical parameters of the complete sample.
2.3. Experimental Research Program
In this test, samples with a three-dimensional flaw were sheared in different directions; that is, sheared in different directions according to the same flaw inclination angle, which was defined as positive shear, reverse shear, and lateral shear. A schematic diagram of shear is shown in Figure 5. The solid red line represents the central shear zone, and the blue arrow represents the direction of the applied external load.
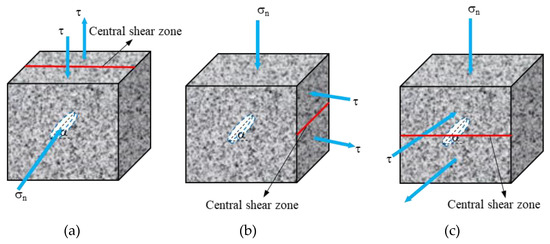
Figure 5.
Schematic diagram of a sample with flaw shear in three different directions (taking an angle α = 45° as an example): (a) Positive shear; (b) Reverse shear; (c) Lateral shear.
In this test, according to the different flaw inclinations and shear directions, the samples were divided into three groups (as shown in Table 2) and a group of complete samples for comparison. The initial normal stress σn was 2 MPa for each group (inclination angle α = 0°, 30°, 60°, and 90°). When the flaw inclination angle α was 45° in the complete sample, the initial stress σn was loaded from 1 MPa to 5 MPa at an interval of 1 MPa. The loading path of the test is shown in Figure 6. The normal load was first applied at a rate of 0.5 MPa/min to 2 MPa (point B). Then, the normal load was kept constant, the shear load started to load at a rate of 0.5 MPa/min (point C) until the specimen was broken through, and the peak shear strength τp (point D) was obtained.

Table 2.
Rock-like sample numbers and test grouping.
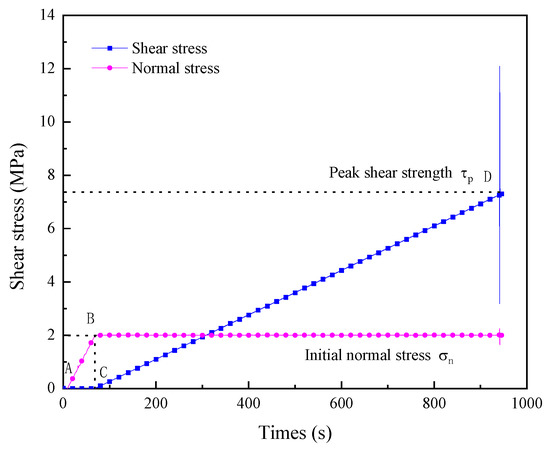
Figure 6.
Schematic diagram of sample loading path.
3. Experiment Results
3.1. Shear Displacement-Stress Curve
Figure 7 shows the shear stress-shear displacement curves of samples with different flaw inclinations and shear directions. It can be seen from Figure 7 that the characteristics of the shear stress-shear displacement curves of all samples are similar on the whole. At the initial stage of loading, the curves are concave, and the slope of the curves begin to rise continuously, indicating that the shear modulus of the sample is increasing. At this point, the micropores between crystals in the sample begin to close and then reach a dense state. With the increase in shear stress, the curves approach a straight line and the slope reaches the maximum. The internal flaws of the samples begin to expand rapidly and produce many secondary cracks. After that, the curves go to the next stage and are divided into two types: For α = 0°, 90° in Figure 7a and α = 0°, 60 ° in Figure 7b, the curves continue to maintain the linear trend of the previous stage until sudden failure. The other type is that with a continuous increase in shear stress, the curves begin to show a downward convex trend and the slopes begin to decrease. Compared with the sudden drop of the previously described curve, these curves are relatively gentle before the failure of the samples.
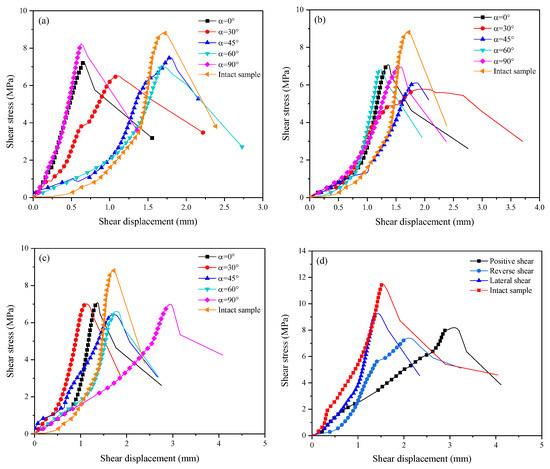
Figure 7.
Shear stress-shear displacement curve: (a) positive shear, σn = 2 MPa; (b) reverse shear, σn = 2 MPa; (c) lateral shear, σn = 2 MPa; (d) α = 45°, σn = 4 MPa.
Table 3 and Table 4 show the peak shear strength and corresponding shear displacement of each sample under different conditions. It can be seen from Table 3 that the shear displacement when the sample reached the peak shear strength under the action of low normal stress (σn = 2 MPa) was generally between 0.5~2 mm, while it could reach 2~3 mm when α = 45°. As can be seen from Table 4, when α = 45°, different normal stresses had a considerable influence on the shear displacement of the sample when it reached the peak shear strength, while the shear displacement of the intact sample had a small overall change, indicating that the internal flaws had a certain influence on the shear deformation characteristics of the sample.

Table 3.
Mechanical characteristics of the samples at different inclinations and shear directions under the same normal stress (σn = 2 MPa).

Table 4.
Mechanical characteristics of the samples under different shear directions and normal stresses at the same flaw inclination angle (α = 45°).
3.2. Strength Characteristics
Figure 8 exhibits the variation of the peak shear strength with the flaw angle and normal stress under different shear modes. Figure 8a shows that under the same conditions, the peak shear strength of positive shear was larger than that of reverse shear, while lateral shear was in between. The peak shear strength of positive shear showed weak regularity and reached its maximum value at α = 90°. When the flaw angle α increased from 0° to 90°, the peak shear strength increased from 7.26 MPa to 8.25 MPa (by 13.64%). The peak shear strength of reverse shear and lateral shear decreased first and then increased with the increase in the flaw inclination angle, reaching the maximum at α = 0°. When α = 30°, the peak shear strength of reverse shear was the smallest among all samples. The peak shear strength of reverse shear decreased from 7.07 MPa to 6.95 MPa (by 1.2%), and the peak shear strength of lateral shear decreased by 1.13%.
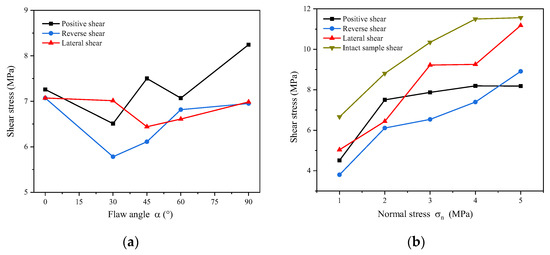
Figure 8.
Variation of peak shear strength with flaw dip angle and normal stress: (a) Flaw dip angle vs. peak shear strength; (b) Normal stress vs. peak shear strength.
Figure 8b shows that under the same flaw inclination angle (α = 45°), the peak shear strength of the three shear directions and complete sample increased with an increase in normal stress. The shear strength of intact samples was greater than that of all samples with flaws, indicating that the flaws had a significant effect on the strength characteristics of samples. When the normal stress increased from 1 MPa to 5 MPa, the peak shear strength of lateral shear changed the most, while the peak shear strength of positive shear changed the least. In addition, when the normal stress was high (σn = 4 MPa), the peak shear strength of lateral shear was significantly greater than that of the other two shear directions.
3.3. Analysis of Section Morphology Characteristics
After the shear test, a three-dimensional surface structure laser scanner was used to collect the morphology information of the fracture section of the sample. The spatial distance of each point during collection was 0.5 mm so the microscopic features of the cross-sectional surface could be accurately collected. Matlab 2018b software was used to reconstruct the data to form the three-dimensional topography features of the section, as shown in Figure 9. The red arrow in the figure represents the shearing direction. It can be seen from the figure that the sample was relatively flat along the shear direction, while both sides fluctuated greatly. The fluctuation in the three-dimensional morphology of the complete sample was small, and as a whole it was relatively smooth, which matches the test results. The influence of reverse shear and lateral shear on the failure of the specimen cross-section was greater than that of others. However, in general, under the same other conditions, the cross-sectional morphology obtained from different shear directions was quite different, showing the anisotropic characteristics of the cross-section.
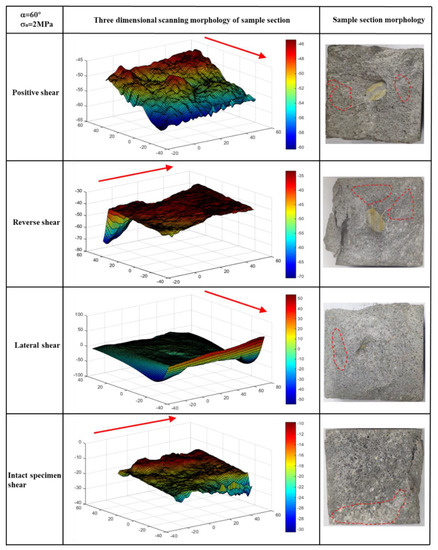
Figure 9.
Comparison of 3D scanning morphology characteristics of sections from each sample after failure (σn = 2 MPa, α = 60°).
4. Numerical Simulation
4.1. Microstructure of Rock-like and PFC3D Numerical Model
The SEM and section images in Figure 10 show that the sample was glued together by a variety of particles of different grades under the action of adhesive materials, which conformed to the microstructure of the real rock sample and ensured the authenticity and anisotropy of the sample. In PFC3D, the particles of different sizes in Figure 10 can be replaced by balls, and the bonding model is used to bond the spheres together to ensure that the model is closer to the real rock.
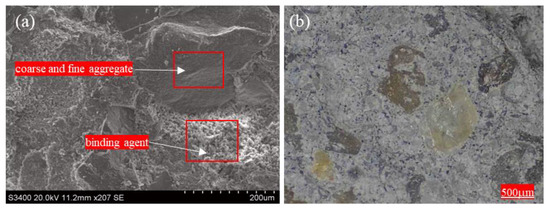
Figure 10.
Microstructure of rock materials: (a) scanning electron microscope (SEM) image; (b) cross-section light microscope image.
The numerical simulation bonding model adopts the linear parallel bonding model, and its theoretical basis is shown in Figure 11. It can not only bear tensile stress but also transfer torque. This model can be conceived as a set of springs with constant normal and shear stiffness at the contact point of two particles. In the simulation of servo control, when the maximum normal stress exceeds the strength of the parallel bond, tensile fracture occurs in the parallel bond. When the maximum shear stress of the parallel bond exceeds the shear bond strength, shear fracture will occur. The breaking of each bond represents the creation of a crack.
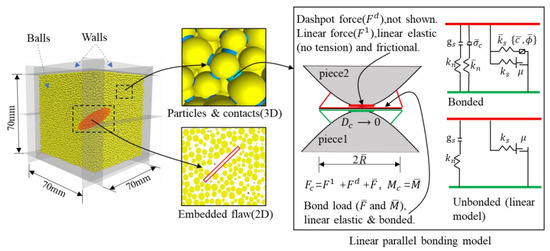
Figure 11.
PFC3D model sample and parallel bonding model.
PFC3D numerical simulation adopts the servo theory control of the software; however, because it cannot directly apply a load to the particles, it is necessary to add walls at the boundary of the model. In PFC3D, the model is controlled and loaded with the function compiled by adding the Fish language built into the software. In PFC3D, the servo function compiled by Fish is added to control the loading of the model. Every time the servo function is called in the shear process, the difference between the actual stress on the wall and the target stress can be reduced; the ultimate goal is to keep the actual normal stress constant.
The normal velocity of the wall is defined as:
where G represents servo parameters.
The change in contact force generated by the wall movement within a unit time step is equal to:
where Nc represents the number of contacts with the wall and kwall is the average contact stiffness.
Therefore, the change in the average contact stress of the wall is equal to:
In order to ensure that the stress of the boundary wall is less than the absolute value of the difference between the test stress and the target value, a stress release factor φ (0~1) is assumed to ensure that the servo control parameters can be achieved in the shearing process.
We can obtain the normal acceleration of the wall by substituting (4) into Equation (1).
The establishment of the model generally includes the following steps. First, establish the loading area, and the whole test can only occur in this area. If the particles pop out of the area, the test will stop immediately. As shown in Figure 11, the size of the model was 70 mm × 70 mm × 70 mm. Since a constant load needs to be applied to the normal direction, and to prevent a large number of particles from overflowing during the test, 10 walls need to be established. A circular geometry is established in the middle of the wall. In addition to the circular geometry, particles with a radius of 0.8~1.25 mm are randomly placed in the wall. The whole model contains 57,983 particles. Finally, add cementation and run to make the particles in the model reach equilibrium and complete the establishment of the whole model.
4.2. Microscopic Parameter Calibration
Based on the physical and mechanical parameters in Table 1, to better match the uniaxial stress-strain curve of the complete sample, a trial-and-error method was adopted in the calibration process of the model. The parallel bonding model generally includes two kinds of microscopic parameters: the spherical microscopic parameters and the bond microscopic parameters. In the calibration process, it was found that the parallel bond stiffness of the particles was approximately proportional to the macro elastic modulus of the sample, and the normal and tangential contact stiffness ratio of the parallel bond was related to Poisson’s ratio. The uniaxial compressive strength was mainly determined by the shear strength and bonding tensile strength of the parallel bond. The shear strength conformed to the Mohr–Coulomb criterion and was determined by bonding force and internal friction angle. Generally, the failure mode of the specimen was related to the ratio of the cohesion and tensile strength of the parallel bond. According to the basic principles described above, the results were tested and adjusted repeatedly. The microparameters are shown in Table 5.

Table 5.
Microscopic parameters of PFC3D model.
4.3. Verification of Model Results
Four groups of model specimens with a normal stress of 2 MPa and a flaw dip angle of 45° were tested using the microscopic parameters of the model shown in Table 5. The peak shear strength and peak shear displacement of the four groups were compared with the physical test results, as shown in Figure 12. The transverse coordinates 1, 2, 3, and 4 represent positive shear, reverse shear, lateral shear, and complete shear, respectively. It can be seen from Figure 12 that the peak shear strength and peak shear displacement of the indoor physical test results and numerical simulation results were basically the same; the difference between the two was within 10%, indicating that the microscopic parameters of the simulation matched well.
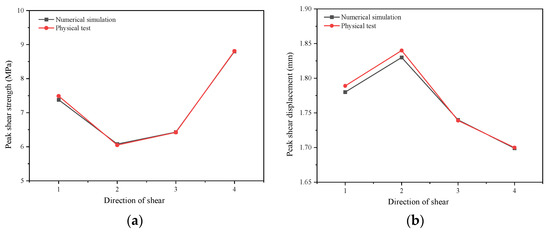
Figure 12.
Comparison between peak parameters of the four groups of model samples and physical test results: (a) peak shear strength; (b) peak shear displacement.
Figure 13 shows the failure surface comparison results of the four model specimens with a normal stress of 2 MPa and a fracture dip angle of 45° with the physical test specimens. It can be concluded from the figure that the failure mode of the model specimen under this group of microparameters was basically consistent with the results of the laboratory test. By comparing the variation in the peak parameters of the model specimen and the physical test and the failure mode of the model after fracture, it was found that the mechanical characteristics of the model specimen were basically consistent with those of the indoor specimen after the shear test, which should be further analyzed and studied.
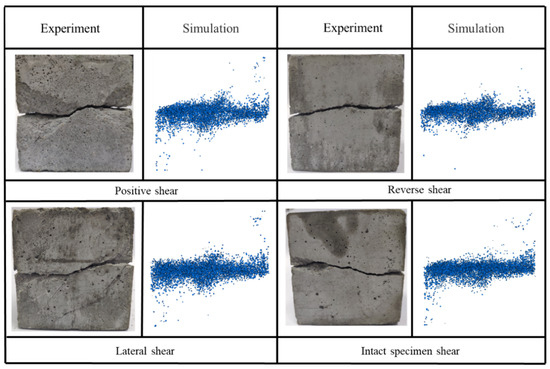
Figure 13.
Comparison between the numerical value for the four groups of samples after failure and the failure surface of the physical test.
4.4. Analysis of Numerical Simulation Results
4.4.1. Crack Propagation Process
It can be concluded from Figure 14 that τi/τp at the crack initiation of the other model samples was maintained at about 45%, except that the lateral shear was less than 40%. Under the action of an external force, the sample with a prefabricated flaw first produced microcracks from the flaw tip. The microcracks of forward shear and reverse shear were mainly generated from the horizontal direction, while the microcracks of lateral shear gradually increased from the upper and lower ends of the flaw in the opposite direction, showing a tensile trend. When τi/τp = 70~80%, the number of microcracks gradually increased and a fin crack occurred. At this time, there was no obvious microcrack at the fracture along the shear direction of the sample. This was consistent with the white scratch at the fracture when the specimen was damaged in the physical test; that is, there were few convex bodies in the model, resulting in an obvious slip failure. When τi/τp was greater than 90%, the microcracks around the flaw increased rapidly and appeared as petal-like crack. When the strength τi of the model sample reached the peak strength τp, the number of internal microcracks increased sharply, and finally the model was broken through.
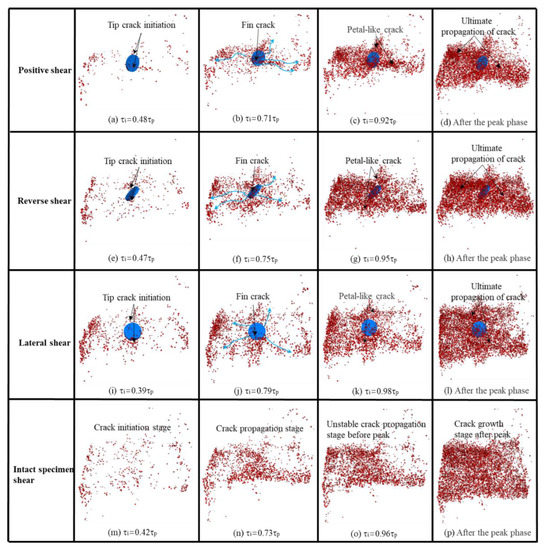
Figure 14.
Microcrack propagation of four groups of models in different servo loading stages.
Figure 15 shows the variation in the number of breakages with time steps in the servo loading process of four groups of different models under the conditions of σn = 2 MPa and α = 45°. The left longitudinal axis indicates the ratio of τi to τp (percentage), the red axis on the right is the number of new breakages added every ten steps, and the blue axis represents the total number of breakages. The whole model loading test can be divided into five stages: internal pore compaction stage, crack initiation stage, crack steady growth stage, unstable crack propagation stage before the peak, and crack growth stage after the peak. During the internal pore compaction stage, few microcracks occur, the red columns are low in height, and the blue curves overlap with the x-axis. When τi/τp is greater than 90%, the red bar rises sharply, and the blue curve shows a straight growth. In the unstable growth stage, the growth of the number of breakages enters a quiet and stable zone; when τi = τp, the number of breakages suddenly increases, which is similar to the characteristics of acoustic emission signals in rock failure [58,59,60]. At this time, the total number of breakages in lateral shear is the largest, and the number of breakages in forward shear is the smallest.
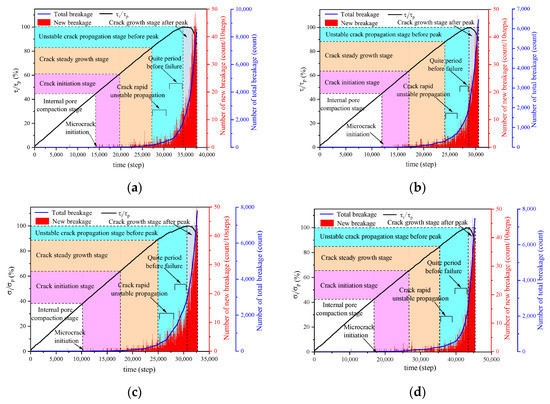
Figure 15.
Variation of breakage number with time steps in the loading process of the model: (a) Positive shear; (b) Reverse shear; (c) Lateral shear; (d) Intact sample shear.
Figure 16 shows the growth of the number of tension-shear breakages and the variation in the proportion of tension-shear breakages in the model loading process. The yellow and purple columns represent the proportion of tensile and shear breakage numbers, respectively, in the corresponding stages. It can be seen from Figure 15 that the number of shear breakages was small in the early loading stage; then, tensile cracks accounted for a large proportion. The proportion of tensile shear breakages in reverse shear and lateral shear was equivalent when τi/τp = 50%, while the proportion of tensile shear breakages in forward shear and complete sample shear was equivalent when τi/τp = 65%. After that, the proportion of shear breakages increased rapidly, and shear failure occurred until the model was broken through.
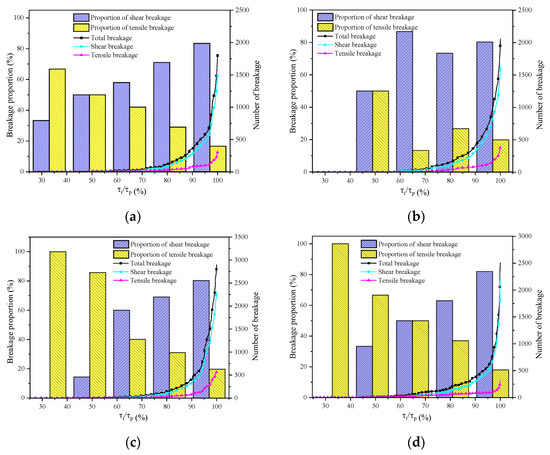
Figure 16.
Variation law of the proportion of tensile shear breaking number with the increase in shear stress: (a) Positive shear; (b) Reverse shear; (c) Lateral shear; (d) Intact sample shear.
4.4.2. Displacement Field Analysis
After entering the stable development stage, it was found that the particles on the right side of the flaw in reverse shear (as shown in Figure 17f) and on the left side of the flaw in lateral shear (as shown in Figure 17j) underwent vortex motion more intensely than the other two model samples, which is consistent with the crack propagation in Figure 14 in Section 4.4.1. During the unstable development stage of the crack, the particles on both sides of the prefabricated flaw underwent vortex motion; the motion direction of the particles in the upper half gradually moved to the left, and the gradual shear zone was progressively cleared. With the continuous increase in load, the crack in the middle of the model expanded rapidly, and the shear band obviously divided the sample into upper and lower parts.
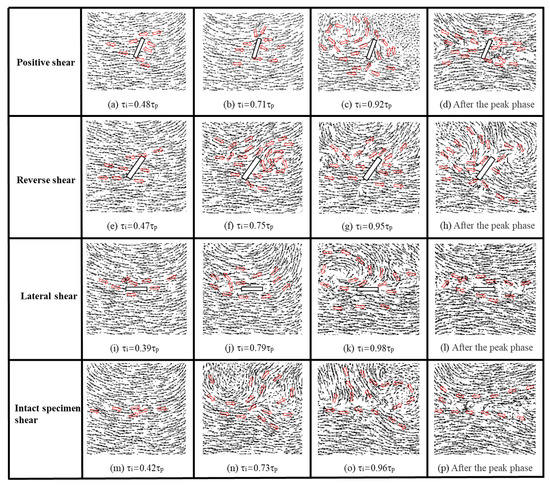
Figure 17.
Distribution rules of particle velocity vectors of four model samples at different stages.
4.4.3. Contact Force Chain Analysis
In the loading process of the PFC3D model, it is usually necessary to use the contact force chain to observe the contact between particles, which can more intuitively and accurately judge the change in contact force and predict the time and location of model failure. Figure 18 shows the changes between the contact force chains of the four groups of models, in which the green contact force chain represents the pulling contact force chain and the blue contact force chain represents the splicing contact force chain. As can be seen from the figure, in the initial stage of loading, the contact force chain is relatively thin, indicating that the contact force is small. With an increase in shear stress, a small amount of the contact force chain begins to break and produce cracks, and the force chain also begins to coarsen. When entering the unstable development stage of crack, the crack develops rapidly, the force chain on both sides of the flaw is thicker, and the red area may be the area of model fracture. After the peak strength, the strong force chain almost runs through the whole shear band, and the specimen is broken through, which is almost consistent with the crack distribution in Figure 14 in Section 4.4.1.
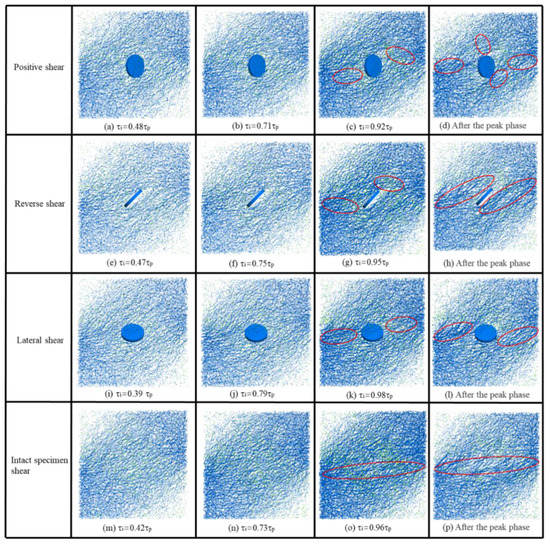
Figure 18.
Changes in contact force chain of four groups of model samples at different stages.
4.4.4. Failure Mode
Figure 19 shows a comparison of the failure modes after fracture between four groups of numerical simulation tests and physical tests. The first column is the failure mode after the physical tests, and the second and third columns are the failure modes obtained after the numerical simulation. It can be seen from the figure that the results of the physical tests and numerical simulation were basically consistent. It was concluded that when α = 45° and σn = 2 MPa, the failure mode of forward shear and lateral shear was shear-tensile-shear (S-T-S), and the failure mode of reverse shear and the complete sample was shear-shear-shear (S-S-S). Among them, the tensile effect of lateral shear was more obvious and mainly concentrated in the middle of the sample.
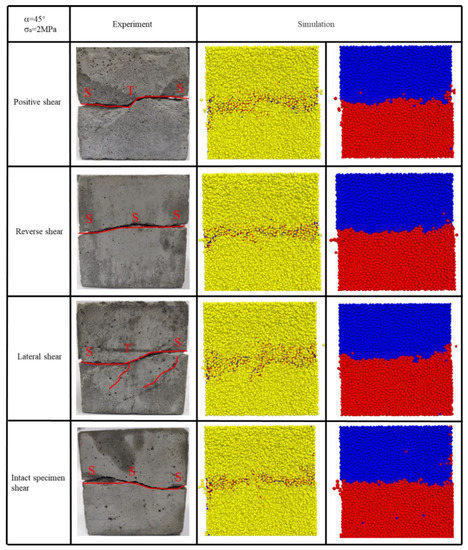
Figure 19.
Comparison of failure modes between four groups of model samples and physical tests.
5. Conclusions
In this study, direct shear tests with different dip angles and different shear directions were carried out on rock-like samples with an embedded flaw. PFC3D numerical simulation software was used to simulate experiments in different shear directions, and the internal crack propagation, displacement field, contact force chain, and failure mode of the model sample were analyzed. Our results can be summarized as follows:
(1) The shear stress-displacement curve had two types of peak decline form: a sudden drop and a gentle drop. The influence of the peak shear displacement of the flawed sample was greater than that of the complete sample. When σn = 4 MPa, the peak shear strength of lateral shear was significantly greater than that of the other two shear directions. At the same flaw inclination angle (α = 45°), the peak shear strength of the three shear directions and the intact sample increased with the increase in normal stress.
(2) In the simulation, it was found that the generation mode of microcracks from the flaw tip was different. The microcracks of forward shear and reverse shear were mainly generated from the horizontal direction, while the microcracks of lateral shear gradually increased from the upper and lower ends of the flaw in the opposite direction, showing a tensile trend. When the peak shear strength was reached, the total number of cracks in lateral shear was the largest, and the number of cracks in forward shear is the smallest.
(3) When the shear peak strength was reached, the particles on both sides of the precast flaw underwent vortex motion; the motion direction of the upper half of the particles gradually moved to the left, and the shear band gradually became clear. When α = 45° and σn = 2 MPa, the failure mode of forward shear and lateral shear was S-T-S, and that of reverse shear and the intact specimen was S-S-S. The tensile effect of lateral shear was more obvious and mainly concentrated in the middle part of the sample.
Author Contributions
Conceptualization, M.T. and C.W.; methodology, M.T.; Data curation, M.T.; software, M.T.; validation, M.T., J.L. and C.W.; formal analysis, S.L.; investigation, M.T.; resources, J.B.; data curation, C.W.; writing—original draft preparation, M.T.; writing—review and editing, M.T.; visualization, M.T.; supervision, C.W.; project administration, C.W. All authors have read and agreed to the published version of the manuscript.
Funding
This research was supported by the National Natural Science Foundation of China (No. 52004072 and No. 52064006), the Guizhou Provincial Science and Technology Foundation (No. [2020]4Y044, No. [2021]292, and [2021]N404), the Research Fund for Talents of Guizhou University (Grant No. 201901), and the Specialized Research Funds of Guizhou University (Grant No. 201903) And the APC was funded by Guizhou University.
Institutional Review Board Statement
Not applicable.
Informed Consent Statement
Not applicable.
Data Availability Statement
Some or all data, models, or codes that support the findings of this study are available from the corresponding author (clwang3@gzu.edu.cn) upon reasonable request.
Conflicts of Interest
We declare that we do not have any commercial or associative interest that represents a conflict of interest in connection with the work submitted.
References
- Scavia, C. Fracture mechanics approach to stability analysis of rock slopes. Eng. Fract. Mech. 1990, 35, 899–910. [Google Scholar] [CrossRef]
- Brideau, M.A.; Yan, M.; Stead, D. The role of tectonic damage and brittle rock fracture in the development of large rock slope failures. Geomorphology 2009, 49, 103–130. [Google Scholar] [CrossRef]
- Zhao, Y.L.; Liu, Q.; Zhang, C.; Liao, J.; Lin, H.; Wang, Y. Coupled seepage-damage effect in fractured rock masses: Model development and a case study. Int. J. Rock Mech. Min. Sci. 2021, 144, 104822. [Google Scholar] [CrossRef]
- Yu, G.D.; Hu, Q.; Feng, X.W.; Meng, G.Y.; Nie, Y.F. Research on Drilling Rate Optimization of a UCS Identification System While Drilling for Coal Mine Roadway Roofs. Machines 2021, 9, 242. [Google Scholar] [CrossRef]
- Lian, S.L.; Li, J.S.; Gan, F.; Bi, J.; Wang, C.L.; Zheng, K. Investigation of the Shear Mechanical Behavior of Sandstone with Unloading Normal Stress after Freezing–Thawing Cycles. Machines 2021, 9, 339. [Google Scholar] [CrossRef]
- Zhao, Y.L.; Zhang, C.S.; Wang, Y.X.; Lin, H. Shear-related roughness classification and strength model of natural rock joint based on fuzzy comprehensive evaluation. Int. J. Rock Mech. Min. Sci. 2021, 137, 104550. [Google Scholar] [CrossRef]
- Huang, D.; Zhong, Z.; Gu, D.M. Experimental investigation on the failure mechanism of a rock landslide controlled by a steep-gentle discontinuity pair. J. Mt. Sci. 2019, 16, 1258–1274. [Google Scholar] [CrossRef]
- Zhang, S.; Xu, J.H.; Chen, L.; Zhang, M.W.; Sasaoka, T.; Shimada, H.; He, H.Y. Numerical Investigation of Influence of Fluid Rate, Fluid Viscosity, Perforation Angle and NF on HF Re-Orientation in Heterogeneous Rocks Using UDEC T-W Method. Machines 2022, 10, 152. [Google Scholar] [CrossRef]
- Feng, Y.J.; Su, H.J.; Nie, Y.J.; Zhao, H.H. Role of Cyclic Thermal Shocks on the Physical and Mechanical Responses of White Marble. Machines 2022, 10, 58. [Google Scholar] [CrossRef]
- Zhao, Y.; Bi, J.; Wang, C.L.; Liu, P.F. Effect of unloading rate on the mechanical behavior and fracture characteristics of sandstones under complex triaxial stress conditions. Rock Mech. Rock Eng. 2021, 54, 4851–4866. [Google Scholar] [CrossRef]
- Zhao, Y.; Ding, D.; Bi, J.; Wang, C.L.; Liu, P.F. Experimental study on mechanical properties of precast cracked concrete under different cooling methods. Constr. Build. Mater. 2021, 301, 124–141. [Google Scholar] [CrossRef]
- Yang, H.; Lin, H.; Chen, Y.; Wang, Y. Influence of wing crack propagation on the failure process and strength of fractured specimens. Bull. Eng. Geol. Environ. 2022, 81, 71. [Google Scholar] [CrossRef]
- Zhao, Y.; He, P.F.; Zhang, Y.F.; Wang, C.L. A new criterion for a toughness-dominated hydraulic fracture crossing a natural frictional interface. Rock Mech. Rock Eng. 2019, 52, 2617–2629. [Google Scholar] [CrossRef]
- Zhao, Y.; Wang, C.L.; Bi, J. Analysis of fractured rock permeability evolution under unloading conditions by the model of elastoplastic contact between rough surfaces. Rock Mech. Rock Eng. 2020, 12, 5795–5808. [Google Scholar] [CrossRef]
- Prudencio, M.; Van Sint Jan, M. Strength and failure modes of rock mass models with non-persistent joints. Int. J. Rock Mech. Min. Sci. 2007, 44, 890–902. [Google Scholar] [CrossRef]
- Asadizadeh, M.; Hossaini, M.F.; Moosavi, M.; Masoumi, H.; Ranjith, P.G. Mechanical characterization of jointed rock-like material with non-persistent rough joints subjected to uniaxial compression. Eng. Geol. 2019, 260, 105224. [Google Scholar] [CrossRef]
- Meng, F.Z.; Wong, L.N.Y.; Zhou, H.; Wang, Z.Q. Comparative study on dynamic shear behavior and failure mechanism of two types of granite joint. Eng Geol. 2018, 245, 356–369. [Google Scholar] [CrossRef]
- Zhuang, X.; Chun, J.; Zhu, H. A comparative study on unfilled and filled crack propagation for rock-like brittle material. Theor. Appl. Fract. Mech. 2014, 72, 110–120. [Google Scholar] [CrossRef]
- Yin, P.; Wong, R.H.C.; Chau, K.T. Coalescence of two parallel pre-existing surface cracks in granite. Int. J. Rock Mech. Min. Sci. 2014, 68, 66–84. [Google Scholar] [CrossRef]
- Liu, J.H.; Zhao, Y.L.; Tan, T.; Zhang, L.Y.; Zhu, S.T.; Xu, Y.F. Evolution and modeling of mine water inflow and hazard characteristics in southern coalfields of China: A case of Meitanba mine. Int. J. Min. Sci. Technol. 2022. [Google Scholar] [CrossRef]
- Adams, M.; Sines, G. Crack extension from flaws in a brittle material subjected to compression. Tectonophysics 1978, 49, 97–118. [Google Scholar] [CrossRef]
- Wong, R.H.C.; Lin, P. Numerical study of stress distribution and crack coalescence mechanisms of a solid containing multiple holes. Int. J. Rock Mech. Min. Sci. 2015, 79, 41–54. [Google Scholar] [CrossRef]
- Zhao, Y.; Wang, C.L.; Ning, L.; Zhao, H.F.; Bi, J. Pore and fracture development in coal under stress conditions based on nuclear magnetic resonance and fractal theory. Fuel. 2022, 309, 122112. [Google Scholar] [CrossRef]
- Lin, H.; Lei, D.; Zhang, C.; Wang, Y. Deterioration of non-persistent rock joints: A focus on impact of freeze-thaw cycles. Int. J. Rock Mech. Min. Sci. 2020, 135, 104515. [Google Scholar] [CrossRef]
- Tang, Y.; Hang Lin, H.; Wang, Y. Rock slope stability analysis considering the effect of locked section. Bull. Eng. Geol. Environ. 2021, 80, 7241–7251. [Google Scholar] [CrossRef]
- Zhao, Y.L.; Zhang, L.Y.; Wang, W.J.; Tang, J.Z.; Lin, H.; Wan, W. Transient pulse test and morphological analysis of single rock fractures. Int. J. Rock Mech. Min. Sci. 2017, 91, 139–154. [Google Scholar] [CrossRef]
- Zhou, X.P.; Zhang, J.Z.; Wong, L.N.Y. Experimental study on the growth, coalescence and wrapping behavior of 3D cross-embedded flaws under uniaxial compression. Rock Mech. Rock Eng. 2018, 51, 1379–1400. [Google Scholar] [CrossRef]
- Zhao, Y.L.; Wang, Y.Z.; Wang, W.J.; Wan, W.; Tang, J.Z. Modeling of non-linear rheological behavior of hard rock using triaxial rheological experiment. Int. J. Rock Mech. Min. Sci. 2017, 93, 66–75. [Google Scholar] [CrossRef]
- Cao, P.; Liu, T.; Pu, C.; Lin, H. Crack propagation and coalescence of brittle rock-like specimens with pre-existing cracks in compression. Eng Geol. 2015, 187, 113–121. [Google Scholar] [CrossRef]
- Zhao, Y.L.; Zhang, L.Y.; Wang, W.J.; Wan, W.; Li, S.Q.; Ma, W.H.; Wang, Y.X. Creep behavior of intact and cracked limestone under multi-level loading and unloading cycles. Rock Mech. Rock Eng. 2017, 50, 1409–1424. [Google Scholar] [CrossRef]
- Zhao, Y.; Zheng, K.; Wang, C.L.; Bi, J.; Zhang, H. Investigation on model-I fracture toughness of sandstone with the structure of typical bedding inclination angles subjected to three-point bending. Theor. Appl. Fract. Mech. 2022, 119, 103327. [Google Scholar] [CrossRef]
- Liu, Q.; Zhao, Y.L.; Tang, L.M.; Liao, J.; Wang, X.G.; Tao, T.; Chang, L.; Luo, S.L.; Wang, M. Mechanical characteristics of single cracked limestone in compression-shear fracture under hydro-mechanical coupling. Theor. Appl. Fract. Mech. 2022, 119, 103371. [Google Scholar] [CrossRef]
- Zhao, Y.L.; Liu, Q.; Lian, L.; Wang, Y.X.; Tang, L.M. Theoretical and numerical models of rock wing crack subjected to hydraulic pressure and far-field stresses. Arab. J. Geosci. 2020, 13, 926. [Google Scholar] [CrossRef]
- Zhao, Y.L.; Lian, L.; Wang, Y.X.; Liu, Q.; Lin, H.; Chang, L. Crack coalescence patterns and local strain behaviors near flaw tip for rock-like material containing two flaws subjected to biaxial compression. Arab. J. Geosci. 2020, 13, 1251. [Google Scholar] [CrossRef]
- Zhao, Y.; Teng, M.Y.; Bi, J.; Wang, C.L. Experimental study on the shear mechanical behaviour of rock-like materials containing one embedded flaw under unloading normal stress conditions. Eur. J. Environ. Civ. Eng. 2022. [Google Scholar] [CrossRef]
- Dyskin, A.V.; Jewell, R.J.; Joer, H.; Sahouryeh, E.; Ustinov, K.B. Experiments on 3D crack growth in uniaxial compression. Int. J. Fract. 1994, 65, 77–83. [Google Scholar] [CrossRef]
- Dyskin, A.V.; Sahouryeh, E.; Jewell, R.J.; Joer, H.; Ustinov, K.B. Influence of shape and locations of initial 3D cracks on their growth in uniaxial compression. Eng. Fract. Mech. 2003, 70, 2115–2136. [Google Scholar] [CrossRef]
- Erdogan, F.; Sih, G.C. On the crack extension in plates under loading and transverse shear trans. ASME J. Basic Engr. 1963, 85, 519–527. [Google Scholar] [CrossRef]
- Wong, R.H.C.; Huang, M.L.; Jiao, M.R.; Tang, C.A.; Zhu, W.S. The mechanisms of crack propagation from surface 3-D fracture under uniaxial compression. Key Eng. Mater. 2004, 261–263, 219–224. [Google Scholar] [CrossRef]
- Guo, Y.S.H.; Wong, R.H.C.; Chau, K.T.; Wei, S.Z.; Shu, C.L. Crack growth mechanisms from 3-D surface flaw with varied dipping angle under uniaxial compression. Key Eng. Mater. 2007, 353, 2353–2356. [Google Scholar] [CrossRef]
- Knauss, W.G. Observations of crack propagation in anti-plane shear. Int. J. Fract. Mech. 1970, 6, 183–185. [Google Scholar] [CrossRef]
- Germanovich, L.N.; Salganik, R.L.; Dyskin, A.V.; Lee, K.K. Mechanism of brittle fracture of rocks with multiple pre-existing cracks in compression. Pure Appl. Geophys. 1994, 143, 117–149. [Google Scholar] [CrossRef]
- Germanovich, L.N.; Ring, L.M.; Carter, B.J.; Ingraffea, A.R.; Dyskin, A.V.; Ustinov, K.B. Simulation of crack growth and interaction in compression. In Proceedings of the Eighth International Conference on Rock Mechanics, Tokyo, Japan, 25–30 September 1995; Volume 1, pp. 219–226. [Google Scholar]
- Germanovich, L.N.; Carter, B.J.; Dyskin, A.V.; Ingraffea, A.R.; Lee, K.K. Mechanics of 3-D Crack Growth under Compressive Loads. In Proceedings of the Second North American Rock Mechanics Symposium: NARMS*96, Montreal, QC, Canada, 19–21 June 1996; pp. 1151–1160. [Google Scholar]
- Zhou, X.P.; Cheng, H.; Feng, Y.F. An experimental study of crack coalescence behavior in rock-like materials containing multiple flaws under uniaxial compression. Rock Mech. Rock Eng. 2014, 47, 1961–1986. [Google Scholar] [CrossRef]
- Zhao, Y.; Wang, C.L.; Teng, M.Y.; Bi, J. Observation on microstructure and shear behavior of mortar due to thermal shock. Cem. Concr. Compos. 2021, 121, 104106. [Google Scholar] [CrossRef]
- Dzienniak, D. The Influence of the Material Type and the Placement in the Print Chamber on the Roughness of MJF-Printed 3D Objects. Machines 2022, 10, 49. [Google Scholar] [CrossRef]
- Zhu, J.B.; Zhou, T.; Liao, Z.Y.; Sun, L.; Li, X.B.; Chen, R. Replication of internal defects and investigation of mechanical and fracture behavior of rock using 3D printing and 3D numerical methods in combination with X-ray computerized tomography. Int. J. Rock Mech. Min. Sci. 2018, 106, 198–212. [Google Scholar] [CrossRef]
- Zhou, T.; Zhu, J.B.; Xie, H.P. Mechanical and volumetric fracturing behavior of three-dimensional printing rock-like samples under dynamic loading. Rock Mech. Rock Eng. 2020, 53, 2855–2864. [Google Scholar] [CrossRef]
- Zhou, T.; Zhu, J.B.; Ju, Y.; Xie, H.P. Volumetric fracturing behavior of 3D printed artificial rocks containing single and double 3D internal flaws under static uniaxial compression. Eng. Fract. Mech. 2019, 205, 190–204. [Google Scholar] [CrossRef]
- Bi, J.; Zhou, X.P.; Xu, X.M. Numerical simulation of failure process of rock-like materials subjected to impact loads. Int. J. Geomech. 2017, 17, 04016073. [Google Scholar] [CrossRef]
- Bi, J.; Zhou, X.P.; Qian, Q.H. The 3D numerical simulation for the propagation process of multiple pre-existing flaws in rock-like materials subjected to biaxial compressive loads. Rock Mech. Rock Eng. 2016, 49, 1611–1627. [Google Scholar] [CrossRef]
- Han, W.; Jiang, Y.J.; Luan, H.J.; Du, Y.T.; Zhu, Y.G.; Liu, J.K. Numerical investigation on the shear behavior of rock-like materials containing fissure-holes with FEM-CZM method. Comput. Geotech. 2020, 125, 103670. [Google Scholar] [CrossRef]
- Zhang, Z.Y.; Jin, X.G.; Lin, S.Z.; Bi, J. Direct shear behavior of sulfate-exposed shotcrete: Experimental and modelling research. Constr. Build. Mater. 2019, 210, 607–619. [Google Scholar] [CrossRef]
- Kou, M.M.; Liu, X.R.; Tang, S.D.; Wang, Y.T. 3-D X-ray computed tomography on failure characteristics of rock-like materials under coupled hydro-mechanical loading. Theor. Appl. Fract. Mech. 2019, 104, 102396. [Google Scholar] [CrossRef]
- Modiriasari, A.; Bobet, A.; Laura, J.; Nolte, J. Seismic Wave Conversion Caused by Shear Crack Initiation and Growth. Rock Mech. Rock Eng. 2020, 53, 2805–2818. [Google Scholar] [CrossRef]
- Zhao, Y.L.; Zhang, L.Y.; Wang, W.J.; Pu, C.Z.; Wan, W.; Tang, J.Z. Cracking and stress–strain behavior of rock-like material containing two flaws under uniaxial compression. Rock Mech. Rock Eng. 2016, 49, 2665–2687. [Google Scholar] [CrossRef]
- Spetzler, H.; Sondergeld, C.; Sobolev, G.; Salov, B. Seismic and strain studies on large laboratory rock samples being stressed to failure. Tectonophysics 1987, 144, 55–68. [Google Scholar] [CrossRef]
- Su, G.; Shi, Y.; Feng, X.; Jiang, J.; Zhang, J.; Jiang, Q. True-triaxial experimental study of the evolutionary features of the acoustic emissions and sounds of rock burst processes. Rock Mech. Rock Eng. 2018, 51, 375–389. [Google Scholar] [CrossRef]
- Wang, C.L. Identification of early-warning key point for rock-mass instability using acoustic emission/micro seismic activity monitoring. Int. J. Rock Mech. Min. Sci. 2014, 71, 171–175. [Google Scholar] [CrossRef]
Publisher’s Note: MDPI stays neutral with regard to jurisdictional claims in published maps and institutional affiliations. |
© 2022 by the authors. Licensee MDPI, Basel, Switzerland. This article is an open access article distributed under the terms and conditions of the Creative Commons Attribution (CC BY) license (https://creativecommons.org/licenses/by/4.0/).