
High-Precision Laboratory Dryer for Characterization of the Drying Behavior of Agricultural and Food Products


Abstract
:
1. Introduction
2. Materials and Methods
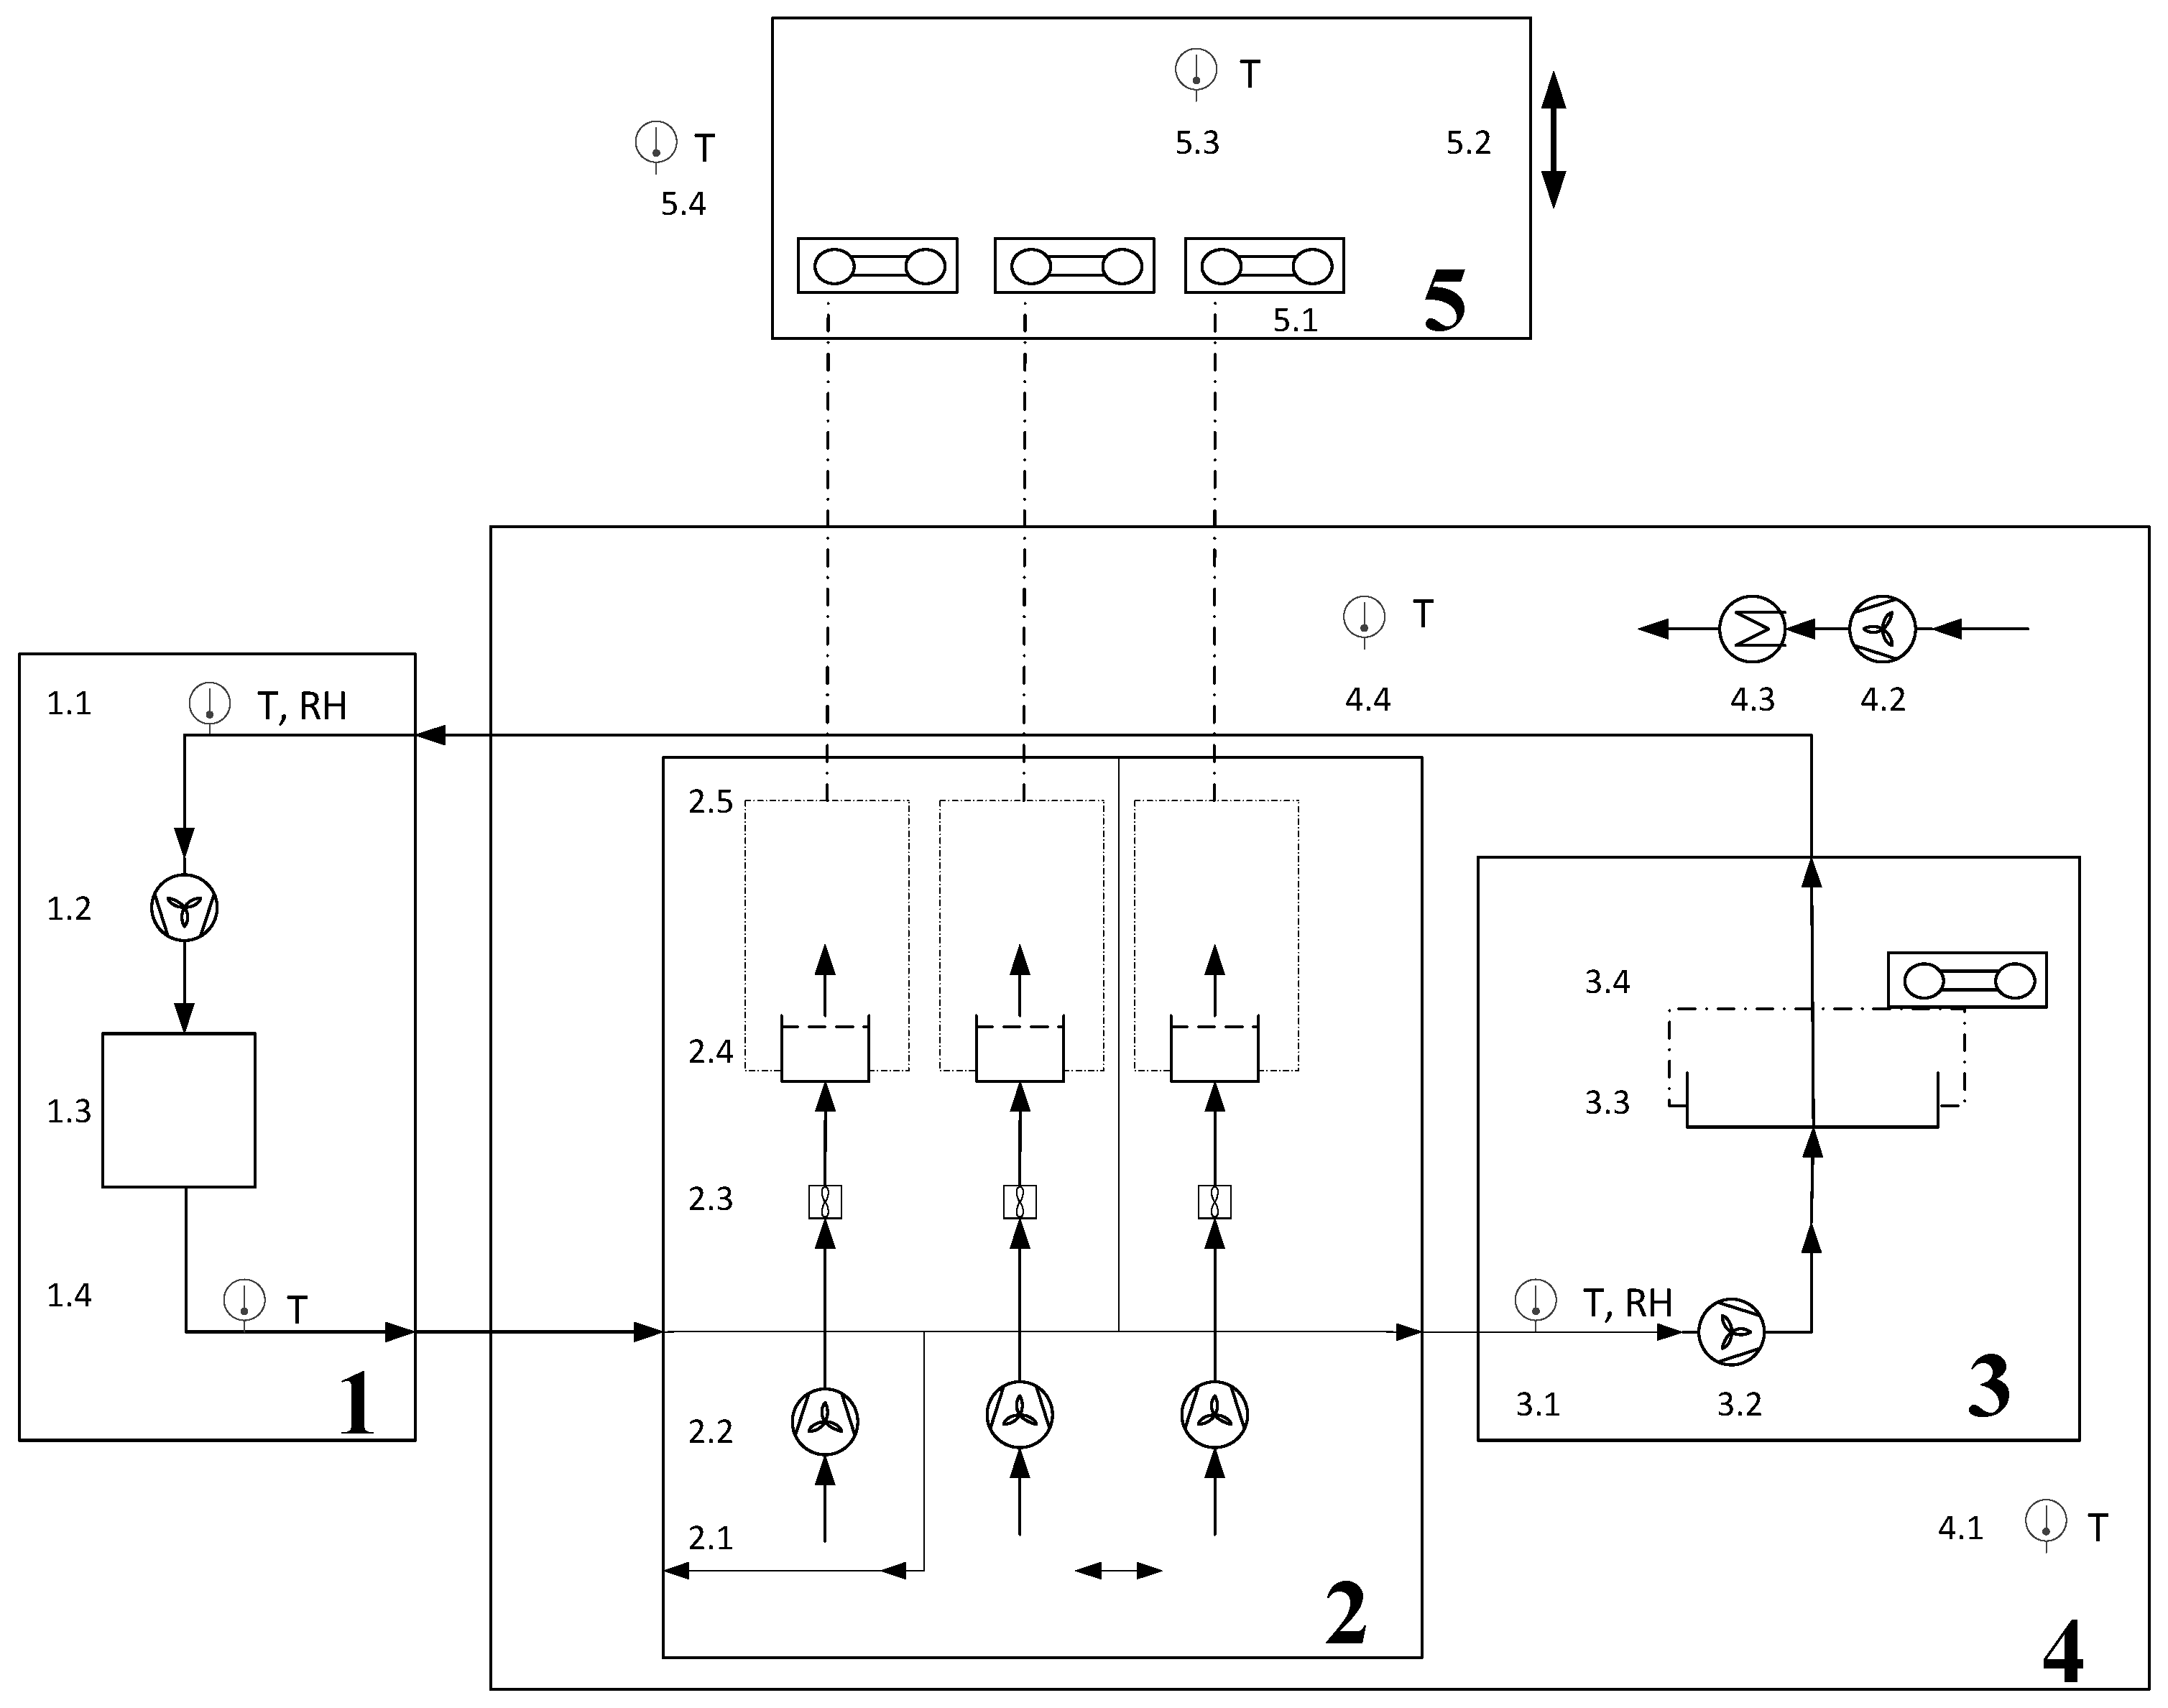
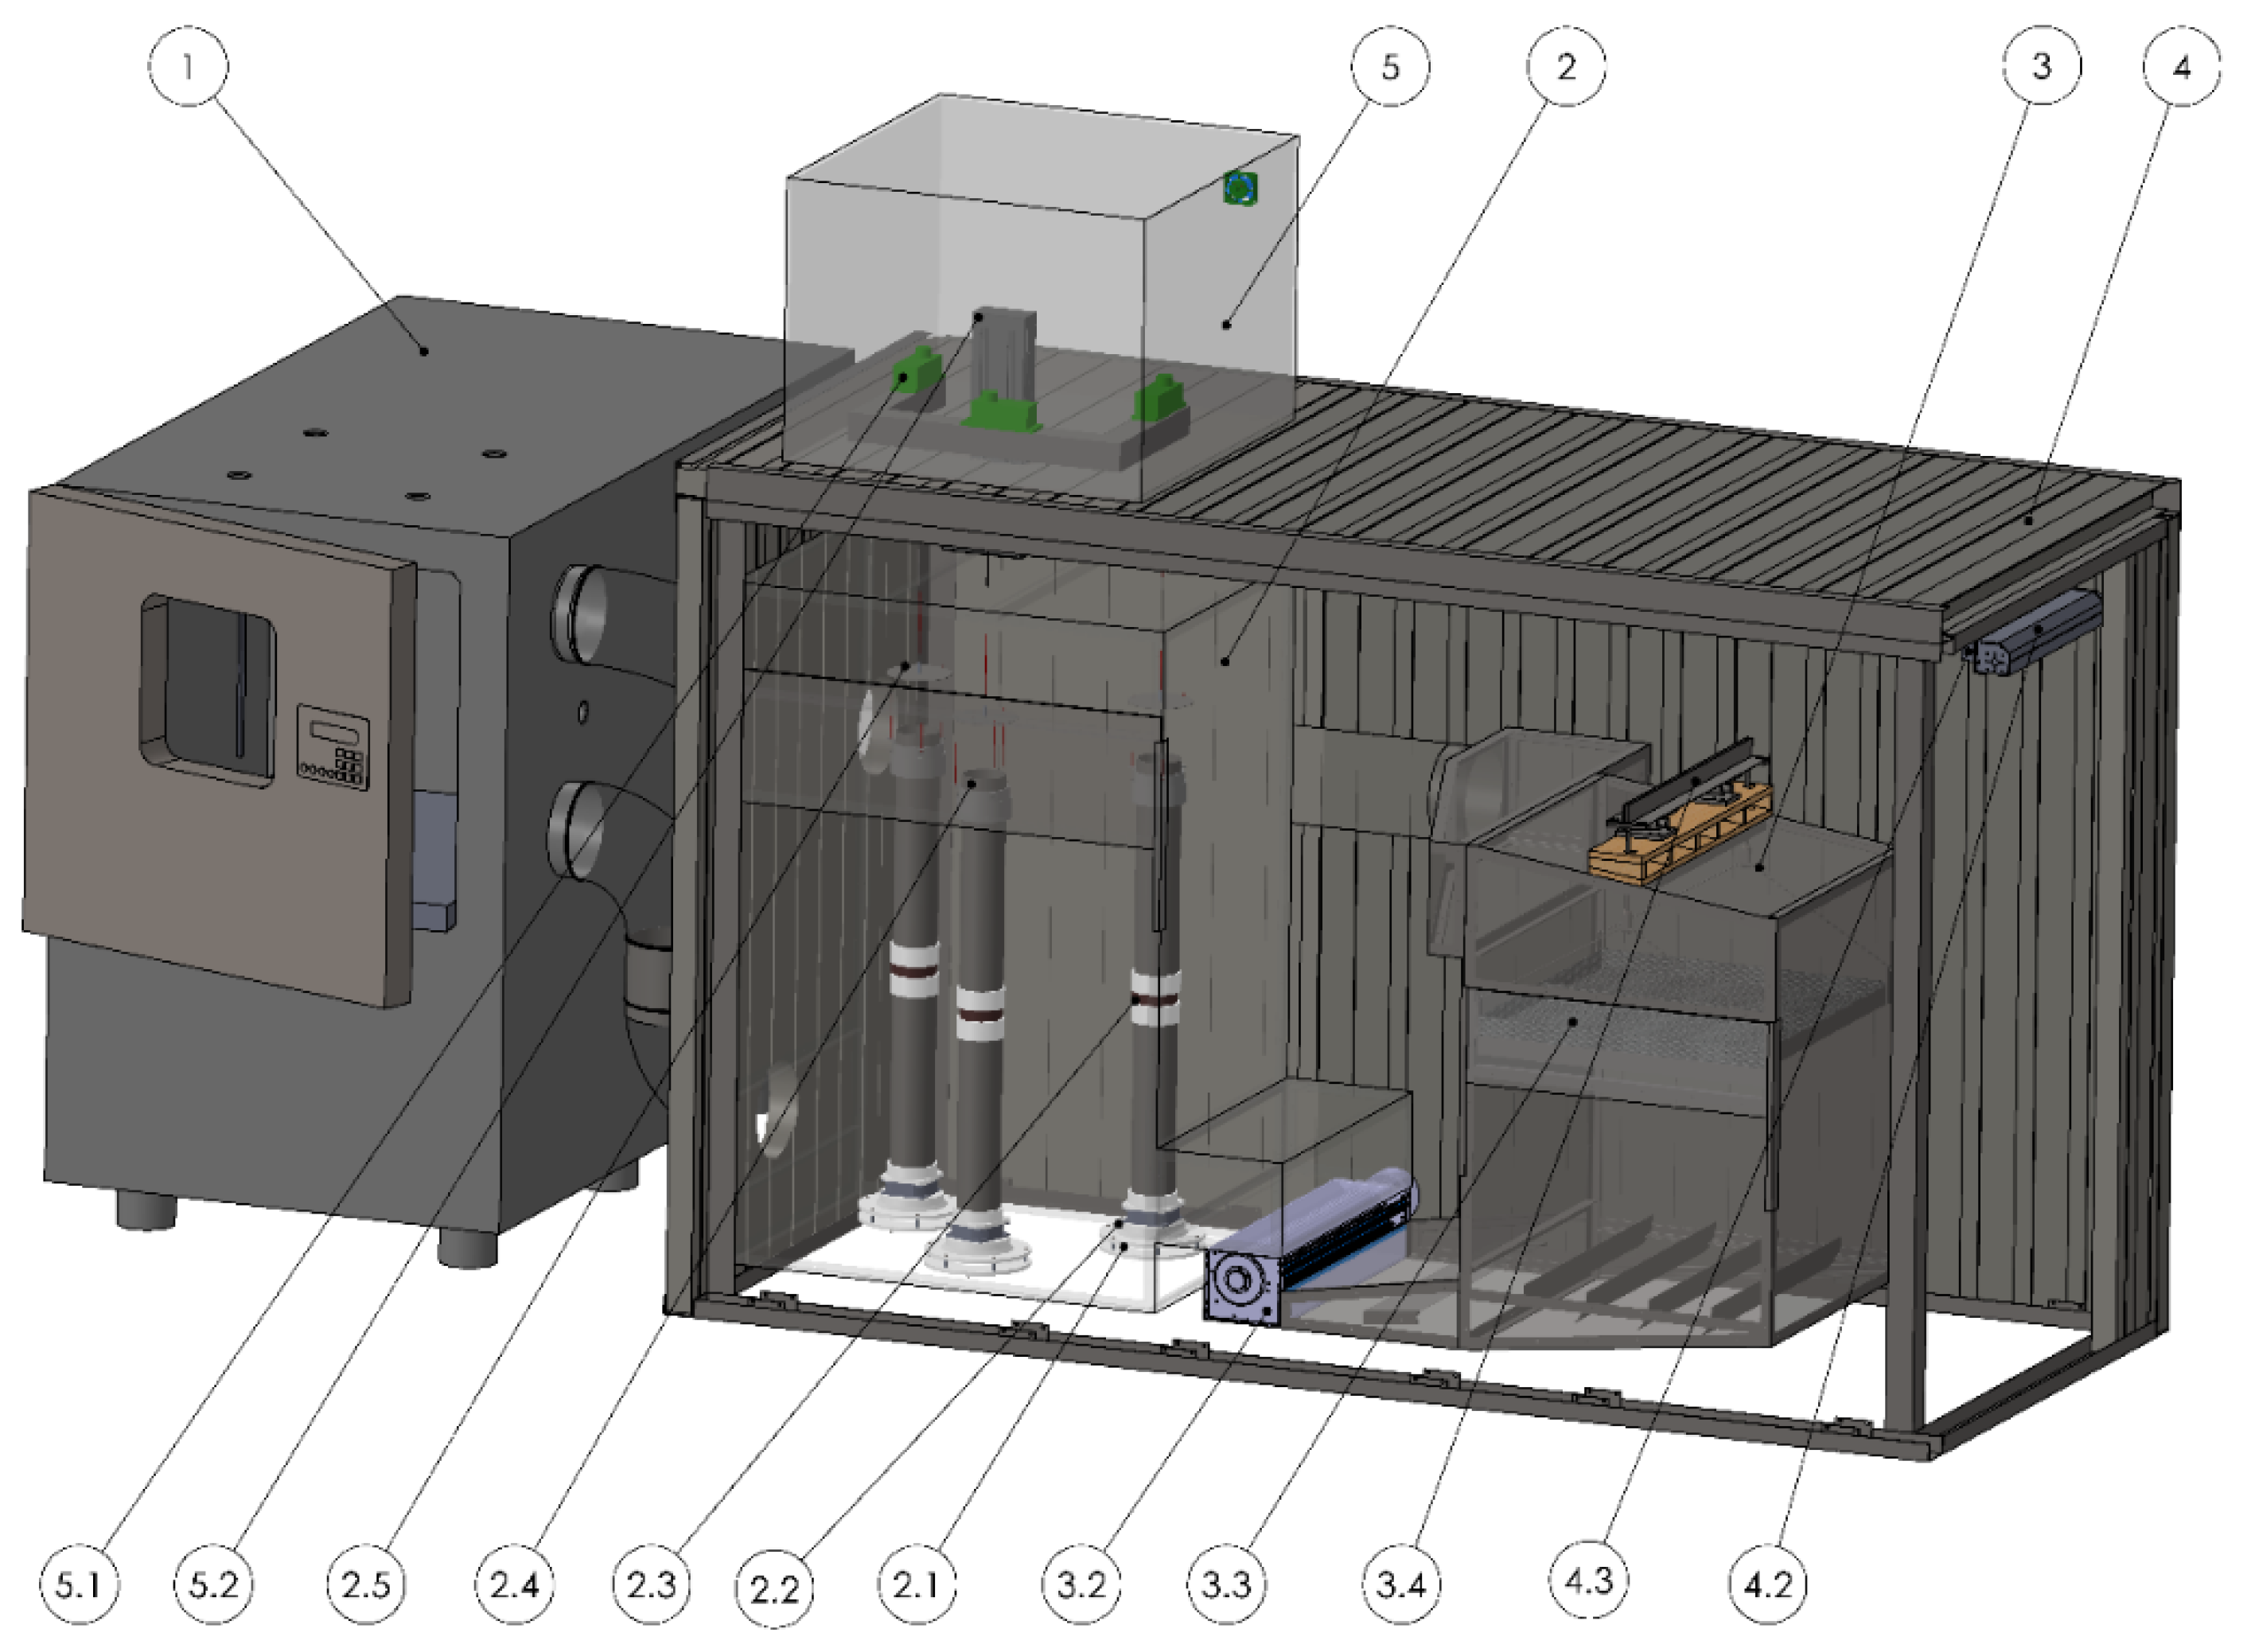
2.1. Design
2.1.1. Air-Conditioning Unit
2.1.2. High-Precision Drying Unit
2.1.3. Balance Unit
2.1.4. Flatbed Drying Unit
2.1.5. Heat-Loss Compensation Unit
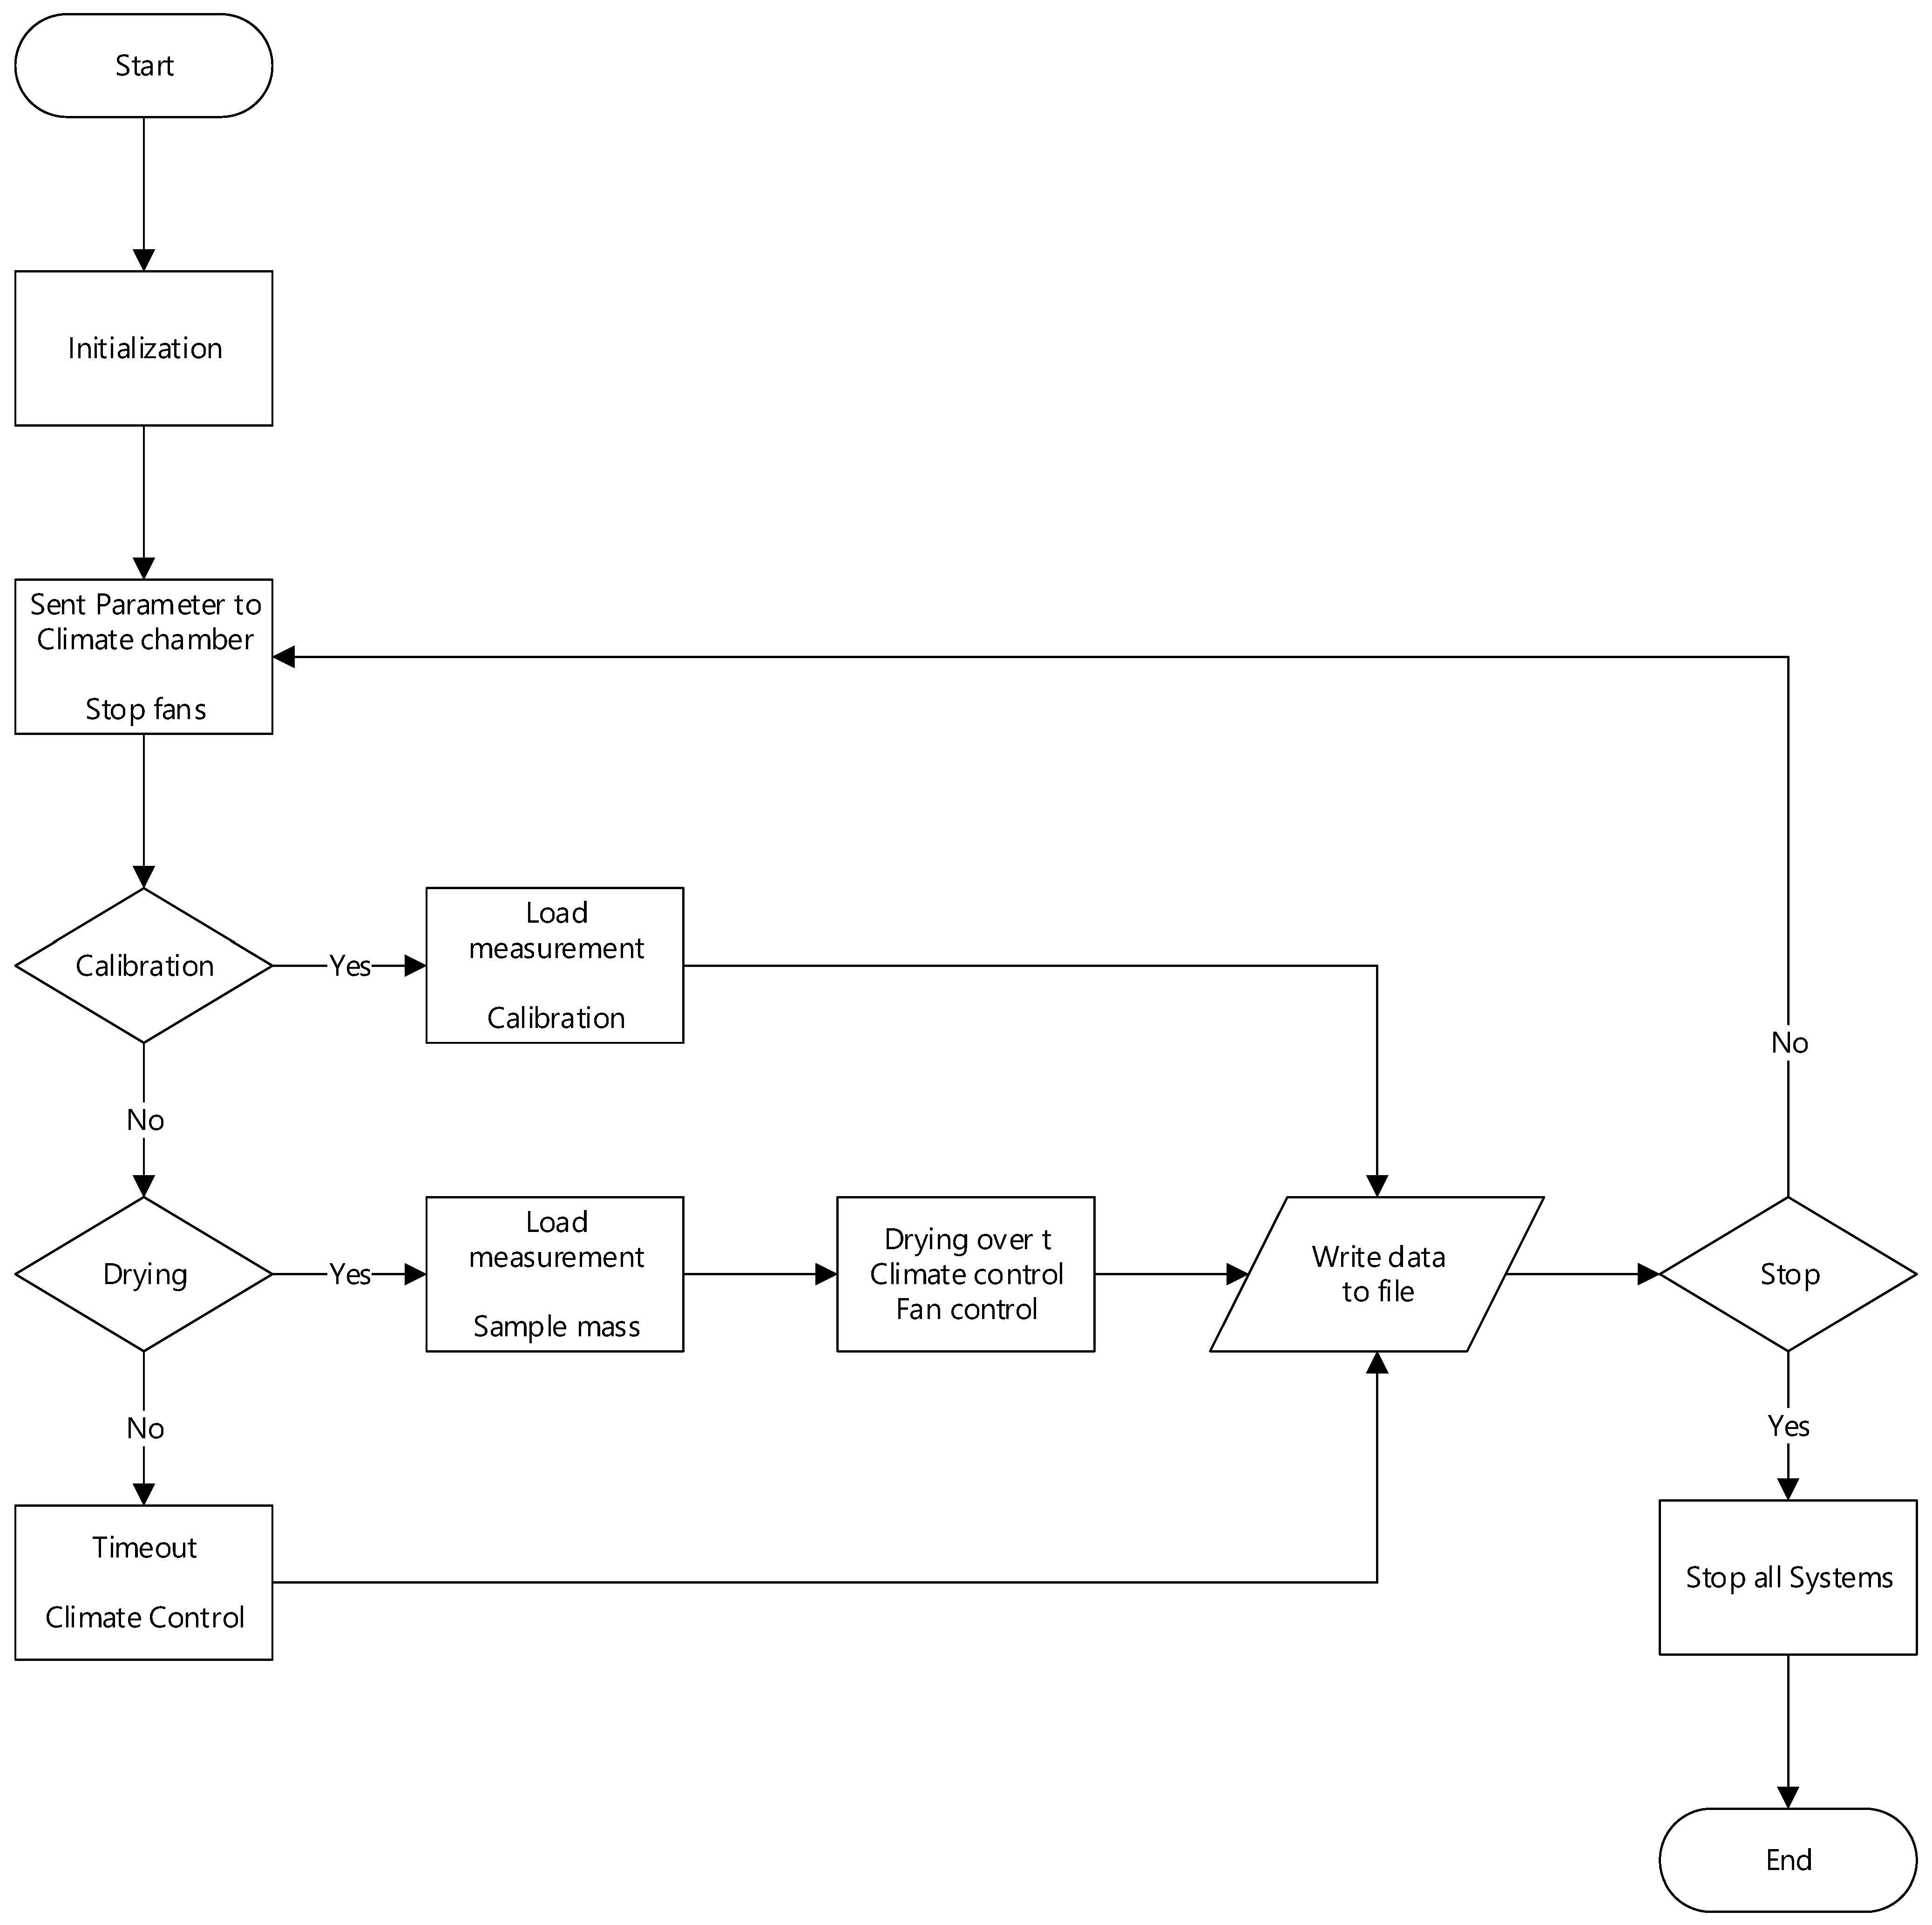
2.2. Operation of the Laboratory Dryer
3. Results
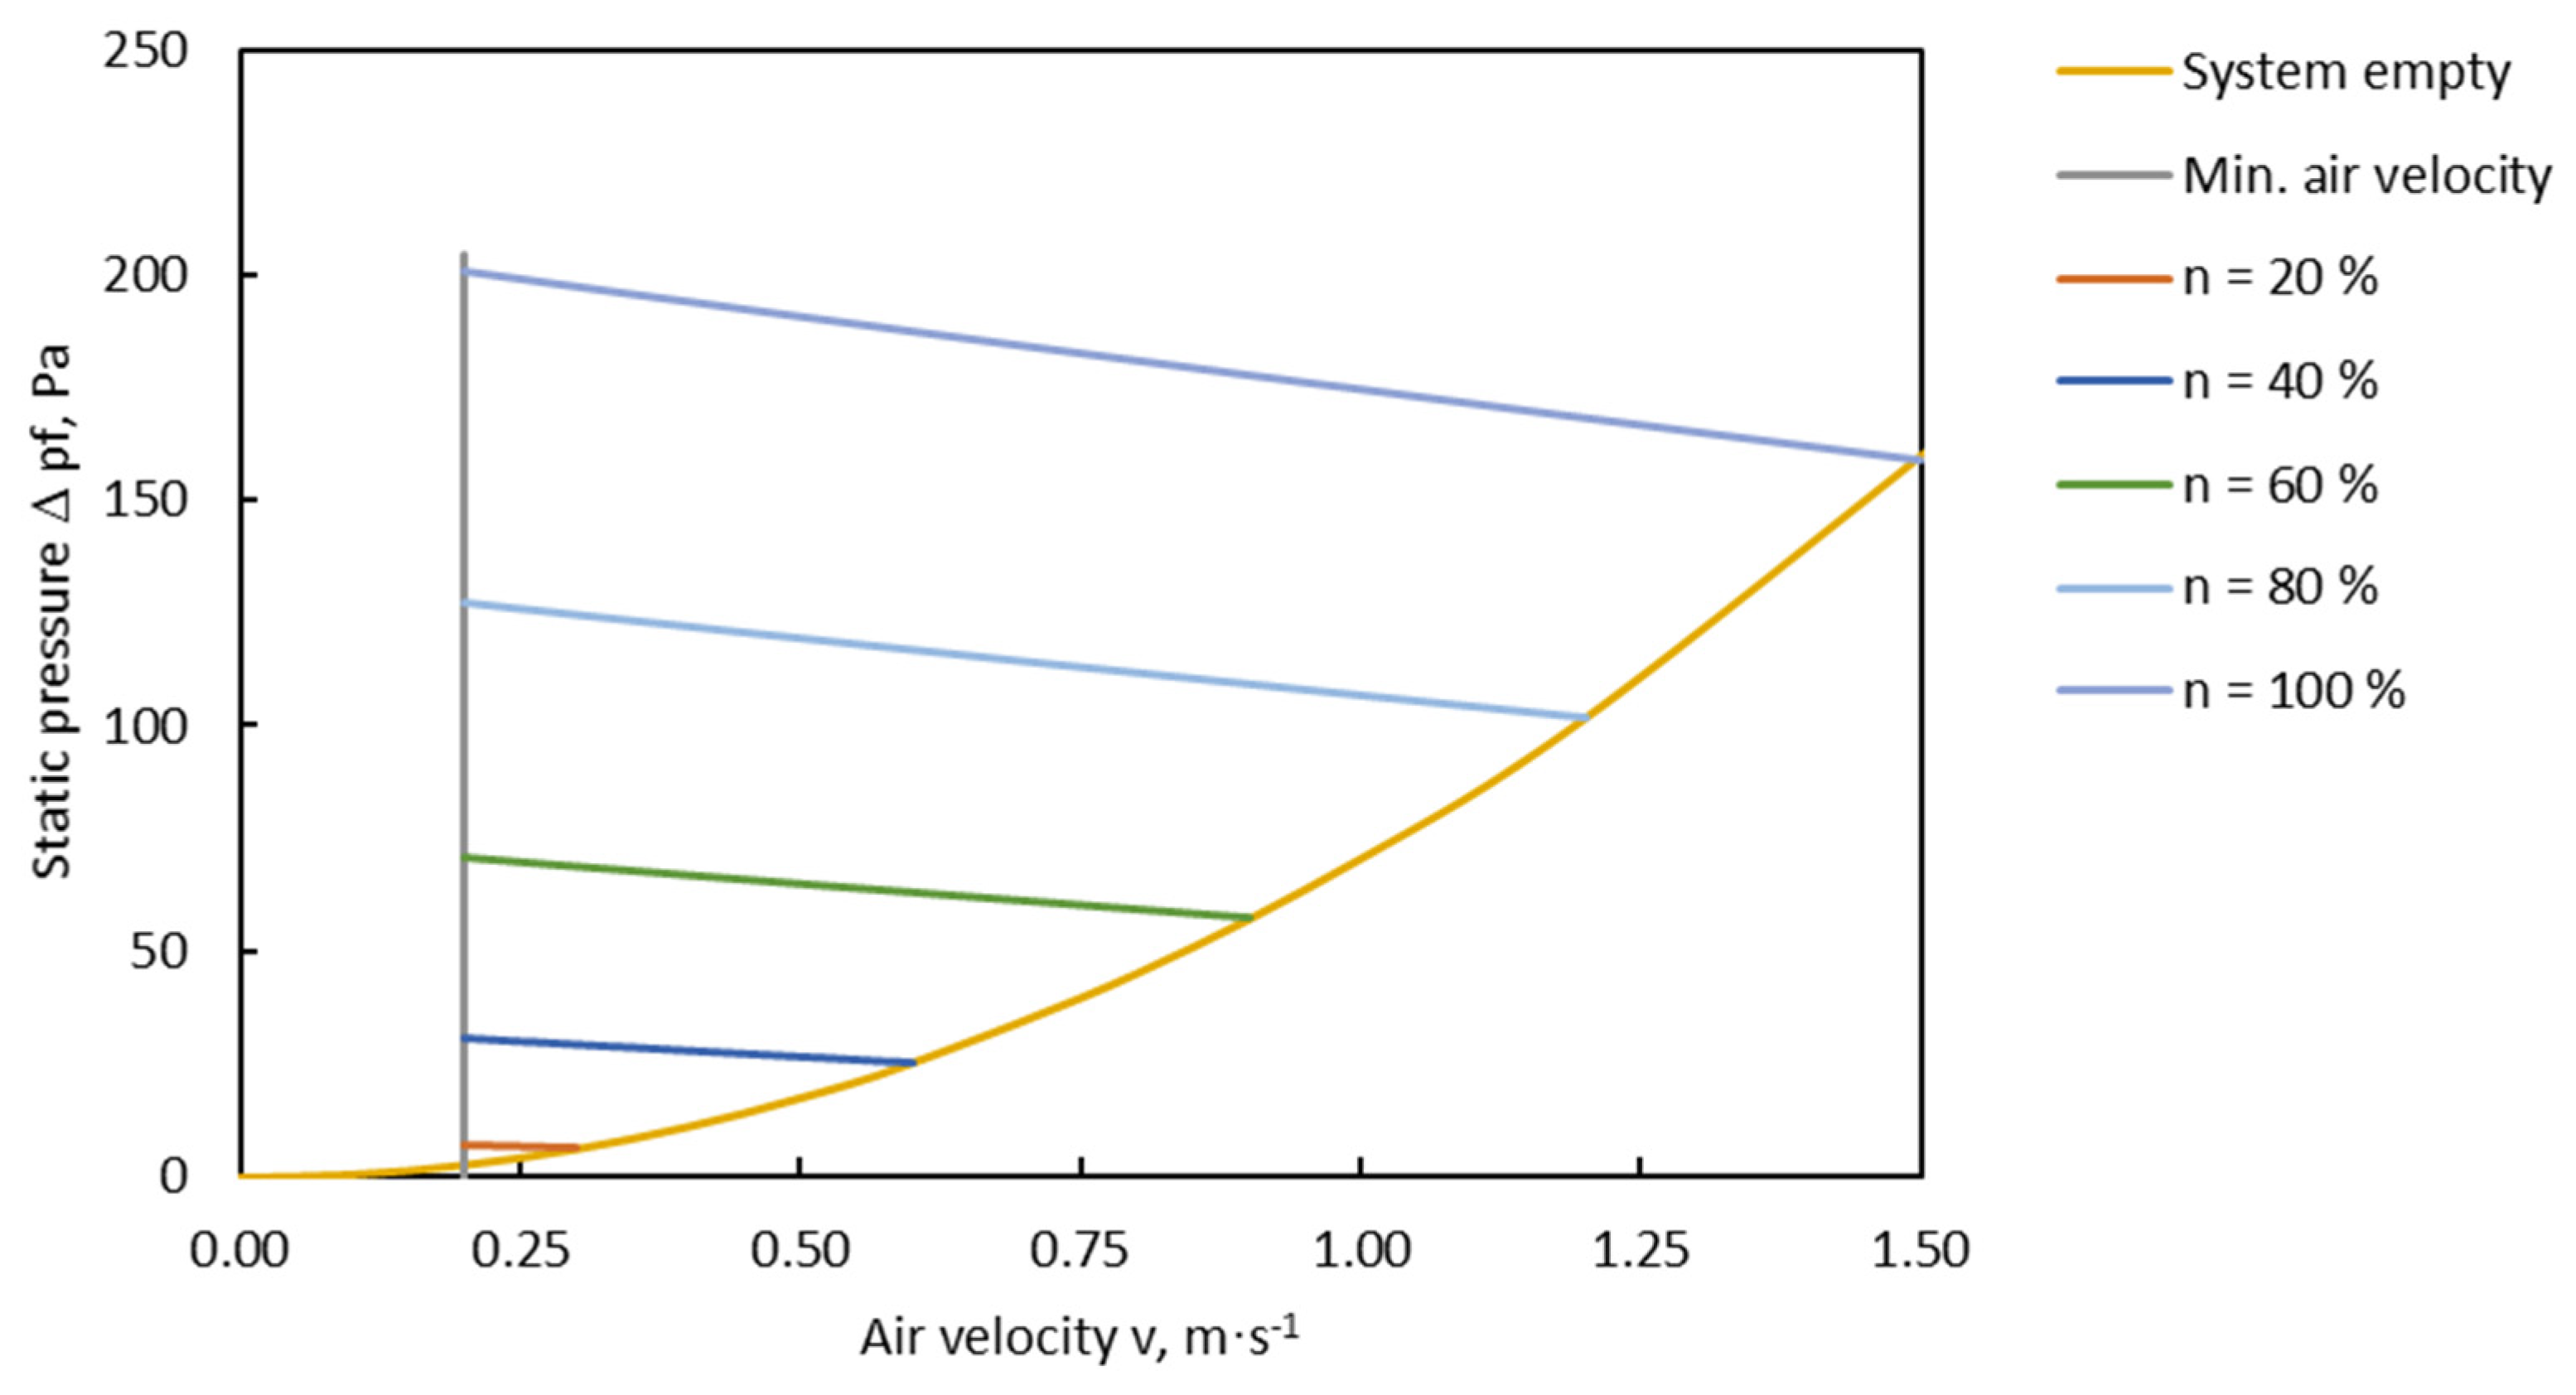
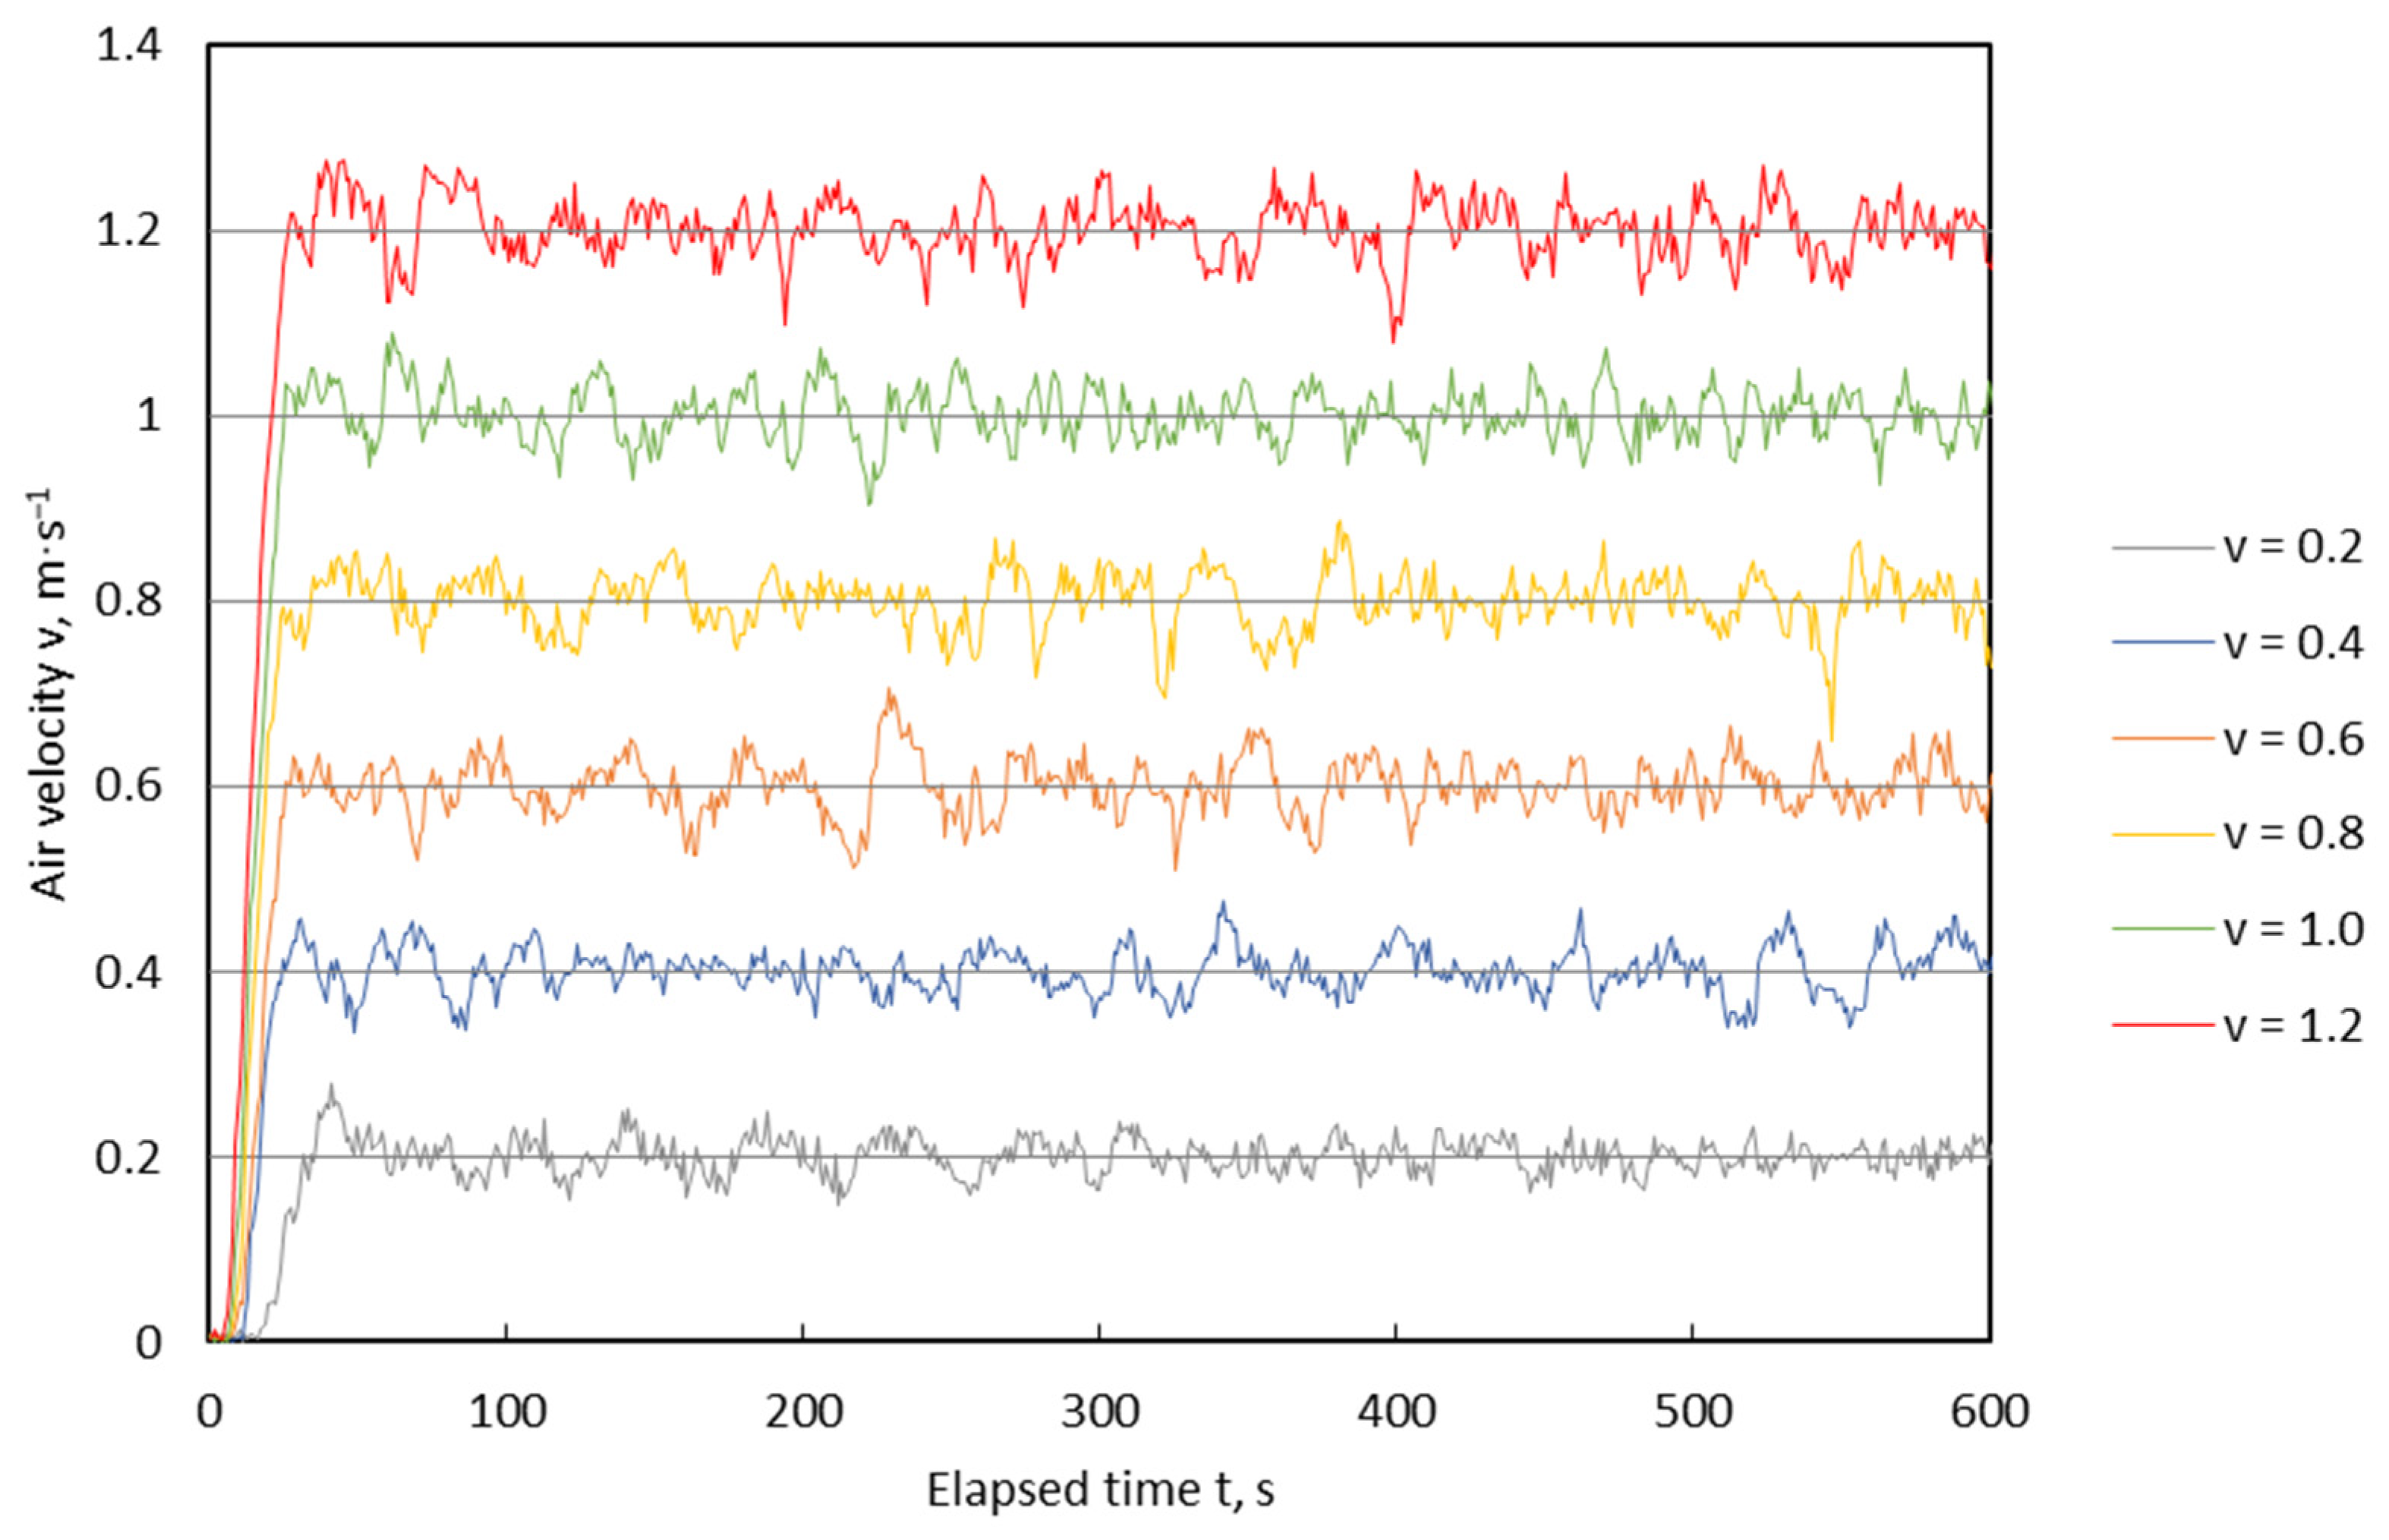
3.1. Calibration of Fan and Vane Anemometer
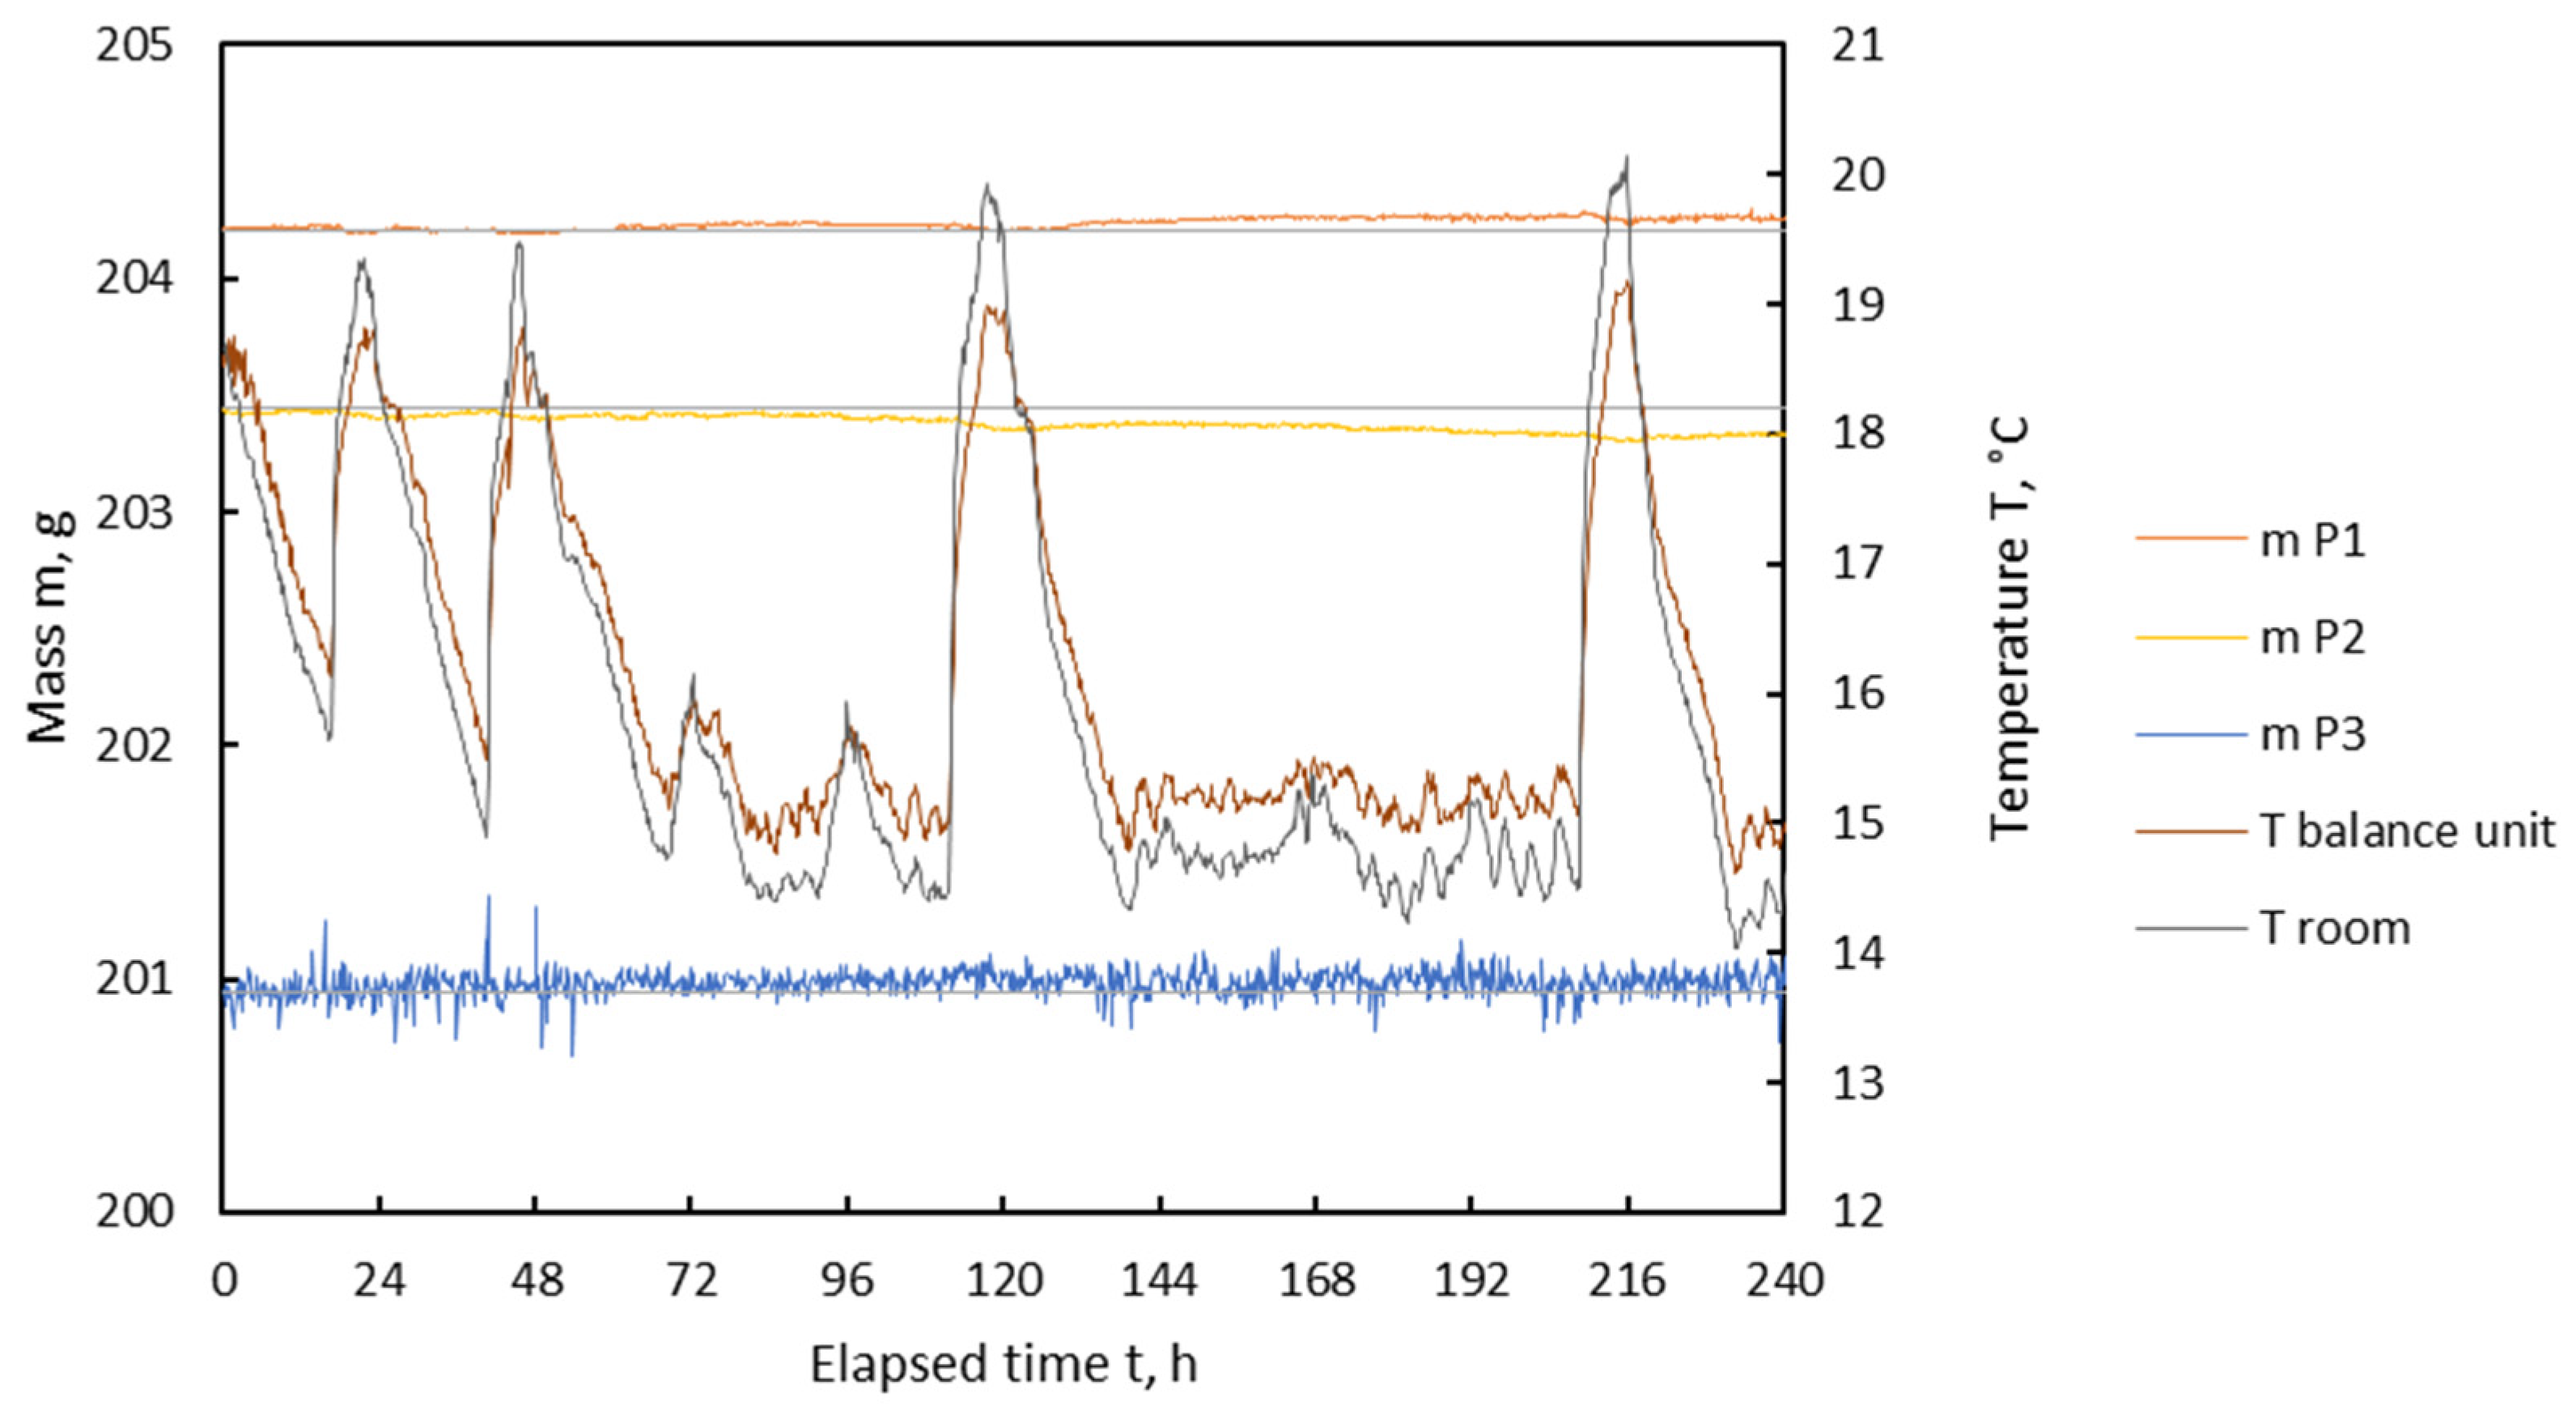
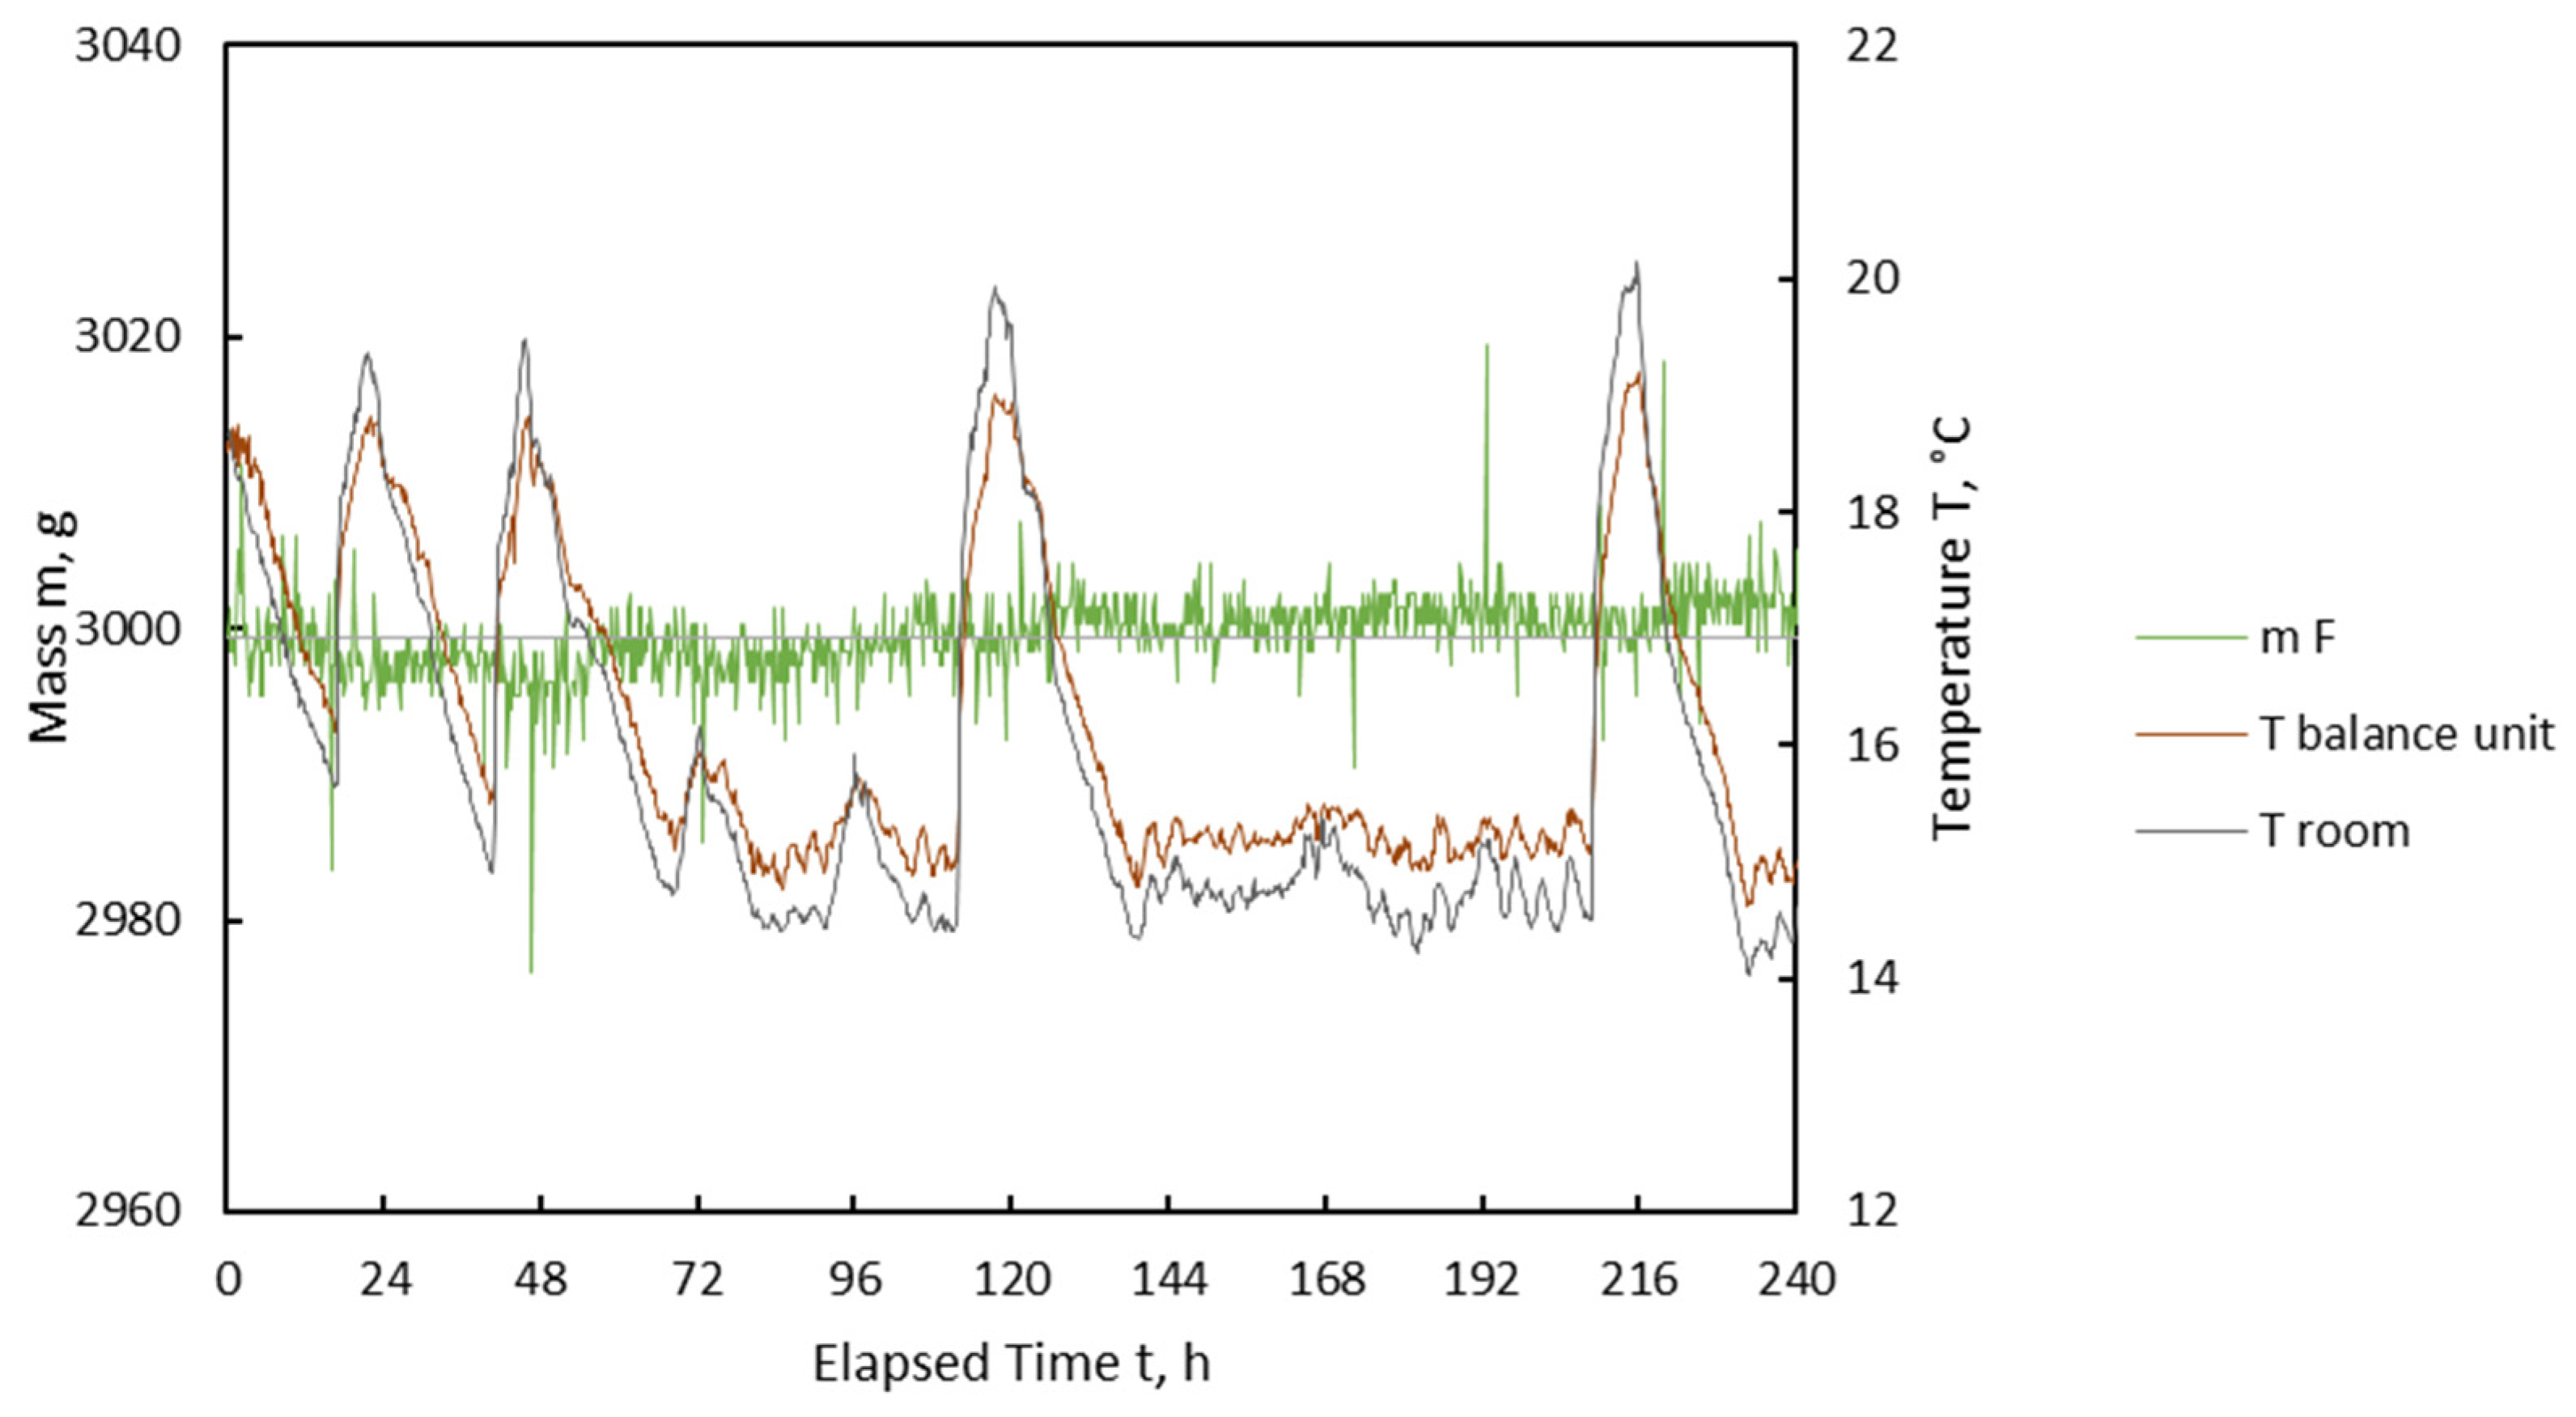
3.2. Calibration of Electronic Balances
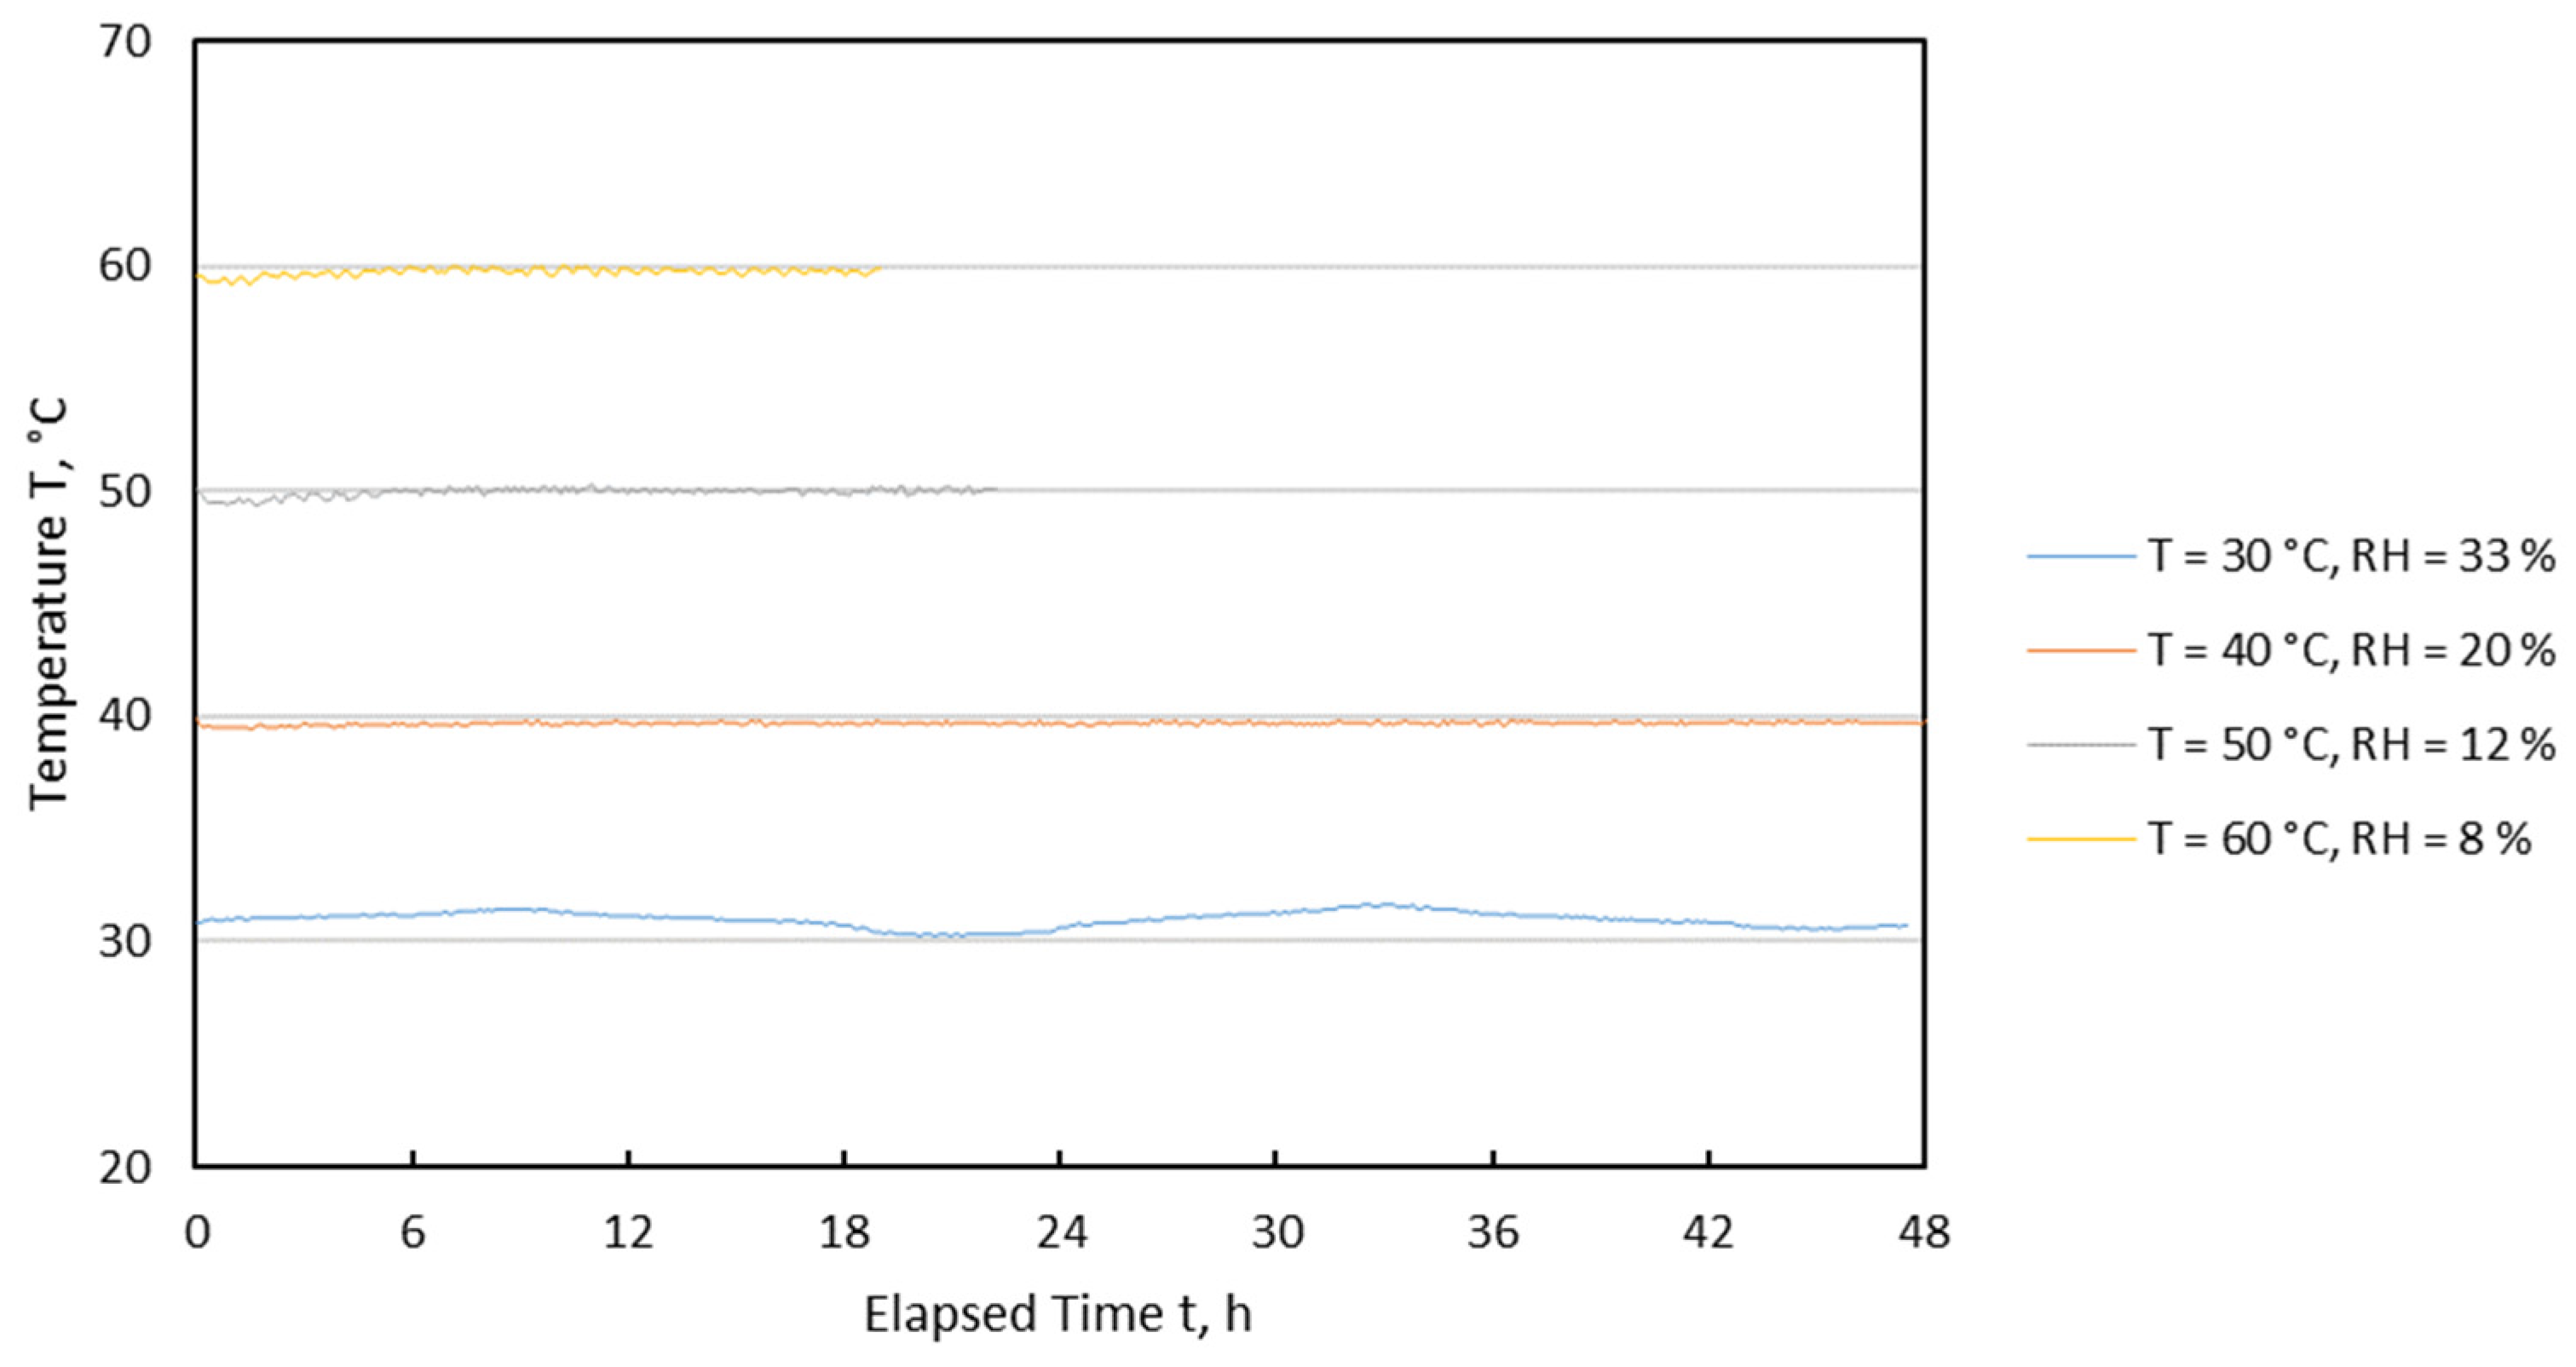
3.3. Validation
4. Discussion
5. Conclusions
Author Contributions
Funding
Institutional Review Board Statement
Informed Consent Statement
Data Availability Statement
Conflicts of Interest
Appendix A
Source File Repository
- HPD TF3+.EASMAssembly file for gaining an overview of the construction and operation. eDrawings is a free 3D viewer of 3DS: https://www.edrawingsviewer.com/download-edrawings (accessed on 10 November 2021).
- HPD TF3+_FullSW.zipSolidWorks files with all the components for reproduction or improvements;
- HPD TF3+.IGSIGS files with all the components for reproduction or improvements;
- 2021_HPD TF3+_Electrical.pdfElectrical circuits for the balance heating unit and the PWM control;
- HPD TF3+ Install.zipContains the installer for the control program and the LabView runtime engine for Microsoft Windows.

| Design File Name | File Type | Open Source License |
|---|---|---|
| HPD TF3+_FullSW.zip | zip//SolidWorks parts and assembly files | CC BY 4.0 |
| HPD TF3+.IGS | igs | CC BY 4.0 |
| HPD TF3+.EASM | easm | CC BY 4.0 |
| 2021_HPD TF3+_Electrical.pdf | CC BY 4.0 | |
| HPD TF3+ Install.zip | zip | CC BY 4.0 |
Appendix B
| # | Company | Location | Country | Type | Price/pcs (EUR) | Total (EUR) | |
|---|---|---|---|---|---|---|---|
| Climate chamber | 1 | CTS Clima Temperatur Systeme GmbH | Hechingen | D | C 10/1000 | 42,786.45 | 42,786.45 |
| Axial fan | 2.2 | ebm-papst Mulfingen GmbH & Co. KG | Mulfingen | D | Fan 4412/2HHP | 58.67 | 176.00 |
| Vane anemometer | 2.3 | LAMBRECHT meteo GmbH | Göttingen | D | 00.14680.020400 (1468) | 1432.56 | 4297.67 |
| Balance | 5.1 | Sartorius AG | Göttingen | D | WZA1203-N | 3558.10 | 10,674.30 |
| Linear lifting unit | 5.2 | isel Germany AG | Eichenzell | D | LES 6 | 1768.86 | 1768.86 |
| Balance | 3.4 | Minebea Intec GmbH | Hamburg | D | 2 × MP77/20 kg C3MR + 2 × MP97/00 N + MP 90/04+ MP 30/00 + MP 30/31, PR 1256/31 | 3105.90 | 3105.90 |
| Control technology | National Instruments Germany GmbH | München | D | NI cDAQ-9184, NI9215, NI9217, NI9401, NI9263 | 4394.02 | 4394.02 | |
| Converter | IC Intracom Vertriebs GmbH | Halver | D | PCI-RS232 Card Part No.: 158213 | 17.99 | 53.97 | |
| Control pc | D | PC with Windows 10 | 700.00 | 700.00 | |||
| Construction material | Esslinger Eisenlager GmbH | Esslingen | D | Steel | 2528.77 | 2528.77 | |
| Vibration damper | EFFBE GmbH | Bad Soden-Salmünster | D | LM 480 daN | 31.06 | 248.47 | |
| Vent pipe | ERO Edelstahl-Rohrtechnik GmbH | Salzwedel | D | Vent pipe | 501.55 | 501.55 | |
| Perforated plate | MEVACO GmbH | Göppingen | D | Perforated steel plate | 196.59 | 196.59 | |
| Cross-flow fan | 3.2 | LTG Aktiengesellschaft | Stuttgart | D | TMR 125/800/E | 2676.31 | 2676.31 |
| T sensors | 4.1, 4.4, 5.3, 5.4 | TMH Elektrotechnik GmbH | Ellerbek | D | 4* PT100 | 52.48 | 209.92 |
| Electrical parts | Conrad | D | Electrical parts | 750.00 | 750.00 | ||
| Sandwich panel | 4 | Ranrode GmbH | Wettin-Löbejün | D | Isopanels RANWAND K 80 Typ IP | 1022.93 | 1022.93 |
| Cross-flow fan | 4.2, 4.3 | LTG Aktiengesellschaft | Stuttgart | D | TAR h 60/615/24VDC 3 kW, 230 V | 702.10 | 702.10 |
| Total (EUR) | 76,793.81 |
References
- Komonsing, N.; Reyer, S.; Khuwijitjaru, P.; Mahayothee, B.; Müller, J. Drying Behavior and Curcuminoids Changes in Turmeric Slices during Drying under Simulated Solar Radiation as Influenced by Different Transparent Cover Materials. Foods 2022, 11, 696. [Google Scholar] [CrossRef] [PubMed]
- Ntwali, J.; Schock, S.; Romuli, S.; Chege, C.; Banadda, N.; Aseru, G.; Müller, J. Performance Evaluation of an Inflatable Solar Dryer for Maize and the Effect on Product Quality Compared with Direct Sun Drying. Appl. Sci. 2021, 11, 7074. [Google Scholar] [CrossRef]
- Heindl, A. Praxisbuch Bandtrocknung; Springer Vieweg: Heidelberg, Germany, 2016. [Google Scholar]
- Jain, D.; Pathare, P. Selection and Evaluation of Thin Layer Drying Models for Infrared Radiative and Convective Drying of Onion Slices. Biosyst. Eng. 2004, 89, 289–296. [Google Scholar] [CrossRef]
- Esmaiili, M.; Sotudeh-Gharebagh, R.; Mousavi, M.A.; Rezazadeh, G. Influence of dipping on thin-layer drying characteristics of seedless grapes. Biosyst. Eng. 2007, 98, 411–421. [Google Scholar] [CrossRef]
- Ghnimi, T.; Hassini, L.; Bagane, M. Experimental study of water desorption isotherms and thin-layer convective drying kinetics of bay laurel leaves. Heat Mass Transf. 2016, 52, 2649–2659. [Google Scholar] [CrossRef]
- Lopez, A.; Iguaz, A.; Esnoz, A.; Virseda, P. Thin-layer drying behaviour of vegetable wastes from wholesale market. Dry. Technol. 2000, 18, 995–1006. [Google Scholar] [CrossRef]
- Sonmete, M.H.; Mengeş, H.O.; Ertekin, C.; Özcan, M.M. Mathematical modeling of thin layer drying of carrot slices by forced convection. J. Food Meas. Charact. 2016, 11, 629–638. [Google Scholar] [CrossRef]
- Xanthopoulos, G.; Lambrinos, G.; Manolopoulou, H. Evaluation of Thin-Layer Models for Mushroom (Agaricus bisporus) Drying. Dry. Technol. 2007, 25, 1471–1481. [Google Scholar] [CrossRef]
- Goyal, R.; Kingsly, A.; Manikantan, M.; Ilyas, S. Thin-layer Drying Kinetics of Raw Mango Slices. Biosyst. Eng. 2006, 95, 43–49. [Google Scholar] [CrossRef]
- Fang, S.; Wang, Z.; Hu, X. Hot air drying of whole fruit Chinese jujube (Zizyphus jujuba Miller): Thin-layer mathematical modelling. Int. J. Food Sci. Technol. 2009, 44, 1818–1824. [Google Scholar] [CrossRef]
- Ajibola, O. Thin-layer drying of melon seed. J. Food Eng. 1989, 9, 305–320. [Google Scholar] [CrossRef]
- Dotto, G.L.; Meili, L.; Tanabe, E.H.; Chielle, D.P.; Moreira, M.F.P. Evaluation of the mass transfer process on thin layer drying of papaya seeds from the perspective of diffusive models. Heat Mass Transf. 2017, 54, 463–471. [Google Scholar] [CrossRef]
- Mocelin, B.; Oliveira, D.L.; Chielle, D.P.; Tanabe, E.H.; Bertuol, D.A.; Schwaab, M.; Meili, L. Mathematical Modeling of Thin Layer Drying of Papaya Seeds in a Tunnel Dryer Using Particle Swarm Optimization Method. Part. Sci. Technol. 2014, 32, 123–130. [Google Scholar] [CrossRef]
- Bengtsson, P.; Sanati, M. Evaluation of hydrocarbon emissions from heart- and sapwood of Scots pine using a laboratory-scale wood drier. Holzforschung 2004, 58, 660–665. [Google Scholar] [CrossRef]
- Mirahmadi, S.F.; Norouzi, R. Influence of Thin Layer Drying on the Essential Oil Content and Composition of Lavandula officinalis. J. Essent. Oil Bear. Plants 2016, 19, 1537–1546. [Google Scholar] [CrossRef]
- Reyer, S.; Awiszus, S.; Meissner, K.; Müller, J. High precision laboratory dryer for thin layer and bulk drying with adjustable temperature, relative humidity and velocity of the drying air. HardwareX 2020, 8, e00133. [Google Scholar] [CrossRef] [PubMed]
- VDI. Measurement of Fluid Flow with Primary Devices. In Orifice Plates and Nozzles for Special Applications; VDI: Düsseldorf, Germany, 1991; p. 2041. [Google Scholar]
- Duc, L.A.; Han, J.W.; Keum, D.H. Thin layer drying characteristics of rapeseed (Brassica napus L.). J. Stored Prod. Res. 2011, 47, 32–38. [Google Scholar] [CrossRef]
- Doymaz, I.; Gorel, O.; Akgun, N. Drying Characteristics of the Solid By-product of Olive Oil Extraction. Biosyst. Eng. 2004, 88, 213–219. [Google Scholar] [CrossRef]
| Description | |
|---|---|
| 1 | Air-conditioning unit |
| 1.1 | T and RH sensor |
| 1.2 | Controllable fan |
| 1.3 | Air conditioning inside the climate chamber |
| 2 | High-precision drying unit |
| 2.1 | Radial air inlet of drying column |
| 2.2 | Axial fan |
| 2.3 | Vane anemometer |
| 2.4 | Sample tray with through flow |
| 2.5 | Traverse with nylon strings |
| 3 | Area drying unit |
| 3.1 | T and RH sensor |
| 3.2 | Cross-flow fan |
| 3.3 | Sample tray with through flow |
| 3.4 | Traverse with bending beam load cells |
| 4 | Heat-loss compensation unit |
| 4.1 | T sensor |
| 4.2 | Cross-flow fan |
| 4.3 | Electrical heater |
| 4.4 | T sensor |
| 5 | Balance unit |
| 5.1 | High-precision load cells |
| 5.2 | Linear lifting unit |
| 5.3 | T sensor |
| 5.4 | T sensor, ambient |
| vset m·s−1 | vmin m·s−1 | vmax m·s−1 | MAPE (v) % |
|---|---|---|---|
| 0.2 | 0.09 | 0.34 | 7.46 |
| 0.4 | 0.24 | 0.58 | 4.92 |
| 0.6 | 0.43 | 0.78 | 3.91 |
| 0.8 | 0.51 | 0.99 | 3.07 |
| 1.0 | 0.80 | 1.23 | 2.29 |
| 1.2 | 0.92 | 1.44 | 2.08 |
| Balance | Tset °C | RHset % | mcal g | mmin g | mmax g | MAPE (m) % |
|---|---|---|---|---|---|---|
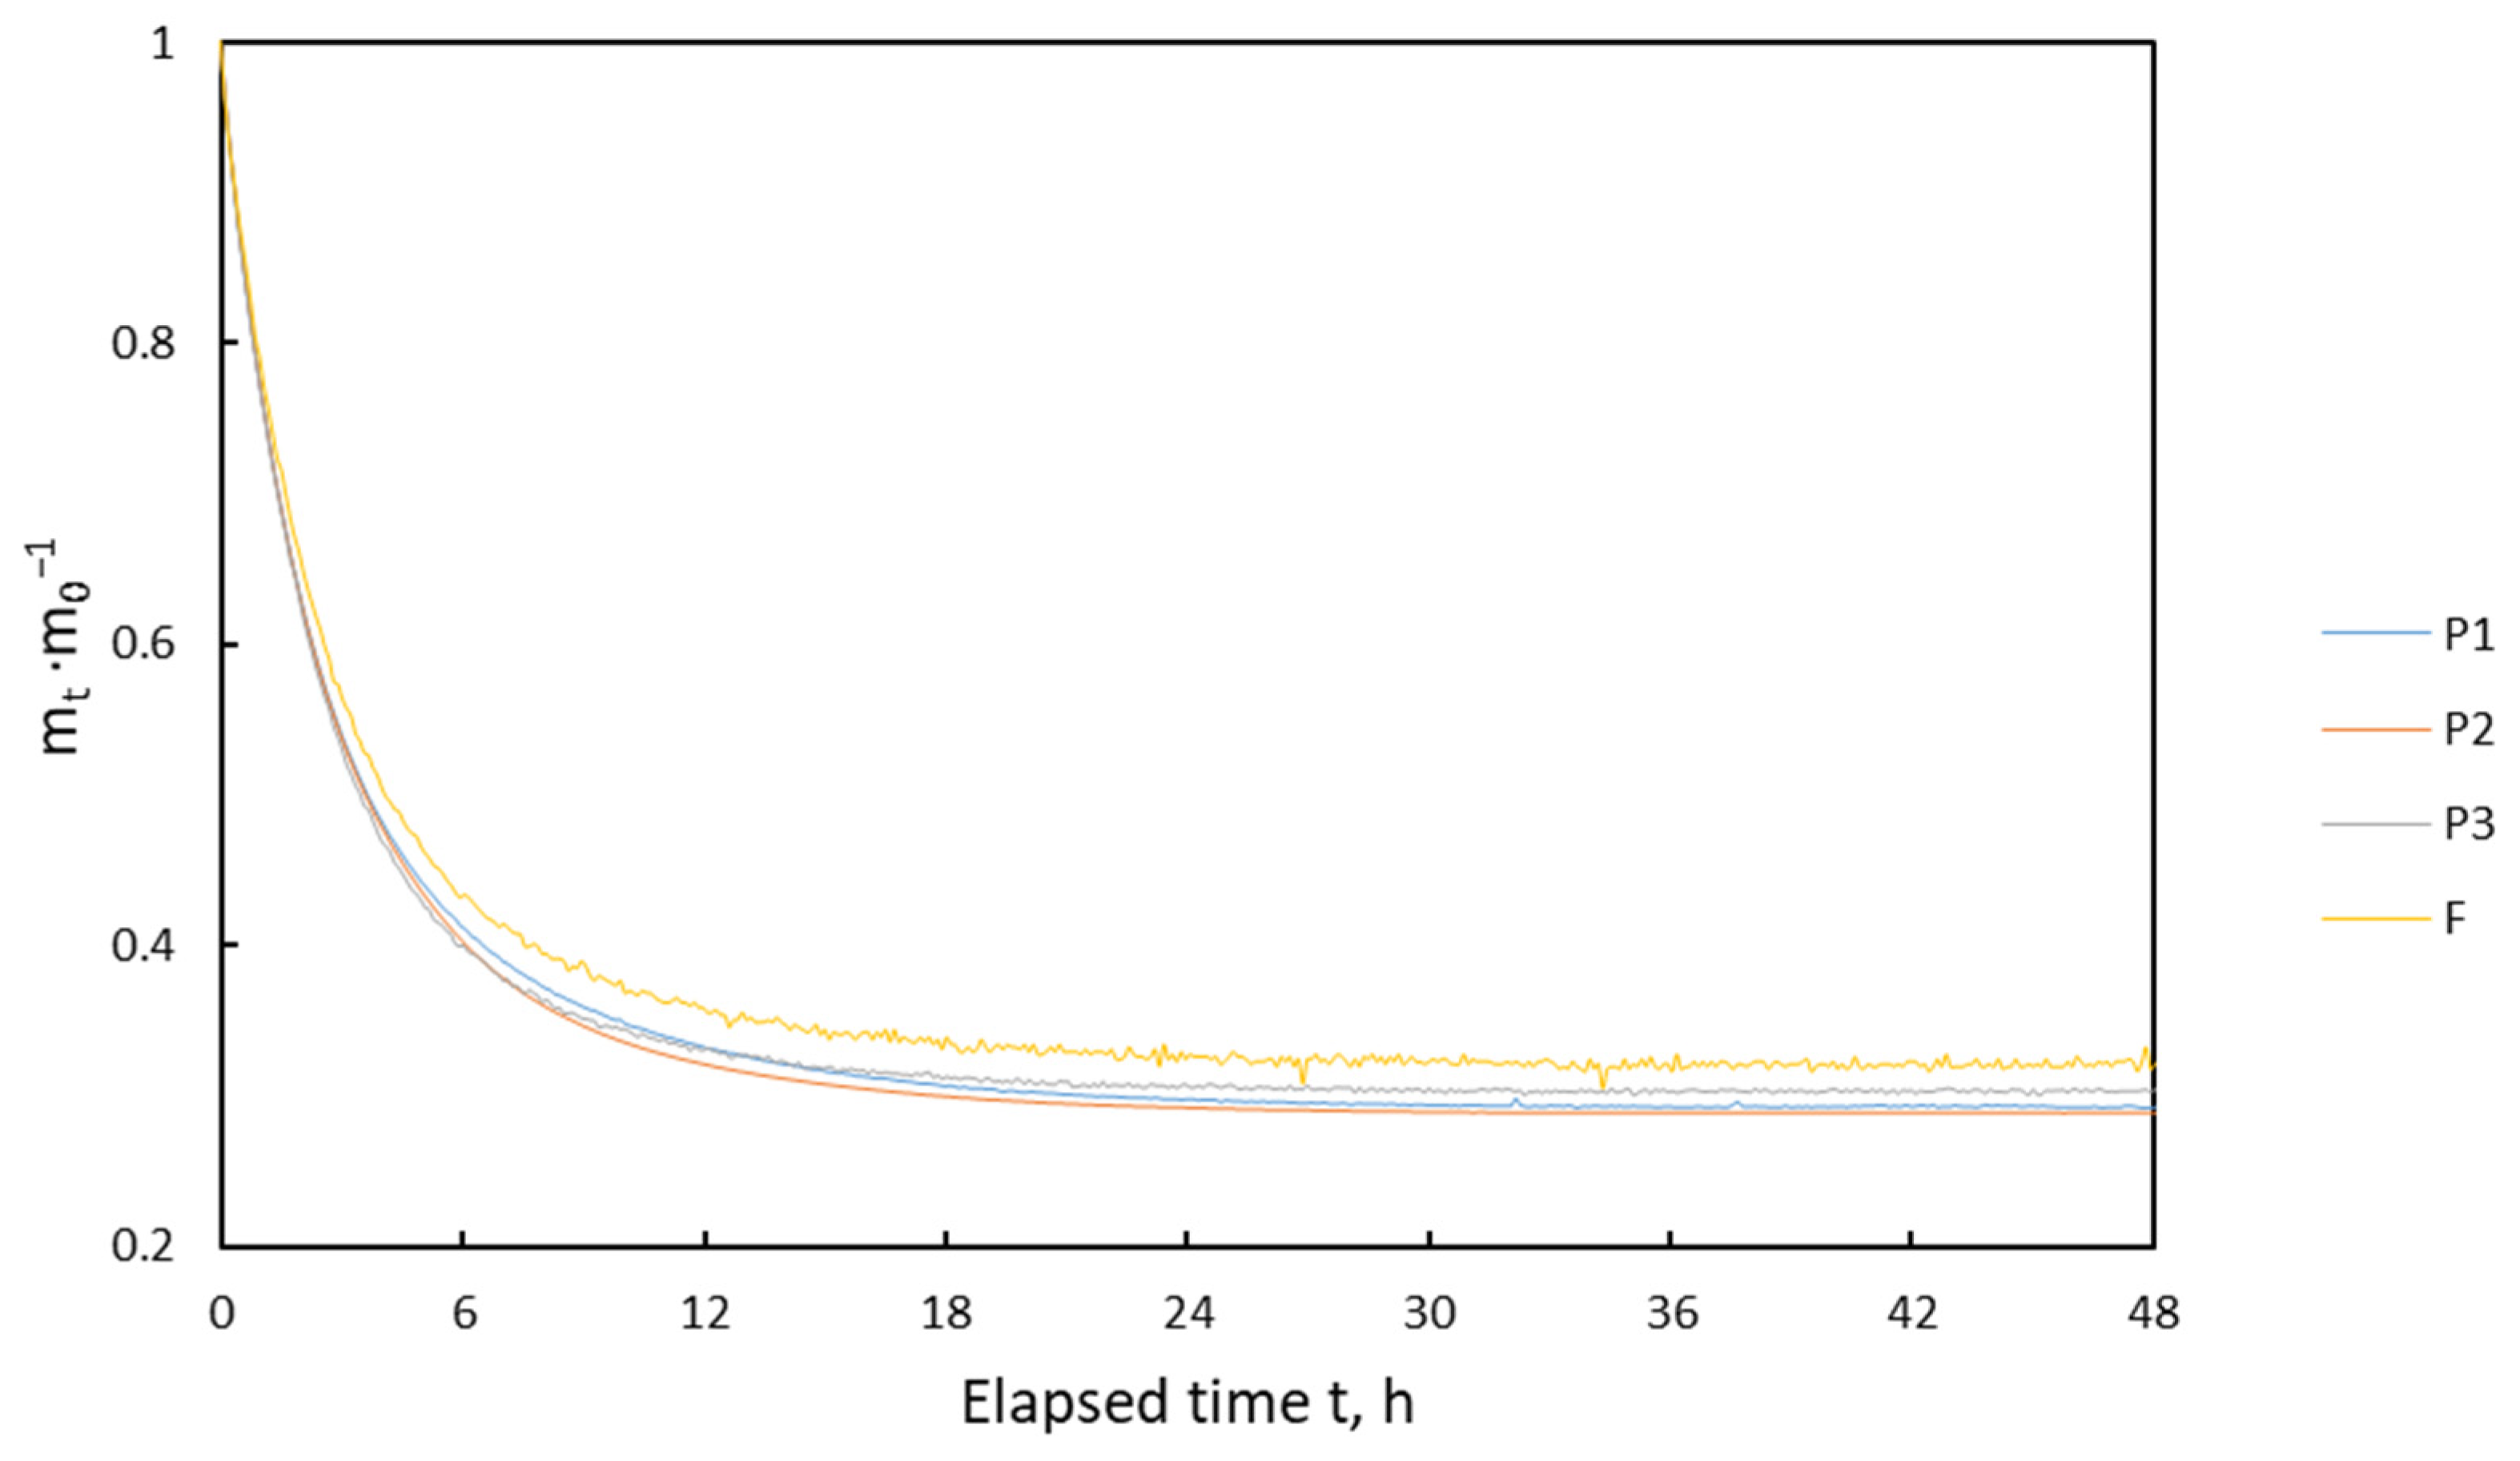
| P1 | 30 | 33 | 204.21 | 204.18 | 204.30 | 0.01 |
| P2 | 30 | 33 | 203.44 | 203.26 | 203.44 | 0.03 |
| P3 | 30 | 33 | 200.94 | 200.67 | 201.36 | 0.03 |
| F | 30 | 33 | 2999 | 2976 | 3019 | 0.06 |
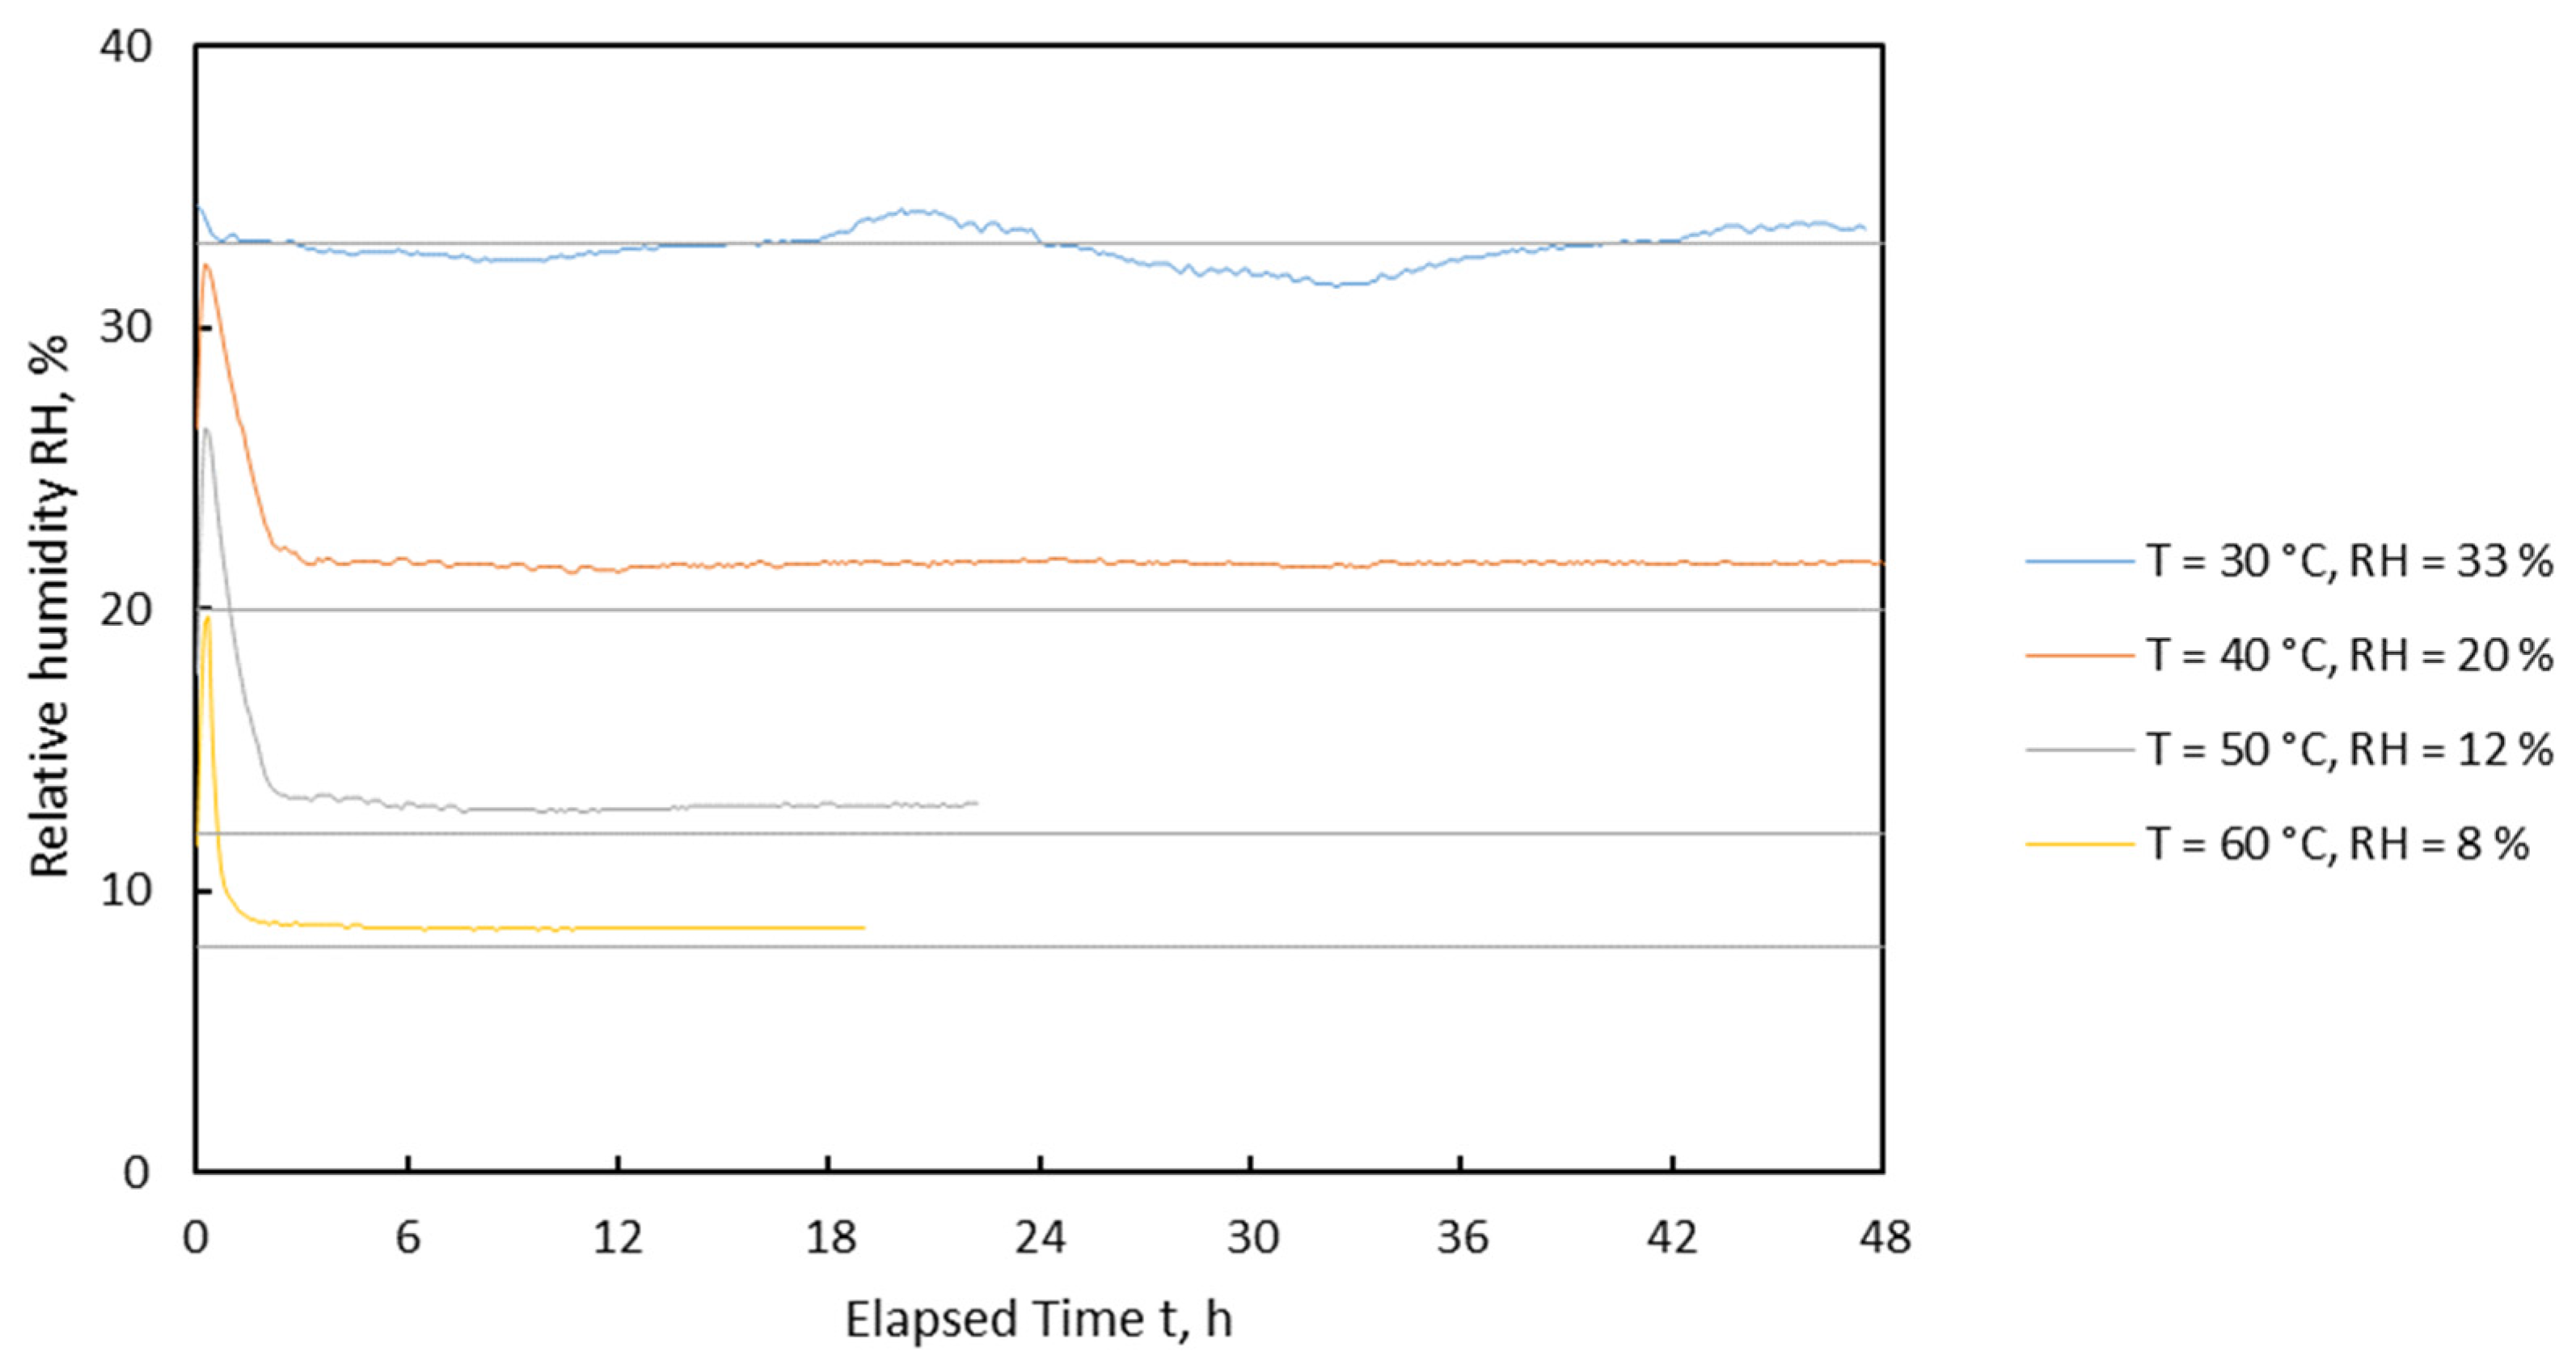
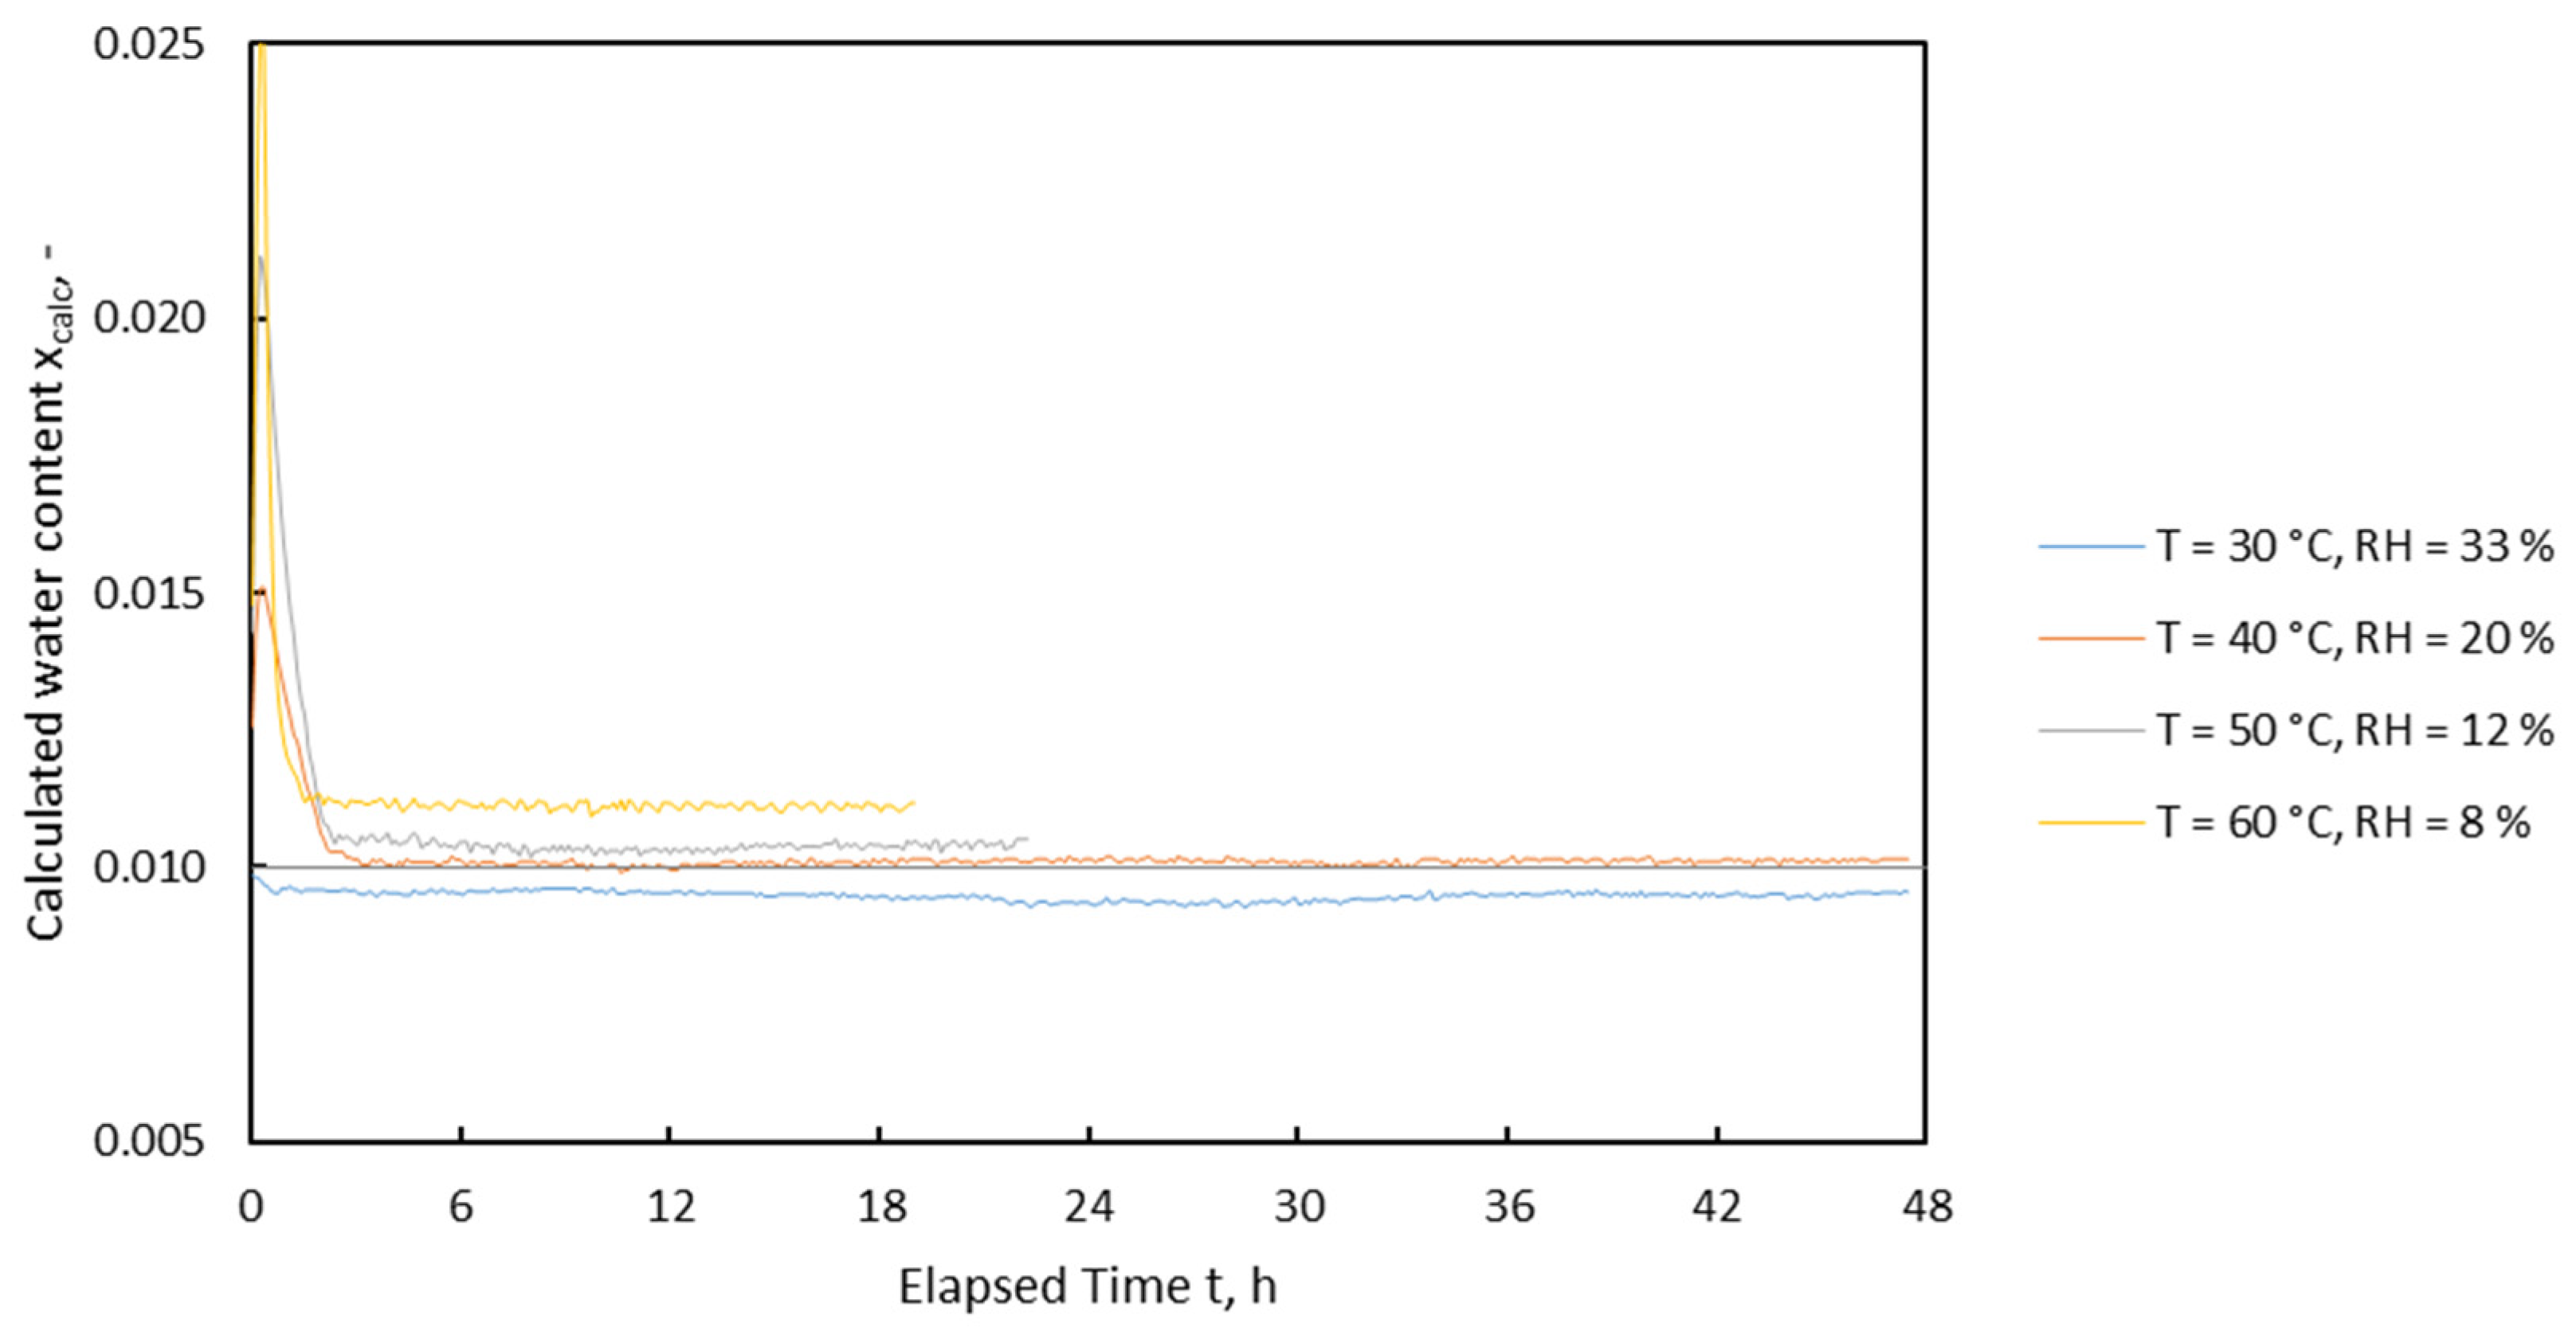
| Tset °C | RHset % | Tmin °C | Tmax °C | RHmin % | RHmax % | xmin - | xmax - | MAPE (T) % | MAPE (RH) % | MAPE (x) % |
|---|---|---|---|---|---|---|---|---|---|---|
| 30 | 33 | 30.2 | 31.6 | 31.5 | 34.3 | 0.009 | 0.010 | 3.17 | 1.51 | 5.06 |
| 40 | 20 | 38.4 | 40.0 | 21.0 | 32.2 | 0.010 | 0.015 | 0.81 | 9.33 | 2.40 |
| 50 | 12 | 49.4 | 50.3 | 12.8 | 26.4 | 0.010 | 0.021 | 0.26 | 13.44 | 8.33 |
| 60 | 8 | 59.2 | 60.0 | 8.6 | 19.7 | 0.011 | 0.025 | 0.42 | 12.45 | 14.71 |
Publisher’s Note: MDPI stays neutral with regard to jurisdictional claims in published maps and institutional affiliations. |
© 2022 by the authors. Licensee MDPI, Basel, Switzerland. This article is an open access article distributed under the terms and conditions of the Creative Commons Attribution (CC BY) license (https://creativecommons.org/licenses/by/4.0/).
Share and Cite
Reyer, S.; Awiszus, S.; Müller, J. High-Precision Laboratory Dryer for Characterization of the Drying Behavior of Agricultural and Food Products. Machines 2022, 10, 372. https://doi.org/10.3390/machines10050372
Reyer S, Awiszus S, Müller J. High-Precision Laboratory Dryer for Characterization of the Drying Behavior of Agricultural and Food Products. Machines. 2022; 10(5):372. https://doi.org/10.3390/machines10050372
Chicago/Turabian StyleReyer, Sebastian, Sebastian Awiszus, and Joachim Müller. 2022. "High-Precision Laboratory Dryer for Characterization of the Drying Behavior of Agricultural and Food Products" Machines 10, no. 5: 372. https://doi.org/10.3390/machines10050372
APA StyleReyer, S., Awiszus, S., & Müller, J. (2022). High-Precision Laboratory Dryer for Characterization of the Drying Behavior of Agricultural and Food Products. Machines, 10(5), 372. https://doi.org/10.3390/machines10050372