1. Introduction
The power transmission system is one of the important subsystems of vehicles. There is a great variety of vehicles which can be divided into electric vehicles (uses power batteries [
1] and driving motor [
2] as the main power system) and fuel-engine vehicles in terms of energy. Most vehicles have a transmission which gives the vehicle a better chance of working in a stage with the best dynamic or economical property by changing its transmission ratio to fit the engine [
3]. Theoretically, the more transmission ratio series the transmission has (i.e., the more gear shifts the transmission has) and the bigger the variation range of transmission ratio is, the better service characteristics the vehicle has. Moreover, the automatically intelligent control of the transmission system helps the development of intelligent vehicles [
4] and the sustainable development of environment and ecology to some extent.
The hydro-mechanical continuously variable transmission (HMCVT) [
5,
6] as a power-split continuously variable speed system [
7,
8] (the power output from the engine is split into the hydraulic power flow and the mechanical power flow) can meet the requirements above effectively (i.e., the more transmission series the transmission has, the larger the variation range of transmission ratio is; automatically intelligent control). The HMCVT has been researched and applied to the fields of agriculture and forestry work vehicles, military vehicles, and some commercial vehicles [
9], especially for agriculture and forestry work vehicles (such as tractors) working in poor environments with complicated and variable load conditions [
10,
11]. Therefore, the application of HMCVT to vehicles such as tractors has great significance for the improvement in the automation and the intelligence and operational performance (mainly referring to the power performance and economic efficiency) of full vehicles.
A reasonable design and control of HMCVT is the key to engineering applications. Currently, there are some studies on the design and control of HMCVT. For instance, Ni et al. [
12] and He et al. [
13] designed the HMCVT of tractors with the equal-ratio principle. Volpe et al. [
14] analyzed the transmission characteristics and researched the optimized design for the power-split continuously variable transmission. In the study, they used methods including the differential evolution algorithm for the optimized design of different types of power-split continuously variable transmissions. Macor and Rossetti [
15] proposed a multi-objective optimized design method for CVT (one of the optimization objects was the minimum fuel consumption, considering the integral mean loss between the zero-speed vehicle and the maximum design speed of vehicle as the objective function). The method combined software MATLAB and AMESim, and was based on the multi-objective particle swarm optimizer (MOPSO). Xiao et al. [
16] proposed a HMCVT speed ratio matching method based on the tractor’s fuel economy and mainly adopted the simulation test to study the effective specific fuel consumption of the tractor in different working conditions. Ahn et al. [
17] proposed a mixed transmission control strategy for tractors considering engine characteristics and HMCVT’s transmission efficiency, and built a co-simulation model for tractors based on AMESim and MATLAB/simulink (without the PTO) to analyze the full vehicle system’s fuel efficiency. Ince and Guler [
18] conducted a comparative study on the performance of the power-split continuously variable transmission and the conventional transmission in terms of fuel consumption. The study simulated two different control strategies based on MATLAB. Zhang et al. [
19] analyzed the fuel consumption rate of the engine and the efficiency variation characteristics of HMCVT, calculated and obtained the optimal gear ratio of tractors in different working conditions using the parameter round-robin algorithm, compared the characteristics of tractors in unitary and binary coordinated regulations, and verified the energy-saving effect of the proposed binary regulation variable speed control strategy. It showed that grasping the efficiency characteristics of the CVT system is the key to the reasonable transmission design and control strategy development. However, currently, some studies introduce a fixed value to the efficiency of the power-split CVT system, some studies neglect the influence of working conditions in the efficiency models used, and some studies describe the variation laws of power-split CVT efficiency using mathematical models with few independent variables.
Currently, there are few studies on HMCVT’s efficiency characteristics. Li et al. [
20], basing on the plunger-pump-motor system efficiency model with few parameters and the engaging power method, assessed the HMCVT of amphibian tractors. Xia and Sun [
21] set the single-stage external meshing gear transmission efficiency as a fixed value (0.97) when researching the working efficiency of CVT, and considered the energy loss of HMCVT’s gear shift, pump-motor system, and planetary row in the research process. Liu et al. [
22] split the hydro-mechanical transmission efficiency into a mechanical part and a hydraulic part, calculated the efficiency of the two parts and then the efficiency of the whole transmission system according to the proportions of two parts of efficiency, and made a torque-rotating-speed-efficiency map. Cheng et al. [
23] built an efficiency characteristic model by using an improved simulated annealing algorithm with a few test data. This study used a stage of multi-stage HMCVT as an example and calculated the power-split proportions of HMCVT (combining the calculation of mechanical transmission ratio’s variation characteristics and the calculation of the pressure difference between inlet and outlet oil circuits of a constant motor). To summarize, current studies on the HMCVT efficiency characteristic model generally use purely theoretical calculation models based on analyses of the energy transmission characteristics of parts in the system. The HMCVT’s efficiency characteristics are affected by working conditions (i.e., the working speed, load power, displacement ratio, and other factors affect the HMCVT’s working efficiency). Therefore, it is difficult to build an efficiency model with certain reliable precision in the design stage. It is also possible to obtain efficiency characteristics by producing a HMCVT prototype and making a practical test. However, it may have an excessive cost and require a heavy workload. Wang et al. [
24] built a HMCVT efficiency characteristic model with the Simulation X and verified the precision of the simulation model through a comparison with the measured value of the practical test. However, it is difficult to optimize HMCVT’s design parameters and develop control strategies through the simulation model of Simulation X alone in the design stage. The model with specific mathematical expressions can be applied to the optimized design and control strategy development of HMCVT effectively.
To solve the above problems, we proposed a piecewise modeling method for HMCVT efficiency characteristics considering HMCVT’s working stage characteristics, engine working speed, load power, and variable pump’s displacement ratio in the design stage. We built a simulation model of efficiency characteristics specific for a novel five-stage HMCVT transmission scheme using software Simulation X. We conducted an efficiency characteristic test using a full factorial test, obtained 160 groups of simulation test samples, and explored the influences of various factors on HMCVT’s efficiency characteristics using a range analysis. Test results showed that the variable pump’s displacement ratio had the greatest influence, and HMCVT’s efficiency characteristics presented two variation laws with the boundary that the displacement ratio is 0. On this basis, we proposed a piecewise model to describe the variation laws of HMCVT’s efficiency characteristics. According to all test samples, we used an improve genetic algorithm (I-GA) to build seven efficiency characteristic mathematical models (which were all piecewise models). Additionally, we compared the results of seven models using the mean absolute percentage error (MAPE) and the coefficient of determination (R2) as evaluation indexes. This paper offers valuable reference information for the optimized design of HMCVT’s structure and parameters, and also offers reliable mathematical models of efficiency characteristics that can be used directly for the development of control strategies in the design stage. Moreover, the paper offers an evaluation method for HMCVT efficiency.
2. Materials and Methods
2.1. A Novel 5-Stage HMCVT
The research in this paper was specific for a novel 5-stage HMCVT composed of the variable pump, the constant motor, the planetary gears, the wet clutch, the brake, and the shaft gear. The 5-stage HMCVT studied in this paper had 5 working stages (named stage H
0, HM
1, HM
2, HM
3, and HM
4, respectively). Each working stage realized stepless change of the transmission ratio within a certain range. The transmission ratio range of the adjacent working stage was continuous. See
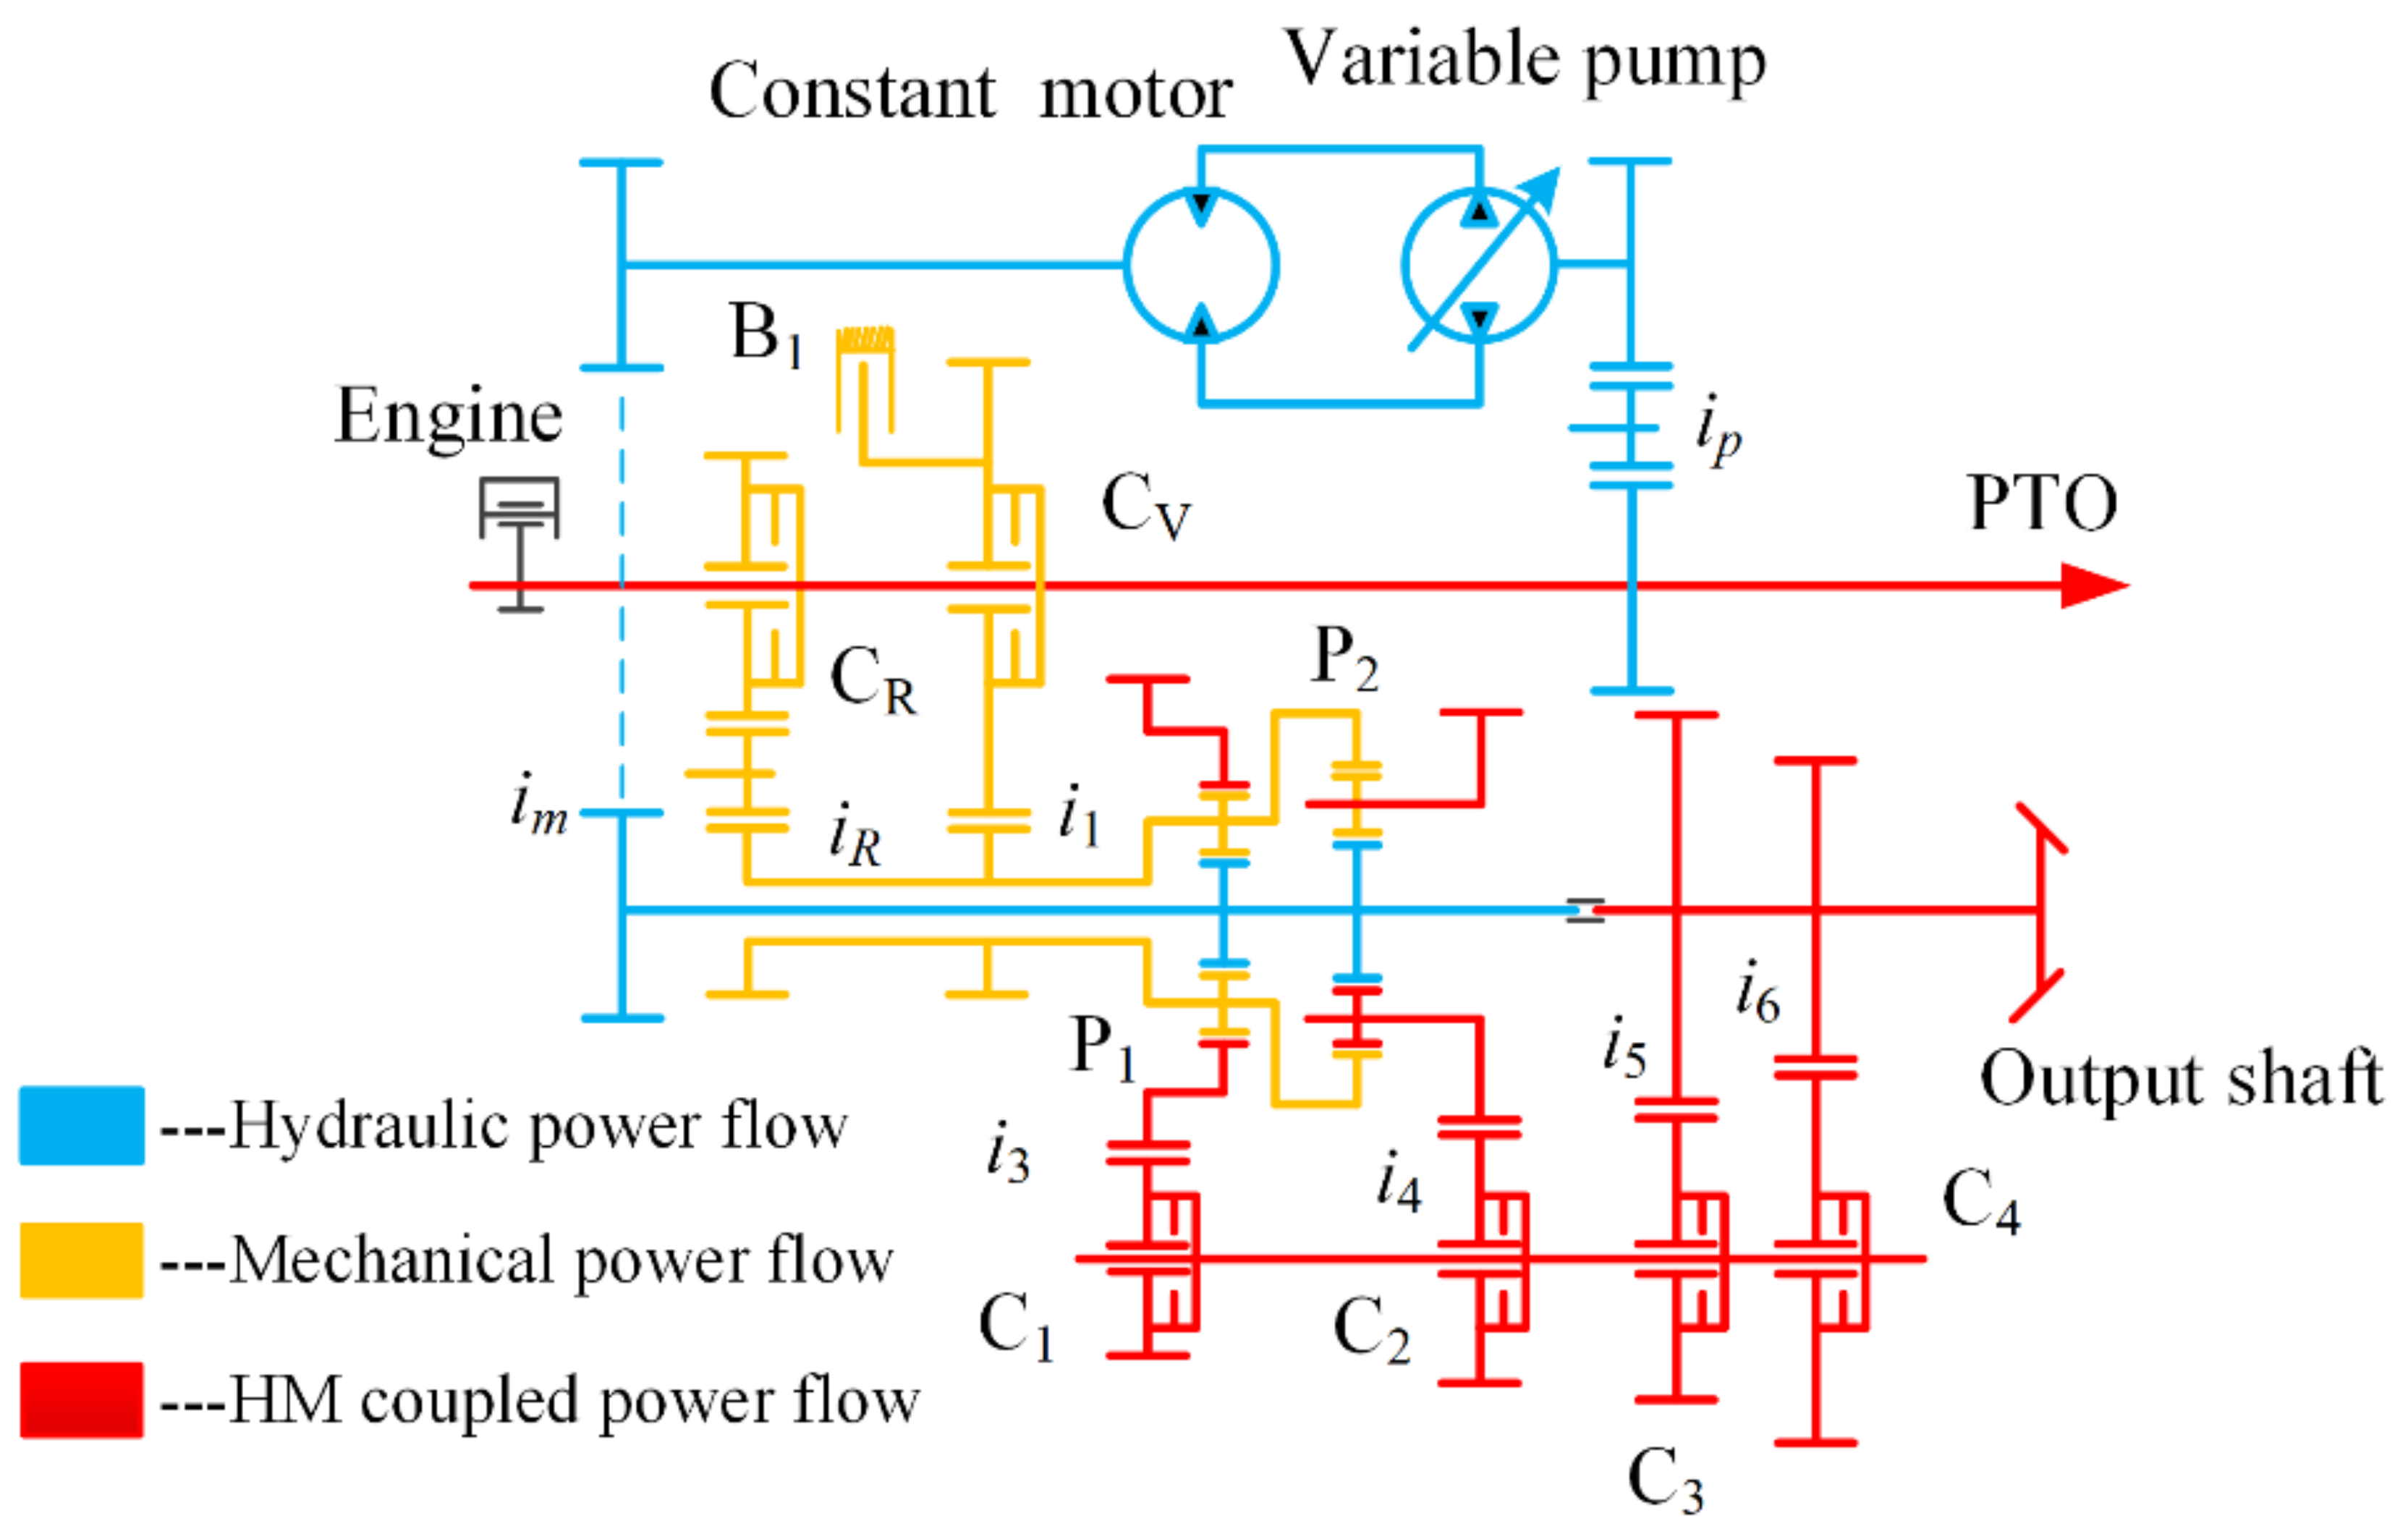
Figure 1 for the system’s transmission scheme.
In
Figure 1, the blue full line represents the hydraulic power flow’s transmission route. In this route, a part of the engine’s output power is fed into the sun gear of planetary gear P
1 or P
2 through
ip, the variable pump, the constant motor, and
im. The yellow full line represents the mechanical power flow’s transmission route. In this route, a part of the engine’s output power is fed into planetary gear P
1 or gear ring P
2 through
i1 or
iR. The red full line represents the transmission route of the engine total output power flow and the hydro-mechanical (HM) coupled power flow. In this route, the power of the hydraulic power flow and the mechanical power flow converge and then is output by gear ring P
1 or planet carrier P
2. Finally, the power is transmitted to the output end through
i3 or
i4 and
i5 or
i6. The 5-stage HMCVT uses clutch C
R and clutch C
V to make the vehicle move forward and backward, respectively. Moreover, for the opposite rotation direction, when clutch C
R or clutch C
V works, the HMCVT has the following five consistent working stages: (1) one purely hydraulic working stage (stage H
0) in which brake B
1 and clutches C
1 and C
3 work; (2) four HM power coupled working stages including stage HM
1 (in which clutches C
2 and C
3 work), stage HM
2 (in which clutches C
1 and C
3 work), stage HM
3 (in which clutches C
2 and C
4 work), and stage HM
4 (in which clutches C
1 and C
4 work).
The HMCVT used in this study was designed by the principle of equal ratio. That is, except for the initial working stage (H
0 stage), the ratios of the maximum and minimum transmission ratios of HM1~HM4 stages are approximately equal (note: the transmission ratio of HMCVT is defined by the effective working range of the displacement ratio). In this study, the common ratio was 1.81, the maximum transmission ratio of HMCVT was 7.52, and the minimum transmission ratio was 0.72. The design values of transmission system parameters obtained by calculation are shown in
Table 1.
Figure 2 shows the variation characteristics of the 5-stage HMCVT’s transmission ratio (use the forward pattern as an example).
2.2. Build a Simulation Test Platform for Efficiency Characteristics Based on Simulation X
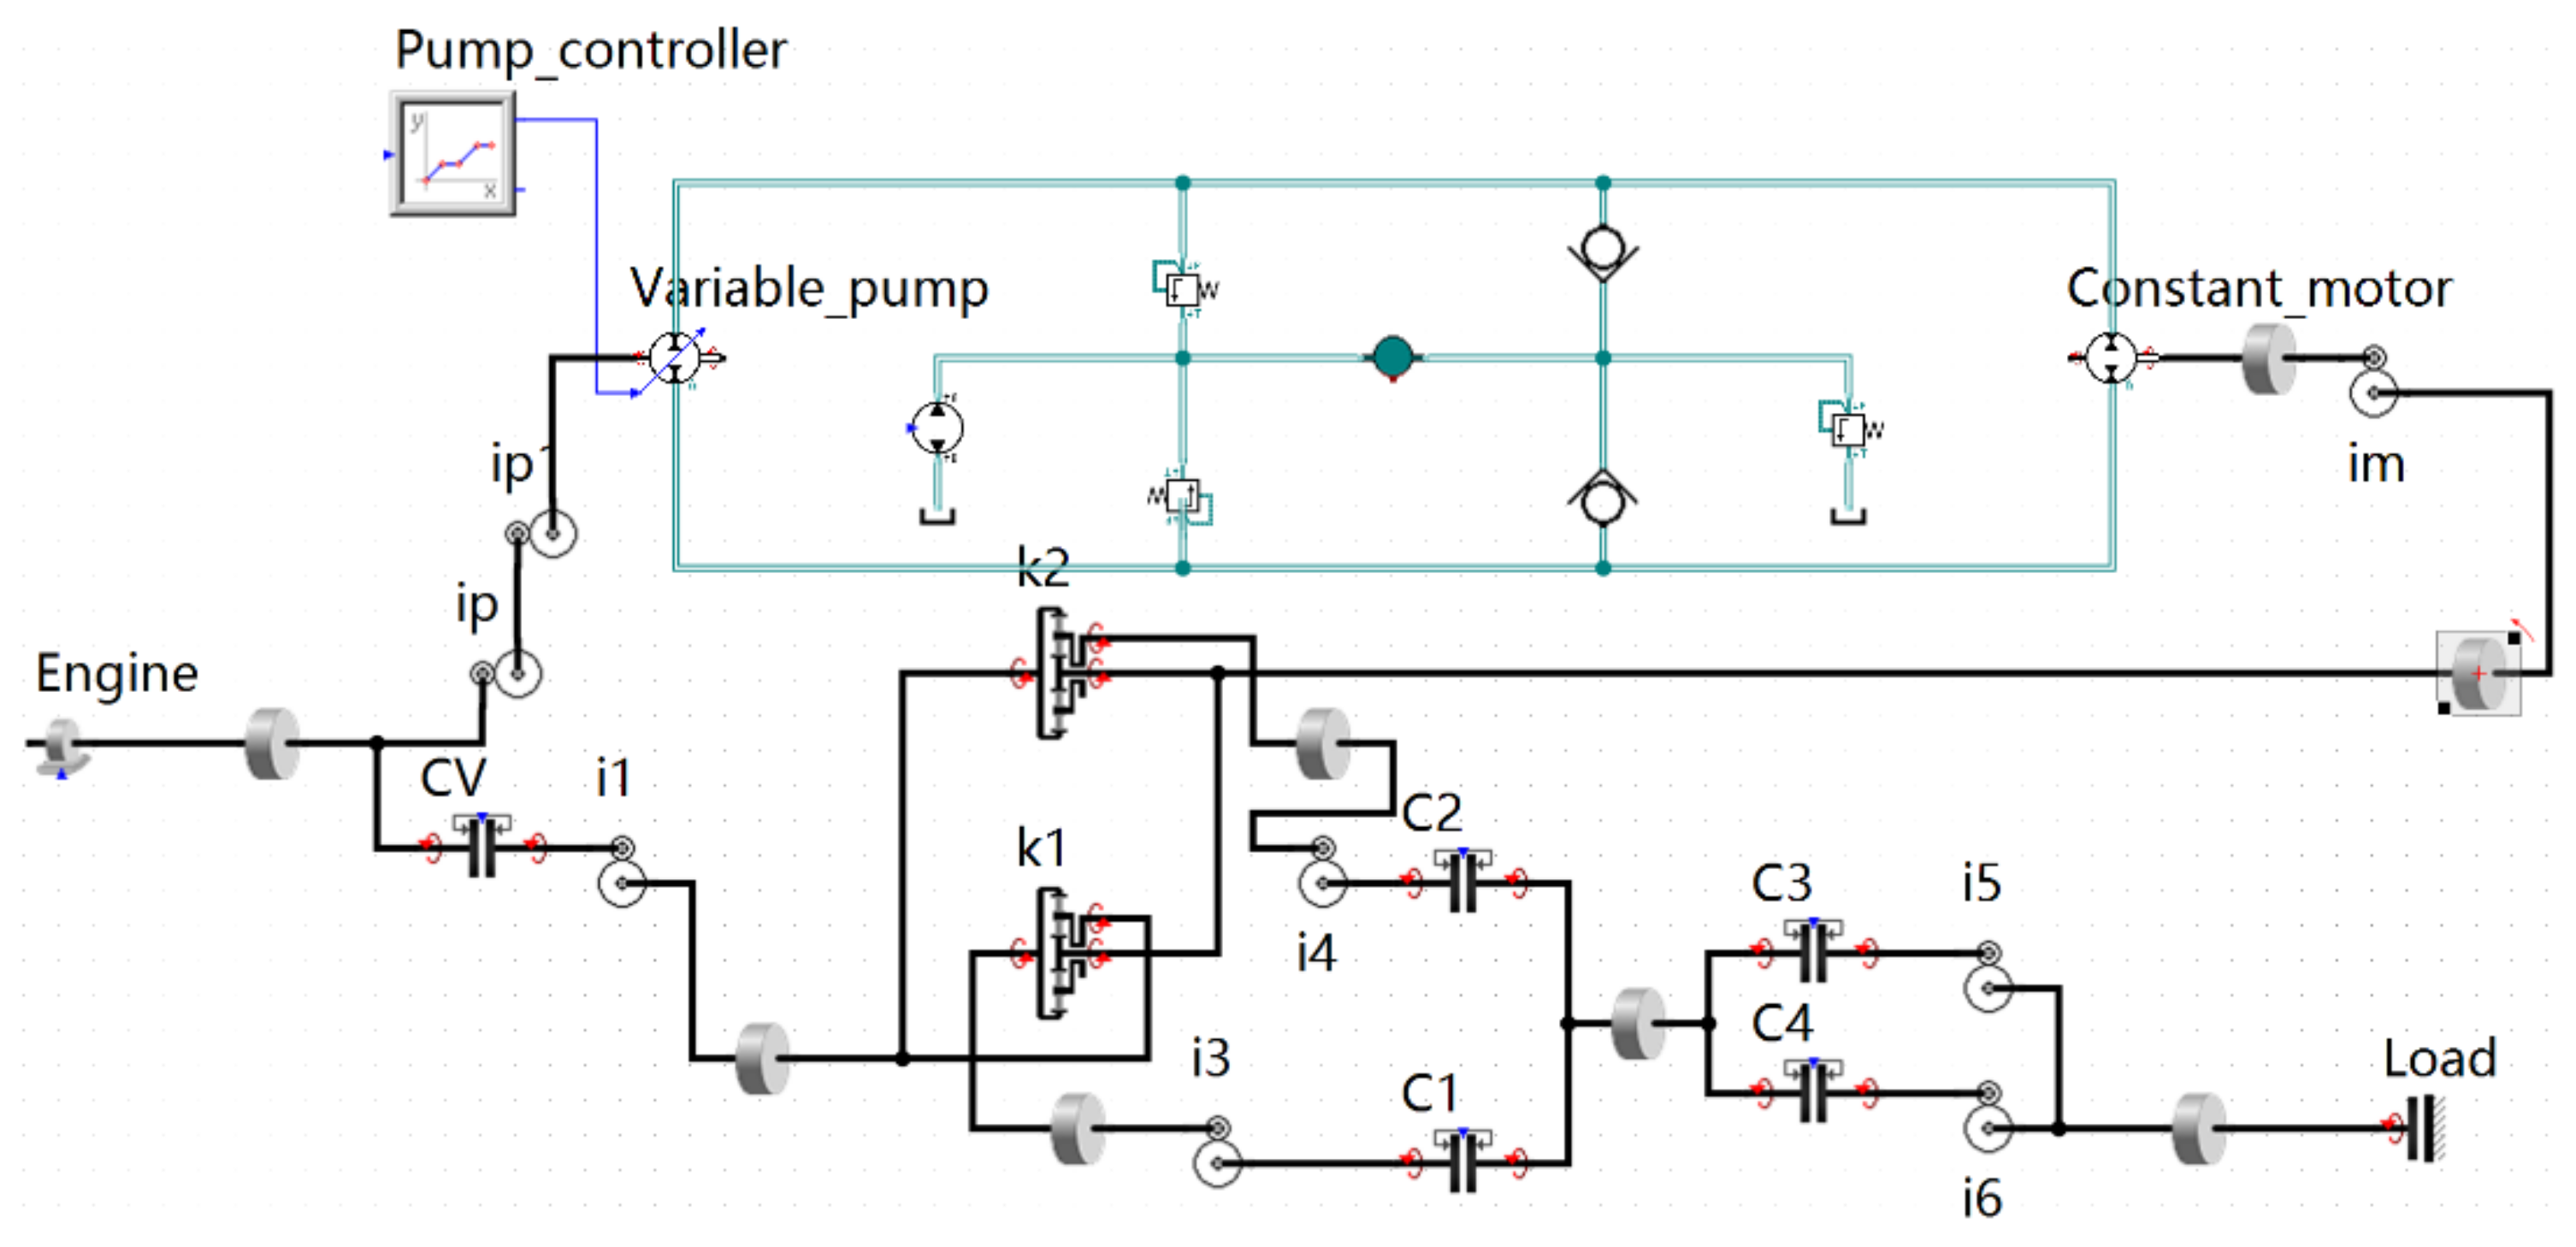
Simulation X has been applied widely in the research on power transmission systems, and its modularized modeling method is applicable to the research objective in this paper. We built a 5-stage HMCVT simulation model (see
Figure 3) with the inbuilt variable pump, constant motor model, various types of valve models, planetary gear model, fixed-shaft gear model, and clutch model of the software.
We measured the load end power and the engine power and then divided the two values to obtain the total transmission efficiency of the whole transmission system based on the simulation test system. In this research, the transmission efficiency of shaft gear was set as 0.98. Planetaries took into account stiffness and damping of contact (the power loss mainly includes power dissipated due to damping). Hydro-mechanical efficiency (maximum efficiency was set to 0.9, mainly including sticking friction torque and coulomb friction torque) was considered in both the variable pump and the constant motor system. Because the research work was oriented to the conceptual design stage, the leakage of hydraulic system, friction loss of bearing, and hydraulic loss of gear and shaft dipped into oil were ignored.
2.3. The Full Factorial Test Design for Four Efficiency Characteristic Factors
According to reference document [
23], HMCVT’s efficiency characteristics may vary in different working conditions. The engine speed, the load power, the variable pump’s displacement ratio, and the working stage of HMCVT (HMCVT’s working parts are different in different working stages) are the variable factors related to the HMCVT during the running of the vehicle. We used a full factorial test method to explore the variation characteristics of HMCVT’s transmission efficiency when the four factors were in different cases.
The vehicles with HMCVT generally use the diesel engine. This paper uses the diesel engine of model LR6105ZWT3 as an example. The diesel engine has a working speed range of 800~2200 rpm and a rated power of 132 kW. The research sets the engine speed and load power to be divided into three levels equally into the ranges of 800~2200 rpm and 10~132 kW, respectively. The variable pump’s displacement ratio has a positive mode and the negative mode. The paper sets three levels evenly in each mode (including the levels of 800 rpm, 1500 rpm, and 2200 rpm and the levels of 10 kW, 71 kW, and 132 kW). Additionally, the two modes both have the state that the displacement ratio is 0 (i.e., the variable pump does not output the displacement in which case the constant motor’s output speed is 0). Merging the states when the displacement ratio is 0, the variable pump’s displacement ratio can be equally divided into five levels (including levels −1, −0.5, 0, 0.5, and 1). The HMCVT has a total of five working stages, while the purely hydraulic working stage generally works in the starting stage of the vehicle and has a relatively simple transmission route. This paper only explored the HMCVT efficiency characteristics in HM power coupled working stages. Therefore, the HMCVT’s working stages were divided into four levels (representing stages HM
1~HM
4, respectively). Then,
Table 2 shows the full designed factorial test.
We used a range analysis method to explore each factor’s influence on HMCVT’s efficiency characteristics. We calculated four factors’ (the engine speed, the load power, the variable pump’s displacement ratio, and the HMCVT working stage) range of mean efficiency of all levels (i.e., the difference between the maximum and the minimum of mean efficiency of all levels in the full factorial test results of each factor). The following is the calculation formula:
where
is the range of the
ith factor and
is the set of mean efficiency of all levels of the
ith factor.
We compared the range of each factor to analyze the influence on efficiency characteristics. For a factor, a positive range means the factor has a positive correlation with efficiency characteristics, while a negative range means the factor has a negative correlation with efficiency characteristics. Moreover, the bigger the range is, the greater influence the factor has on efficiency characteristics.
2.4. An I-GA-Based Piecewise Modeling Method for Efficiency Characteristics
According to reference documents [
3,
23], the HMCVT’s efficiency characteristics present two significantly different variation laws in different working ranges of the variable pump’s displacement ratio. Specifically, the HMCVT’s efficiency characteristics are significantly different when the displacement ratio is in the ranges of −1~0 and 0~1. It was also supported by the test results of this paper (see
Section 3).
On this basis, we used the form of a piecewise function (with the displacement ratio in the ranges of −1~0 and 0~1, respectively) to build the HMCVT efficiency characteristic model. Because the variation laws of efficiency characteristics had some similarity in the two ranges (see
Section 3), for the convenience of HMCVT efficiency characteristic model’s modeling and applications, we used the same form of the model to describe two kinds of characteristics in the two ranges.
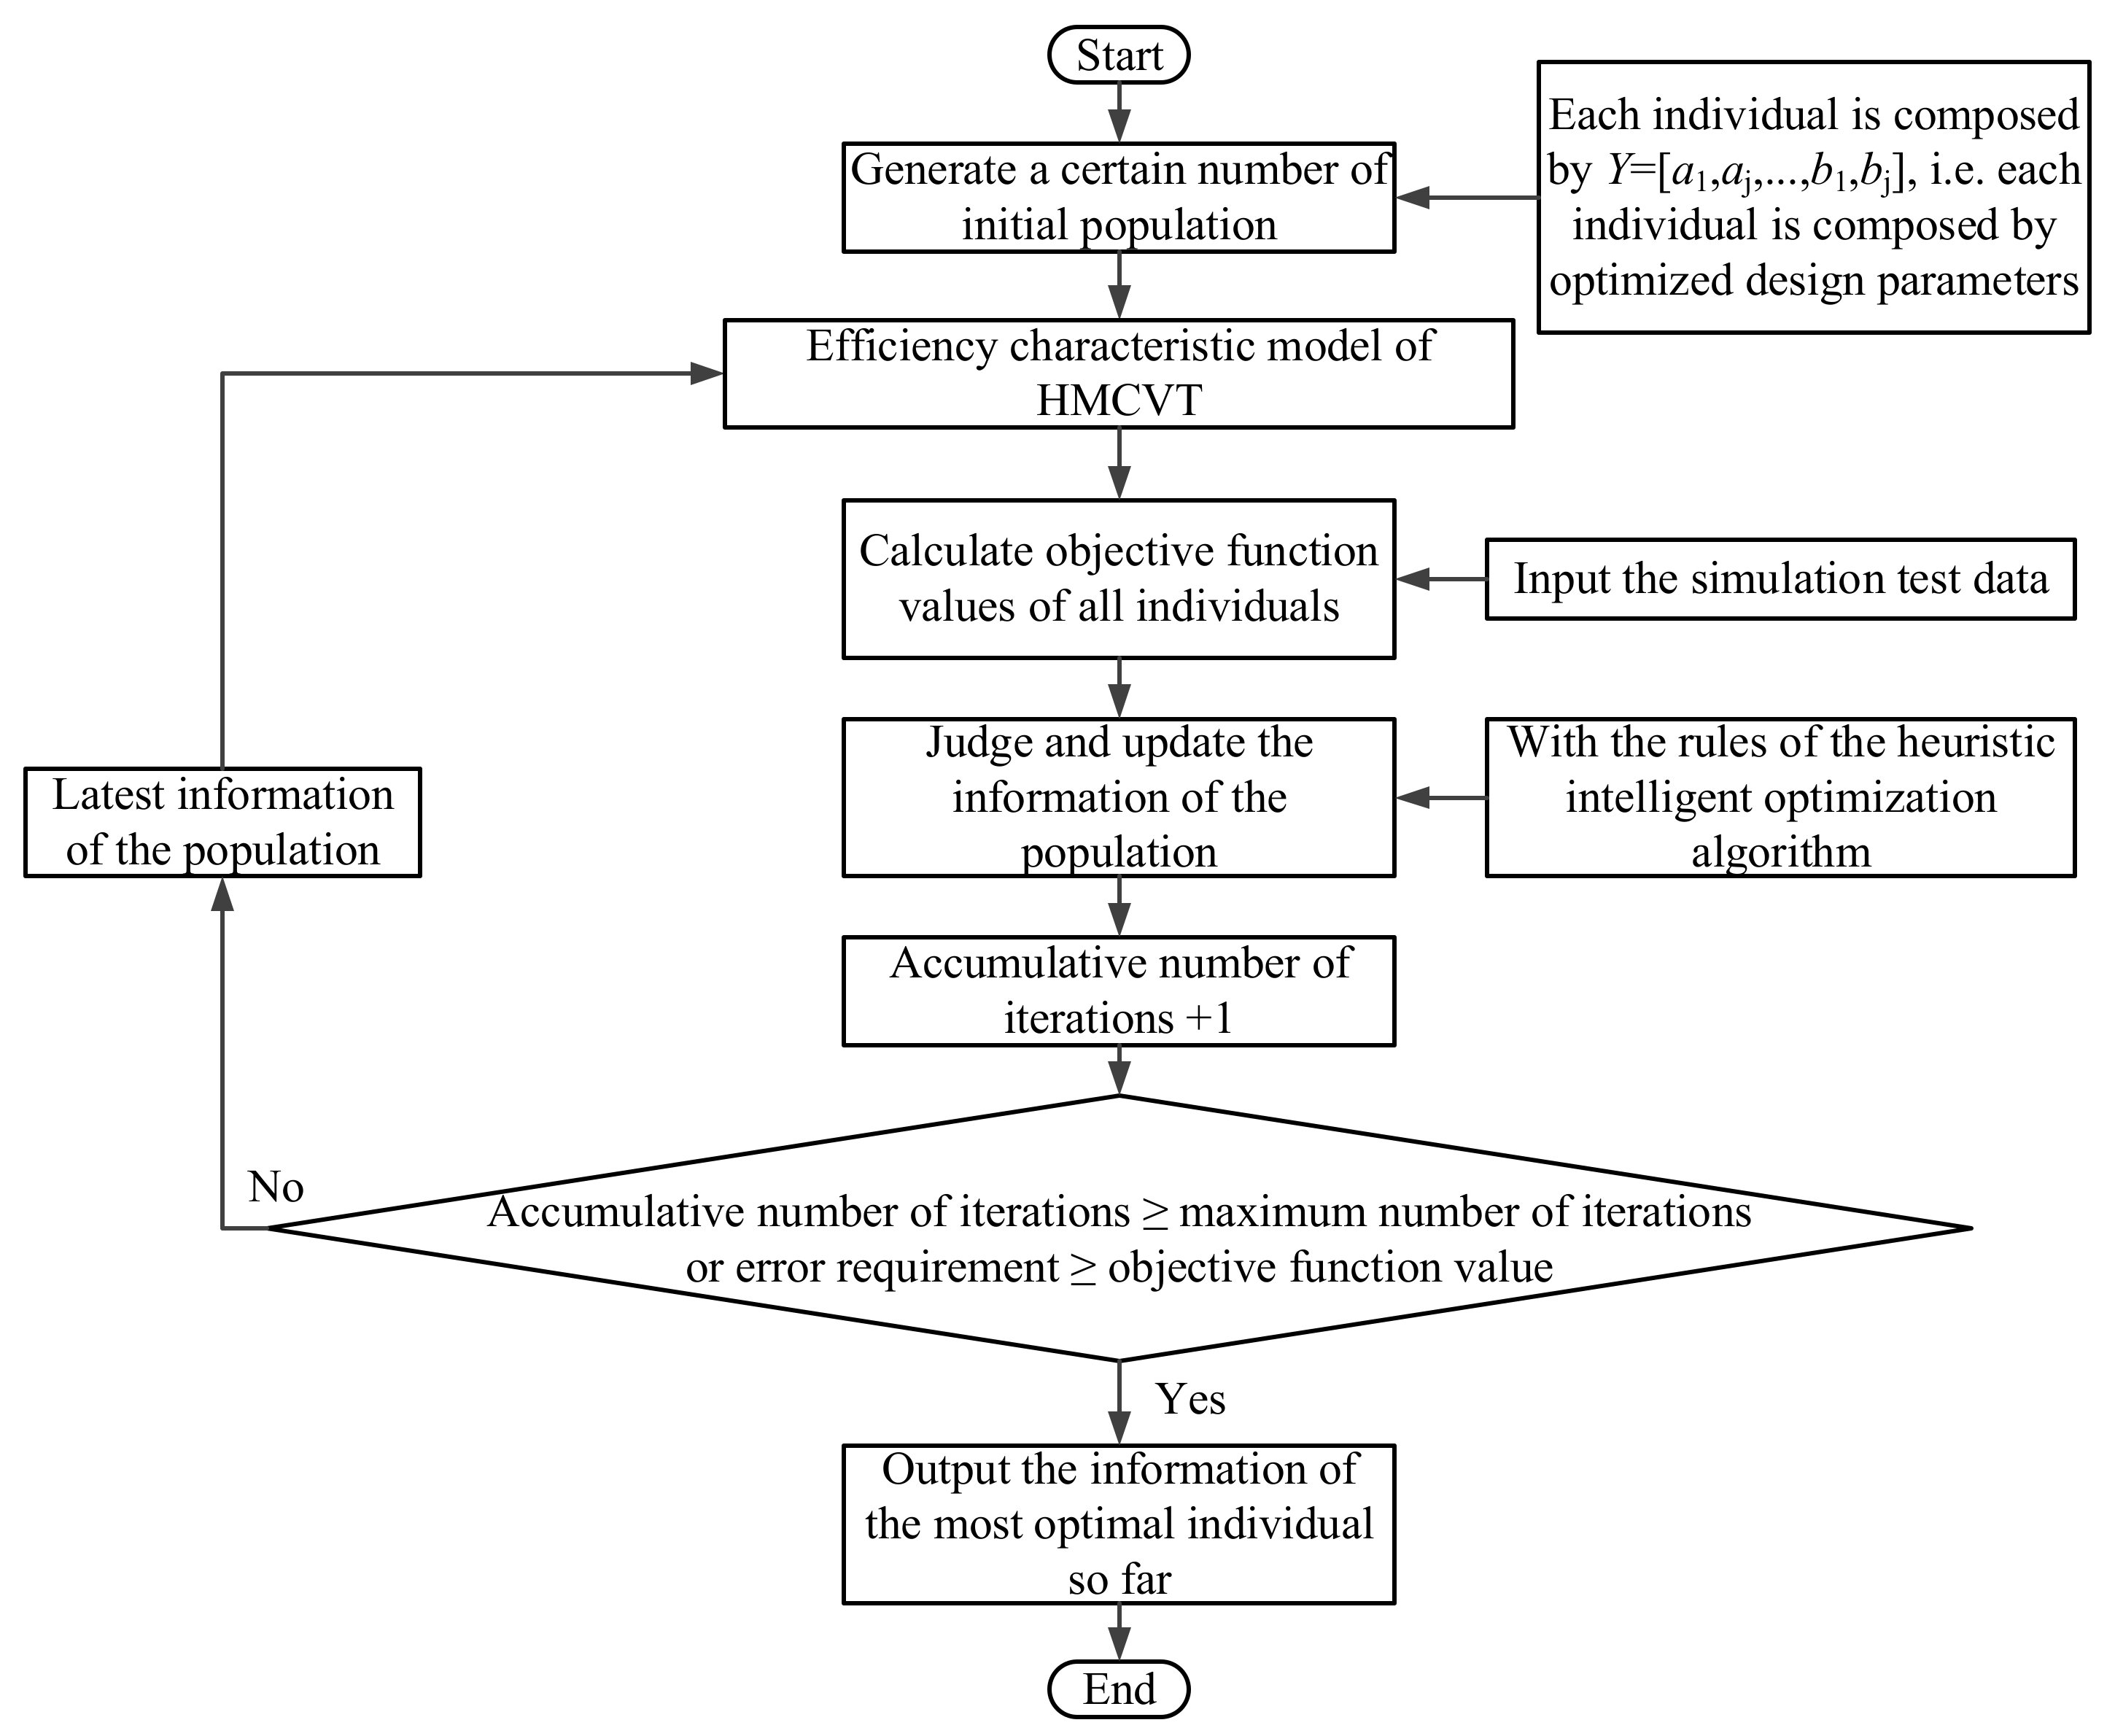
We proposed an I-GA-based piecewise modeling method for efficiency characteristics. The piecewise model is, essentially, the combination of two sub-models, so the traditional modeling method uses a series mode to build the sub-models of the piecewise mode one by one. To improve the efficiency of modeling (i.e., the speed, convenience, and precision of modeling), the proposed method considers all unknown parameters in the HMCVT efficiency characteristic piecewise model as the decision variables of I-GA. Moreover, the method sets the fitness function as the highest total precision of two sub-models in the piecewise model, resulting in the HMCVT efficiency characteristic model built synchronously in a parallel way.
In the optimization algorithm, the decision variables are:
where
is the number of decision variables in the single sub-model of piecewise model,
are the decision variables of the first sub-model of piecewise model, and
are the decision variables of the second sub-model of piecewise model.
The proposed method considers the
MAPE between the test value and estimation value as the index to evaluate the precision of the efficiency characteristic model. Then, the objective function
is:
where
is the number of samples in each range after the range division of efficiency characteristics,
is the estimated value of sub-model 1,
is the measured value in the working stages of sub-model 1,
is the estimated value of sub-model 2, and
is the measured value in the working stages of sub-model 2.
Figure 4 shows the flow chart of the proposed modeling method.
The proposed HMCVT efficiency characteristic piecewise model has many variables to be optimized (see
Section 2.5; the three piecewise models have 4, 12, and 14 unknown parameters, respectively). The algorithm’s objective function is nonlinear. The heuristic optimization algorithm plays an important role in solving complicated engineering problems. For example, the research studies in references [
25,
26,
27,
28] can be reflected to a certain extent. Considering that the research object has two nonlinear objectives and two sub-models searching the optimum synchronously (which causes relatively more decision variables), we used the genetic algorithm (GA) to solve the unknown parameters in sub-models to build the HMCVT efficiency characteristic piecewise model. To further improve the modeling result of the efficiency characteristic piecewise model, we used the I-GA proposed in previous research and verified for engineering applications [
29]. The I-GA improves the convergence rate and precision through the following steps: (1) judging and screening the super individual in the population, (2) adaptive changes of the population size, and (3) adaptive changes of the crossover and mutation probabilities.
2.5. Types of Piecewise Models and Accuracy Evaluation Indexes Studied in the Paper
The 5-stage HMCVT researched has four HM power coupled working stages (i.e., stages HM
1~HM
4). We explored the laws of efficiency characteristics of each working stage varying with three factors (including the engine speed, the load power, and the variable pump’s displacement ratio). We proposed a method to build the efficiency characteristic piecewise model according to the influences of the three factors. According to the range analysis results (see
Section 3.2), we built the efficiency characteristic piecewise models of HMCVT’s single working stage with a single factor, two factors, and three factors as independent variables, respectively. The single-factor model uses the factor with the greats influence on efficiency characteristics. The two-factor model uses the two factors with greater influences on efficiency characteristics. The three-factor model use all the three factors researched in the paper. The polynomial model can contain both the single-factor higher order term and the multi-factor interaction term, so it generally has good estimation precision in engineering applications [
30].
Through the range analysis, we set the factors as x1 (with a relatively greater influence), x2, and x3 (with relatively smaller influences) according to their influences on efficiency characteristics.
The single-factor polynomial model built considers the first-order term of a single factor and its expression is as follows:
where
is the HMCVT efficiency characteristic piecewise model built with the polynomial, and
is variable pump’s displacement ratio.
The two-factor polynomial model built considers the first-order term, second-order term, and interaction term of two factors and its expression is as follows:
x3 has the smallest influence on efficiency characteristics comparatively. If we introduce the parameter in the same way as introducing
x1 and
x2, it may cause too many unknown parameters to be solved in the model, and consequently may result in an overfitting phenomenon. Therefore, we only introduced an independent variable containing
x3, , to correct the original two-factor model. The following is the expression of new model:
For the multiple independent variable forms with
x3 (we considered
x3’s first-order term, second-order term, and interaction term with other factors), we proposed an enumeration method for the comparison to determine the relatively optimal new independent variable
. Specifically, (1) introducing different forms of
one by one to form a new three-factor model; (2) completing the three-factor model with the I-GA-based method proposed in
Section 2.3; and (3) comparing different forms of three-factor models one by one in terms of precision to select the relatively optimal
.
We used the
MAPE and coefficient of determination
as the indexes to compare and evaluate the precision of different efficiency characteristic piecewise models. The following is the calculation formula of
:
where
is the total number of samples at one HM stage of HMCVT and
represents all test values at one HM stage of HMCVT.
4. Conclusions
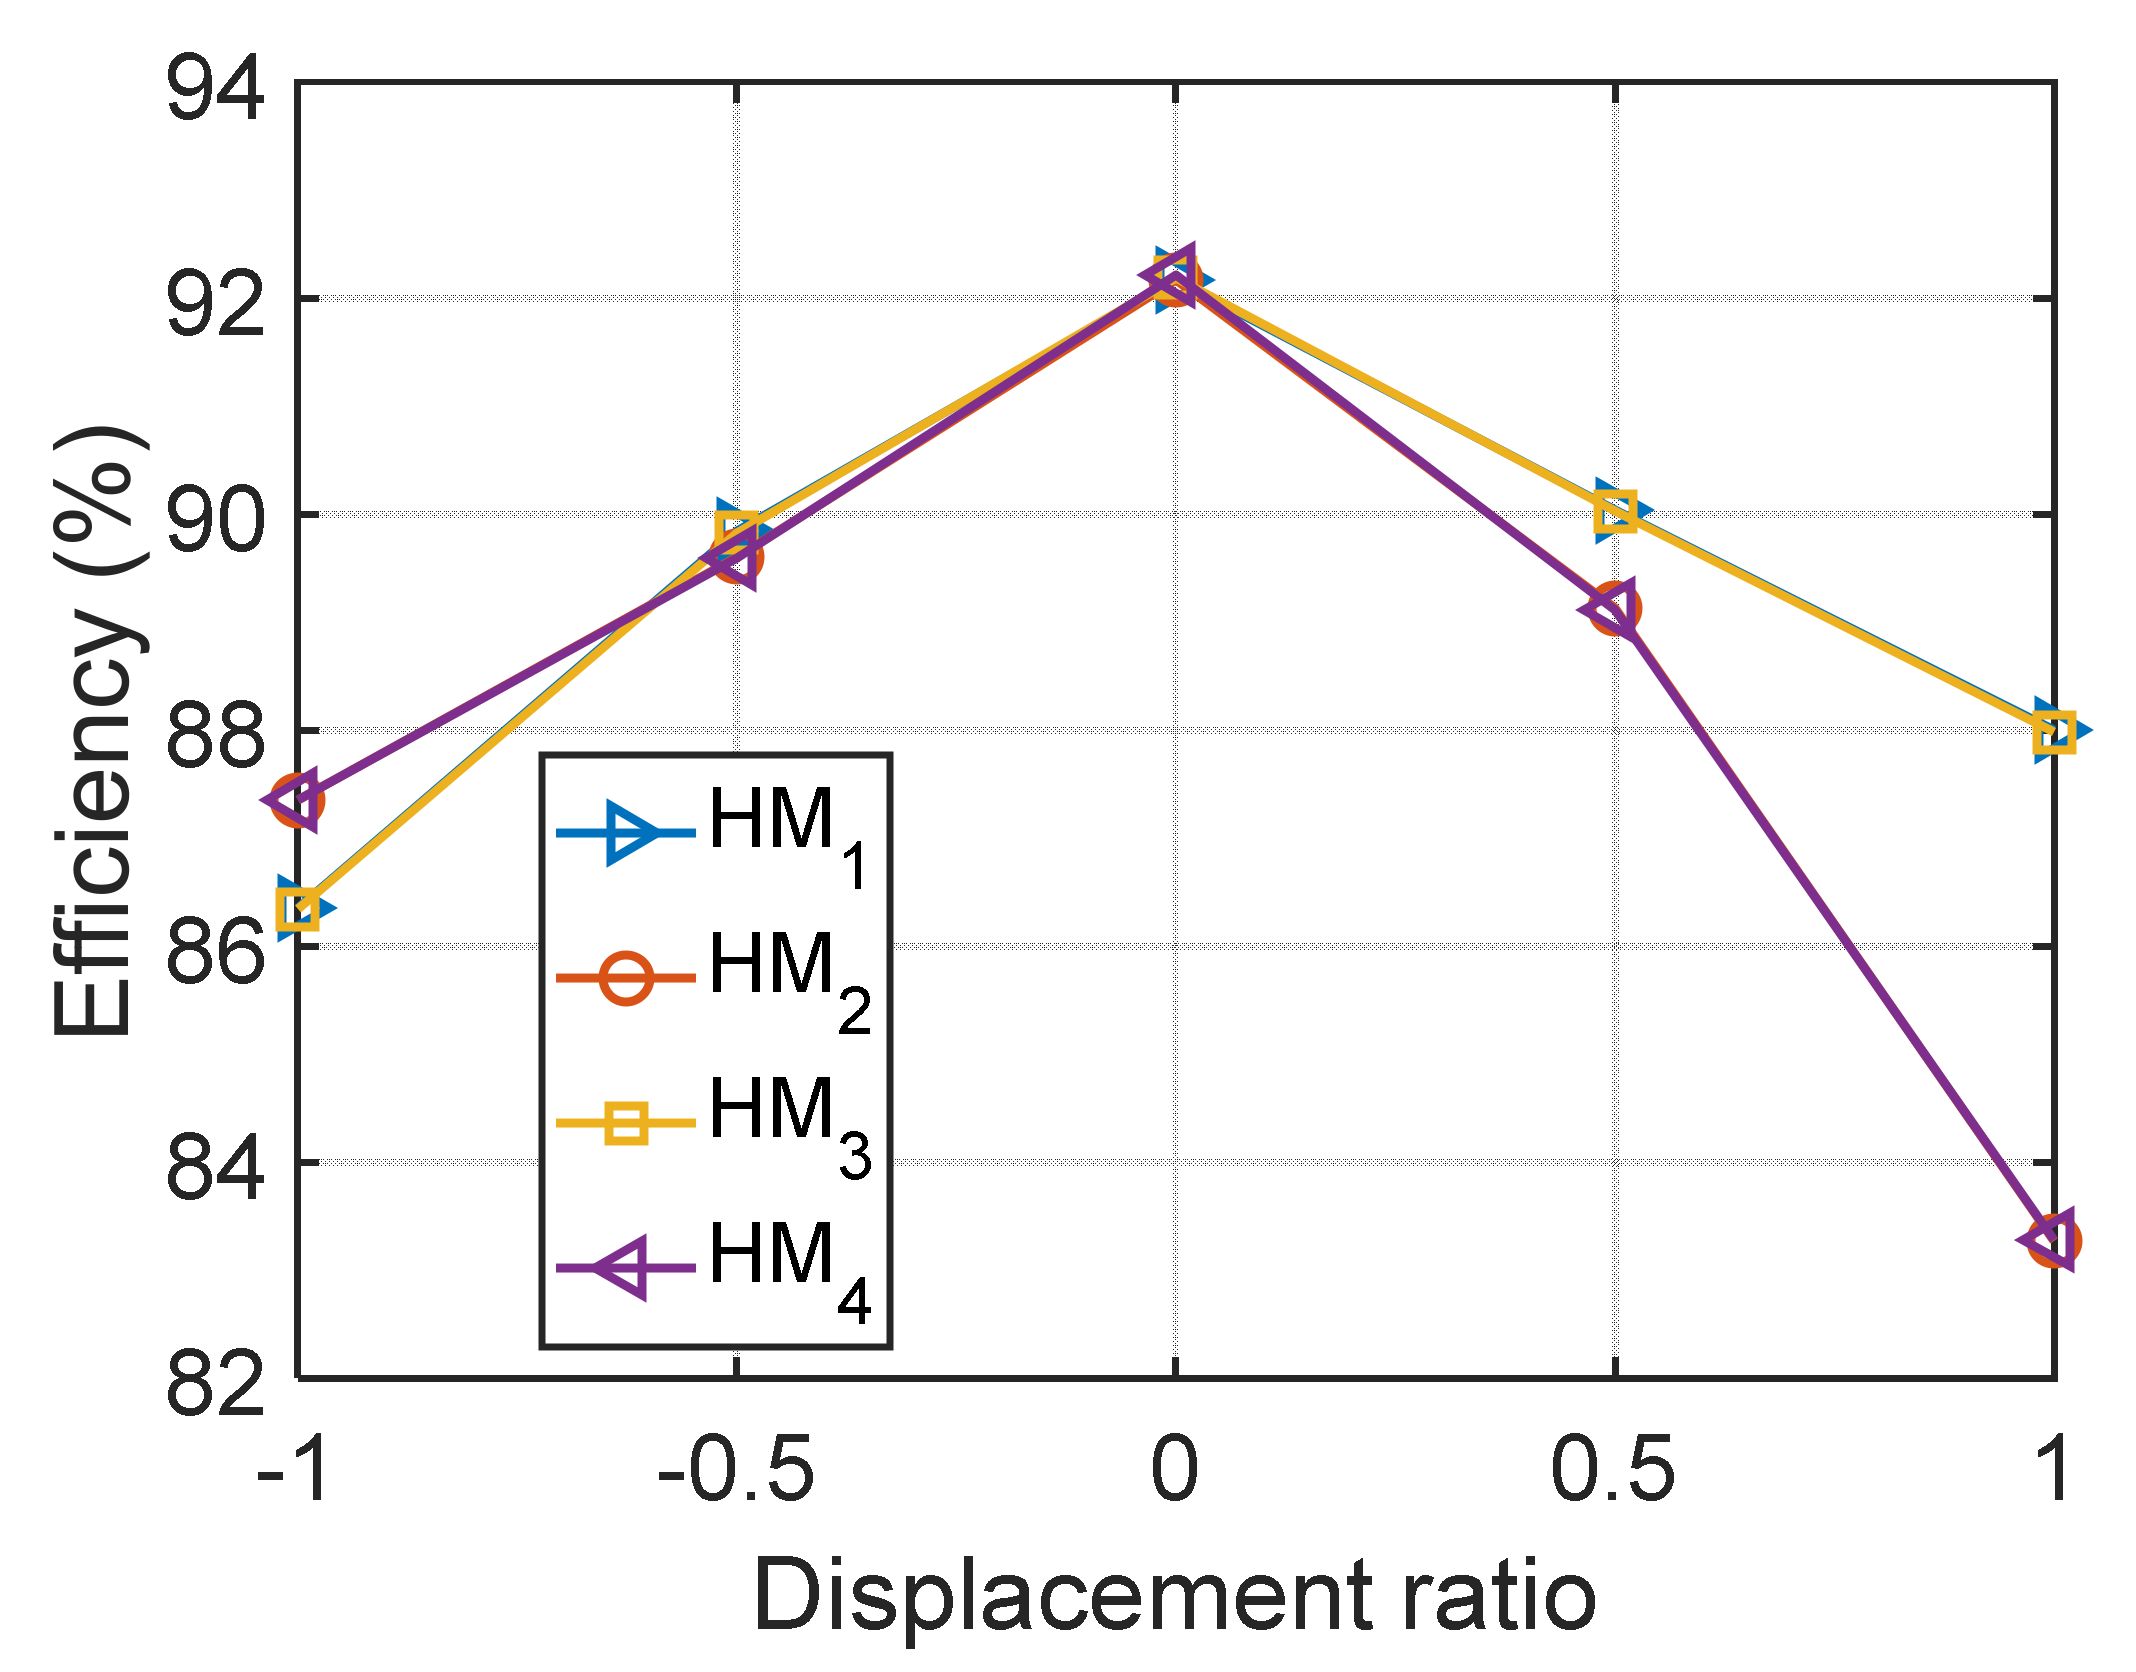
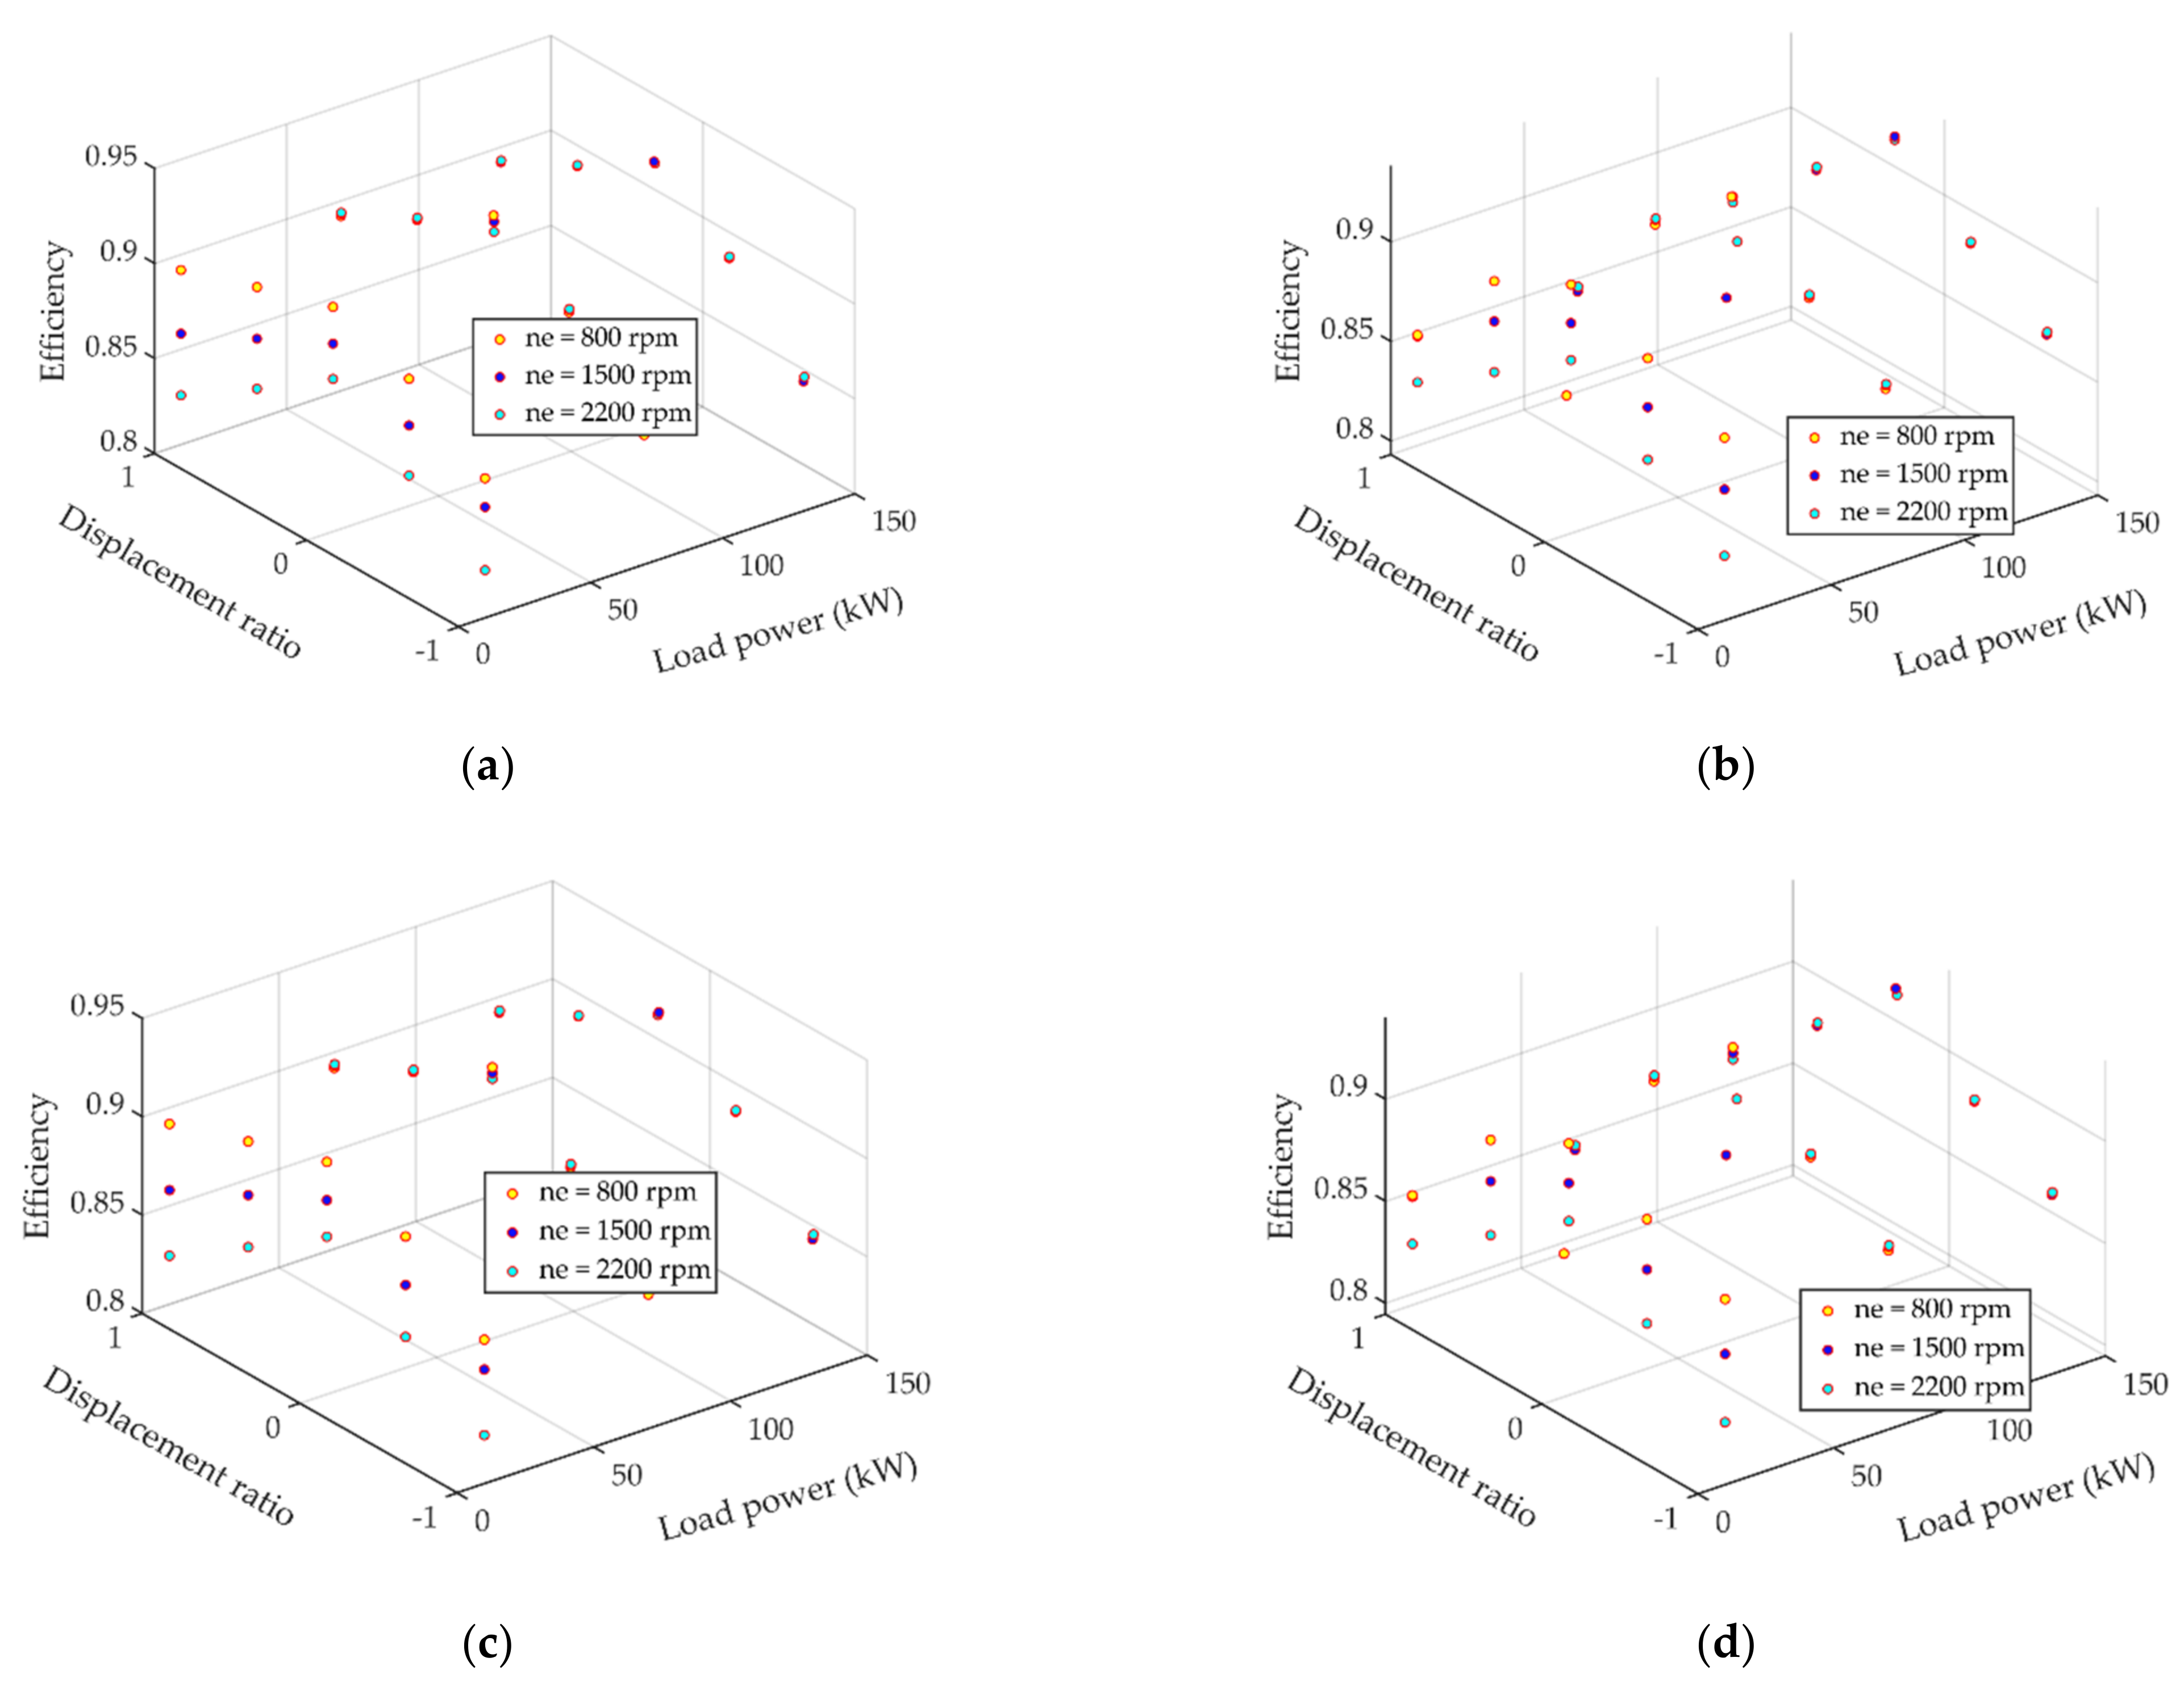
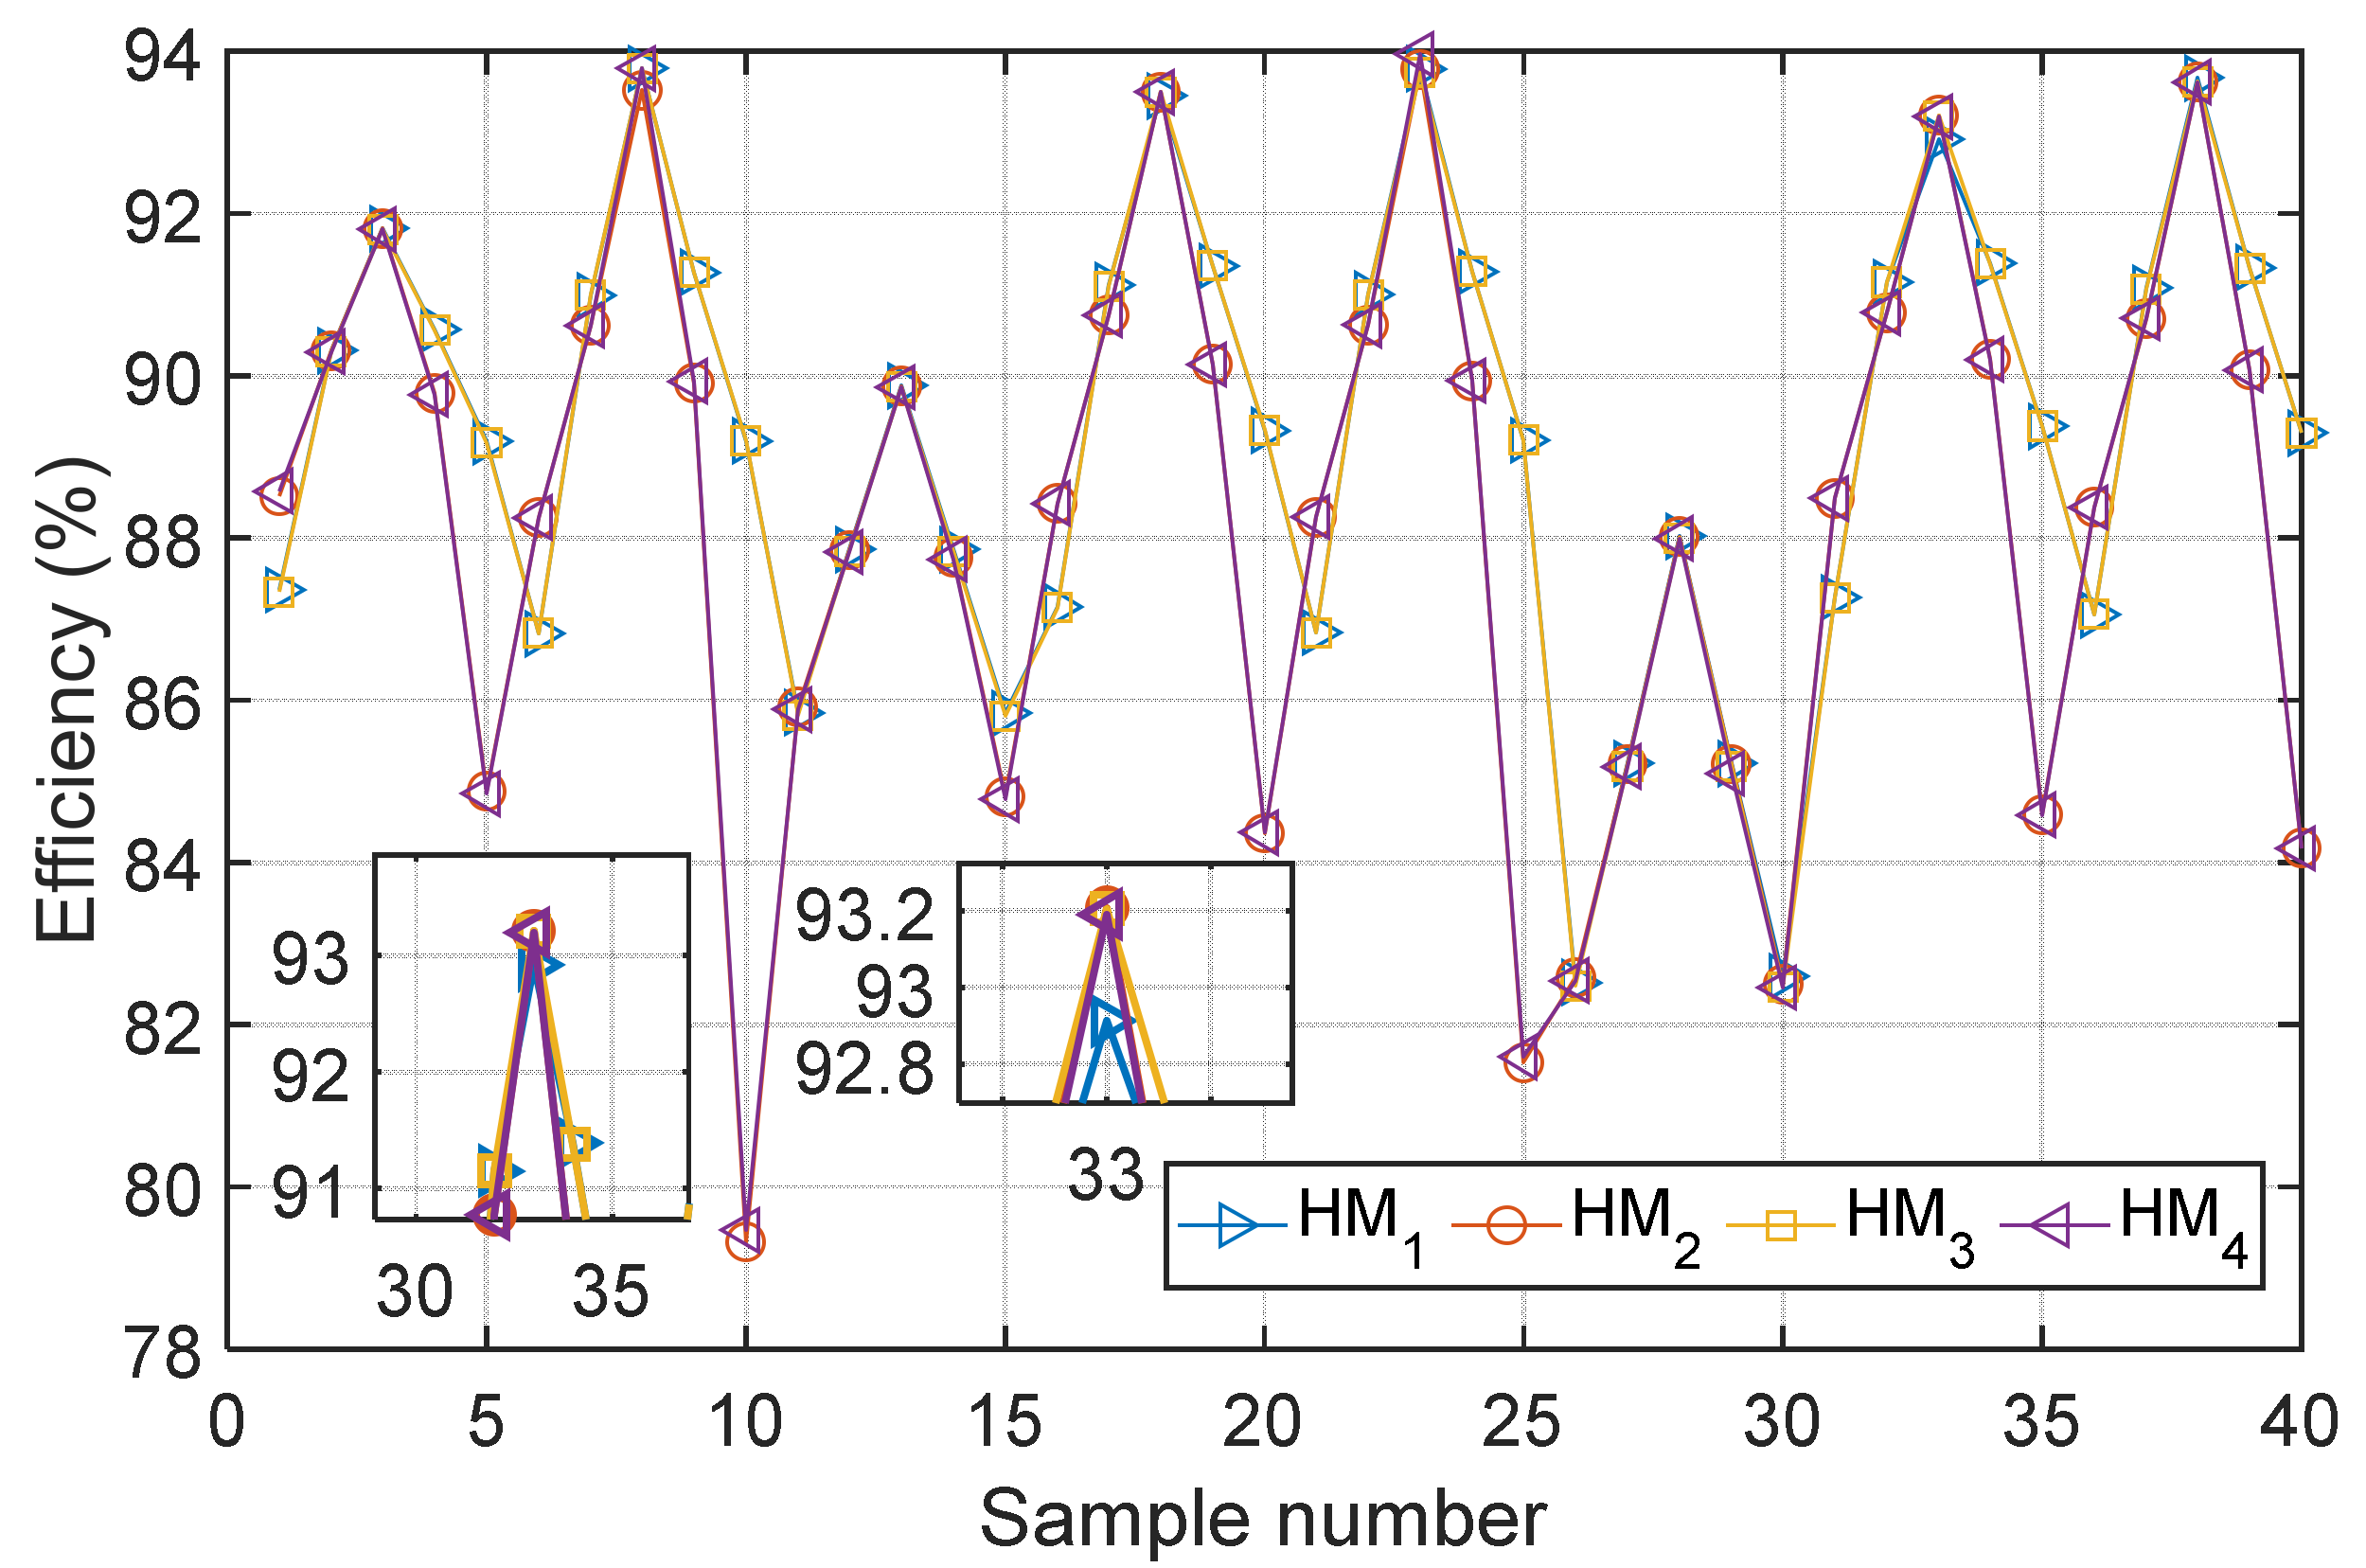
We explored the efficiency characteristics of a new 5-stage HMCVT. According to the full factorial test results (with a total of 160 groups of sample data), the working stages using the same planetary row had similar efficiency characteristics. Moreover, when the hydraulic power flow and the mechanical power flow were input from the sun gear and the planet carrier (output from the planetary row), respectively, the working efficiency was slightly higher than that in the case where the hydraulic power flow and the mechanical power flow were input from the sun gear and the planet carrier (output from the gear ring), respectively. The efficiency characteristics of HMCVT at different working stages showed two variation laws with the boundary of .
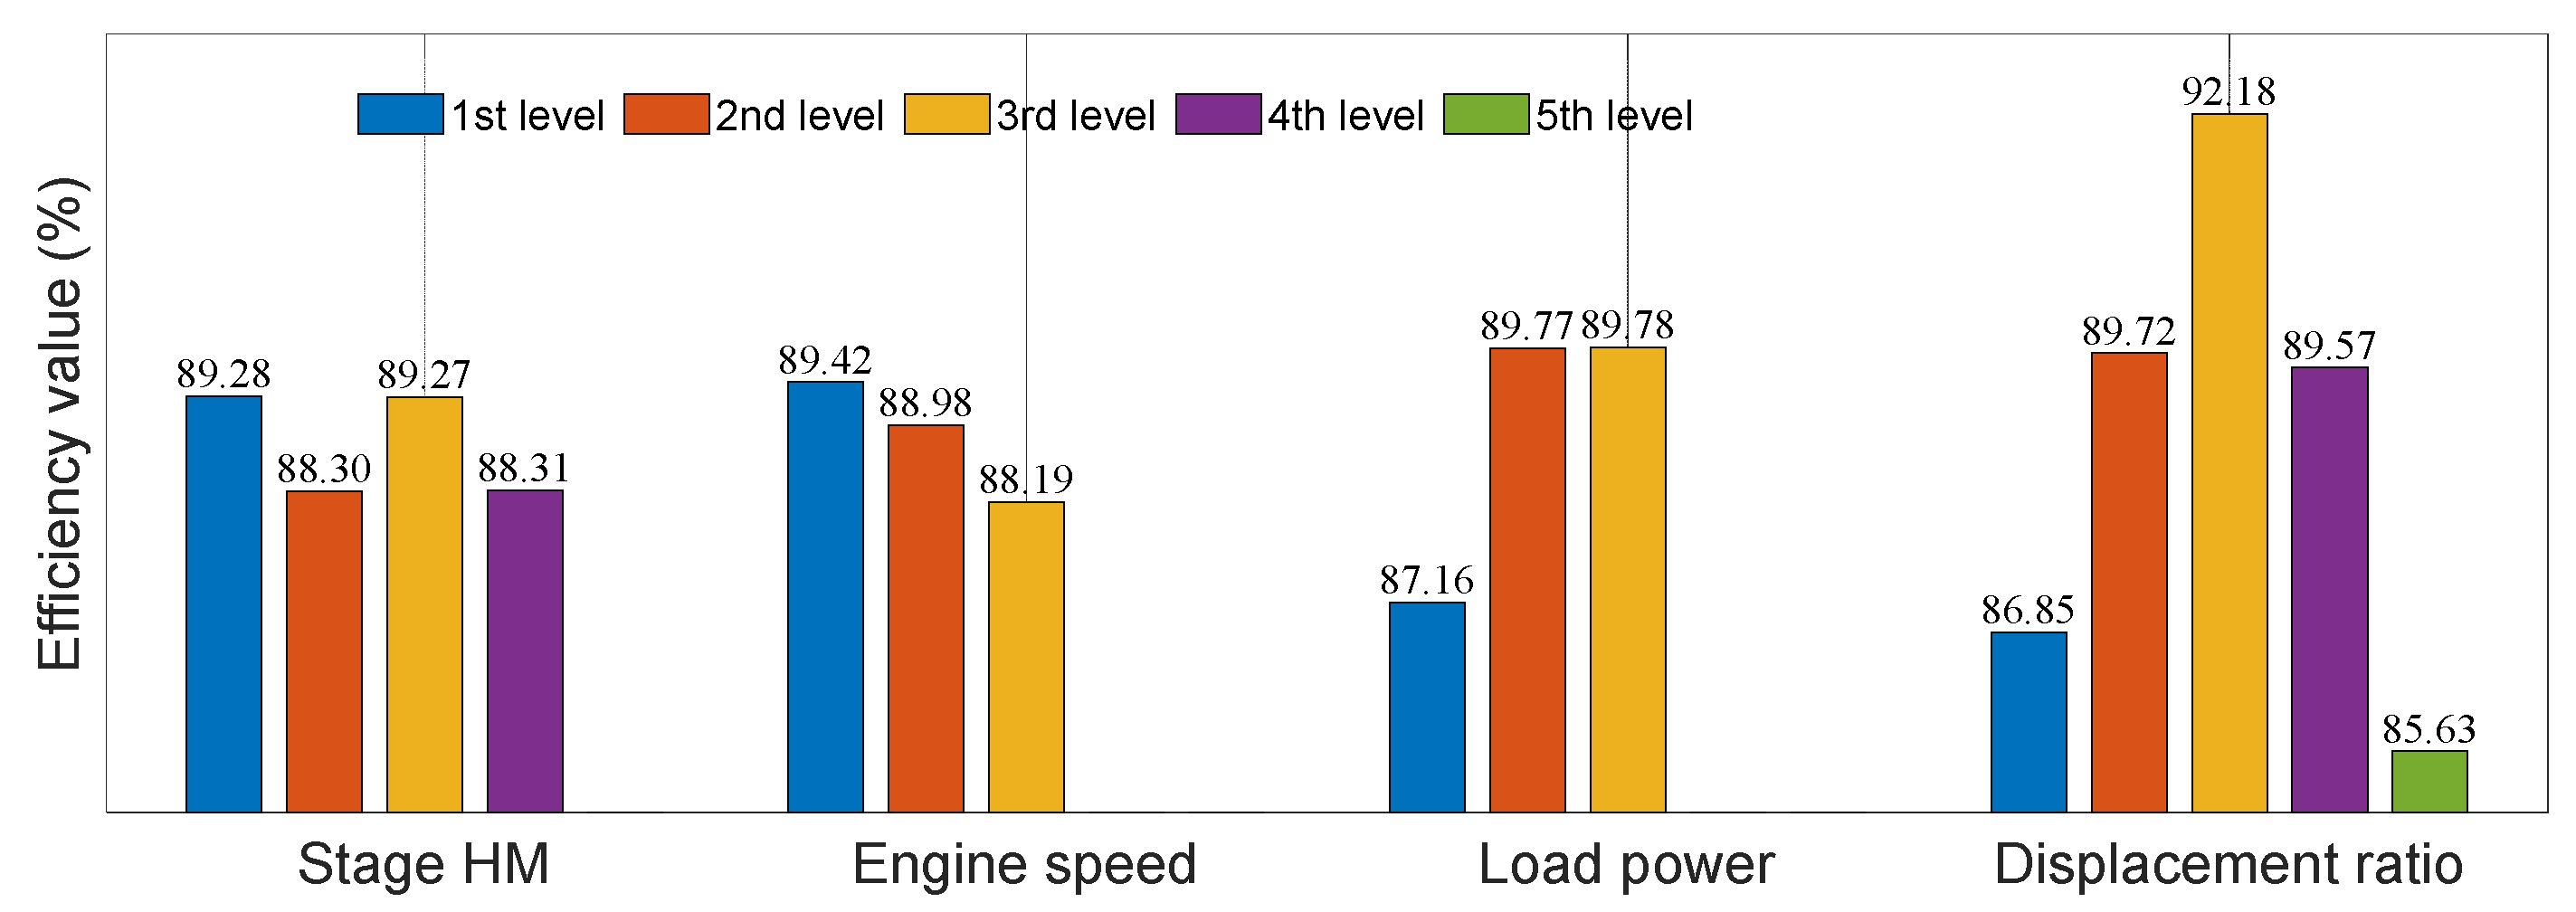
The range analysis results showed that the factors’ ranking by the influence on efficiency characteristics was displacement ratio > load power > engine speed > stage HM. The influences of load power and engine speed on efficiency characteristics were the positive correlation and the negative correlation, respectively. The influences decreased as the load power and the engine speed increased.
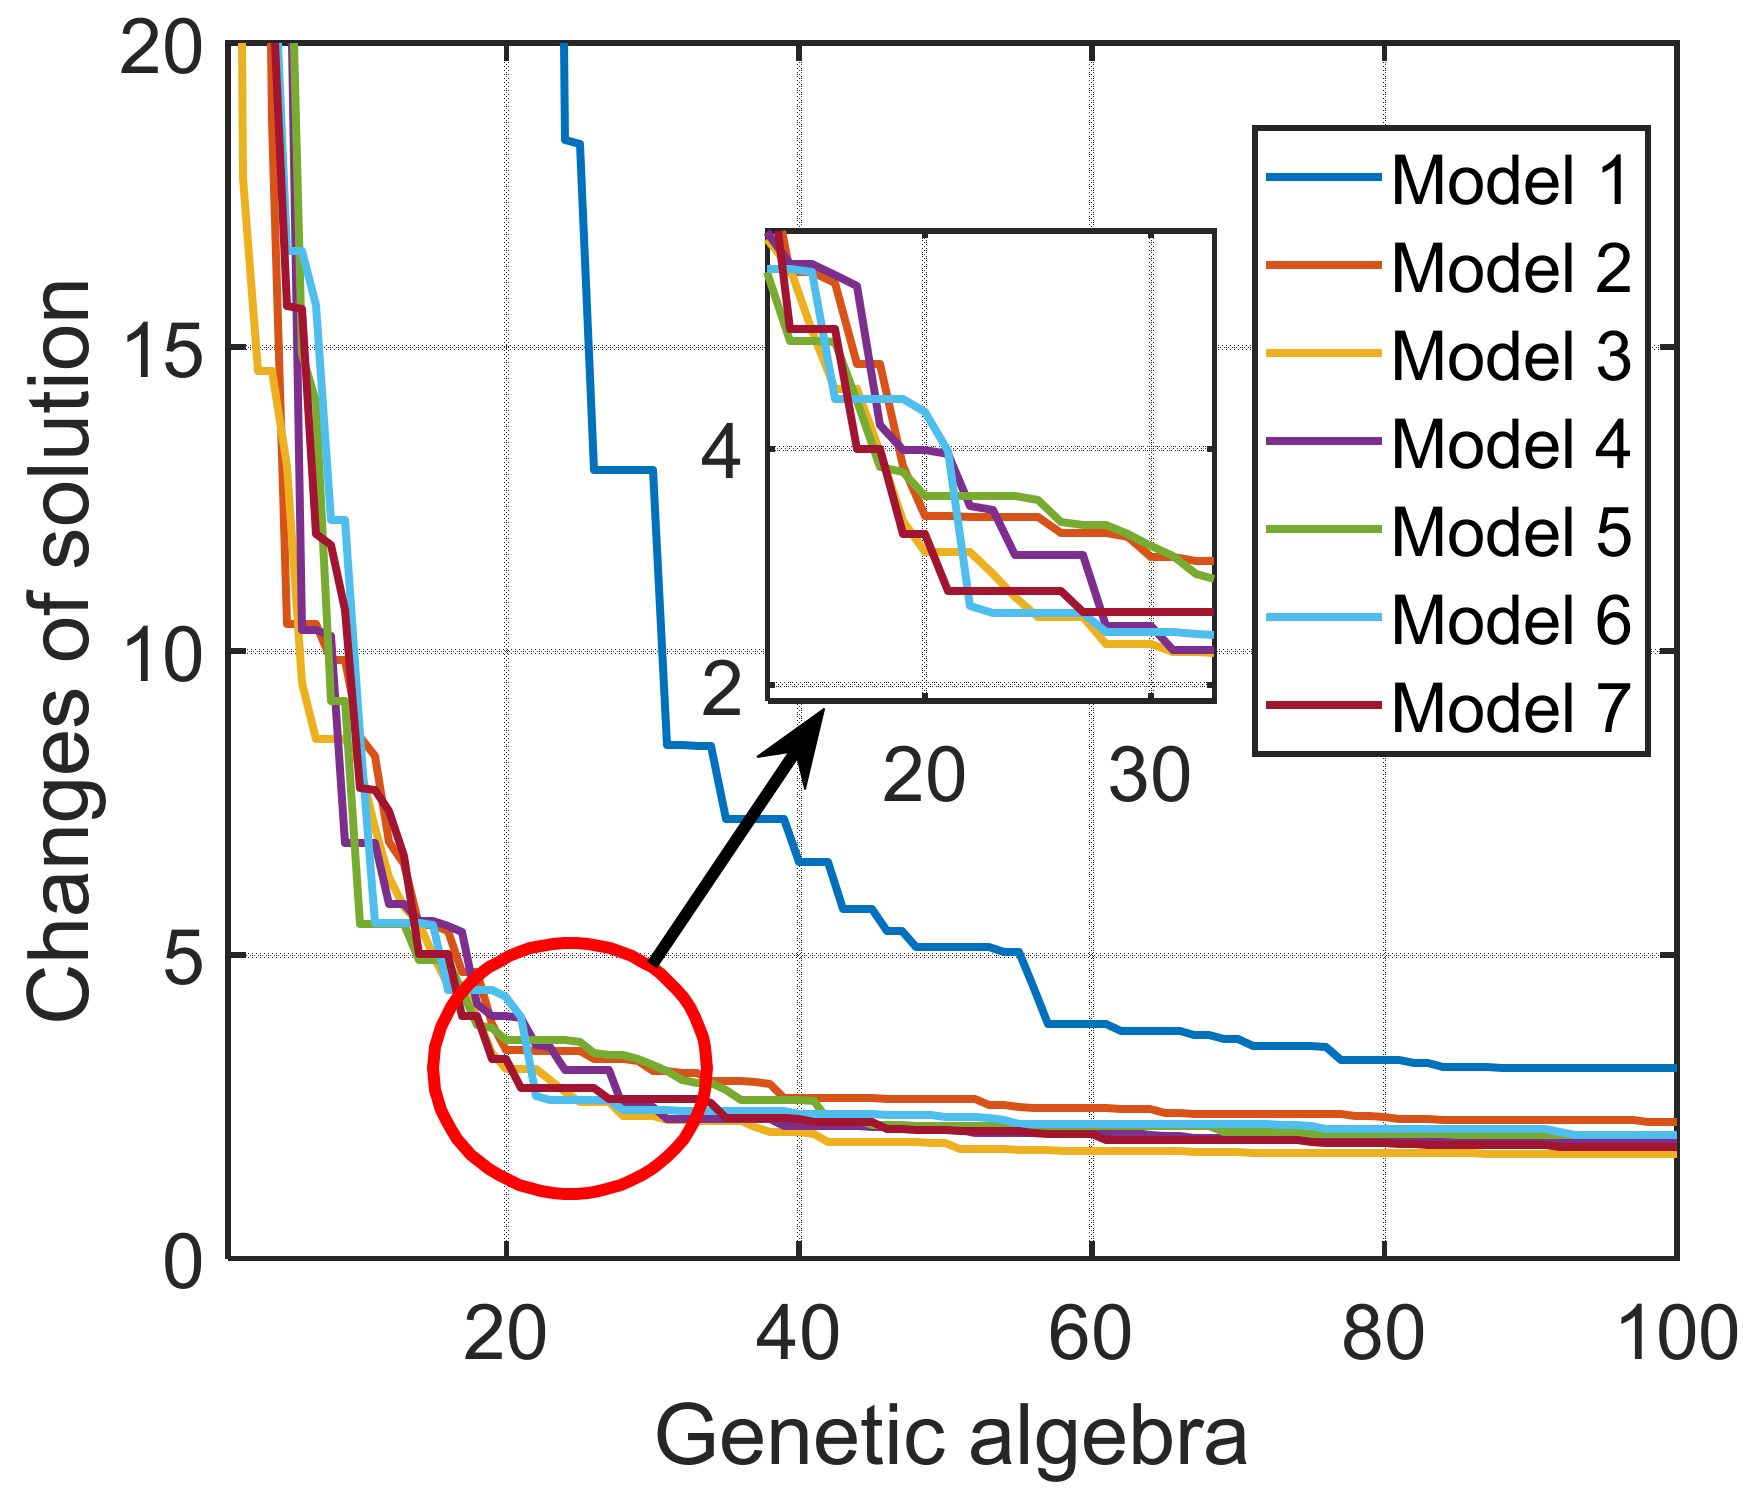
The proposed I-GA-based piecewise modeling method for HMCVT efficiency characteristics had a good modeling result. The MAPE of all models (a total of seven models) had an error range of 1.6884~3.1375% used the stage HM1 as an example. The two-factor model considered the displacement ratio and the load power as independent variables and could be applied to the case with less test data. The two-factor model could be corrected by introducing the first-order term of engine speed, in which case the MAPE was reduced by 7.7024% and the R2 was improved by 9.2943%.


 ,
, 


