Article

Research on the Controllable Interface Response Enhancement of the Textured Pilot Valve

1
Department of Mechanical Engineering, Hangzhou Dianzi University, Hangzhou 310018, China
2
Department of Mechanical Engineering, China Jiliang University, Hangzhou 310018, China
*
Author to whom correspondence should be addressed.
Machines 2022, 10(5), 357; https://doi.org/10.3390/machines10050357
Submission received: 28 February 2022 / Revised: 25 April 2022 / Accepted: 28 April 2022 / Published: 10 May 2022
(This article belongs to the Section Machine Design and Theory)

Abstract

:
Based on the textured controllable interface effect, the dynamic performances of the textured and ordinary pilot valve are analyzed experimentally, and the influence of the textured controllable interface on the response of pilot valve is studied. Results show that when Pin is small, the textured surface shortens the reciprocating time of valve core, increasing the flow rate, and speeds up the piston stroke of oil cylinder. The valve core actions much more stable and sensitivity. Meanwhile, combined with the theoretical calculation, the operation mechanism of texturing the pilot valve is analyzed. It is concluded that the stress of textured valve core sealing surface is greater than that of ordinary one, and the pressure difference gradually decreases with the increase in Pin, and the flow difference is basically the same as the force on the sealing surface. This indicates that the textured surface improves lubrication characteristics, reduces the friction between components. The textured valve makes the velocity changes gently, and enhances the responsiveness and stability of the valve. Those related results provide a new idea for enhancing the response design of the pilot valve.

1. Introduction

At present, the propulsion power of high-tech ships is basically driven by the steam turbine, and the steam quantity can be adjusted timely and accurately by the steam valve to meet the increasing mobility requirements of speeds change and directions change. The pilot valve is a kind of control valve which depends on the oil pressure and electromagnetic signal to change the displacement of the slide valve so as to control the system [1]. The unsteady operation of the pilot valve is the key to the oil engine failure and the weak link of the main steam regulation system. The oil film of the pilot valve has the characteristics of medium pollution and flow instability, which can easily lead to problems, such as hydraulic clamping, increased leakage, delay of control signal transmission, etc. [2,3,4], resulting in the imbalance of actuator and control system, and even vibration, eccentric wear, and fracture of the valve core. Therefore, how to optimize the clearance of the pilot valve to realize rapid and continuous transportation, forming a complete liquid film, and reducing the friction resistance of valve core movement, improving the response speed, is a burning question in the transportation control of liquid flow.
It is well-known that the valve performance is related to clearance flow and friction characteristics. Many scholars pointed out that low frequency and high-amplitude vibration of the valve [5], oil pollution [6], and so on are easy to cause friction between the valve stem and sleeve, resulting in the jam phenomenon. Frosina et al. [7] found that the hydrodynamic force in the valve would reduce the valve performance during the stem displacement. Sun Ping [8] analyzed the response problems of the pilot valve axial force and closing speed of the turbine governing system. Sweeney [9] proposed the hydraulic clamping was caused by the uneven distribution of the hydraulic pressure, and the groove [10] was machined on the valve core to reduce the volume of the valve [11], which affected the lubrication characteristics, improved the clamping problem, but increased the internal leakage. Lisowski, Wang Yongjiu et al. [12,13] modified the valve core structure to improve the flow field and flow characteristics, and solved the problems of wear and jam of hydraulic servo motor [14,15]. Those methods could improve the friction characteristics of the liquid film and enhance the response characteristics of the valve, but it had a great impact on the use of the system due to the change of the existing structure or the increase in internal leakage and other new problems.
It is well known that the reasonable texture design can reduce the friction between gas–liquid and gas–solid surfaces. In some special occasions, texture can reduce the vibration and noise of the workpiece. Etsion [16,17] processed texture inside the friction pair of piston ring to enhance the lubrication characteristics of piston ring and reduce friction resistance, and showed the friction force on the textured surface was far less than that on the smooth surface. Pan et al. [18] found that the microhole texture and vertical microgroove texture were able to effectively reduce the surface roughness of the workpiece. Xiuqing Hao [19] fabricated the microstructures on the inner surface of the hybrid bearing, and showed the micro-texture with reasonable area ratio could significantly reduce the vibration amplitude under water film lubrication. Gherca [20] proposed the textures on the rotor could improve the hydrodynamic performance of the thrust bearing. Liu Honglong [21] carried out an experimental study on the tribological properties of textured surfaces based on the point contact between ball and disc high pairs, and concluded the micro-texture exhibited better lubrication and friction reduction effects at higher frequencies. Haiwu Yu [22] adopted the successive overrelaxation method to obtain the average dynamic pressure of circular, elliptical, and triangular texture pits on the sliding direction of bearings in different directions, and the ellipse perpendicular to the sag direction had the best bearing capacity. Yang LJ et al. [23] put forward femtosecond laser modification of micro-textured surface on bearing steel GCr15 to reduce frictional wear and enhance load capacity. Reddy [24] studied the tribological performance of textured parallel sliding contact under mixed lubrication condition, and the texture shape has a significant effect. Han Zhibin et al. [25] tested and analyzed the influence of structural parameters of pit texture on the lubrication performance of graphite materials, results show that the pit texture had a certain anti-friction effect under the condition of water lubrication. The lubrication of the clearance of the pilot valve directly affects the stability and responsiveness, which means it is the same as other friction pair, is expected to pass the friction pair surface texture change operating characteristics.
In view of this, based on the enhancement control between the morphology of textured and performance of the pilot valve, taking the textured controllable interface effect as the breakthrough point, making a new type of core with surface texture by laser marking machine. The flow rate of valve, the corresponding displacement of hydraulic cylinder piston rod, and the outlet pressure are studied experimentally. The influence of textured controllable interface on the response of pilot valve is studied. Then, based on the fluid lubrication, the operation mechanism of the textured pilot valve is defined, and the interface friction control is realized. Those related results provide a new idea for enhancing the response design of pilot valve.

2. Experiment Details

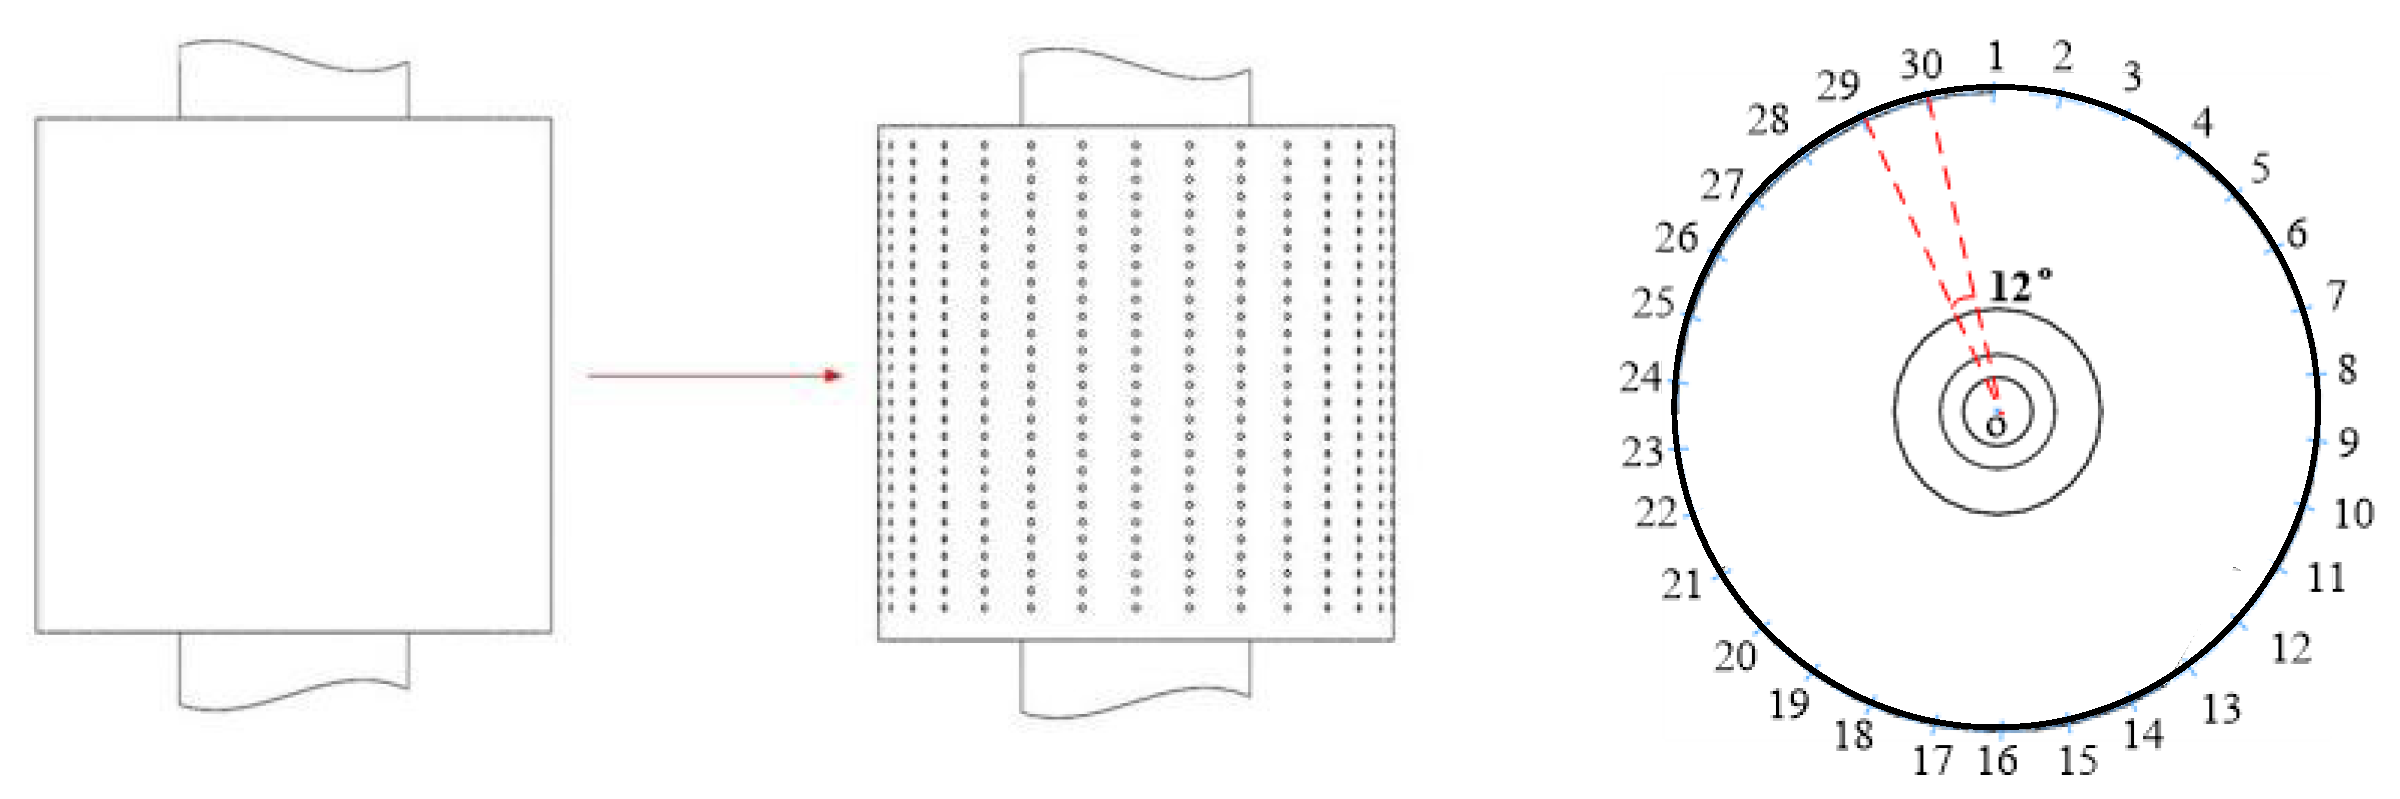
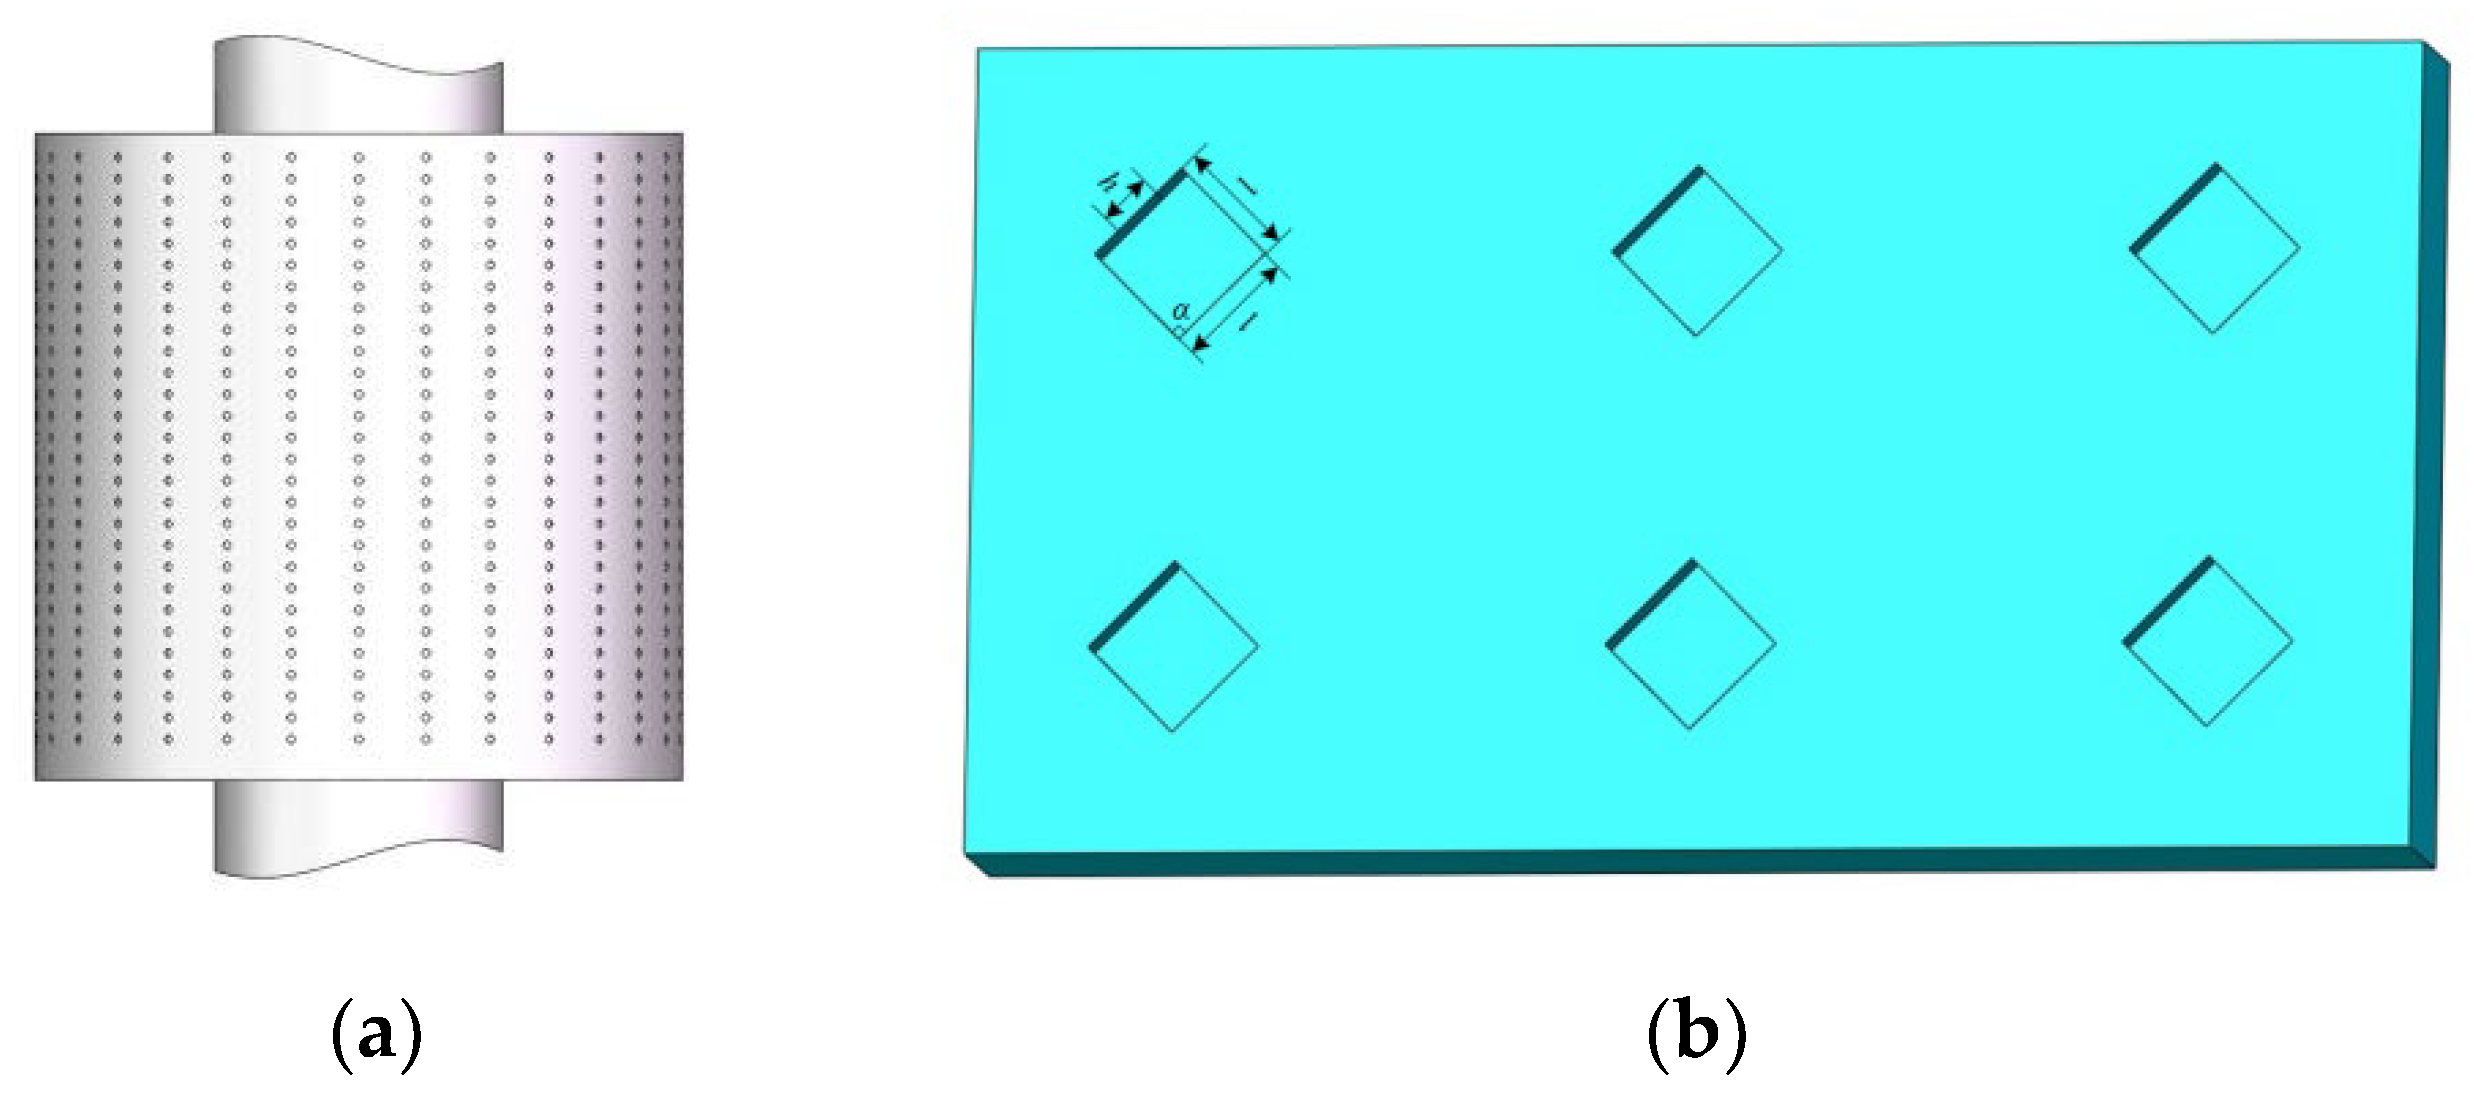
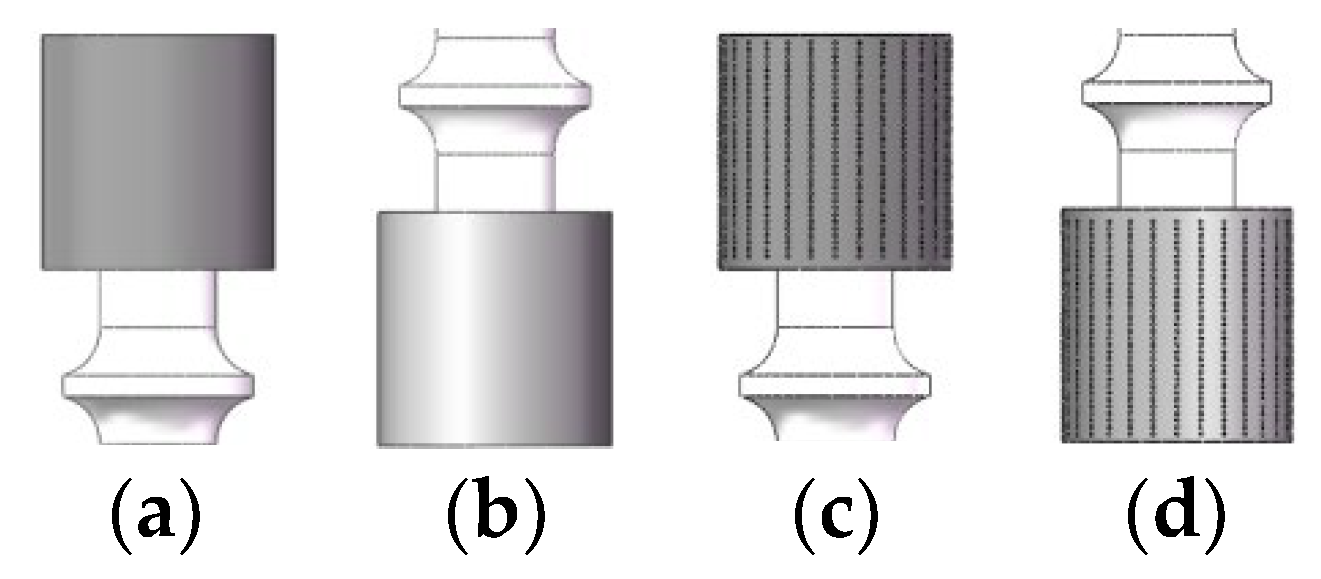
2.1. Pilot Valve Core Treatment

Studies have shown [26] that the shark skin can reduce the fluid resistance because of the special rhombus texture which makes them swim fast. Therefore, proper rhomboid texture can reduce the fluid resistance, accelerating the fluid movement, and effectively improve the dynamic lubrication characteristics.
Figure 1 shows the sealing section on the outer surface of the core (valve core shoulder) is textured. The surface of the valve core is divided into 30 areas along the circumference, and each area can be approximately regarded as a plane. The valve core center axis is used as the center of rotation, and the fiber laser marking machine processes the design pattern along the center line of each area. When one area is processed, the valve core needs to rotate 12° to make the next area, until the texture is fully processed.
Relevant studies [27] show that the friction coefficient is the minimum when the texture diameter is d = 300 μm and the depth h = 40 μm. A rhomboid texture with side length l = 300 μm, depth h = 40 μm and angle α = 90° between two adjacent sides is designed. The core has five shoulders in direct contact with the sleeve, with a total length of L = 90 mm. Figure 2 is the schematic diagram of textured surface of pilot valve core.

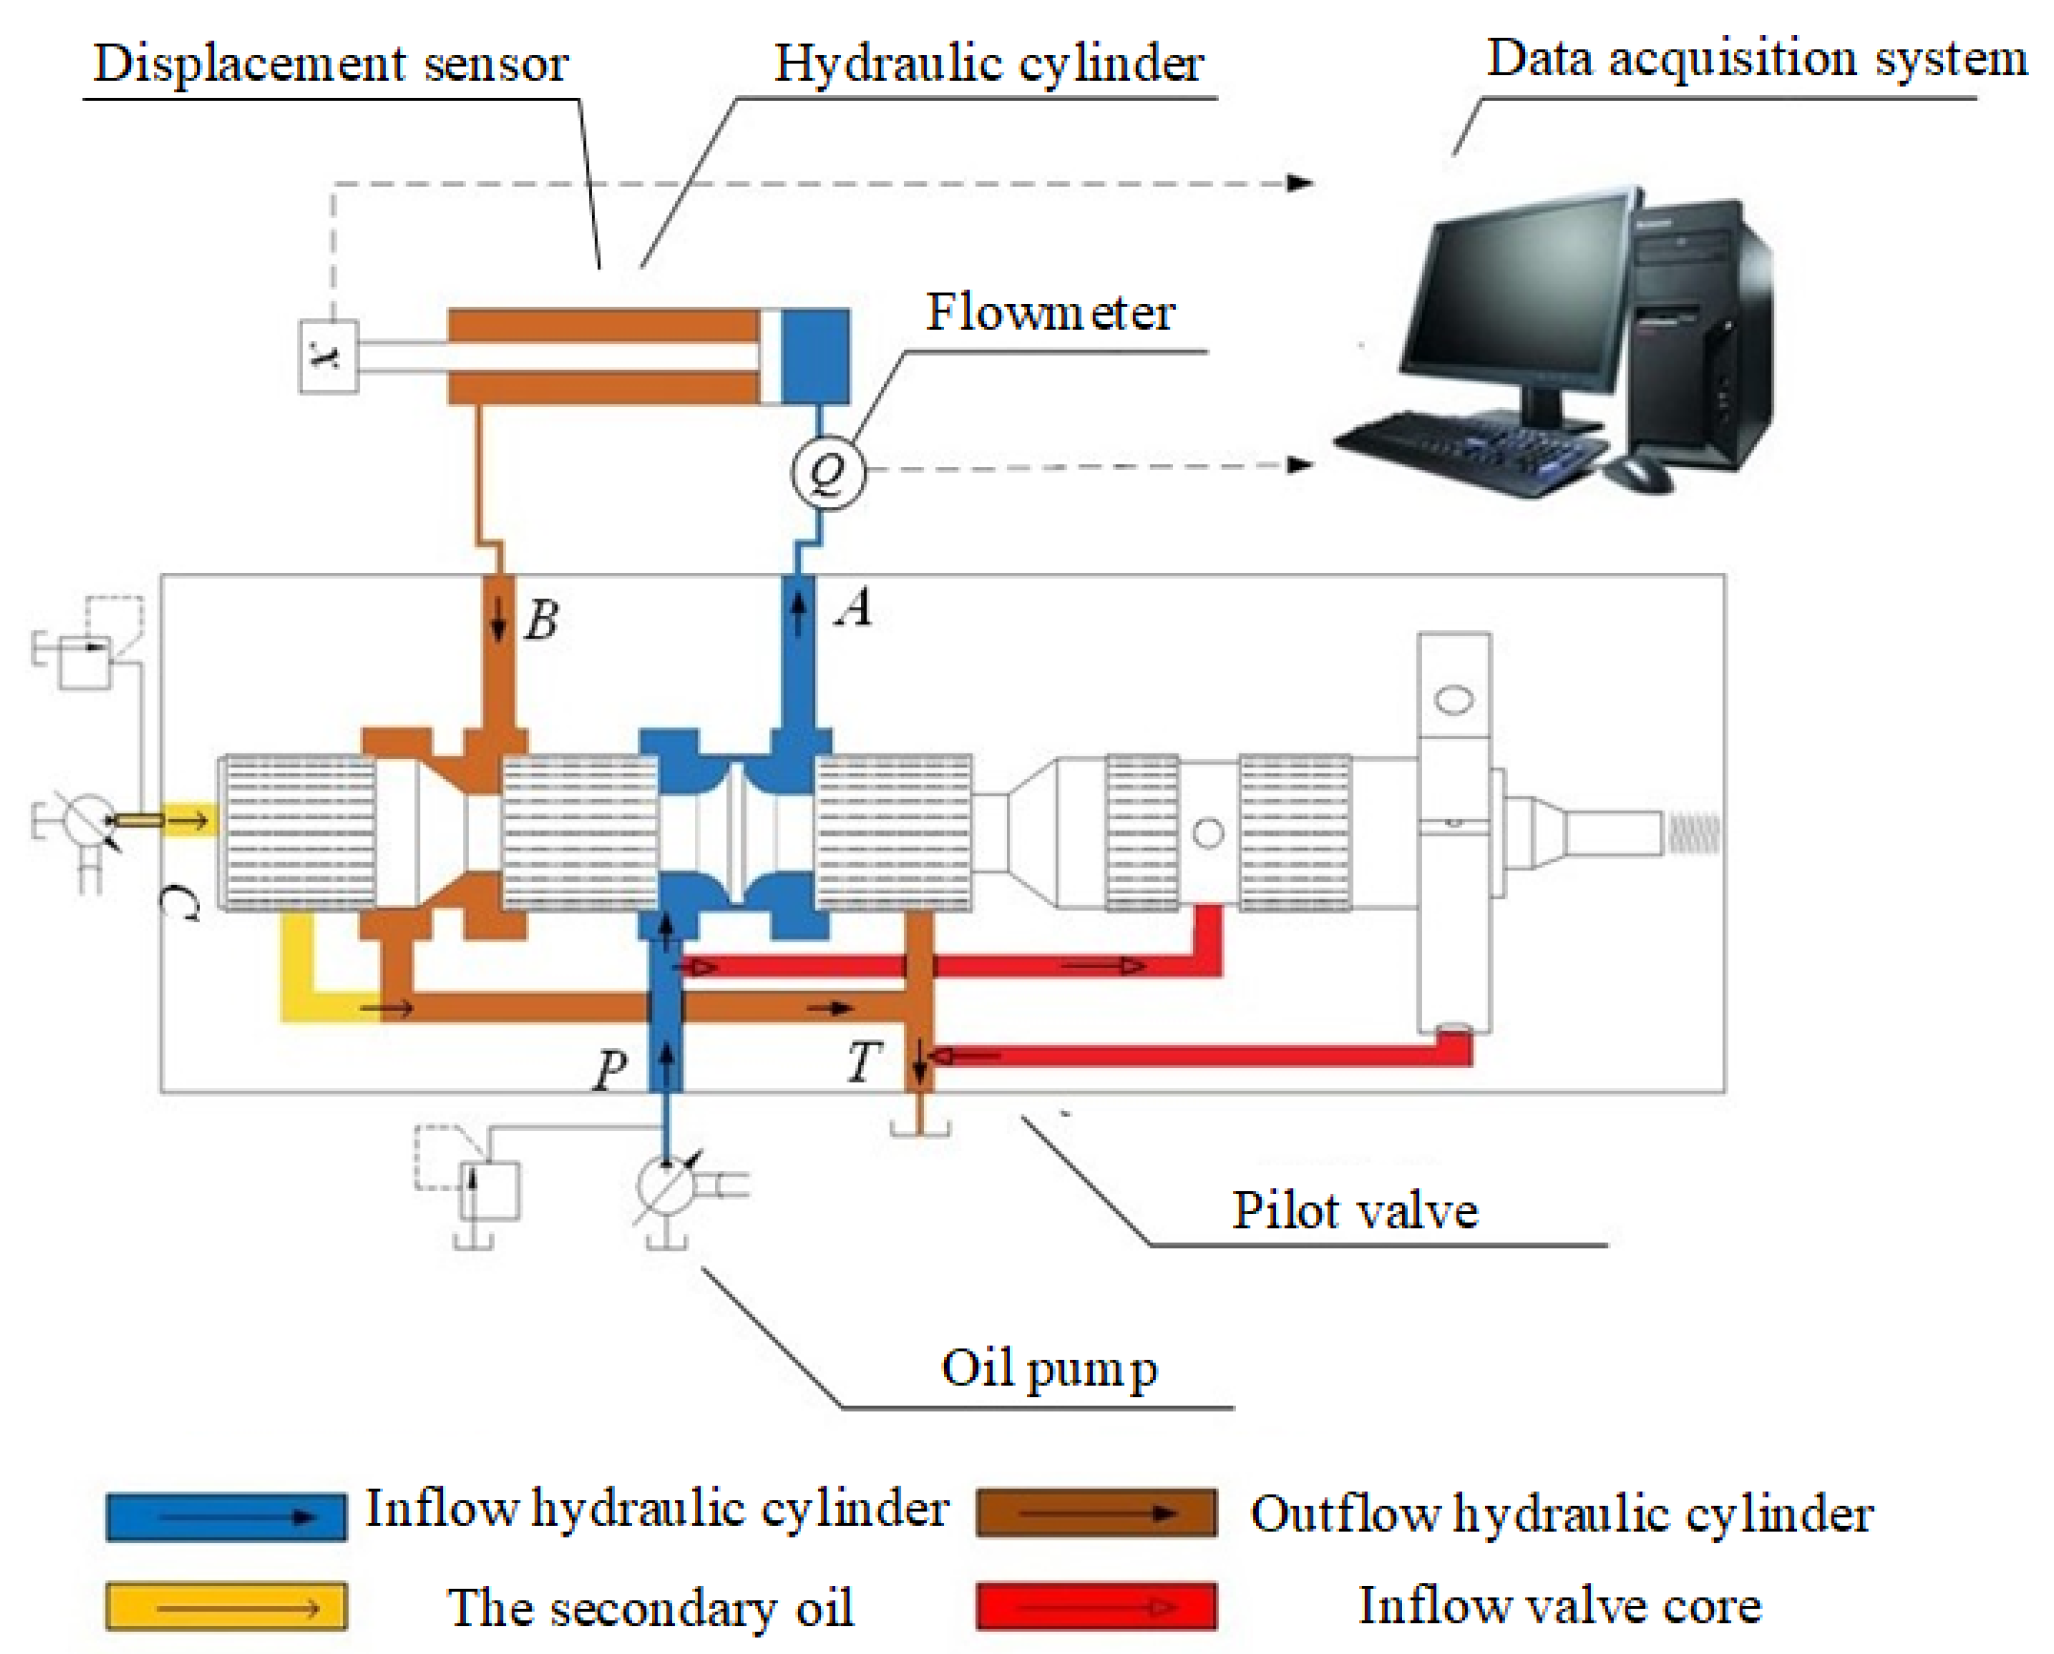
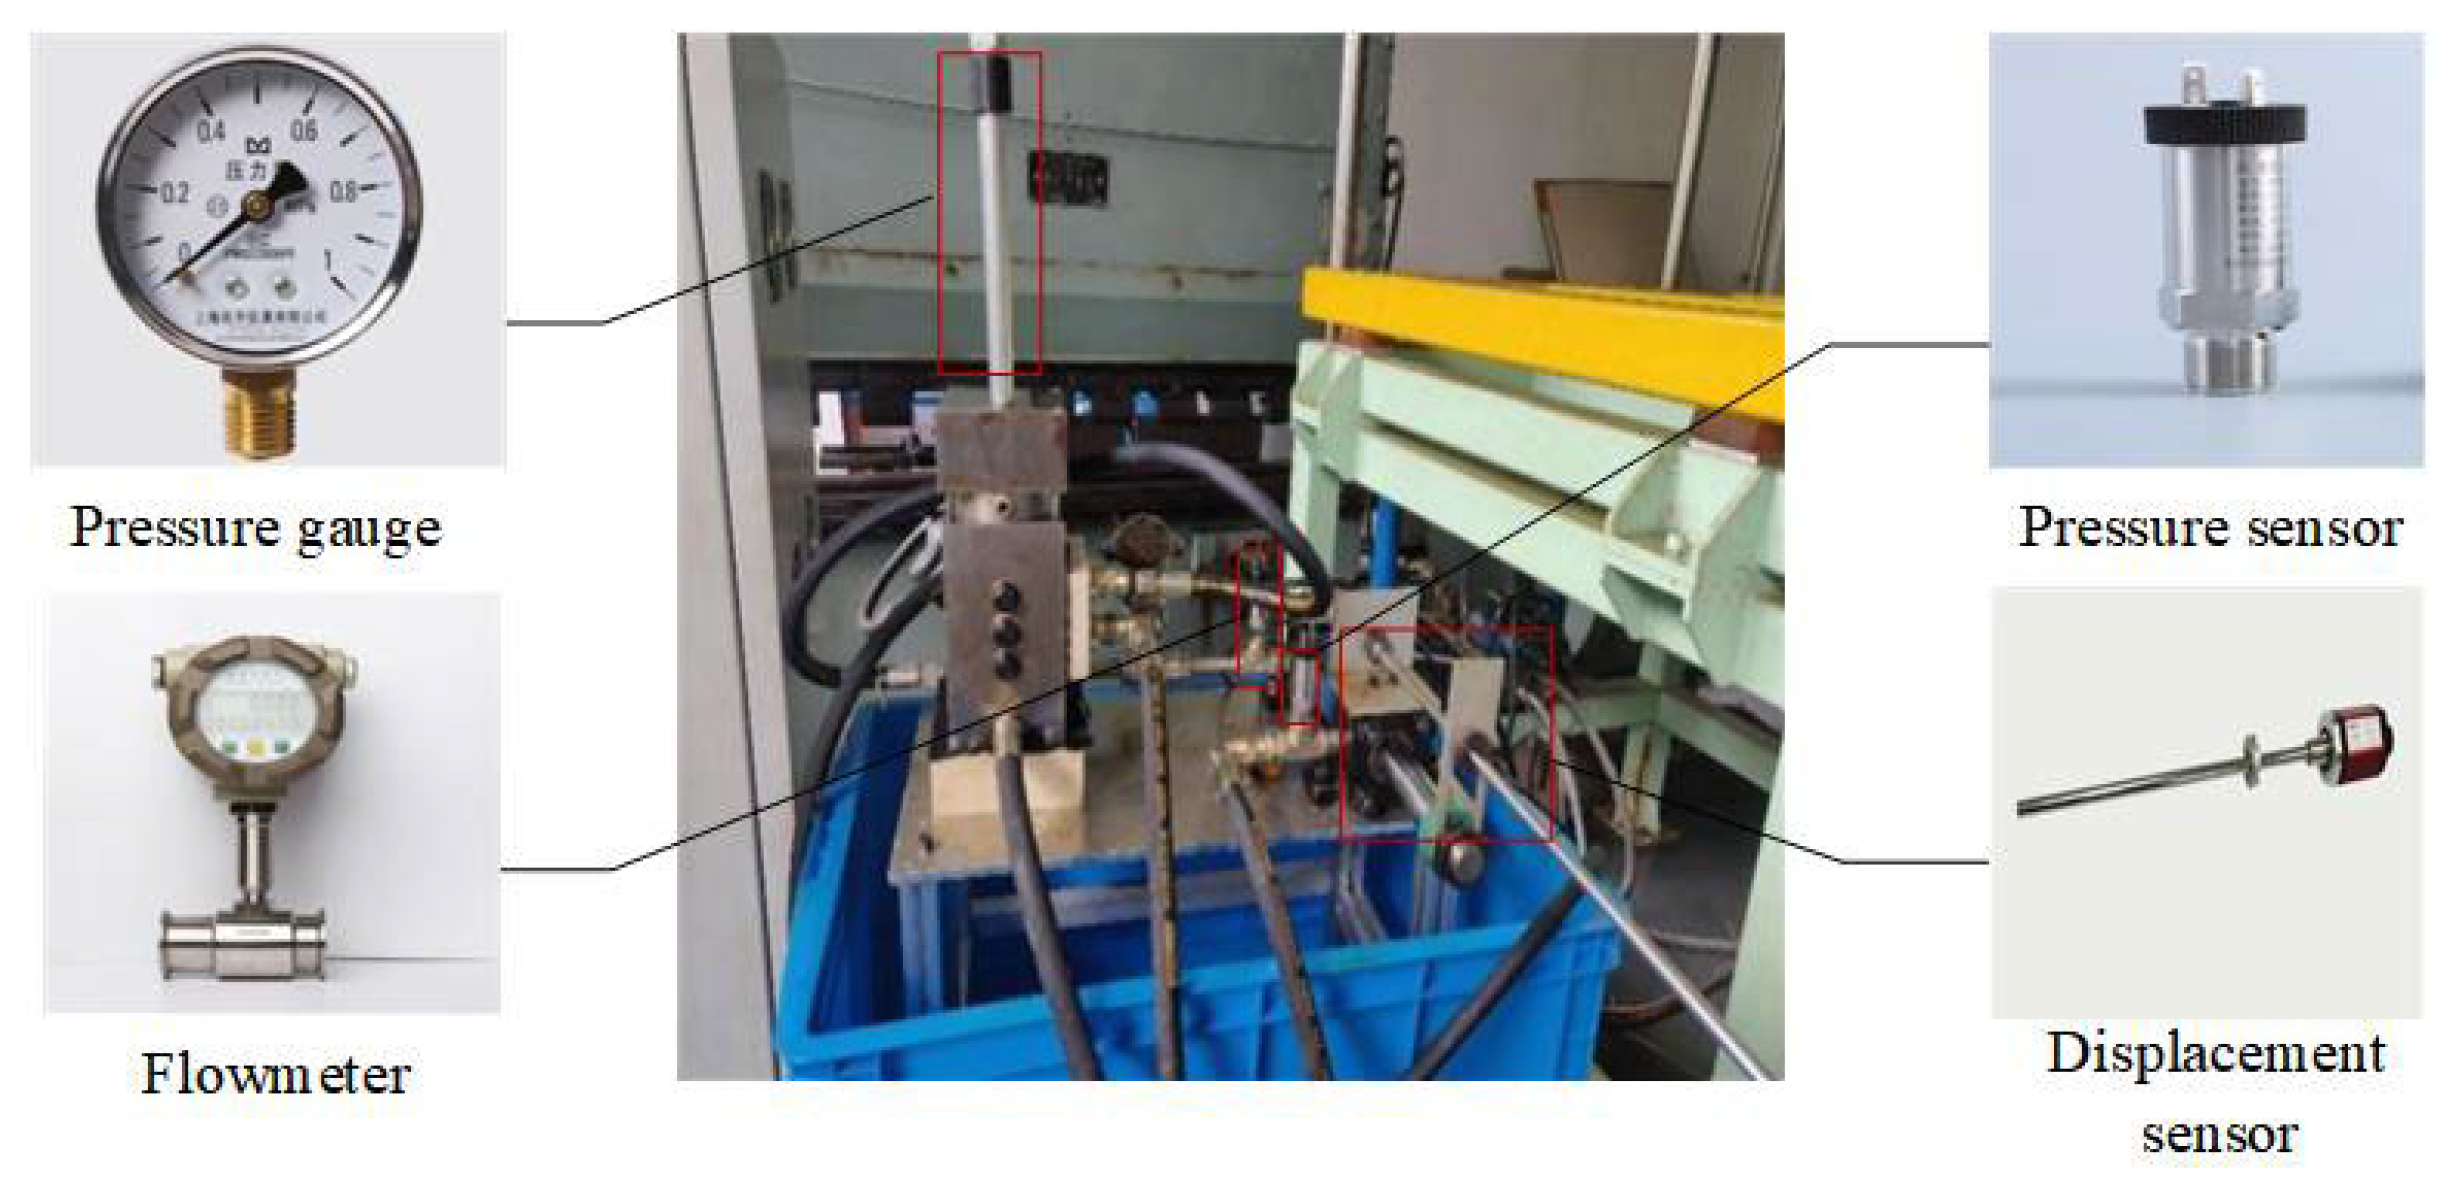
2.2. Pilot Valve Experiment Design

Figure 3 shows the experimental system diagram of pilot valve. The hydraulic oil enters the pilot valve from port P, and the pilot valve outlet A and B are, respectively, connected with the cylinder. The secondary oil pressure at port C controls the valve core to move left and right, it makes the pilot valve outlet A and B switch. The port P and C are equipped with a regulating valve to control the pressure at the inlet, and the pressure sensor and flow sensor are installed at the oil inlet of the cylinder to detect the flow and pressure at the inlet of the cylinder. After the secondary oil pressure increasing, the valve core moves right, and the port A channel opens, the power oil enters the cylinder and pushes the piston to move to the left. When the secondary oil pressure drops, the valve core moves left, port B channel opens, the hydraulic oil enters the cylinder and pushes the piston to run to the right. The measured signals of cylinder piston displacement Δx, outlet pressure P and flow Q at port A are detected. The influence of the textured valve core on the performance is studied under different pressure. After smoothing the measured signal curve, Δx, Q, and P dynamic characteristic curves are obtained. The influence of textured valve core on its flow characteristics during the startup process of pilot valve is analyzed.
Figure 4 shows the corresponding experimental devices, such as flowmeter, displacement sensor, pressure sensor, and pressure gauge are installed on the experimental system for testing the measured signals such as P, Δx, and Q. Table 1 shows the main symbols and meanings in the paper. Table 2 shows the main measuring equipment.

2.3. Results and Discussion

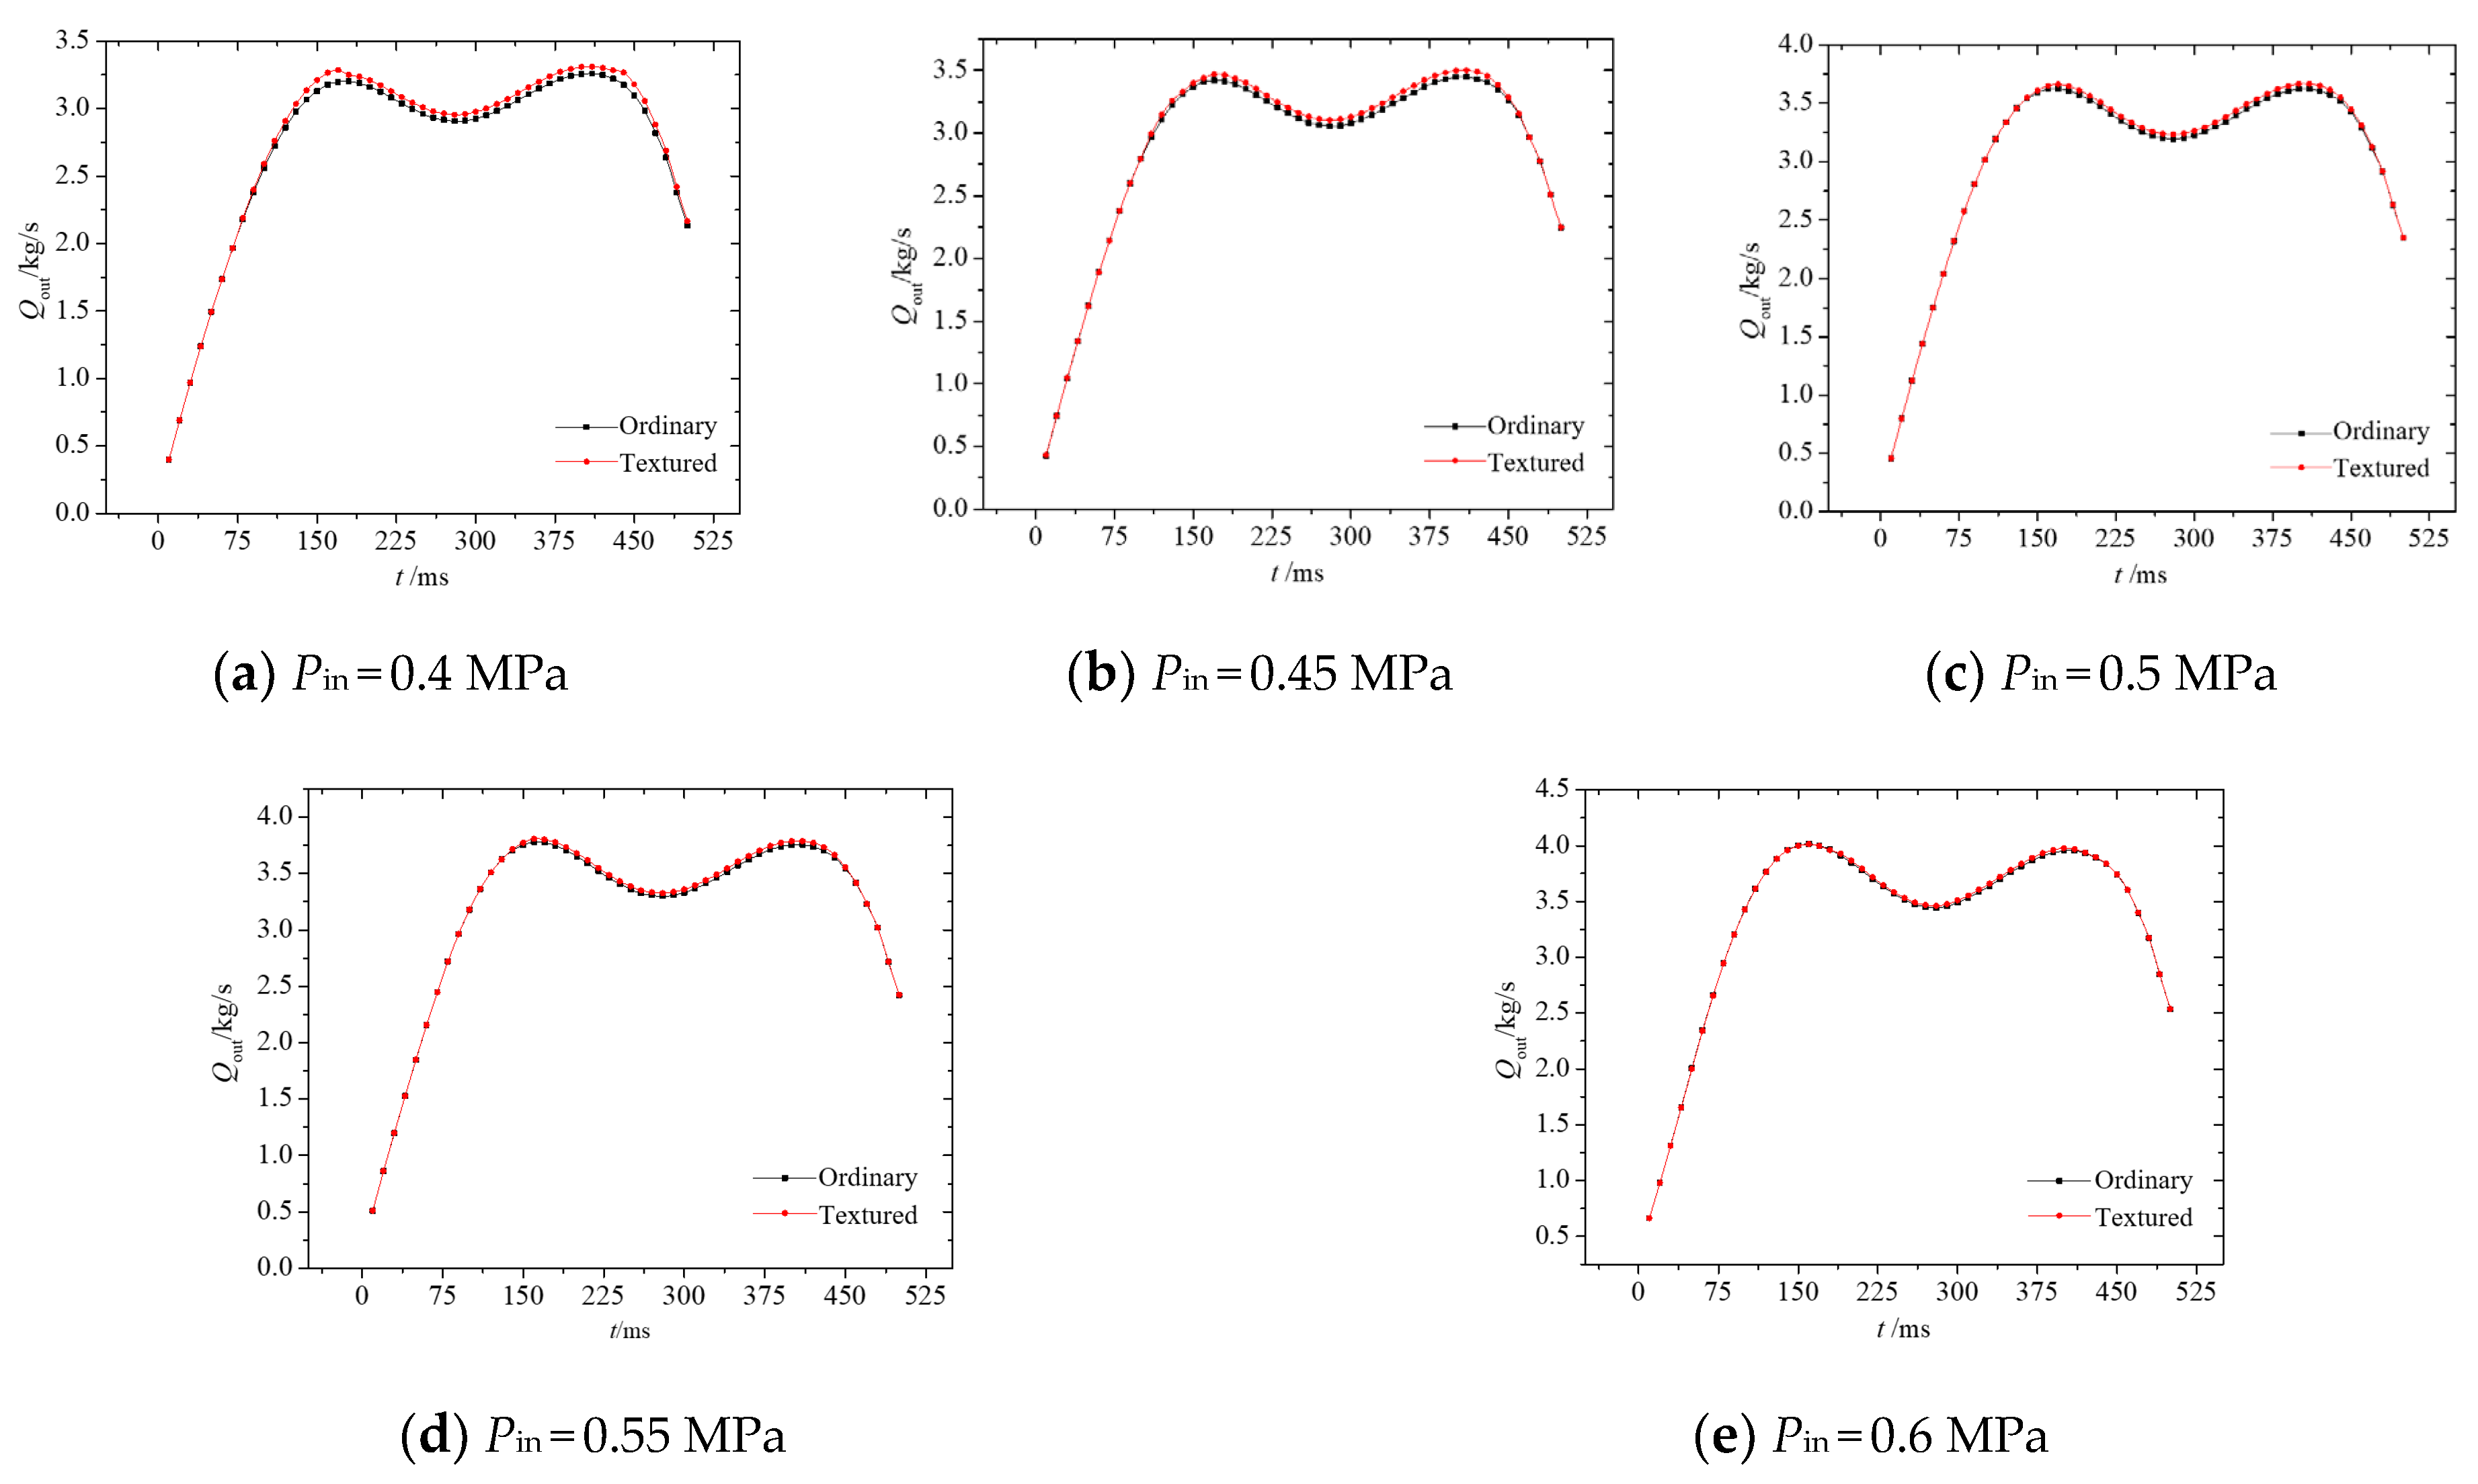
2.3.1. Influence of Response on Outlet Flow

Figure 5 shows the Q (port A) dynamic characteristic curve of the two kinds of pilot valve. Results show that the flow curve can be divided into three stages. The first stage is the initial stage which only the power oil is fed, and the secondary oil valve port is closed. The second stage is the piston running stage. During this stage, the secondary oil valve port is opened, the valve core moves up, and the Q gradually increases. The third stage is the stable stage which the piston reaches the maximum displacement and Q remains unchanged. When the Pin is 0.4 MPa to 0.6 MPa, the maximum difference between the ordinary and textured pilot valve flow is ΔQ0.4 = 1 m3/h, ΔQ0.45 = 0.8 m3/h, ΔQ0.5 = 0.5 m3/h, ΔQ0.55 ≈ ΔQ0.6 = 0. It can be seen that the Q of the textured pilot valve is always greater than that of the ordinary one, and the textured valve Q reaches the stable stage is much faster than the ordinary one. With the increase in Pin, the difference of the Q decreases, and the time difference reaches the stable stage is also narrowing. Q is related to the response speed V of the pilot valve (QV), so the response speed of the textured valve core is higher than that of the ordinary one under low pressure, and the textured surface can improve the response speed of the valve. This indicates the textured surface improves lubrication characteristics, and reduce the friction between components.

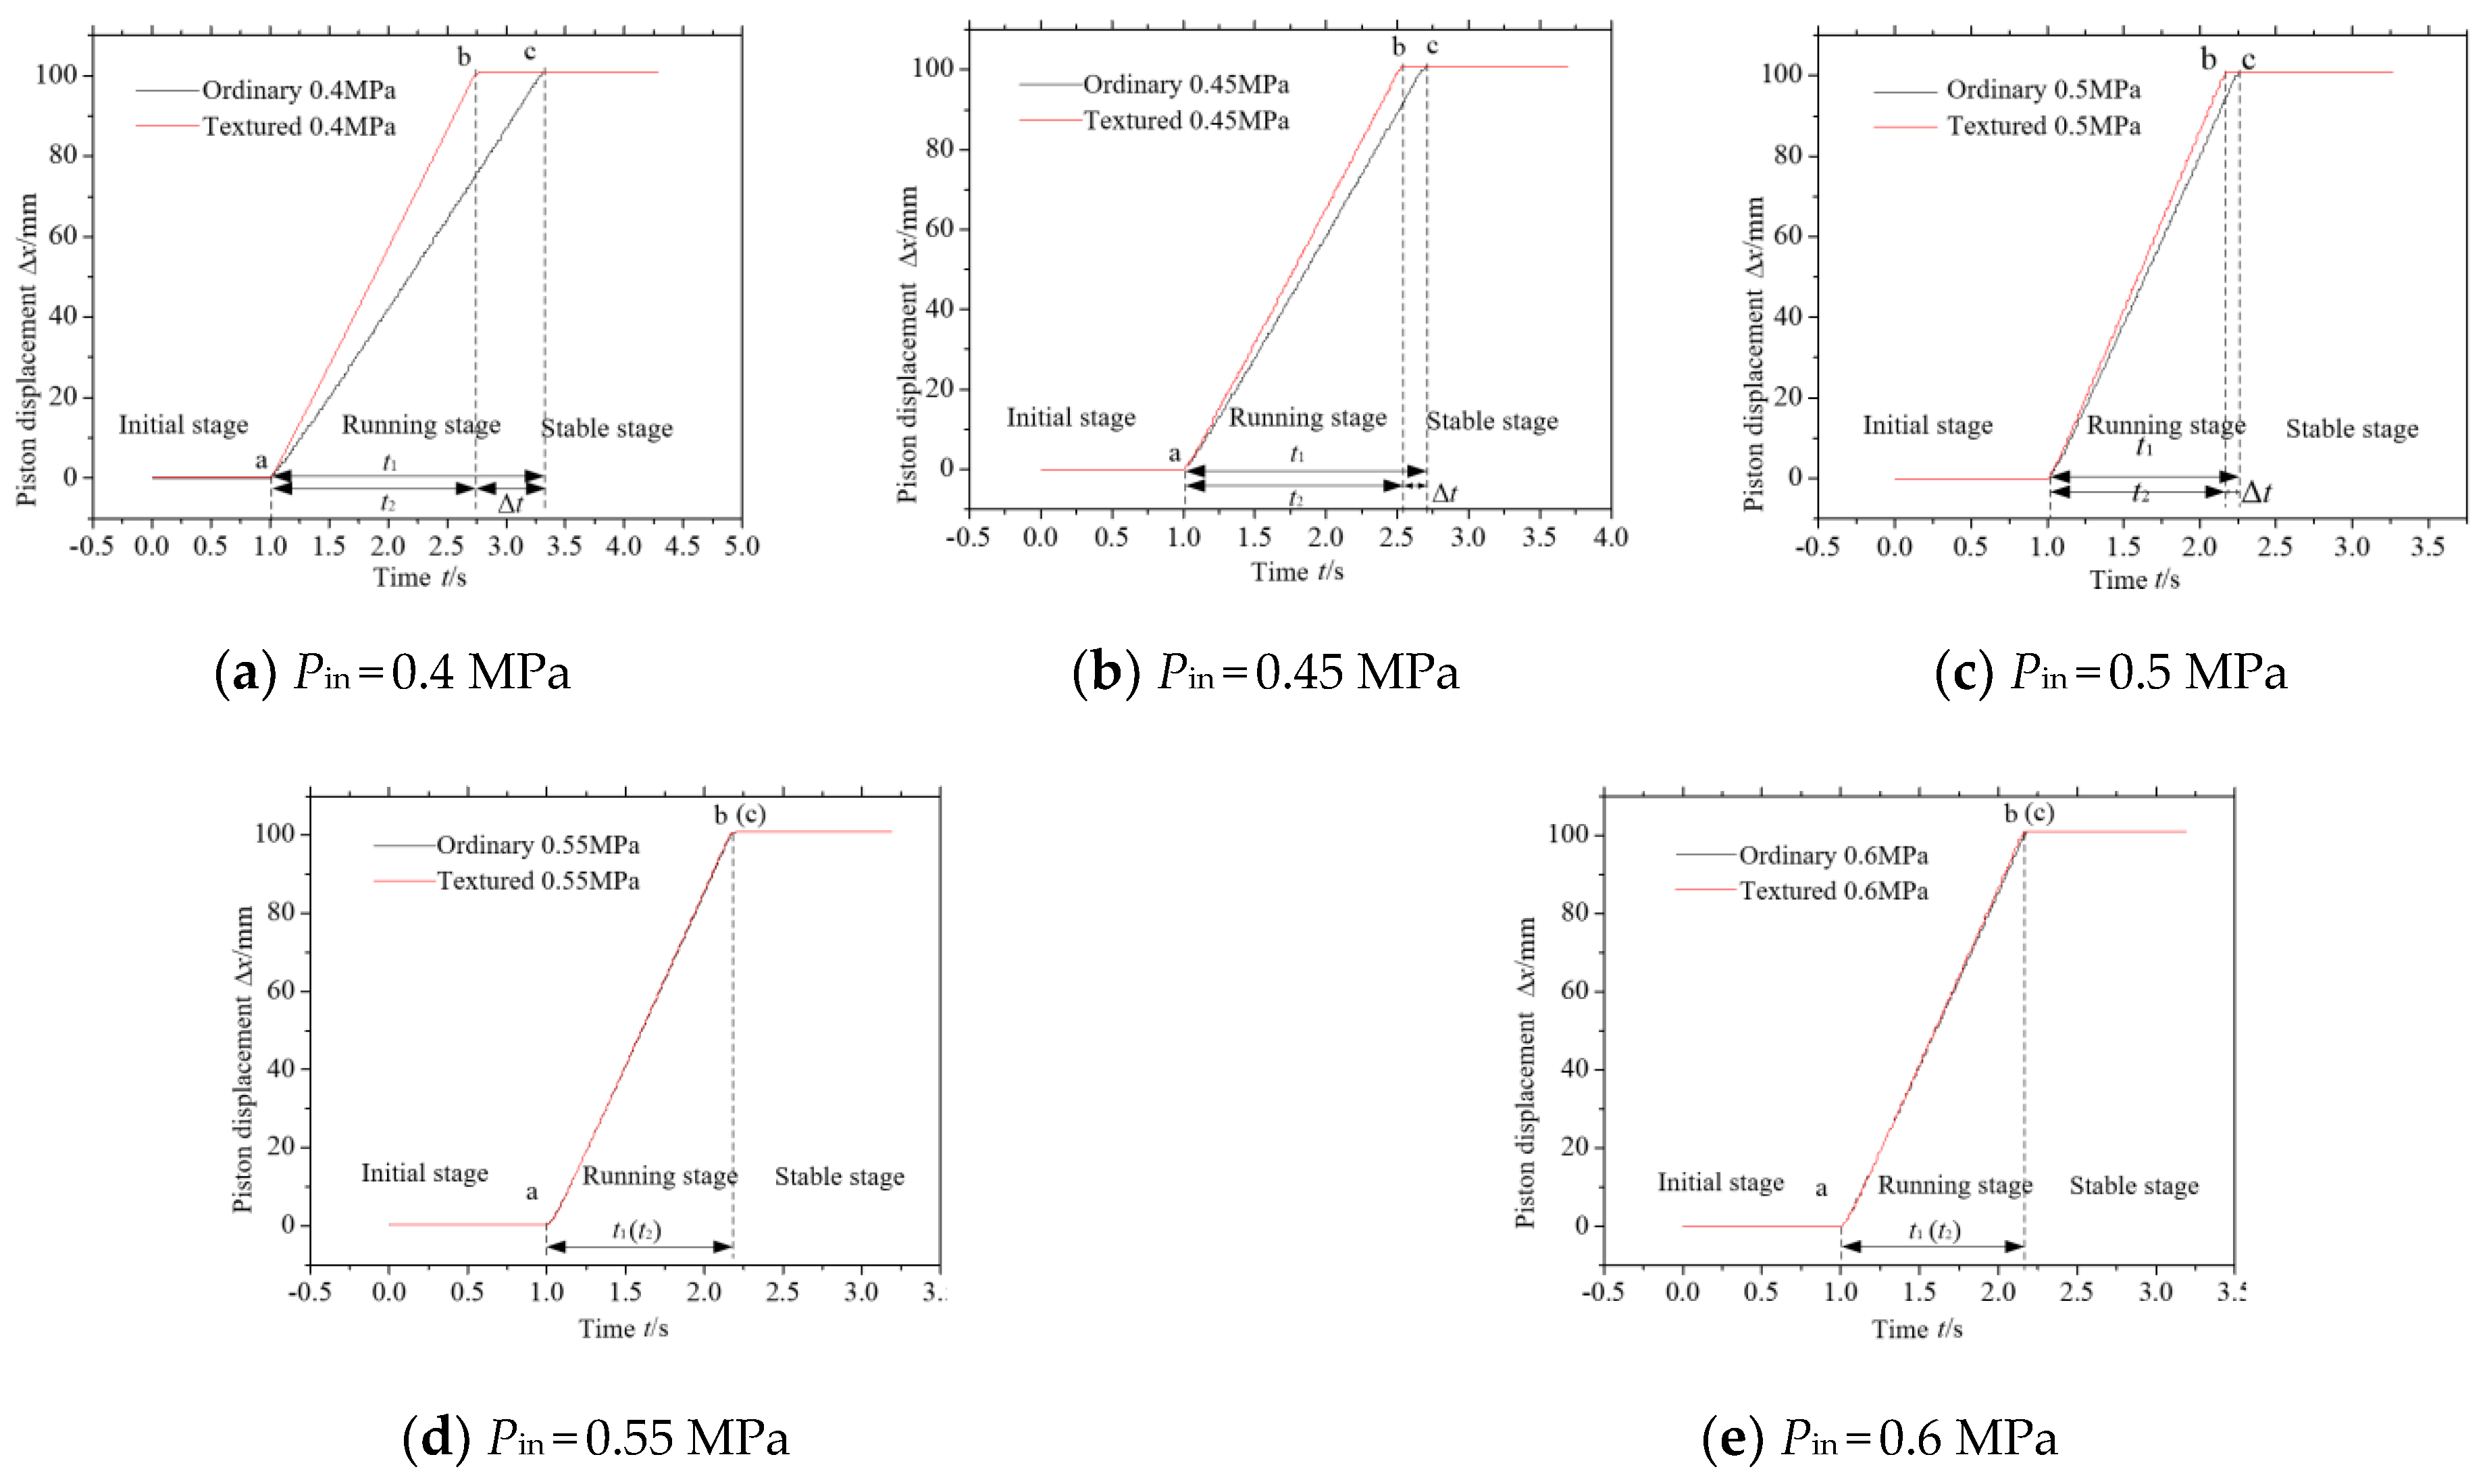
2.3.2. Influence of Response on Piston Displacement

Figure 6 shows the displacement curve of cylinder piston. In the initial stage, the pilot valve at port A is closed, the piston speed Vh = 0. In the piston running stage, the pilot valve at port A is opened at point a, the power oil enters the cylinder and pushes the piston out of the cylinder. The piston reaches the maximum displacement at points b and c, and the displacement Δx = 100 mm. In the stable operation stage, Δx reaches the maximum stroke and the operating speed is 0. With the increase in Pin, the Vh increases from 3.1 cm/s to 8.7 cm/s. The Vh of textured pilot valve system is always higher than that of ordinary one. The time difference ΔT between the two pistons to reach the maximum displacement decreases, and the ΔT decreases from ΔTP=0.4MPa ≈ 0.5 s to ΔTP=0.6MPa ≈ 0 s. This is because when the Pin is low, the textured valve Q is greater than ordinary valve Q, which makes the stroke of the cylinder piston faster. When Pin > 0.5 MPa, Q is almost unchanged, and the Vh is also unchanged. That is consistent with Q analysis results.

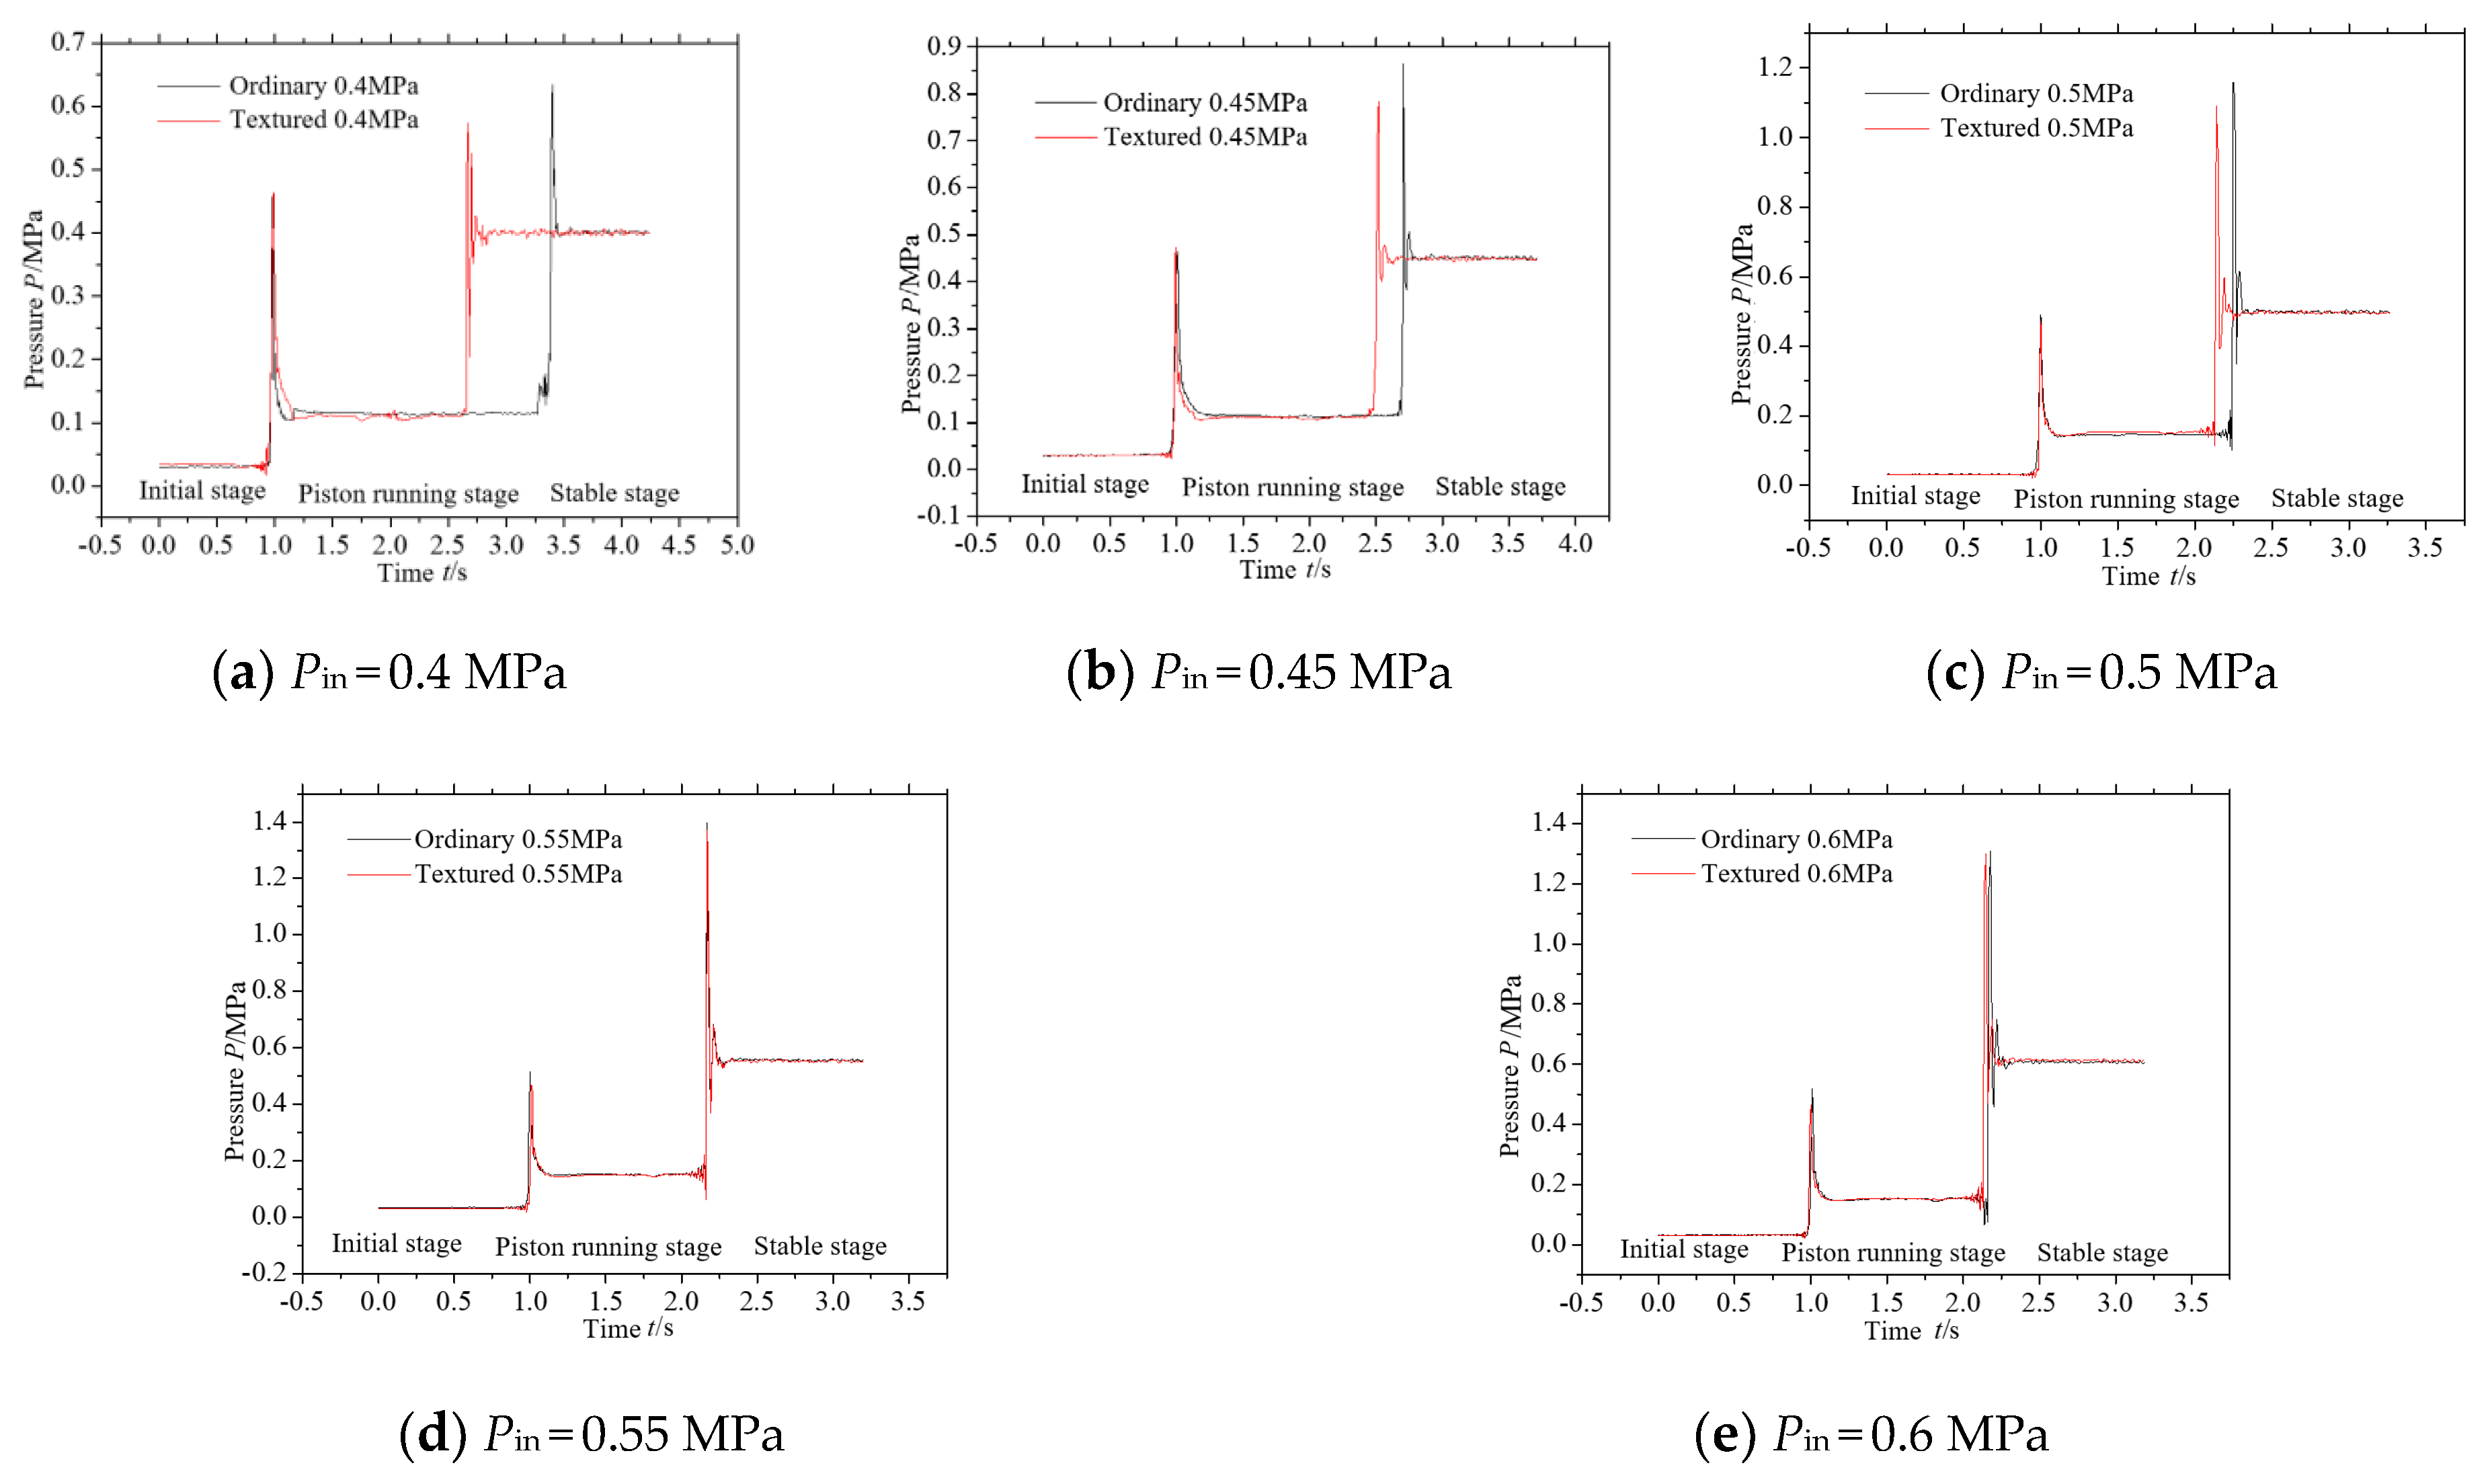
2.3.3. Influence of Response on Outlet Pressure

Figure 7 shows the dynamic characteristic curve of outlet pressure P. Results show that the P curve also has obvious changes in three stages. During the initial stage (P ≈ 0) to the piston operation stage, P rises to the first peak and then decreases to a certain value, then remains stable. During the transition from the piston running stage to the stable stage, P rises to another peak in a short time, then decreases to a certain value. The textured valve to reach the peak is faster than that of the ordinary valve. The lower the Pin, the faster the textured pilot valve to reach the fixed value. Meanwhile, with the increase in Pin, the P difference ΔPP between the ordinary and textured valve reaching the second peak is smaller, which decreases from ΔPP=0.4MPa = 0.09 MPa to ΔPP=0.6MPa = 0 MPa. The reason is when the piston reaches the maximum displacement, it forms a hydraulic impact, and the reaction force is caused by the hydraulic impact will be fed back to port A. When Pin < 0.55 MPa, the textured valve Q is large and the P is small, the hydraulic impact produced by textured valve is smaller than that of ordinary valve, so the pressure fed back to port A is smaller. When Pin ≥ 0.55 MPa, Q and P is close to the same, and the reaction force of hydraulic impact is almost the same. That is consistent with Q and Δx analysis results. Under the condition of low pressure, the textured valve can reduce the hydraulic impact of system in start-stop condition, it makes the velocity changes gently, and enhances the responsiveness and stability of the valve.

3. Research on Operation Mechanism

Experimental results show that the surface texture can improve the sensitivity of the pilot valve and enhance the response of the controllable interface. Based on the fluid lubrication theory, the internal flow field of valve is numerically calculated, and the operation mechanism of performance is analyzed by studying the stress on the sealing face of valve core and the variation law of outlet flow rate Q.

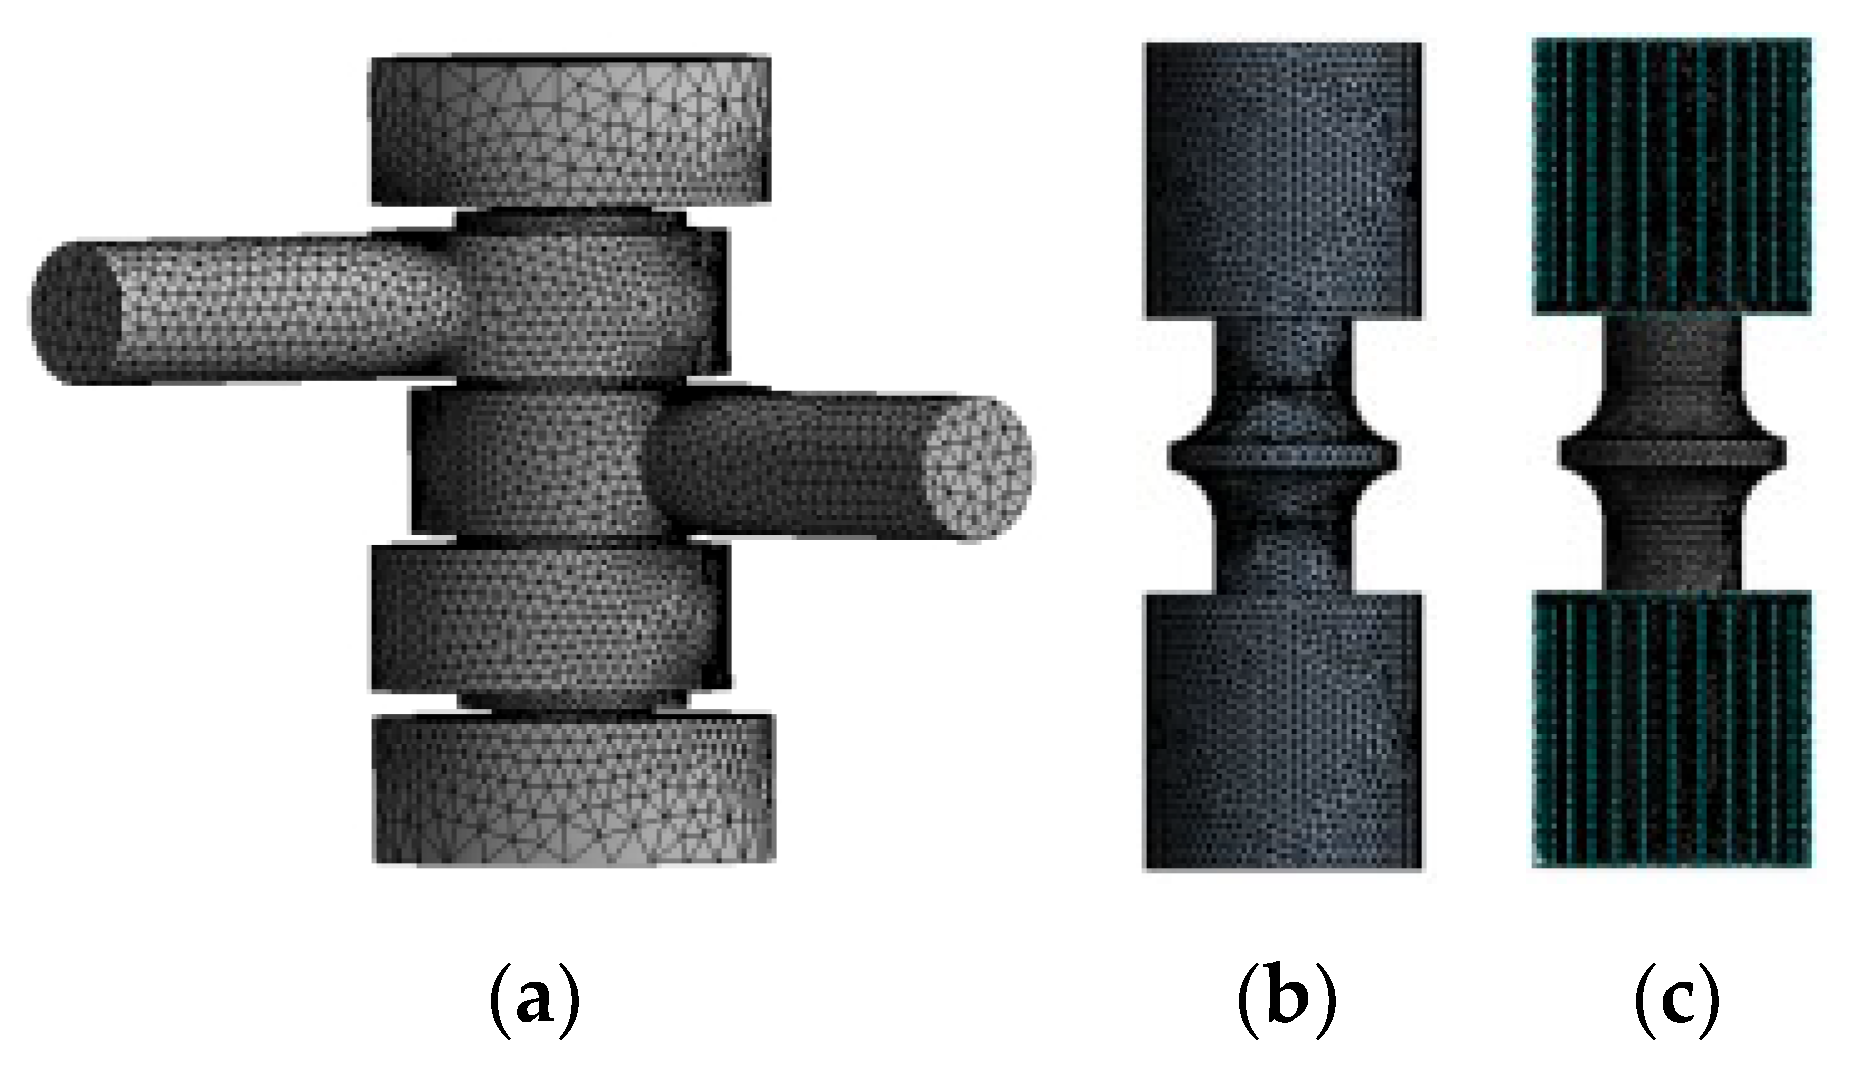
3.1. Modeling and Meshing

The critical Reynolds number of valve clearance fluid flow Re’ = 2000. The calculation formula of Reynolds number is shown in Equation (1).
R e = u D υ
where u is the average velocity of fluid (m/s), D is the hydraulic diameter (mm), D = 20 mm, and υ is the kinematic viscosity (m2/s), where, u = Q/A, D = 4A/ρ. According to the above experimental results, Q is the minimum of 0.04 m3/h, and A is the cross-sectional area of the valve port, so u is calculated to be 127.4 m/s. The kinetic viscosity of hydraulic oil υ is 280 mm2/s, and the Reynolds number Re is 9600, greater than 2000. Therefore, the internal flow field is characterized by turbulence.
The transport equation of turbulent kinetic energy and dissipation rate in k-ε model are (The derivation process is shown in the Appendix A at the end of the paper)
( ρ k ) t + ( ρ k u i ) x i = x i [ ( μ + μ i σ k ) k x j ] + G k ρ ε
( ρ ε ) t + ( ρ ε u i ) x i = x j [ ( μ + μ i σ ε ) ε x j ] + C 1 ε k G k C 2 ε ρ ε 2 k
where G k = ρ u i u j ¯ u j x j represents the generating term of turbulent kinetic energy, and k = 1 2 u i ¯   u j ¯ is the expressions of turbulent kinetic energy k and ε = μ ρ ( u i x k ) ( u i x k ) is the dissipation rate,
μ i = ρ C μ k 2 ε
here, C1ε = 1.44, C2ε = 1.92, Cμ = 0.09, σk = 1.0, σε = 1.3.
The dynamic characteristics of the pilot valve during normal operation are simulated. The research model is from the pilot valve model 2-8386-2201-07 produced by Hangzhou steam turbine group. Its main structural parameters are as follows: the inlet P diameter 20 mm, the outlet A and B diameter 20 mm, the valve core stroke 60 mm, the valve core diameter 22 mm, the valve core shell length 319 mm, and width and height 120 mm.
Due to the complex structure of the pilot valve passage, it is necessary to simplify the inside of the pilot valve passage without affecting the calculation results. The models of the pilot valve fluid domain, ordinary valve core and textured valve core were established, and the mesh was divided. In the process of calculation, the surface of the solid domain needs to be divided into high-quality meshes in order to obtain more accurate results. Therefore, the pilot valve core was divided into high-quality structured grids. Figure 8a was the schematic diagram of fluid domain meshing, and Figure 8b,c were the schematic diagram of valve core meshing.
To set the boundary conditions, first define the fluid domain type as Fluid Domain, select the calculation time of 500 ms and the time step of 0.001 s. Secondly, the valve core type was defined as Immersed Solid. The fluid medium was 25 °C hydraulic oil, the specific heat capacity was 1800 J/(kg·K), the density was 860 kg/m3, the thermal conductivity was 0.12 W/(m·K), and the kinematic viscosity was ν = 280 mm2/s, dynamic viscosity μ = 0.2519 Pa·s. The inlet pressure of the pilot valve was 0.4 MPa to 0.6 MPa, the secondary oil pressure was 0.2 MPa, the outlet pressure was 0 MPa, and the maximum displacement of the valve core is 20 mm.

3.2. Calculation Results and Discussion

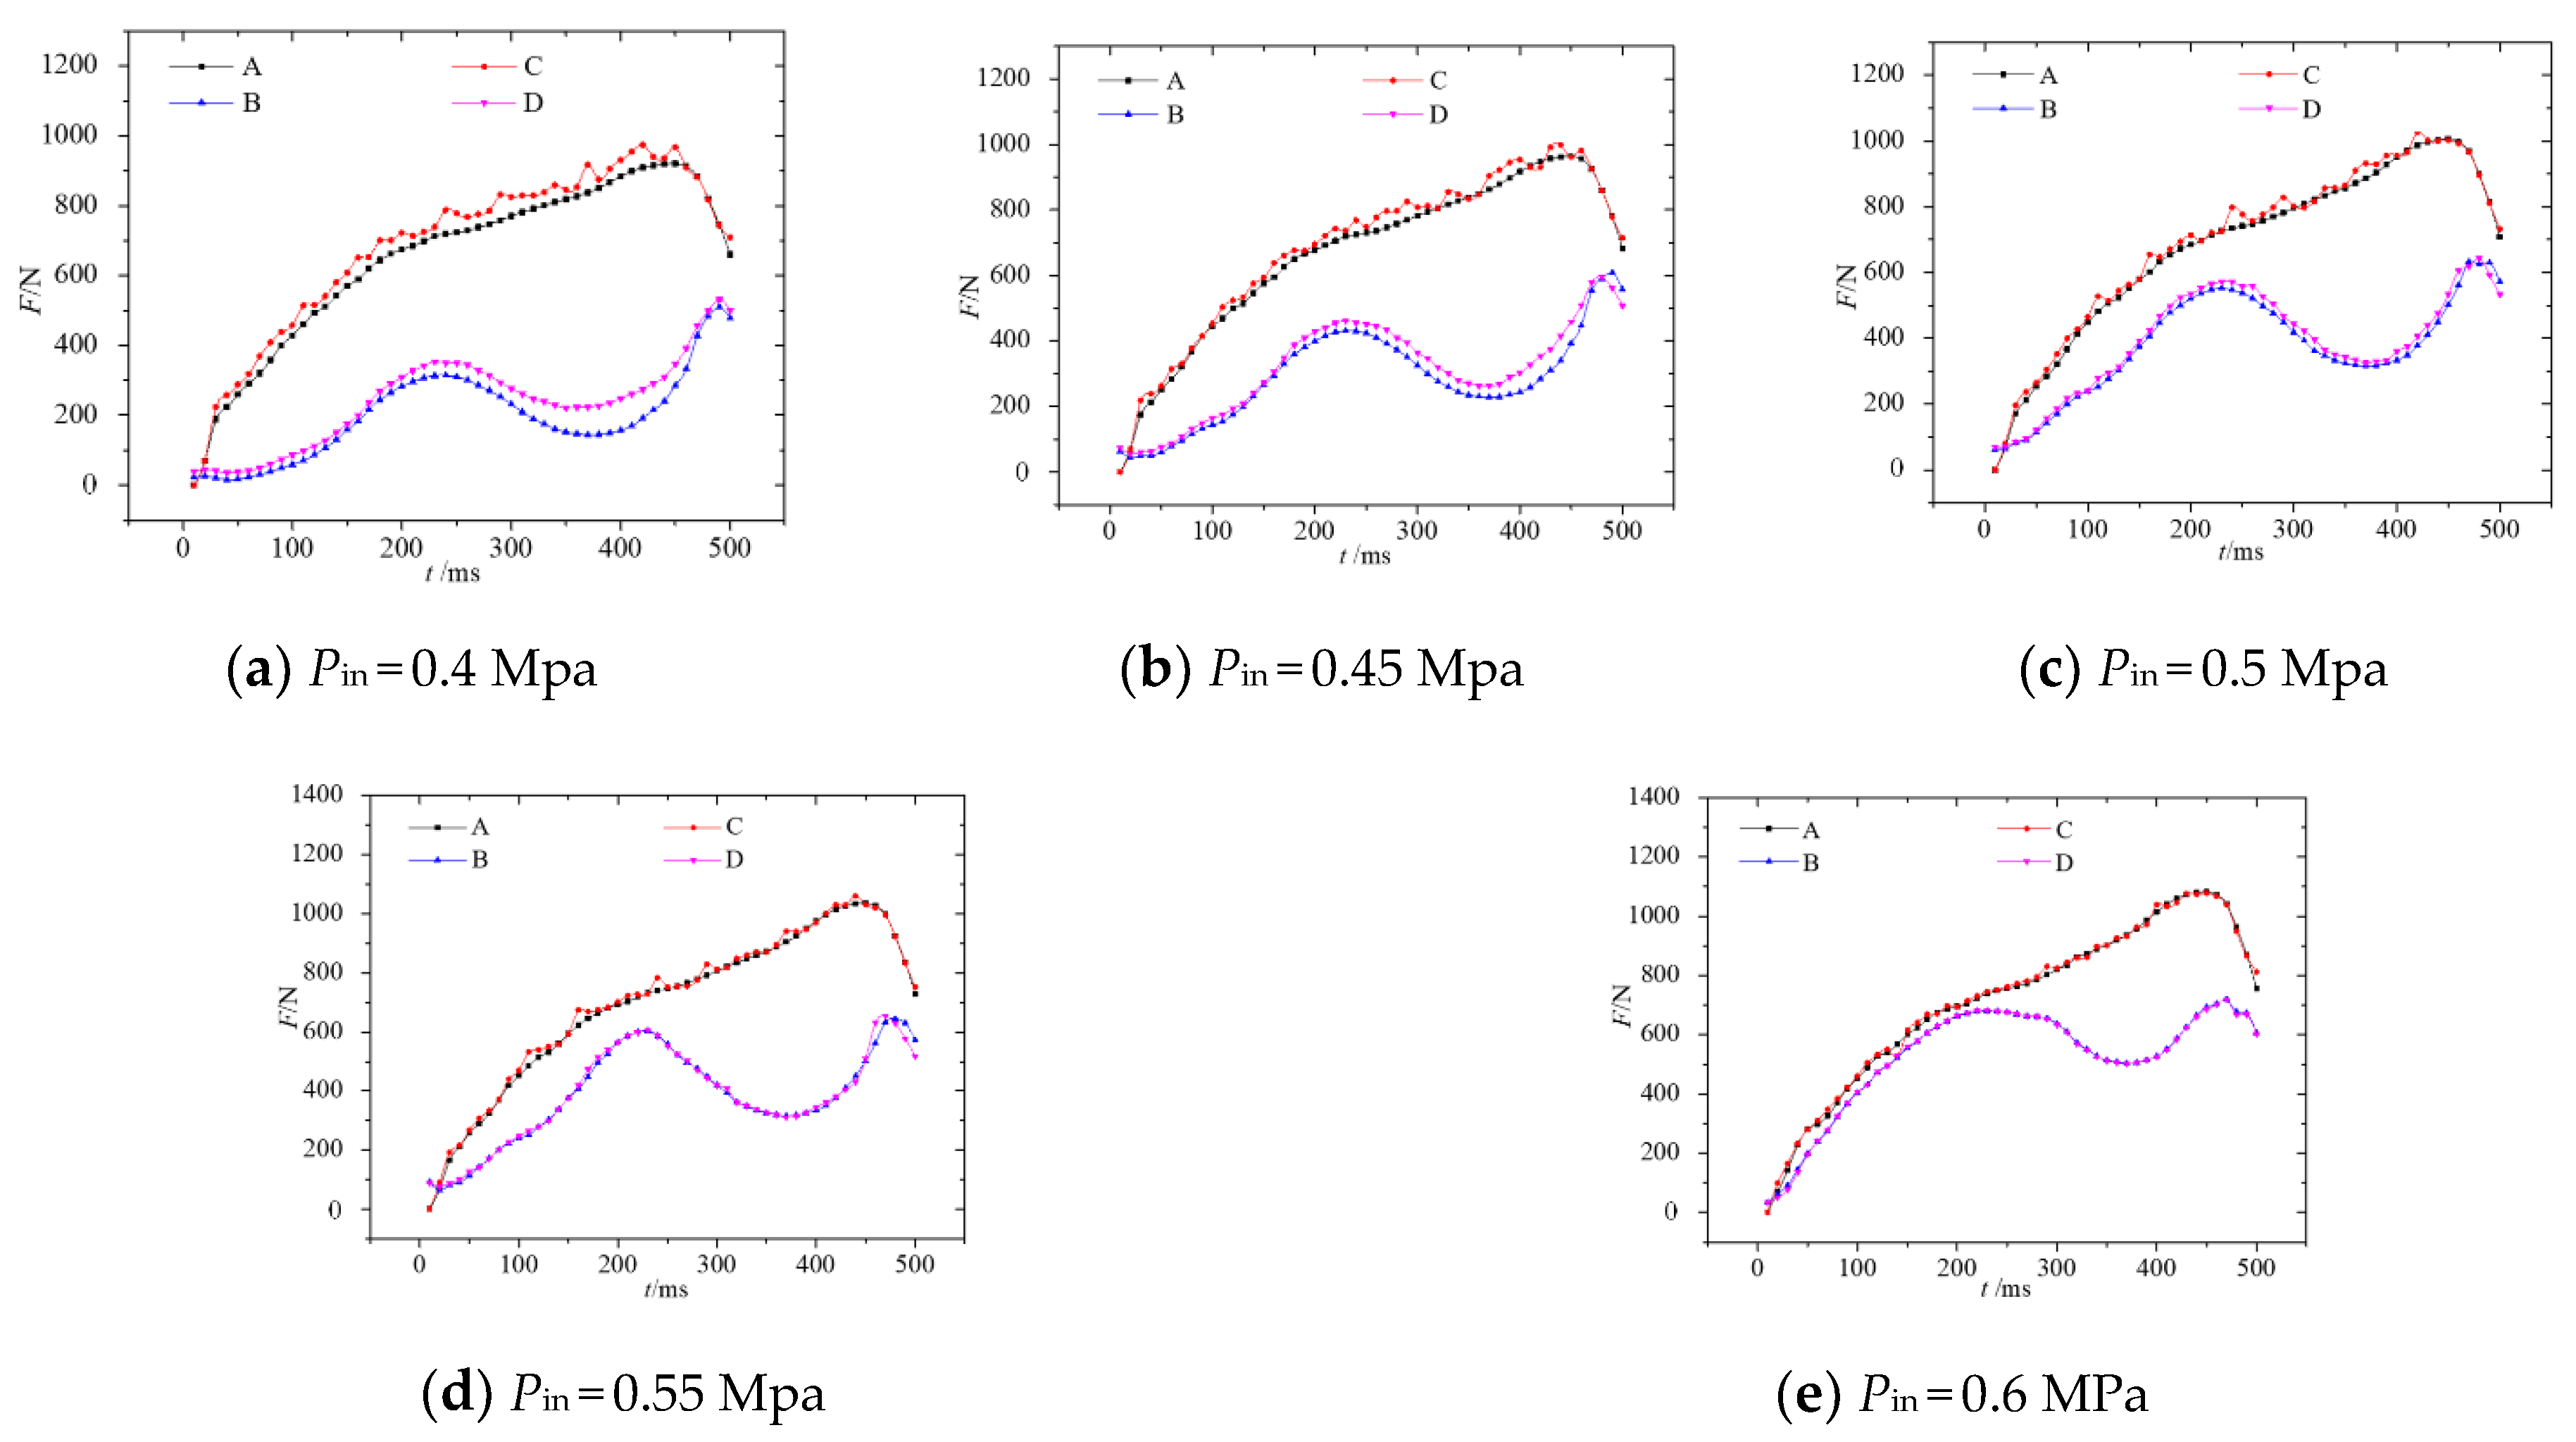
3.2.1. Stress Analysis

When the pilot valve is closed, the oil acts on the upper and lower sealing surfaces of the valve core. When the secondary oil pressure changes, the position of the valve core changes accordingly. When the pilot valve is opened, the oil acts on the upper, lower, and middle parts of the valve core at the same time. This design controls the change of valve core position through the change of secondary oil pressure, which ensures the operational stability of the pilot valve [28]. The stress on the valve core surface indirectly reflects the contact lubrication state between the valve core and sleeve. The greater the stress, the stronger the bearing capacity of the valve core surface. It can effectively avoid the direct contact between the valve core and sleeve, reducing the friction and wear, and improves the service life and work efficiency. Therefore, four complete stressed sealing surfaces with or without textured valve core are selected, see Figure 9, and the stress variation law of the end face of valve core in the opening process of the pilot valve is studied.
Figure 10 shows the stress curves of the upper and lower sealing surfaces of the pilot valve core under different Pin during the opening process. Results show that force curves of four sealing surface have the same trendline. The variation of the stress of the upper sealing surface like a parabola, i.e., it climbs up and then declines, while the stress of the lower one varied in another way, i.e., it increases first followed by decreasing, and finally increases again. The stress of the upper sealing surface is always greater than that of the lower one. When Pin = 0.4 MPa, there is a significant stress difference ΔFs on the upper sealing surface between textured and ordinary surface, and the maximum ΔFs = 79.7 N. The lower one ΔFs between textured and ordinary is more obvious, and the maximum ΔFx = 91.1 N. With the increase in Pin, ΔFs gradually weakens, when Pin ≥ 0.55 Mpa, there is no obvious difference, the curves basically coincide. It can be seen that the textured surface can effectively reduce the stress of the friction pairs, and the texture effect gradually decreases with the increase in the Pin. This indirectly reflects that the lubrication effect of textured valve is better than that of ordinary one. When Pin ≥ 0.55 Mpa, the texture effect can be ignored. This is consistent with the experimental results.

3.2.2. Flow Rate Analysis

Figure 11 shows the variation of outlet flow rate Q with time t during the opening process under different Pin. Results show that the Q is changing as the valve core position change. With the increase in Pin, Q between textured and ordinary pilot valve is slightly different. When Pin < 0.55 MPa, the Q of textured valve is obviously larger than that of ordinary valve. The smaller the Pin is, the more obvious the Q difference is. When Pin ≥ 0.55 MPa, the Q of textured valve is almost equal to that of the ordinary valve. This is because the effect of texture on hydrodynamic lubrication increases the sealing clearance and the leakage rate. The lower the Pin is, the higher the leakage rate is. When Pin ≥ 0.55 MPa, the texture effect weakens, the Q difference between textured and ordinary valve can be ignored. That is consistent with stress analysis.

4. Conclusions

Based on the textured controllable interface effect, the dynamic performances of the textured and ordinary pilot valve are analyzed experimentally. Combined with the theoretical calculation, the stress variation law of textured pilot valve during opening process is analyzed.
(1)
The flow rate Q, pressure P and displacement of cylinder piston Δx at port A of pilot valve are experimental studied. Results show when Pin < 0.55 MPa, the textured surface shortens the reciprocating time of valve core, increasing the flow rate of port A, and speeds up the piston stroke of oil cylinder, the textured valve actions much more stable and sensitivity. This indicates that the textured surface increases the oil film gap, reduce the friction between components, and effectively improve the dynamic lubrication performance of components. Texture valve core effectively improves the responsiveness of pilot valve. When Pin ≥ 0.55 MPa, the effect of the textured surface is gradually weakened;
(2)
The stress variation law of the upper and lower sealing surfaces of the two kinds of valve cores are computational analysis. Results show when Pin < 0.55 MPa, the stress of textured valve core sealing surface is greater than that of ordinary one, and the stress difference gradually decreases with the increase in inlet pressure Pin. The textured surface can effectively reduce the stress of the friction pairs. When Pin ≥ 0.55 MPa, the stress of textured valve core is basically the same, and the flow difference is basically the same as the force on the sealing surface.

Author Contributions

Conceptualization, J.X.; data curation, G.Z.; Formal analysis, S.F.; Methodology, J.N.; writing—original draft preparation, J.L. All authors have read and agreed to the published version of the manuscript.

Funding

This research was funded by the Nature Science Foundation of Zhejiang Province, China grant number No. LY19E050011.

Institutional Review Board Statement

Not applicable.

Informed Consent Statement

Not applicable.

Data Availability Statement

Not applicable.

Acknowledgments

The research is financially supported by the Nature Science Foundation of Zhejiang Province, China (No. LY19E050011).

Conflicts of Interest

The authors declare no conflict of interest.

Appendix A

  • Hydrodynamic control equation
(1)
Momentum conservation equation
Momentum conservation equation is also called N-S equation. Momentum conservation equation in x, y and z directions is shown as the equation:
( ρ u ) t + ( ρ u u ) x + ( ρ v v ) y + ( ρ u w ) z = x ( μ u x ) + y ( μ u y ) + z ( μ u z ) P x + S u
( ρ v ) t + ( ρ v u ) x + ( ρ v v ) y + ( ρ v w ) z = x ( μ v x ) + y ( μ v y ) + z ( μ v z ) P y + S v
( ρ w ) t + ( ρ w u ) x + ( ρ w v ) y + ( ρ w w ) z = x ( μ w x ) + y ( μ w y ) + z ( μ w z ) P y + S w
where, μ is the hydrodynamic viscosity, P is the pressure on the cell, Su, Sv, Sw are the generalized source terms of the momentum conservation equation, where Su = Fx + sx, Sv= Fy + sy, Sw = Fz+sz
s x = x ( μ u x ) + y ( μ v x ) + z ( μ w x ) x ( λ d i v u )
s y = x ( μ u y ) + y ( μ v y ) + z ( μ w y ) y ( λ d i v u )  
s w = x ( μ u z ) + y ( μ v z ) + z ( μ w z ) z ( λ d i v u )
where, λ is the second viscosity and λ is −2/3.
(2)
Mass conservation equation
The mass conservation equation is also known as the continuity equation, and its equation is:
ρ t + ( ρ u ) x + ( ρ v ) y + ( ρ w ) z = 0
where ρ is the density of the fluid, u, v and w are the components of the velocity vector u in the x, y, and z directions, respectively.
  • Theoretical model
Assuming that the fluid is incompressible, the continuity equation and momentum equation are
u i x i = 0
u i t + u j u i x j = 1 ρ p x i + v 2 u i x i x j + f i
If we replace the instantaneous quantity ui and p with the average quantity and pulsation quantity, that is, the Reynolds equation is
u i ¯ t + u j ¯ u i ¯ x j = 1 ρ p ¯ x i + 1 ρ x j ( u u i ¯ x j ρ u i u j ¯ ) + f i
Comparing Equations (9) and (10), it can be found that there is one more Reynolds stress term ρ u i ¯   u j ¯ in the Reynolds equation. Through the observation of the actual situation, many physical models are designed, of which k-ε Model, which is suitable for compressible and incompressible fluids in turbulent state. Can assume
ρ u i u j ¯ = μ ( u j x j + u j x i ) 2 3 δ i j ρ k
where, δ i j is the symbol of “Kronecker delta”, that is, when i = j, δ i j = 1 and the rest δ i j   = 0; k is turbulent kinetic energy. To sum up, the transport equation of turbulent kinetic energy and dissipation rate in the k-ε model is
( ρ k ) t + ( ρ k u i ) x i = x i [ ( μ + μ i σ k ) k x j ] + G k ρ ε
( ρ ε ) t + ( ρ ε u i ) x i = x j [ ( μ + μ i σ ε ) ε x j ] + C 1 ε k G k C 2 ε ρ ε 2 k

References

  1. Shi, Y.; Ding, X.; Gai, Y. Steam Turbine Equipment and Operation; China Electric Power Press: Beijing, China, 2008; pp. 15–16. [Google Scholar]
  2. Qi, J. Cause analysis and treatment of oil leakage of steam turbine oil seal. Equip. Maint. Technol. 2020, 1, 87–96. [Google Scholar] [CrossRef]
  3. Wang, R. Digital Twin-Driven Mating Performance Analysis for Precision Spool Valve. Machines 2021, 9, 157. [Google Scholar]
  4. Zhang, J.; Lu, Z.; Xu, B.; Su, Q. Investigation on the dynamic characteristics and control accuracy of a novel proportional directional valve with independently controlled pilot stage. ISA Trans. 2019, 93, 218–230. [Google Scholar] [CrossRef] [PubMed]
  5. Liu, Z. A Performance Prediction Method for a High-Precision Servo Valve Supported by Digital Twin Assembly-Commissioning. Machines 2021, 10, 11. [Google Scholar]
  6. Fan, S.; Xu, R.; Ji, H.; Yang, S.; Yuan, Q. Experimental Investigation on Contaminated Friction of Hydraulic Spool Valve. Appl. Sci. 2019, 9, 5230. [Google Scholar] [CrossRef] [Green Version]
  7. Frosina, E.; Senatore, A.; Buono, D.; Pavanetto, M.; Olivetti, M. 3D CFD transient analysis of the forces acting on the spool of a directional valve. Energy Proc. 2015, 81, 1090–1101. [Google Scholar] [CrossRef] [Green Version]
  8. Ping, S. Discussion on several problems in dynamic characteristic calculation of steam turbine speed governing system. Therm. Power Gener. 1993, 1, 29–35. [Google Scholar]
  9. Sweeny, D.C. Preliminary investigation of hydraulic lock. Engineering 1951, 172, 513–516. [Google Scholar]
  10. Ye, Y.; Yin, C.B.; Li, X.D.; Zhou, W.; Yuan, F. Effects of groove shape of notch on the flow characteristics of spool valve. Energy Convers. Manag. 2014, 86, 1091–1101. [Google Scholar] [CrossRef]
  11. Zheng, F.; Zhu, D.; Lu, C.; Zhang, Y.; Li, T. Design and experimental research of solenoid directional valve based on 2D Technology. Hydraul. Pneum. Seals 2019, 7, 6–8. [Google Scholar]
  12. Lisowski, E.; Filo, G. CFD analysis of the characteristics of a proportional flow control valve with an innovative opening shape. Energy Convers. Manag. 2016, 123, 15–28. [Google Scholar] [CrossRef]
  13. Wang, Y.; Lin, S.; Li, Y. Treatment of Cylinder Wall Wear of Steam Turbine Governor Valve Engine. Northeast. Electr. Power Technol. 2012, 32–34. [Google Scholar] [CrossRef]
  14. Nieminen, P.; Esque, S.; Muhammad, A.; Mattila, J.; Vayrynen, J.; Siuko, M.; Vilenius, M. Water hydraulic manipulator for fail safe and fault tolerant remote handling operations at ITER. Fusion Eng. Des. 2009, 84, 1420–1424. [Google Scholar] [CrossRef]
  15. Watanabe, T.; Inayama, T.; Oomichi, T. Development of the Small Flow Rate Water Hydraulic Servo Valve. J. Robot. Mechatron. 2010, 22, 333–340. [Google Scholar] [CrossRef]
  16. Etsion, I.; Kligerman, Y.; Halperin, G. Analytical and Experimental Investigation of Laser-Textured Mechanical Seal Faces. ASLE Transa 1999, 42, 511–516. [Google Scholar] [CrossRef]
  17. Etsion, I. Improving tribological performance of mechanical components by laser surface texturing. Tribol. Lett. 2004, 17, 733–737. [Google Scholar] [CrossRef]
  18. Pan, C.; Li, Q.; Hu, K.; Song, Y. Study on Surface Roughness of Gcr15 Machined by Micro-Texture PCBN Tools. Machines 2018, 6, 42. [Google Scholar] [CrossRef] [Green Version]
  19. Hao, X.; Sun, H.; Wang, L.; Ali, Q.; Li, L.; He, N. Fabrication of micro-texture on cylindrical inner surface and its effect on the stability of hybrid bearing. Int. J. Adv. Manuf. Technol. 2020, 109, 1671–1680. [Google Scholar] [CrossRef]
  20. Gherca, A.; Fatu, A.; Hajjam, M.; Maspeyrot, P. Influence of surface texturing on the hydrodynamic performance of a thrust bearing operating in steady-state and transient lubrication regime. Tribol. Int. 2016, 102, 305–318. [Google Scholar] [CrossRef]
  21. Liu, H.; Wang, W.; Zhao, Z.; Kong, L. Experimental study on effect of surface texture on friction properties of point contact lubrication. Lubr. Eng. 2014, 39, 9–16. [Google Scholar] [CrossRef]
  22. Yu, H.; Wang, X.; Zhou, F. Geometric shape effects of surface texture on the generation of hydrodynamic pressure between conformal contacting surfaces. Tribol. Lett. 2010, 37, 123–130. [Google Scholar] [CrossRef]
  23. Yang, L.; Ding, Y.; Cheng, B.; He, J.; Wang, G.; Wang, Y. Investigations on femtosecond laser modified micro-textured surface with anti-friction property on bearing steel GCr15. Appl. Surf. Sci. 2018, 434, 831–842. [Google Scholar] [CrossRef]
  24. Reddy, A.R.; Ismail, S. Tribological performance of textured parallel sliding contact under mixed lubrication condition by considering mass conservation condition and couple-stress parameter. Proc. Inst. Mech. Eng. 2021, 235, 410–422. [Google Scholar] [CrossRef]
  25. Han, Z.; Wang, L.; Zhang, X.; Zheng, H.; Li, Y.; Wang, Z. Effect of pit texture on water lubrication properties of graphite materials. Lubr. Eng. 2020, 45, 6. [Google Scholar]
  26. Meng, F.D.; Liu, B.S.; Zeng, Y.S.; Wu, W. Geometric characterization of placoid scales of fast-swimming sharks. J. Plast. Eng. 2016, 23, 143–147. [Google Scholar]
  27. He, T.; Wang, C.L.; Deng, H.S.; Huang, Y.L.; Yu, C.F. Hydrodynamic Lubrication and Load Carrying Capacity Analysis of Laser Surface Texturing Valve Core. In Key Engineering Materials; Trans Tech Publications Ltd.: Bach, Switzerland, 2016; Volume 693, pp. 348–355. [Google Scholar]
  28. Tamburrano, P.; Amirante, R.; Distaso, E.; Plummer, A.R. Full simulation of a piezoelectric double nozzle flapper pilot valve coupled with a main stage spool valve. Energy Proc. 2018, 148, 487–494. [Google Scholar] [CrossRef]
Figure 1. Preparation of textured valve core diagram.
Machines 10 00357 g001
Figure 2. Schematic diagram of textured surface of pilot valve core. (a) Diagram of shoulder texture surface; (b) Schematic diagram of texture model.
Machines 10 00357 g002
Figure 3. Experimental system diagram of pilot valve.
Machines 10 00357 g003
Figure 4. Experimental system of pilot valve.
Machines 10 00357 g004
Figure 5. Measured flow curve at port A of pilot valve.
Machines 10 00357 g005
Figure 6. Measured displacement curve of cylinder piston.
Machines 10 00357 g006
Figure 7. Measured outlet pressure curve.
Machines 10 00357 g007
Figure 8. Meshes of fluid domain and solid domain. (a) Fluid domain meshing. (b) Ordinary valve core meshing. (c) Textured valve core meshing.
Machines 10 00357 g008
Figure 9. Diagram of sealing surface for different valve core. (a) Upper sealing surface of ordinary valve core. (b) Lower sealing surface of ordinary valve core. (c) Upper sealing surface of textured valve core. (d) Lower sealing surface of textured valve core.
Machines 10 00357 g009
Figure 10. Stress change curve of different valve core sealing surface. (A is upper sealing surface of ordinary, B is lower sealing surface of ordinary, C is upper sealing surface of textured, and D is lower sealing surface of textured).
Machines 10 00357 g010
Figure 11. Change of outlet flow of different pilot valve.
Machines 10 00357 g011
Table 1. Main symbols and meanings in the paper.
SymbolMeaning
PinInlet pressure
POut pressure
ΔxCylinder piston displacement
QOutlet flow
FSealing surface stress
Table 2. Specifications of main experimental instruments.
NameModelMeasurement ParametersAccuracy Class
FlowmeterECLWGY10ALC2SSN0.2~1.2 m3/h1%
Displacement sensorRH-M0500-S1-DN02-A010~100 mm0.1%
Pressure sensorPTh5030~60 MPa±0.5%
Pressure gaugeYTN-600~5 MPa±1.6%
Publisher’s Note: MDPI stays neutral with regard to jurisdictional claims in published maps and institutional affiliations.

