Article

Micromechanism of Plastic Accumulation and Damage Initiation in Bearing Steels under Cyclic Shear Deformation: A Molecular Dynamics Study

1
School of Mechanical Engineering, Xi’an Jiaotong University, Xi’an 710049, China
2
State Key Laboratory for Manufacturing Systems Engineering, Xi’an Jiaotong University, Xi’an 710049, China
3
Beijing Aeronautical Technology Research Center, Beijing 100024, China
*
Author to whom correspondence should be addressed.
Machines 2022, 10(3), 199; https://doi.org/10.3390/machines10030199
Submission received: 31 December 2021 / Revised: 4 March 2022 / Accepted: 8 March 2022 / Published: 10 March 2022
(This article belongs to the Special Issue Advances in Bearing Modeling, Fault Diagnosis, RUL Prediction)

Abstract

:
Fatigue failure usually occurs on the subsurface in rolling bearings due to multiaxial and non-proportional fatigue loadings between rolling elements. One of the main stress components is the alternating shear stress. This paper focuses on the micromechanism of plastic accumulation and damage initiation in bearing steels under cyclic shear deformation. The distribution of subsurface shear stress in bearings was firstly investigated by finite element simulation. An atomic model containing bcc-Fe and cementite phases was built by molecular dynamics (MD). Shear stress–strain characteristics were discussed to explore the mechanical properties of the atomic model. Ten alternating shear cycles were designed to explore the mechanism of cyclic plastic accumulation and damage initiation. Shear stress responses and evolutions of dislocaitons, defect meshes and high-strain atoms were discussed. The results show that cyclic softening occurs when the model is in the plastic stage. Severe cyclic shear deformation can accelerate plastic accumulation and result in an earlier shear slip of the cementite phase than that under monotonic shear deformation, which might be the initiation of microscopic damage in bearing steels.

1. Introduction

Rolling bearings with bearing steels as the main component are widely used in important equipment such as aircraft engines and high-speed trains because of the strong bearing capacity and wide range of applicable speeds and temperatures. However, the working environment of rolling bearings is harsh, and the common damage failure modes include spalling, wear, pitting, cracks and so on. Fatigue failure in bearings involves the initiation and propagation of damage originating from the contact surface or subsurface [1,2,3]. Although surface damage, such as wear and pitting, can be relieved by careful surface treatment and effective lubrication [4], subsurface failure such as microcracks near non-metallic inclusions is the most dangerous form of fatigue failure and inevitable under the theoretical framework of Palmgren and Lundberg [5,6]. Thereinto, the multiaxial and non-proportional fatigue loadings consisting of three-dimensional high compressive stresses and shear stresses are usually the main reason for Rolling Contact Fatigue (RCF) [7,8,9]. RCF refers to a localized cumulative damage that occurs between two tangent and cyclically loaded parts [8,10]. The typical phenomena of rolling bearings under rolling contact fatigue are a dark-etching region on the subsurface and butterfly wings near non-metallic inclusions [11]. The raceways and rolling elements of a normal rolling bearing are generally subjected to billions of rolling contacts during service. As service time goes on, cumulative damage gradually develops at a depth of 200–400 μm under contact surface [12], eventually leading to the failure of bearings. The initiation of damage mostly occurs when the region corresponding to the peak of alternating shear stress coincides with the defect region in materials, and further results in fatigue failure such as macroscopic spalling [13,14].
In recent decades, a large number of researchers have attempted to reveal the mechanism involved in RCF by using the theory of multiaxial and non-proportional stresses [6,7,15,16,17,18,19]. Although the theoretical results can be consistent with the experimental phenomenon to some extent, the micromechanism of plastic accumulation and damage initiation during RCF, especially under the joint action of multiaxial stress and in-phase shift between shear and normal stresses, is still unclear. Due to the complexity of the stress action mechanism and the importance of shear stress on damage initiation [20], this paper focuses only on the research of the micromechanism of plastic accumulation and damage initiation under alternating shear stress in bearing steels.
Under the assumption of macroscopic homogeneity, bearing steels will not suffer from plastic deformation and damage during nominal elastic loading. However, the presence of phase interfaces and carbide inclusions introduces heterogeneity at the microstructure level. Local yielding and microplastic strain accumulation will occur within bearing steels under RCF. Additionally, such microplastic flow is often referred to as ‘ratcheting’ phenomenon [3,21,22]. The damage evolution of RCF is generally divided into three stages. In stage I, microplastic strain accumulation tends to occur near the inclusions, which indicates the starting point of damage initiation [23]. Such damage evolution behavior is inconducive to the fatigue life of rolling bearings.
In order to explain the plastic accumulation and damage initiation in bearing steels under cyclic shear deformation, it is important to build an accurate atomic model of bearing steels. Nevertheless, typical bearing steels contain more than ten atomic types, and the interatomic potentials between these atomic types are very scarce. So, just two main atomic types including Fe and C elements are considered for the atomic model. The typical components of bearing steels consist of tempered martensite, homogeneously distributed primary spheroidized carbide, tempered carbide and retained austenite [24,25]. Among them, martensite is a supersaturated solid solution formed by the solubilization of carbon in α-Fe matrix [26]. In addition to this, sparsely proportional carbon atoms have little influence on plastic deformation. Additionally, the crystal structure of martensite is body-centered tetragonal [27], which is similar with the body-centered cubic structure of α-Fe, so the martensite phase can be replaced by the α-Fe phase to simplify the research. The carbides in bearing steels can be categorized into metallic and non-metallic, among which the main metallic elements of metallic carbides are Cr, Fe and Mo [28]. Although the content of carbide can be reduced by fine processing and heat treatment, there still exists a certain proportion of Fe-rich M3C. The primary spheroidized carbide in AISI 52,100 bearing steels is (Fe,Cr)3C [25]. Bhadeshia [11] found that 3–4% of cementite cannot be dissolved in the process of austenization during the quenching of AISI 52,100 bearing steels. Lian et al. [29] found a small amount of Fe-rich M3C when studying the dissolution and precipitation of carbides in carburized M50NiL bearing steels. Therefore, the cementite phase was chosen to build the atomic model. Due to the mismatch of two phases within materials, dislocations will be generated and emitted on the interface during deformation, thus causing plastic accumulation [30,31]. Therefore, the mechanism of fatigue failure can be revealed to some extent by studying the influence of the interface between bcc-Fe and cementite on cyclic plastic accumulation in bearing steels.
Existing relevant atomic models mostly focus on the generation and evolution of defects at the ferrite–cementite interface under monotonic loading. Ferrite is a kind of solid solution formed by carbon atoms occupying the interstitial space among the lattice atoms of the α-Fe crystal, and the maximum solubility of carbon in α-Fe is only 0.022 wt% below 1000 K [32]. Therefore, the ferrite phase is usually replaced by the α-Fe phase in the existing models. Ghaffarian et al. [33,34] reported that the deformation mechanism of the ferrite–cementite interface strongly depends on the size, temperature and different loading directions of cementite, and revealed the hindrance mechanism of cementite layer on dislocation, as well as the influence of temperature and lamellar thickness on the ductility of the model. Guziewski et al. [35] noted that the mechanical properties of the ferrite–cementite interface depend on the volume ratio and orientation relationships (ORs) between the ferrite and cementite phases. More recently, Liang et al. [31] reported the nucleation and evolution mechanism of dislocation at the ferrite–cementite interface and explained the plastic mechanism of fatigue failure under cyclic tensile and compressive loadings in pearlite. However, few existing papers pay attention to the initiation and evolution of interfacial defects under cyclic alternating shear load. In addition to this, Pandkar et al. [36] revealed the accumulation of deformation and microplastic strain during RCF due to the ratcheting behavior caused by using finite element method, and explained the contribution of carbide particles towards ratcheting. Nevertheless, the macroscale studied is insufficient to explain the origin of cumulative damage. Additionally, due to the limitations in terms of spatial-temporal resolution of existing experimental instruments and the complexity of the atomic modeling of bearing steels, the mechanism of plastic accumulation and damage initiation near inclusion in bearing steels still remains unclear.
In the present work, we attempt to explain the micromechanism of plastic accumulation and damage initiation in bearing steels under cyclic shear deformation. Figure 1 shows the framework of this paper. In Section 2, we first establish a finite element model to obtain the distribution and variation rule of subsurface shear stress under dynamic hertz contact load. Then, a two-phase atomic model of bcc-Fe and cementite is built and pretreated. Monotonic shear deformation was carried out to obtain the mechanical properties of the atomic model. Three levels of shear strain were designed for cyclic deformation. In Section 3, we analyze the shear stress responses. Afterwards, the evolution of dislocations, defect meshes and high-strain atoms are discussed, respectively. Finally, the shear slip thresholds of the cementite phase under monotonic and cyclic shear deformation were compared. The current work has partly explained why microscopic damage is more likely to appear near the inclusion on the subsurface in bearing steels at the microstructure level.

2. Methodology

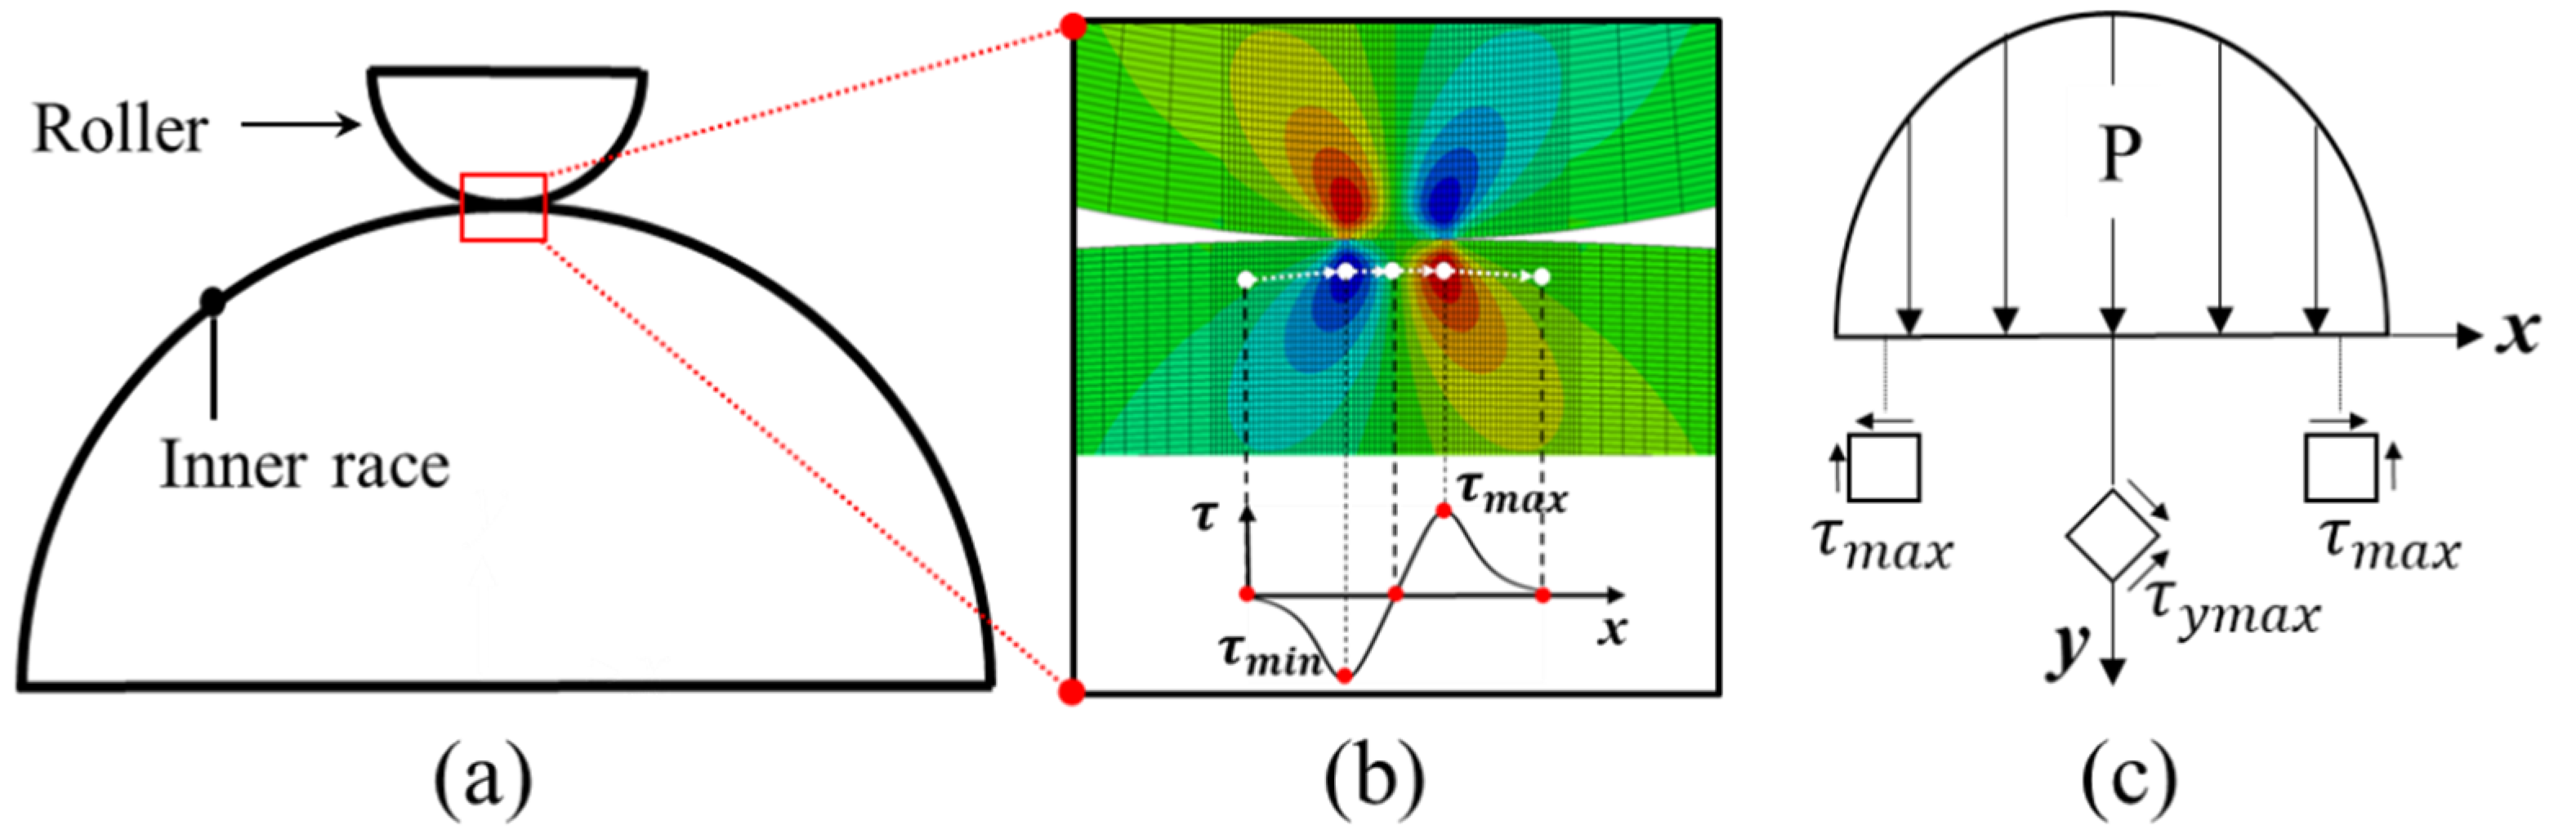
2.1. Subsurface Shear Stress
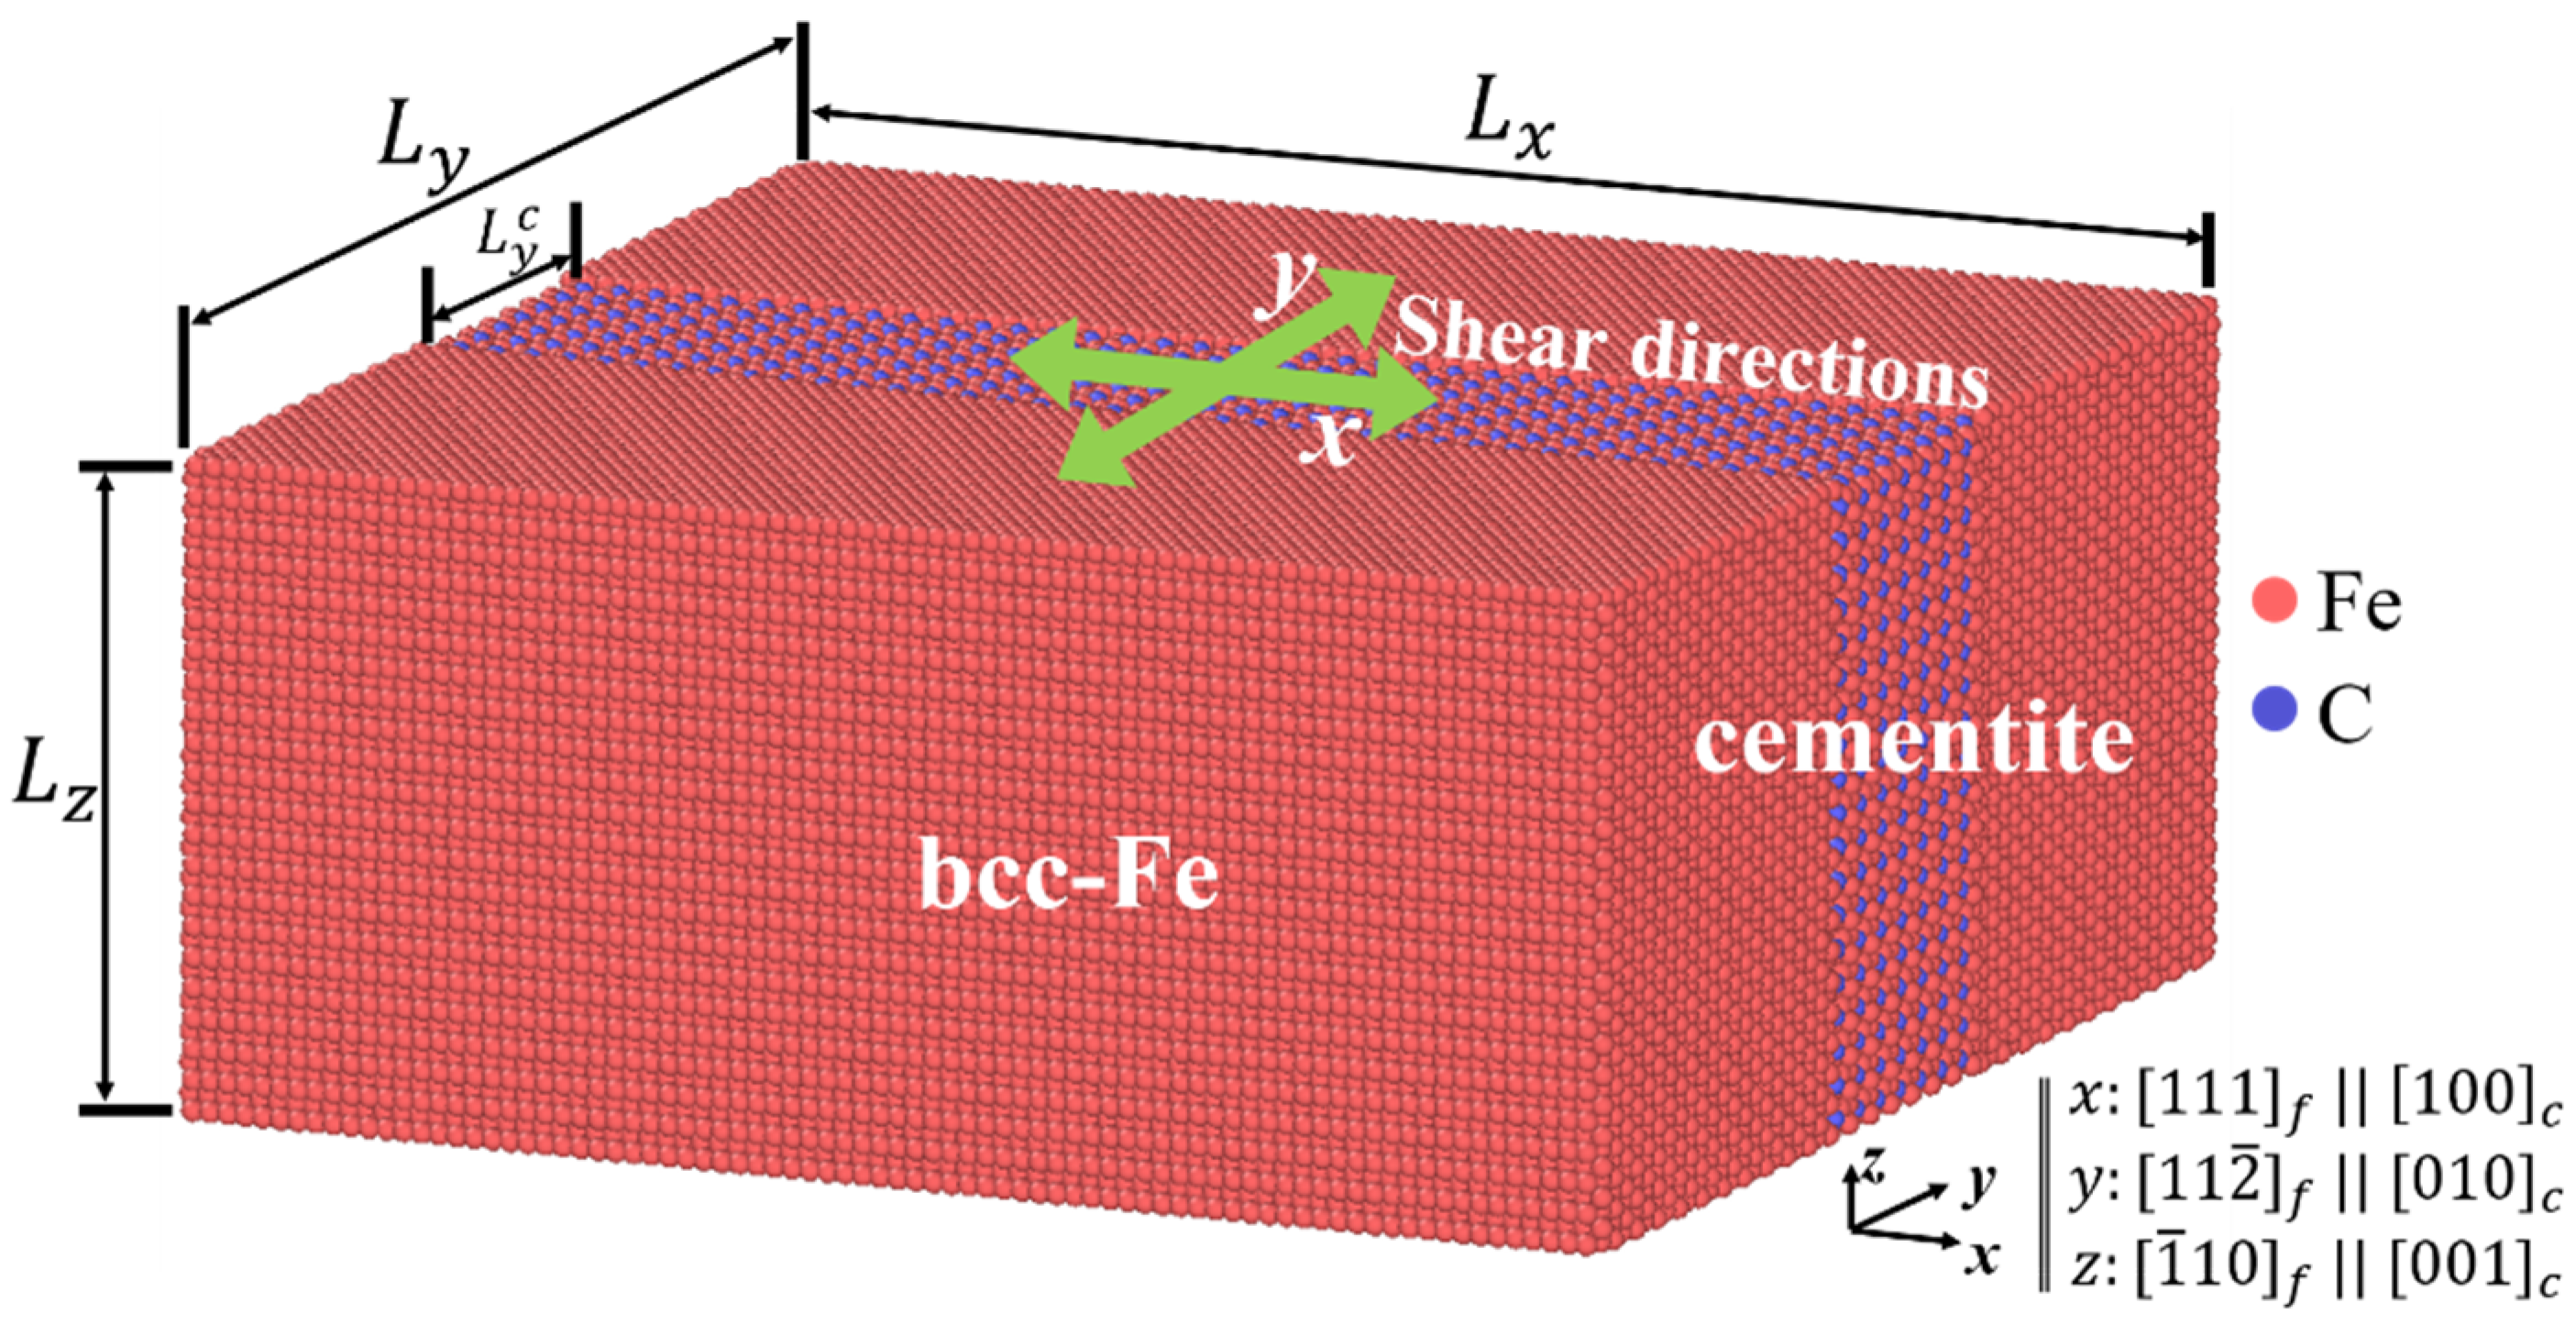
Most of the rolling contact fatigue originates from the subsurface, so before the atomic model is built for simulating the subsurface evolution of rolling bearings, the macroscopic stress field during rolling contact on the subsurface should be discussed. Based on the classical Hertz contact theory and some relevant results, the determination of the whole subsurface stress components in rolling bearings can be obtained [37,38]. The subsurface shear stress reaches its maximum and minimum values at a certain depth and changes alternately along the direction parallel to a bearing raceway. Here, a two-dimensional (2D) finite element model was established to simulate the contact between the roller and raceway. Note that the alternating shear stress is the key factor to resulting in damage accumulation and microcrack propagation [39]. Although 3D compressive stresses have influence on shear stress and negative effect on fatigue life, they are not taken into account in the performed study. Figure 2 shows the distribution of shear stress in the contact area between the roller and raceway. The roller has a diameter of 5.5 mm and inner race has a radius of 9.63 mm in the 2D contact model (shown in Figure 2a). Contact analysis implemented in ABAQUS was used. Figure 2b shows the nephogram of shear stress distribution in the contact area. It shows that the distribution of shear stress along the raceway has maximum and minimum values. Note that we are only interested in the stress distribution and ignore the specific stress value. Figure 2c shows the maximum shear stress and the maximum orthogonal shear stress on the subsurface under contact load. The x-axis represents the direction along raceway, and τ m a x represents the maximum orthogonal shear stress which will change alternately as the bearing runs. τ y m a x stands for the maximum shear stress acting on planes at 45° to the x and y axes.
According to the classical Hertz contact theory, the rolling contact between the roller and raceway can be simplified to the ideal line contact under 2D conditions. In order to simulate the dynamic contact process between the roller and raceway, the Dload subroutine implemented in ABAQUS was used. The Dynamic Hertz contact load setting is shown in Figure 3. p ( d )   represents the contact load distribution and p m a x represents the maximum contact load which is specified p m a x = 2000 MPa. p ( d ) is calculated by the following formula:
p ( d ) = p m a x [ 1 ( d / w ) 2 ] 1 / 2
where w represents the half-width of the contact area and is specified, w = 0.25 mm and   p ( d ) = 0, when d is equal to w. The computational domain was chosen to be 12w length and 5w depth, with a 0.01w distance between each node horizontally or vertically (shown in Figure 3a).   p ( d ) was set to move uniformly along the x-axis, aiming to replace the rolling contact process between the roller and raceway. Figure 3c shows the shear stress at point P1 as a function of loading time. The result of this is that shear stress at a certain point on the subsurface changes alternately with the motion of the contact load. Considering the similarity between Figure 3c and the sine curve, the alternating shear stress is replaced by the stress with sinusoidal regularity in the interest of computational simplicity in the following sections.

2.2. Atomic Model

To explain the micromechanism of cumulative damage in bearing steels, a two-phase atomic model was built and molecular dynamics (MD) simulations were performed using the Large-scale Atomic/Molecular Massively Parallel Simulator (LAMMPS) package [40]. The MD model shown in Figure 4 includes the cementite phase in the middle and bcc-Fe matrix on both sides. The simulation model has a rectangular shape with dimensions L x × L y × L z = 20 × 20 × 8.5 nm 3 (~0.3 million atoms). The cementite phase has a length along the y-axis of L y c = 4.7 nm. The bcc-Fe matrix has a calculated lattice parameter of a 0 = 2.855 Å, and the lattice parameters of orthorhombic cementite are a = 5.088 Å, b = 6.670 Å, c = 4.470 Å [41]. The lattice orientation of this model can be expressed as x : [ 111 ] f   | |   [ 100 ] c , y : [ 11 2 ¯ ] f   | |   [ 010 ] c and z : [ 1 ¯ 10 ] f   | |   [ 001 ] c . Here, the subscripts f and c denote bcc-Fe and cementite, respectively. The widely accepted Bagaryatskii orientation relation between ferrite and cementite was referred to and adopted here [35,42].
The interatomic potential of Fe–C proposed by Liyanage et al. [43], which is based on a modified embedded atom method (MEAM), was adopted to describe the interatomic force. The potential was proved to have high precision in MD annealing and simulations [34]. Periodic boundary conditions were applied in all three directions to reduce the size limitations of the MD simulation. Molecular statics energy minimization was carried out at zero pressure and 0 K by using the conjugate gradient algorithm. Then, MD annealing was performed. The Nosé–Hoover isothermal–isobaric (NPT) ensemble [44,45] was used to the simulation system to assign a temperature of 800 K and further equilibrate thermally at 800 K for 100 ps. After this, the system was cooled down to 5 K within 100 ps and further equilibrated at 5 K for 50 ps. The temperature of 5K was chosen to better observe the interface reactions caused by shear motion rather than being dominated by temperature.

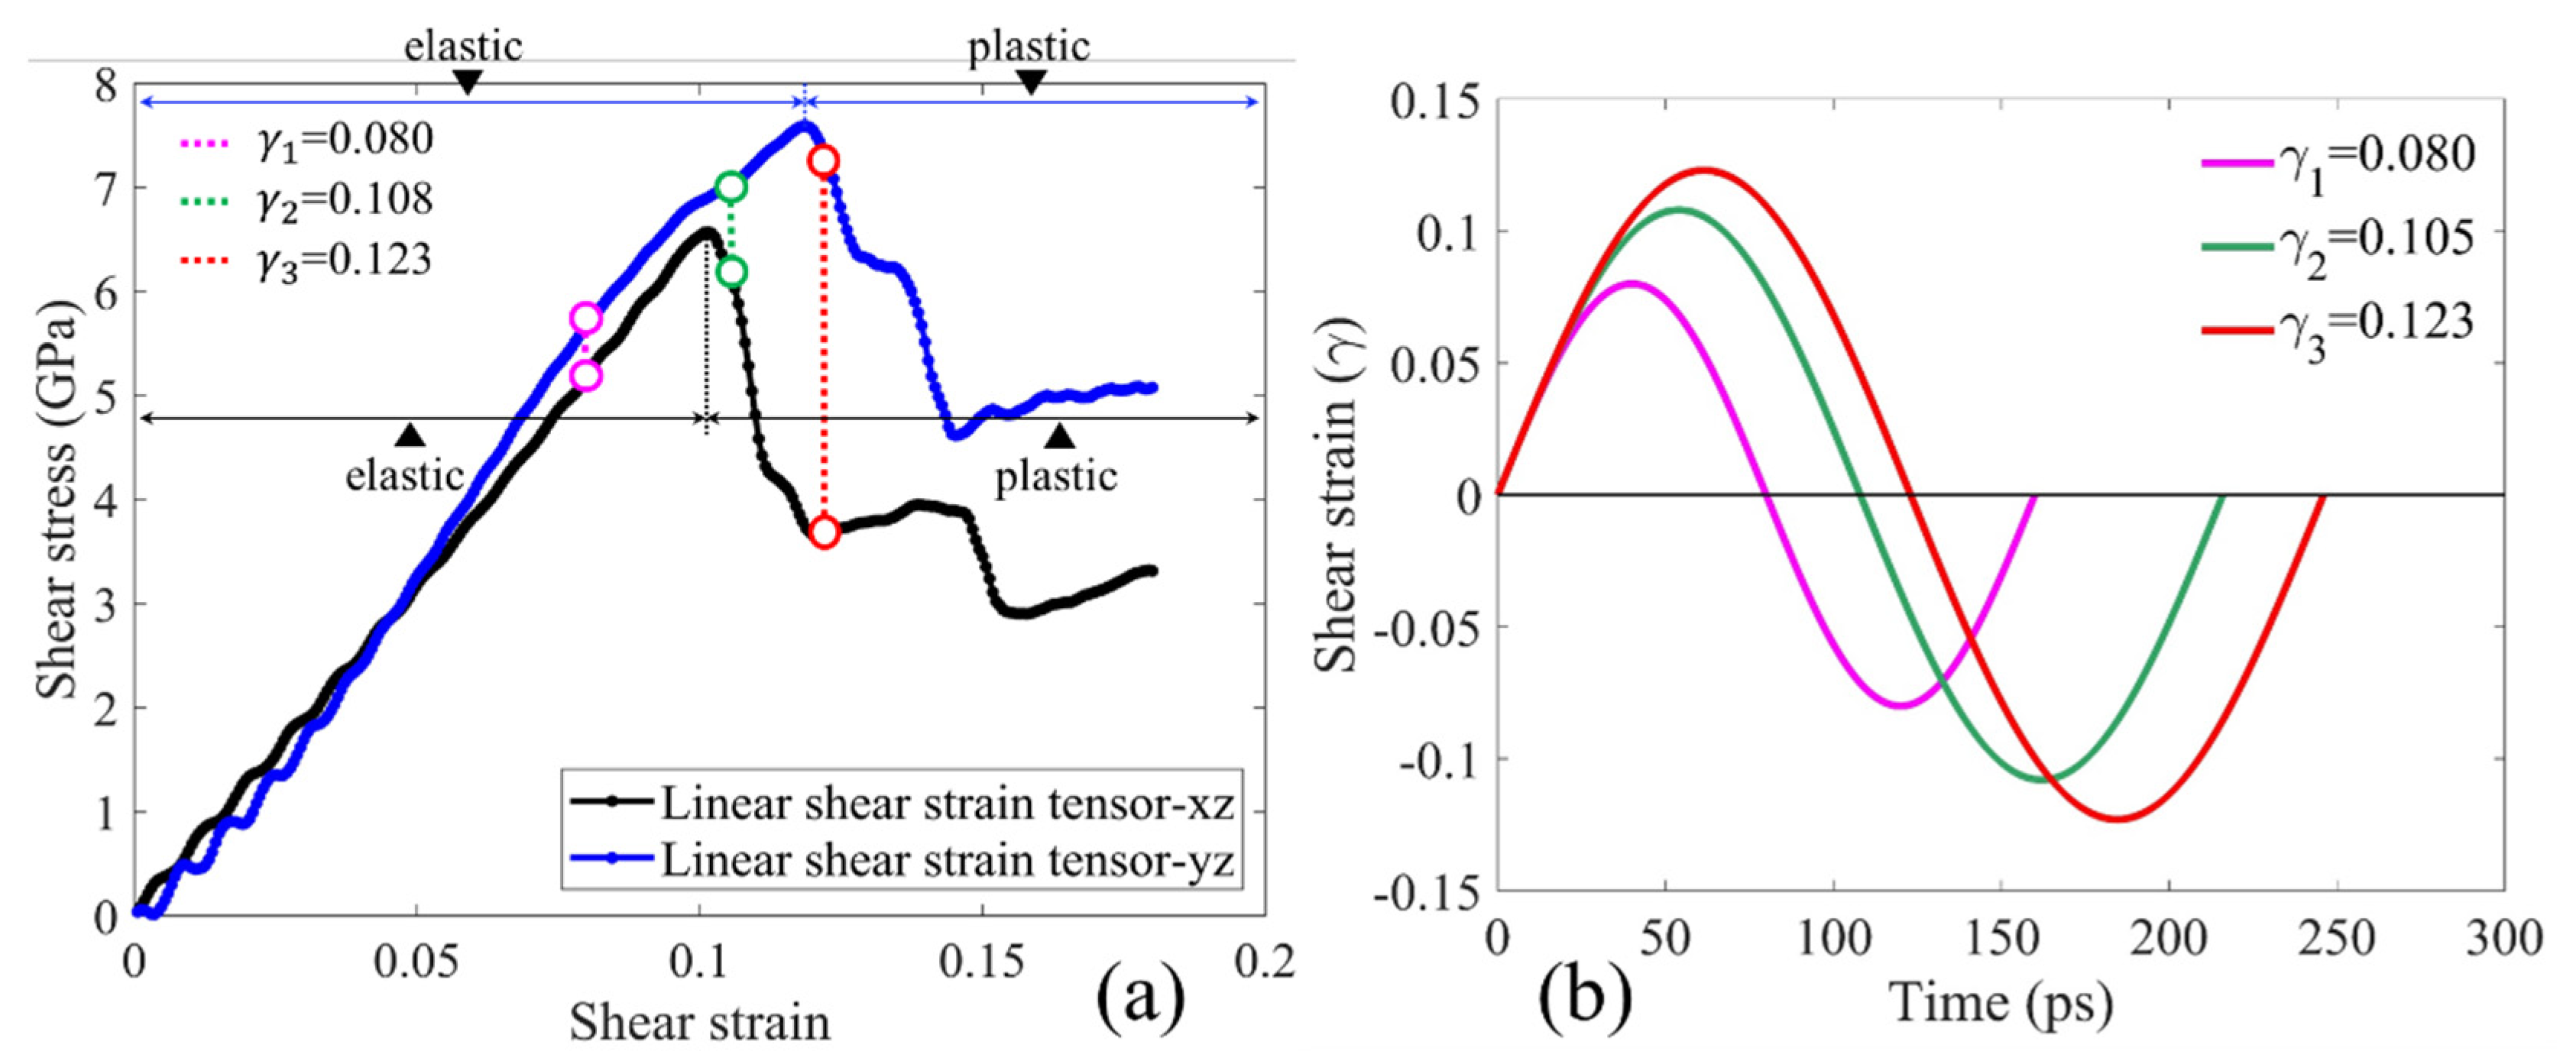
2.3. Loading Conditions

The characteristics of the alternating shear stress on the subsurface in rolling bearings include alternation and periodicity. Here, the cyclic shear deformation was applied to the atomic model to replace the real alternating stress field. Because of the deformation properties of bearing steels, it is necessary to discuss the transition between elasticity and plasticity of the atomic model under shear deformation in order to determine the amplitudes of cyclic shear deformation. Therefore, monotonic shear deformations were performed to discuss the transition. Strain rate at a constant of 10 9   s 1 was applied to the simulation model along the y-axis and the x-axis, respectively, considering that loading directions will affect the simulation results. The MD timestep was 2 fs, and the temperature was maintained at 5K. Here, γ represents the shear strain of the model.
Based on the atomic model and MD simulations, the mechanical properties and loading conditions of the model are shown in Figure 5. Shear stress–strain curves under monotonic shear deformation along two directions are shown in Figure 5a. Note that the shear stress refers to the average values calculated along the y-axis ( τ y z ) and the x-axis ( τ x z ) of the model [46], respectively. The linear shear stress tensor-yz and linear shear stress tensor-xz shown in Figure 5a denote the results of loading along the y-axis and the x-axis, respectively. Although shear deformation along the two directions resulted in different stress states for the model, both cases contain two different stages: elastic and plastic. Nevertheless, the elastic–plastic transition points of this two curves are different. To explore the plastic accumulation principle of the simulation model, three shear stress states for the following cyclic simulations were selected, as shown in Figure 5b. Three different shear deformations named γ 1 , γ 2 and γ 3 had values of 0.080, 0.105 and 0.123, respectively. All curves shown in Figure 5b are sinusoidal curves.
As shown in Figure 5a,b, the model is in the elastic stage when shear deformation is along the y-axis and the x-axis under γ 1 . When shear deformation is γ 2 , the model is in elastic stage under shear deformation along the y-axis and is in plastic stage under shear deformation along the x-axis. When shear deformation goes up to γ 3 , the model is in plastic stage along both loading directions. Actually, the variation in the alternating shear stress on the subsurface during RCF is similar to the impulse waveform [25]. The alternating shear stress in a certain region is close to zero for most of a cycle. However, we ignored the period when the model was at a low alternating shear stress level to reduce the simulation cost. The cyclic shear movement of the boundary layers was set to be continuous. Figure 5b shows only one load cycle, and we conducted 10 cycles for all three load amplitudes to explore the plastic cumulative damage mechanism of the model. The OVITO software package [47] was used to visualize the different defects in the system. Dislocations were analyzed by using the dislocation extraction algorithm (DXA) tool [48].

3. Results and Discussion

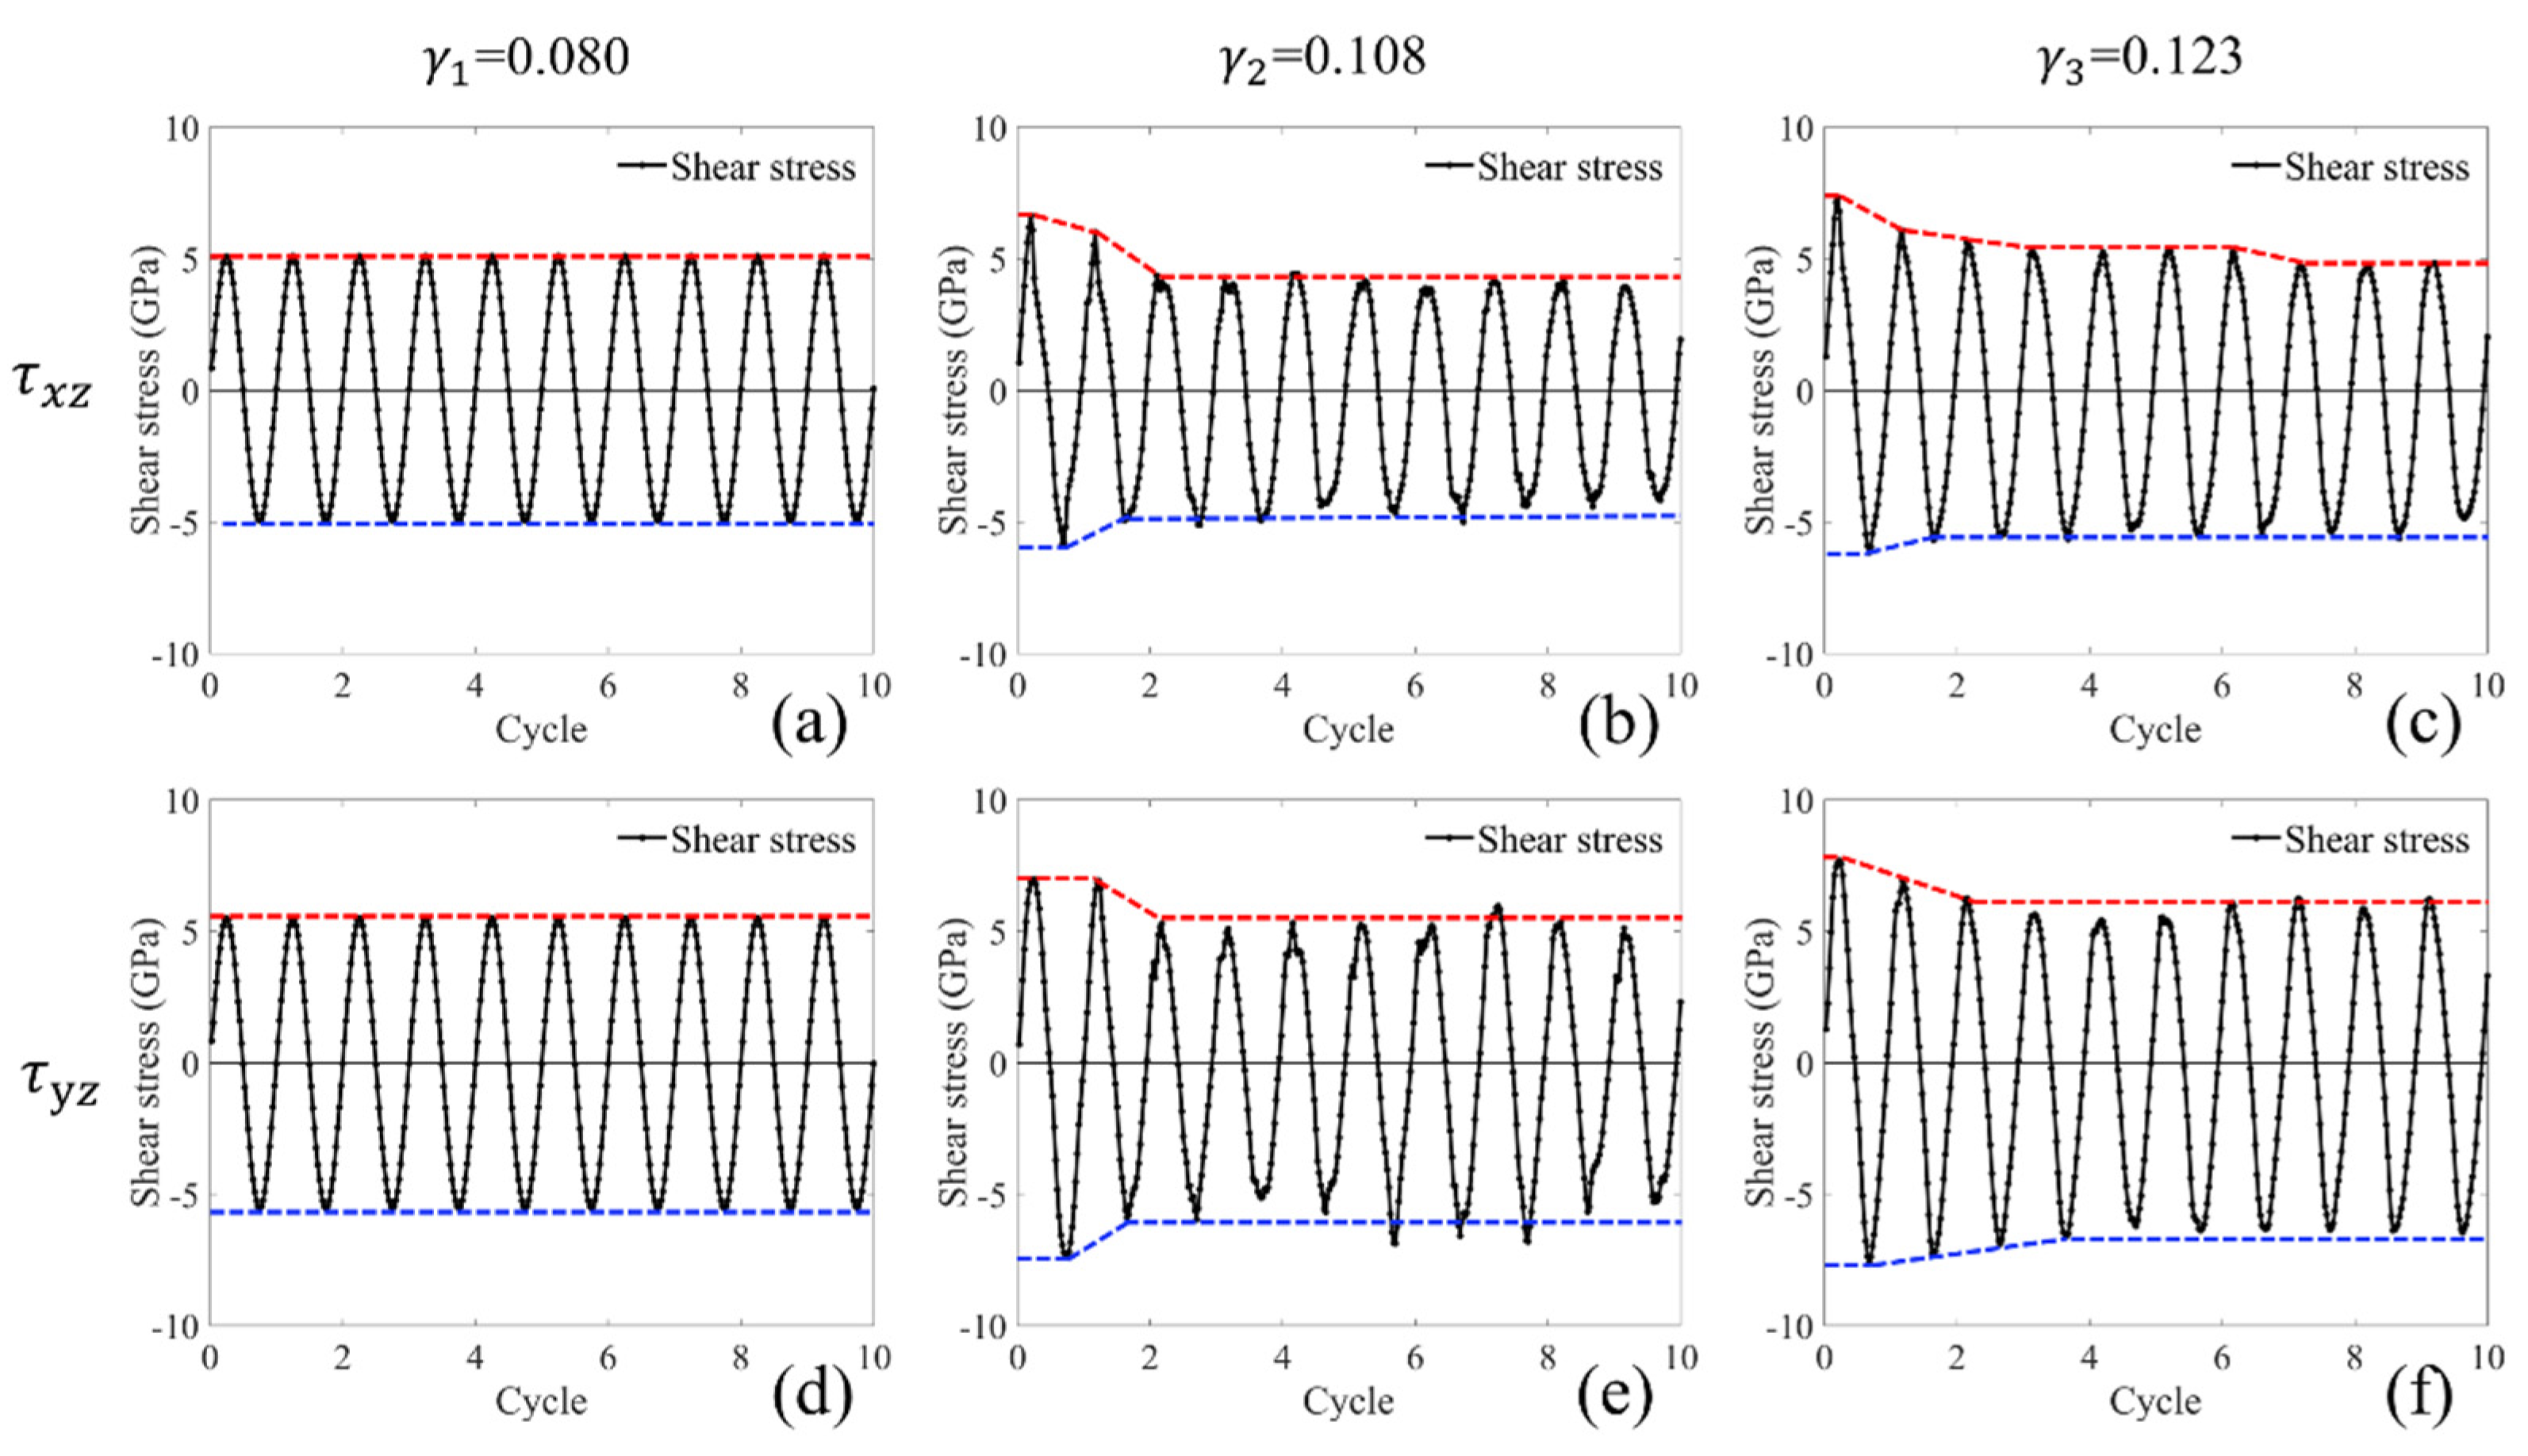
3.1. Shear Stress Responses

Cyclic shear stress was calculated to investigate the plastic accumulation behavior of the atomic model. Figure 6a,d show the curves of the shear stress as functions of cycle when shear strain γ 1 is applied along the y-axis and the x-axis, respectively. In all ten cycles, the maximum stress amplitudes remain unchanged in both curves, indicating that the model is in the elastic stage. Figure 6b,e show the curves of the shear stress as functions of cycle when shear strain γ 2 is applied along the y-axis and the x-axis, respectively. The stress amplitudes decrease to some extent when shear deformation is along the x-axis due to the model being in the plastic stage (shown in Figure 5a). The decrease is called cyclic softening [49], which also highlights the beginning of plastic accumulation. Dislocations nucleate and grow on the interface between cementite and the bcc-Fe matrix, thus resulting in plastic accumulation. It is worth noting that the stress response also decreases in Figure 6e and, after the first cycle, the model is in the elastic stage shown in Figure 5a. Actually, this phenomenon is closely related to the slight stress reduction in Figure 5a when shear strain is near 0.1 and can also be explained by evolutions of dislocations and highly strained atoms. The details will be discussed in the following sections. Figure 6c,f show that when shear strain γ 3 is applied, shear stress amplitudes decrease in the first cycle and then reach a steady level. Additionally, the mean value of steady stress shown in Figure 6e,f is greater than that shown in Figure 6b,c. This is due to the higher yield stress and the weaker decrease in stress amplitude in the plastic stage when shear strain is applied along the y-axis. The conclusion is that cyclic softening is determined by both shear deformation amplitude and shear direction. Under severe shear deformation, large residual shear stress exists within the model at the end of 10 cycles.
The decreasing extent of stress amplitude during cyclic softening depends on the dislocation evolution mechanism under different shear deformations. Note that the experimental results drawn from carbon steels show work hardening as cyclic cycles increase under uniaxial ratchetting deformation [23,50], which may be explained by cyclic softening. The elastic deformation ability of the material is weakened and regular structures are destroyed due to the decrease in stress amplitudes, thus resulting in the macroscopic phenomenon of work hardening. Furthermore, the results shown in Figure 6 are a little different from the results drawn from the model under cyclic tension and compression loadings [31]. During cyclic shear deformation, the atomic model seems more likely cause cyclic softening, which also happens earlier in this model, and the plastic accumulation is faster and more obvious. This is mainly due to the differences in the calculated stress tensors and the mode of motion. Faster plastic accumulation occurs on the subsurface in rolling bearings, which is unfavorable to the fatigue life of bearings.

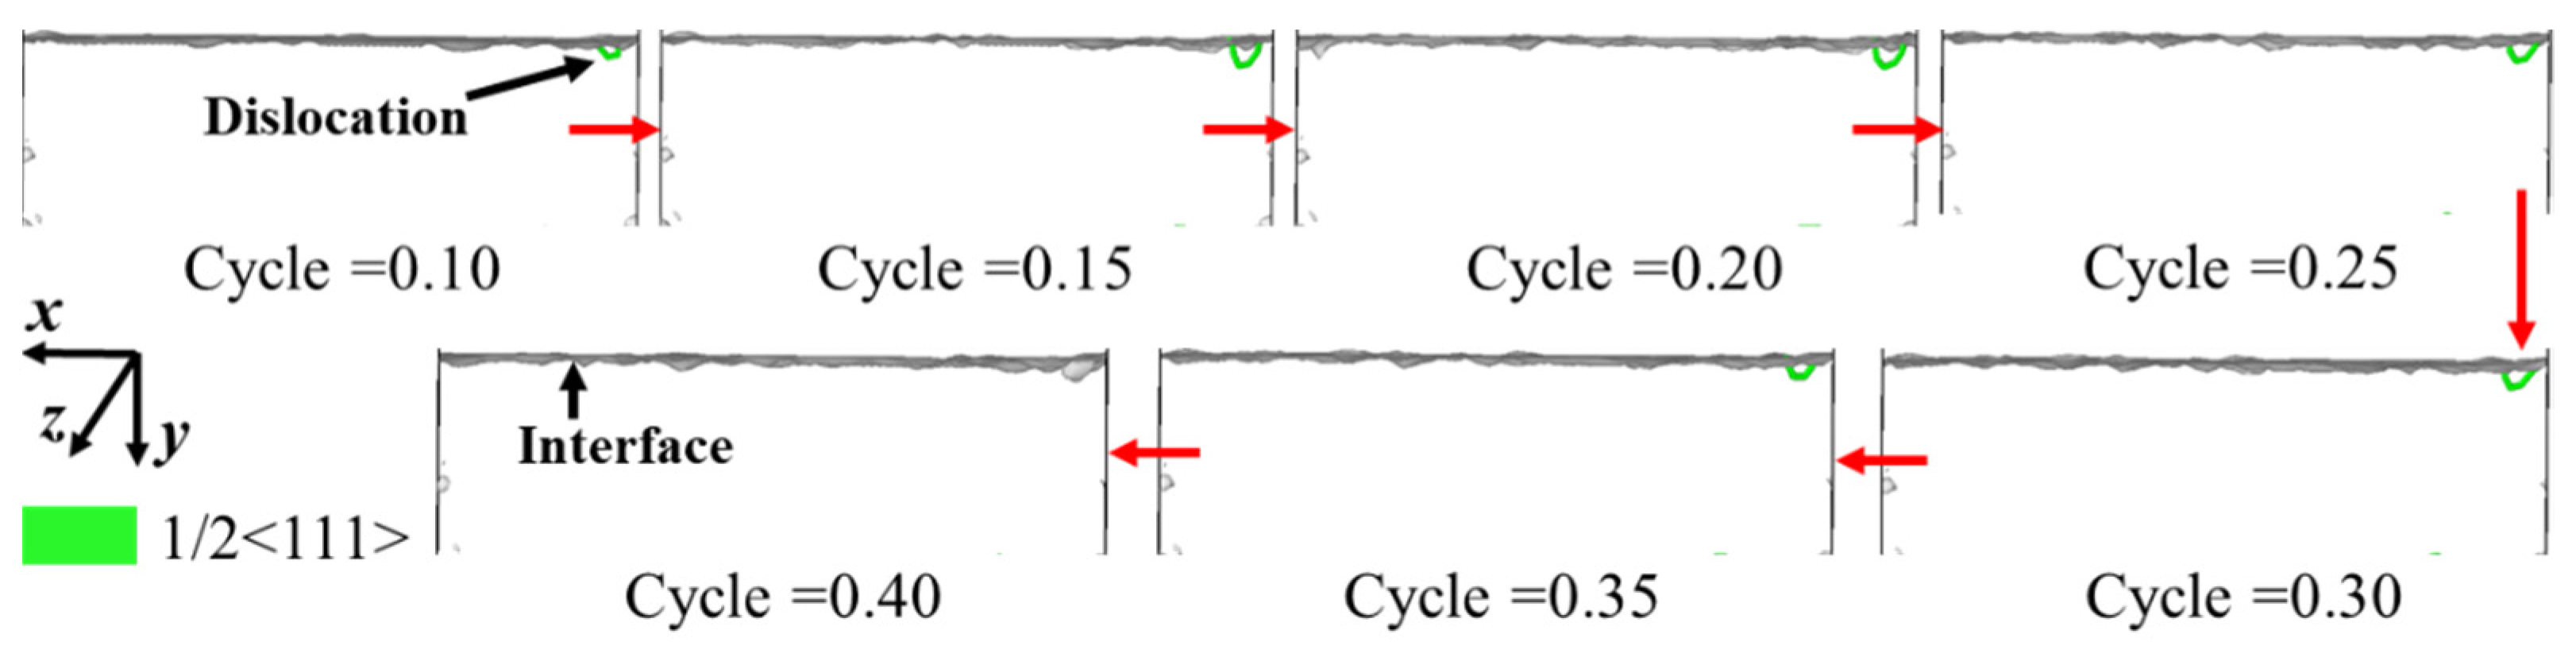
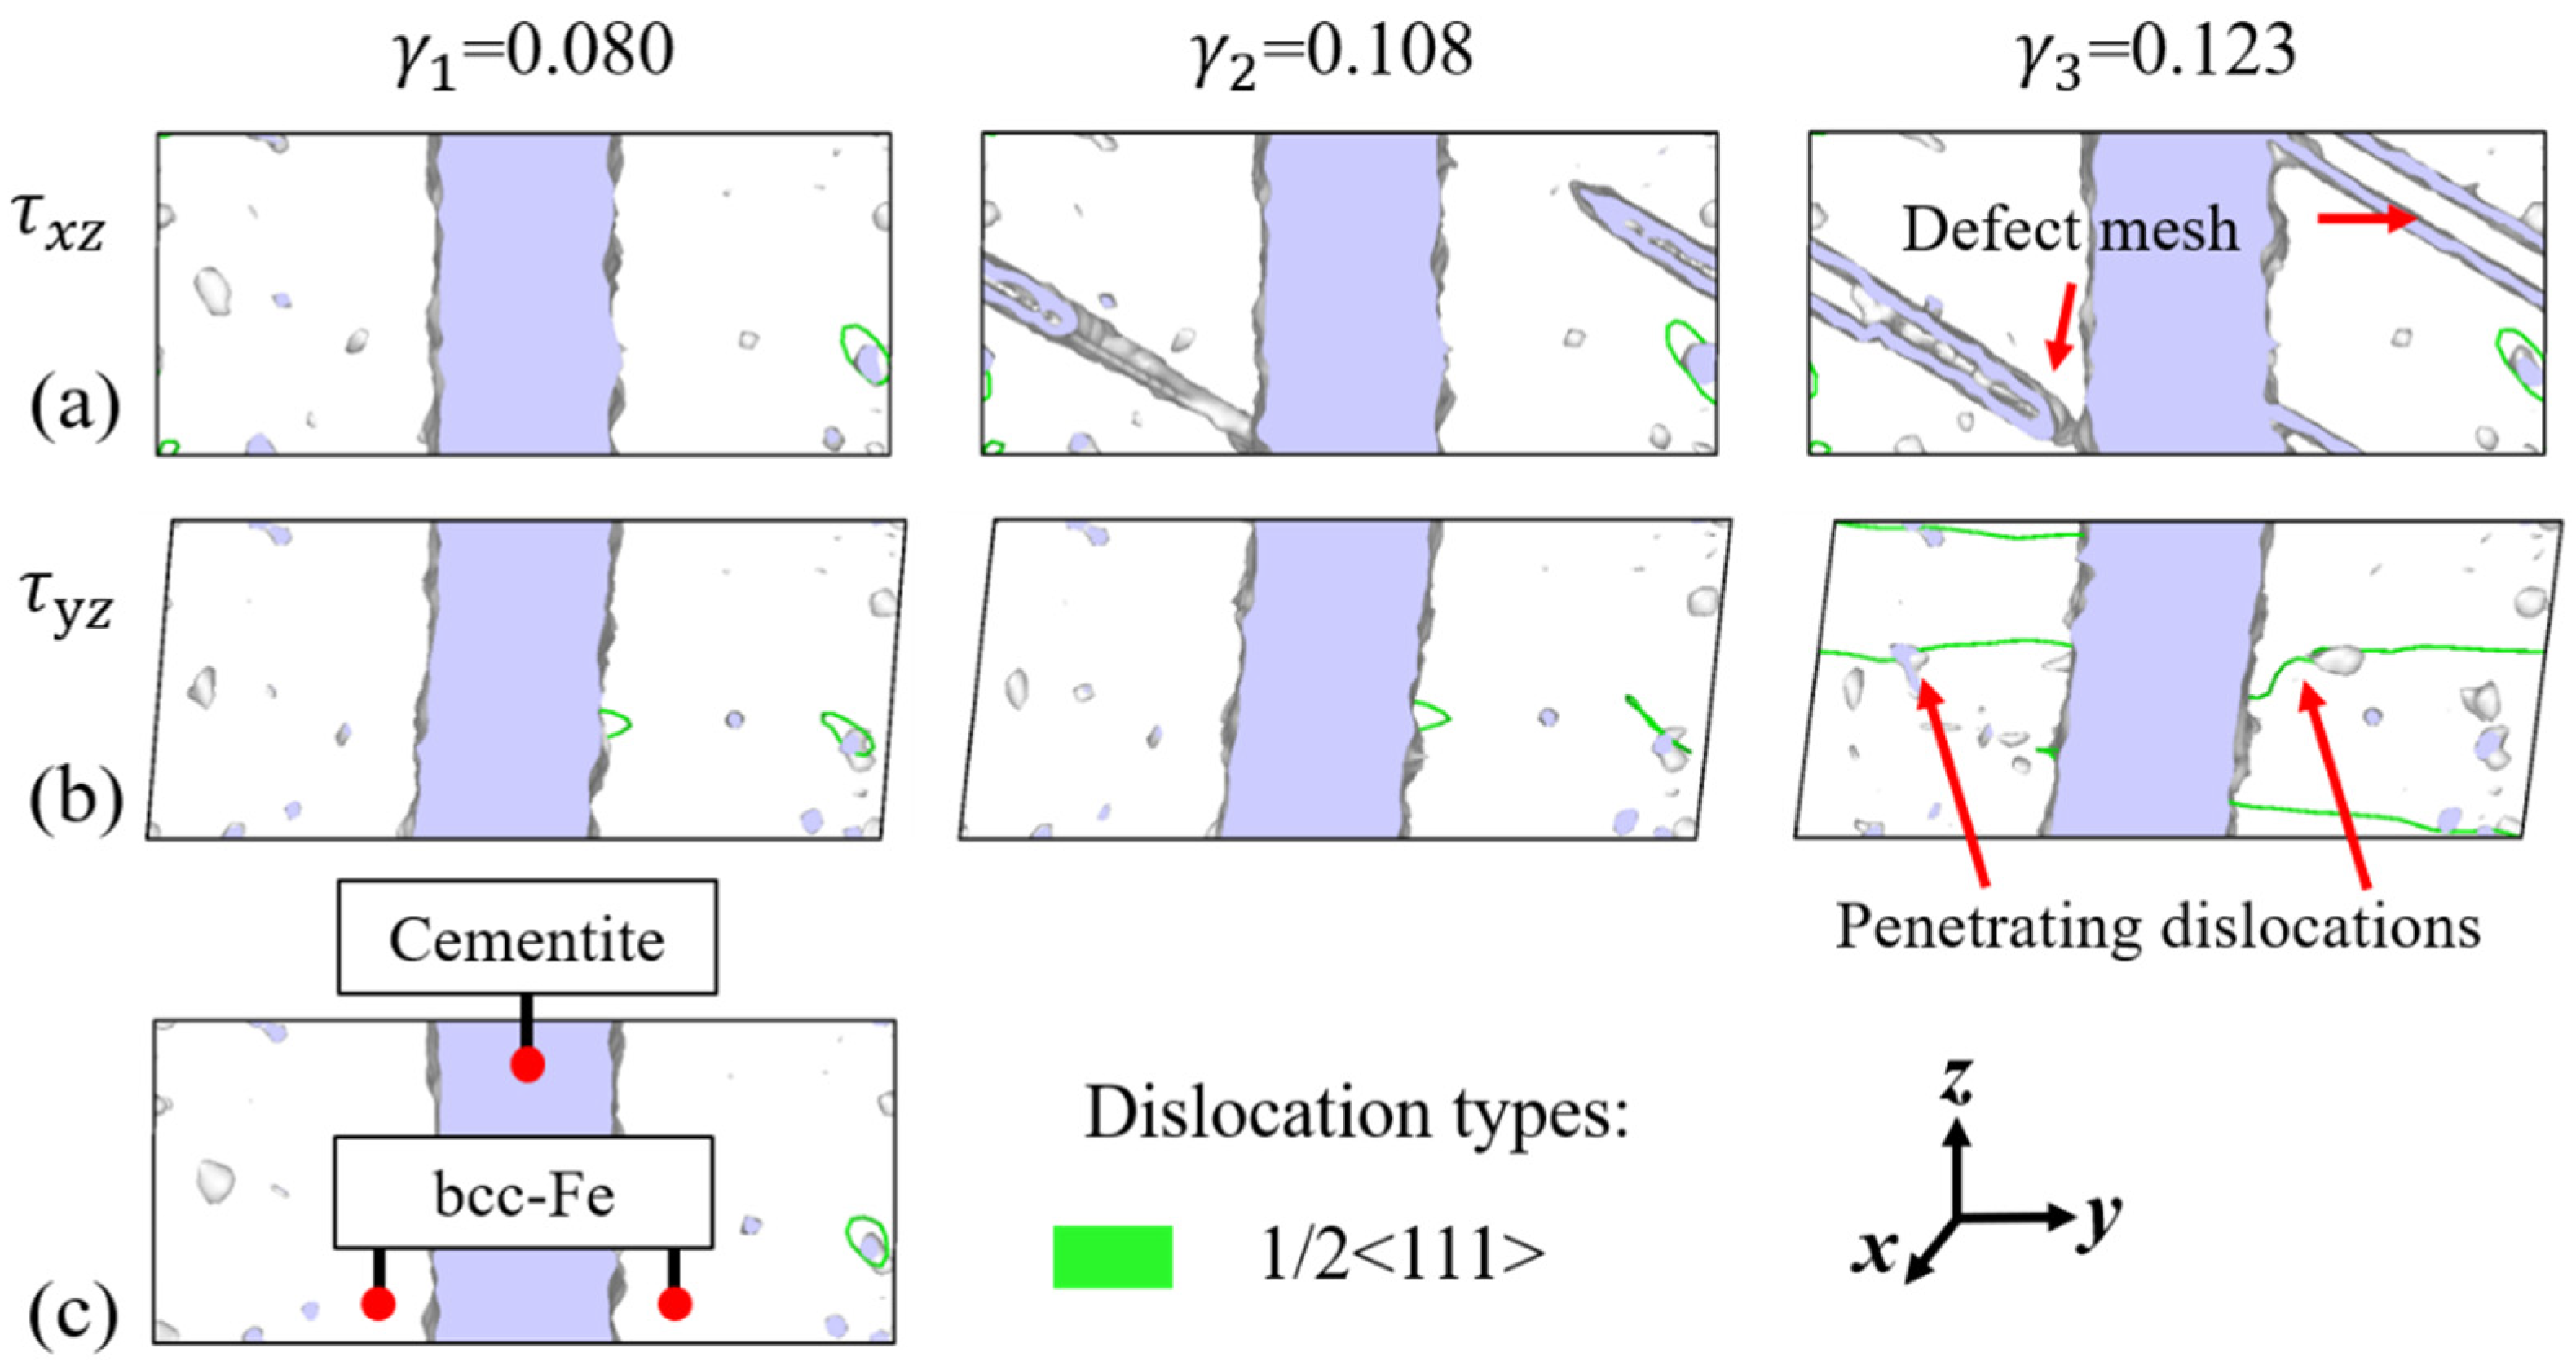
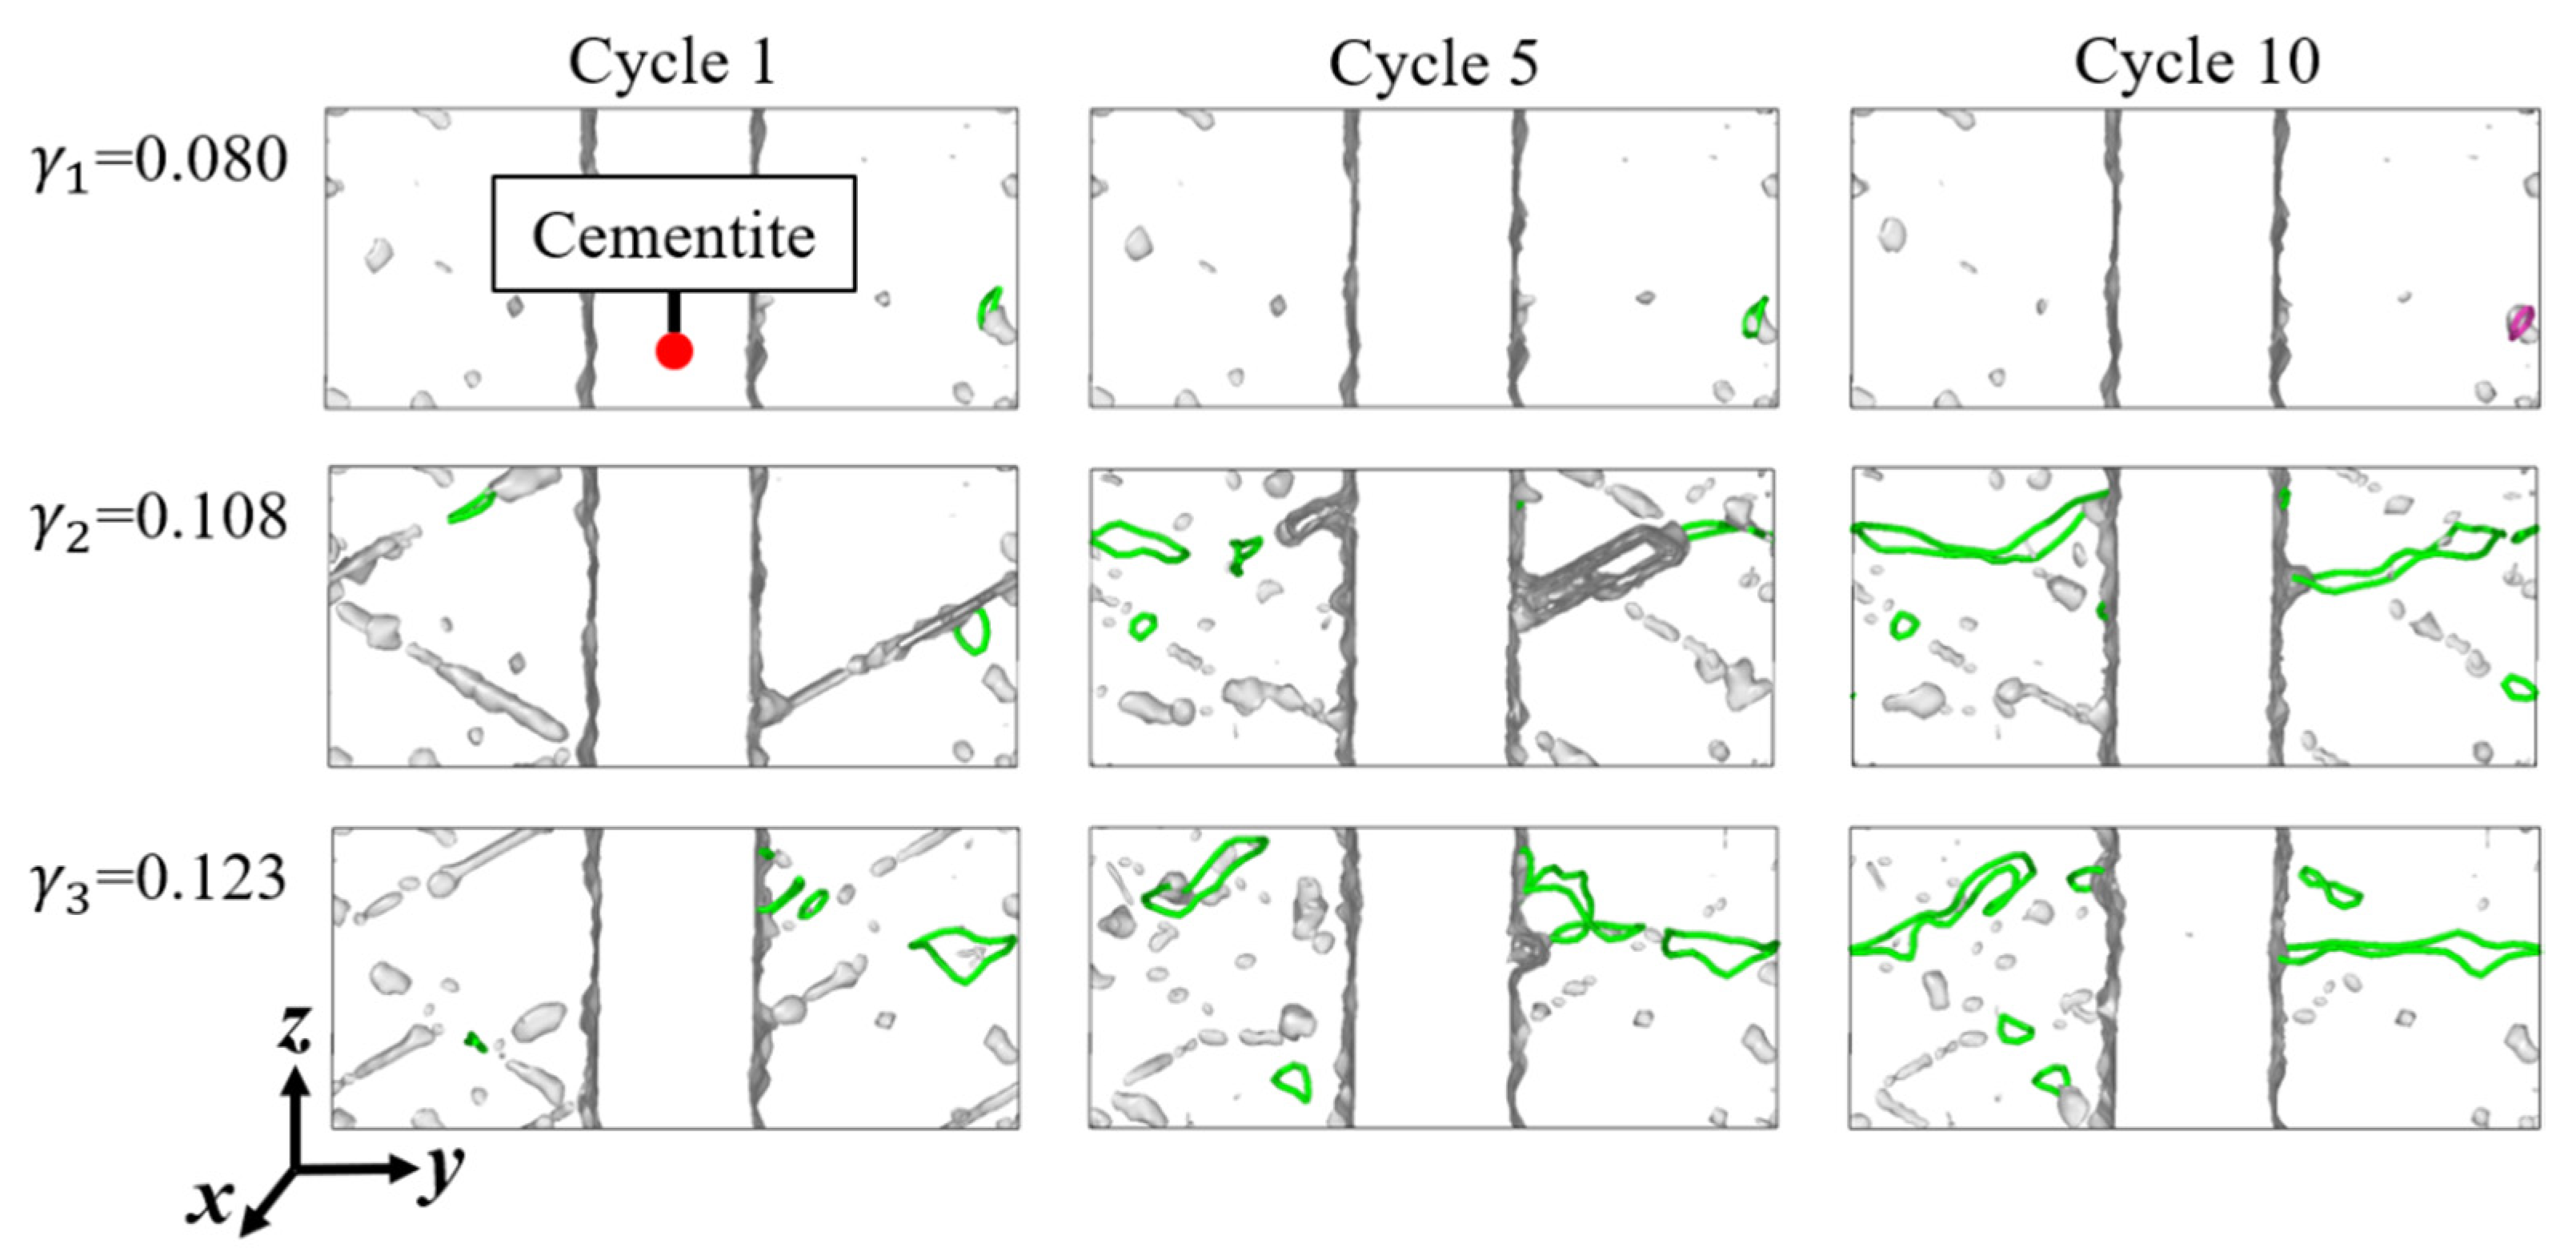
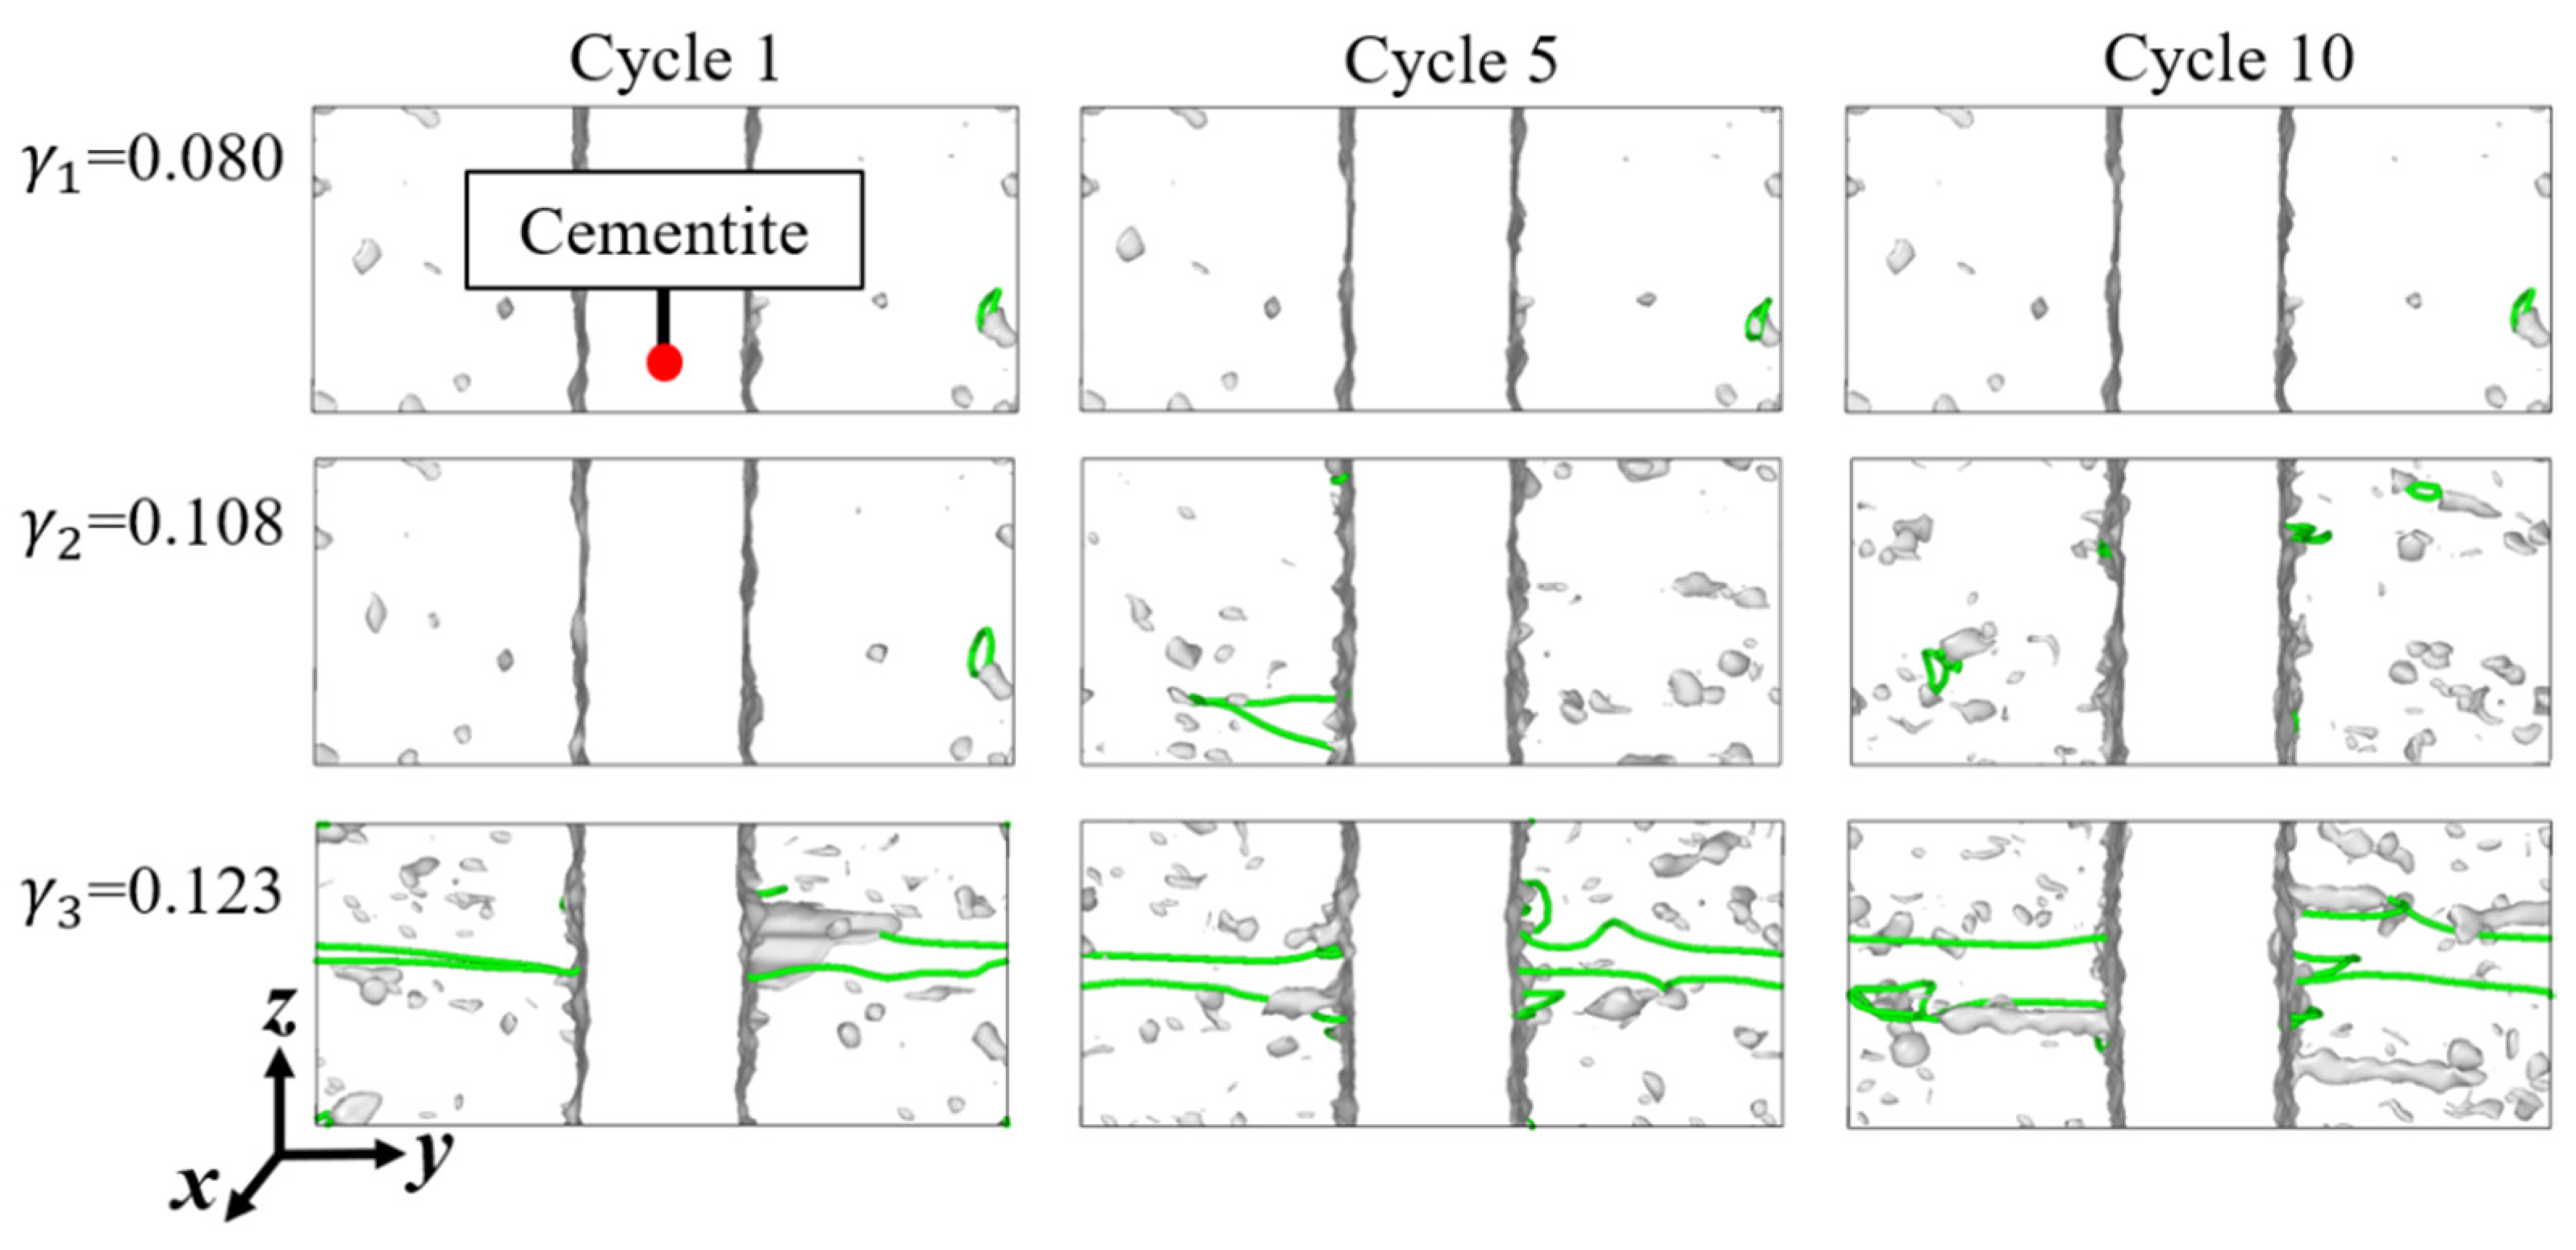
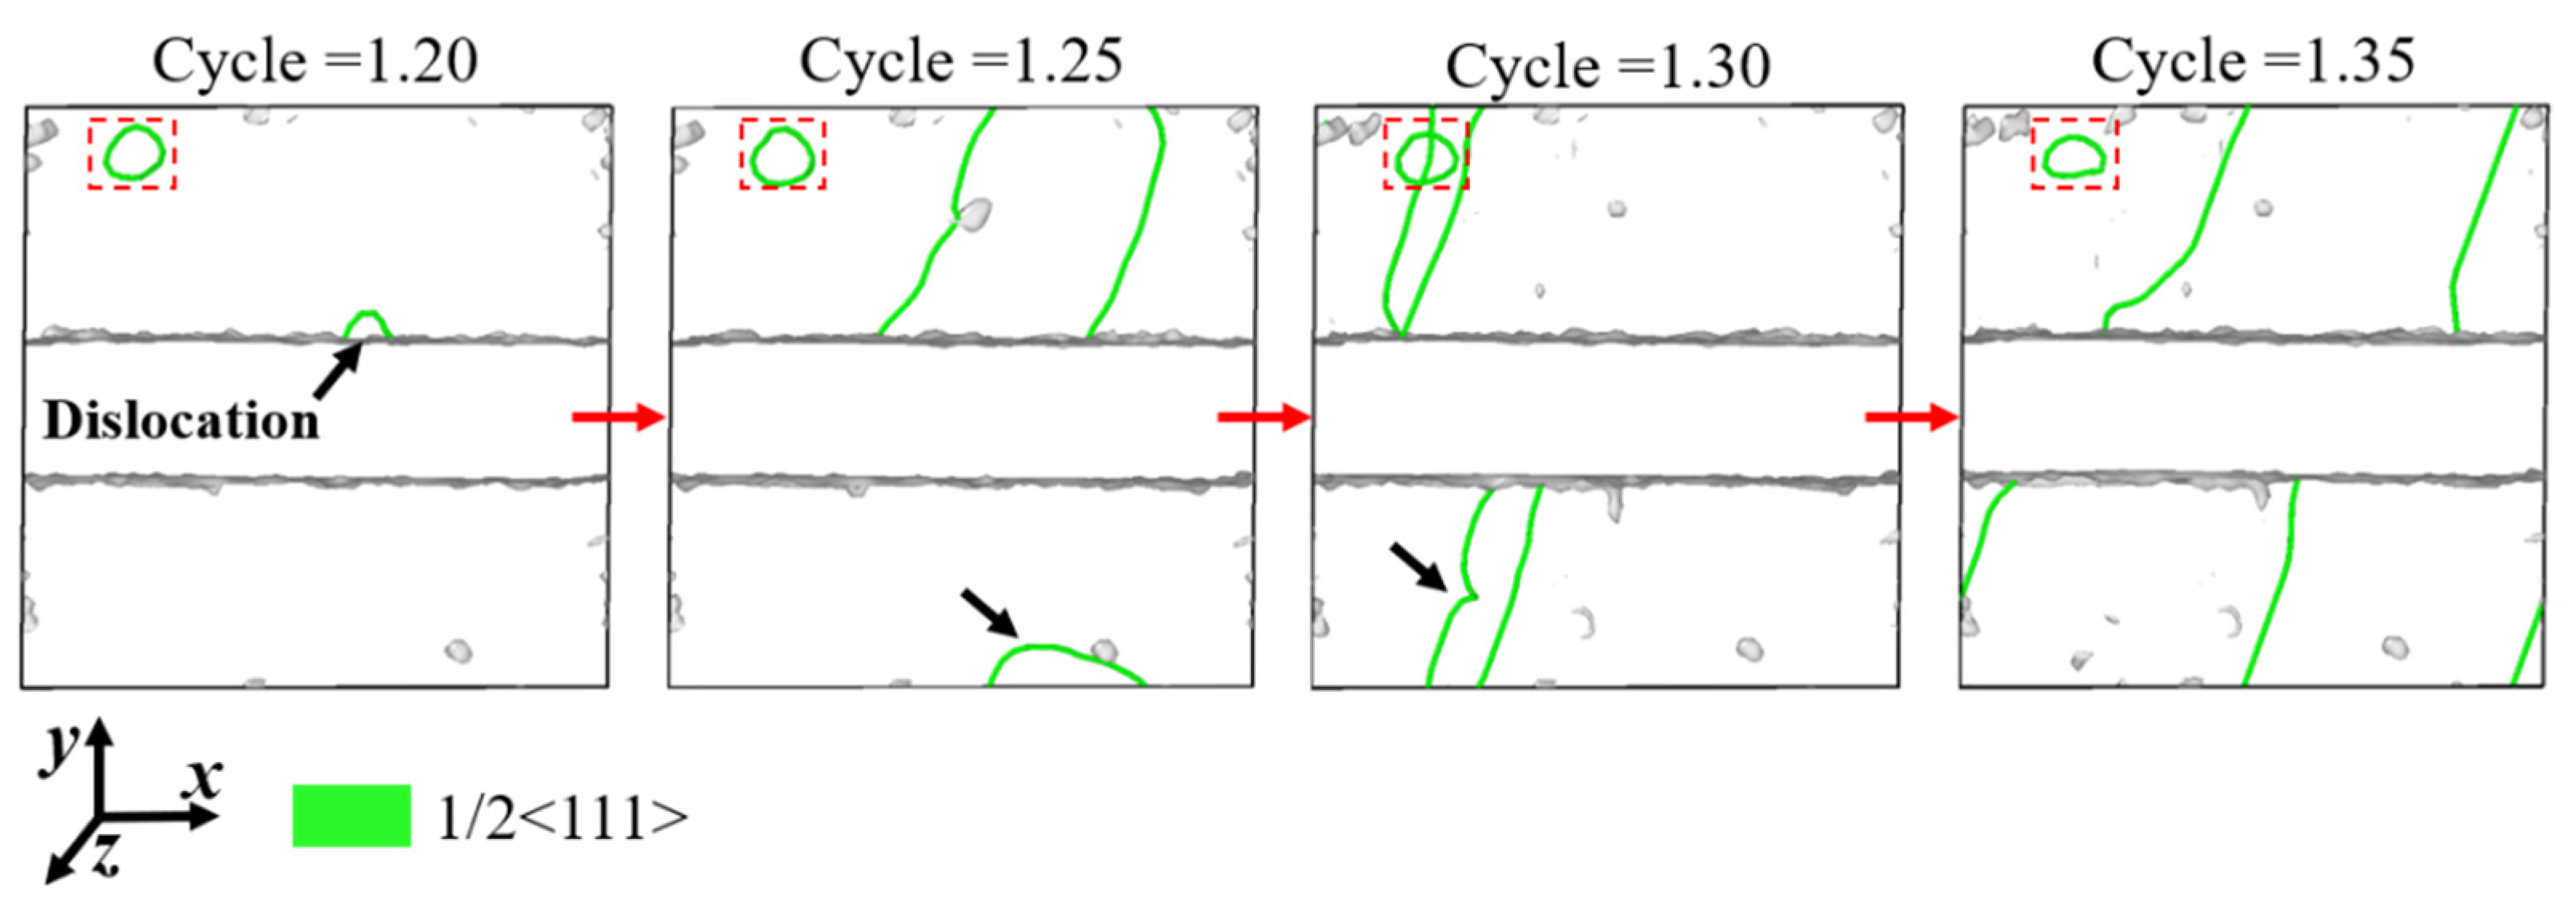
3.2. Evolution of Dislocations and Defect Meshes

Dislocation is a kind of line defect in crystal which plays a decisive role in the plastic deformation, strength and fracture of materials [51]. Defect mesh is a triangulated mesh which represents the bad crystal regions that have not been classified as dislocations [47,52]. In the present work, defect mesh represents the residual shear strain in the bcc-Fe matrix due to cyclic shear deformation, and further indicates the residual shear strain in the model. The appearance of defect mesh corresponds to the increase in local microplastic flow and the residual stress of the material in stage I of RCF, which is not conducive to a good fatigue life of the bearing [23].
Figure 7 shows the details of dislocation evolution under monotonic shear deformation. Figure 7a,b show the dislocation distribution when shear strains were applied along the x-axis and the y-axis, respectively. Figure 7c provides the initial structure for comparison. In Figure 7a, few dislocations nucleate from the interface between cementite and bcc-Fe under all three shear strain levels. Nevertheless, large amounts of defect meshes appear near the interface, and due to the periodic boundary conditions, defect meshes gradually connect the left and the right interfaces, which manifests as defect meshes initiating from one interface and growing through the boundary to the other interface. This pattern usually indicates the presence of large shear slip bands in the model. Meantime, it also refers to the transfer of the slip bands from the bcc-Fe matrix to the cementite phase, indicating that shear deformation begins to occur inside or on the surface of the cementite phase. When shear slip occurs in the brittle cementite phase, the fatigue failure of the material begins to develop. Figure 7b shows that with the increase in shear strain, the quantity of dislocation gradually increases. The dislocations are also penetrating, initiating from one interface and growing through the boundary to the other interface. This indicates that dislocations cannot be annihilated and continue to remain in the material, marking the beginning of plastic accumulation of the material.
The cyclic softening and elastic–plastic transformation in Figure 6 are closely related to the evolution of dislocations and defect meshes during cyclic shear deformation. Figure 8 shows the dislocation distribution in the model underlying cyclic shear deformation along the x-axis. The results show that when shear deformation is severe enough and the model is in the plastic stage, dislocations and defect meshes begin to nucleate and are annihilated in the model or on the two phase interfaces as cycle goes on. At the end of ten cycles, a certain number of dislocations and defect meshes remain in the model. Note that there are not a lot penetrating defect meshes at the end of cycle, but a large amount of defect meshes with the same orientation appear during each cycle, which is the same as seen in Figure 7a. This indicates that there exists a lot of residual strain in the model and also points out that the material has undergone severe plastic deformation.
Figure 9 corresponds to the dislocation distribution in the model under cyclic shear deformation along the y-axis. When shear strain is γ 1 , no new dislocations and defect meshes nucleate and are annihilated in the model due to the elastic stage. When shear strain goes up to γ 2 , a few penetrating dislocations begin to nucleate and grow and finally remain in the model at the end of ten cycles. When shear strain is γ 3 , penetrating dislocations nucleate on the interface and remain in the model at the end of the first cycle. The results show that severe shear deformation will accelerate the nucleation of dislocations and the accumulation of plasticity. Additionally, the amount of defect meshes is kept at a low level, which corresponds to that in Figure 7b. The lower residual shear strain in the model can be attributed to that the direction of the cyclic loadings is parallel to the interface. This indicates that the model produces less plastic accumulation, or the rate of plastic accumulation is slower, which may result in a relatively longer fatigue life of the material. Figure 8 and Figure 9 suggest that the plastic accumulation mechanism of the material is ascribed to the synergistic effects between the cyclic deformation and the loading direction.
The interface is an underlying area for defect generation and annihilation during plastic deformation [53]. During cyclic shear deformation, the interface is accompanied by the nucleation and annihilation of dislocations, which results in the fluctuation of dislocation density. After several cycles, the residual strain in the model hinders the annihilation of dislocations, which is manifested as a large number of dislocations remaining in the model at the end of the cycle. Figure 10 shows the nucleation and annihilation of dislocations on the interface when γ 2 is applied along the y-axis. The view in Figure 10 is kept parallel to the interface by rotating the coordinate system. At the end of the first cycle shown in Figure 9, when γ 2 is applied, no dislocation appears on the interface. Nevertheless, a 1/2<111> dislocation nucleates when the cycle is 0.1, then gradually grows up from 0.15 cycle to 0.25 cycle, and finally disappears from 0.30 cycle to 0.40 cycle. Note that the time for dislocation nucleation is longer than that for annihilation, which is mainly due to a larger activation barrier of nucleation than that of annihilation. The same conclusion was drawn by Liang et al. [31]. In addition to this, low temperature was adopted to the atomic model, because temperature affects the speed of dislocation evolution [54]. Choosing a temperature of 5 K could help us observe the process of dislocation nucleation and annihilation more clearly.
From the shear stress response under a shear strain of γ 2 along the y-axis (shown in Figure 6), we can determine that shear stress begins to drop after the first cycle. Actually, this cyclic softening can also be explained by dislocation evolution, shown in Figure 11. When shear deformation comes to cycle 1.2, a 1/2<111> dislocation nucleates on the two-phase interface. Different from the interface dislocation in the first cycle shown in Figure 10, this dislocation rapidly increases from 1.20 cycle to 1.25 cycle and finally becomes a penetrating dislocation at cycle 1.30. Then, the dislocation begins to move and react, resulting in irreversible plastic accumulation. Therefore, the appearance of penetrating dislocations represents the beginning of plastic accumulation. Note that a dislocation loop always exists in the model throughout the cycle. It exists in the model at the beginning of shear deformation due to unperfect model pretreatment. Nevertheless, Figure 11 shows that the dislocation loop is stable and almost remains unchanged during shear deformation, which indicates that it does not affect the stress characteristics of the model.
Severe shear deformation leads to the excessive growth of dislocations which evolve into surface defects such as stacking fault, and the interlaced dislocations ultimately result in irreversible plastic accumulation. Note that the nucleation of dislocations usually occurs on the interface between bcc-Fe and cementite. Therefore, the idea that the generation and accumulation of dislocations on the two-phase interface or the boundary of carbide inclusions are the origin of the cyclic plastic accumulation is convincing. This may also be the main reason why damage to rolling bearings usually appears near inclusions such as carbides.

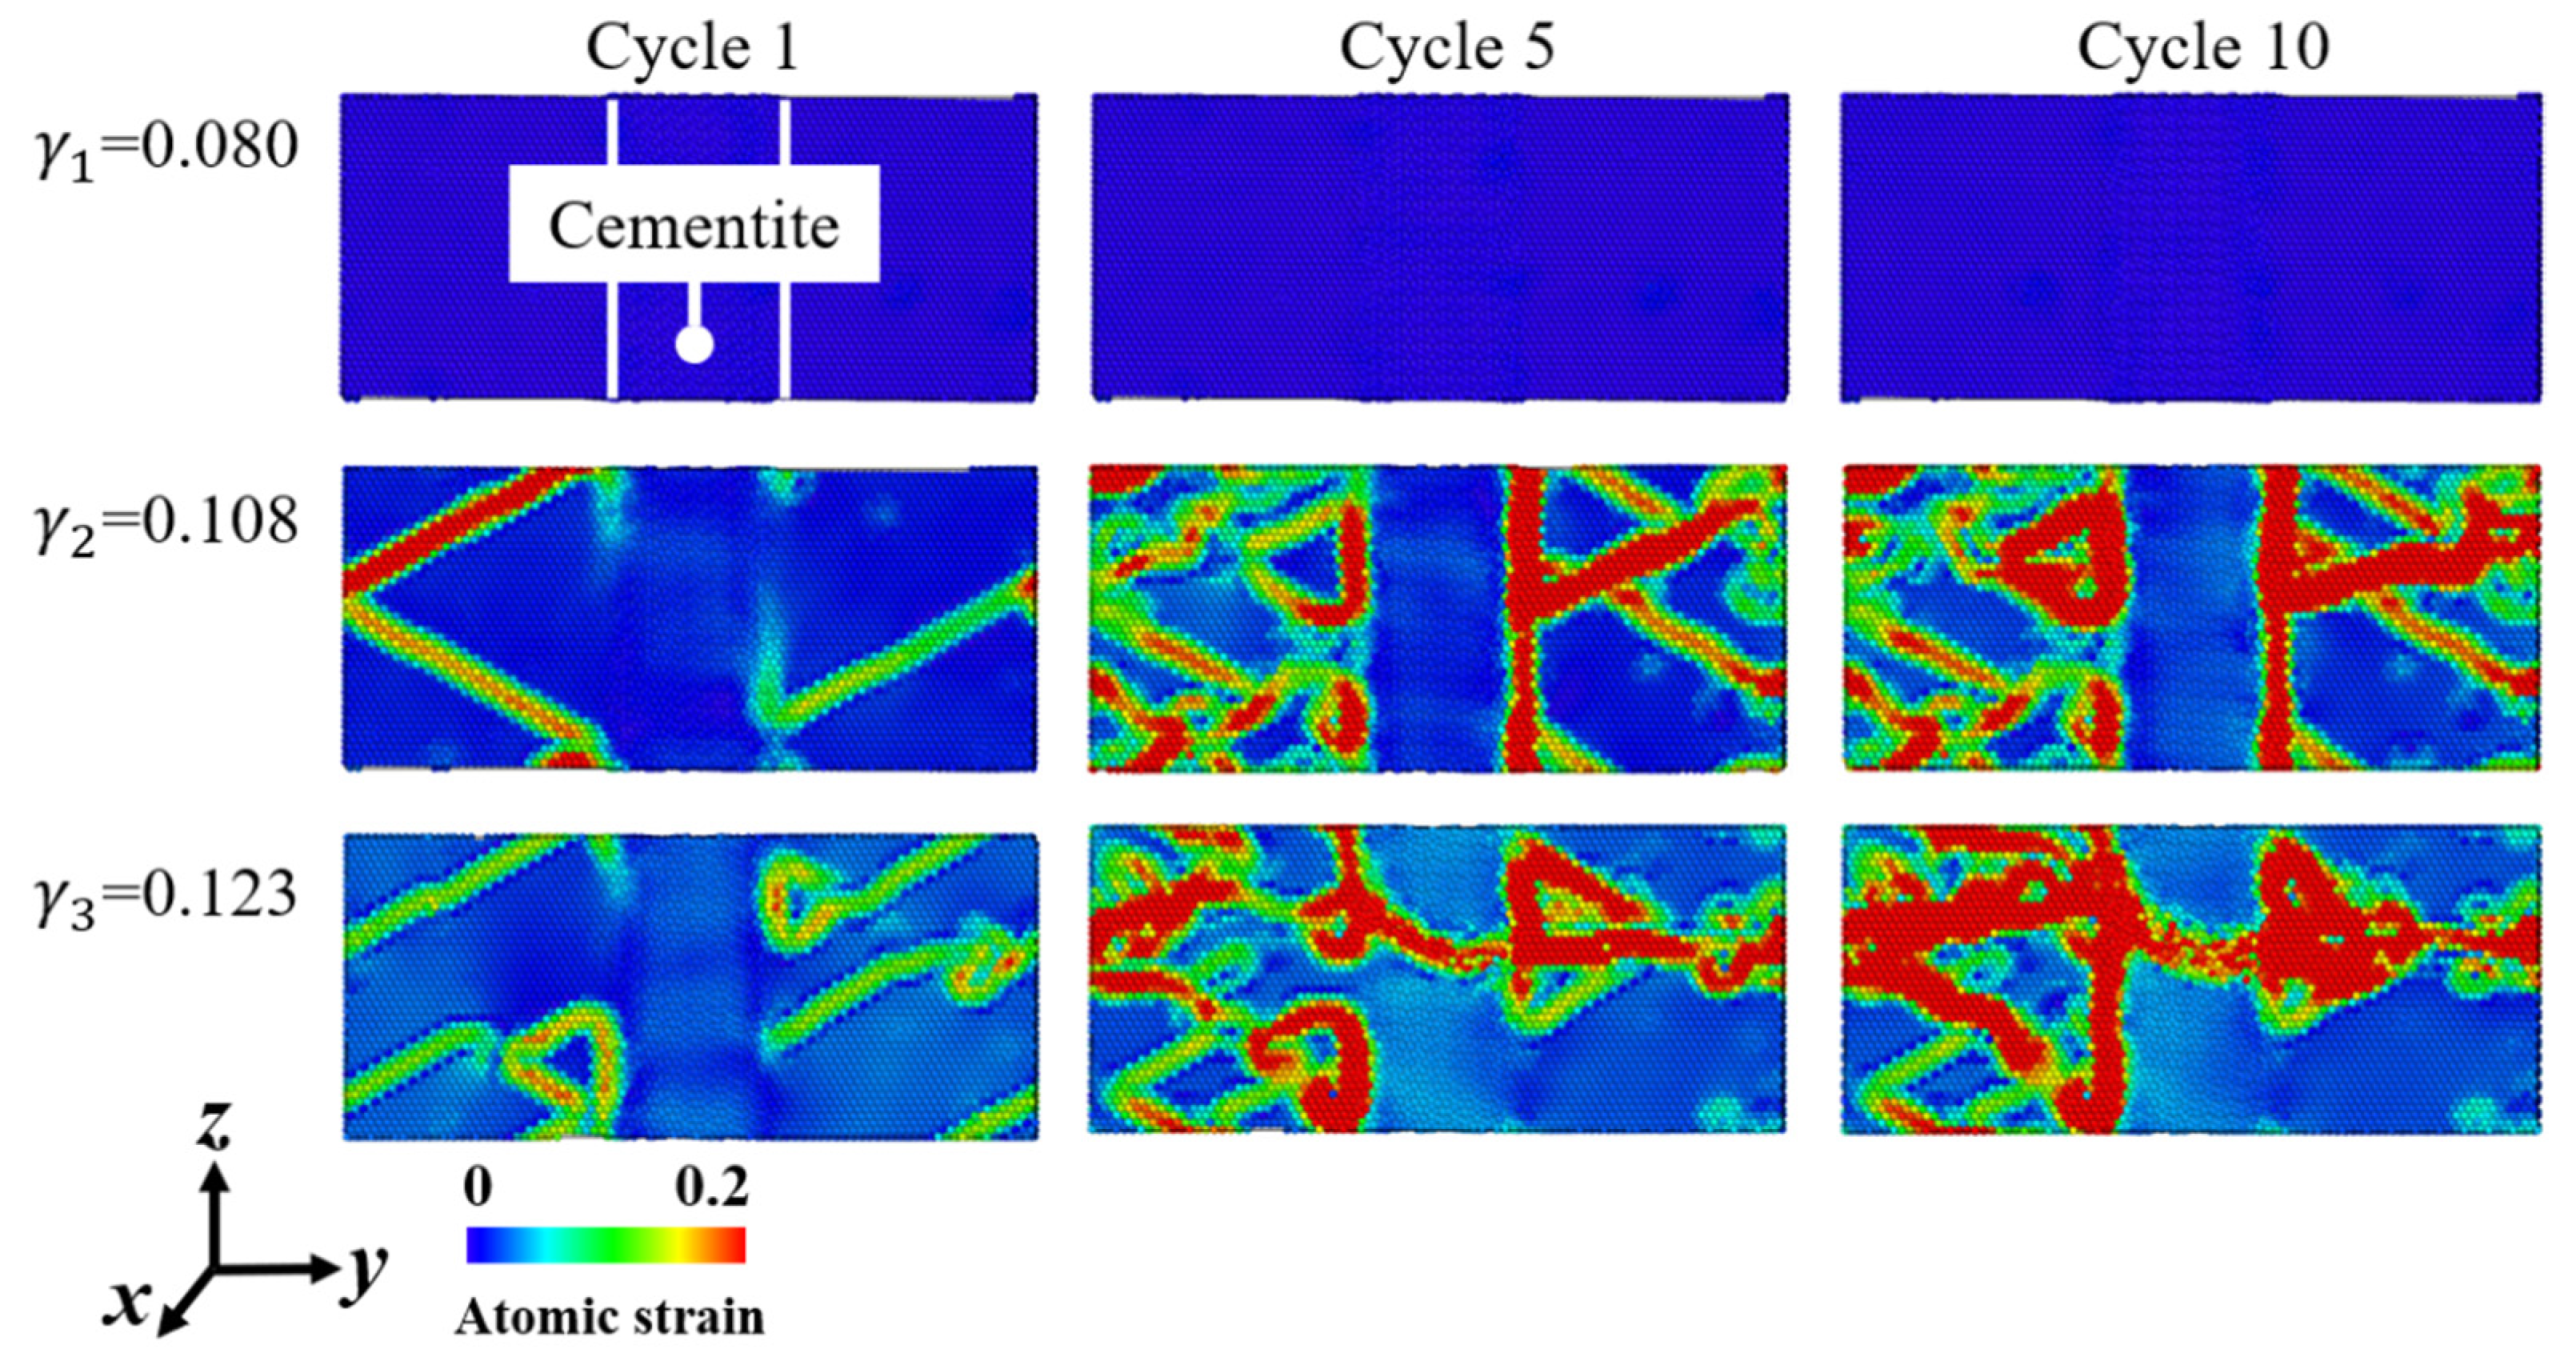
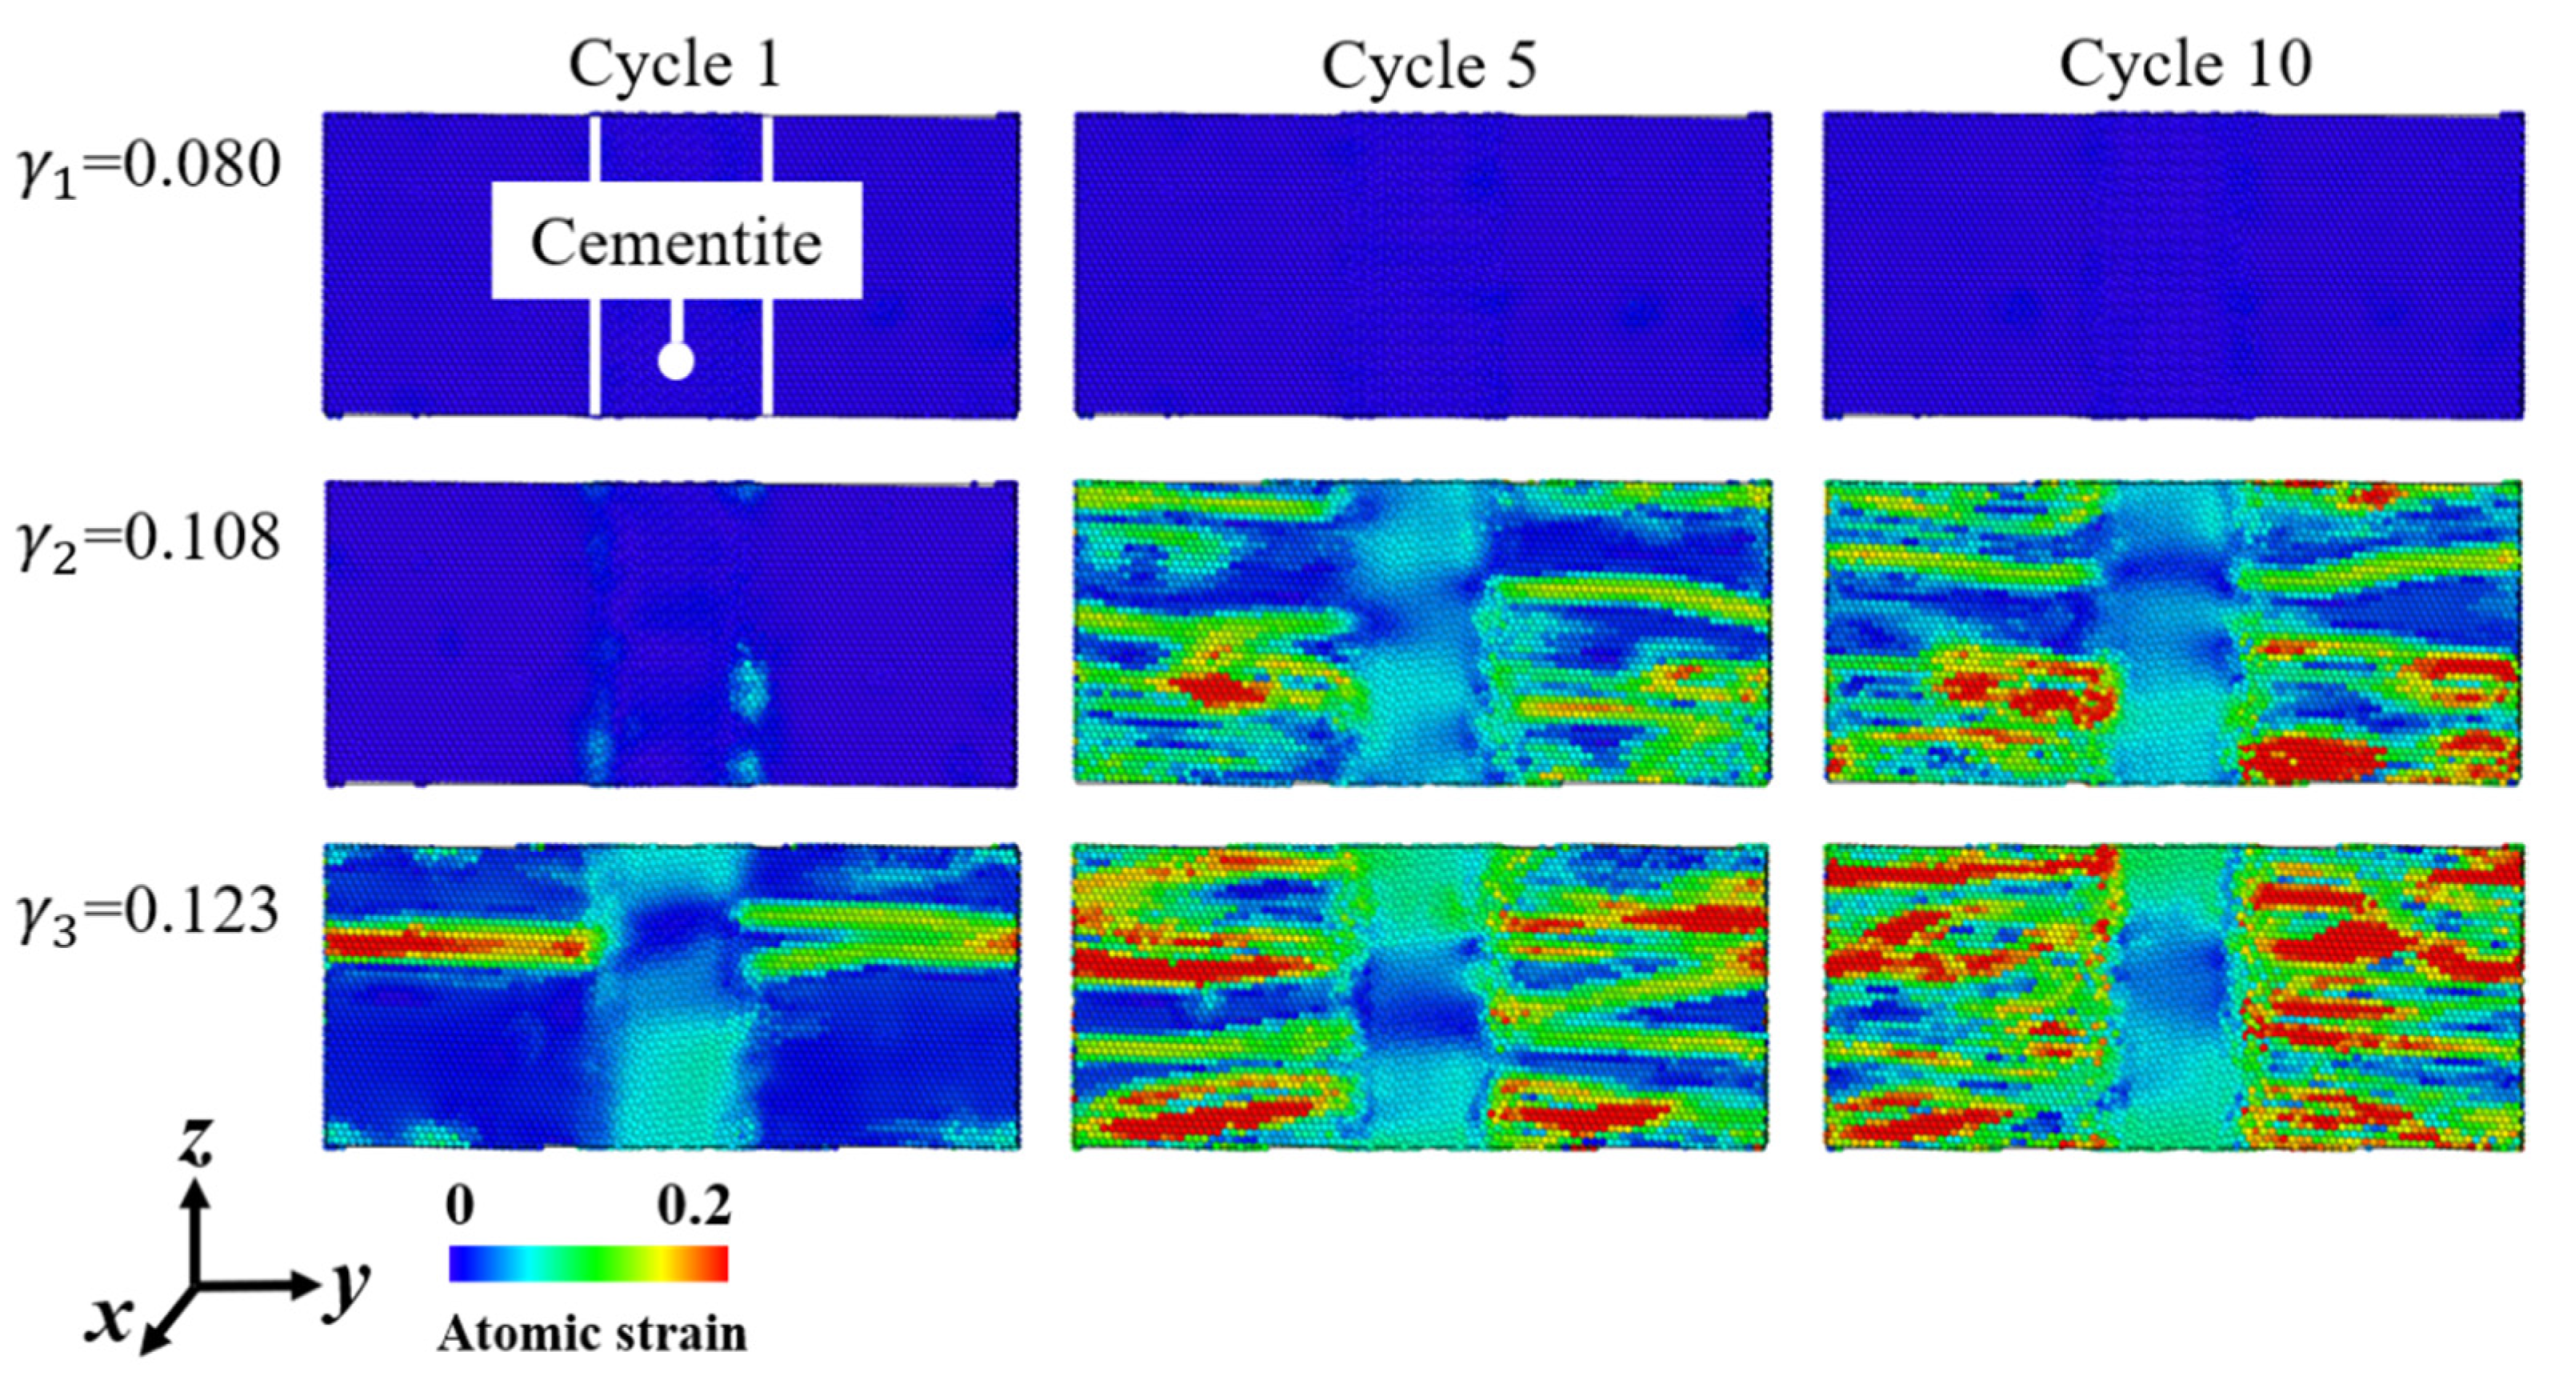
3.3. Evolution of High-Strain Atoms

To further understand the shear deformation mechanisms in detail, atomic shear strain analysis was performed following the approach of Shimizu et al. [55]. Highly strained atoms can represent the stress state of the atomic model and residual shear strain at the end of each cycle to some extent. Figure 12 shows the evolution of highly strained atoms in the model under different shear strain levels, and shear deformation is along the x-axis. The display range of atomic strain was chosen to be 0–0.2, because atoms with a shear strain larger than 0.2 are considered to be highly strained atoms. Obviously, when shear strain is small, such as equal to γ 1 , all atoms keep at a low shear strain level until the end of ten cycles. However, when shear strain is larger than or equal to γ 2 , highly strained atoms firstly appear in the slip bands in the bcc-Fe phase then come into being on the interface with cycle increasing. It is worth noting that when shear strain is large enough such as equal to γ 3 , these shear bands propagate into the cementite phase. In this case, a big shear band is formed across the two phases, which is very dangerous and may be the origin of microscopic cracks, and thus negatively affects the fatigue life of rolling bearings.
Figure 13 shows the evolution of highly strained atoms in the model under three shear strain levels, and shear deformation is along the y-axis. When the model is in the elastic stage, which means that shear strain is approximately lower than 0.118 (shown in Figure 5), unexpectedly, some high-strain atoms appear especially near the interface with shear strain and cycle increasing. It is worth noting that the stress–strain curve has a decreasing slope when the strain is near 0.1, which may be the main reason for the accumulation of stress in the model. The stage when shear strain is lower than 0.118 and larger than 0.1 is more precisely be called elastic—plastic transition zone. When shear strain goes up to γ 3 , no obvious shear band consisted of highly strained atoms exists in the model, which is very different from the results shown in Figure 13. The conclusion is that shear deformation direction has a significant influence on the evolution of high-strain atoms. The direction paralleled in the two-phase interface is more likely to induce residual strain in the model, and is beneficial to the accumulation of plastic in the model and shear slip of cementite, and thus it results in cumulative damage.

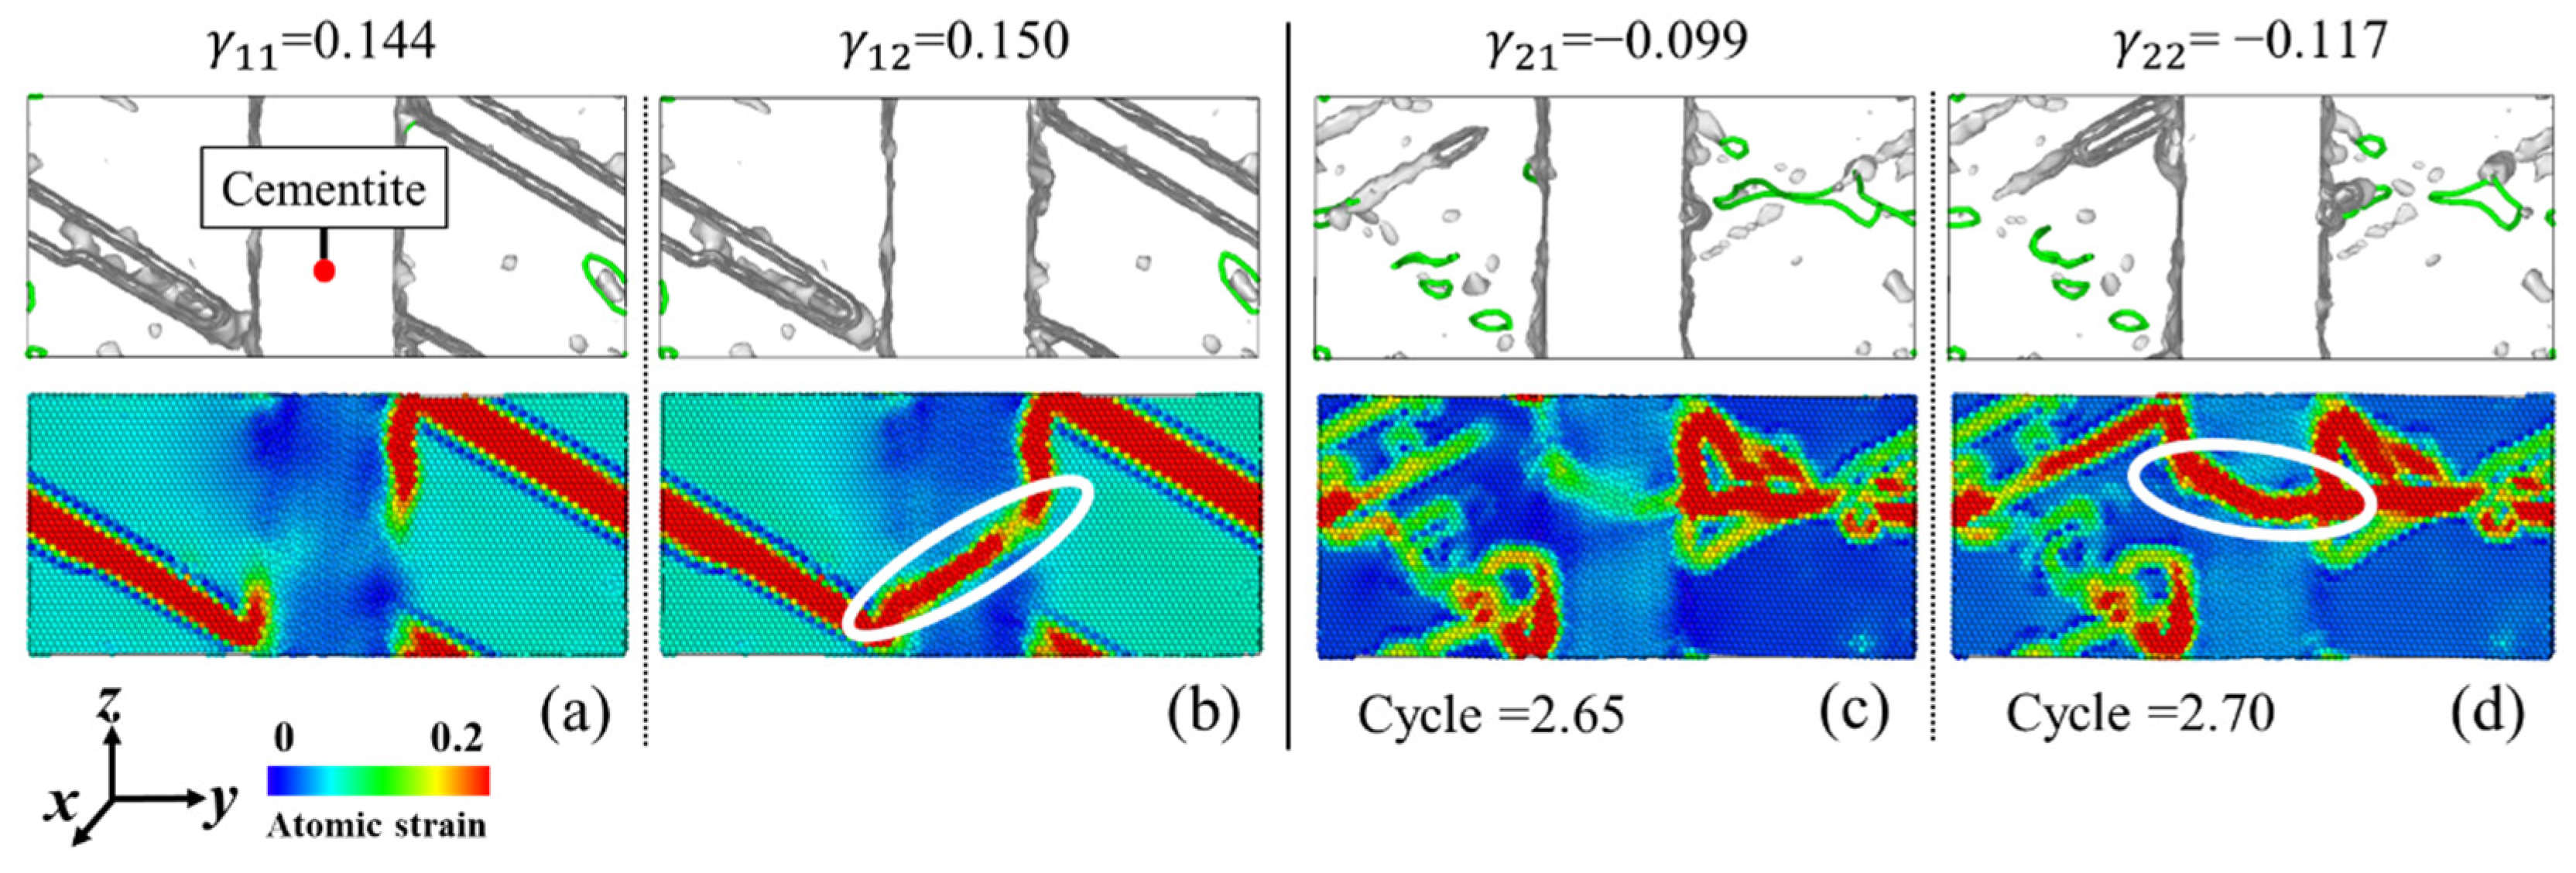
3.4. Shear Deformation of Cementite Phase and Damage Initiation

The present work has shown that although it is much harder for cementite to slip compared to a matrix in bearing steels, it still participates in shear deformation under severe shear deformation. Figure 12 has shown that a shear band exists in the cementite phase at the end of ten cycles of deformation. In this part, the start time and reason for the forming of a shear band are discussed. Figure 14 shows the shear deformation and start points of shear slip of the cementite phase under both monotonic and cyclic deformations. In Figure 14a,b, we can see that when shear strain is equal to 0.15, the first shear slip band appears. Nevertheless, when the model is under cyclic shear deformation, even in a lower shear strain level such as γ 3 (0.123), the shear slip band can still occur in the cementite phase, as shown in Figure 14c,d. Note that the negative shear strain value shown in Figure 14c,d is due to the opposite direction of shear deformation. The first shear band appears during the third cycle of cyclic shear deformation. After this, the shear band remains in the cementite phase in subsequent cycles. The results show that cyclic shear strain can accelerate the plastic accumulation of the atomic model and thus result in an earlier shear slip of the cementite phase. This can also explain why cyclic shear stress can speed up crack propagation to some extent. As the cycle goes on, more and more slip bands will appear on the subsurface in rolling bearings and result in microscopic damage initiation.
Plastic deformation results in dislocations initiating and growing from one interface to another until they are absorbed by the cementite phase. The absorbed dislocations may then result in a local shear deformation in the cementite phase [34]. Additionally, this is characterized by a shear slip band composed of high-strain atoms. The prerequisite for this phenomenon is that the shear zone in the bcc-Fe matrix is thick enough to penetrate the interface. It is known that the breaking of a brittle phase such as cementite works as a trigger of cleavage fracture initiation [56]. Under the joint induction of cyclic shear deformation and the inclusion defects within the subsurface, severe cyclic shear deformation will destroy the brittle phase, such as cementite inclusions in bearing steels, and thus initiate microscopic damage and impair the fatigue life of bearing.

4. Conclusions

The atomic simulations based on the two-phase model of bcc-Fe and cementite in this work characterize the micromechanism of plastic accumulation and damage initiation in bearing steels under cyclic shear deformation. The main conclusions can be summarized as follows:
  • The stress response of the atomic model is cyclic softening when the model is in the plastic stage, and shear deformation along x-axis is more likely to appear cyclic softening than that along the y-axis.
  • Dislocations nucleate and are annihilated on the interface when shear strain amplitude and cycle index are small. When the amplitude and index are large enough, regular structures of the material are destroyed, and dislocations and defect meshes are retained in the model, resulting in the gradual accumulation of plasticity.
  • Highly strained atoms appear in the bcc-Fe phase and cementite phase when shear strain amplitude and cycle index are large enough. The direction parallel to the two-phase interface is more likely to induce residual strain in the model, and is beneficial to the shear slip of the cementite phase, thus resulting in cumulative damage.
  • Cyclic shear deformation can accelerate the plastic accumulation of the atomic model and thus result in an earlier shear slip of the cementite phase than that under monotonic shear deformation. When the cementite phase is damaged under severe shear deformation, the material is usually in a dangerous state, which indicates the origin of microscopic damage near inclusion. Since cementite is brittle and difficult to deform, it can represent a series of brittle inclusions in bearing steels. Therefore, plastic accumulation and defect initiation are more likely to occur on the interface between inclusions and bearing steel matrix under cyclic shear deformation.

Author Contributions

Conceptualization, Y.S. and H.C.; methodology, Y.S.; software, Y.S.; validation, Y.S., X.W. and H.C.; writing—original draft preparation, Y.S.; writing—review and editing, Y.S. and H.C.; visualization, Y.S.; supervision, H.C. and X.W. All authors have read and agreed to the published version of the manuscript.

Funding

This work was financially supported by the National Science and Technology Major Project (j2019-IV-0004-0071) and the National Science Fund for Excellent Young Scholars under Grant 51922084.

Institutional Review Board Statement

Not applicable.

Informed Consent Statement

Not applicable.

Data Availability Statement

The data that support the findings of this study are available from the corresponding author upon reasonable request.

Acknowledgments

Many thanks to the HPC Platform of Xi’an Jiaotong University for the support of calculation.

Conflicts of Interest

The authors declare no conflict of interest.

References

  1. Breidenstein, B.; Denkena, B.; Krödel, A.; Prasanthan, V.; Poll, G.; Pape, F.; Coors, T. Production-Related Surface and Subsurface Properties and Fatigue Life of Hybrid Roller Bearing Components. Metals 2020, 10, 1339. [Google Scholar] [CrossRef]
  2. Fu, H.; Rivera-Díaz-del-Castillo, P. Evolution of White Etching Bands in 100Cr6 Bearing Steel under Rolling Contact-Fatigue. Metals 2019, 9, 491. [Google Scholar] [CrossRef] [Green Version]
  3. Rycerz, P.; Olver, A.; Kadiric, A. Propagation of surface initiated rolling contact fatigue cracks in bearing steel. Int. J. Fatigue 2017, 97, 29–38. [Google Scholar] [CrossRef] [Green Version]
  4. Darisuren, S.; Park, J.; Pyun, Y.; Amanov, A. A Study on the Improvement of the Fatigue Life of Bearings by Ultrasonic Nanocrystal Surface Modification Technology. Metals 2019, 9, 1114. [Google Scholar] [CrossRef] [Green Version]
  5. Lundberg, G.; Palmgren, A. Dynamic capacity of rolling bearings. J. Appl. Mech. Trans. ASME 1947, 196, 12. [Google Scholar] [CrossRef]
  6. Romanowicz, P. Numerical assessment of fatigue load capacity of cylindrical crane wheel using multiaxial high-cycle fatigue criteria. Arch. Appl. Mech. 2017, 87, 1707–1726. [Google Scholar] [CrossRef]
  7. Romanowicz, P.J.; Szybinski, B. Fatigue Life Assessment of Rolling Bearings Made from AISI 52100 Bearing Steel. Materials 2019, 12, 371. [Google Scholar] [CrossRef] [Green Version]
  8. Sadeghi, F.; Jalalahmadi, B.; Slack, T.S.; Raje, N.; Arakere, N.K. A Review of Rolling Contact Fatigue. J. Tribol. Trans. ASME 2009, 131, 220. [Google Scholar] [CrossRef]
  9. Ebert, F.J. Fundamentals of Design and Technology of Rolling Element Bearings. Chin. J. Aeronaut. 2010, 23, 123–136. [Google Scholar] [CrossRef] [Green Version]
  10. Warhadpande, A.; Sadeghi, F.; Evans, R.D. Microstructural Alterations in Bearing Steels under Rolling Contact Fatigue Part 1—Historical Overview. Tribol. Trans. 2013, 56, 349–358. [Google Scholar] [CrossRef]
  11. Bhadeshia, H.K.D.H. Steels for bearings. Prog. Mater. Sci. 2012, 57, 268–435. [Google Scholar] [CrossRef]
  12. Arakere, N.K. Gigacycle rolling contact fatigue of bearing steels: A review. Int. J. Fatigue 2016, 93, 238–249. [Google Scholar] [CrossRef]
  13. Harris, T.A.; Kotzalas, M.N. Advanced Concepts of Bearing Technology: Rolling Bearing Analysis, 5th ed.; CRC Press: Boca Raton, FL, USA, 2006. [Google Scholar]
  14. Shanyavskiy, A.A. Mechanisms and modeling of subsurface fatigue cracking in metals. Eng. Fract. Mech. 2013, 110, 350–363. [Google Scholar] [CrossRef]
  15. Dey, R.; Tarafder, S.; Sivaprasad, S. Influence of proportional and non-proportional loading on deformation behaviour of austenitic stainless steel-macro and micro analysis. Theor. Appl. Fract. Mech. 2019, 100, 342–353. [Google Scholar] [CrossRef]
  16. Kachit, M.; Courbon, J.; Boulnat, X.; Adrien, J.; Verdu, C. Non-symmetrical fatigue life of nodular graphite cast iron under non-proportional multi-axial cyclic loading. Int. J. Fatigue 2019, 125, 128–137. [Google Scholar] [CrossRef]
  17. Romanowicz, P.J.; Smolarski, D.; Kozien, M.S. Using the Effect of Compression Stress in Fatigue Analysis of the Roller Bearing for Bimodal Stress Histories. Materials 2021, 15, 196. [Google Scholar] [CrossRef]
  18. Akama, M. Fatigue Crack Growth under Non-Proportional Mixed Mode Loading in Rail and Wheel Steel Part 1: Sequential Mode I and Mode II Loading. Appl. Sci. 2019, 9, 2006. [Google Scholar] [CrossRef] [Green Version]
  19. Akama, M.; Kiuchi, A. Fatigue Crack Growth under Non-Proportional Mixed Mode Loading in Rail and Wheel Steel Part 2: Sequential Mode I and Mode III Loading. Appl. Sci. 2019, 9, 2866. [Google Scholar] [CrossRef] [Green Version]
  20. Chen, Q.; Shao, E.; Zhao, D.; Guo, J.; Fan, Z. Measurement of the critical size of inclusions initiating contact fatigue cracks and its application in bearing steel. Wear 1991, 147, 285–294. [Google Scholar] [CrossRef]
  21. Xia, Z.; Kujawski, D.; Ellyin, F. Effect of mean stress and ratcheting strain on fatigue life of steel. Int. J. Fatigue 2015, 18, 335–341. [Google Scholar] [CrossRef]
  22. Pandkar, A.S.; Arakere, N.; Subhash, G. Ratcheting-based microstructure-sensitive modeling of the cyclic hardening response of case-hardened bearing steels subject to Rolling Contact Fatigue. Int. J. Fatigue 2015, 73, 119–131. [Google Scholar] [CrossRef]
  23. Arakere, N.K.; Subhash, G. Work hardening response of M50-NiL case hardened bearing steel during shakedown in rolling contact fatigue. Mater. Sci. Technol. 2012, 28, 34–38. [Google Scholar] [CrossRef]
  24. Trojahn, W.; Valentin, P. Bearing steel quality and bearing performance. Mater. Sci. Technol. 2013, 28, 55–57. [Google Scholar] [CrossRef]
  25. Šmeļova, V.; Schwedt, A.; Wang, L.; Holweger, W.; Mayer, J. Electron microscopy investigations of microstructural alterations due to classical Rolling Contact Fatigue (RCF) in martensitic AISI 52100 bearing steel. Int. J. Fatigue 2017, 98, 142–154. [Google Scholar] [CrossRef]
  26. Chakraborty, J.; Bhattacharjee, D.; Manna, I. Development of ultrafine bainite + martensite duplex microstructure in SAE 52100 bearing steel by prior cold deformation. Scr. Mater. 2009, 61, 604–607. [Google Scholar] [CrossRef]
  27. Lobodyuk, V.A.; Meshkov, Y.; Pereloma, E.V. On Tetragonality of the Martensite Crystal Lattice in Steels. Metall. Mater. Trans. A 2018, 50, 97–103. [Google Scholar] [CrossRef] [Green Version]
  28. Decaudin, B.; Djega-Mariadassou, C.; Cizeron, G. Structural study of M50 steel carbides. J. Alloy. Compd. 1995, 226, 208–212. [Google Scholar] [CrossRef]
  29. Lian, J.; Zheng, L.; Wang, F.; Zhang, H. Evolution of carbides on surface of carburized M50NiL bearing steel. J. Iron Steel Res. Int. 2018, 25, 1198–1211. [Google Scholar] [CrossRef]
  30. Wang, K.; Jing, H.; Xu, L.; Han, Y.; Zhao, L.; Hu, W.; Deng, H. Carbide effects on tensile deformation behavior of [001] symmetric tilt grain boundaries in bcc Fe. Model. Simul. Mater. Sci. Eng. 2020, 28, 035006. [Google Scholar] [CrossRef]
  31. Liang, L.; Wang, Y.; Chen, Y.; Wang, H.; Dai, L. Dislocation nucleation and evolution at the ferrite-cementite interface under cyclic loadings. Acta Mater. 2020, 186, 267–277. [Google Scholar] [CrossRef]
  32. Luu, H.T.; Gunkelmann, N. Pressure-induced phase transformations in Fe-C: Molecular dynamics approach. Comput. Mater. Sci. 2019, 162, 295–303. [Google Scholar] [CrossRef]
  33. Ghaffarian, H.; Karimi Taheri, A.; Ryu, S.; Kang, K. Nanoindentation study of cementite size and temperature effects in nanocomposite pearlite: A molecular dynamics simulation. Curr. Appl. Phys. 2016, 16, 1015–1025. [Google Scholar] [CrossRef] [Green Version]
  34. Ghaffarian, H.; Taheri, A.K.; Kang, K.; Ryu, S. Molecular Dynamics Simulation Study on the Effect of the Loading Direction on the Deformation Mechanism of Pearlite. Multiscale Sci. Eng. 2019, 1, 47–55. [Google Scholar] [CrossRef] [Green Version]
  35. Guziewski, M.; Coleman, S.P.; Weinberger, C.R. Atomistic investigation into the mechanical properties of the ferrite-cementite interface: The Bagaryatskii orientation. Acta Mater. 2017, 144, 656–665. [Google Scholar] [CrossRef]
  36. Pandkar, A.S.; Arakere, N.; Subhash, G. Microstructure-sensitive accumulation of plastic strain due to ratcheting in bearing steels subject to Rolling Contact Fatigue. Int. J. Fatigue 2014, 63, 191–202. [Google Scholar] [CrossRef]
  37. Sackfield, A.; Hills, D.A. Some useful results in the classical Hertz contact problem. J. Strain Anal. Eng. Des. 1983, 18, 101–105. [Google Scholar] [CrossRef]
  38. Radzimovsky, E.I. Stress distribution and strength condition of two rolling cylinders pressed together. Univ. Ill. Bull. 1953, 50, 1–40. [Google Scholar]
  39. Moghaddam, S.M.; Sadeghi, F.; Paulson, K.; Weinzapfel, N.; Correns, M.; Bakolas, V.; Dinkel, M. Effect of non-metallic inclusions on butterfly wing initiation, crack formation, and spall geometry in bearing steels. Int. J. Fatigue 2015, 80, 203–215. [Google Scholar] [CrossRef]
  40. Plimpton, S. Fast Parallel Algorithms for Short-Range Molecular Dynamics. J. Comput. Phys. 1995, 117, 1–19. [Google Scholar] [CrossRef] [Green Version]
  41. Kim, J.; Kang, K.; Ryu, S. Characterization of the misfit dislocations at the ferrite/cementite interface in pearlitic steel: An atomistic simulation study. Int. J. Plast. 2016, 83, 302–312. [Google Scholar] [CrossRef]
  42. Bhadeshia, H. Solution to the Bagaryatskii and Isaichev ferrite–cementite orientation relationship problem. Mater. Sci. Technol. 2018, 34, 1666–1668. [Google Scholar] [CrossRef] [Green Version]
  43. Liyanage, L.S.I.; Kim, S.G.; Houze, J.; Kim, S.; Tschopp, M.A.; Baskes, M.I.; Horstemeyer, M.F. Structural, elastic, and thermal properties of cementite (Fe3C) calculated using a modified embedded atom method. Phys. Rev. B 2014, 89, 094102. [Google Scholar] [CrossRef] [Green Version]
  44. Nosé, S. A molecular dynamics method for simulations in the canonical ensemble. Mol. Phys. 1984, 52, 255–268. [Google Scholar] [CrossRef]
  45. Hoover, W.G. Canonical dynamics: Equilibrium phase-space distributions. Phys. Rev. A 1985, 31, 1695. [Google Scholar] [CrossRef] [PubMed] [Green Version]
  46. Heyes, D.M. Pressure tensor of partial-charge and point-dipole lattices with bulk and surface geometries. Phys. Rev. B Condens Matter 1994, 49, 755. [Google Scholar] [CrossRef]
  47. Stukowski, A. Visualization and analysis of atomistic simulation data with OVITO–the Open Visualization Tool. Model. Simul. Mater. Sci. Eng. 2010, 18, 2154–2162. [Google Scholar] [CrossRef]
  48. Stukowski, A.; Bulatov, V.V.; Arsenlis, A. Automated identification and indexing of dislocations in crystal interfaces. Model. Simul. Mater. Sci. Eng. 2012, 20, 085007. [Google Scholar] [CrossRef]
  49. Yuan, X.; Yu, W.; Fu, S.C.; Yu, D.; Chen, X. Effect of mean stress and ratcheting strain on the low cycle fatigue behavior of a wrought 316LN stainless steel. Mater. Sci. Eng. A 2016, 677, 193–202. [Google Scholar] [CrossRef]
  50. Kang, G.; Dong, Y.; Liu, Y.; Wang, H.; Cheng, X. Uniaxial ratchetting of 20 carbon steel: Macroscopic and microscopic experimental observations. Mater. Sci. Eng. A 2011, 528, 5610–5620. [Google Scholar] [CrossRef]
  51. Matthews, J.W.; Blakeslee, A.E. Defects in Epitaxial Multilayers. I. Misfit Dislocations. J. Cryst. Growth 1974, 27, 118–125. [Google Scholar] [CrossRef]
  52. Stukowski, A.; Albe, K. Extracting dislocations and non-dislocation crystal defects from atomistic simulation data. Model. Simul. Mater. Sci. Eng. 2010, 119, 2131–2145. [Google Scholar] [CrossRef]
  53. Zhang, Y.; Jiang, S.; Zhu, X.; Zhao, Y. Mechanisms of crack propagation in nanoscale single crystal, bicrystal and tricrystal nickels based on molecular dynamics simulation. Results Phys. 2017, 7, 1722–1733. [Google Scholar] [CrossRef]
  54. Liang, L.; Xiang, L.; Wang, Y.; Chen, Y.; Wang, H.; Dai, L. Ratchetting in cold-drawn pearlitic steel wires. Metall. Mater. Trans. A 2019, 50, 4561–4568. [Google Scholar] [CrossRef]
  55. Shimizu, F.; Ogata, S.; Li, J. Theory of Shear Banding in Metallic Glasses and Molecular Dynamics Calculations. Mater. Trans. 2007, 48, 2923–2927. [Google Scholar] [CrossRef] [Green Version]
  56. Shibanuma, K.; Aihara, S.; Ohtsuka, S. Observation and Quantification of Crack Nucleation in Ferrite-Cementite Steel. ISIJ Int. 2013, 99, 582–591. [Google Scholar] [CrossRef] [Green Version]
Figure 1. Research framework of this paper. FEM, Finite element method. MD, Molecular dynamics.
Machines 10 00199 g001
Figure 2. Shear stress distribution in the contact area between roller and raceway. (a) Two-dimensional model of roller and raceway. (b) Nephogram of shear stress distribution in the contact area. (c) Maximum orthogonal shear stress and maximum shear stress on the subsurface under contact load.
Machines 10 00199 g002
Figure 3. Shear stress on the subsurface under rolling contact load. (a) Dynamic Hertz contact load setting. (b) FEM model and the location of point P1. (c) Change curve of shear stress at Point P1.
Machines 10 00199 g003
Figure 4. Atomic model of bcc-Fe and cementite, in which f and c represent bcc-Fe and cementite, respectively. Red and blue atoms represent ferrum and carbon atoms, respectively.
Machines 10 00199 g004
Figure 5. Mechanical properties and loading conditions of the atomic model. (a) Shear stress–strain curves under monotonic shear strain. Open symbols indicate the designed cyclic shear strain levels. (b) Shear strain–time curves for cyclic deformation with different periods and strain amplitudes. Periods are 160 ps ( γ 1 ), 216 ps ( γ 2 ) and 246 ps ( γ 3 ).
Machines 10 00199 g005
Figure 6. Shear stress-cycle responses under different loading conditions. Applied shear strain of (a,d) γ 1 , (b,e) γ 2 and (c,f) γ 3 . Loading directions are along (ac) the x-axis and (df) the y-axis, respectively. Red and blue dash lines represent the trends of maximum and minimum stress amplitudes, respectively.
Machines 10 00199 g006
Figure 7. Dislocation distribution in the model under monotonic shear deformation. Shear directions are along (a) the x-axis and (b) the y-axis, respectively. The initial structure is provided for comparison in (c). Green lines in bcc-Fe matrix correspond to 1/2<111> dislocations. Gray planes in bcc-Fe matrix are defect meshes.
Machines 10 00199 g007
Figure 8. Dislocation distribution in the model under cyclic shear deformation along the x-axis. Applied shear strain of γ 1 , γ 2 and γ 3 . Only dislocation distribution at the end of the cycle (1, 5, 10) is shown.
Machines 10 00199 g008
Figure 9. Dislocation distribution in the model under cyclic shear deformation along the y-axis. Features are the same as in Figure 8.
Machines 10 00199 g009
Figure 10. Nucleation and annihilation process of a 1/2<111> dislocation on the interface when γ 2 is applied along the y-axis. The whole process is contained in the first cycle.
Machines 10 00199 g010
Figure 11. Nucleation and grow process of a 1/2<111> dislocation on the interface when γ 2 is applied along the y-axis. The whole process is contained in the second cycle. A dislocation loop exists in the red dotted box.
Machines 10 00199 g011
Figure 12. Evolution of high-strain atoms in the model under different shear strain levels when shear deformation is along x-axis. Display range of atomic strain is 0–0.2.
Machines 10 00199 g012
Figure 13. Evolution of high-strain atoms in the model under different shear strain levels when shear deformation is along y-axis.
Machines 10 00199 g013
Figure 14. Shear deformation and shear slip threshold of cementite phase. (a,b) is under monotonic shear deformation; (c,d) is under cyclic shear deformation. Loading directions are both along the x-axis.
Machines 10 00199 g014
Publisher’s Note: MDPI stays neutral with regard to jurisdictional claims in published maps and institutional affiliations.

