Abstract
An energy management control strategy based on the instantaneous optimization method of equivalent consumption minimization strategy (ECMS) under motor power compensation for mild hybrid vehicles is proposed in this study to improve fuel economy and ensure the dynamic performance of cars. A mild hybrid platform is built, and the future supplementary model of electric energy and the future consumption model of electric energy are established according to different power flow directions. It determines the equivalent fuel consumption rate of powertrain as the objective function by defining the equivalent factor and corresponding derivation, carries out optimization calculation, and obtains the energy distribution relationship between the engine and the motor. The motor power compensation strategy based on the control strategy is adopted to solve the effect of turbocharged engines’ transient response on vehicle dynamics and fuel economy. The actual results showed that vehicle power and fuel economy can be improved under the control strategy and compensation strategy design. Meanwhile, different motors allow the compensating coefficient to have different power-boosting and fuel economy effects.
1. Introduction
The automotive industry has developed considerably since the world’s first car was produced in the 1980s, and it has completely changed travel in human society. Cars will continue to be an important travel tool for human beings in the future [1]. However, problems of resource shortage and environmental pollution have intensified with the continuous growth in car ownership. The development of new energy vehicles is an important means to address the contradiction among economic development, resource shortage, and environmental protection under the worsening situation and pressures [2,3,4,5]. The three main types of new energy vehicles are battery electric (BEV), hybrid electric (HEV), and fuel cell (FCV) vehicles [6]. Among them, hybrid electric vehicles are currently the most suitable for development and promotion. Compared with other forms of hybrid electric vehicles, mild hybrid vehicles are characterized by a simple system structure, minimal modification to the vehicle chassis, low cost, short production cycle, and convenient mass production. The energy management strategy of the power system is difficult to investigate because the quality of the management strategy determines the overall performance of the vehicle. Management strategies aim to control the energy flow between different power sources of the powertrain according to the power demand of the vehicle to reduce energy consumption and emission pollution [7,8,9,10,11,12].
Energy management can be divided into rule- and optimization-based strategies according to control logic [13]. Rule-based management strategies are commonly used to collect information, such as driving speed, power requirement of the vehicle, and battery power, during the driving process. A set-rule threshold logic table is available for data, such as power battery state, which can be subdivided into two categories: deterministic and fuzzy rules [14,15,16,17]. Piyush B et al. [18] proposed a switching and prediction-based power management strategy for fuel cell hybrid buses. Operation data were obtained through Simulink simulation and real vehicle tests. The experimental comparison of management strategies showed that the latter presents excellent advantages for the significant improvement of the average efficiency of the fuel cell system while reducing hydrogen consumption. Kim M et al. [19] put forward a new management technique based on thermostat strategy called hybrid thermostat strategy for series hybrid electric vehicles and combined it with the power follower strategy using AMESim and Simulink co-simulation and optimization to improve efficiency.
Optimization-based management strategies can be further subdivided into global and real-time optimization. This type of management strategy can effectively solve the problem of poor performance among rule-based management strategies. The nonlinear optimization problem is constrained to achieve optimal performance under different vehicle driving conditions [20,21,22,23]. M.S.Teja [24] used a particle swarm optimization algorithm to optimize fuel consumption, power output, and energy flow of HEVs. The policy comparison proved that this method can rapidly complete the design and reduce fuel consumption and vehicle emissions. Scholars, such as Satoshi [25], investigated an effective energy management system, optimized the operating area of the internal combustion engine, and proposed a torque control strategy for charging the battery of a parallel hybrid electric vehicle (HEV) to reduce the amount of CO2 and NOx emissions sufficiently [26].
The fuel economy advantage of mild hybrid systems in existing studies on energy management control strategies requires optimization. Therefore, an energy management control strategy for a mild hybrid system considering motor power compensation is proposed in this study to improve the fuel economy of traditional turbocharged engine-powered vehicles.
2. Establishment of a Mild Hybrid System Platform
The simulation of a vehicle power system can be divided into forward and backward simulations according to the relative direction of variable signal transmission and energy flow. If the direction of both variable signal transmission and energy flow is the same, then the simulation is considered forward; however, if their direction is in reverse, then the simulation is considered backward [27].
The basic structure of the forward simulation analysis platform is shown in Figure 1 [28]. The forward simulation analysis platform adopts a closed-loop control system, in which the driver model receives the target and actual vehicle speeds and controls the pedal position through a corresponding algorithm. The control system model completes the engine and the motor according to the received signal and the specified control strategy. The output torque is transmitted to the tire model through the vehicle powertrain model to control the entire vehicle model. The internal logic of the simulation method is close to the real vehicle to ensure that dynamic characteristics of the whole vehicle are demonstrated realistically.
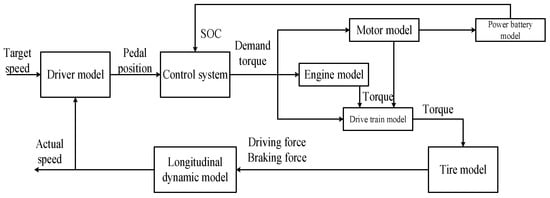
Figure 1.
Basic structure of forward simulation analysis platform.
3. Research on Energy Management Control Strategy
3.1. Instantaneous Optimization Method Based on Equivalent Consumption Minimization Strategy
3.1.1. Equivalent Fuel Consumption Rate Model
The equivalent fuel consumption rate model is divided into an “electric energy future supplement model” and an “electric energy future consumption model” according to the charge and discharge state of the power battery pack.
The motor is in drive mode, the power battery pack is in a discharged state and consumes electric energy, and the current consumed power will be supplemented by the engine fuel consumption at some time in the future when the mild hybrid system requires the motor to provide power assistance. The fuel consumption rate framework is called the “Future Energy Supplement Model”, as shown in Figure 2.
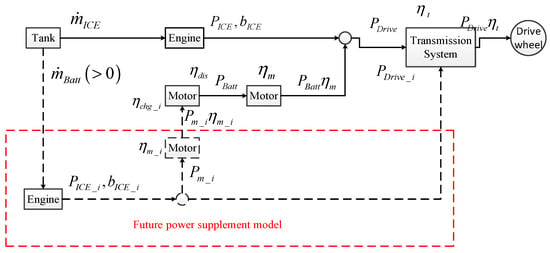
Figure 2.
Future power supplement model.
Assuming that the power consumption at this time will be supplemented in the next N charging cycles, the equivalent fuel consumption rate of the current power battery pack is expressed as follows:
where is the actual fuel consumption rate that the engine consumes for the power battery pack in the “I” cycle in the future.
The total fuel consumption rate of the power system at the current moment is expressed as follows:
where is the current engine power output, is the sum of the engine output and motor input power values required at the current time, is the operating efficiency of the motor, is the actual effective fuel consumption rate of the engine in the “I” cycle in the future, is the charging efficiency of the battery pack, and is the recorded discharge efficiency of the battery pack in the ith cycle in the future.
The power battery pack is in the state of charge and stores electric energy when the mild hybrid system requires the motor to absorb power and generate electricity. The currently stored electric energy will drive the vehicle instead of the engine fuel consumption at some time in the future. The equivalent fuel consumption rate model at this time is called the “electric energy future consumption model”, as shown in Figure 3.
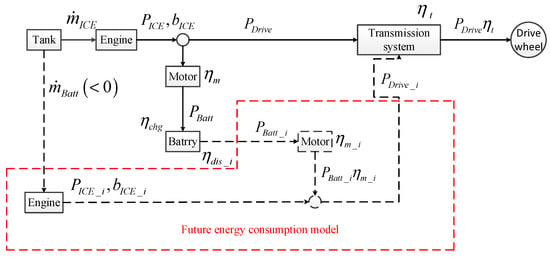
Figure 3.
Electric energy future consumption model.
Assuming that the power replenishment at this time will be consumed in the next N discharge cycles, the equivalent fuel consumption rate of the current power battery pack is expressed as follows:
The total fuel consumption rate of the power system at the current moment is expressed as follows:
3.1.2. Equivalent Factor Definition and Selection
The instantaneous optimization method based on ECMS is to convert the electric energy charged and discharged by the current power battery pack into fuel consumption at present or at a certain moment in the future. The mathematical model of the equivalent fuel consumption rate of the power battery pack needs to be simplified accordingly for practical application. The equivalent fuel consumption rate of the battery pack can be rewritten as follows:
where and include all the estimated values in the process of deriving the equivalent fuel consumption rate of the battery pack and defined as the equivalent factor; hence, this value varies under different driving conditions. The equivalent factor is expressed as follows [29]:
The selection of the equivalent factor is determined by estimating the driving demand of the car in a certain period of time in the future, and the driving condition exerts a strong influence on it. Hence, the equivalent factor should be selected according to the specific driving conditions. The selected equivalent factors are listed in Table 1.

Table 1.
Equivalent factor selection under different working conditions.
3.1.3. SOC Compensation Strategy
The energy management control strategy should maintain the power battery pack’s state of charge (SOC) within a reasonable range. However, the ECMS instantaneous optimization method is unable to control the power battery pack’s SOC. Therefore, an SOC compensation strategy must be designed to adjust the power battery pack on the basis of the remaining power. Depending on the remaining power in the power battery pack, the charge and discharge power is adjusted to avoid overcharging or over-discharging the power battery pack.
The SOC compensation strategy is applied to the penalty function method in this study. Moreover, a weight coefficient for the equivalent fuel consumption rate of power battery pack is set. The total equivalent fuel consumption rate of the power system is then expressed as follows:
The penalty function adjusts the power consumption of the power battery pack. When the battery pack’s SOC is equal to the target value , ,there is no need to perform SOC compensation. When the battery pack SOC is higher than the target value ,, which reduces the equivalent amount of battery power, the control strategy tends to reduce the actual engine fuel consumption, increasing the amount of electricity used by the battery pack. When the battery pack’s SOC is lower than the target value , , which increases the equivalent amount of battery power, the control strategy tends to improve the actual engine fuel consumption reduces the amount of battery power used.
The penalty function uses the proportional link polynomial penalty function to define the SOC deviation as follows:
and represent the lower and upper limits of the SOC of the power battery pack, respectively. Thus, the adjustment range of the SOC is expressed as follows:
The penalty function is calculated as follows:
where is the proportional coefficient of the penalty function and is the order coefficient of the penalty function and a non-negative integer. Various values of and are used to obtain the penalty function curves of different shapes, as shown in Figure 4. The proportional and order coefficients of the penalty function used in this study are set to and , respectively.
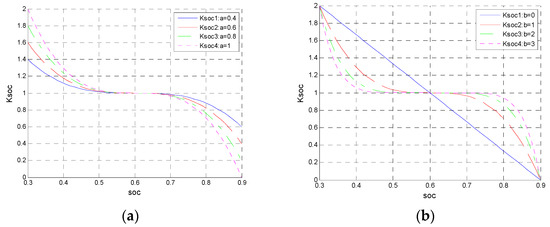
Figure 4.
(a) The influence of the proportional coefficient on the penalty function; (b) the influence of order coefficient on the penalty function.
3.1.4. Regenerative Braking Correction
The motor stores the recovered braking energy in the form of electrical energy in the power battery pack when the mild hybrid system is in the regenerative braking mode of operation. A part of the power stored in the battery power consumed is stored again in the battery pack by regenerative braking when the power system requires the motor to provide auxiliary power in the future, that is, when the motor is in the drive mode. Although this part of the electric energy belongs to the “future supplement”, it does not actually consume fuel and lead to a lower amount of fuel consumed in the future supplementary electric energy than the estimated value [30,31].
The effects of regenerative braking energy recovery under the discharge condition of the battery pack and the equivalent fuel consumption rate must be considered to adopt the energy management control strategy under the driving conditions of mild hybrid vehicles and optimize its fuel economy advantages. The mathematical model is revised. Regenerative braking is difficult to estimate because it occurs at some point in the future. Hence, the regenerative braking compensation algorithm is used to estimate the regenerative braking power that will occur in the future on the basis of the regenerative braking power that has occurred over a period of time.
The average regenerative braking power in N control cycles that have previously occurred is expressed as follows:
where is the regenerative braking power of the “I” cycle of the N control cycles that have previously occurred. The average regenerative braking power is used to correct the equivalent fuel consumption rate of the battery pack under discharge conditions.
Similar to the equivalent factor, the selection of the average regenerative braking power is also determined by estimating the driving demand of the car at a certain time in the future, and the driving condition exerts a strong influence on it. Therefore, it should be selected according to specific driving conditions.
The vehicle speed is low, the braking force required for deceleration braking is small, and the absolute value of is small when the vehicle is under congested conditions. The speed of the vehicle is higher than the congested condition, the braking force required for deceleration braking also improves, the deceleration braking frequency in this condition is higher, and the absolute value of increases when the vehicle is under neutral conditions. The deceleration braking frequency is low and the absolute value of is small although the vehicle speed is high when the vehicle is running under smooth conditions. As shown in Table 2, the average regenerative braking power is selected according to this principle.

Table 2.
Average regenerative braking power value under different road conditions.
3.1.5. Objective Function and Constraint Determination
The objective function of the ECMS-based instantaneous optimization method is expressed as follows:
Constraints combined with the characteristics of components, such as engine, motor, and power battery pack are determined as follows:
where is the engine operating speed, is the engine idle speed, is the maximum engine speed, is the output torque of the engine, is the maximum output torque at the current engine speed, is the motor speed, is the maximum motor speed, is the motor output torque, is the maximum output torque at the current motor speed, is the battery pack output power, is the minimum output power of the battery pack, and is the maximum output power of the battery pack.
Finally, the energy management control strategy map is illustrated, as shown in Figure 5.

Figure 5.
Energy management control strategy map.
3.2. Simulation Comparison Analysis
The two standardized cycle test conditions of NEDC and WLTP are used (Figure 6). The NEDC cycle consists of urban and suburban working conditions, including four urban low-speed and one suburban high-speed working condition. The WLTP cycle uses a Class 3 vehicle test cycle with a maximum speed of more than 120 km/h and consists of low-, medium-, high-, and ultrahigh-speed sections. In this paper, two typical formal working conditions are selected to validate the algorithm. WLTP is now the most widely used test condition, and NEDC is currently also used for emission testing under current Chinese standards.
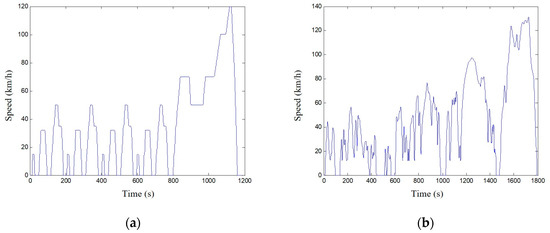
Figure 6.
(a) NEDC cycle test condition; (b) WLDP cycle test condition.
The traditional power system, ECMS control strategy, and ECMS mild hybrid system are compared and analyzed under two test conditions to prove the fuel economy effectiveness of the designed ECMS instantaneous optimization method. Fuel consumption curves of the three power systems obtained via simulation are illustrated in Figure 7. The numerical summary is presented in Table 3.
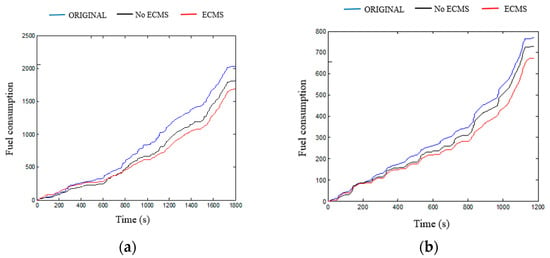
Figure 7.
Comparison of fuel consumption of various power systems under different test conditions. (a) NEDV cycle test condition; (b) WLDP cycle test condition.

Table 3.
Comparison of fuel consumption under various power systems.
Figure 7 shows that MHEV with the ECMS control strategy can more effectively reduce fuel consumption compared with MHEVs and conventional power vehicles without ECMS control strategies.
The simulation results of the mild hybrid system with and without the ECMS control strategy are compared and analyzed. The process of generating electricity with the motor causes the operating conditions of the engine to change and result in a different engine load after the application of the ECMS control strategy.
Figure 8, Figure 9, Figure 10 and Figure 11 present the motor output torque and the engine load of different power systems after applying the ECMS control strategy under NEDC and WLTP test conditions. The motor works power-assisted engine when the vehicle accelerates or the working condition changes drastically. The motor is typically in power generation mode when the vehicle stabilizes or the working condition changes smoothly to store electric energy. This feature reduces the load when the engine is under high load and increases the load when the engine is under low load to prevent the engine from operating at very low or high loads. The change of engine load is reflected in the distribution of operating conditions on the universal characteristic MAP as shown in Figure 12 and Figure 13.
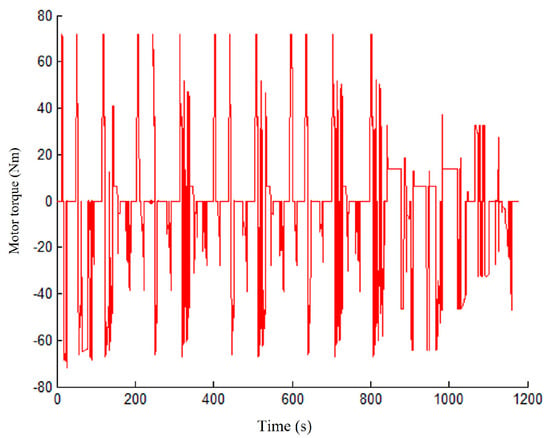
Figure 8.
Output torque of the motor after ECMS control strategy participates in NEDC test conditions.
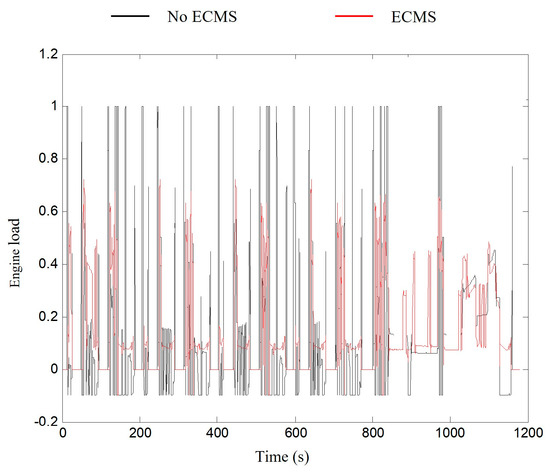
Figure 9.
Engine load corresponding to different power systems under NEDC test conditions.
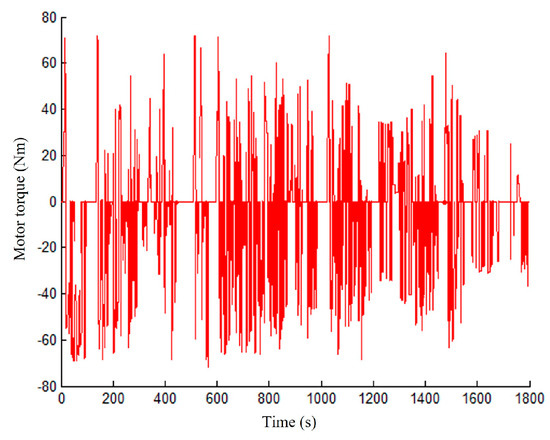
Figure 10.
Motor output torque after ECMS control strategy participation under WLTP test conditions.
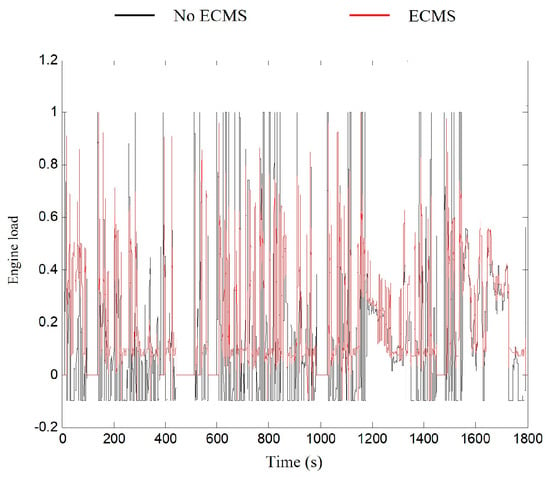
Figure 11.
Engine load corresponding to different power systems under WLTP test conditions.
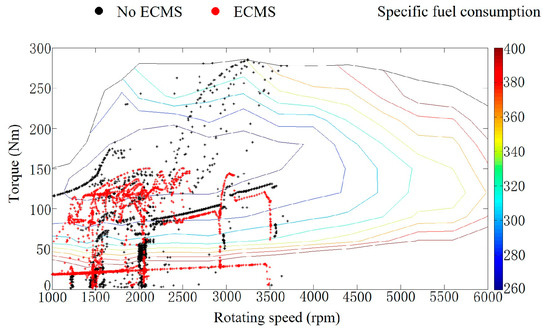
Figure 12.
Distribution of engine operating conditions under NEDC test conditions.
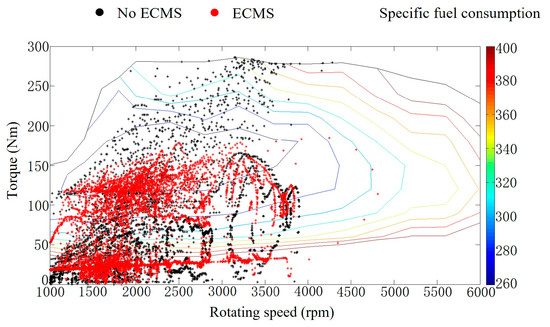
Figure 13.
Distribution of engine operating conditions under WLTP test conditions.
The mild hybrid system with the ECMS control strategy allows most of the engine’s operating conditions compared with a mild hybrid system with only an automatic idle start and stop and regenerative braking energy recovery under the two cyclic test conditions. The movement of the point toward the high-efficiency zone causes the thermal efficiency of the engine to change. The thermal efficiency of the engine in each power system under the two test conditions is shown in Figure 14 and Figure 15, and the average thermal efficiency values are listed in Table 4.
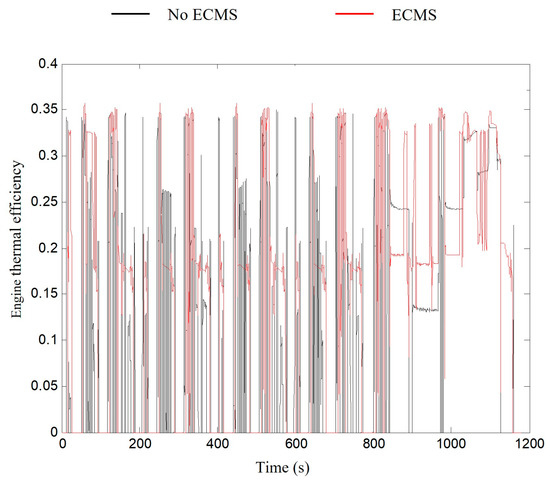
Figure 14.
Comparison of engine thermal efficiency in two power systems under NEDC conditions.
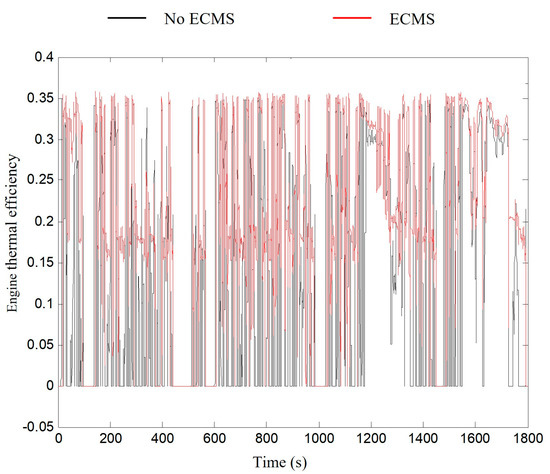
Figure 15.
Comparison of engine thermal efficiency in two−power system under WLTP condition.

Table 4.
Comparison of fuel consumption under various power systems.
As shown in Figure 14 and Figure 15, the mild hybrid system with the ECMS control strategy under the two test conditions reduces consumption during the engine running process more than the mild hybrid system without the ECMS control strategy. The extremely low efficiency of the middle part of the engine improved the overall efficiency of the engine.
Table 4 shows that the mild hybrid system with the ECMS control strategy under the two test conditions increases the average thermal efficiency value during engine operation. The increase in average thermal efficiency represents a reduction in fuel consumption. This explains why the ECMS control strategy can improve the fuel economy of the vehicle.
The results demonstrated that the ECMS control strategy under NEDC and WLTP test conditions can reduce fuel consumption by 7.071% per 100 km and 5.963% per 100 km, respectively. This finding clearly verifies the fuel economy of the ECMS control strategy.
4. Motor Dynamic Compensation Strategy Considering Turbocharged Engine Response Characteristics
The phenomenon of “turbo lag” occurs in the turbocharged engine during the acceleration of the vehicle; that is, the transient response is slow. This situation is manifested by the slow change of output torque of the engine and slow response when the engine load demand changes rapidly. The transient response of the turbine engine exerts a strong influence on vehicle dynamics and fuel economy. Therefore, the proposed motor power compensation strategy based on the original energy management control strategy can compensate for turbo lag.
4.1. Formulation of Motor Power Compensation Strategy
The ECMS control strategy aims to distribute the demand torque of the engine and the motor under steady-state conditions. The investigated motor dynamic compensation strategy is applied to optimize the transient response characteristics of the engine and energy management control strategy for the mild hybrid system. The input of the motor power compensation strategy module is the accelerator pedal signal, total demand torque of the engine and the motor (target total output torque), real-time output torque of the engine and the motor, engine and motor speed, and SOC value of the power battery pack. Meanwhile, the output is the motor compensation. The basic principle of the motor power compensation strategy is shown in Figure 16.

Figure 16.
Basic principle of motor power compensation strategy.
When the turbocharged engine is in transient response, the motor’s power compensation will cause the total output torque or power of the engine and motor to change during the process, thus affecting the performance of the vehicle. Defining the motor allows use of the compensable coefficient and introducing a weighting factor that varies with the SOC of the power battery pack. Its SOC curve with the power battery pack is shown in Figure 17, and the formula is expressed as in (14).
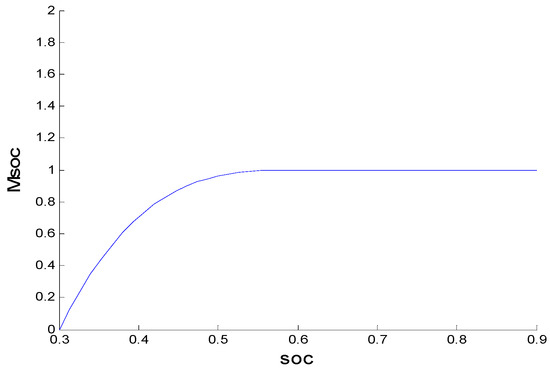
Figure 17.
Compensation coefficient with power battery SOC curve.
Therefore, the motor compensation power can be expressed as in (15).
where allows the compensable power for the motor, is the maximum compensable power of the motor, is the maximum output power of the motor at the current speed, is the output power of the motor at the current speed, is the ideal compensation power for the motor, is the total output power of the engine and motor target, and is the real-time total output power of the engine and motor.
The required power of the motor during the transient response of the engine after adding the motor power compensation strategy can be expressed as:
4.2. Analysis of the Influence of Motor Power Compensation Strategy on Vehicle Dynamics
Two typical operating conditions are extracted from the NEDC and WLTP cycles after adding the motor power compensation strategy. The typical working condition A represents the modal working condition, and the other typical working condition B represents the transient operating condition. Diagrams of working conditions A and B are shown in Figure 18. The motor allowable compensation coefficient is set to 0, 0.2, 0.4, 0.6, 0.8, and 1, where represents the motor power compensation strategy and represents the motor full-power compensation. The vehicle dynamics analysis in this work is carried out under different motors’ allowable compensable coefficients.
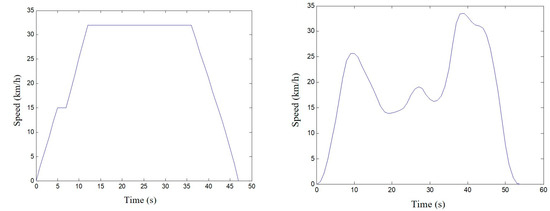
Figure 18.
Typical working condition A and B.
Figure 19 and Figure 20 show a comparison of the actual and target vehicle speeds under working conditions A and B. The standard deviation values of the actual and target vehicle speeds are listed in Table 5 and Table 6, respectively
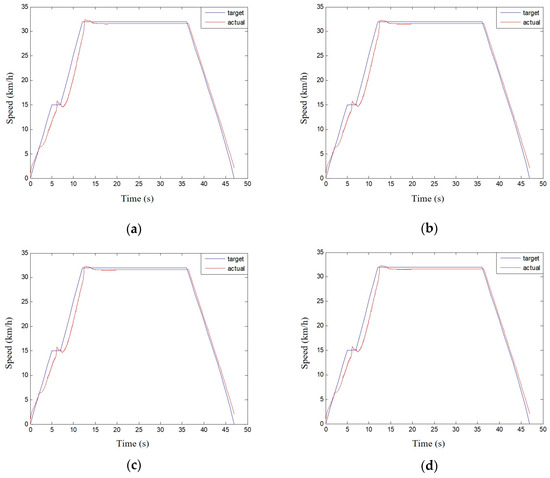
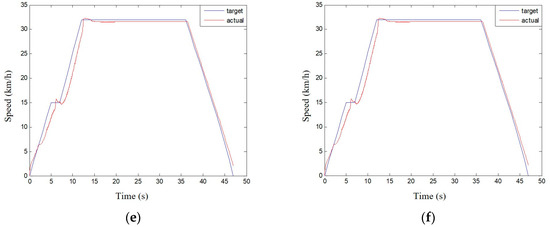
Figure 19.
Comparing the speed of the motor with the compensable coefficient under different working conditions A. (a) α = 0; (b) α = 0.2; (c) α = 0.4; (d) α = 0.6; (e) α = 0.8; (f) α = 1.
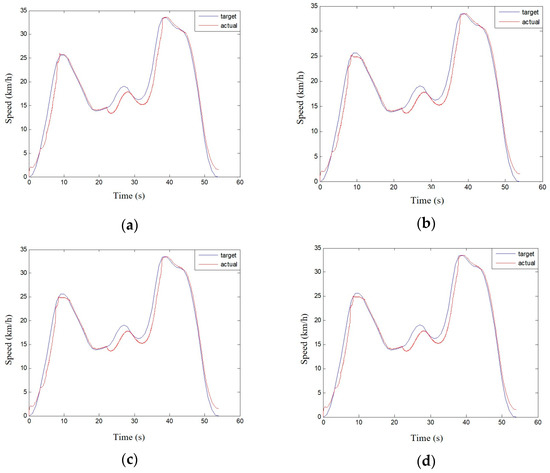
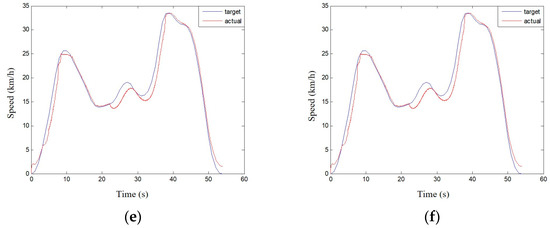
Figure 20.
Comparing the speed of the motor with the compensable coefficient under different working conditions B. (a) α = 0; (b) α = 0.2; (c) α = 0.4; (d) α = 0.6; (e) α = 0.8; (f) α = 1.

Table 5.
The standard deviation of the vehicle speed corresponding to the compensable coefficient for different motors under working condition A.

Table 6.
The standard deviation of the vehicle speed corresponding to the compensable coefficient for different motors under working condition B.
According to the data in Table 5 and Table 6, the motor power compensation strategy can reduce the standard deviation between the actual and target vehicle speeds, and the standard deviation decreases with the increase in the motor allowable compensation coefficient until the same. Figure 21 presents the comparison of the actual vehicle speed with the compensation coefficient of 0 and 0.2 under condition A. Figure 22 illustrates the comparison of the actual vehicle speed with the compensation coefficient of 0 and 0.6 under condition B.
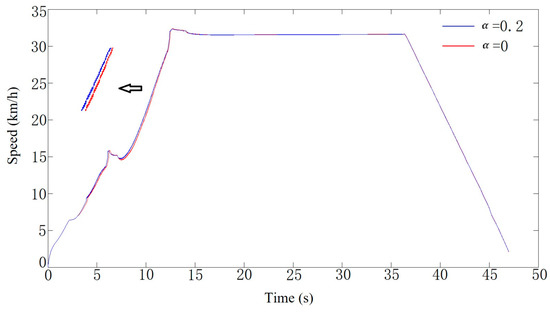
Figure 21.
Comparison of actual speed of and under working condition A.
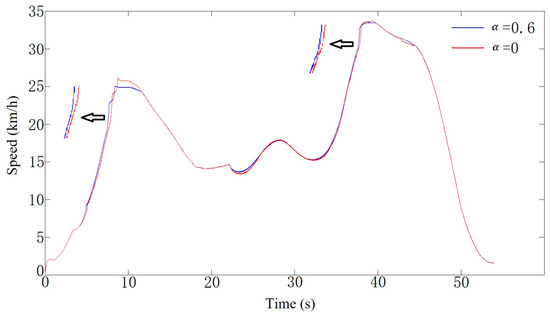
Figure 22.
Comparison of actual speed of and under working condition B.
The results showed that the motor power compensation strategy can increase vehicle speed rapidly and achieve a speed close to the target vehicle speed. A high degree of motor compensation within a certain range corresponds to excellent power improvement. The standard deviation between the actual and target vehicle speeds can be reduced by a maximum of 8.123% and 8.765% under working conditions A and B, respectively. The increase in real-time total output torque of the engine and motor due to the compensation power of the motor during the transient response of the engine directly increases the power, thereby reducing the difference between the real-time and target total output torque values. The comparison between the total and real-time total output torque of the engine and motor target corresponding to the compensable coefficient under different operating conditions is presented in Figure 23 and Figure 24, and their standard deviation values are listed in Table 7 and Table 8.
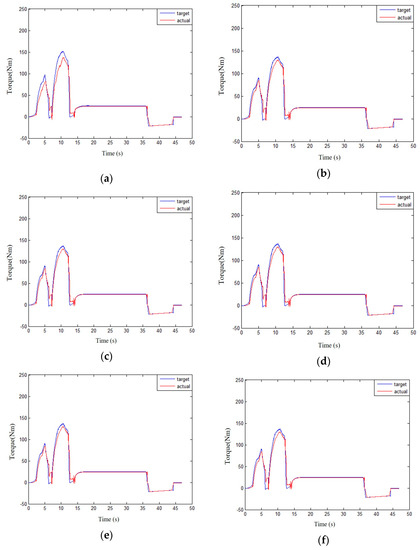
Figure 23.
Comparison of the total torque between engine and motor corresponding to the compensable coefficient of different motors under working condition A. (a) α = 0; (b) α = 0.2; (c) α = 0.4; (d) α = 0.6; (e) α = 0.8; (f) α = 1.
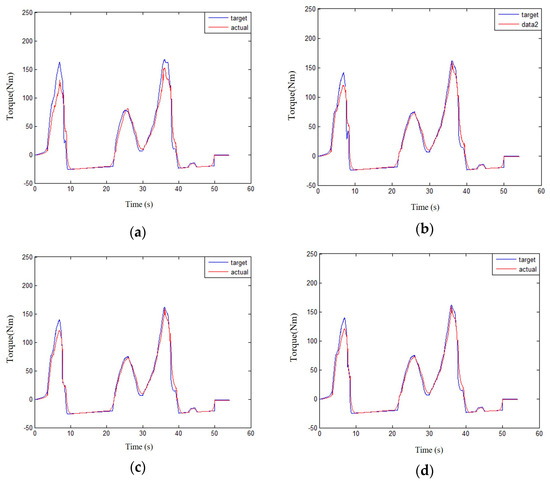
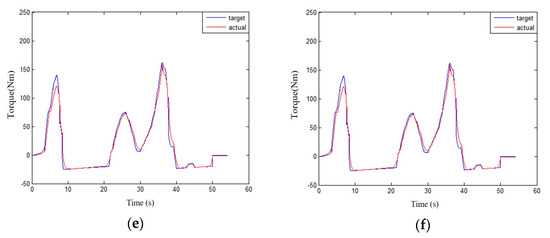
Figure 24.
Comparison of the total torque between engine and motor corresponding to the compensable coefficient of different motors under working condition B. (a) α = 0; (b) α = 0.2; (c) α = 0.4; (d) α = 0.6; (e) α = 0.8; (f) α = 1.

Table 7.
Standard deviation of the torque corresponding to the compensable coefficient of different motors under working condition A.

Table 8.
Standard deviation of the torque corresponding to the compensable coefficient of different motors under working condition B.
As shown in Table 7 and Table 8, the standard deviation between the real-time and target total output torque values of the engine and the motor within a certain range reduces more with the compensation strategy compared with that of the motor power compensation strategy. The difference decreases with the increase of the allowable compensation coefficient of the motor within the range, thereby confirming the correctness of the above-mentioned compensation strategy for improving the dynamics of the vehicle.
4.3. Analysis of the Influence of Motor Power Compensation Strategy on Fuel Economy of Vehicles
According to the analysis of the dynamic impact of the vehicle, the motor power compensation strategy changes the actual vehicle speed and causes the engine speed to change, thereby affecting the engine’s transient ratio fuel consumption value and ultimately lead to a change in the engine’s fuel consumption. Compared with the original energy management control strategy, the change in the output torque of the motor will affect the amount of fuel consumed by the engine in the future; the replenishment and consumption of electric energy result in a change in the equivalent fuel consumption of the mild hybrid system. The bench test method was adopted to analyze and verify the impact of the motor power compensation strategy on the fuel economy of the vehicle under the allowable compensation coefficient of different motors.
The selected typical modal working condition A and the typical transient working condition B are tested using the built test rig on different allowable compensation coefficients of the motor. The numerical results are summarized in Table 9 and Table 10.

Table 9.
Energy consumption table corresponding to the compensable coefficients of different motors underworking condition A in bench test.

Table 10.
Energy consumption table corresponding to the compensable coefficients of different motors underworking condition B in bench test.
Compared with the motor power compensation strategy, the motor power compensation strategy can effectively reduce the fuel consumption of the engine and the equivalent fuel consumption of the power system while the compensation coefficient of the motor increases.
The change in engine fuel consumption is greater than the equivalent of the battery pack when the motor is compensated for power in the transient state of the engine despite the increase in the amount of fuel consumed in the future replenishment of electric energy or reduction in the amount of fuel consumed in the future consumption of electric energy. The equivalent fuel consumption of the above power system also reduces with the increase in the allowable compensation coefficient of the motor. The equivalent fuel consumption of 100,000 m can be reduced by 2.542% and 3.947% under working conditions A and B, respectively. The motor allows a compensable coefficient of 0.2 and 0.6 under operating conditions A and B, respectively, at the intercept point where the fuel consumption is no longer changing.
The case where the vehicle’s power and fuel economy no longer change with the increase of the motor’s allowable compensation coefficient is called compensation saturation. The compensable coefficient is called the compensating saturation point when the initial motor compensates for saturation. The compensation saturation occurs because the actual compensation power of the motor is affected by the SOC compensation coefficient. When the actual compensation power of the motor increases with the allowable compensation power of the motor, the power system tends to consume more power, and the SOC value of the power battery pack tends to decrease, which tends to lower the SOC compensation coefficient, thereby suppressing the motor. The actual compensation power increases until the compensation saturation point is reached. The actual compensation power of the motor then stays the same, although the motor allows the compensable power to continue to increase.
The motor power compensation strategy can reduce fuel consumption because the engine speed is closer to the target speed through the improvement of the vehicle’s power and the engine speed is in the transient response of the engine from a lower load to a slightly higher load. This improvement can lead to a lower transient ratio than fuel consumption, a reduced transient ratio fuel consumption value, decrease the average fuel consumption of the engine under driving conditions, and finally enhance the fuel economy of the whole vehicle. The average fuel consumption of the engine under the two working conditions is presented in Table 11 and Table 12. Adding the compensation strategy can reduce the average fuel consumption of the engine and the average engine ratio before compensating for the saturation point. The fuel consumption decreases as the motor allows the compensation coefficient to increase, thereby confirming the correctness of the above-mentioned compensation strategy to improve the fuel economy of the vehicle.

Table 11.
Average specific fuel consumption corresponding to the compensable coefficient of different motors under working condition A in the bench test.

Table 12.
Average specific fuel consumption corresponding to the compensable coefficient of different motors under working condition B in the bench test.
5. Discussion and Conclusions
A forward hybrid simulation platform for mild hybrid systems is built and the use of the ECMS instantaneous optimization method is put forward to formulate energy management control strategies in this work. A motor power compensation strategy considering the characteristics of a turbocharged engine transient response is also proposed.
The equivalent fuel consumption rate model of the power battery pack under charge and discharge conditions is established on the basis of the instantaneous optimization method of ECMS. The equivalent factor is introduced for the simplified calculation, the SOC compensation of the power battery pack introduces a penalty function, the regenerative braking correction introduces the average regenerative braking power, and the above control parameters are set for different working conditions in the process of determining the objective function according to the model. The constraints are then combined as an energy management control strategy to optimize the energy distribution relationship between the generator and the motor. The results showed that the ECMS control strategy can achieve an engine operating point close to the high-efficiency zone, improve the average thermal efficiency of the engine, and enhance the fuel economy of the vehicle. The ECMS control strategy can additionally reduce the fuel consumption by 7.071% per 100 km and 5.163% per 100 km under the NEDC and WLTP test conditions, respectively
The transient response of the turbocharged engine affects the vehicle’s power and fuel economy. The motor is used to compensate power and solve the negative impact of turbocharged engine response characteristics according to the energy management control strategy. The results demonstrated that the motor power compensation strategy can improve the vehicle’s dynamic performance. The standard deviation between the actual and target vehicle speeds can be reduced by 8.123% and 8.765% under the NEDC and WLTP cycle selection sections, respectively. Hence, the ECMS mild hybrid control strategy introduced by motor power compensation can maintain the power and improve the fuel economy of the vehicle.
We will continue to explore strategies for improving vehicle fuel economy and test the motor power compensation strategy using real vehicles to validate the proposed algorithm further in future investigations. The compensation strategy will be optimized and improved on the basis of the experimental results to enhance the practicality of the motor compensation strategy and fuel economy while ensuring vehicle power.
Author Contributions
Data curation, H.L.; Funding acquisition, C.S.; Software, D.W.; Validation, N.Z.; Writing—original draft, C.Q. All authors have read and agreed to the published version of the manuscript.
Funding
This research received no external funding.
Data Availability Statement
Not applicable.
Conflicts of Interest
The authors declare no conflict of interest.
References
- Lv, H.; Qi, C.; Song, C.; Song, S.; Zhang, R.; Feng, X. Energy management of hybrid electric vehicles based on inverse reinforcement learning—ScienceDirect. Energy Rep. 2022, 8, 5215–5224. [Google Scholar]
- Grijalva, E.R.; Martínez, J.M.L.; Flores, M.N.; Del Pozo, V. Design and Simulation of a Powertrain System for a Fuel Cell Extended Range Electric Golf Car. Energies 2018, 11, 1766. [Google Scholar] [CrossRef]
- Campíñez-Romero, S.; Colmenar-Santos, A.; Pérez-Molina, C.; Mur-Pérez, F. A hydrogen refuelling stations infrastructure deployment for cities supported on fuel cell taxi roll-out. Energy 2018, 148, 1018–1031. [Google Scholar] [CrossRef]
- Ligen, Y.; Vrubel, H.; Girault, H.H. Mobility from Renewable Electricity: Infrastructure Comparison for Battery and Hydrogen Fuel Cell Vehicles. World Electr. Veh. J. 2018, 9, 3. [Google Scholar] [CrossRef]
- Zhang, X.; Mi, C. Vehicle Power Management: Modeling, Control and Optimization; Springer: Berlin/Heidelberg, Germany, 2011. [Google Scholar] [CrossRef]
- Deng, X. The development of EV and its impact on energy, environment and other socioeconomic aspects. Int. J. Smart Grid Clean Energy 2020, 9, 975–982. [Google Scholar] [CrossRef]
- Wang, G.; Huang, F.; Yu, Y.; Wen, S.; Tu, Z. Degradation behavior of a proton exchange membrane fuel cell stack under dynamic cycles between idling and rated condition. Int. J. Hydrogen Energy 2018, 43, 4471–4481. [Google Scholar] [CrossRef]
- Wang, Y.; Seo, B.; Wang, B.; Zamel, N.; Jiao, K.; Adroher, X.C. Fundamentals, materials, and machine learning of polymer electrolyte membrane fuel cell technology. Energy AI 2020, 1, 100014. [Google Scholar] [CrossRef]
- Lebeau, K.; Van Mierlo, J.; Lebeau, P.; Mairesse, O.; Macharis, C. The market potential for plug-in hybrid and battery electric vehicles in Flanders: A choice-based conjoint analysis. Transp. Res. Part D Transp. Environ. 2012, 17, 592–597. [Google Scholar] [CrossRef]
- Wang, L.; Li, H. Maximum Fuel Economy. Ind. Appl. IEEE Trans. 2010, 46, 1011–1020. [Google Scholar]
- Robuschi, N.; Zeile, C.; Sager, S.; Braghin, F. Multiphase mixed-integer nonlinear optimal control of hybrid electric vehicles. Automatica 2020, 123, 109325. [Google Scholar] [CrossRef]
- Sabri, M.M.; Danapalasingam, K.; Rahmat, M. A review on hybrid electric vehicles architecture and energy management strategies. Renew. Sustain. Energy Rev. 2016, 53, 1433–1442. [Google Scholar] [CrossRef]
- Zhang, P.; Yan, F.; Du, C. A comprehensive analysis of energy management strategies for hybrid electric vehicles based on bibliometrics. Renew. Sustain. Energy Rev. 2015, 48, 88–104. [Google Scholar] [CrossRef]
- Yang, C.; Du, S.; Li, L.; You, S.; Yang, Y.; Zhao, Y. Adaptive real-time optimal energy management strategy based on equivalent factors optimization for plug-in hybrid electric vehicle. Appl. Energy 2017, 203, 883–896. [Google Scholar] [CrossRef]
- Yu, Y.; Liu, X.; Min, H.; Sun, H.; Xu, L. A novel fuzzy-logic based control strategy for a semi-active battery/super-capacitor hybrid energy storage system in vehicular applications. J. Intell. Fuzzy Syst. 2015, 29, 2575–2584. [Google Scholar] [CrossRef]
- Hu, J.; Li, J.; Hu, Z.; Xu, L.; Ouyang, M. Power distribution strategy of a dual-engine system for heavy-duty hybrid electric vehicles using dynamic programming. Energy 2020, 215, 118851. [Google Scholar] [CrossRef]
- Guo, N.; Zhang, X.; Zou, Y.; Guo, L.; Du, G. Real-time predictive energy management of plug-in hybrid electric vehicles for coordination of fuel economy and battery degradation. Energy 2020, 214, 119070. [Google Scholar] [CrossRef]
- Bubna, P.; Brunner, D.; Advani, S.G.; Prasad, A.K. Prediction-based optimal power management in a fuel cell/battery plug-in hybrid vehicle. J. Power Sources 2010, 195, 6699–6708. [Google Scholar] [CrossRef]
- Kim, M.; Jung, D.; Min, K. Hybrid Thermostat Strategy for Enhancing Fuel Economy of Series Hybrid Intracity Bus. IEEE Trans. Veh. Technol. 2014, 63, 3569–3579. [Google Scholar] [CrossRef]
- Qi, C.; Song, C.; Xiao, F.; Song, S. Generalization ability of hybrid electric vehicle energy management strategy based on reinforcement learning method. Energy 2022, 250, 123826. [Google Scholar] [CrossRef]
- Liu, T.; Tang, X.; Hu, X.; Tan, W.; Zhang, J. Human-like Energy Management Based on Deep Reinforcement Learning and Historical Driving Experiences. arXiv 2020, arXiv:2007.10126. [Google Scholar]
- Hu, X.; Han, J.; Tang, X.; Lin, X. Powertrain Design and Control in Electrified Vehicles: A Critical Review. IEEE Trans. Transp. Electrification 2021, 7, 1990–2009. [Google Scholar] [CrossRef]
- Qi, C.; Zhu, Y.; Song, C.; Cao, J.; Xiao, F.; Zhang, X.; Xu, Z.; Song, S. Self-supervised reinforcement learning-based energy management for a hybrid electric vehicle. J. Power Sources 2021, 514, 230584. [Google Scholar] [CrossRef]
- Teja, M.; Varma, P.S.; Irfan, M.; Sudarshan, E. Designing for Control Strategy by Particle Swarm Optimization in Parallel Hybrid Electric Vehicles for Economical Fuel Consumption. IOP Conf. Series: Mater. Sci. Eng. 2020, 981, 042034. [Google Scholar] [CrossRef]
- Kitayama, S.; Saikyo, M.; Nishio, Y.; Tsutsumi, K. Torque control strategy incorporating charge torque and optimization for fuel consumption and emissions reduction in parallel hybrid electric vehicles. Struct. Multidiscip. Optim. 2016, 54, 177–191. [Google Scholar] [CrossRef]
- Qi, C.; Zhu, Y.; Song, C.; Yan, G.; Xiao, F.; Wang, D.; Zhang, X.; Cao, J.; Song, S. Hierarchical reinforcement learning based energy management strategy for hybrid electric vehicle. Energy 2021, 238, 121703. [Google Scholar] [CrossRef]
- Visser, W.P.J.; Shakariyants, S.A.; Oostveen, M. Development of a 3 kW microturbine for cogeneration applications. J. Gas Turbine Power Eng. 2010, 133, 042301. [Google Scholar] [CrossRef]
- Wang, Q. Forward modeling and simulation of hybrid vehicles. Automot. Eng. 2005, 4, 392-394+398. [Google Scholar] [CrossRef]
- Tribioli, L.; Barbieri, M.; Capata, R.; Sciubba, E.; Jannelli, E.; Bella, G. A Real Time Energy Management Strategy for Plug-in Hybrid Electric Vehicles based on Optimal Control Theory. Energy Procedia 2014, 45, 949–958. [Google Scholar] [CrossRef]
- Xu, L. Comparative Study on Energy Management Strategies of Enhanced Bus-Driven Urban Buses. J. Univ. Sci. Technol. China 2012, 42, 640–647. [Google Scholar] [CrossRef]
- Shen, C. Research on Energy Optimization Management Strategy of Series Hybrid Electric Vehicles. Master’s Thesis, Department Electron, Tianjin University, Tianjin, China, 2010. [Google Scholar]
Publisher’s Note: MDPI stays neutral with regard to jurisdictional claims in published maps and institutional affiliations. |
© 2022 by the authors. Licensee MDPI, Basel, Switzerland. This article is an open access article distributed under the terms and conditions of the Creative Commons Attribution (CC BY) license (https://creativecommons.org/licenses/by/4.0/).