Article

A Study on Dimensional Accuracy of a Vehicle Hood-Catch Considering Material Shrinkage of Polyamide 6 and Length-to-Volume Ratio Characteristic of a Shape

1
Department of Mechanical Engineering, Keimyung University, Daegu 42601, Korea
2
Division of Mechanical and Automotive Engineering, Keimyung University, Daegu 42601, Korea
*
Author to whom correspondence should be addressed.
Machines 2022, 10(10), 934; https://doi.org/10.3390/machines10100934
Submission received: 7 August 2022 / Revised: 10 October 2022 / Accepted: 11 October 2022 / Published: 14 October 2022
(This article belongs to the Section Vehicle Engineering)

Abstract

:
A hood-catch is a car part that fixes the vehicle’s hood to its body. This serves as a mechanism for opening and closing the engine bay of an automobile and prevents safety accidents in which the hood is opened while driving due to vibration generated from off-road conditions by firmly latching. Research regarding the overall improvement of products by injection molding, with analysis based on computer-aided engineering, is being actively conducted. However, research on the shrinkage rate considering the characteristics of parts’ shapes, such as length-to-volume ratio, is insufficient. Therefore, in this study, our research is concerned with (1) process improvement compared to the existing process using the design of an experimental method, (2) suggestion of a shrinkage-rate constant, considering both PA6 shrinkage ratio, which is a material characteristic, and length-to-volume ratio, which is a part shape characteristic, and (3) the effect of the proposed shrinkage rate on the accuracy of key dimensions of the hood-catch joint. The results of this study demonstrated that the shrinkage-rate constant needs to be considered simultaneously for both material characteristics and part shape characteristics. In particular, the shrinkage rates of the hood-catch’s pivot sub-assembly and open lever with reinforced PA6, with length-to-volume ratios of 1.24 × 10⁻³ and 3.10 × 10⁻³, respectively, are suggested as 0.2% and 0.5%.

1. Introduction

A hood-catch (or hood latch) is an automobile part that fixes the hood of a Sport Utility Vehicle (SUV) and Recreational Vehicle (RV). This serves as a mechanism for opening and closing the engine compartment of automobiles and prevents safety accidents in which the hood is opened while driving due to vibration generated from navigation on off-road conditions, unpaved roads, etc., by firmly fixing the hood to the car body. According to data from the U.S. Transportation Department, however, more than 2 million vehicles have been recalled from 2013 to the present from manufacturers such as Nissan, Hyundai, KIA, GM, etc. for the reason that the vehicles had the possibility of the hood suddenly opening while driving due to an unfixed hood catch or corrosion. This means that quality of hood catch should be improved [1].
Hood-catches are usually manufactured through an injection molding process using engineering plastic materials. Injection molding is a process in which plastic is converted into a flowable state by heating it at a temperature above a melting point and injected into a mold of a shape the product is processed into using pressure. Through this process, products with complicated shapes can be made at low cost and used in various industries. The steps of the injection molding process have a cycle consisting of the filling step, i.e., to fill melted polymer resin into the mold; the holding-pressure step that gives continuous pressure to compensate for volume reduction resulting from shrinkage; the cooling step to reach the ejection temperature; and the ejection step in which the mold is opened and the product is released [2,3]. Therefore, it is necessary to analyze key process variables such as resin molding temperature, mold temperature, injection time, holding pressure, coolant temperature, cooling time, etc., to improve the quality of the product and maintain productivity during the injection molding process. These process variables are factors affecting the characteristics and behavior of the molten resin that is injected into the mold during injection molding, and they greatly influence the quality, failure rate, size, etc., of molded products [4]. Injection-molded products are developed through a process of product design, mold design, mold processing, and test injection, and it is necessary to verify the validity of product design or mold design before processing the mold. In general, the injection molding process mostly depends on the experience of designers or practitioners. Product failures are found at test injection, so revision requires a lot of time and cost. However, developing time and costs can be saved by predicting the shapes and defects of molded products in advance according to the development of injection molding analysis software [5,6,7].
In relation to research on product improvement through injection molding analysis, Carpenter et al. modeled molds, templates of injection molding presses, and cylinder support structures as finite elements and used injection pressure as a factor to analyze the deformation rate of a mold [8], and Lin et al. used injection molding analysis software in the research process for manufacturing subminiature parts by using PIM to predict warpage phenomenon and select the optimal process conditions [9]. Seow et al. conducted research on design thickness to balance mold cavities through commercialized injection molding analysis software and selected a geometric model optimized for cavity balancing [10]. Ginghtong et al. analyzed the plastic flow of super-ultra-thin wall products through flow analysis and researched mechanical and physical properties of injection process parameters through Taguchi experimental design [11]. In addition, Lee et al. presented a way to conduct injection molding analysis and process improvement to develop an engine mount bracket—a connection part that supports engine fix it to the vehicle body—by applying composite materials [12], and Jeong et al. conducted injection flow analysis for manufacturing nano-carbon-reinforced composite material and prior verification of injection molding based on nylon resin, and presented an injection molding process for top-mount housing [13]. Choi et al. presented an improvement of appearance defects on the outside mirror housing of cars by analyzing flow patterns through the development of metallic plastic material that surround parts of the plastic surface with a metal film and injection molding analysis [14]. Fernandez et al. found that ABS, as processed by PolyJet technology, and PA11, as processed by MJF, are most suited for hybrid injection mold insert applications when comparing five material options using computer-aided engineering software [15].
As mentioned above, research related to overall part improvement according to injection molding analysis based on computer-aided engineering (CAE) and the development of parts using PA6 is being actively conducted. However, research on the shrinkage rate considering the shape characteristics of parts, such as length-to-volume ratio, is insufficient. Therefore, in this study, we use Moldflow, a commercial injection molding analysis software, to research (1) process improvements compared to the existing process using the design of an experiment method for automobile hood-catch parts, (2) suggestions for a shrinkage-rate constant considering both PA6 shrinkage ratio, which is a material characteristic, and length-to-volume ratio, and (3) the effect of the proposed shrinkage rate on the accuracy of key hood-catch joint dimensions.

2. Theoretical Background

2.1. Characteristics of PA6

PA6 is a kind of engineering plastic that has excellent physical properties, such as its mechanical properties, electrical properties, and processability, and—given its exceptional price-competitiveness—its use is increasing by replacing metals in various industries.
Regarding mechanical properties, it has (1) high strength and stiffness even at high temperature, (2) high impact strength, (3) excellent fatigue resistance, and (4) creep resistance, periodic damping properties, and high toughness, so it is regarded as an application material in the field of structural materials that require heavy load.
Regarding electrical properties, it has (1) high electric insulation, (2) excellent self-lubricative properties, and (3) excellent resistance against UV rays and gamma radiation.
Alongside other properties, it has excellent wear resistance and formability. On the other hand, it has a problem of low dimensional stability. However, this is supplemented by reinforcing with Glass Fiber (GF), and it is widely used in the automobile industry [16,17,18,19,20,21].
This study was conducted by applying BASF Ultramid 8266GHS, Mineral Fiber (MF) and GF 40% reinforced PA6. The content ratio of MF and GF is shown in Table 1, and its properties are in Table 2.

2.2. Hood-Catch Modeling and Injection Molding Process Conditions

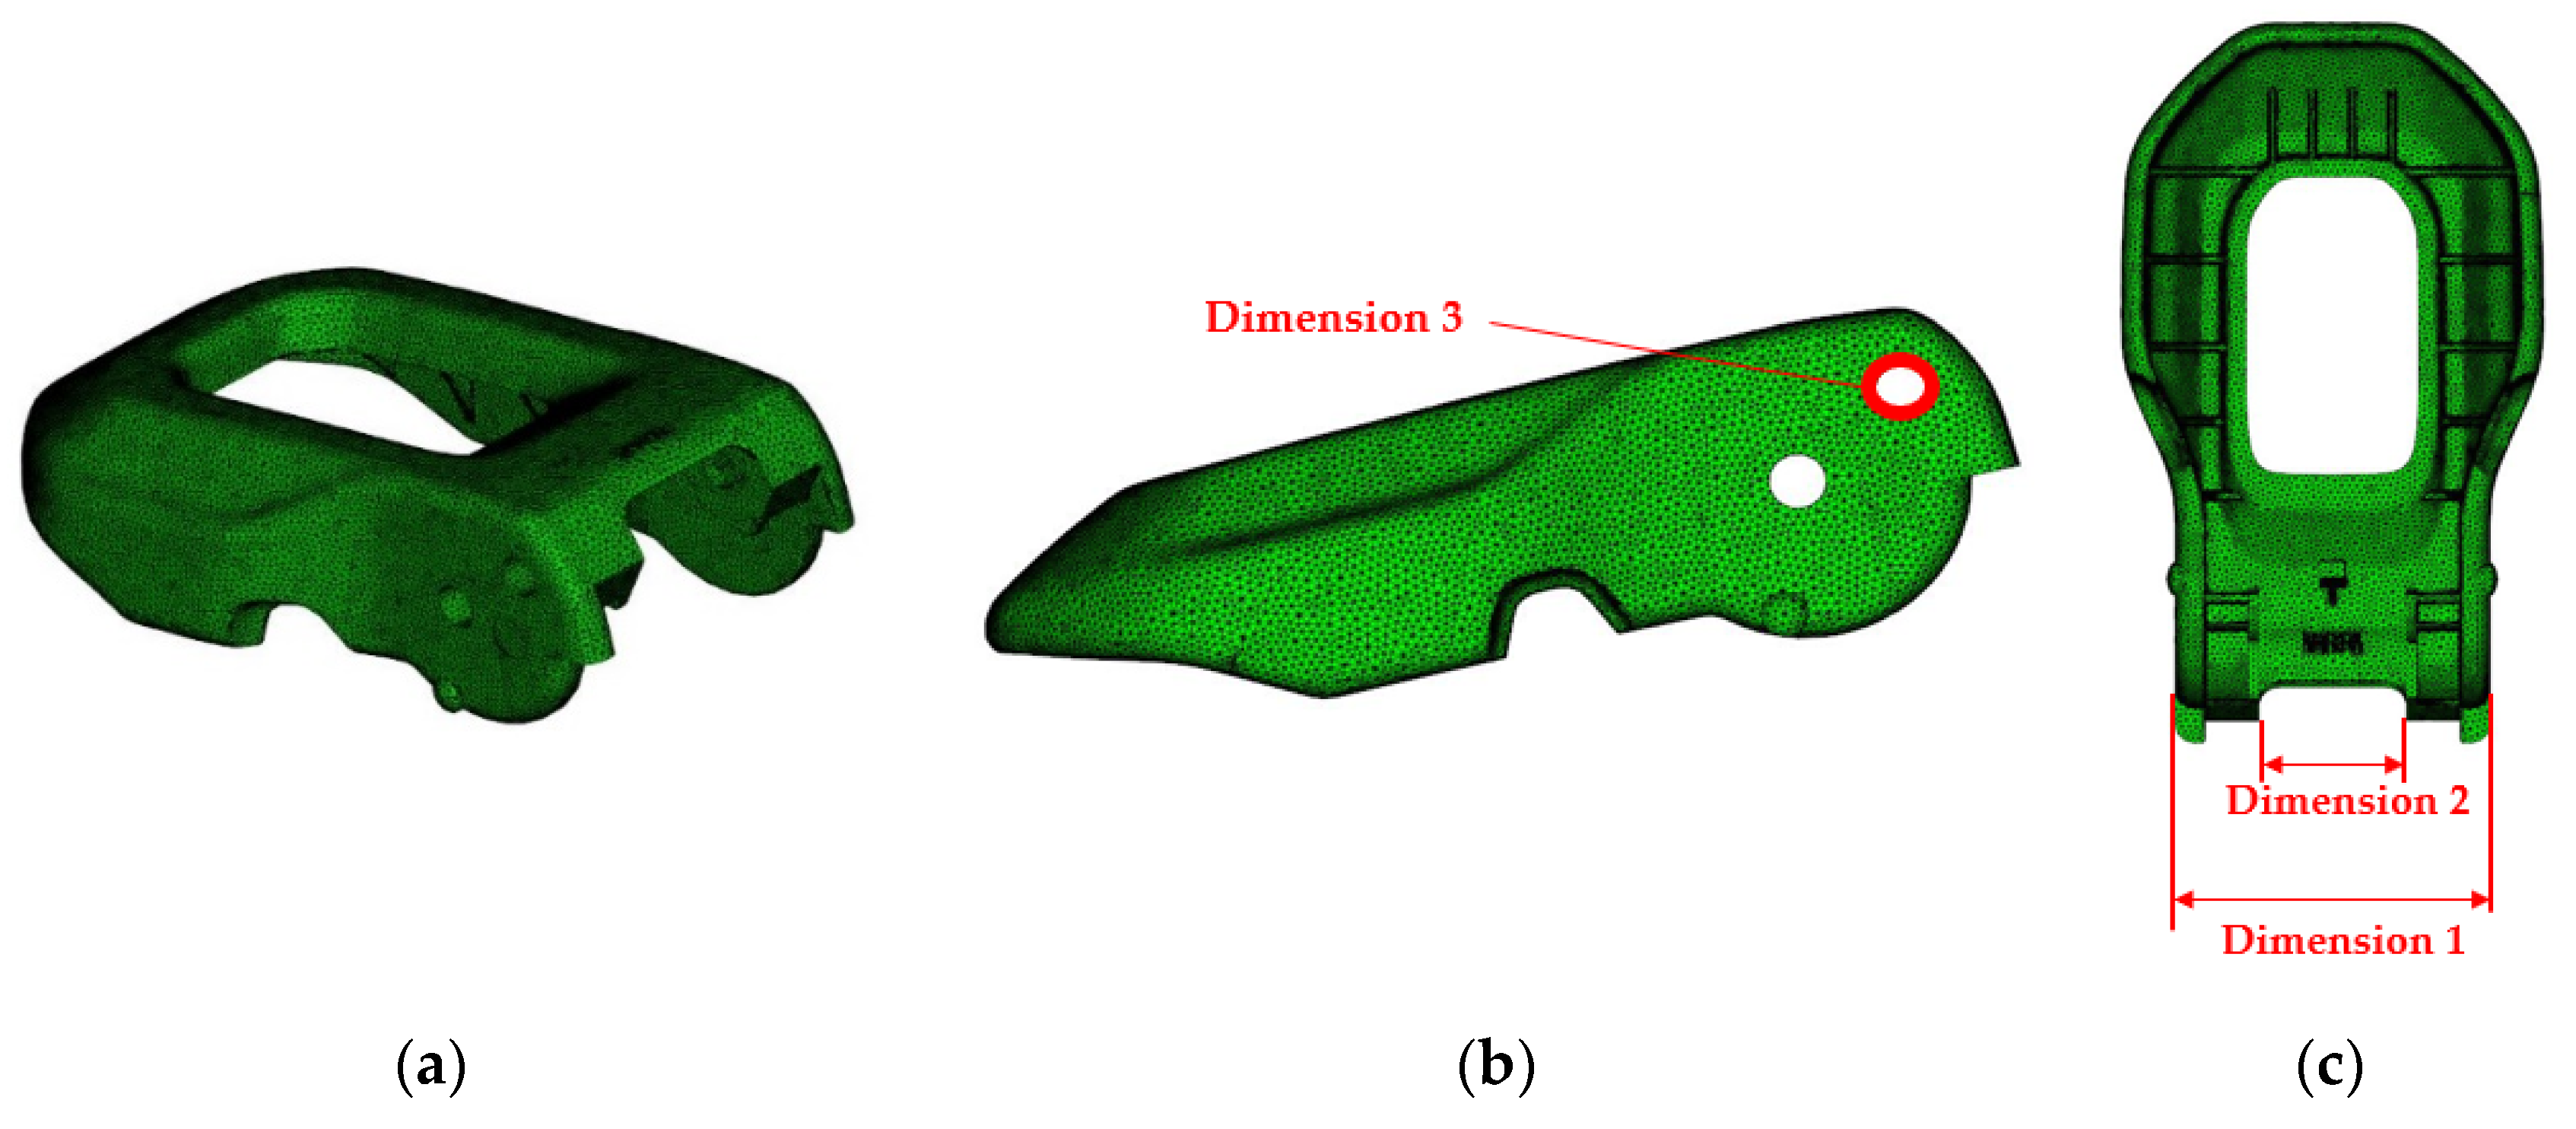
The hood-catch consists of a pivot sub-assembly and an open lever, and the pivot sub-assembly is injected with an M8 bolt inserted. Three junctions where correct dimensional accuracy can prevent safety accidents in which the hood-catch is suddenly opened were selected as main dimensions, which are represented as dimension 1, dimension 2, and dimension 3 in Figure 1 and Figure 2. Table 3 indicates a modeling dimension and a target dimension to be satisfied after injection molding. Injection molding analysis is performed using Moldflow, a commercialized software [22].
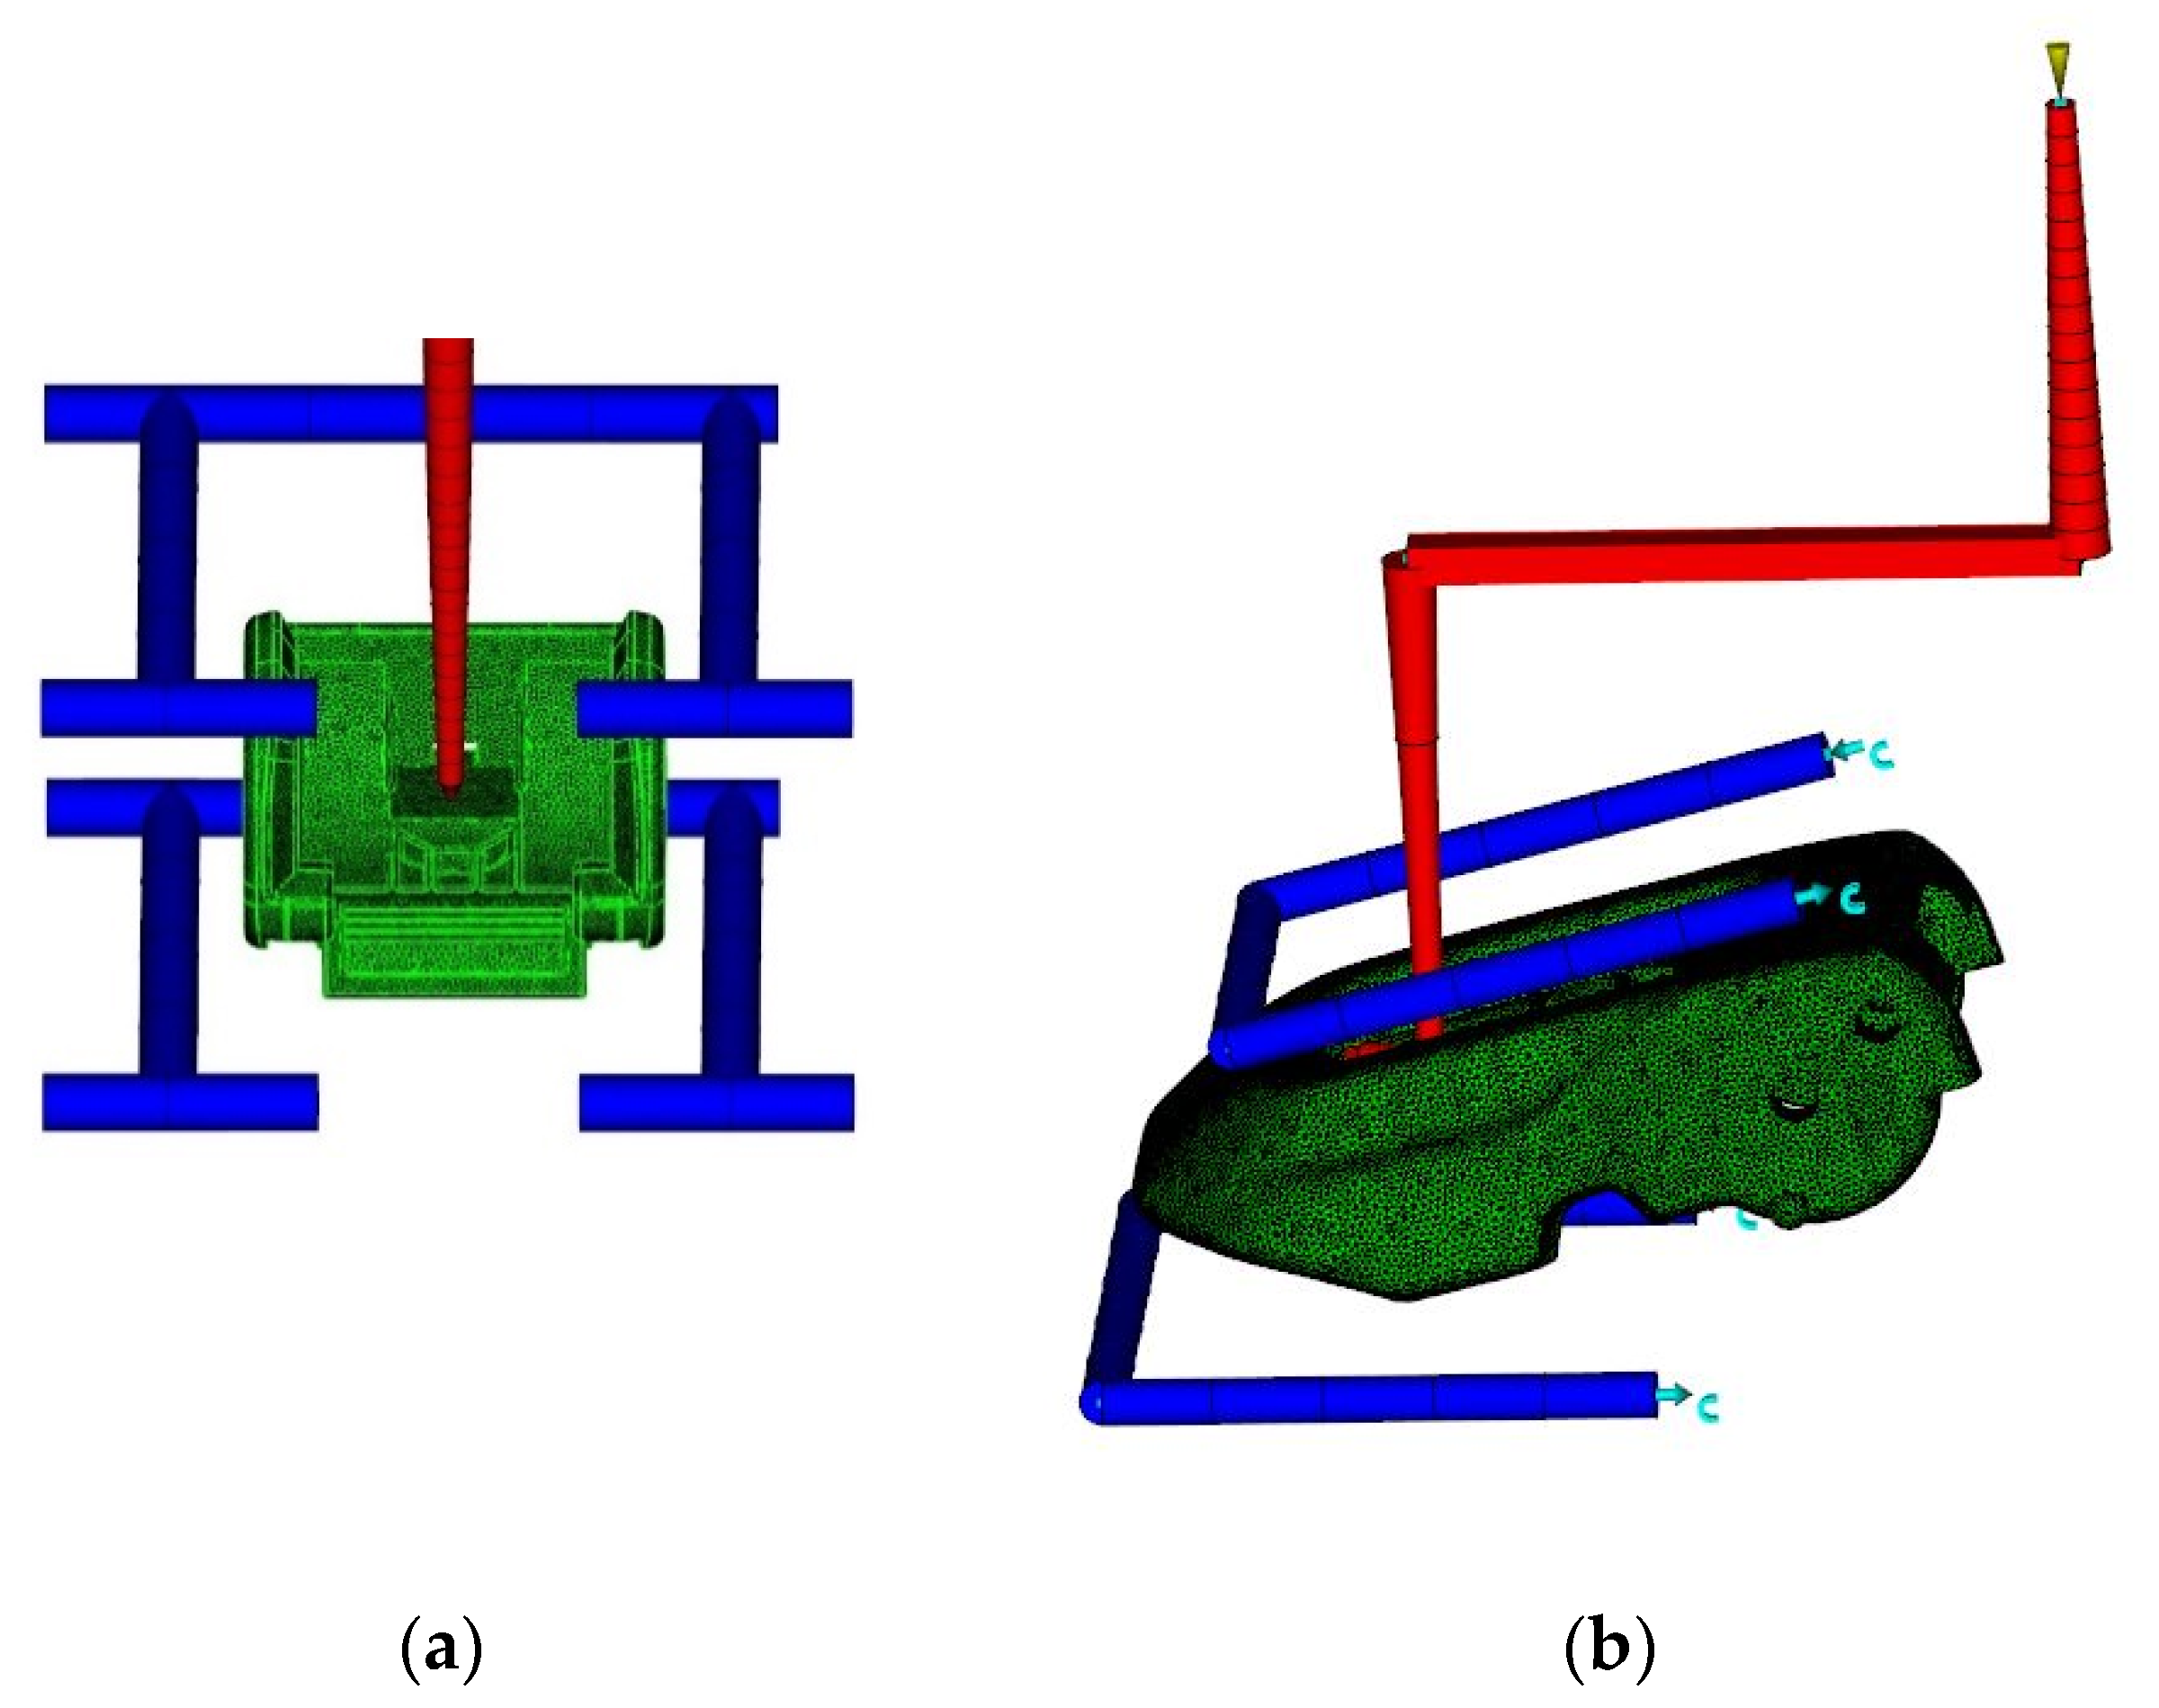
Figure 3 shows a modeled shape of the target product’s hood-catch as well as products that are used in mass production—gates, runner, and cooling channels—for injection molding analysis. Meshed shapes for analyzing the parts are shown in Figure 3; the pivot sub-assembly was modeled with 1,181,311 meshes and the open lever was modeled with 1,089,777 meshes. The gate is shown in Figure 4, and the size of the runner system is shown in Table 4. All the cooling circuit diameters are 6 mm. Specifications of the injection machine, a FANUC product, are shown in Table 5, and the injection process conditions of existing mass production is shown in Table 6.
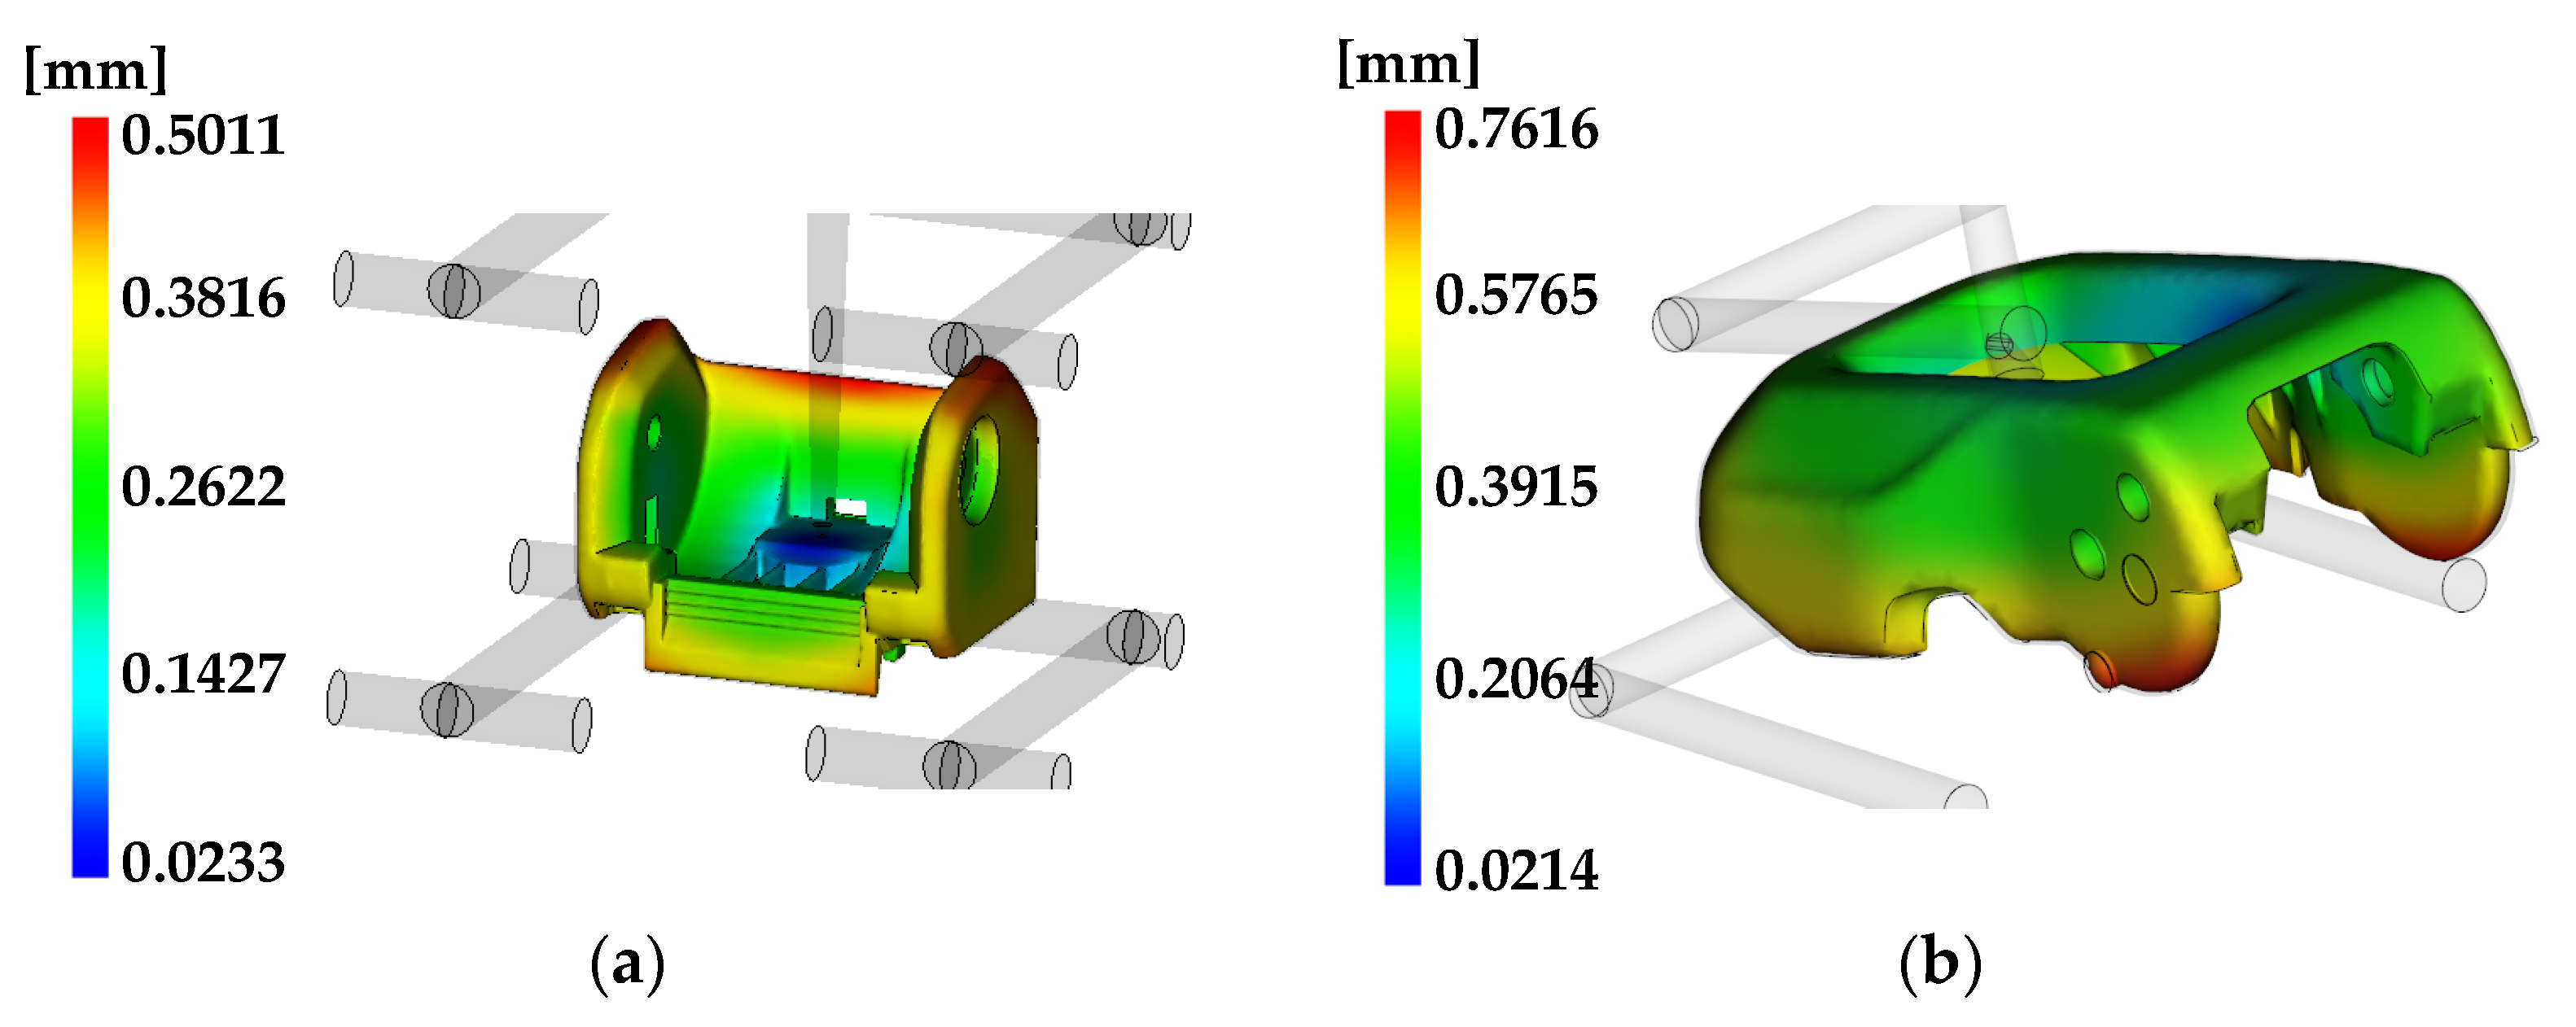
Total deflection results and measured values of dimensions 1, 2, and 3 from injection molding analysis of pivot sub-assembly and open lever, a nominal dimension of Figure 3 that is used in existing mass production, and injection process conditions of Table 6 are shown in Figure 5 and Table 7.
Results of our analysis are as follows. The measurements of the main dimensions of the pivot sub-assembly were dimension 1 = 47.32 mm, dimension 2 = 6.17 mm, and dimension 3 = 55.52 mm. Measurements of the open lever were dimension 1 = 46.55 mm, dimension 2 = 21.60 mm, and dimension 3 = 5.85 mm. None of the dimensions reached the target value except dimension 3 of the open lever, which indicates that it is necessary to secure dimensional accuracy. Dimension 3 of the open lever reached the target value, but it is adjacent to dimension 1 and 2 of the open lever that apply environmental variables and corrosion dimensions in actual injection molding, so it is required to be corrected all the same.
The average shrinkage rate result and path-line result were analyzed to select the shrinkage-rate constant, and are shown in Figure 6 and Figure 7. The average shrinkage rate result shows the average value of the surface and internal shrinkage rate. The result shows the shrinkage rate in all directions, such as the thickness and the vertical directions. The path-line result shows the melted resin flow as a line, which makes it possible to predict the internal density.
In the case of the pivot sub-assembly, the average shrinkage rate result is −0.9525~1.802% in the key dimensions 1–3, and the path-line result shows that the internal density is low because the line density is relatively low in the part relevant to the key dimensions.
In the case of the open lever, the average shrinkage rate result is −0.1242~3.031% in the key dimensions 1–3, and the path-line result shows that the internal density is low as in the pivot sub-assembly. Therefore, the internal density of the pivot sub-assembly and the open lever in the key dimensions is low, and it is judged that this affects the shrinkage rate in the thickness direction. In addition, it can be seen generally that the greater the distance from the gate, which means the longer the melt flow, the lower the line density. Therefore, not only material shrinkage rate, which is a material characteristic, but also length-to-volume ratio, which is a shape characteristic, were selected as the criteria for judging the shrinkage of the part.

2.3. Experimental Factors and Preparation of Table of Orthogonal Arrays

Experimental design is a technique that selects various factors affecting properties of the target products, and conducts experiments to find optimal conditions of the product in an economical manner; it is also called DOE (Design Of Experiments). Among them, Taguchi experiment design can significantly reduce the number of experiments compared to other experiment design frameworks by designing experimental conditions using tables of orthogonal arrays assuming that there is no interaction, and is characterized by the easy measuring of quality—depending on properties—through S/N (Signal to Noise) ratio analysis. To improve the injection molding process based on the existing process, Taguchi experiment design was used in this study [23,24].
Resin melt temperature, cooling time, and coolant temperature were selected as process parameters to select control parameters within the range of the injection machine’s molding process limits for the existing molding process of the pivot sub-assembly and open lever shown in Table 6. Resin melt temperature has a major effect on the shrinkage of melt resin and the time to reach ejection. The recommended melt temperature range of the BASF Ultramid 8266GHS used in the analysis is 270 °C to 295 °C, but in the case of the pivot sub-assembly, since the injection is performed with the bolt, shape deformation due to temperature deviation around the insert is avoided. To prevent this, the temperature selected was lower than the recommended temperature. Cooling time is a crucial process variable in considering part-deformation and cycle time [25]. As the cooling time was selected, the coolant temperature, not the mold temperature, was additionally selected as a process variable to consider the correlation with the cooling time. Therefore, Table 8 and Table 9 show control parameters and level values of the pivot sub-assembly and open lever, and experiment plans are accordingly made and shown in Table 10.

2.4. Shrinkage Ratio Selection Considering Both Material and Shape Characteristics and Part Modeling

The shrinkage rate of the part was selected based on both the material shrinkage rate of reinforced PA6 and the part shape shrinkage rate depending on the length-to-volume ratio.
In the case of material shrinkage rate, PA6 generally exhibits more significant shrinkage in the direction orthogonal to the flow than in the direction of the flow. As the GF content increases, the overall shrinkage decreases. According to the results of the previous study, the PA6 shrinkage rate was tested using disk-shaped specimens with diameters and thicknesses of 100 mm and 3.2 mm, respectively, by ASTM D 955. It shows that the shrinkage rate in the flow direction was about 0.25~0.58%, and in the direction orthogonal to the flow 0.45% to 0.62%, for the GF 10~30% reinforced PA6 [26]. The Ultramid 8266GHS used in this study is PA6 reinforced with MF 25%/GF 15% and has a shrinkage rate of 0.4% without considering the flow direction. However, since the shrinkage in the orthogonal direction to the flow is generally large, we selected 0.62%, which is the maximum shrinkage.
In the case of shrinkage rate, considering the shape characteristic depends on the length-to-volume ratio, the length-to-volume ratio of the disk specimen of ASTM D 955 is 3.98 × 10⁻³. Since the pivot sub-assembly and the open lever are 1.24 × 10⁻³ and 3.10 × 10⁻³, respectively, they appear as ratios of 0.31 and 0.78 to the length-to-volume ratio of the disk specimen in ASTM D 955. To simultaneously consider the shrinkage rate according to both the material characteristics of reinforced PA6 and part-shape characteristics depending on the length-to-volume ratio, the maximum shrinkage rate of 0.62% was calculated as the length-to-volume ratio, and the pivot sub-assembly and the open lever were 0.19% and 0.48%, respectively. However, the approximate values of 0.2% and 0.5% were selected for part modeling.
From this, the length-to-volume ratio of the disk-shaped specimen, pivot sub-assembly, and the open lever is 3.98 × 10⁻³:1.24 × 10⁻³:3.10 × 10⁻³, expressed as a ratio of 1:0.77:0.31. By applying the PA6 maximum shrinkage rate of 0.62%—which was the result of the shrinkage test using a disk-shaped specimen—to each rate, the pivot sub-assembly was selected as 0.2% and the open lever as 0.5% shrinkage. At this point, to confirm the result of the shrinkage rate, shrinkage-rate constants of both the pivot sub-assembly and the open lever were applied and modeled, respectively. The approximate values of the key dimensions 1, 2, and 3 for the joint part, according to part modeling with the shrinkage rate correction, are shown in Table 11.

3. Analysis Results

3.1. Analysis of Nominal Dimension Parts for Process Condition Selection

3.1.1. Injection Flow Analysis Applying Experiments Design

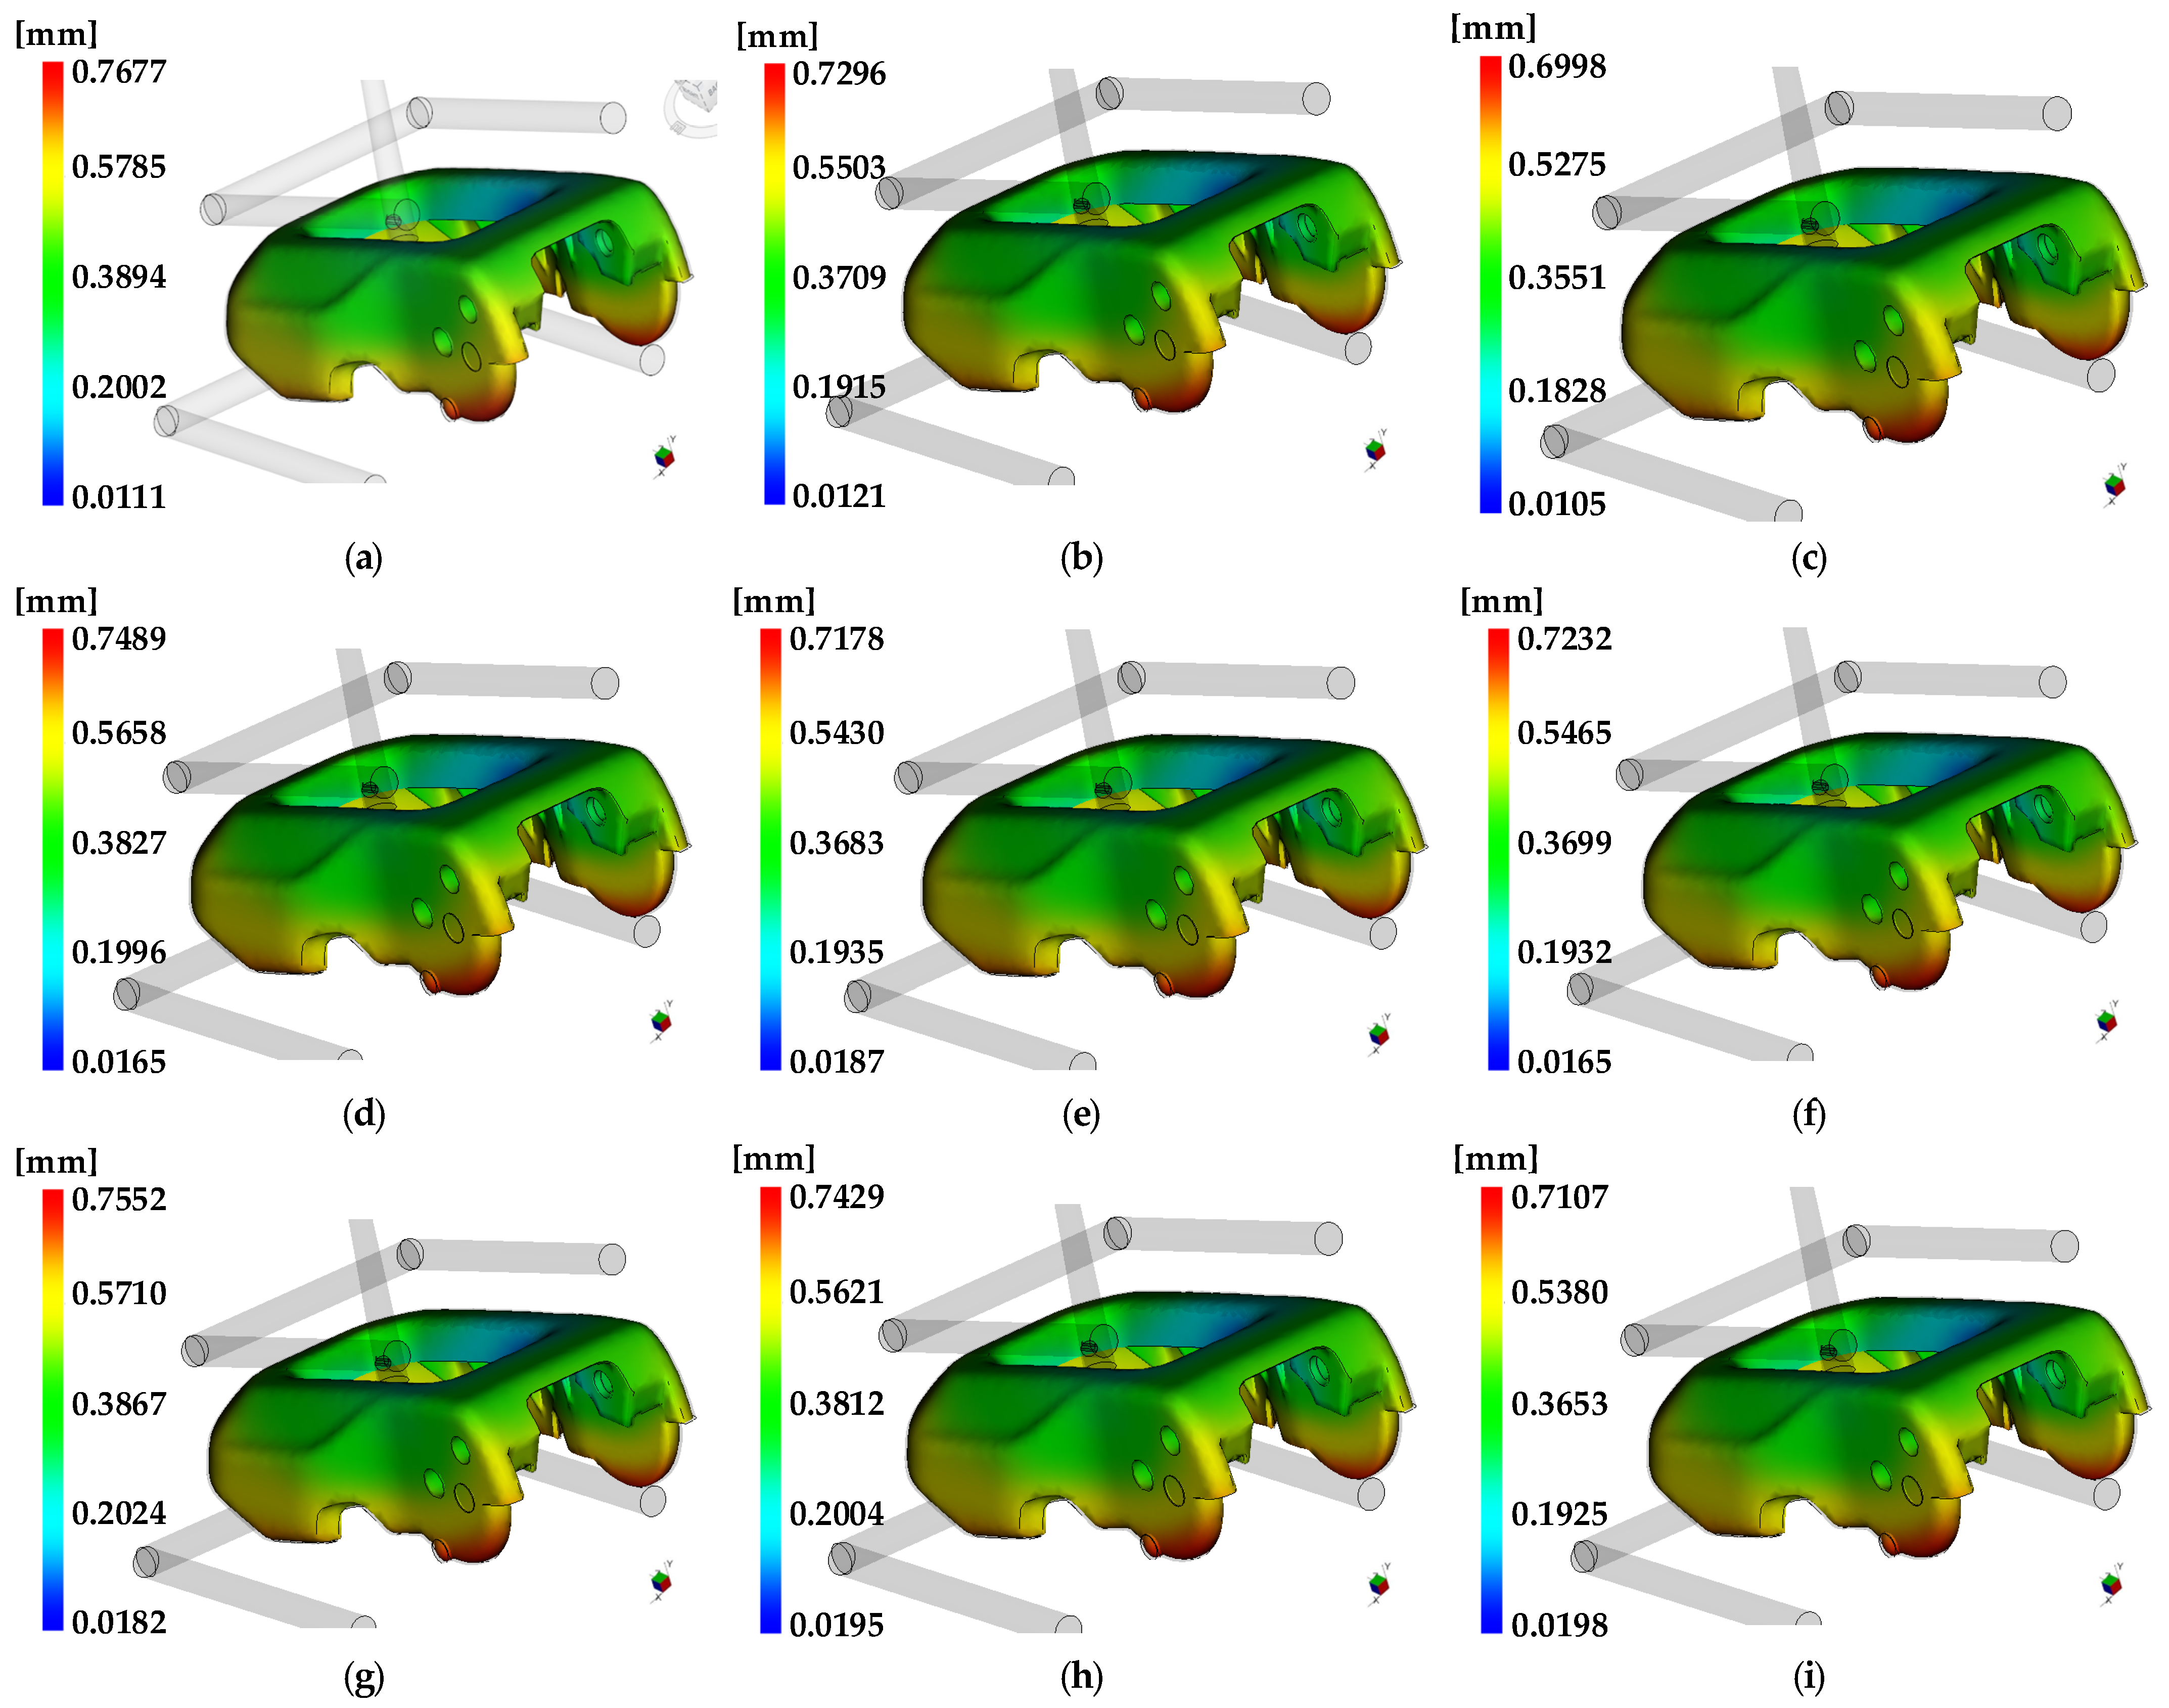
Results of injection analysis using Moldflow for each level combination are shown in Figure 8 for the pivot sub-assembly and Figure 9 for the open lever, and key dimensions are shown in Table 12.

3.1.2. Setting Process Conditions by S/N Ratio Analysis

The most suitable process was selected by applying a Taguchi nominal-is-best loss function in Equation (1) and comparing S/N ratio since it should reach a specific value to achieve the target value of key dimension 1, 2 and 3:
S / N = 10   log ( 1 n i = 1 n ( y i m ) 2 )
where y indicates analysis result value, n indicates the number of analysis and m refers target value.
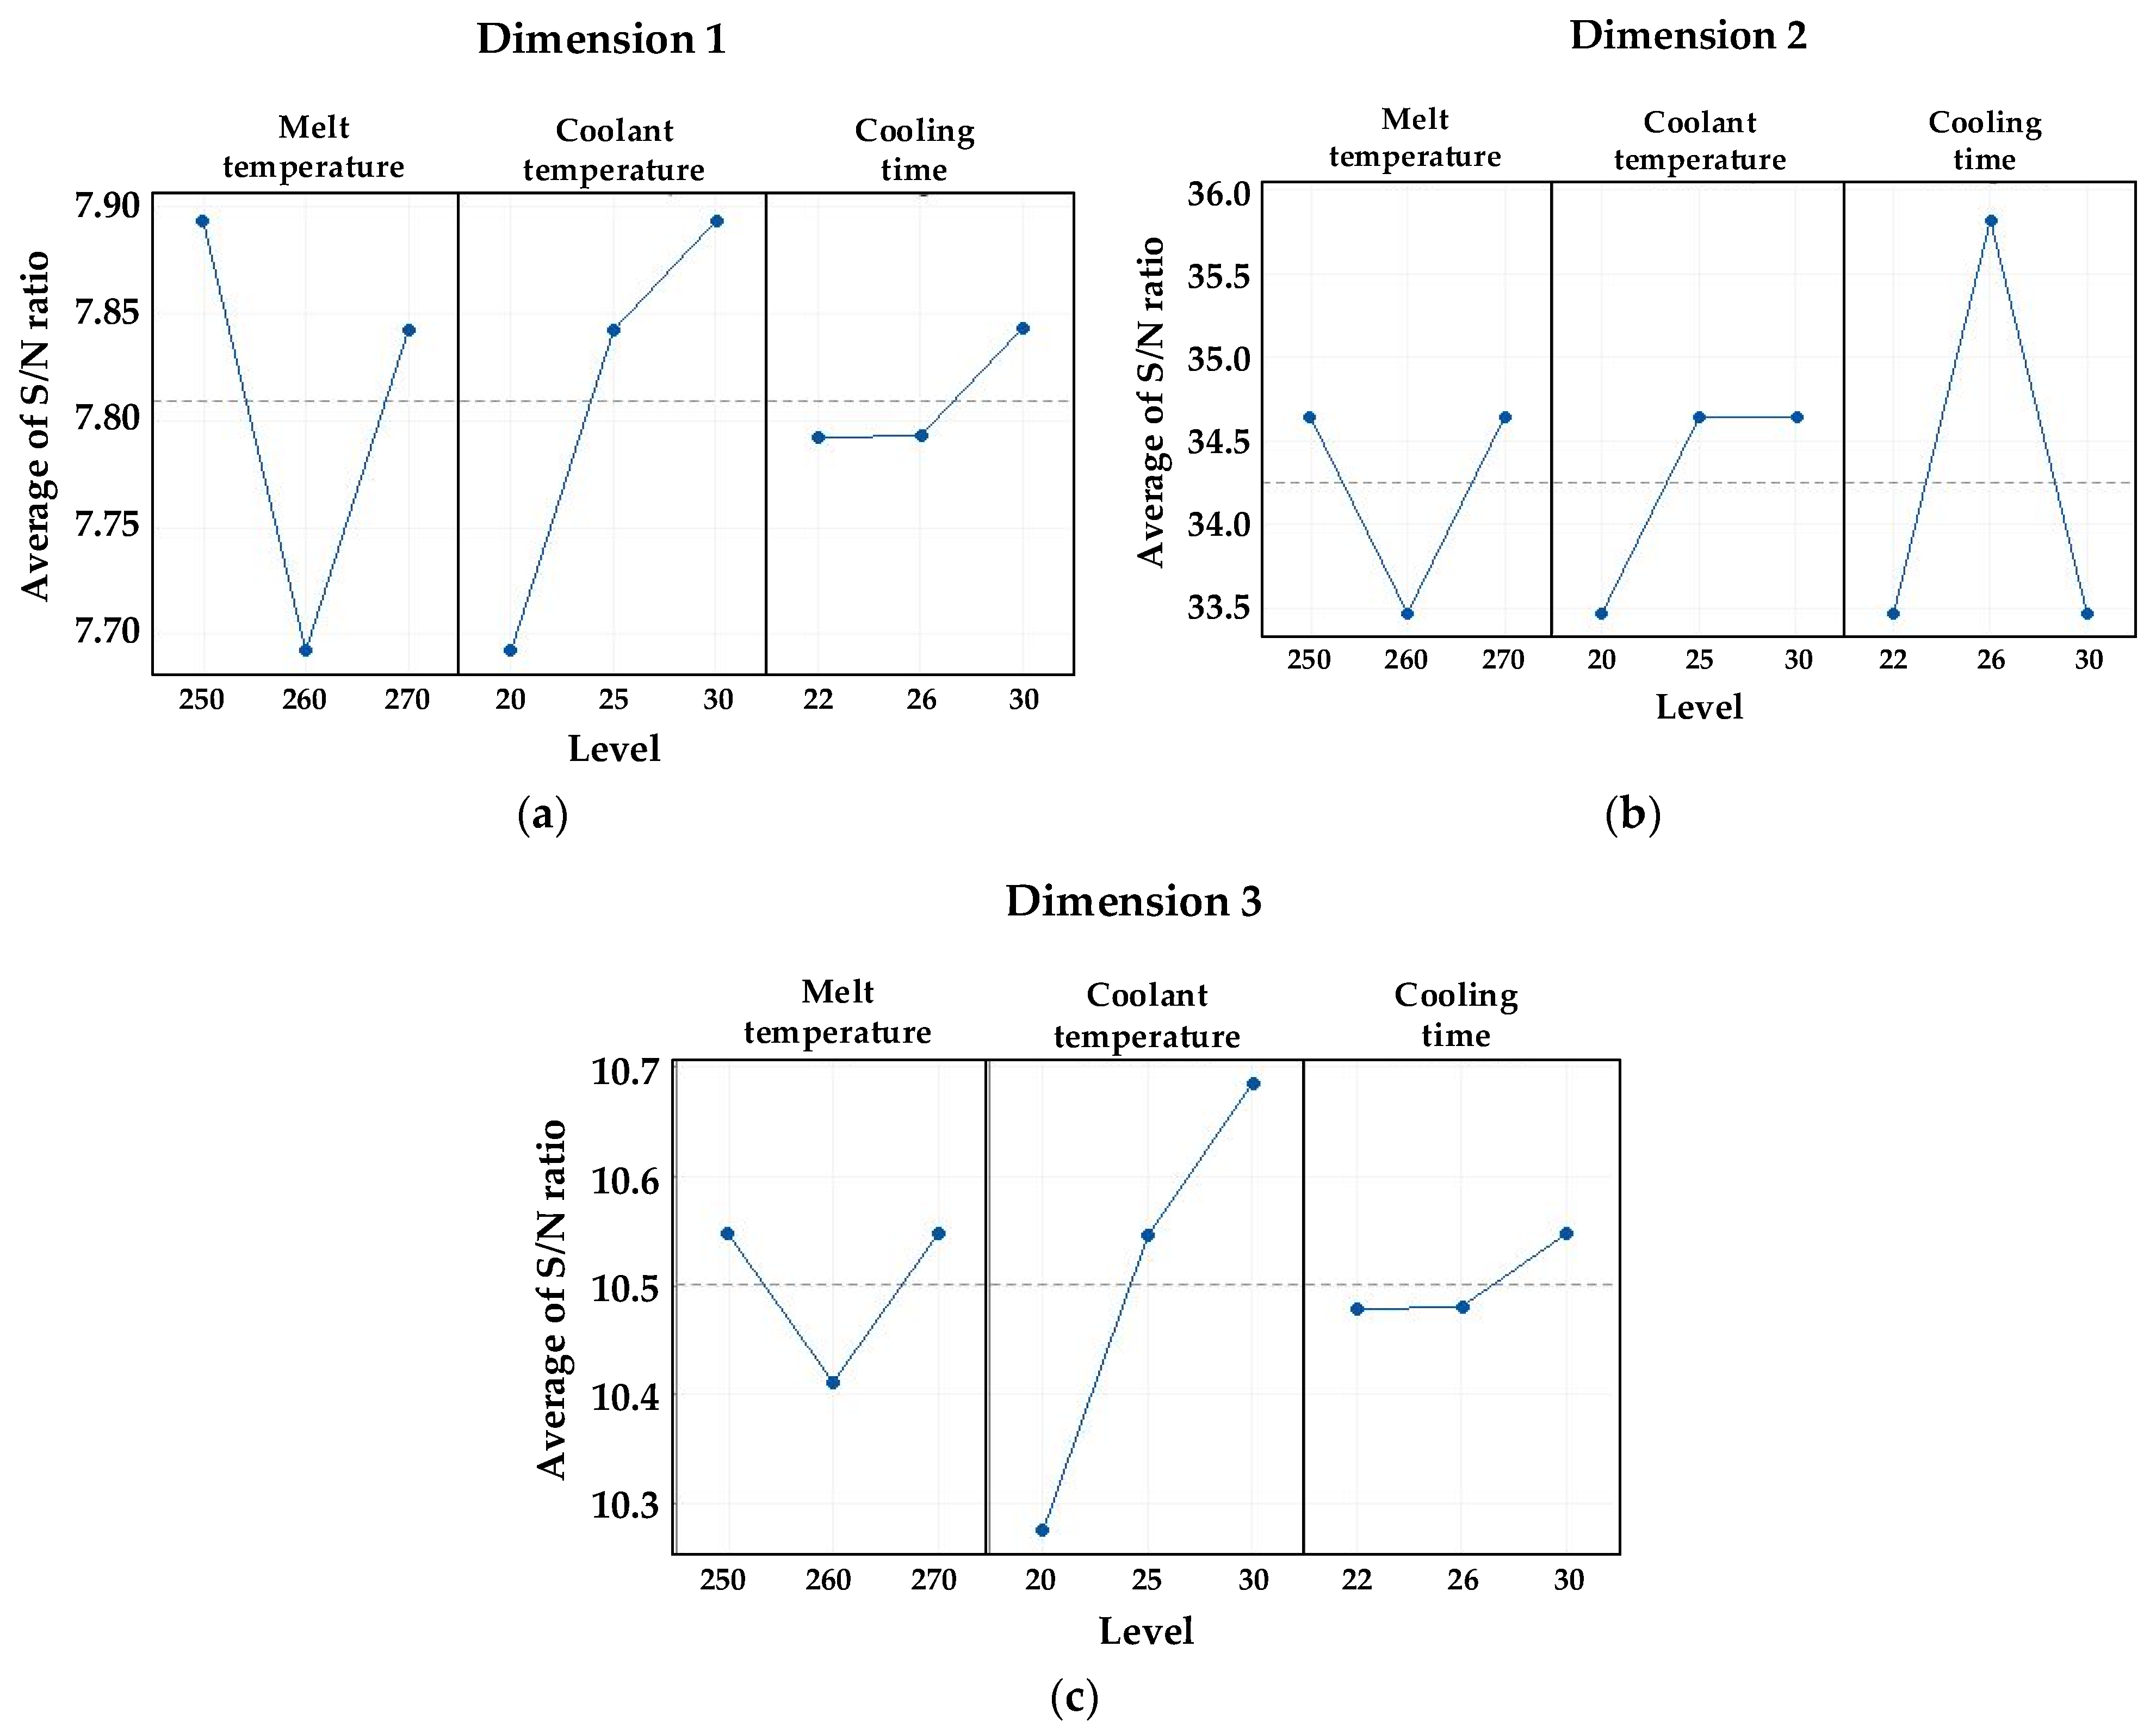
Table 13, Table 14 and Table 15 is S/N ratio results for dimensions 1, 2 and 3 of pivot sub-assembly. In order to select the optimal process, the average S/N ratio for each level of the factor was compared, and it is presented in Figure 10 and Table 16.
The effect on dimension 1 showed significance in the order of melt temperature, cooling time, and coolant temperature, and the process conditions with the maximum S/N ratio were melt temperature = 250 °C, coolant temperature = 30 °C, and cooling time = 30 s.
The effect on dimension 2 showed significance in the order of melt temperature, cooling time, and coolant temperature, and the process conditions with the maximum S/N ratio were melt temperature = 250 °C and 270 °C, coolant temperature = 25 °C and 30 °C, and cooling time = 26 s.
The effect on dimension 3 showed significance in the order of melt temperature, cooling time, and coolant temperature, and the process conditions with the maximum S/N ratio were melt temperature = 250° C and 270 °C, coolant temperature = 30 °C, and cooling time = 30 s.
The melt temperature was the same for dimensions 2 and dimension 3 as 250 °C and 270 °C, but the S/N ratio for dimension 1 is the highest at 250 °C. Therefore, 250 °C was selected as melt temperature.
The coolant temperature that presented the maximum S/N ratio for dimensions 1 and 3 was 30 °C; dimension 2 had the same value of 25 °C. Considering dimension 1 and 3, 30 °C was selected as the coolant temperature.
The cooling time was 30 s for dimensions 1 and 3, and 26 s for dimension 2. The differences in S/N ratio between 26 s and 30 s in dimensions 1, 2, and 3 were 0.051, 2.35, and 0.07, demonstrating that the effect on dimension 2 is quite high. Therefore, 26 s was selected for the cooling time.
As a result of these, the optimal process conditions were found to be melt temperature 250 °C, coolant temperature 30 °C, and cooling time 26 s by considering all the dimensions of pivot sub-assembly.
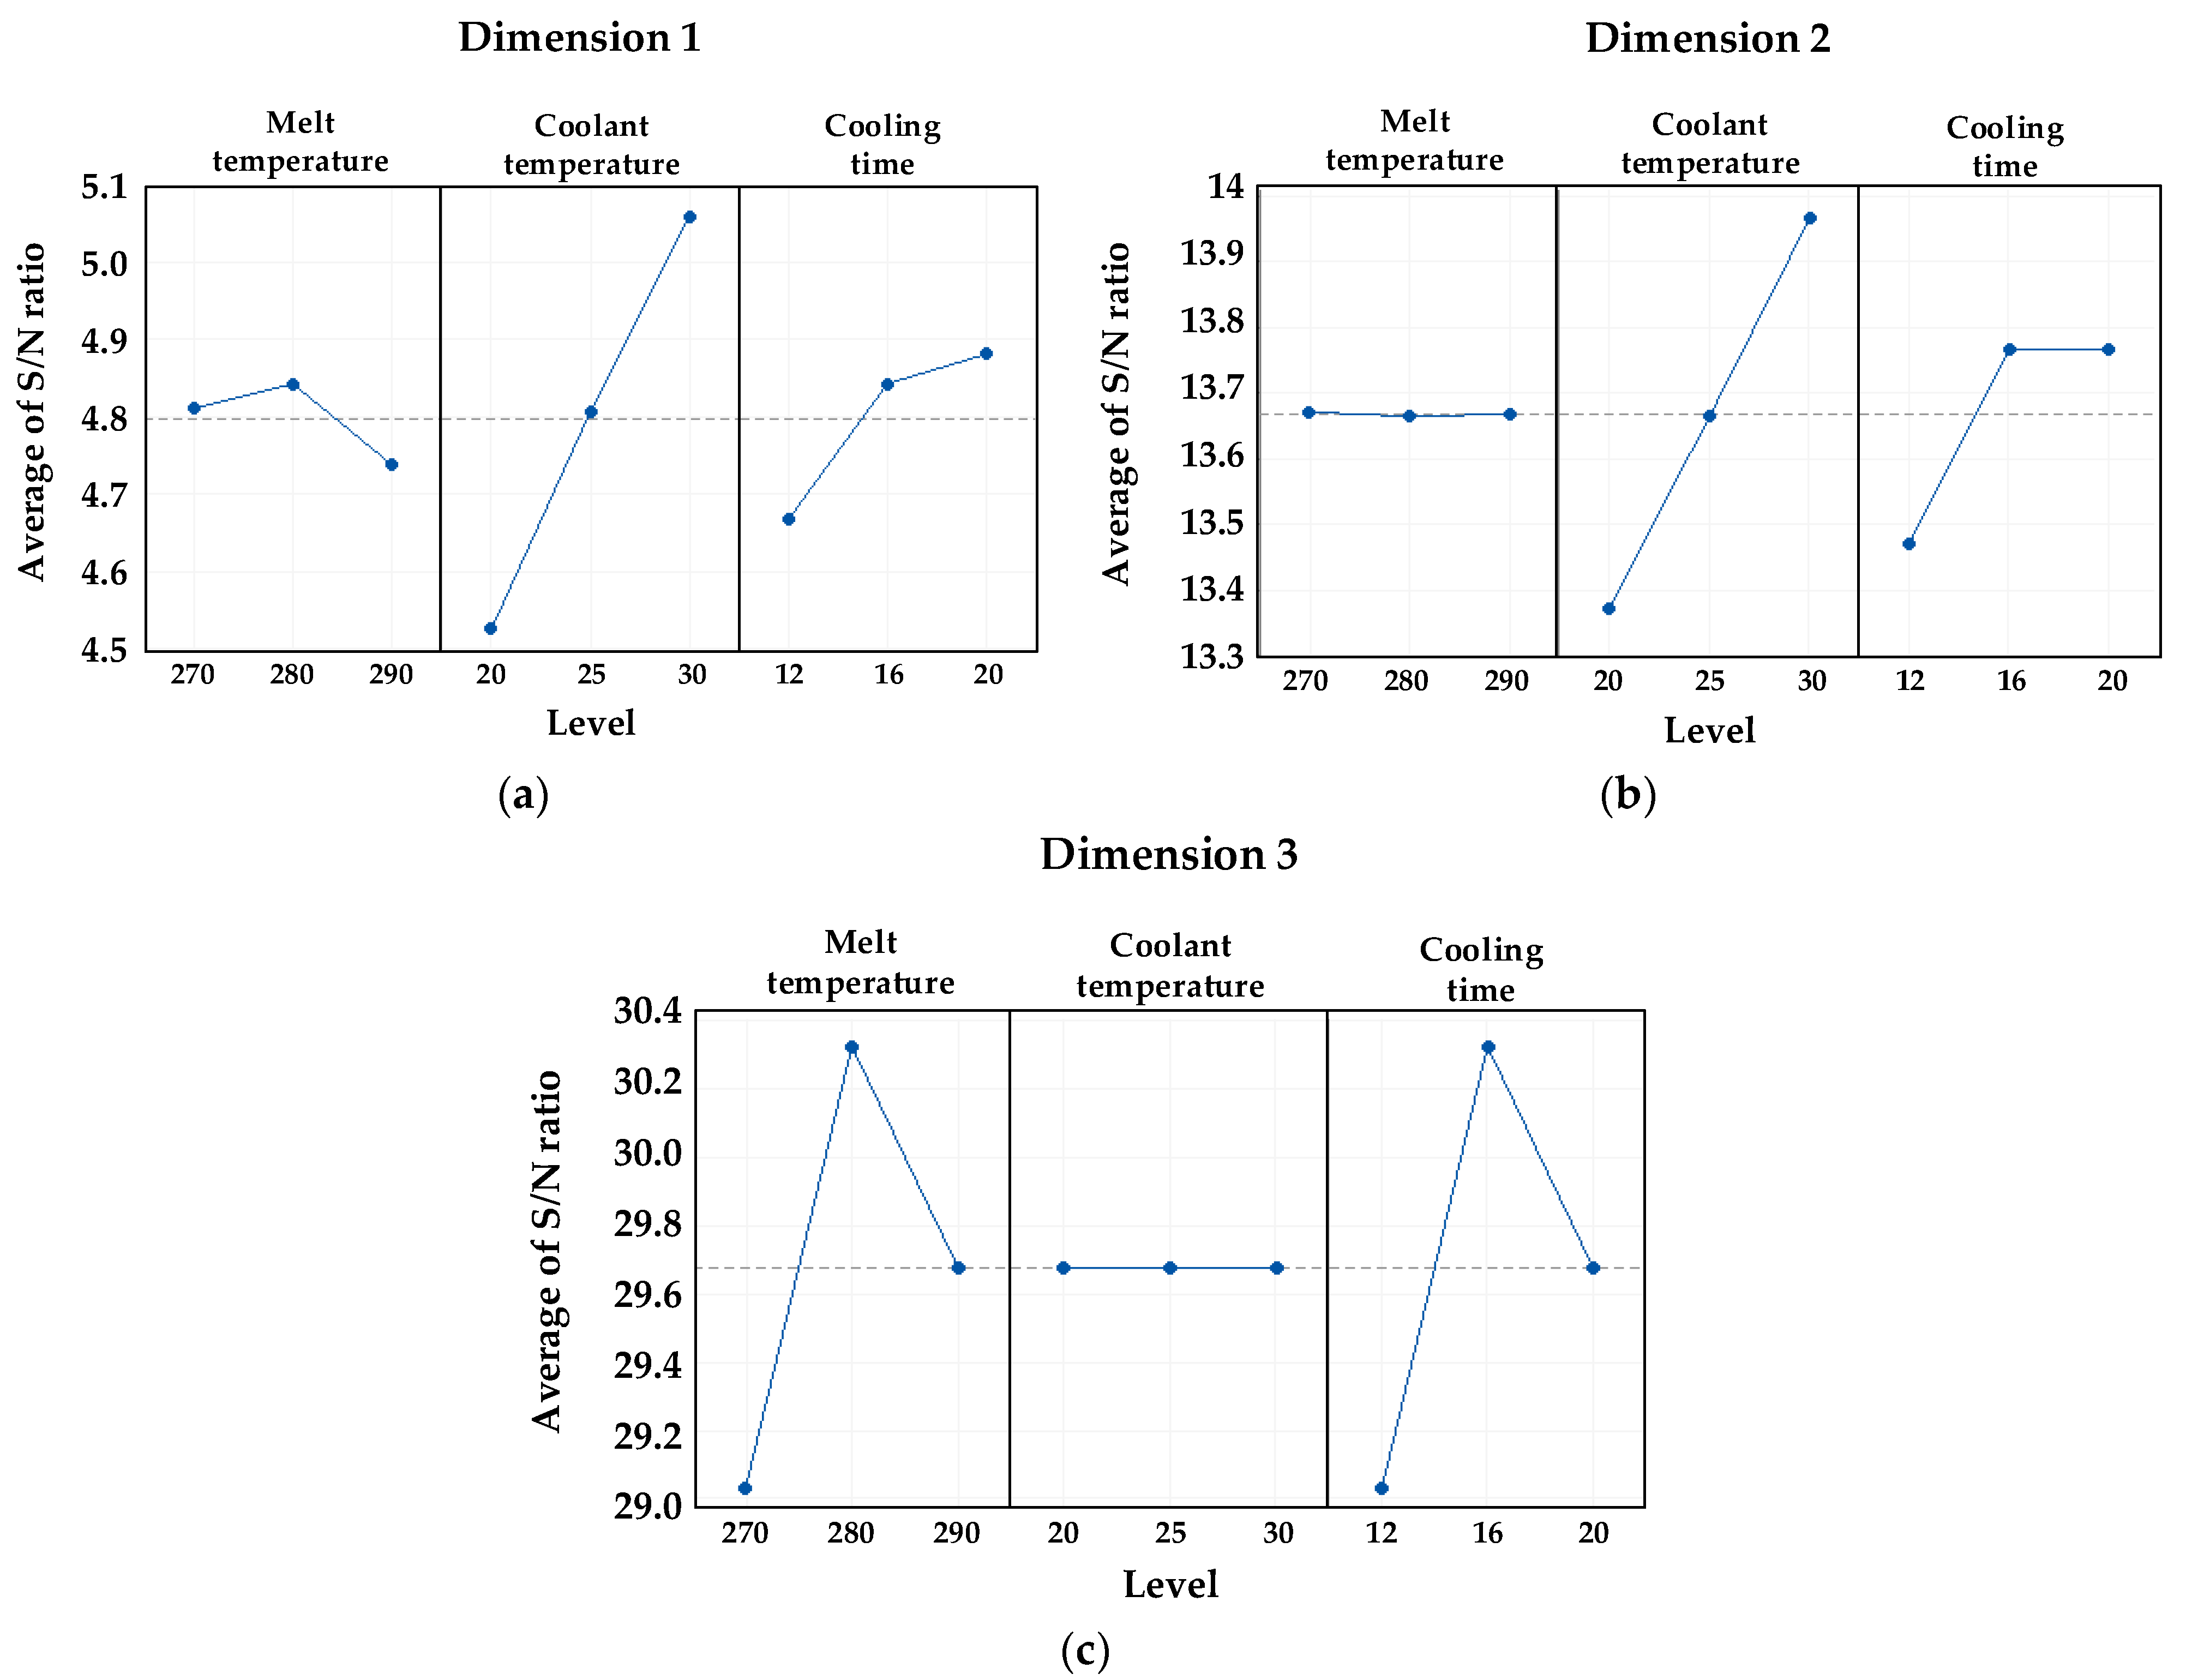
Table 17, Table 18 and Table 19 contain the S/N ratio results for dimensions 1, 2, and 3 of the open lever. In order to select the optimal process, the average S/N ratio for each level of the factor were compared, and are presented in Figure 11 and Table 20.
The effect on the dimension 1 showed significance in the order of melt temperature, cooling time, and coolant temperature, and the process conditions with the maximum S/N ratio were melt temperature = 280 °C, coolant temperature = 30 °C, and cooling time = 20 s.
The effect on the dimension 2 showed significance in the order of melt temperature, cooling time, and coolant temperature, and the process conditions with the maximum S/N ratio were melt temperature = 270 °C and 290 °C, coolant temperature = 30 °C, and cooling time = 16 s and 20 s.
The effect on the dimension 3 showed significance in the order of melt temperature, cooling time, and coolant temperature, and the process conditions with the maximum S/N ratio were melt temperature = 280 °C and cooling time = 16 s. All coolant temperatures have the same value for S/N ratio at each level.
The melt temperature is the same for dimensions 1 and 3 at 280 °C, but the S/N ratio for dimension 2 is the highest at both 270 °C and 290 °C. However, the S/N ratio average difference between these two values and 280 °C was 0.01, which is not significant. Therefore, when considering dimension 1 and dimension 3 together, it is appropriate to select 280 °C for the melt temperature.
As for the coolant temperature, 30 °C presented the maximum S/N ratio, except for dimension 3, so 30 °C was selected considering other factors.
The cooling time is 20 s for dimension 1, 16 s and 20 s for dimension 2, and 16 s for dimension 3. However, the difference in S/N ratio between 16 s and 20 s in dimension 3 is larger than in dimension 1. Therefore, 16 s was selected for the cooling time.
As a result of these tests, the optimal process conditions were chosen as melt temperature 280 °C, coolant temperature 30 °C, and cooling time 16 s when considering dimensions 1, 2, and 3 of the open lever.
Therefore, the S/N ratio was the maximum for the dimension 1, 2, and 3 in this study, and the process conditions with maximum S/N ratio and minimum cycle time were melt temperature 250 °C, coolant temperature 30 °C, and cooling time 26 s for pivot sub-assembly and melt temperature 280 °C, coolant temperature 30 °C, and cooling time 16 s for the open lever. However, the material shrinkage was not considered in the parts-applied nominal dimension, so dimensional target values were not satisfied except for dimension 2 of the pivot sub-assembly and dimension 3 of the open lever. Therefore, it is necessary to secure dimensional accuracy by modeling dimensional correction values for the pivot sub-assembly and open lever that consider the 0.2% and 0.5% shrinkage rates. Dimension 2 of the pivot sub-assembly and dimension 3 of the open lever satisfy the target value, but it is adjacent to other target dimension sections that apply the shrinkage-rate constant in actual injection molding, so it should be corrected to be the same.

3.2. Analysis Results of Applying 0.2% Shrinkage

3.2.1. Pivot Sub-Assembly

When the 0.2% shrinkage-rate constant is considered for the pivot sub-assembly, dimension 1 is 48.01 mm, dimension 2 is 6.09 mm, and dimension 3 is 56.12 mm. The overall deflection results after applying the process conditions of melt temperature 250 °C, coolant temperature 30 °C, and cooling time 26 s selected in Section 3.1 are shown in Figure 12, and key dimensional measurement values are shown in Table 21.
As a result of analysis, the overall deflection ranged from a minimum of 0.0511 mm to a maximum of 0.4516 mm, and it was confirmed that dimensions 1, 2, and 3 satisfied the target value.

3.2.2. Open Lever

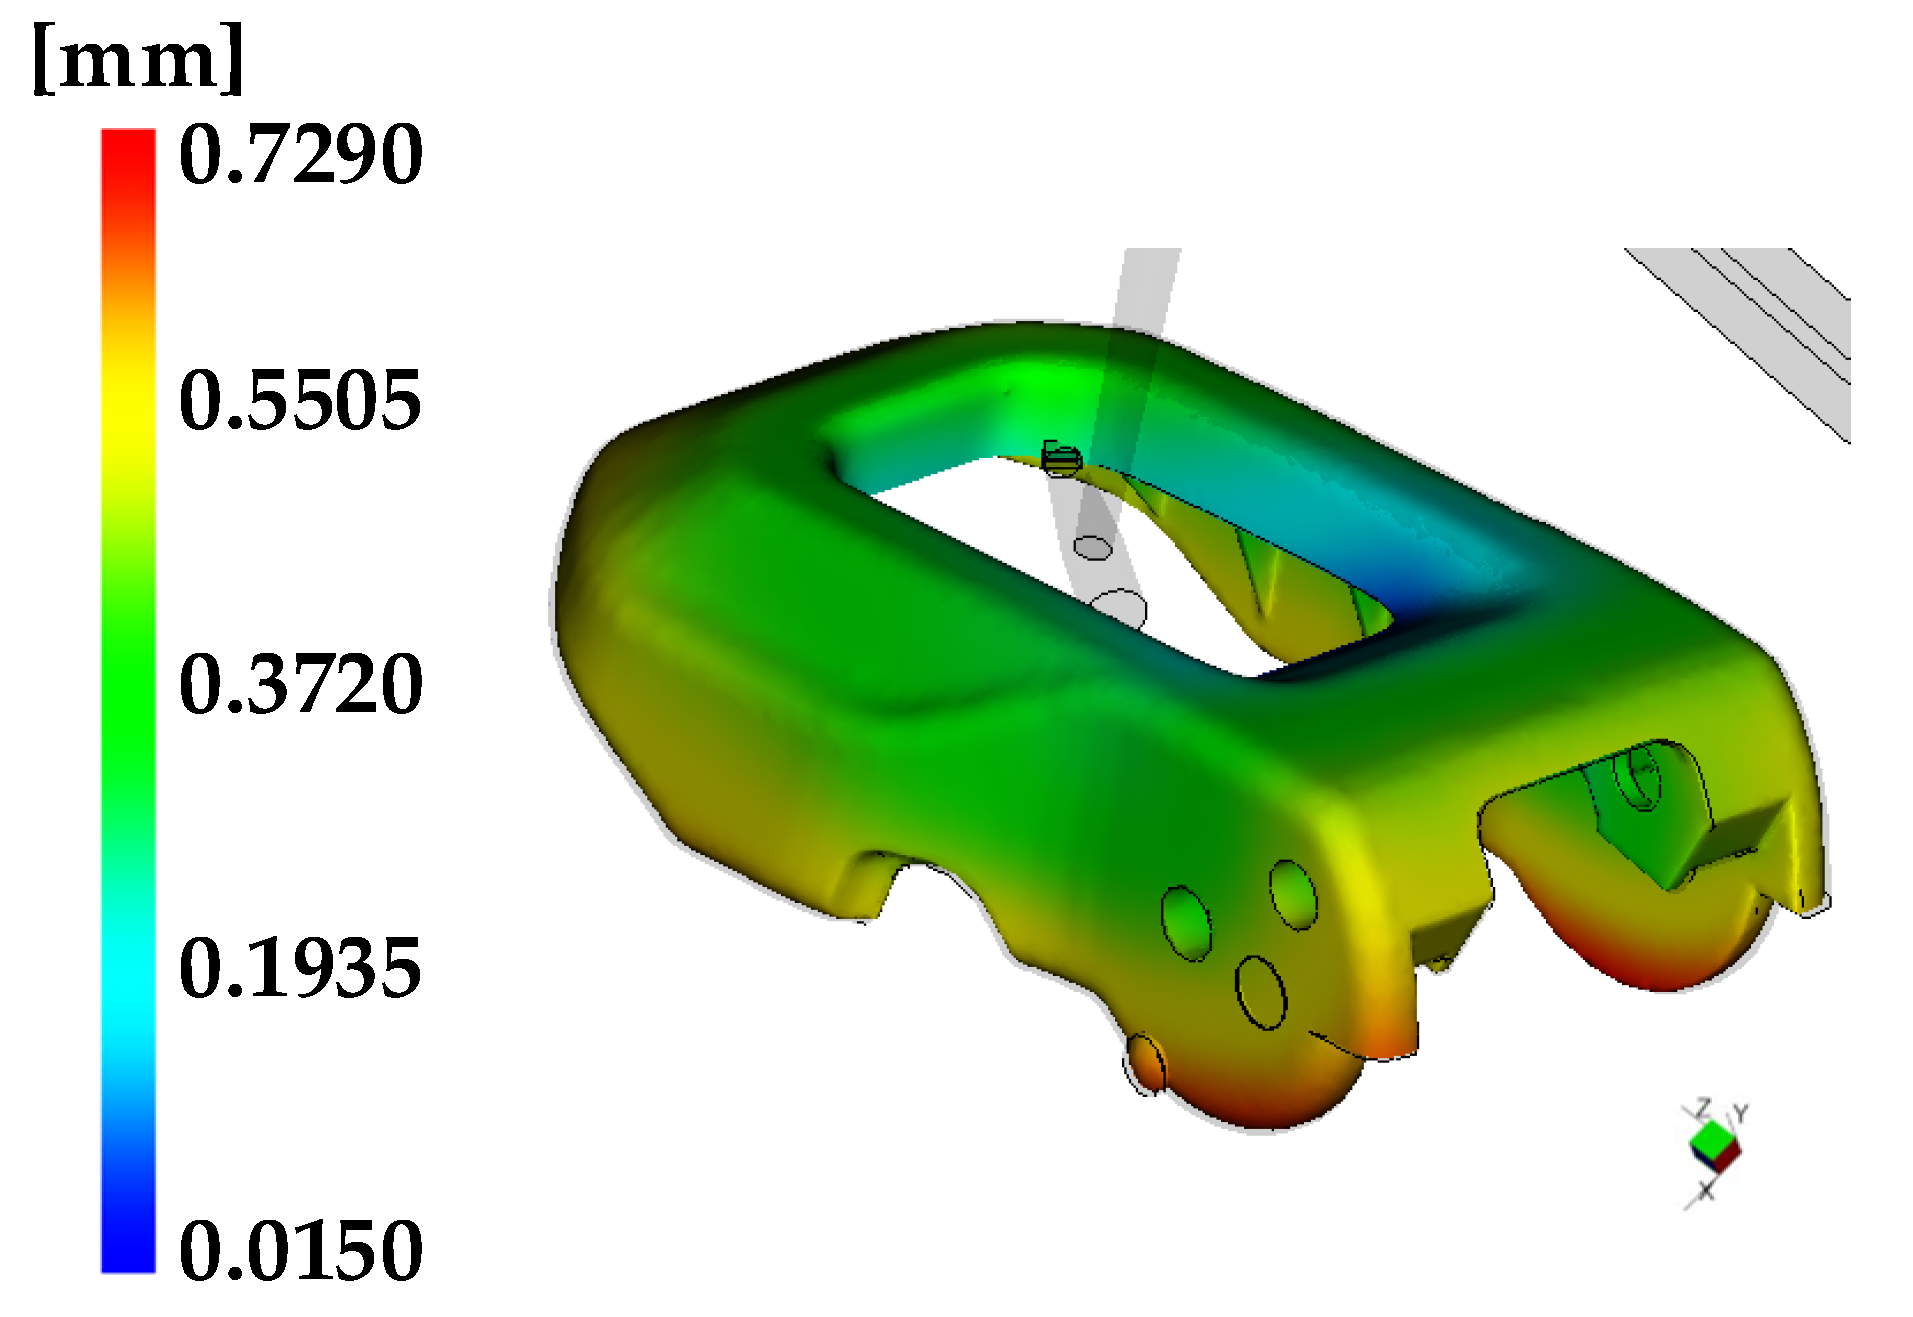
When the 0.2% shrinkage-rate constant is considered for the open lever, dimension 1 is 47.50 mm, dimension 2 is 21.94 mm, and dimension 3 is 5.79 mm. The overall deflection results from applying the process conditions of melt temperature 280 °C, coolant temperature 30 °C, and cooling time 16 s selected in Section 3.1 are shown in Figure 13 and key dimensional measurement values are shown in Table 22.
As a result of the analysis, the overall deflection was minimum 0.0150 mm to maximum 0.7290 mm, and it was confirmed that the dimension 3 satisfied the target value. However, the dimension 1 and 2 failed to satisfy the target value.

3.3. Analysis Results of Applying 0.5% Shrinkage

3.3.1. Pivot Sub-Assembly

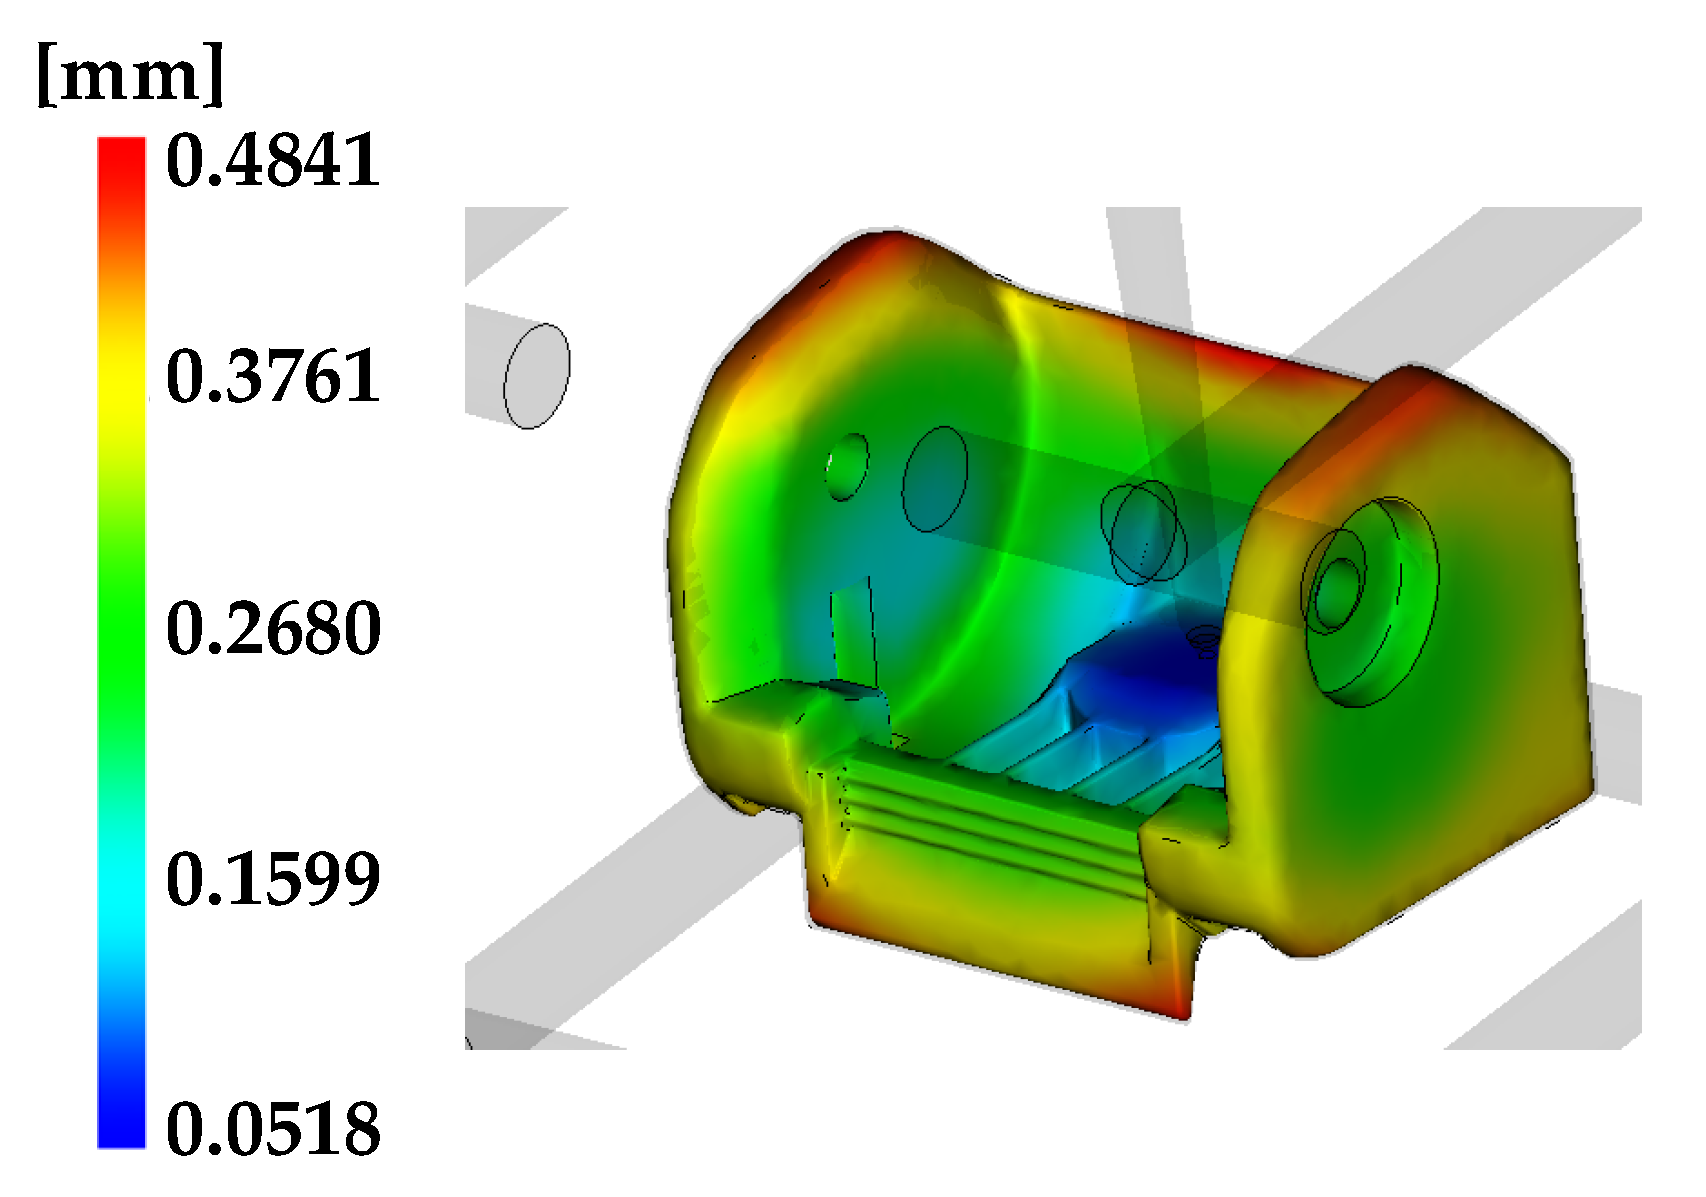
When the 0.5% shrinkage-rate constant is considered for pivot sub-assembly, dimension 1 is 48.14 mm, dimension 2 is 6.07 mm, and dimension 3 is 56.28 mm. The overall deflection results that apply the process conditions of melt temperature 280 °C, coolant temperature 30 °C, and cooling time 26 s selected in Section 3.1 are shown in Figure 14, and key dimensional measurement values are shown in Table 23.
As a result of the analysis, the overall deformation dimension was minimum 0.0518 mm to maximum 0.4841 mm, and it was confirmed that all of dimension 1, 2 and 3 satisfied the target value.

3.3.2. Open Lever

When a 0.5% shrinkage-rate constant is considered for the open lever, the dimension 1 is 47.63 mm, dimension 2 is 22.01 mm and dimension 3 is 5.77 mm. The overall deflection results that apply the process conditions of melt temperature 280 °C, coolant temperature 30 °C, and cooling time 16 s selected in Section 3.1 are shown in Figure 15 and key dimensional measurement values are shown in Table 24.
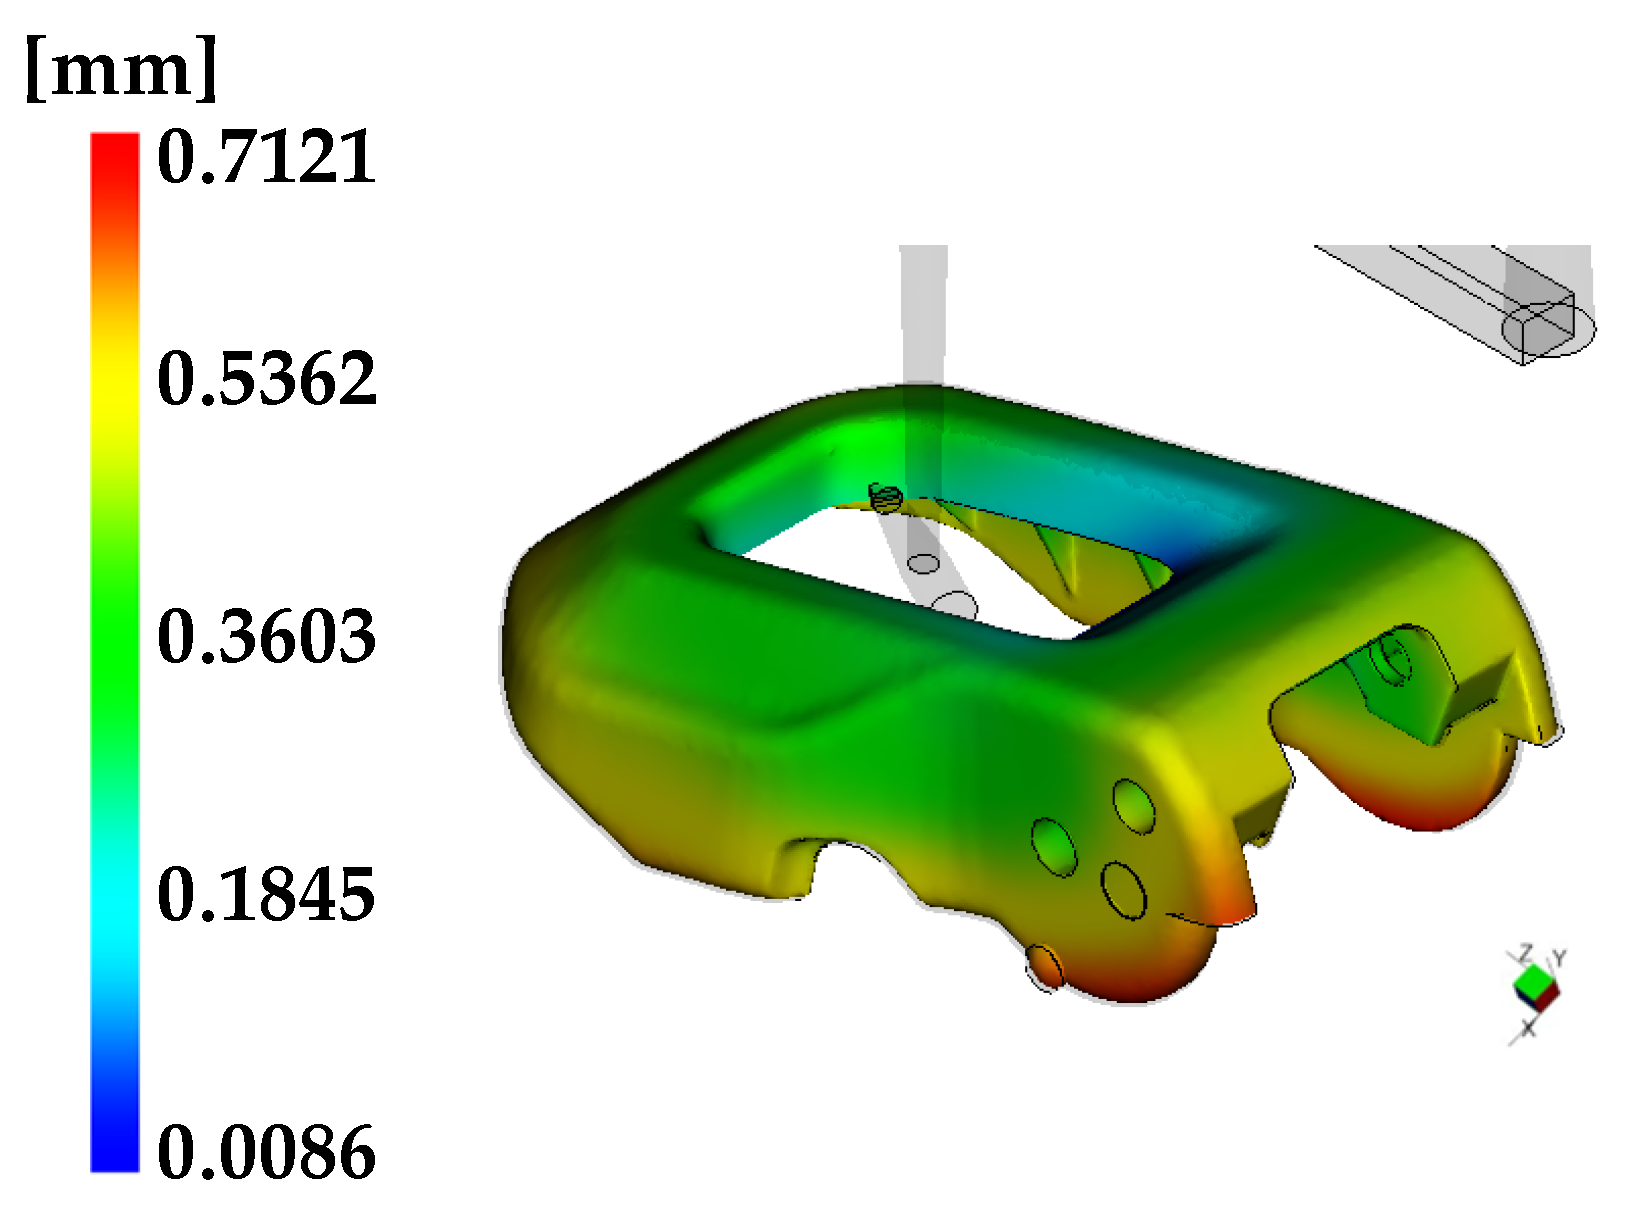
As a result of the analysis, the overall deflection ranged from a minimum of 0.0086 mm to a maximum 0.7121 mm, and it was confirmed that dimensions 1 and 3 satisfied the target value. However, dimension 2 has still failed to satisfy the target value.
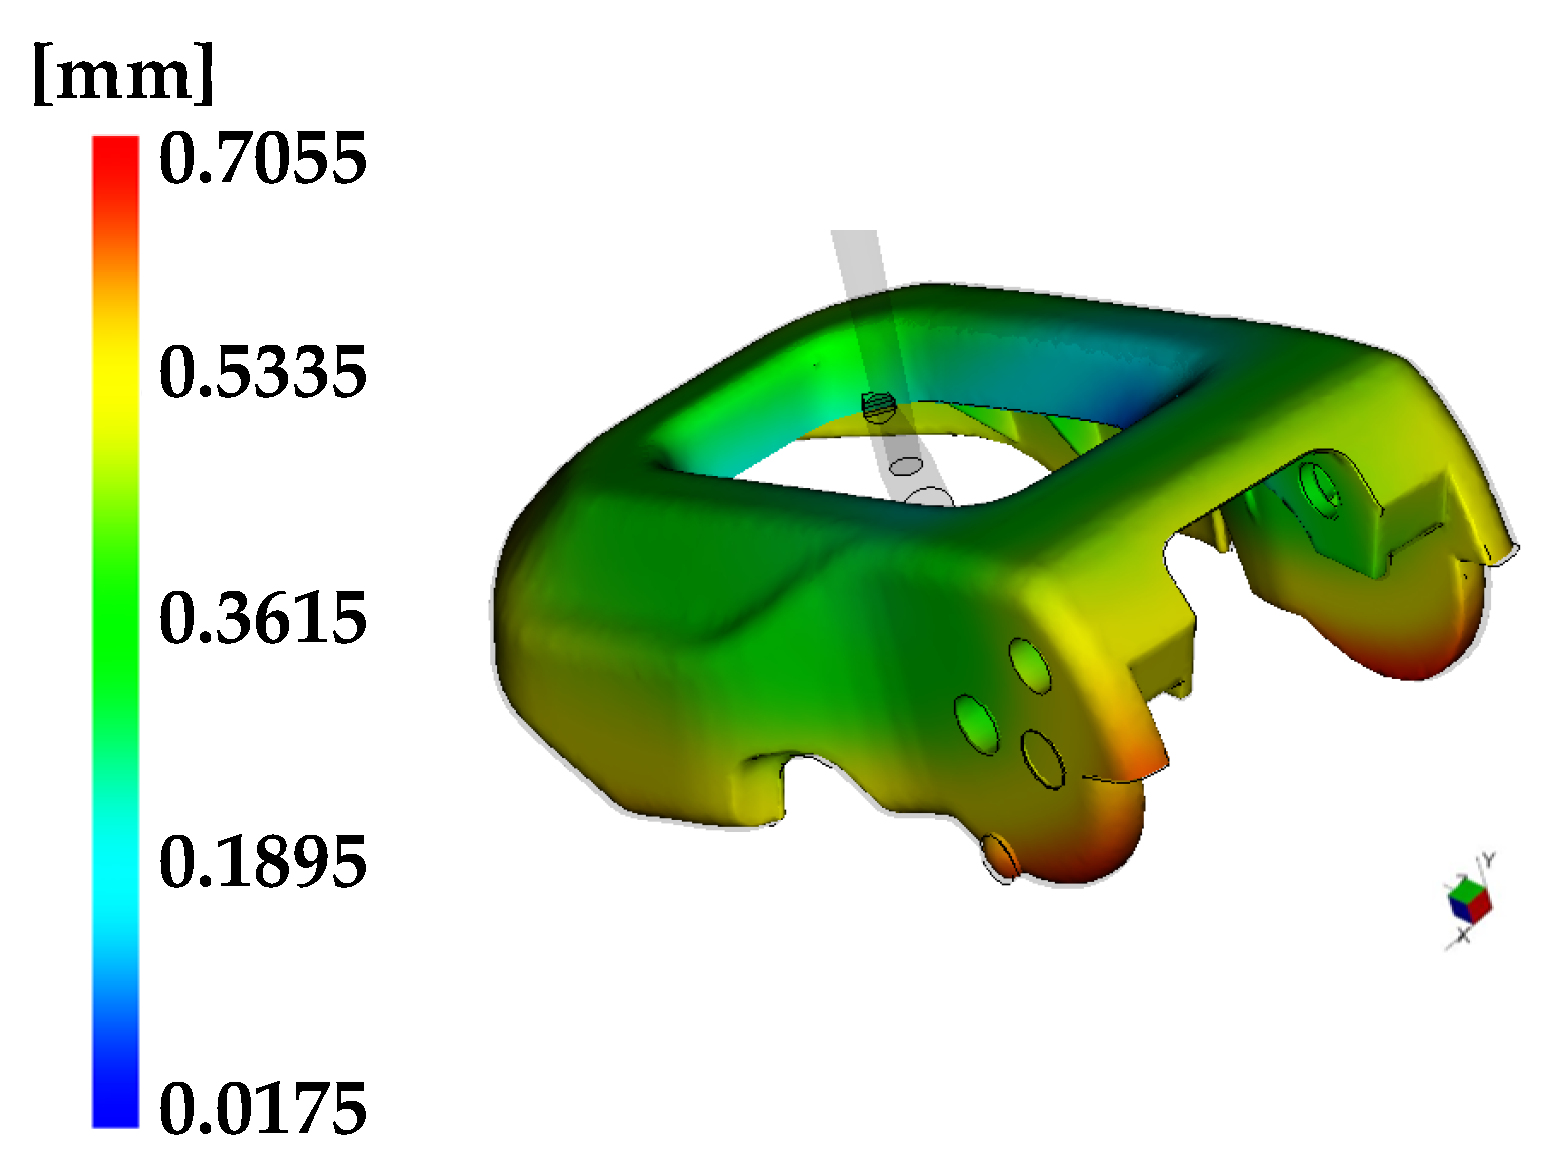
This is because amorphous resin and crystal resin tend to have greater warpage if the rectangular rib exists on a flat plate [27,28]. in Figure 13 and Figure 15, which show the analysis results, it was found that rectangular ribs were reinforced in the area of dimension 2 of the open lever, and deflection was greater in the part where the rectangular ribs are connected. Due to this, the warpage for the section containing dimension 2 was great, and it was predicted that the target value would not be satisfied. Therefore, for the open lever, the dimension was corrected for 0.3 mm which did not satisfy the target value of dimension 2. Therefore, 47.63 mm for dimension 1, 22.31 mm for dimension 2, and 5.77 mm for dimension 3 were applied. Deflection results of injection molding analysis applying the same process conditions are shown in Figure 16 and key dimensional measurement values are shown in Table 25.
As a result of the analysis, the overall deflection ranged from a minimum of 0.0175 mm to a maximum of 0.7055 mm, and it was confirmed that all the dimensions reached the target value.

3.4. Analysis of Results for Injection Molding Analysis

For the pivot sub-assembly, the process with the maximum S/N ratio was found to be melt temperature 250 °C, coolant temperature 30 °C, and cooling time 26 s according to the results of injection molding analysis applying DOE. As a result of applying the process to corrected modeling by considering the 0.2% and 0.5% shrinkage rate-constant, dimensions 1, 2, and 3 all satisfied the target value. Both models achieve the target dimensions, but modeling that considered the 0.2% shrinkage-rate constant had the advantage of reduced material usage. Therefore, modeling that considered the 0.2% shrinkage-rate constant was selected.
For the open lever, the process with the maximum S/N ratio was found to be melt temperature 280 °C, coolant temperature 30 °C, and cooling time 16 s according to the results of injection molding analysis applying experiment design. As a result of applying the process to corrected modeling by considering 0.2% and 0.5% of shrinkage, dimensions 1 and 2 failed to reach the target value in the modeling that considered 0.2% of shrinkage, and all dimensions except dimension 2 satisfied the target value in the modeling that considered 0.5% of shrinkage. In dimension 2, about 0.2 mm out of the target value was additionally corrected due to the greater warpage and shrinkage deformation with the rectangular rib reinforcement, and the results of injection molding analysis applying the above modeling showed that dimensions 1, 2, and 3 all satisfied the target value. Therefore, the modeling that considered 0.5% shrinkage and additionally corrected dimension 2 was selected.
Therefore, the length-to-volume ratios of the pivot sub-assembly and the open lever are 1.24 × 10⁻³ and 3.10 × 10⁻³, respectively, and it is confirmed that the suggested shrinkage rates of 0.2% and 0.5%, which consider material shrinkage rate and part shrinkage rate depending on length-to-volume ratio at the same time, are applicable.

4. Verification of Injection Molding Analysis Results

To examine the conditions selected through injection molding analysis, a mold was manufactured and experiments for comparing the dimensions were conducted.
The Capability of Process Katayori (CPK) calculation formula is presented as Equations (2)–(4), which is a capability index that tells how well the target can meet specification limits.
C P = S U S L 6 σ
σ = X i 2 ( X i ) 2 n n 1
  K = | ( S U S L ) 2 X ¯ ( S U S L ) 2 |
Here, S U indicates upper specification limit, S L indicates lower specification limit, n indicates the number of samples, X indicates the average of data value, X i indicates the sum of data value, and X i 2 indicates the sum of squares of each data.
The error rate means the difference between the actual injection molded part (product) and the value measured in the simulation as a percentage. The formula for calculating the error rate is presented as Equation (5).
E r r o r   r a t e = | a p p r o x i m a t e e x a c t | e x a c t   ×   100  
Here, a p p r o x i m a t e means simulated measurements and e x a c t means measurements on actual injection molded parts.
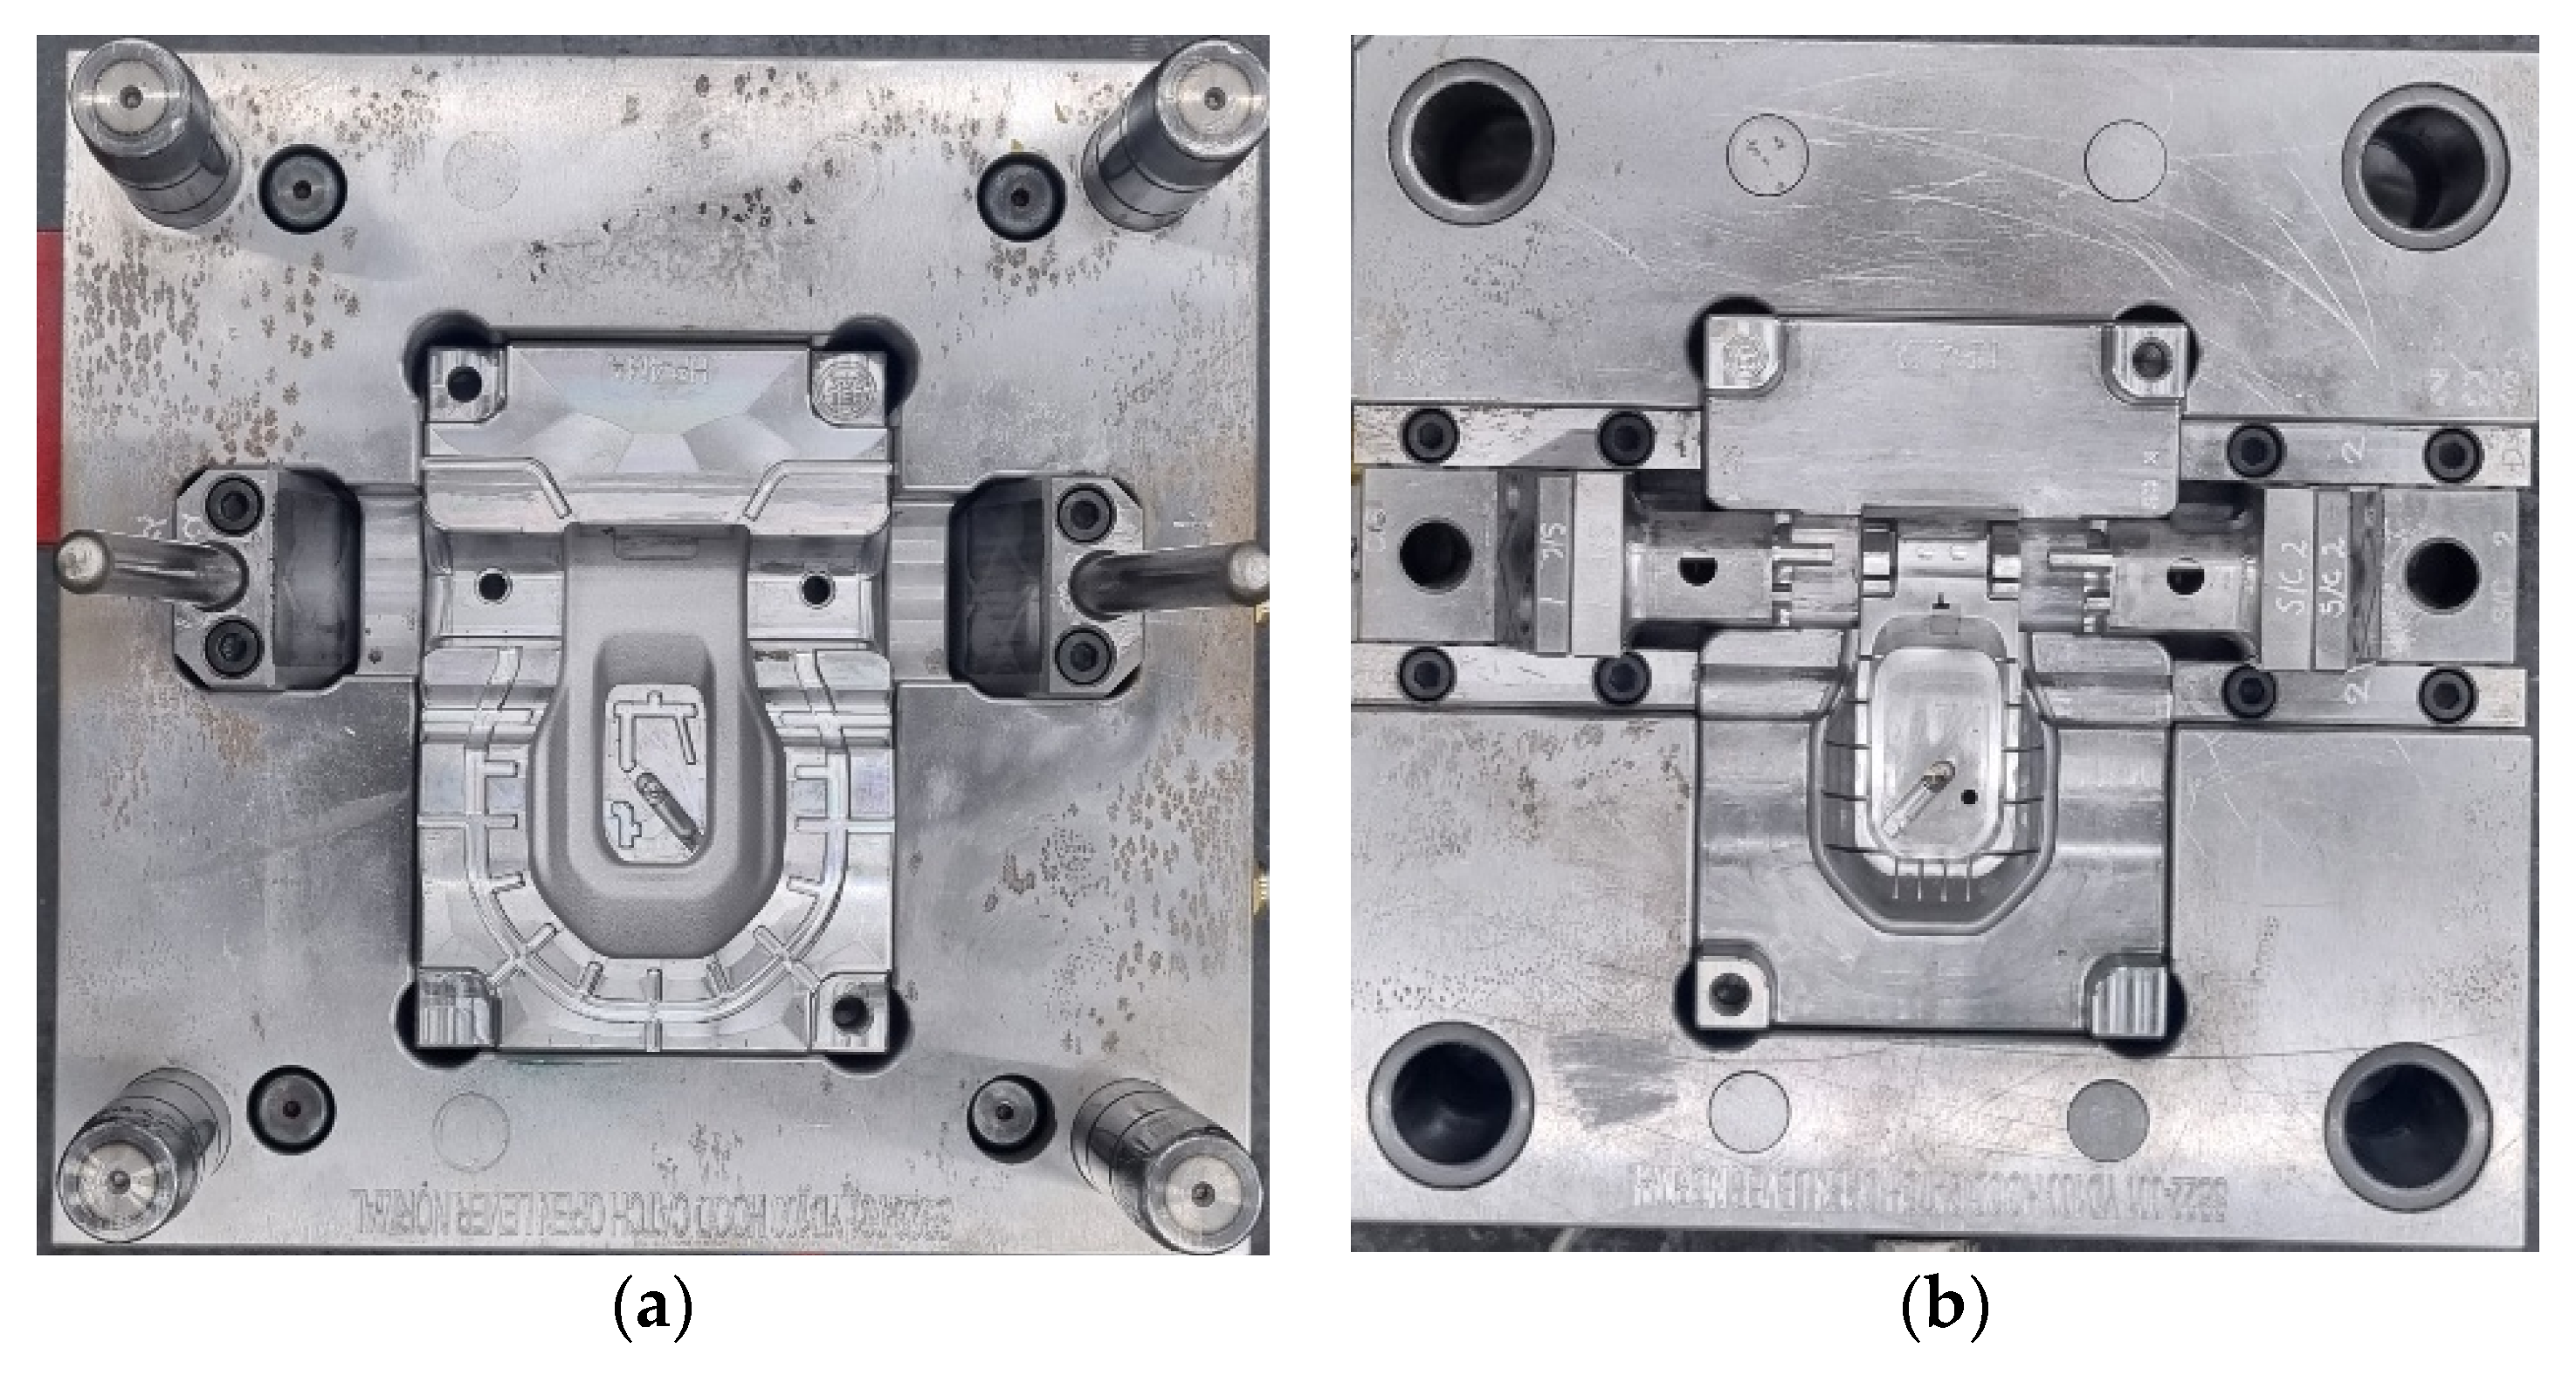
In the case of the pivot sub-assembly, each key dimension of 1, 2, and 3 of modeling which applied the 0.2% and 0.5% shrinkage-rate constant satisfied the target value, but modeling which applied 0.2% of shrinkage was selected by considering the minimization of material use. The mold which applied improved modeling is shown in Figure 17, and CPK measurement results for corresponding mold and actual injection molded products applying the process selected in Section 3.1.2 are shown in Table 26. As a result of measuring actual injection molded products applying the corrected mold, it was found that dimensions satisfied the target value with 47.620 mm for dimension 1, 6.117 mm for dimension 2, and 55.837 mm for dimension 3.
In the case of the open lever, the modeling applying the 0.5% shrinkage-rate constant and additional correction of dimension 2, with which dimensions 1, 2, and 3 all satisfied the target value, was selected. The mold applying the improved modeling is shown in Figure 18, and measurement results for CPK data for actual injection molded products applying the corresponding mold and process selected in Section 3.1.2 are shown in Table 27. As a result of measuring actual injection molded products applying the improved mold, it was found that dimensions satisfied the target value with 47.500 mm for the dimension 1, 22.202 mm for dimension 2, and 5.901 mm for dimension 3.

5. Conclusions

In this study, firstly, we suggest the shrinkage rate, simultaneously considering both the PA6 material characteristics and the part shape characteristics depending on the length-to-volume ratio. Secondly, the process condition is improved through the injection molding analysis of the pivot sub-assembly and open lever, which applied the DOE planning method. Finally, it was confirmed that when the shrinkage rate—considering not only material shrinkage rate but also part shape shrinkage rate depending on the length-to-volume ratio—was applied, it was possible to secure the dimensional accuracy of the parts.
(1)
Dimensions 1, 2, and 3 are selected as the key, main sections of the joints between the pivot sub-assembly and open lever to secure the dimensional accuracy of hood-catch.
(2)
The shrinkage-rate constant with PA6 material and part shape characteristics for the pivot sub-assembly and open lever were calculated to be 0.19% and 0.48%, respectively. Therefore, the shrinkage-rate constant was selected as the approximate values of 0.2% and 0.5% for parts modeling.
(3)
To determine process conditions for securing the accuracy of key dimensions, melt temperature, coolant temperature, and cooling were selected as control factors in DOE, and the injection flow analysis was accordingly performed. As a result of comparing the S/N ratio specialized at reaching the specific value, the pivot sub-assembly process conditions were shown to be melt temperature 250 °C, coolant temperature 30 °C, cooling time 26 s; for the open lever, they were shown to be melt temperature 280 °C, coolant temperature 30 °C, cooling time 16 s.
(4)
In consideration of the proposed 0.2% and 0.5% shrinkage rate, the injection flow analysis of the pivot sub-assembly and the open lever was performed using Moldflow. As a result of the analysis, in the case of the pivot sub-assembly, the target values of the key dimensions 1, 2, and 3 were satisfied with both shrinkage rates. Therefore, the application of the 0.2% shrinkage rate was suitable for minimizing material usage.
(5)
In the case of the open lever, when applying the 0.2% shrinkage rate, key dimensions 1 and 2 did not satisfy the target values; however, when applying the 0.5% shrinkage rate, the target values were satisfied except for key dimension 2. Dimension 2 was determined to require additional dimensional correction because the warp caused by the orthogonal rib reinforcement was large, and the corresponding analysis results satisfied all key dimensions’ target values. Therefore, the application of the 0.5% shrinkage rate was suitable except for the specificity caused by the orthogonal rib reinforcement.
(6)
To verify the research results, the key dimensions of the actual injection molded product, applying the suggested shrinkage rate, were compared with the analysis results. In the case of the pivot sub-assembly, the results showed dimension 1 = 47.620 mm, dimension 2 = 6.117 mm, and dimension 3 = 55.837 mm, and the reliability was more than 99.77% with an 0.05~0.23% error range. In the case of the open lever, the results showed dimension 1 = 47.500 mm, dimension 2 = 22.202 mm, and dimension 3 = 5.901 mm, and the reliability was more than 98.29% with an 0.8~1.71% error range.
(7)
Consequently, it is reasonable to consider not only the material shrinkage rate but also the part shape shrinkage rate depending on the length-to-volume ratio; according to the results of the study, the shrinkage rates of the pivot sub-assembly and open lever with MF 25%/GF 15% reinforced PA6, with length-to-volume ratios of 1.24 × 10⁻³ and 3.10 × 10⁻³ for each, is suggested as 0.2% and 0.5%. To generalize the theory, further research should be performed.

Author Contributions

Conceptualization, S.-B.L.; methodology, W.-J.K. and S.-B.L.; validation, W.-J.K. and S.-B.L.; formal analysis, S.-B.L.; investigation, S.-L.L.; software S.-L.L.; data analysis, S.-L.L. and S.-B.L.; data curation, S.-L.L.; writing—original draft preparation, S.-L.L.; writing—review and editing, S.-B.L.; supervision, S.-B.L.; project administration, S.-B.L.; All authors have read and agreed to the published version of the manuscript.

Funding

This paper is a research result of “Development of Automotive Hood Catch Automation Processes and Parts” which was funded by Korea Institute of Advancement of Technology, grant number S3195795.

Institutional Review Board Statement

Not applicable.

Informed Consent Statement

Not applicable.

Data Availability Statement

Not applicable.

Acknowledgments

This paper is a research result of ‘Development of Automotive Hood Catch Automation Processes and Parts(S3195795)’ that is conducted with the support of Korea Institute of Advancement of Technology. I’m deeply grateful to staff for their support.

Conflicts of Interest

The authors declare no conflict of interest.

References

  1. U.S. Department of Transportation. Available online: https://datahub.transportation.gov/dataset/NHTSA-Recalls-by-Manufacturer/mu99-t4jn (accessed on 1 August 2022).
  2. Choi, B.J.; Kang, I.J.; Jeon, Y.H.; Hong, M.S. Deformation Analysis for Injection Molding of Lower Stiffener in Automobile Bumper. J. Korean Soc. Manuf. Technol. Eng. 2018, 27, 564–569. [Google Scholar]
  3. Lee, J.H.; Lee, S.B. Determined Car Door Latch Injection Molding Process Conditions through the Finite Elements Analysis. J. Korea Acad. Ind. Coop. Soc. 2016, 17, 499–508. [Google Scholar]
  4. Park, K.; Ahn, J.H.; Choi, S.R. Optimal Design for Injection Molding Processes using Design of Experiments and Finite Element Analysis. Proc. Korean Soc. Technol. Plast. 2001, 19043, 150–153. [Google Scholar]
  5. Lee, J.H.; Kim, J.S. A Study on the Experimental Verification and Prediction of Mold Deformation at Injection Stage during Injection Molding through Simulation Analysis. Mech. Technol. 2020, 22, 1061–1074. [Google Scholar]
  6. Chen, C.P.; Chuang, M.T.; Hsiao, Y.H.; Yang, Y.K.; Tsai, C.H. Simulation and experimental study in determining injection molding process parameters for thin-shell plastic parts via design of experiments analysis. Expert Syst. Appl. 2009, 36, 10752–10759. [Google Scholar] [CrossRef]
  7. Oh, J.Y.; Huh, Y.J. A Study on Optimization of Injection-molded System Using CAE and Design of Experiment. J. Korea Acad. Ind. Coop. Soc. 2006, 7, 271–277. [Google Scholar]
  8. Carpenter, B.; Patil, S.; Hoffman, R.; Lilly, B.; Castro, J. Effect of machine compliance on mold deflection during injection and packing of thermoplastic parts. Polym. Eng. Sci. 2006, 46, 844–852. [Google Scholar] [CrossRef]
  9. Lin, W.C.; Fan, F.Y.; Huang, C.F.; Shen, Y.K.; Wang, H. Analysis of the warpage phenomenon of micro-sized parts with precision injection molding by experiment, numerical simulation, and grey theory. Polymers 2022, 14, 1845. [Google Scholar] [CrossRef] [PubMed]
  10. Seow, L.W.; Lam, Y.C. Optimizing flow in plastic injection molding. J. Mater. Process. Technol. 1997, 72, 333–341. [Google Scholar] [CrossRef]
  11. Ginghtong, T.; Nakpathomkun, N.; Pechyen, C. Effect of injection parameters on mechanical and physical properties of super ultra-thin wall propylene packaging by Taguchi method. Results Phys. 2018, 9, 987–995. [Google Scholar] [CrossRef]
  12. Lee, S.C.; Kim, J.W.; Yoon, S.I. Injection Molding Analysis for Development of Torque Roll Engine Mount Module using Composite Materials. In Proceedings of the KAIS Spring Conference, Jeongseon, Korea, 22–23 May 2015. [Google Scholar]
  13. Jeong, H.J.; Kim, S.H.; Cho, S.W.; Jeong, S.W.; Kwon, I.J. A Study on the Optimization of Injection Molding Process for Automotive Parts Using Nanocarbon Reinforced Composite Materials. In Proceedings of the KSME Conference, Daejeon, Korea, 28–30 April 2021. [Google Scholar]
  14. Choi, M.J.; Cho, J.M.; Choi, Y.H.; Choi, M.H.; Lee, C.S.; Sung, H.K.; Lee, K.S.; Park, K.H.; Hwang, S.J. Development of Paint-free Metallic Plastic Material for Automotive Parts. Korean Chem. Eng. Res. 2022, 60, 295–299. [Google Scholar]
  15. Fernandez, E.; Edeleva, M.; Fiorio, R.; Cardon, L.; D’hooge, D.R. Increasing the Sustainability of the Hybrid Mold Technique through Combined Insert Polymeric Material and Additive Manufacturing Method Design. Sustainability 2022, 14, 877. [Google Scholar] [CrossRef]
  16. Yu, S.H.; Kim, M.S.; Yoon, H.S.; Park, J.S.; Jeon, S.M.; Sim, J.H. A Study on the Mechanical Properties and Performance Prediction Simulation of PA6/GF Composite Materials with Injection Molding Pressure. Text. Color. Finish. 2022, 34, 46–57. [Google Scholar]
  17. Bula, K.; Korzeniewski, B. Polyamide 6-Aluminum Assembly Enhanced by Laser Microstructuring. Polymers 2022, 14, 288. [Google Scholar] [CrossRef]
  18. Rochardjo, H.S.; Budiyantoro, C. Manufacturing and analysis of overmolded hybrid fiber polyamide 6 composite. Polymers 2021, 13, 3820. [Google Scholar] [CrossRef]
  19. Myalski, J.; Godzierz, M.; Olesik, P. Effect of carbon fillers on the wear resistance of pa6 thermoplastic composites. Polymers 2020, 12, 2264. [Google Scholar] [CrossRef] [PubMed]
  20. Sathees Kumar, S.; Kanagaraj, G. Investigation on mechanical and tribological behaviors of PA6 and graphite-reinforced PA6 polymer composites. Arab. J. Sci. Eng. 2016, 41, 4347–4357. [Google Scholar]
  21. Güllü, A.; Özdemir, A.; Özdemir, E. Experimental investigation of the effect of glass fibres on the mechanical properties of polypropylene (PP) and polyamide 6 (PA6) plastics. Mater. Des. 2006, 27, 316–323. [Google Scholar] [CrossRef]
  22. AUTODESK Moldflow-Plastic Injection and Compression Mold Simulation for Design and Manufacturing. Available online: https://www.autodesk.com/products/moldflow/overview (accessed on 6 August 2022).
  23. Yang, W.P.; Tarng, Y.S. Design optimization of cutting parameters for turning operations based on the Taguchi method. J. Mater. Process. Technol. 1998, 84, 122–129. [Google Scholar]
  24. Jou, Y.T.; Lin, W.T.; Lee, W.C.; Yeh, T.M. Integrating the Taguchi method and response surface methodology for process parameter optimization of the injection molding. Appl. Math. Inf. Sci. 2014, 8, 1277. [Google Scholar]
  25. Hakimian, E.; Sulong, A.B. Analysis of warpage and shrinkage properties of injection-molded micro gears polymer composites using numerical simulations assisted by the Taguchi method. Mater. Des. 2012, 42, 62–71. [Google Scholar] [CrossRef]
  26. Lee, S.B.; Cho, H.S.; Lyu, M.Y. Processability and Mechanical Characteristics of Glass Fiber and Carbon Fiber Reinforced PA6 for Reinforcement Content. Elastomers Compos. 2015, 50, 184–188. [Google Scholar] [CrossRef] [Green Version]
  27. Lee, M. The effects of warpage in injection molded part for various rib design and resins. J. Korea Soc. Mech. Technol. 2012, 14, 59–65. [Google Scholar] [CrossRef]
  28. Lee, M.; Lyu, M.Y. A study on the warpage in injection molded part for various rib design. J. Korea Soc. Die Mold Eng. 2008, 2, 54–61. [Google Scholar]
Figure 1. The shape of pivot sub-assembly. (a) Overview of pivot sub-assembly. (b) Front view of the pivot sub-assembly and location of dimensions 1 and 3. (c) Side view of the pivot sub-assembly and location of dimension 2.
Machines 10 00934 g001
Figure 2. The shape of open lever. (a) Overview of the open lever. (b) Side view of the open lever and location of dimension 3. (c) Bottom view of the open lever and location of dimension 1 and 2.
Machines 10 00934 g002
Figure 3. Runner system for analysis. (a) Pivot sub-assembly. (b) Open lever.
Machines 10 00934 g003
Figure 4. Detailed runner system. (a) Pivot sub-assembly. (b) Open lever.
Machines 10 00934 g004
Figure 5. Deflection of the pivot sub-assembly and open lever existing in mass production. (a) Pivot sub-assembly. (b) Open lever.
Machines 10 00934 g005
Figure 6. Average shrinkage of pivot sub-assembly and open lever existing in mass production. (a) Pivot sub-assembly. (b) Open lever.
Machines 10 00934 g006
Figure 7. Path-line of pivot sub-assembly and open lever existing in mass production. (a) Pivot sub-assembly. (b) Open lever.
Machines 10 00934 g007
Figure 8. Deflection for the pivot sub-assembly. (a) Case 1. (b) Case 2. (c) Case 3. (d) Case 4. (e) Case 5. (f) Case 6. (g) Case 7. (h) Case 8. (i) Case 9.
Machines 10 00934 g008aMachines 10 00934 g008b
Figure 9. Deflection for the open lever. (a) Case 1. (b) Case 2. (c) Case 3. (d) Case 4. (e) Case 5. (f) Case 6. (g) Case 7. (h) Case 8. (i) Case 9.
Machines 10 00934 g009
Figure 10. Average of S/N ratio for each level of factors in the pivot sub-assembly-obtained graph. (a) Dimension 1 (b) Dimension 2 (c) Dimension 3.
Machines 10 00934 g010
Figure 11. Average of S/N ratio for each level of factors in open-lever-obtained graph. (a) Dimension 1 (b) Dimension 2 (c) Dimension 3.
Machines 10 00934 g011
Figure 12. Deflection for pivot sub-assembly after applying 0.2% shrinkage constant.
Machines 10 00934 g012
Figure 13. Deflection for the open lever with 0.2% shrinkage-rate constant applied.
Machines 10 00934 g013
Figure 14. Deflection for the pivot sub-assembly with 0.5% shrinkage-rate constant applied.
Machines 10 00934 g014
Figure 15. Deflection for the open lever with 0.5% shrinkage-rate constant applied.
Machines 10 00934 g015
Figure 16. Deflection of the open lever with 0.5% shrinkage-rate constant applied and additional correction of dimension 2.
Machines 10 00934 g016
Figure 17. Mold of the pivot sub-assembly applying 0.2% shrinkage-rate constant. (a) Lower part. (b) Upper part.
Machines 10 00934 g017
Figure 18. Mold of the open lever applying 0.5% shrinkage-rate constant. (a) Lower part. (b) Upper part.
Machines 10 00934 g018
Table 1. The proportion of glass fiber and mineral fiber in PA6.
FiberMineral FiberGlass Fiber
Proportion ratio [%]2515
Table 2. The properties of MF 25%/GF 15% reinforced PA6.
PropertyValue
Water absorption [%]1.3
Tensile strength at break [MPa]130
Elongation at break [%]2.5
Izod impact, Notched [J/cm]0.530
Table 3. Key dimensions for pivot sub-assembly and open lever.
PartDescriptionTarget
Pivot sub-assembly [mm]Dimension 147.9   ±   0.5
Dimension 2 6.10 ± 0.05
Dimension 3 56.0 0.2 + 0.1
Open lever [mm]Dimension 147.4   ±   0.3
Dimension 2 21.9 0 + 0.5
Dimension 3 5.80 0.00 + 0.15
Table 4. Specification of runner system.
PartFactorDescriptionValue
Pivot sub-assembly [mm]AGate height3.3
BGate first diameter3
CGate second diameter
(Sprue first diameter)
4
DSprue second diameter6.8
ESprue height52
Open lever [mm]FGate first width2
GGate second width
(Runner first diameter)
3
HGate height1
IGate depth2.4
J, KRunner second diameter5
LSprue first diameter6
MSprue second diameter4
NSprue height70
Table 5. Specification of injection machine.
DescriptionValue
Maximum machine injection stroke176 mm
Maximum machine injection rate304 cm3/s
Machine screw diameter44 mm
Maximum injection pressure220 MPa
Maximum machine clamp force150 ton
Table 6. Process conditions of pivot sub-assembly and open lever nominal dimensions in existing mass production.
PartDescriptionValue
Pivot sub-assemblyMold temperature60 °C
Melt temperature270 °C
Injection time10 s
Packing pressureStep 195 MPa for 5 s
Step 275 MPa for 6 s
Coolant temperature20 °C
Cooling time26 s
Open leverMold temperature60 °C
Melt temperature295 °C
Injection time6 s
Packing pressureStep 154 MPa for 4 s
Step 232 MPa for 1.5 s
Coolant temperature20 °C
Cooling time [s]16 s
Table 7. Results of measurement 1, 2, 3 of pivot sub-assembly and open lever existing in mass production.
PartDimension 1Dimension 2Dimension 3
Pivot sub-assembly [mm]47.326.1755.52
Open lever [mm]46.5521.605.85
Table 8. Design variables and levels for pivot sub-assembly.
FactorVariablesLevel
123
AMelt temperature [°C]250260270
BCoolant temperature [°C]202530
CCooling time [s]222630
Table 9. Design variables and levels for open lever.
FactorVariablesLevel
123
AMelt temperature [°C]270280290
BCoolant temperature [°C]202530
CCooling time [s]121620
Table 10. L9(33) orthogonal array.
Simulation No.ABC
1111
2122
3133
4212
5223
6231
7313
8321
9332
Table 11. Key dimensions with material shrinkage.
PartDescriptionTarget0.2% Applied0.5% Applied
Pivot sub-assembly [mm]Dimension 147.9   ±   0.548.0148.14
Dimension 2 6.10 ± 0.05 6.096.07
Dimension 3 56.0 0.2 + 0.1 56.1256.28
Open lever [mm]Dimension 147.4   ±   0.347.5047.63
Dimension 2 21.9 0 + 0.5 21.9422.01
Dimension 3 5.80 0.00 + 0.15 5.795.77
Table 12. Results of key dimensions.
Case No.Pivot Sub-Assembly [mm]Open Lever [mm]
Dimension 1Dimension 2Dimension 3Dimension 1Dimension 2Dimension 3
147.326.1355.5746.5521.595.85
247.336.1255.5846.5921.615.85
347.346.1355.5946.6221.625.85
447.316.1355.5646.5721.605.84
547.326.1355.5846.6021.615.84
647.326.1355.5846.6021.615.85
747.326.1355.5746.5621.605.85
847.326.1355.5846.5721.605.85
947.336.1255.5946.6121.625.84
Table 13. S/N ratio of measurement 1 for pivot sub-assembly.
Case No.Dimension 1 [mm]S/N Ratio
147.327.742
247.337.893
347.348.047
447.317.593
547.327.742
647.327.742
747.327.742
847.327.893
947.337.893
Table 14. S/N ratio of measurement 2 for pivot sub-assembly.
Case No.Dimension 2 [mm]S/N Ratio
16.1333.468
26.1236.990
36.1333.468
46.1333.468
56.1333.468
66.1333.468
76.1333.468
86.1333.468
96.1236.990
Table 15. S/N ratio of measurement 3 for pivot sub-assembly.
Case No.Dimension 3 [mm]S/N Ratio
155.5710.341
255.5810.545
355.5910.755
455.5610.141
555.5810.545
655.5810.545
755.5710.341
855.5810.545
955.5910.755
Table 16. Average of S/N ratio for each level of factors in the pivot sub-assembly.
DescriptionMelt TemperatureCoolant TemperatureCooling Time
Dimension 1Level17.8947.6927.792
27.6927.8427.793
37.8427.8947.843
Delta0.2010.2010.051
Rank1.51.53
Dimension 2Level134.6433.4733.47
233.4734.6435.82
334.6434.6433.47
Delta1.171.172.35
Rank2.52.51
Dimension 3Level110.5510.2710.48
210.4110.5510.48
310.5510.6810.55
Delta0.140.410.07
Rank213
Table 17. S/N ratio of measurement 1 for open lever.
Case No.Dimension 1 [mm]S/N Ratio
146.554.422
246.594.841
346.625.168
446.574.629
546.604.949
646.604.949
746.564.525
846.574.629
946.615.058
Table 18. S/N ratio of measurement 2 for open lever.
Case No.Dimension 2 [mm]S/N Ratio
121.5913.183
221.6113.762
321.6214.067
421.6013.468
521.6113.762
621.6113.762
721.6013.478
821.6013.478
921.6214.067
Table 19. S/N ratio of measurement 3 for open lever.
Case No.Dimension 3 [mm]S/N Ratio
15.8529.309
25.8529.309
35.8529.309
45.8430.9691
55.8430.9691
65.8529.309
75.8529.309
85.8529.309
95.8430.9691
Table 20. Average of S/N ratio for each level of factors in open lever.
DescriptionMelt TemperatureCoolant TemperatureCooling Time
Dimension 1Level14.8104.5254.666
24.8424.8064.842
34.7375.0584.881
Delta0.1050.5330.214
Rank312
Dimension 2Level113.6713.3713.47
213.6613.6613.77
313.6713.9713.77
Delta0.010.590.29
Rank312
Dimension 3Level129.0329.6829.03
230.3229.6830.32
329.6829.6829.68
Delta1.290.001.29
Rank1.531.5
Table 21. Results of dimension 1, 2, 3 for pivot sub-assembly with 0.2% shrinkage constant applied.
DescriptionDimension 1Dimension 2Dimension 3
Value [mm]47.736.1155.81
Table 22. Results of measurement 1, 2, 3 for the open lever with 0.2% shrinkage-rate constant applied.
DescriptionDimension 1Dimension 2Dimension 3
Value [mm]46.8521.675.83
Table 23. Results of dimension 1, 2, 3 for the pivot sub-assembly with 0.5% shrinkage-rate constant applied.
DescriptionDimension 1Dimension 2Dimension 3
Value [mm]47.776.1055.93
Table 24. Results of measurement 1, 2, 3 for the open lever applied 0.5% shrinkage-rate constant.
DescriptionDimension 1Dimension 2Dimension 3
Value [mm]47.1021.725.80
Table 25. Measurement results of dimension 1, 2, and 3 of the open lever with shrinkage-rate constant applied and additional correction of the dimension 2.
DescriptionDimension 1Dimension 2Dimension 3
Value [mm]47.1222.015.80
Table 26. Actual product results of dimensions 1, 2, and 3 for the pivot sub-assembly applying 0.2% shrinkage-rate constant.
DescriptionSimulationCPK Data of Actual ProductError Rate [%]
AverageStandard Deviation
Dimension 1 [mm]47.7347.6200.01050.23
Dimension 2 [mm]6.116.1170.00800.11
Dimension 3 [mm]55.8155.8370.00880.05
Table 27. Actual product results of dimensions 1, 2, and 3 for the open lever applying 0.5% shrinkage-rate constant.
DescriptionSimulationCPK Data of Actual ProductError Rate [%]
AverageStandard Deviation
Dimension 1 [mm]47.1247.5000.01470.8
Dimension 2 [mm]22.0122.2020.01500.86
Dimension 3 [mm]5.805.9010.00791.71
Publisher’s Note: MDPI stays neutral with regard to jurisdictional claims in published maps and institutional affiliations.