1. Introduction
Energy has become an important element with the increase in human population and technological developments. The reserve status of energy resources and difficulties in energy production make the efficient use of energy as important as production. Electric motors are used in different applications around the world and have a share of approximately 40% of energy consumption and use 70% of industrial electricity [
1,
2]. This ratio brings energy efficiency in electric motors to the top of the topics studied. In the design of electric motors, optimum volume, minimum cost, low energy consumption, and maximum efficiency are aimed. These requirements have brought legal regulations to electric motors, and today, the International Electrotechnical Commission (IEC) classification is used [
3].
Electric motors have focused on the development of permanent magnet motors with rare earth elements for many years. However, the availability of permanent magnets, the supply of raw materials, the negativities in the magnet market, and the failures in the motors connected to the magnets have shifted the interest in new motor structures [
4]. Synchronous Reluctance Motor (SynRM) topology is one of these structures. SynRMs are both cheaper to manufacture and lighter than other structures due to the absence of windings, magnets, and squirrel cages in the rotor. Rotor temperatures are very low, and the torque/current ratio is temperature-independent. In addition, since the control methods are similar to those used in the market, it has the opportunity to be used with existing drivers [
5,
6,
7,
8,
9].
In SynRMs, like other motor types, two different designs are encountered, i.e., axial flux and radial flux. Axial flux motor topologies are preferred in applications where size problems are experienced. While the operating logics of the two types of motors are the same, the difference is the placement of the windings and accordingly the direction of the flux vector. Axial flux topology is more efficient than radial fluxes in terms of electromagnetic properties. The flux path is shorter than the radial flux topology, and in radial flux motors, the flux circulating through the long stator yoke completes its path by passing directly through the air gap in axial flux. This feature increases the efficiency and power density of the axial flux motor. In addition, the power ratio produced by the axial flux motor topology per unit weight is higher. Axial flux motors provide the advantage of being used in electric vehicles, pumps, fans, centrifugal machine parts, robots, and many industrial applications [
4,
10,
11,
12].
The development of electric vehicle technology has been accelerating positively in recent years. The gas emissions from internal combustion motors and the shortage of fuel in such vehicles increase the interest in electric vehicle technology. In addition, the measures taken by governments on environmental pollution and incentives in the field of electric vehicles support the studies in this field. Compared to internal combustion motor technology, electric vehicle technology offers a more comfortable ride/journey with advantages such as higher efficiency, energy recovery through various methods, and quiet operation [
13,
14,
15]. This situation is increasing the electric vehicle market demand [
16]. Electric vehicle designers/manufacturers are turning to more efficient, lighter, and more compact electric motors. Vehicles have a dynamic structure in terms of the speed range. Power and torque values at nominal/maximum speed are important factors in determining the driving dynamics of electric vehicles. For this reason, considering that it will be used with other equipment in electric vehicles, the efficiency of the electric motors to be preferred at variable speeds is at the top of the selection criteria.
Torque and power are the determining factors in the required speed/torque or speed/power combination for electric vehicles. The efficiency map of the motors is the determining factor for the selection of the appropriate electric motor in electric vehicles [
17]. The efficiency map can also be defined as a scatterplot with instant torque and speed requirements. It is the most convenient way to identify the motor driver at the operating points according to the constant torque or constant power region.
When considering the design of motor drives, there is often more attention focused on the efficiency of the electric machine. However, the efficiency of the drive is affected by the efficiency of both the inverter and the electric motor. This is because the efficiency of electrical machines is normally lower than inverters and varies more with operating point and machine type [
7].
In this study, the motor performance of AF-SynRM at different speeds and torques was investigated for the first time. The efficiency map of AF-SynRM was first obtained by the Finite Element Method (FEM), and the FEM results were experimentally verified. In this way, it has been shown that AF-SynRM can be preferred as an alternative to other motor types, especially for applications that require variable speed, such as electric vehicles.
2. Materials and Methods
The power factor in AF-SynRM is lower than inductions motors (IM), and permanent magnet synchronous motors (PMSM) as high inverter ratios are required. However, while their efficiency is higher than IMs of the same power, they are lower than PMSMs. AF-SynRMs provide advantages in terms of volume due to their compact structure and high power/torque densities. For this reason, it is shown as an alternative to radial flux motors in automotive applications.
While axial flux topology is rarely studied/encountered in SynRMs compared to radial flux motor topology, axial flux structure has started to be preferred in recent years. In order to examine the axial flux structure, it is designed according to the reference radial structured motors, and the electromagnetic behavior of the AF-SynRM is examined and compared according to the radial flux topologies. In the results obtained, it is observed that the AF-SynRM topology has higher power and torque density than the radial flux topology, as well as a geometrical advantage and ease of manufacture. However, the torque ripple is high in the axial flux topology [
18], and the q-axis current effect is observed [
19]. These studies were tested with FEM [
7,
20,
21,
22]. Only one model was tested and manufactured by modeling AF-SynRM with FEM. The AF-SynRM is designed as 2.2 kW, 8 poles. The study examined the number of barriers, insulation ratio and the effect of multiple barrier structures by concentrating on the rotor topology. It was observed that the torque, power factor, and saliency ratio increased as the number of barriers increased and the insulation ratio decreased. It was also observed that the torque ripple decreased [
23]. In this study, the efficiency map of this structure was created using both FEM and experiments.
2.1. Losses in Axial Flux Synchronous Reluctance Motor
The factors affecting efficiency in electrical machines are given in different categories in the literature. The main components of losses in electrical machines are DC winding loss, AC winding loss, core loss, magnet loss (PM machine only), rotor bar loss (IM machine only), bearing losses, and wind losses. The components of these losses are described in detail in different studies in the literature [
24,
25,
26,
27]. The losses that occur in AF-SynRM can be classified as winding losses, core losses, and friction and ventilation losses. Factors affecting these losses can be shown as motor current, the voltage applied to the motor, operating frequency, temperature, load, and some environmental factors.
In creating the AF-SynRM efficiency map, the determination of input/output powers and losses in the motor must be carefully obtained. Although motor parameters can be obtained via FEM and experimentally, they must also be calculated analytically. First, the electrical input power of the motor
is given by Equation (1) [
28];
where
is the period,
are the voltage and current components in the stationary reference frame. One of the losses that occur in the electric motor is the copper losses in the windings. These losses are released as heat. Copper losses
are calculated by Equation (2) [
28].
In Equation (2), motor phase currents are shown as respectively
. The average stator resistance
is shown in Equation (3).
The stator resistance at base temperature is represented as
.
and
represent the measured average winding temperature and room temperature, respectively. The average winding temperature is calculated by Equation (4).
The mean value of the measured stator temperatures. The average resistance can be calculated precisely, considering the skin effects.
One of the motor performance parameters is the shaft power
that the motor can produce. This value depends on the measured torque
and the angular velocity
. In Equation (5), the relationship between these three values is given [
28].
Losses in motors are grouped under different headings. Iron and mechanical losses are also given as some of these titles. The relations of these values are included in Equations (6) and (7) [
28].
The expressions
in Equations (6) and (7) represent mechanical losses, iron losses, and total mechanical and iron losses, respectively. Torque losses due to iron losses (
and total mechanical losses (
are obtained by Equations (8) and (9).
As a result, the motor mechanical shaft power is reached by subtracting the losses from the motor input power. The efficiency (
) of the motor is shown in Equation (10).
Another parameter affecting the efficiency of electrical machines is leakage fluxes (
). First, the flux connections are calculated as the time domain integral of the back emf voltages in the
frame.
An offset must be arranged to avoid computed flux linkage coupling components. After calculating
and
, leakage flux amplitudes can be easily calculated by d-q transformations.
in Equation (13) is the electrical position obtained as a result of the mechanical measurement, and the number of poles and offset must be known. The value of
is expressed by Equation (14).
In addition, the electromagnetic torque value in the motor is calculated by sampling the PWM voltage of the motor, considering the stator winding temperature and flux components. If this value is expressed as the estimated torque value
;
2.2. FEM Design of AF-SynRM
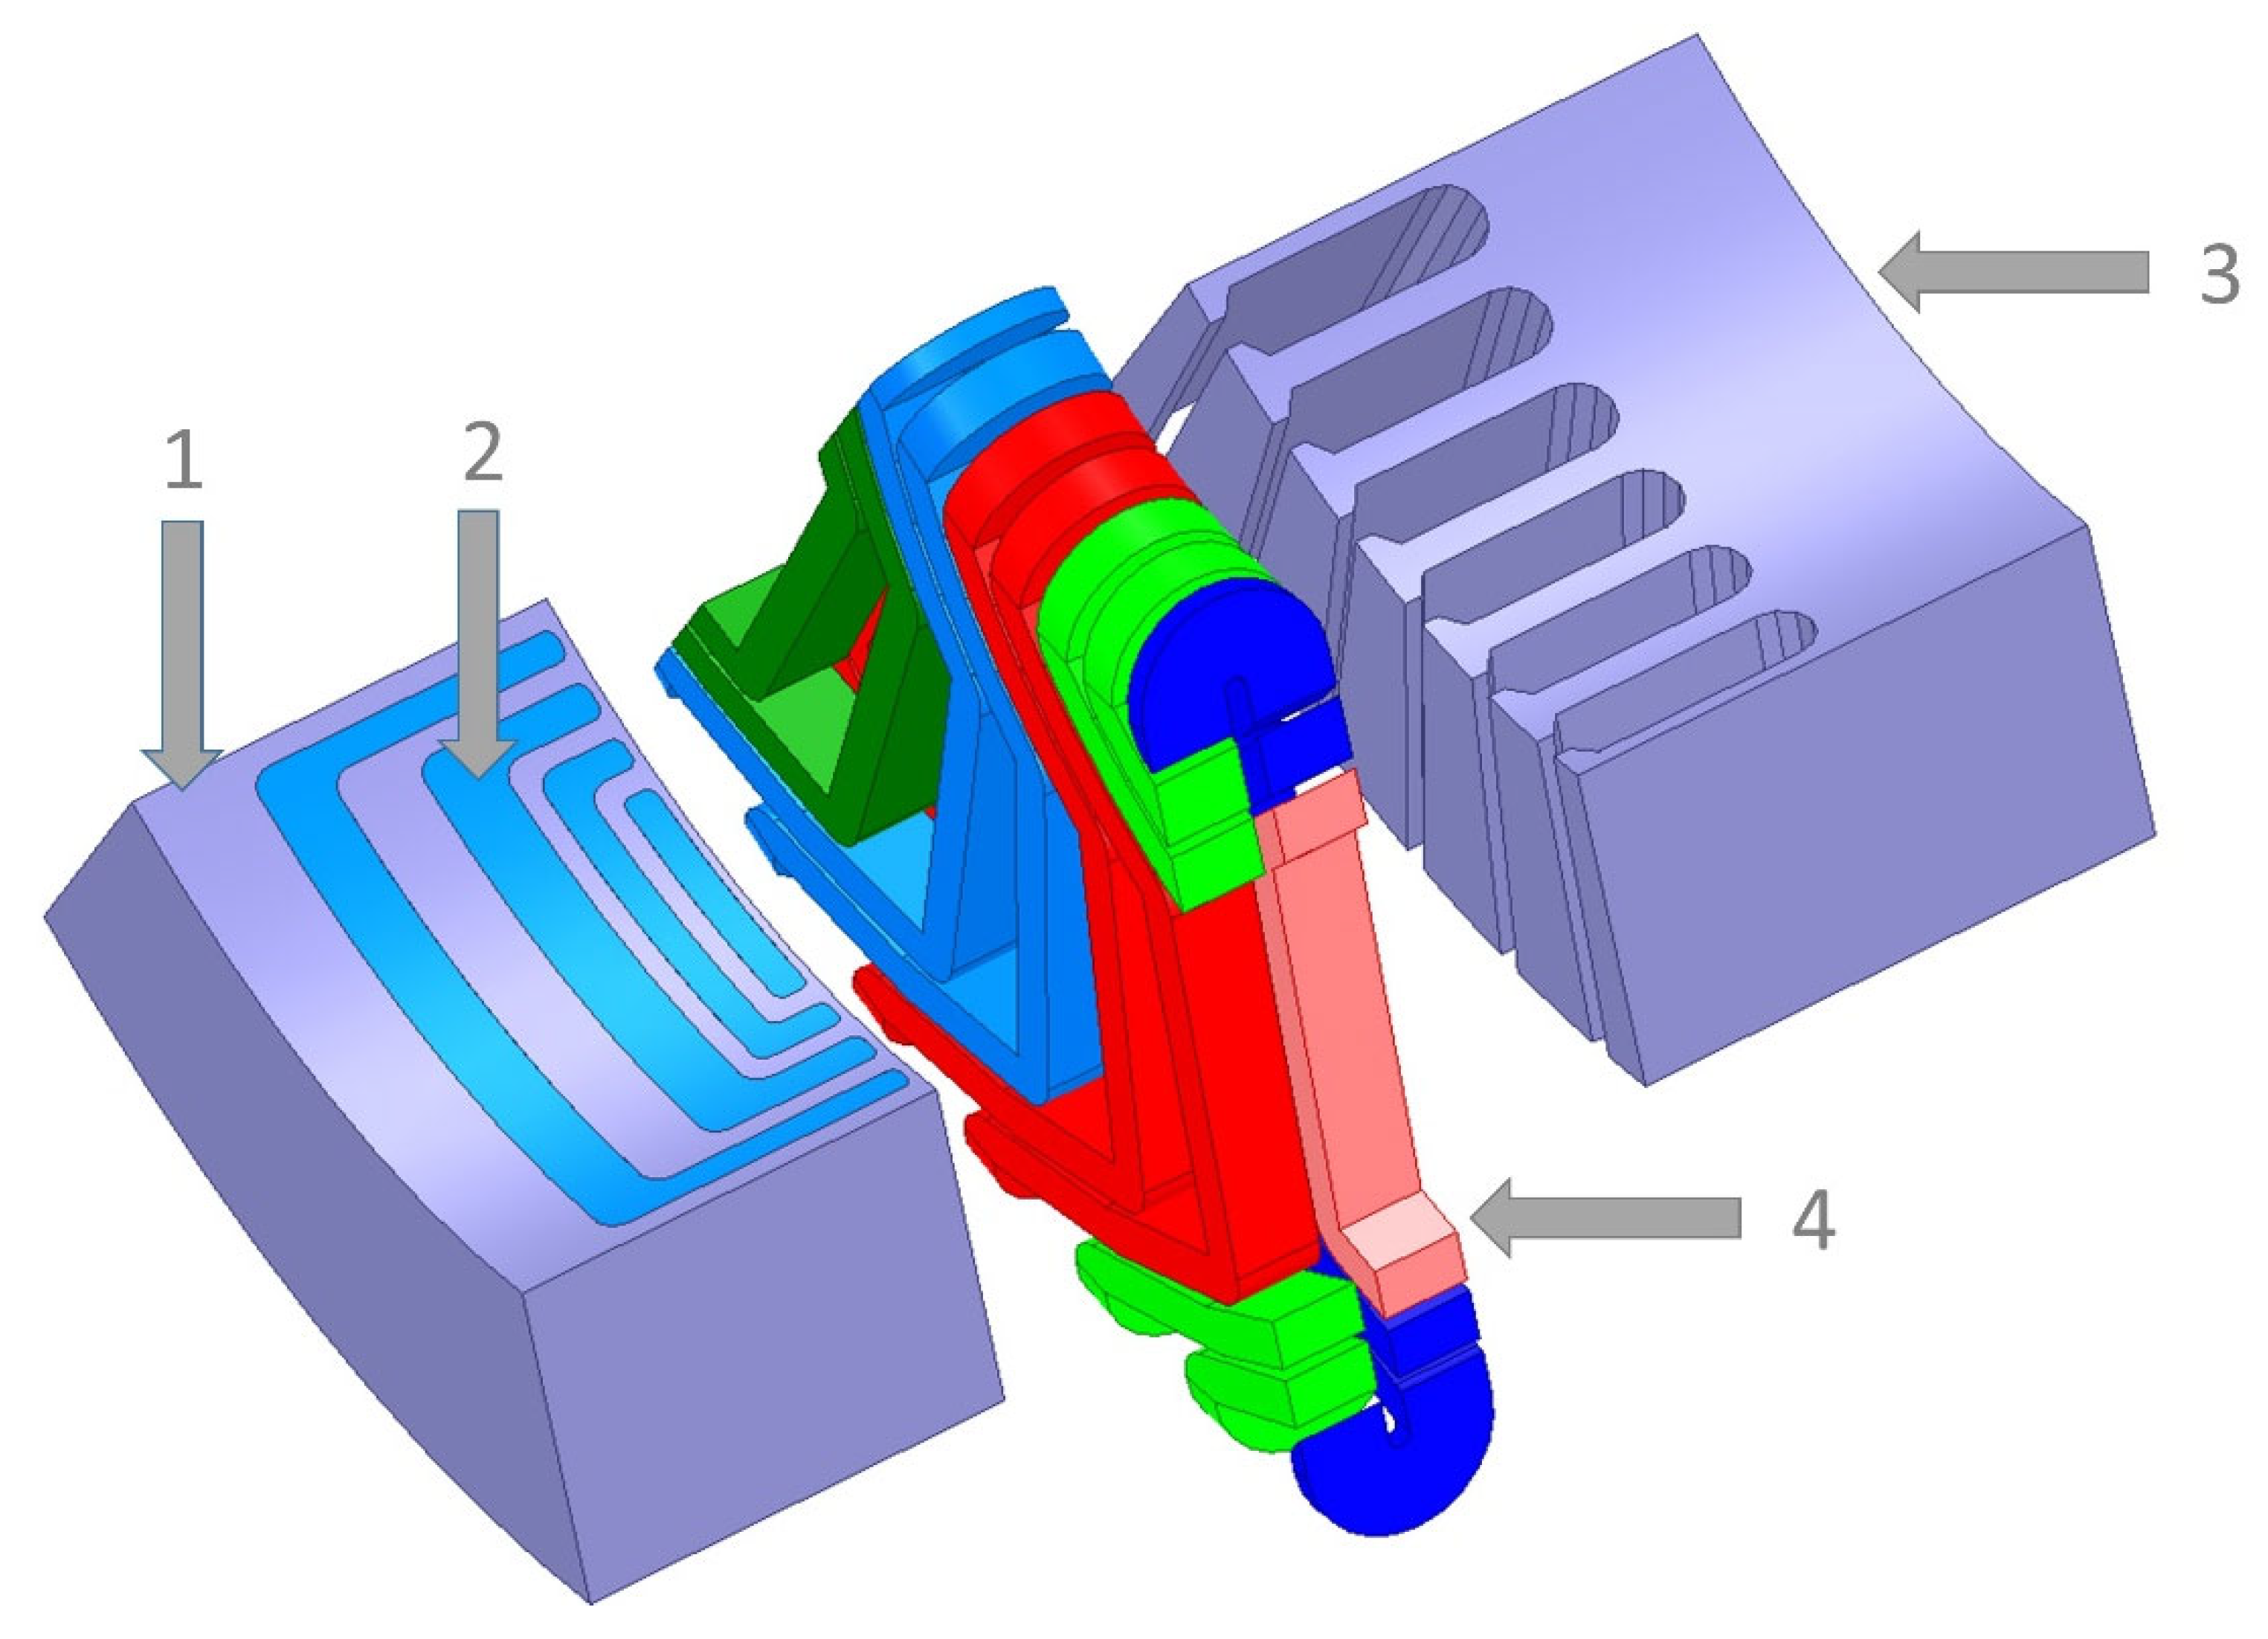
The instantaneous torque and speed requirements of the electric machine to be used in electric vehicles should be determined in detail. For this reason, a 3D solid model of AF-SynRM was created to examine the performance criteria of the motor used with FEM. The solid model created is shown in
Figure 1.
While the motor parameters are determined by the FEM method, the accuracy of the results is directly related to the number of meshes created. However, the increase in the mesh number also increases the resolution time. For this reason, analyses were performed on the 1/8 model, and the TAU mesh type was used. With the created mesh structure, a total of 62,122 areas were formed. In order to examine the performance of AF-SynRM, the efficiency, losses, d-axis, and q-axis parameters of the motor at different speeds were examined and recorded.
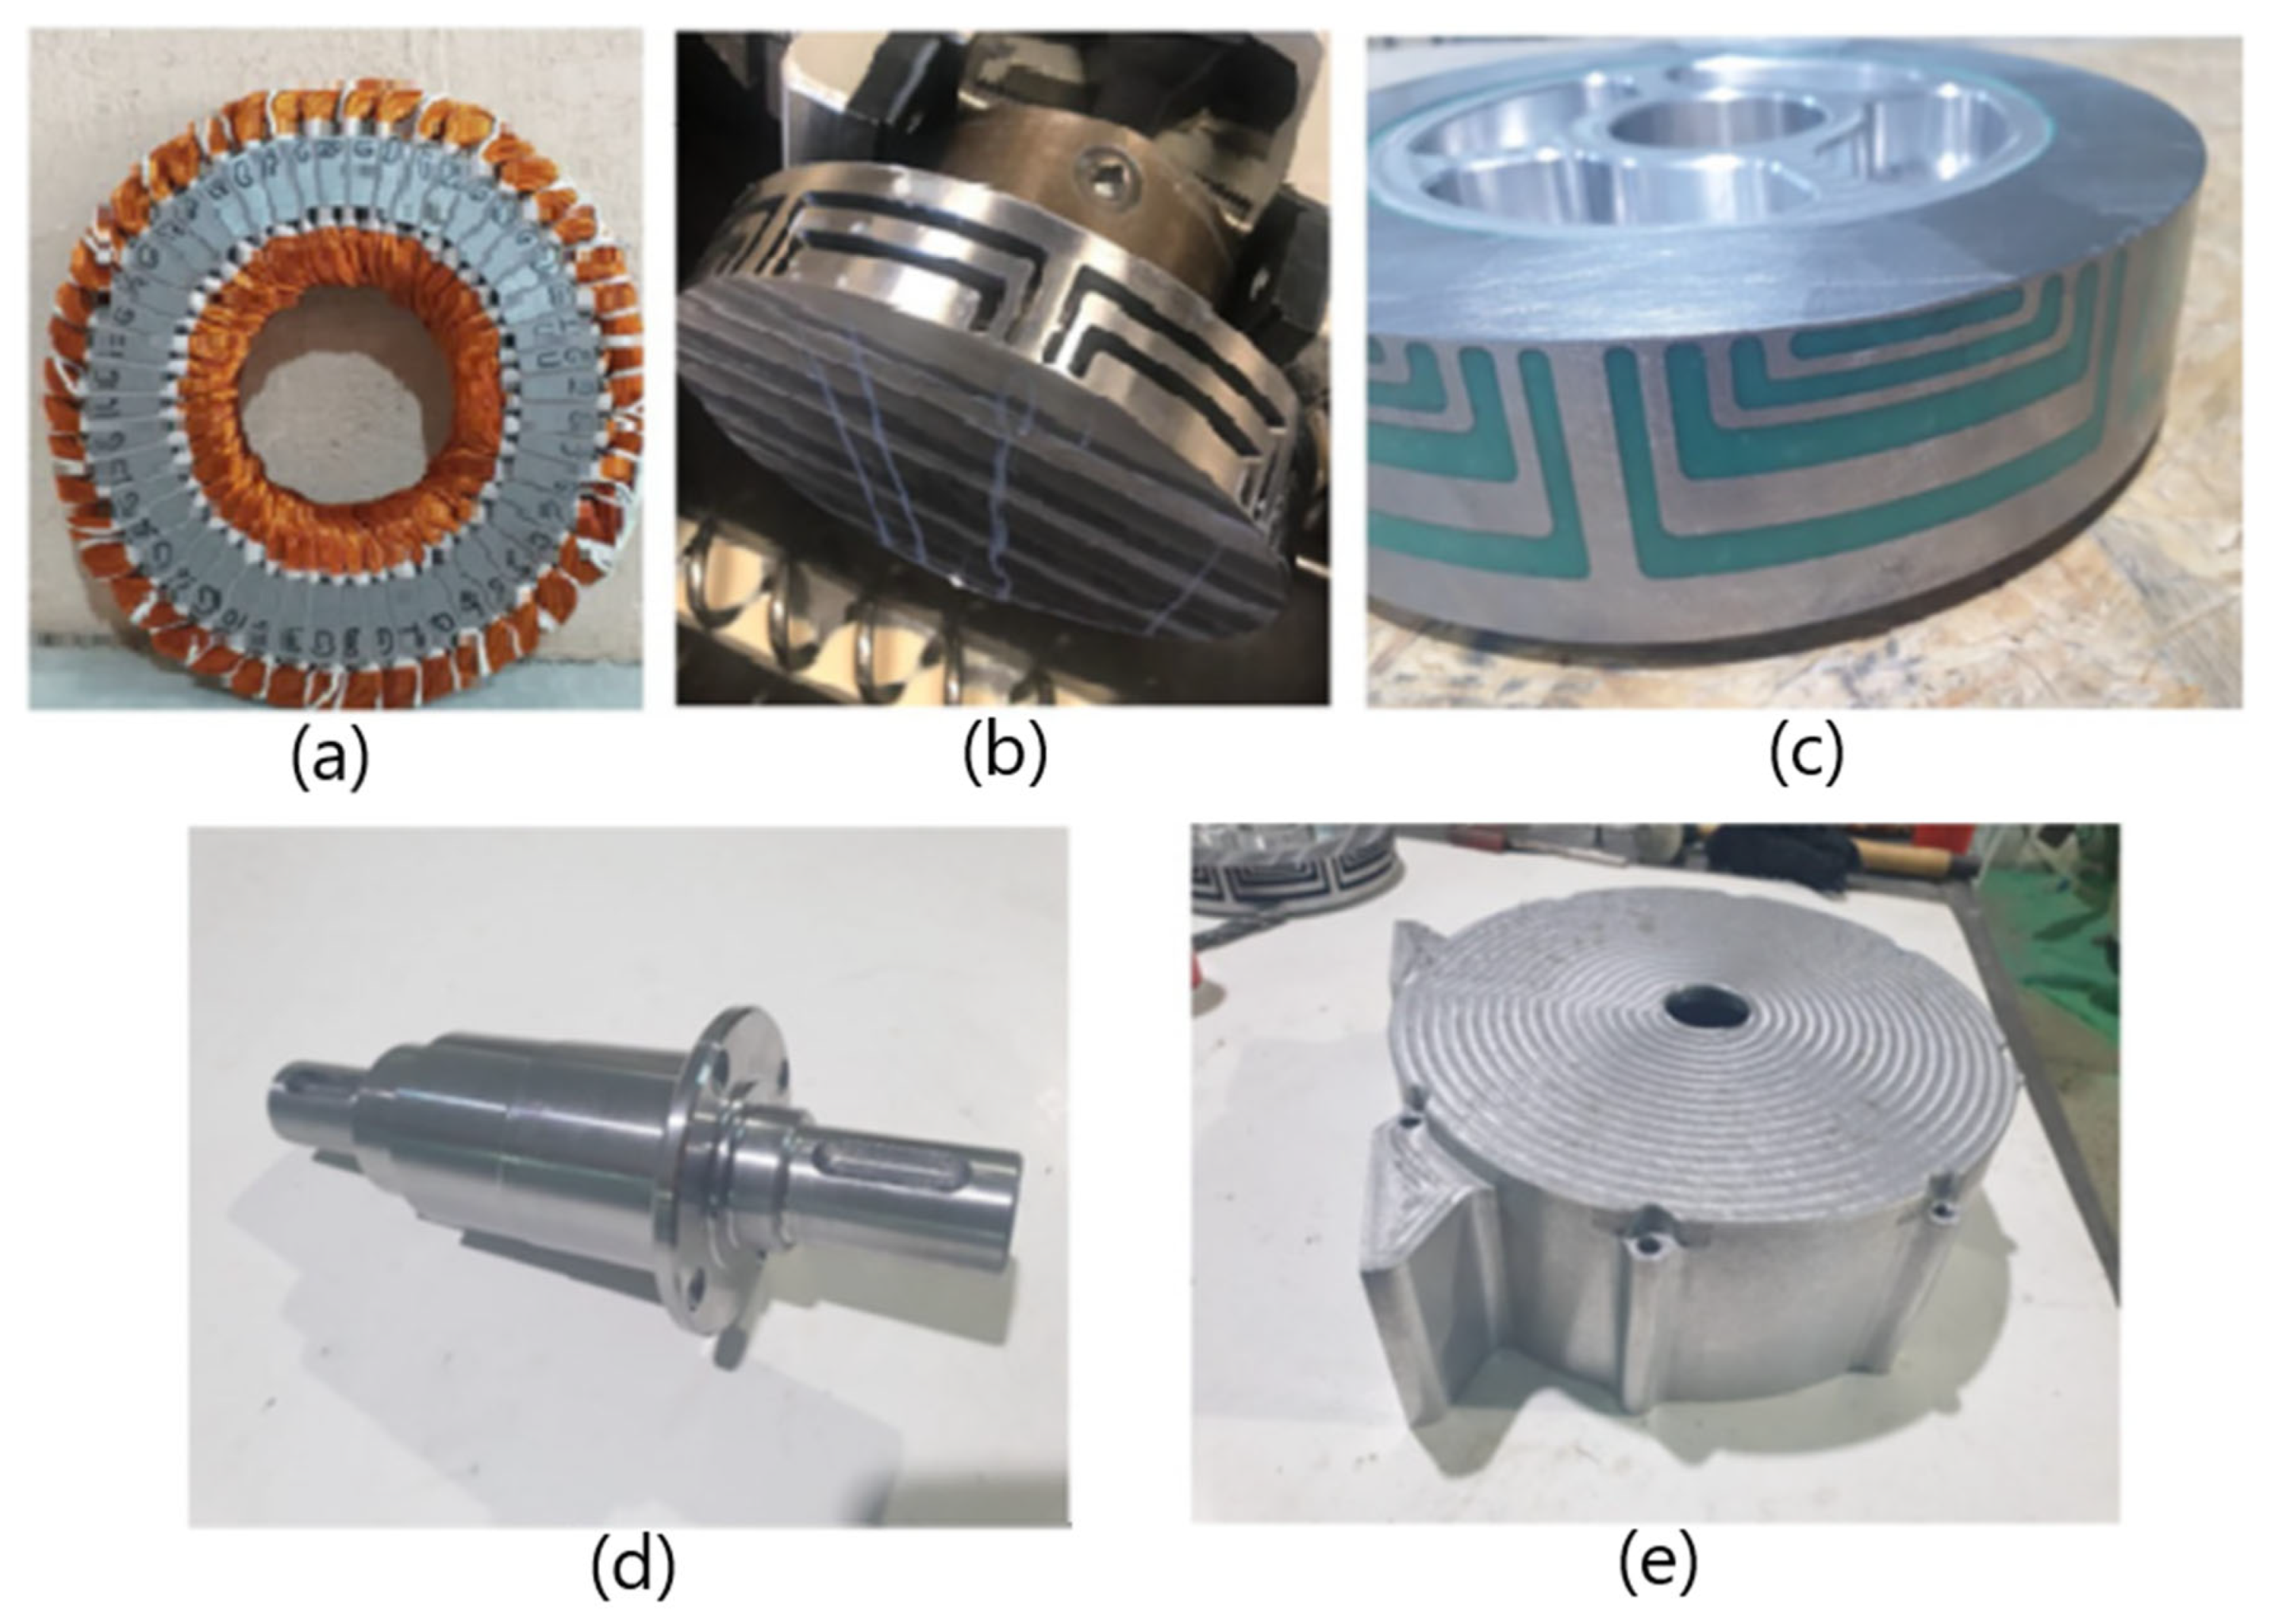
After the design of the AF-SynRM with FEM was completed, the prototype of the motor was manufactured. The visual of the manufactured motor parts is given in
Figure 2. In
Figure 2, the parts manufactured for the motor are given. The stator is made of JFE Steel 35JN300 laminated steel, and the rotor is made of Steel 1010 non-laminated solid steel. Firstly, slots were created using a punch on the laminated steel, and the stator core was formed by rolling the laminated steel. At the end of the rolling process, it was fixed by laser welding. In the documents of the quality control process sent by the manufacturer, the filling factor value of the stator is 0.97.
Especially at high speeds, the fact that the flux barriers are thinner than the other parts of the rotor reduces the mechanical strength, and the flux barriers cause an acoustic problem. In order to prevent this, flux barriers are filled with fluids such as epoxy resin [
29]. Therefore, the barriers in the rotor were filled with epoxy to gain strength and improve the acoustic properties of the motor.
Table 1 provides some crucial motor production values.
2.3. Experimental Study
The efficiency map for motors used in electric vehicles is an important factor for battery systems. In this respect, it is important to determine the motor’s efficiency in different speed and torque combinations. This study aims to examine the motor performance (efficiency) of AF-SynRM at various speed and torque variations. For this purpose, both FEM and experimental analyses of the motor were made.
A suitable test scenario should be created for the efficiency mapping of the AF-SynRM, whose 3D and optimization studies have been completed. In this study, the Maxwell Electromagnetics Suite (Maxwell 3D) program was used for FEM analysis of AF-SynRM. The current, voltage, power factor, Ld-Lq, Id-Iq, and torque data of the motor were recorded with FEM in the range of 0–3000 rpm at 100 rpm intervals. In
Figure 3, the test and data acquisition flow chart of the experimental study is given.
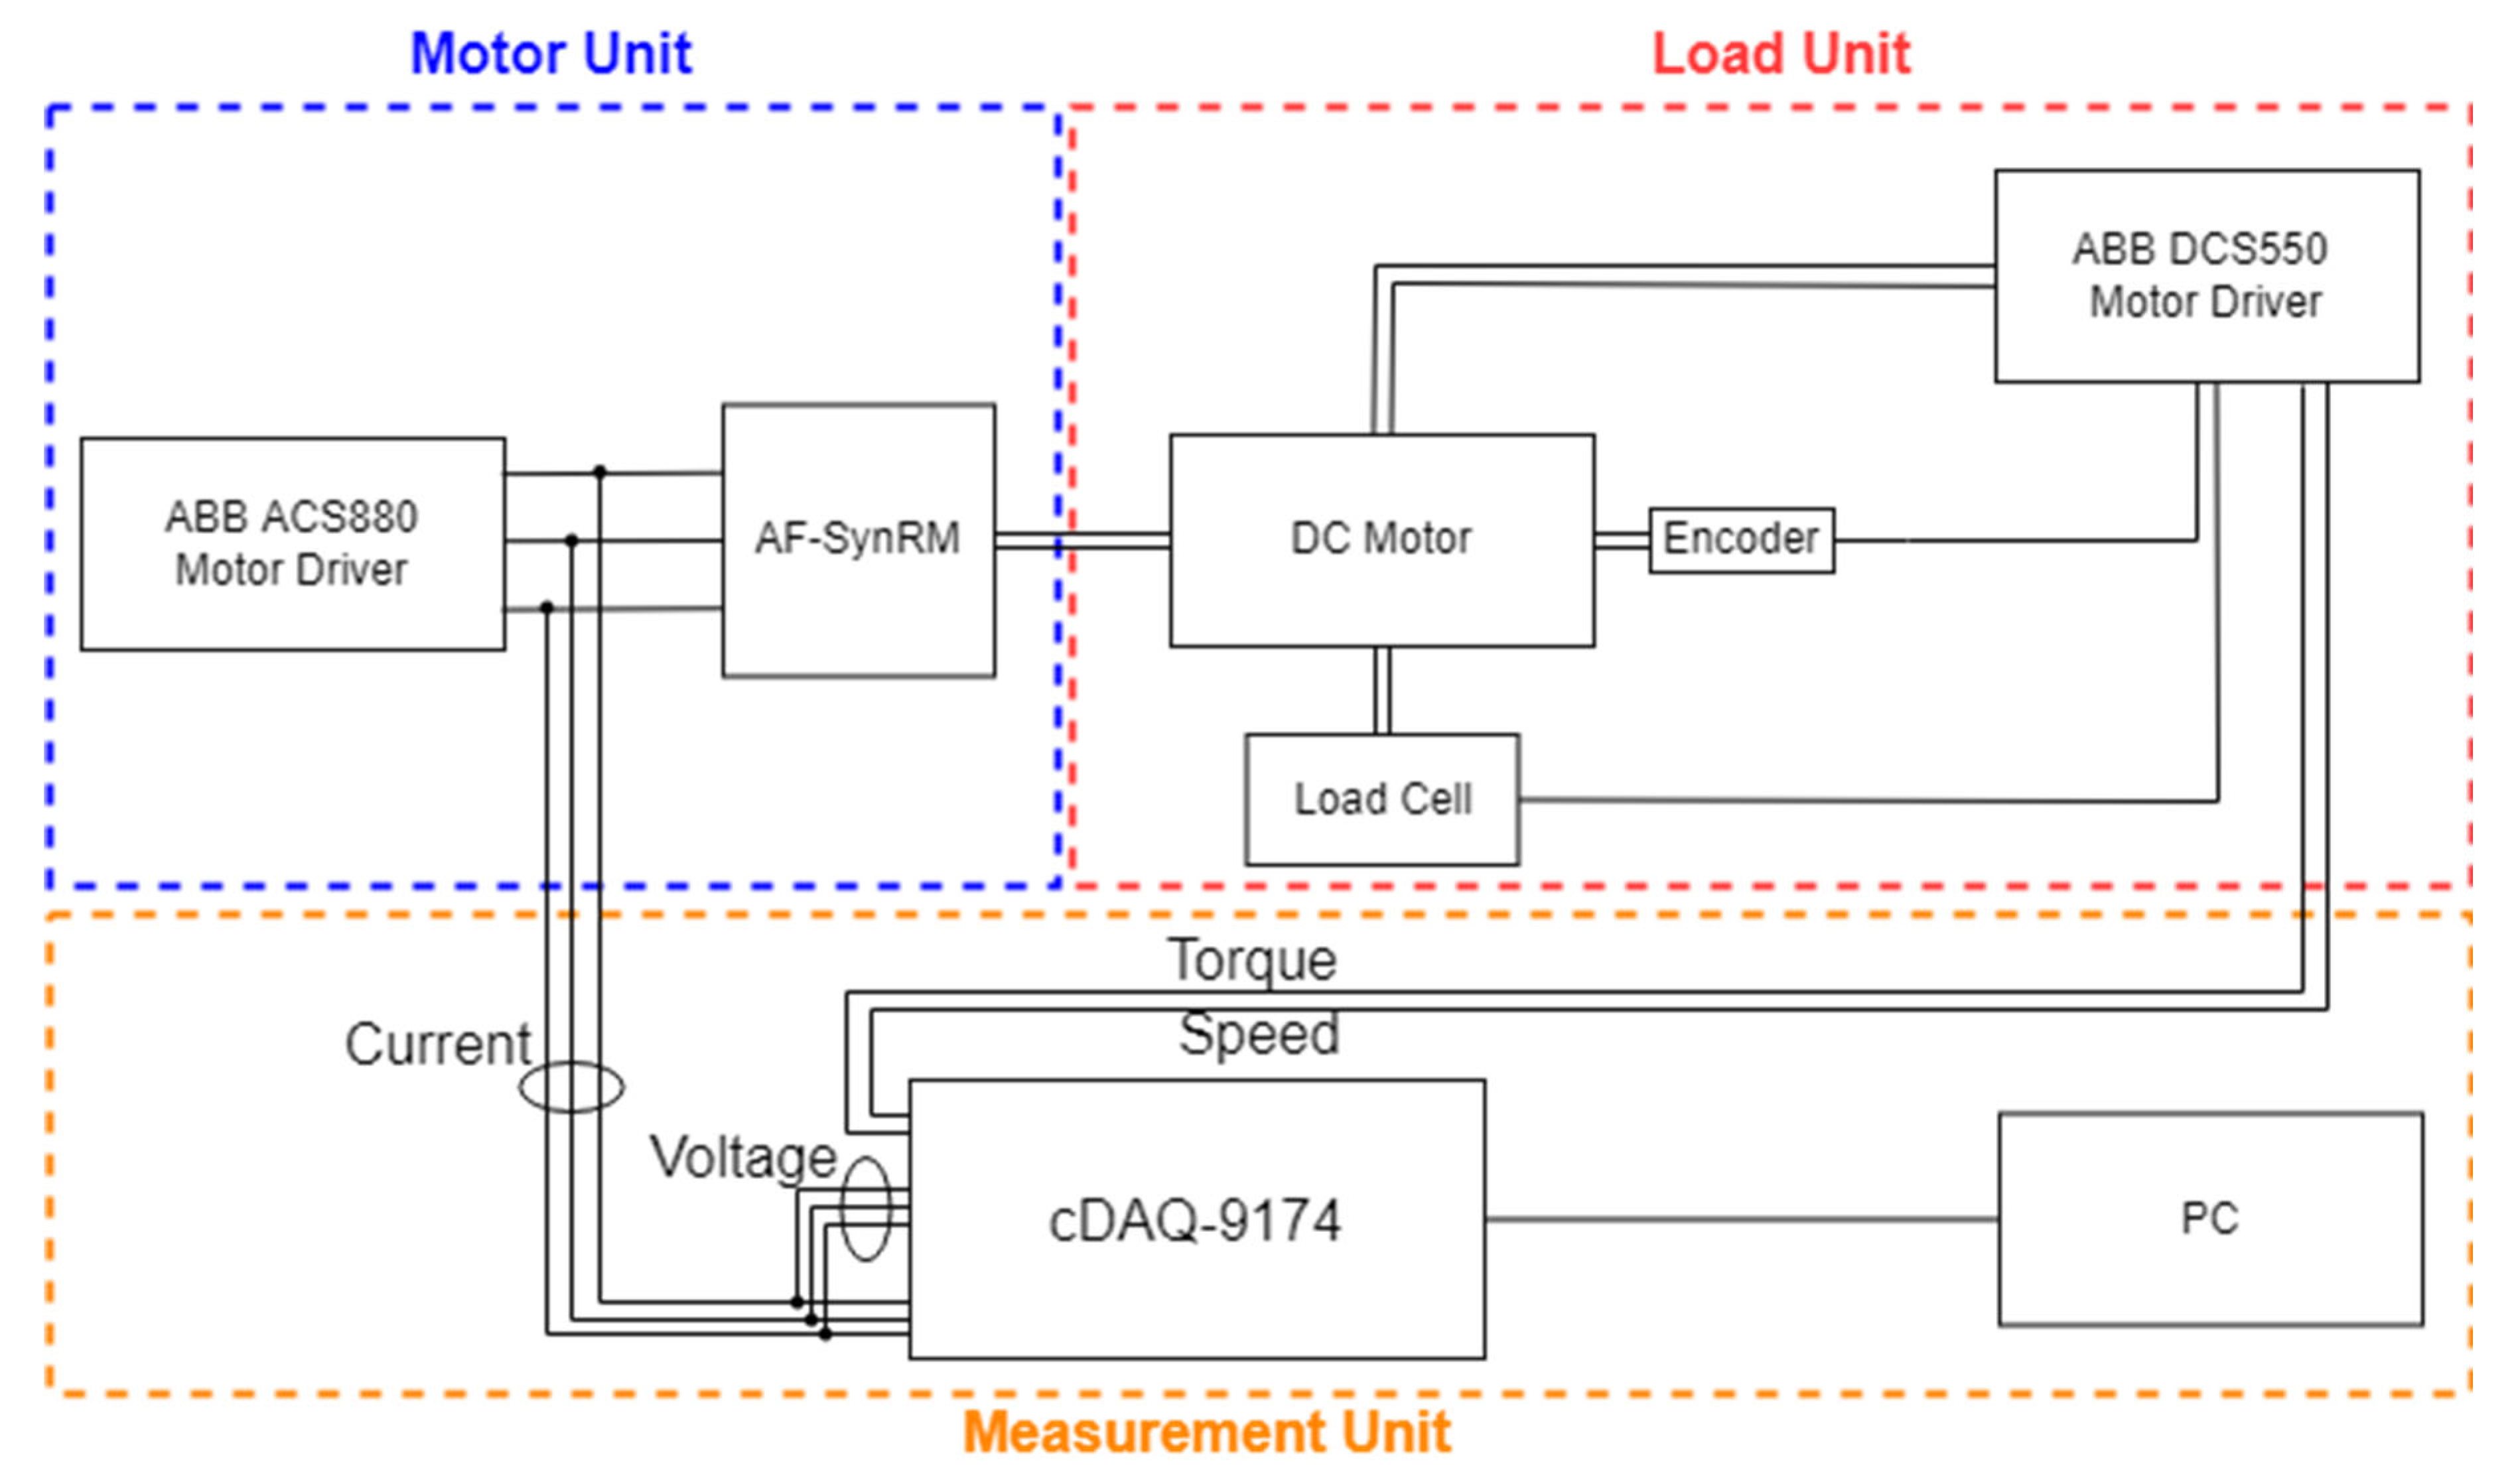
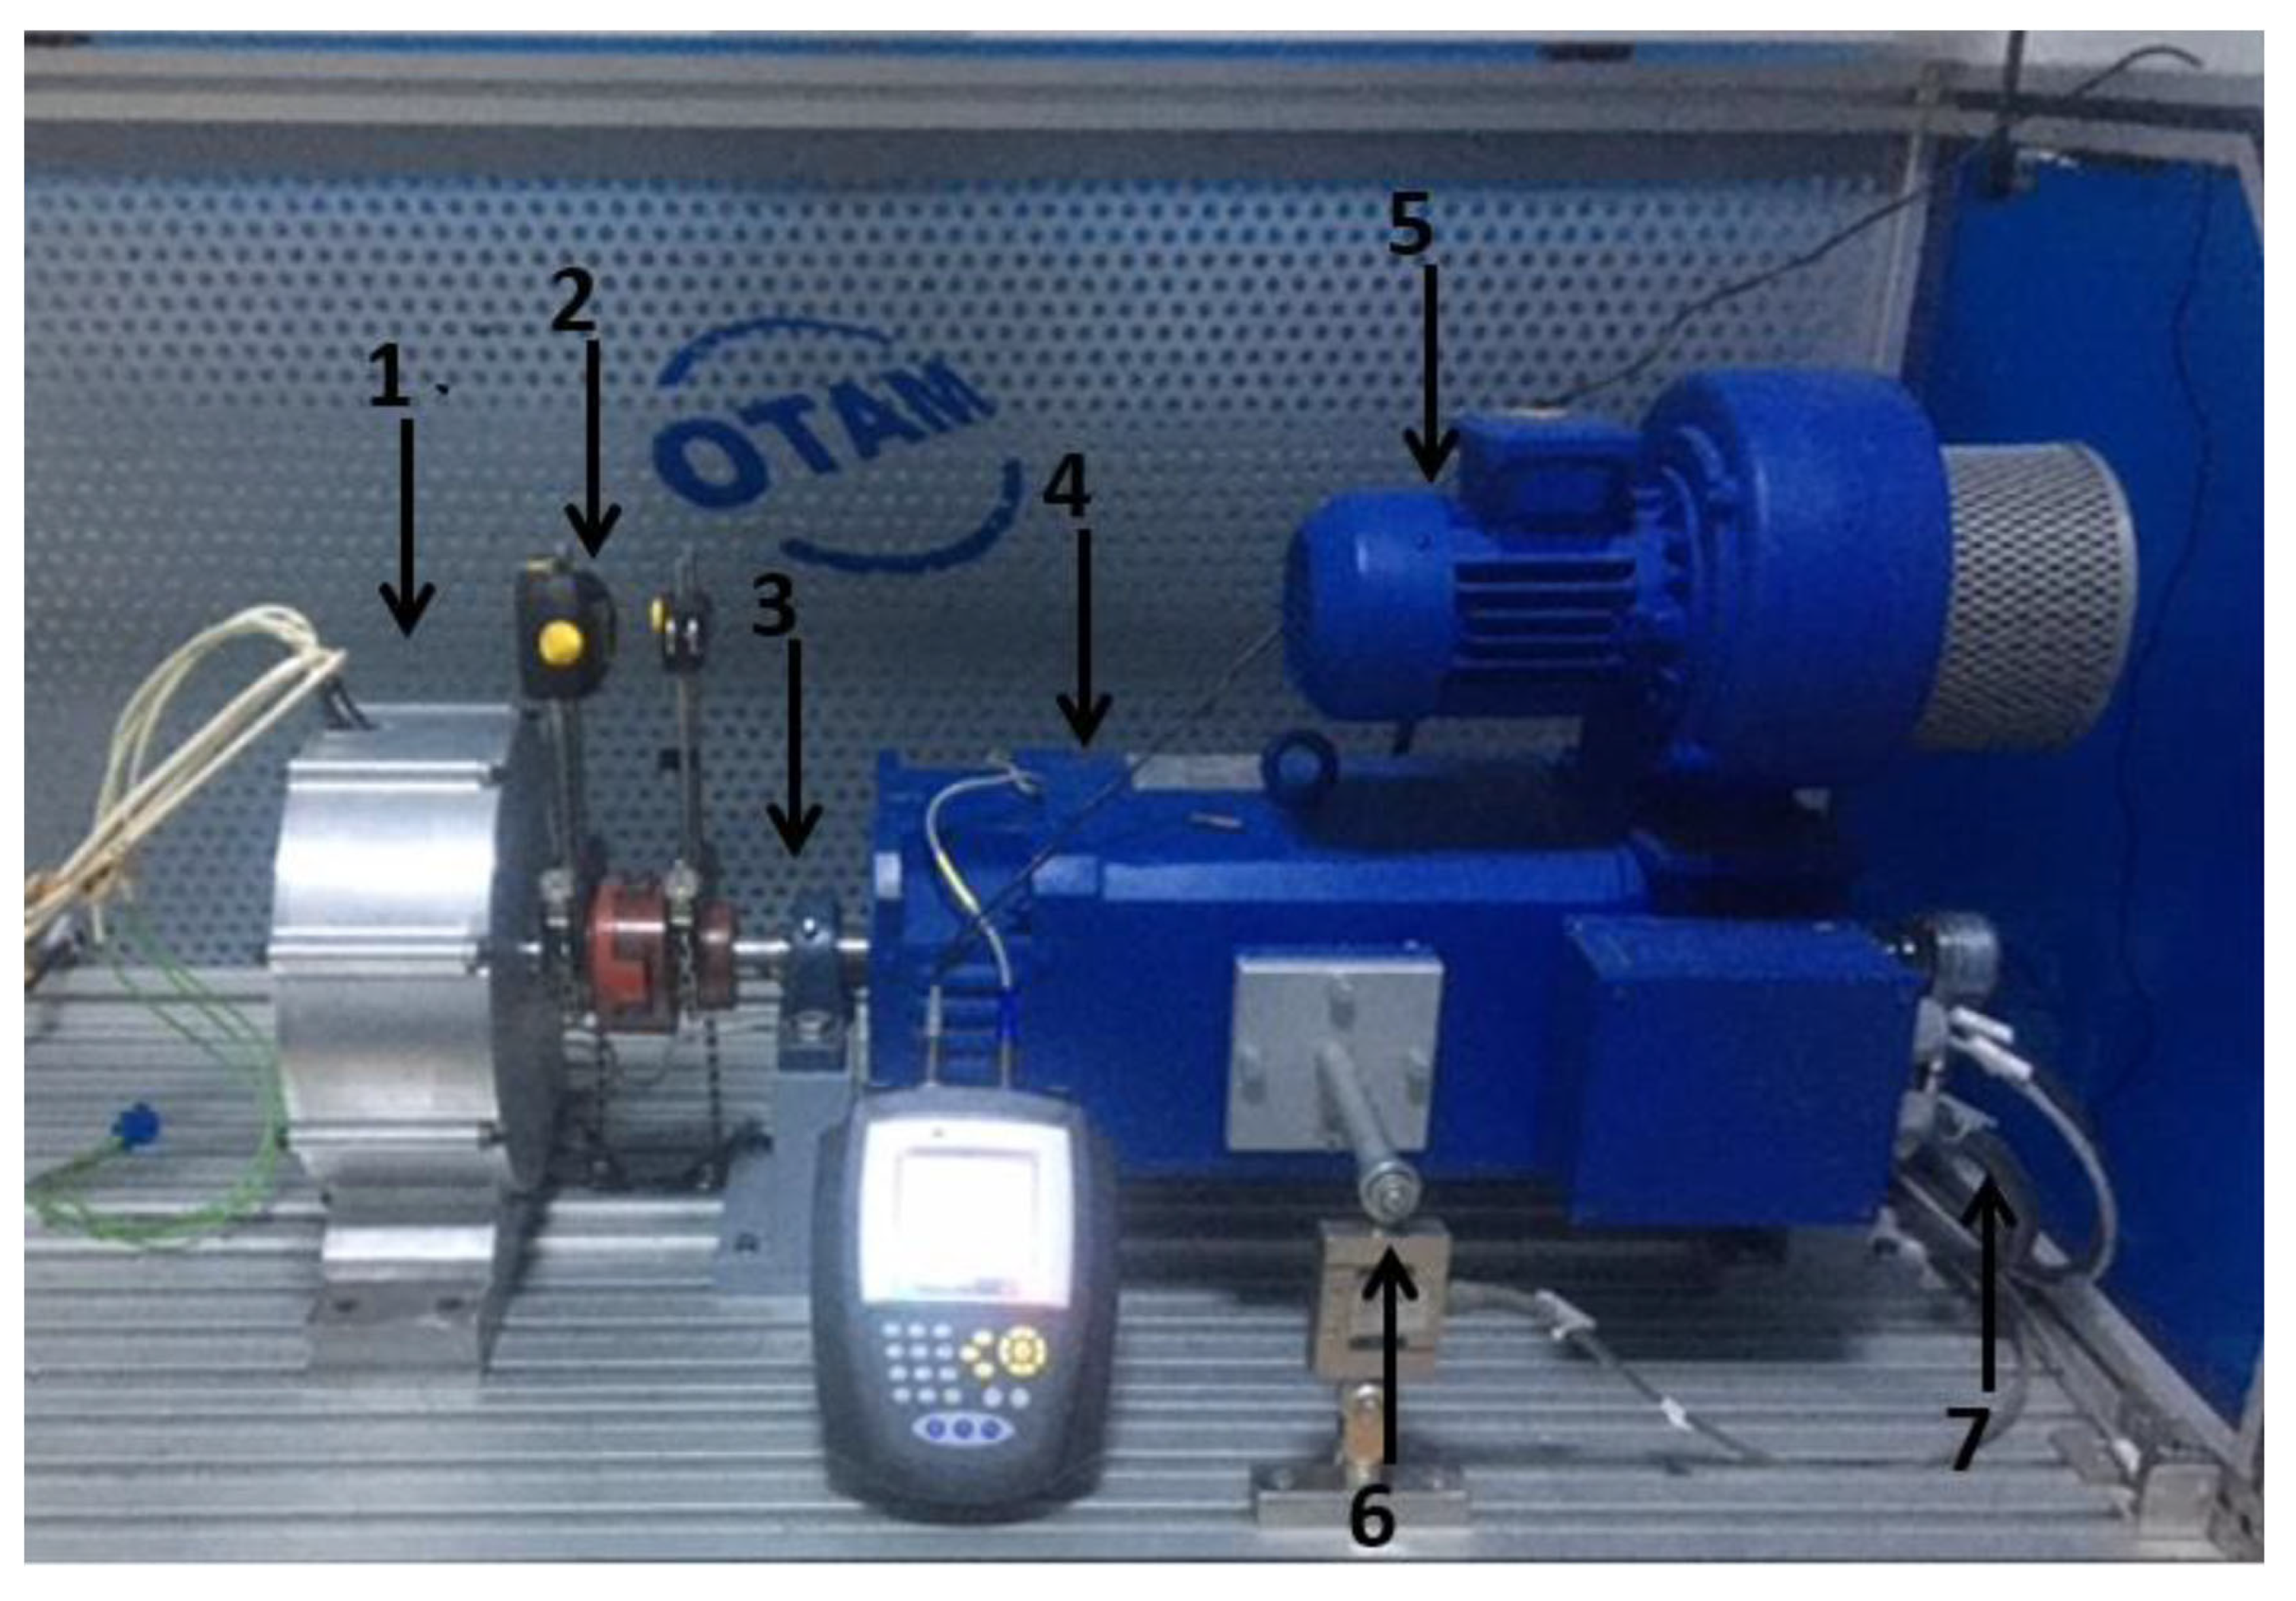
The test setup in
Figure 4 was used to verify the results obtained with FEM. The test setup has an area of 1500 mm × 700 mm. A 10 kW DC motor was used to load the test motor in the test setup. While the DC motor has a maximum speed of 4000 rpm, it also provides 42 Nm of nominal torque at 2270 rpm. In addition, a load cell that can operate up to 100 Nm is used for torque measurement, and an encoder is used for speed measurement.
While the ABB DCS-550 is used in the control of the DC motor forming the load side, the ABB ACS-880 motor drivers are used in the control of AF-SynRM. Load-side driver information was obtained with the I-LAB interface developed by OTAM. Motor parameters were recorded in the National Instrument Company NI cDAQ-9174 cabinet (Austin, TX, USA) and with the interface created in Labview software using NI9234-NI9225-NI9239 modules.
With the test setup, motor d-q axis currents, power factor, input/output powers, motor speed, torque, and input/output phase voltages were obtained. In the creation of the efficiency map, it is necessary to determine the torque values at different speeds. It must be ensured that the speed ranges
of the speed parameter are changed between a minimum value (
) and a maximum value (
). This process is provided by the ABB ACS 880. For each speed, the torque is varied between a minimum value (
) and a maximum value (
) in appropriately selected
steps to obtain a sufficient number of torque points. The I-LAB program allows the creation of test scenarios. With the test scenario created, the predetermined
value and the increasing torque values will be applied to the motor at different speeds at the same values. At each operating point, 4 s of data were obtained. All tests were carried out in accordance with the IEC 60034-30-2 standards applicable to the measurement of the efficiency classes of variable speed AC motors [
30].
3. Results
Both FEM and experimental studies were carried out within the framework of the procedure given in
Figure 3. The rotor speed was gradually increased from 0 to 3000 (30 speed points) in the speed range of 100 rpm. In each speed range, the motor was tested in 2 Nm intervals (9 torque stages) from 0 to 18 Nm, but the max torque level was chosen as 17.5 Nm, which corresponds to 125% of the nominal torque of the motor.
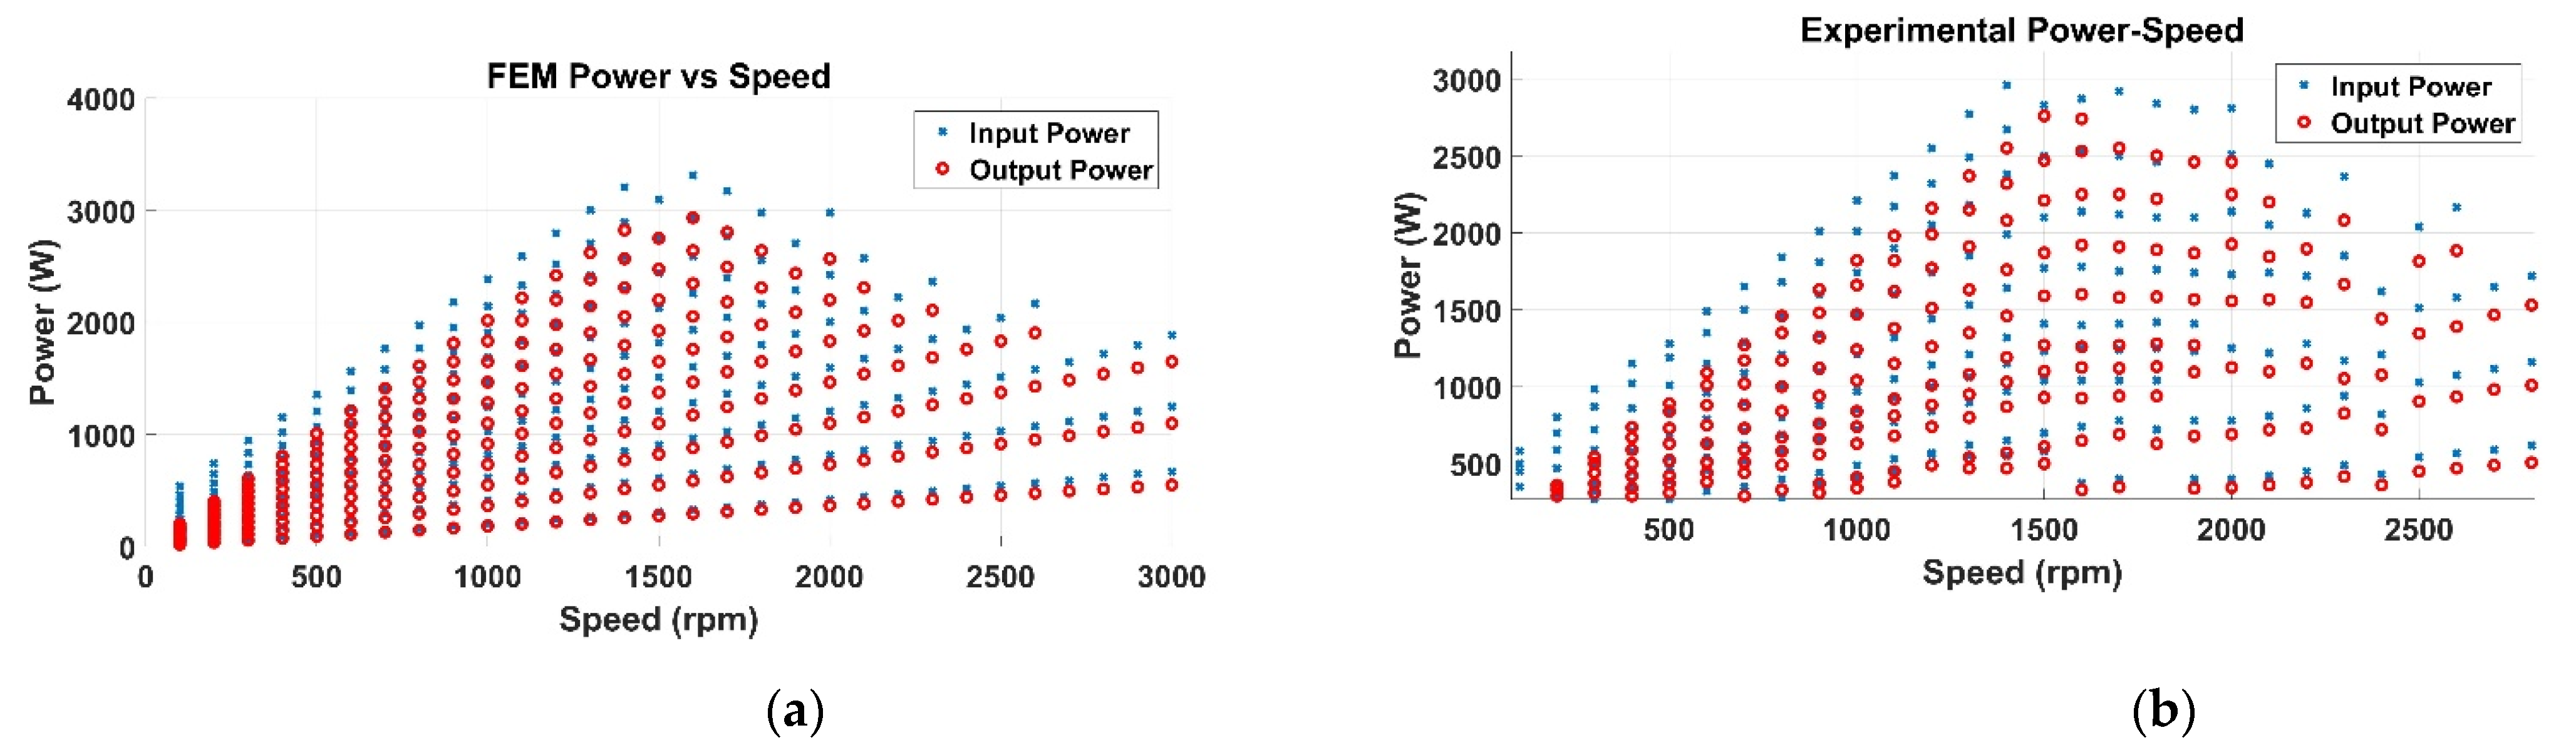
The FEM and experimentally obtained torque/speed and power/speed graphs are given in
Figure 5 and
Figure 6, respectively. When the figures are examined, it will be more useful to examine the graphics in two separate regions as the speed range up to the nominal speed of the motor (1500 rpm) and the speeds higher than the nominal speed of the motor. While the input power increases up to the nominal speed of the motor, the shaft torque remains constant. In operation at speeds higher than the rated speed, the input electrical power is almost constant, while the output mechanical power is slightly reduced. For this reason, while it is the constant torque region up to the nominal speed, the region where it operates at higher speeds than this speed value is expressed as the constant power region.
As can be seen from both the FEM and experimental results, while the MTPA point is around 65 degrees, it is seen that the current angle increases for the attenuation above the nominal speed (
Figure 7). Theoretically, although the maximum moment is 45 degrees, the current angle also increases as the barriers on the q-axis begin to saturate with the increase in load current.
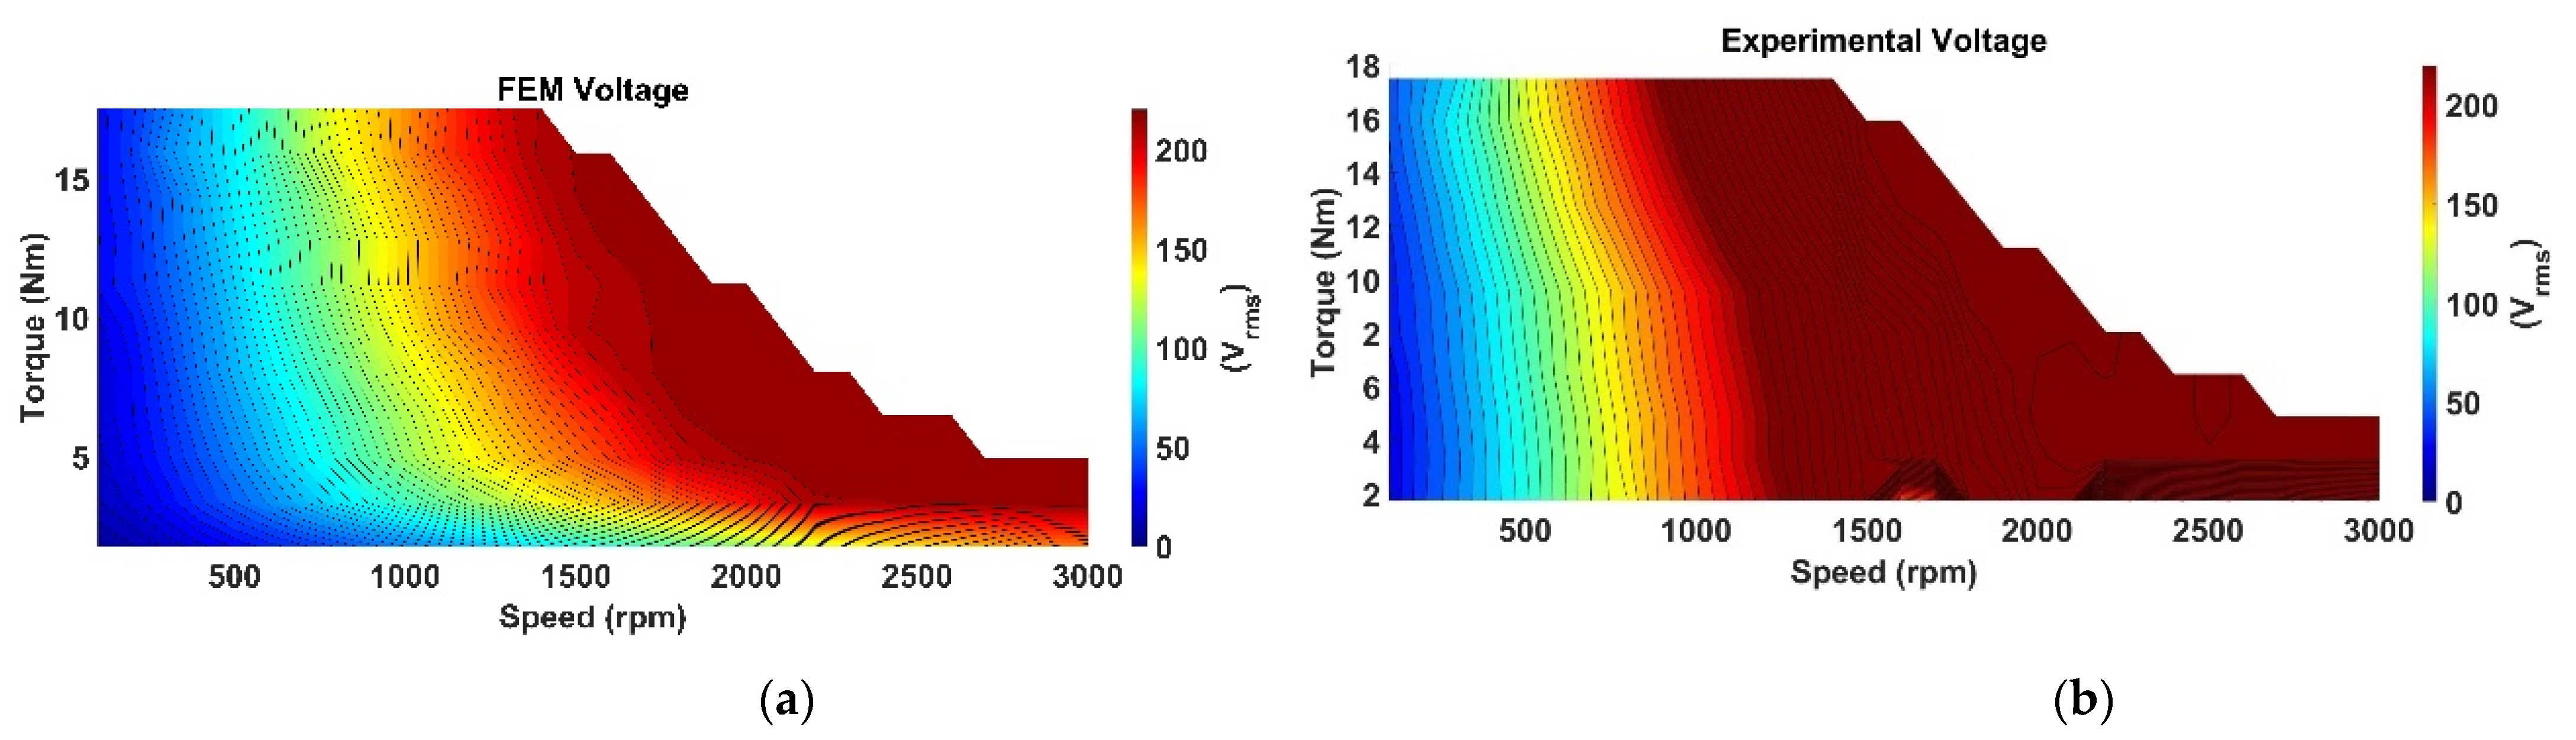
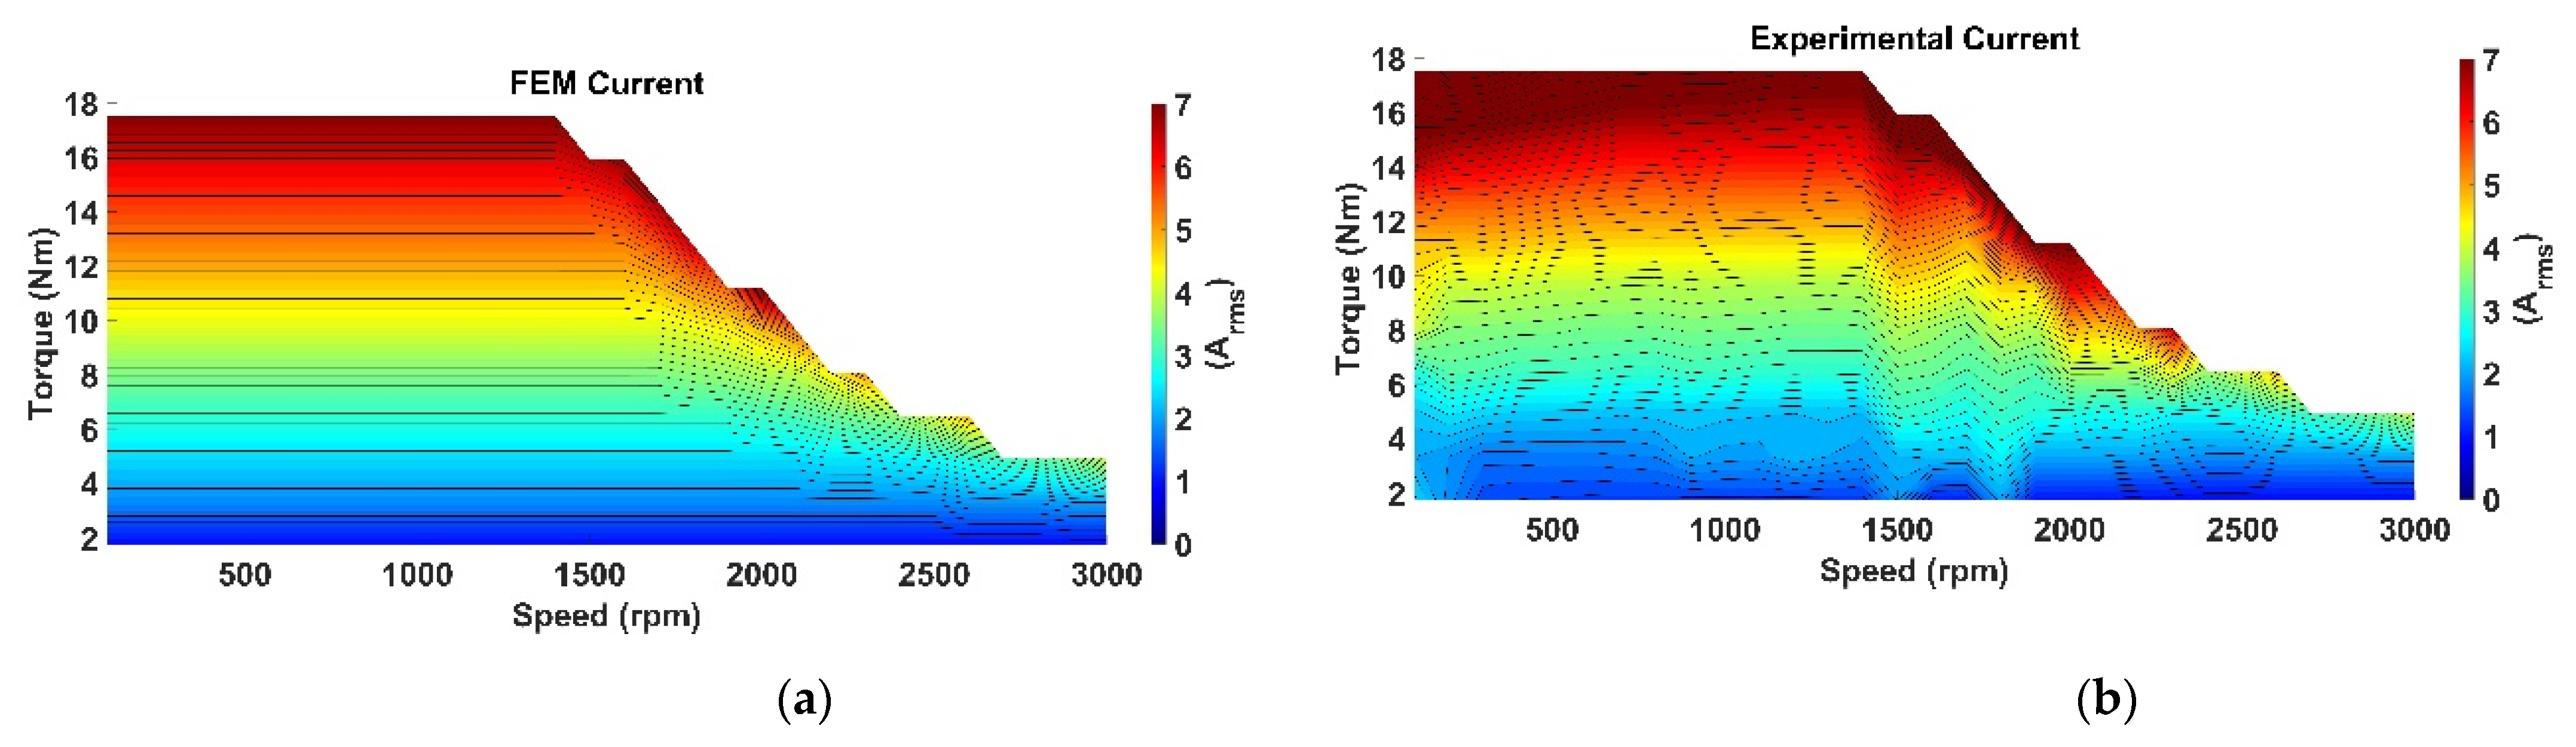
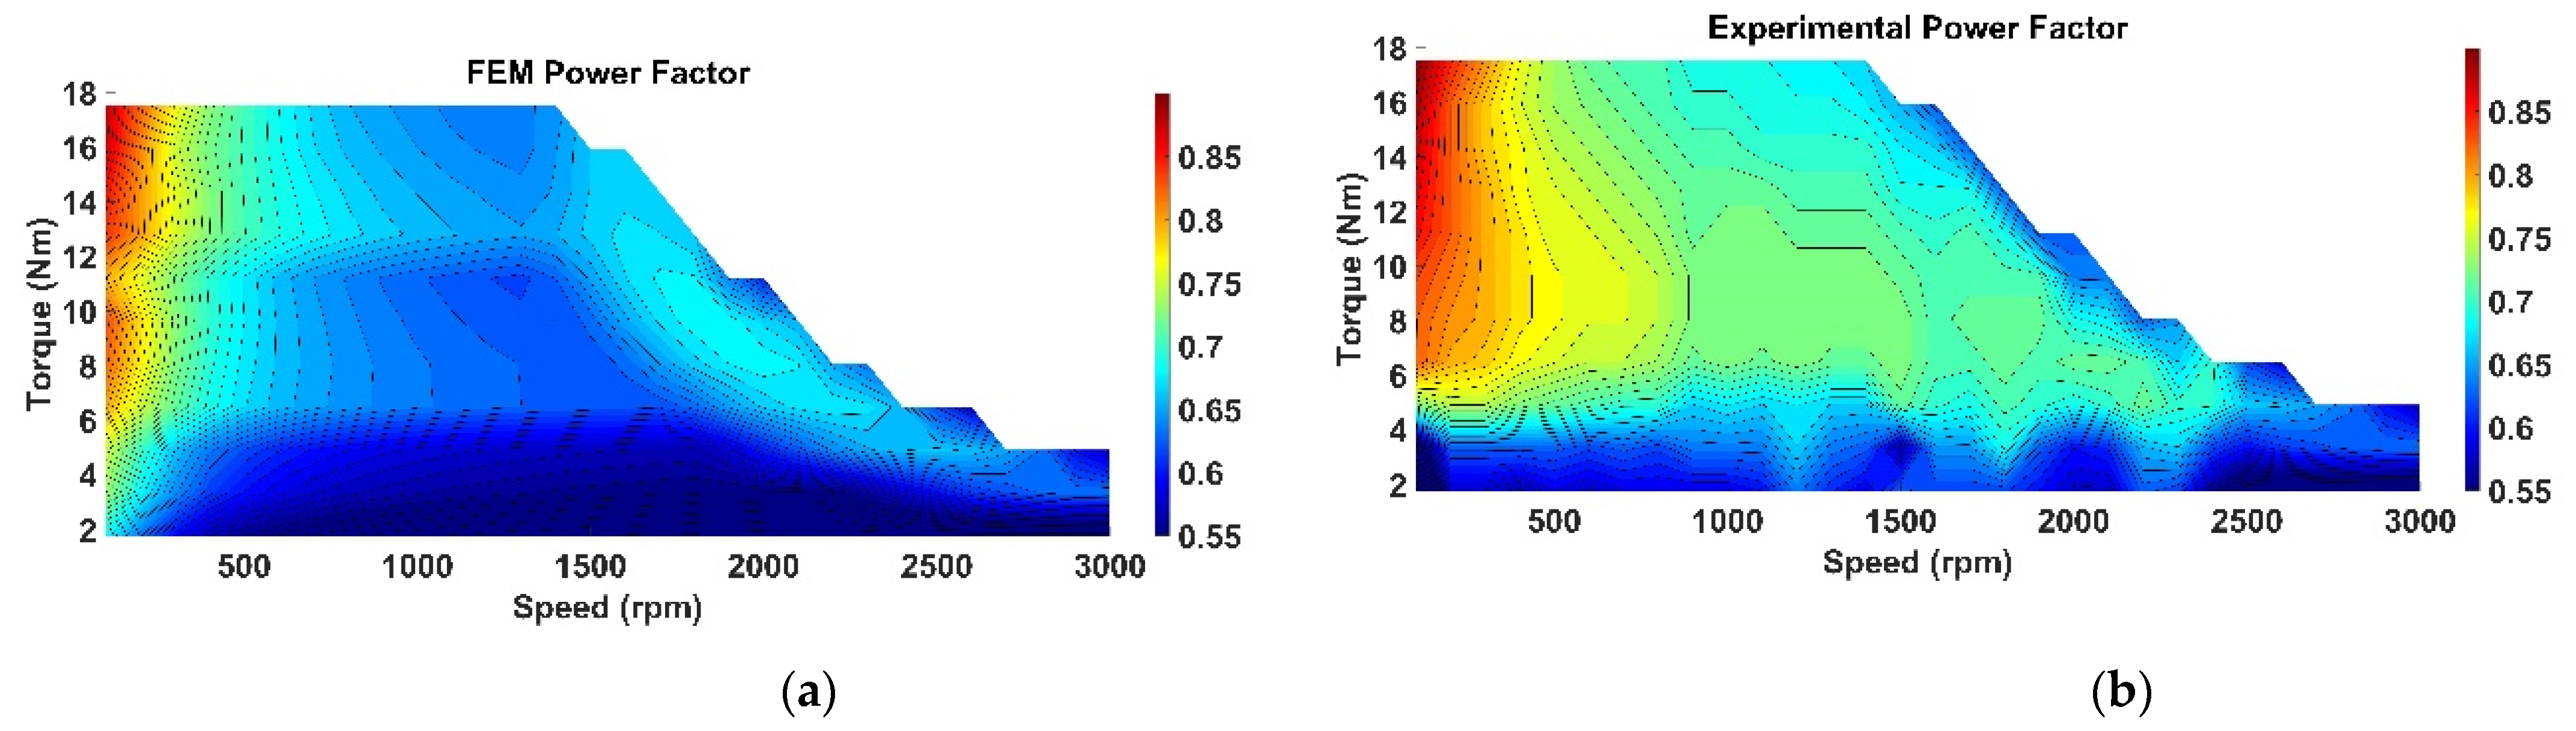
Figure 8 and
Figure 9 show the voltage and current values measured in the AF-SynRM under variable speed and load conditions. In
Figure 10, the curves of the power factor are also given. When the graphs are examined, current, voltage and power factor show similarities both in the FEM and experimental results. Motor phase voltages vary depending on the speed, regardless of the load. This change was observed more clearly in the experimental study. It has been observed that the nominal voltage value is applied to the windings at rated speeds and higher speeds. However, the power factor and current values vary with the load. It was observed that while the motor current approaches the limit values in the constant torque region, it drew more current to obtain the required output power in the constant power region. The power factor is around 0.7 at nominal speed and torque (
Figure 10). While the power factor is higher at low speeds, this value decreases as the motor accelerates to high speeds. Although there are similarities between FEM and experimental results, there are slight differences in the nominal operating region of the experimental results compared to the FEM results. These differences are due to the fact that the motor driver changes the current angle by recalculating it for each operating point.
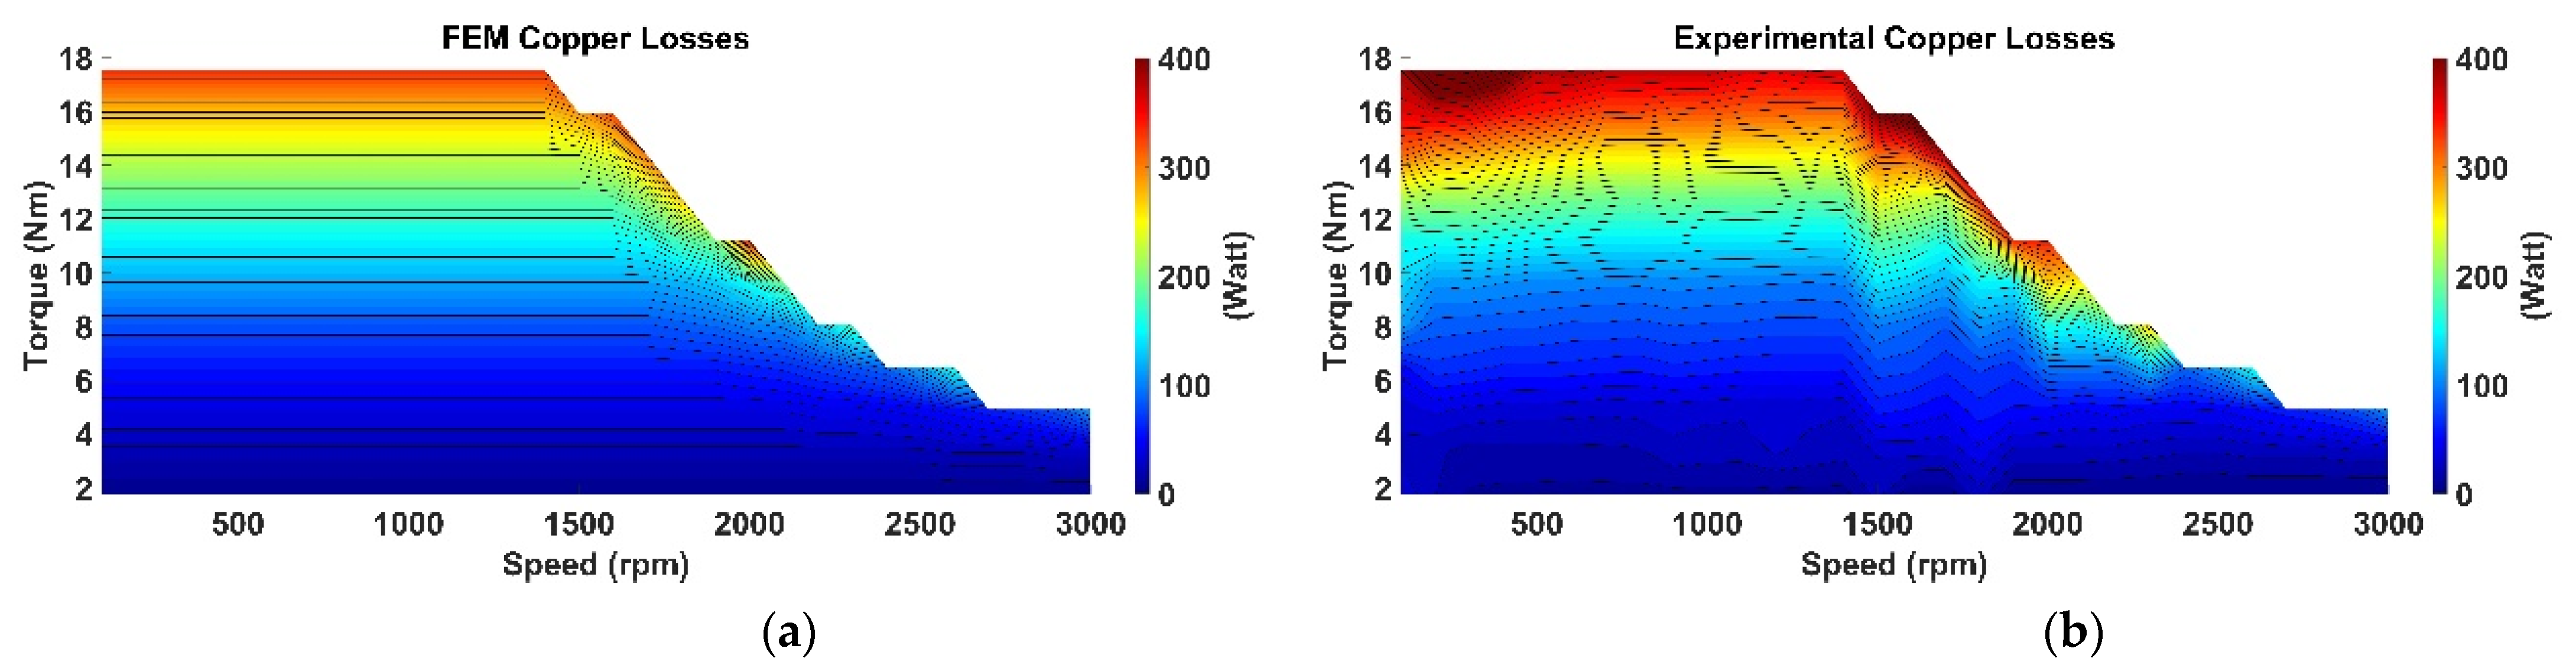
The efficiency map of the motor is important for the effective use of a motor in variable speed applications. The efficiency of the motor is obtained by the ratio of output power to input power. One factor that affects the efficiency is the copper losses in the windings. Since copper losses depend on the motor current, they vary regardless of speed. Copper losses increase as the motor load increases. The graphs of the FEM and experimentally obtained copper losses in the AF-SynRM are given in
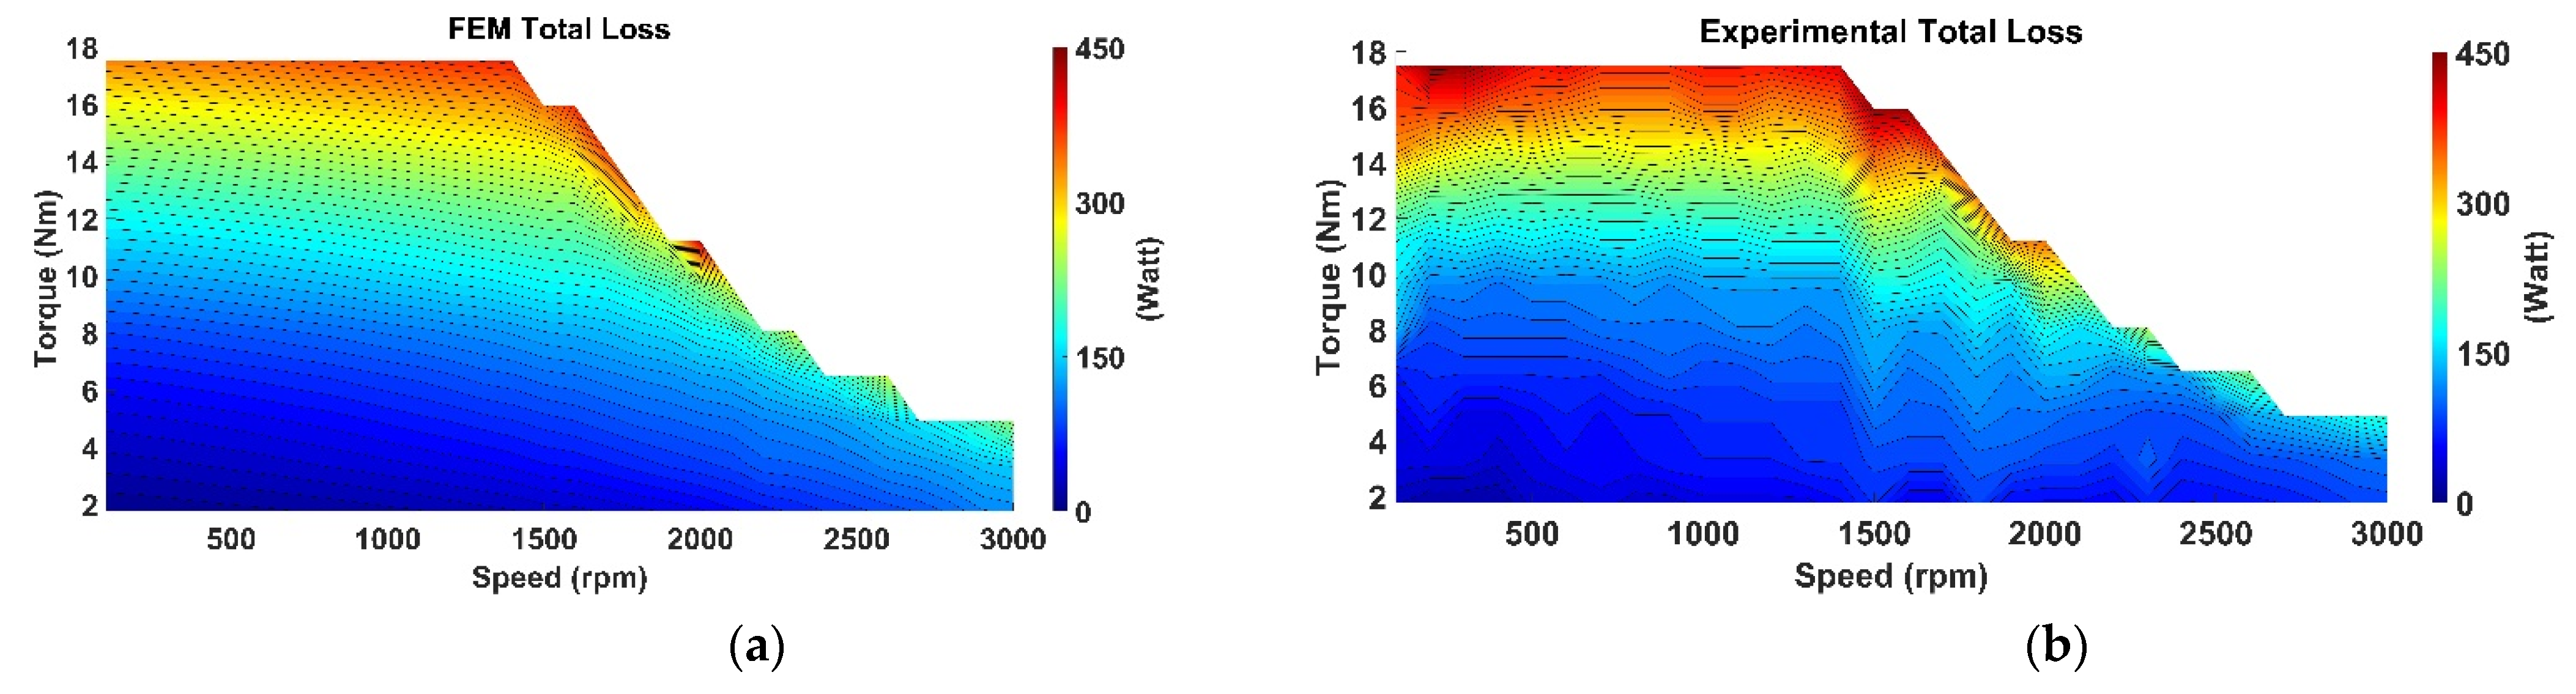
Figure 11. In both experimental studies with FEM, it is seen that around 150 W of copper loss occurs in nominal operating conditions and around 400 W in the maximum current regions. Core losses and mechanical losses also occur in the AF-SynRM. Output power is obtained when all electrical and mechanical losses are subtracted from the input power. Mechanical losses do not show speed-independent properties like copper losses. While the mechanical losses vary according to the motor speed, the core losses vary with the motor voltage. For this reason, the total loss graph given in
Figure 12 differs from the copper loss graph. These differences are observed both in FEM and experimentally. It is also seen in the graphs of the total losses that the losses do not depend on a single parameter and vary depending on the speed and load.
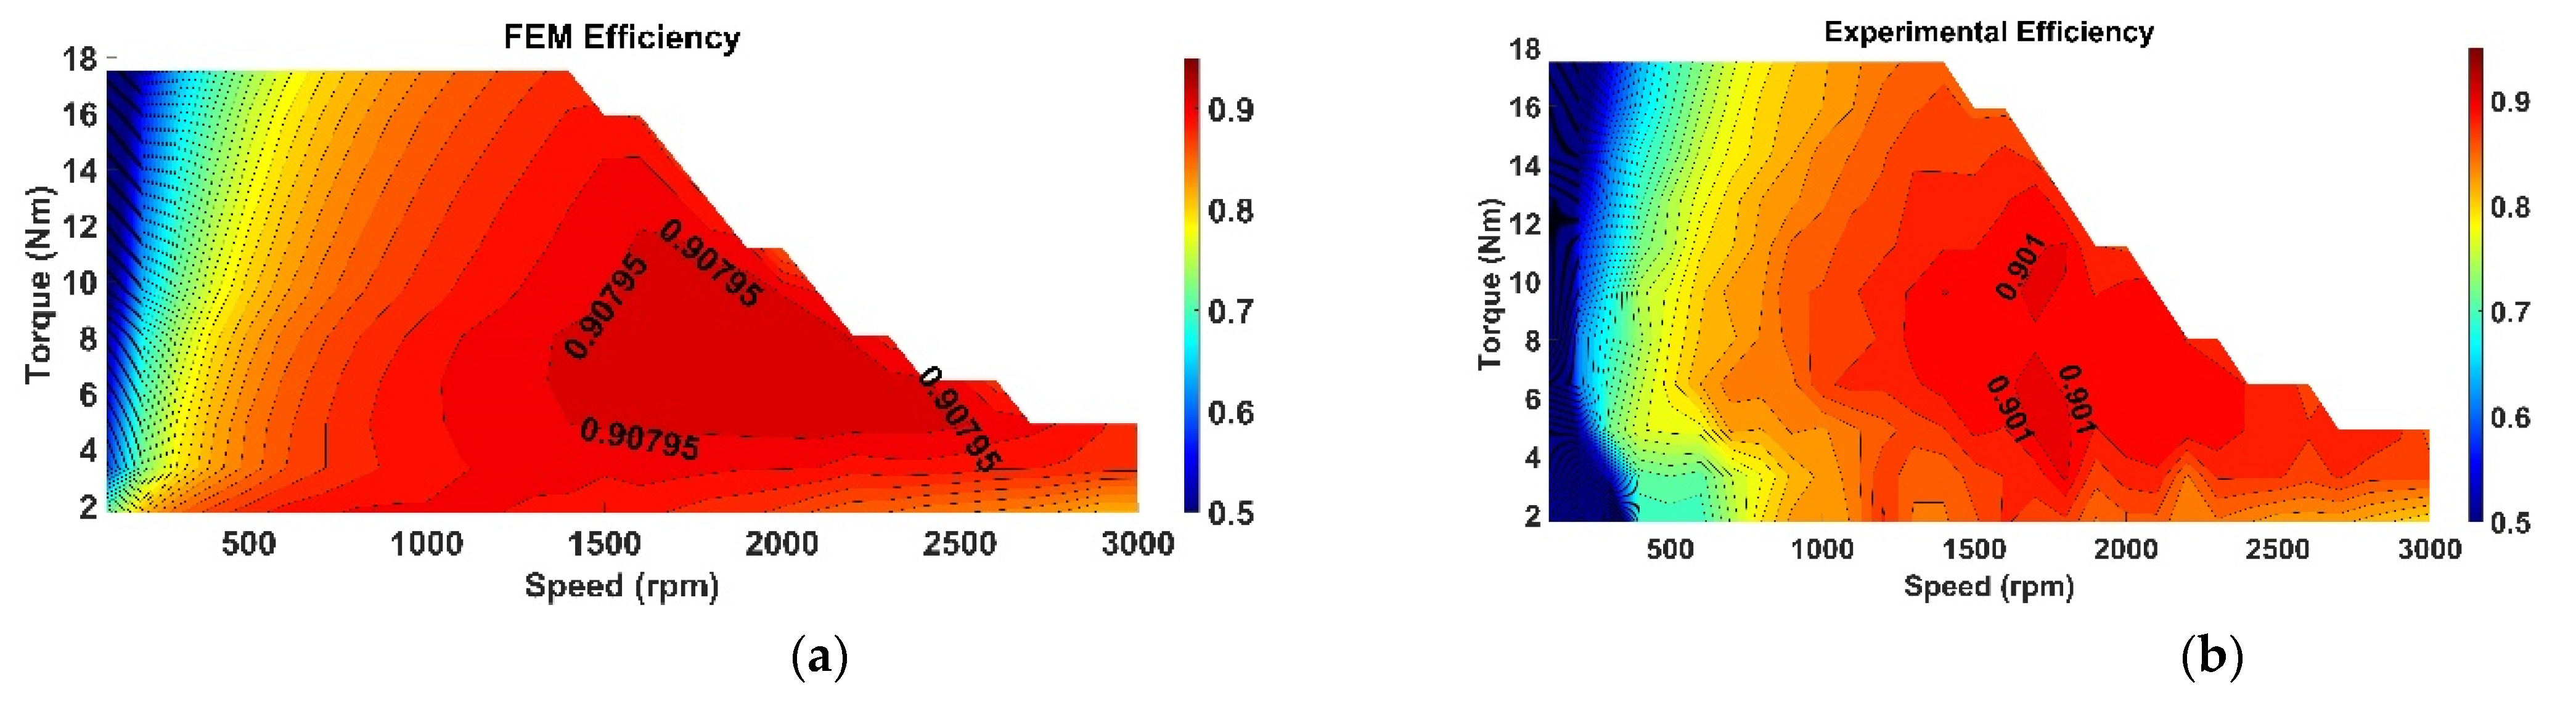
When efficiency graphs (
Figure 13) are examined, both the FEM and experimental data are consistent. While the efficiency is around 90% in the constant torque region and nominal torque values, above the nominal speed and around 50% load, the efficiency is slightly higher. In this case, it shows that the designed motor is slightly more efficient in high-speed driving.
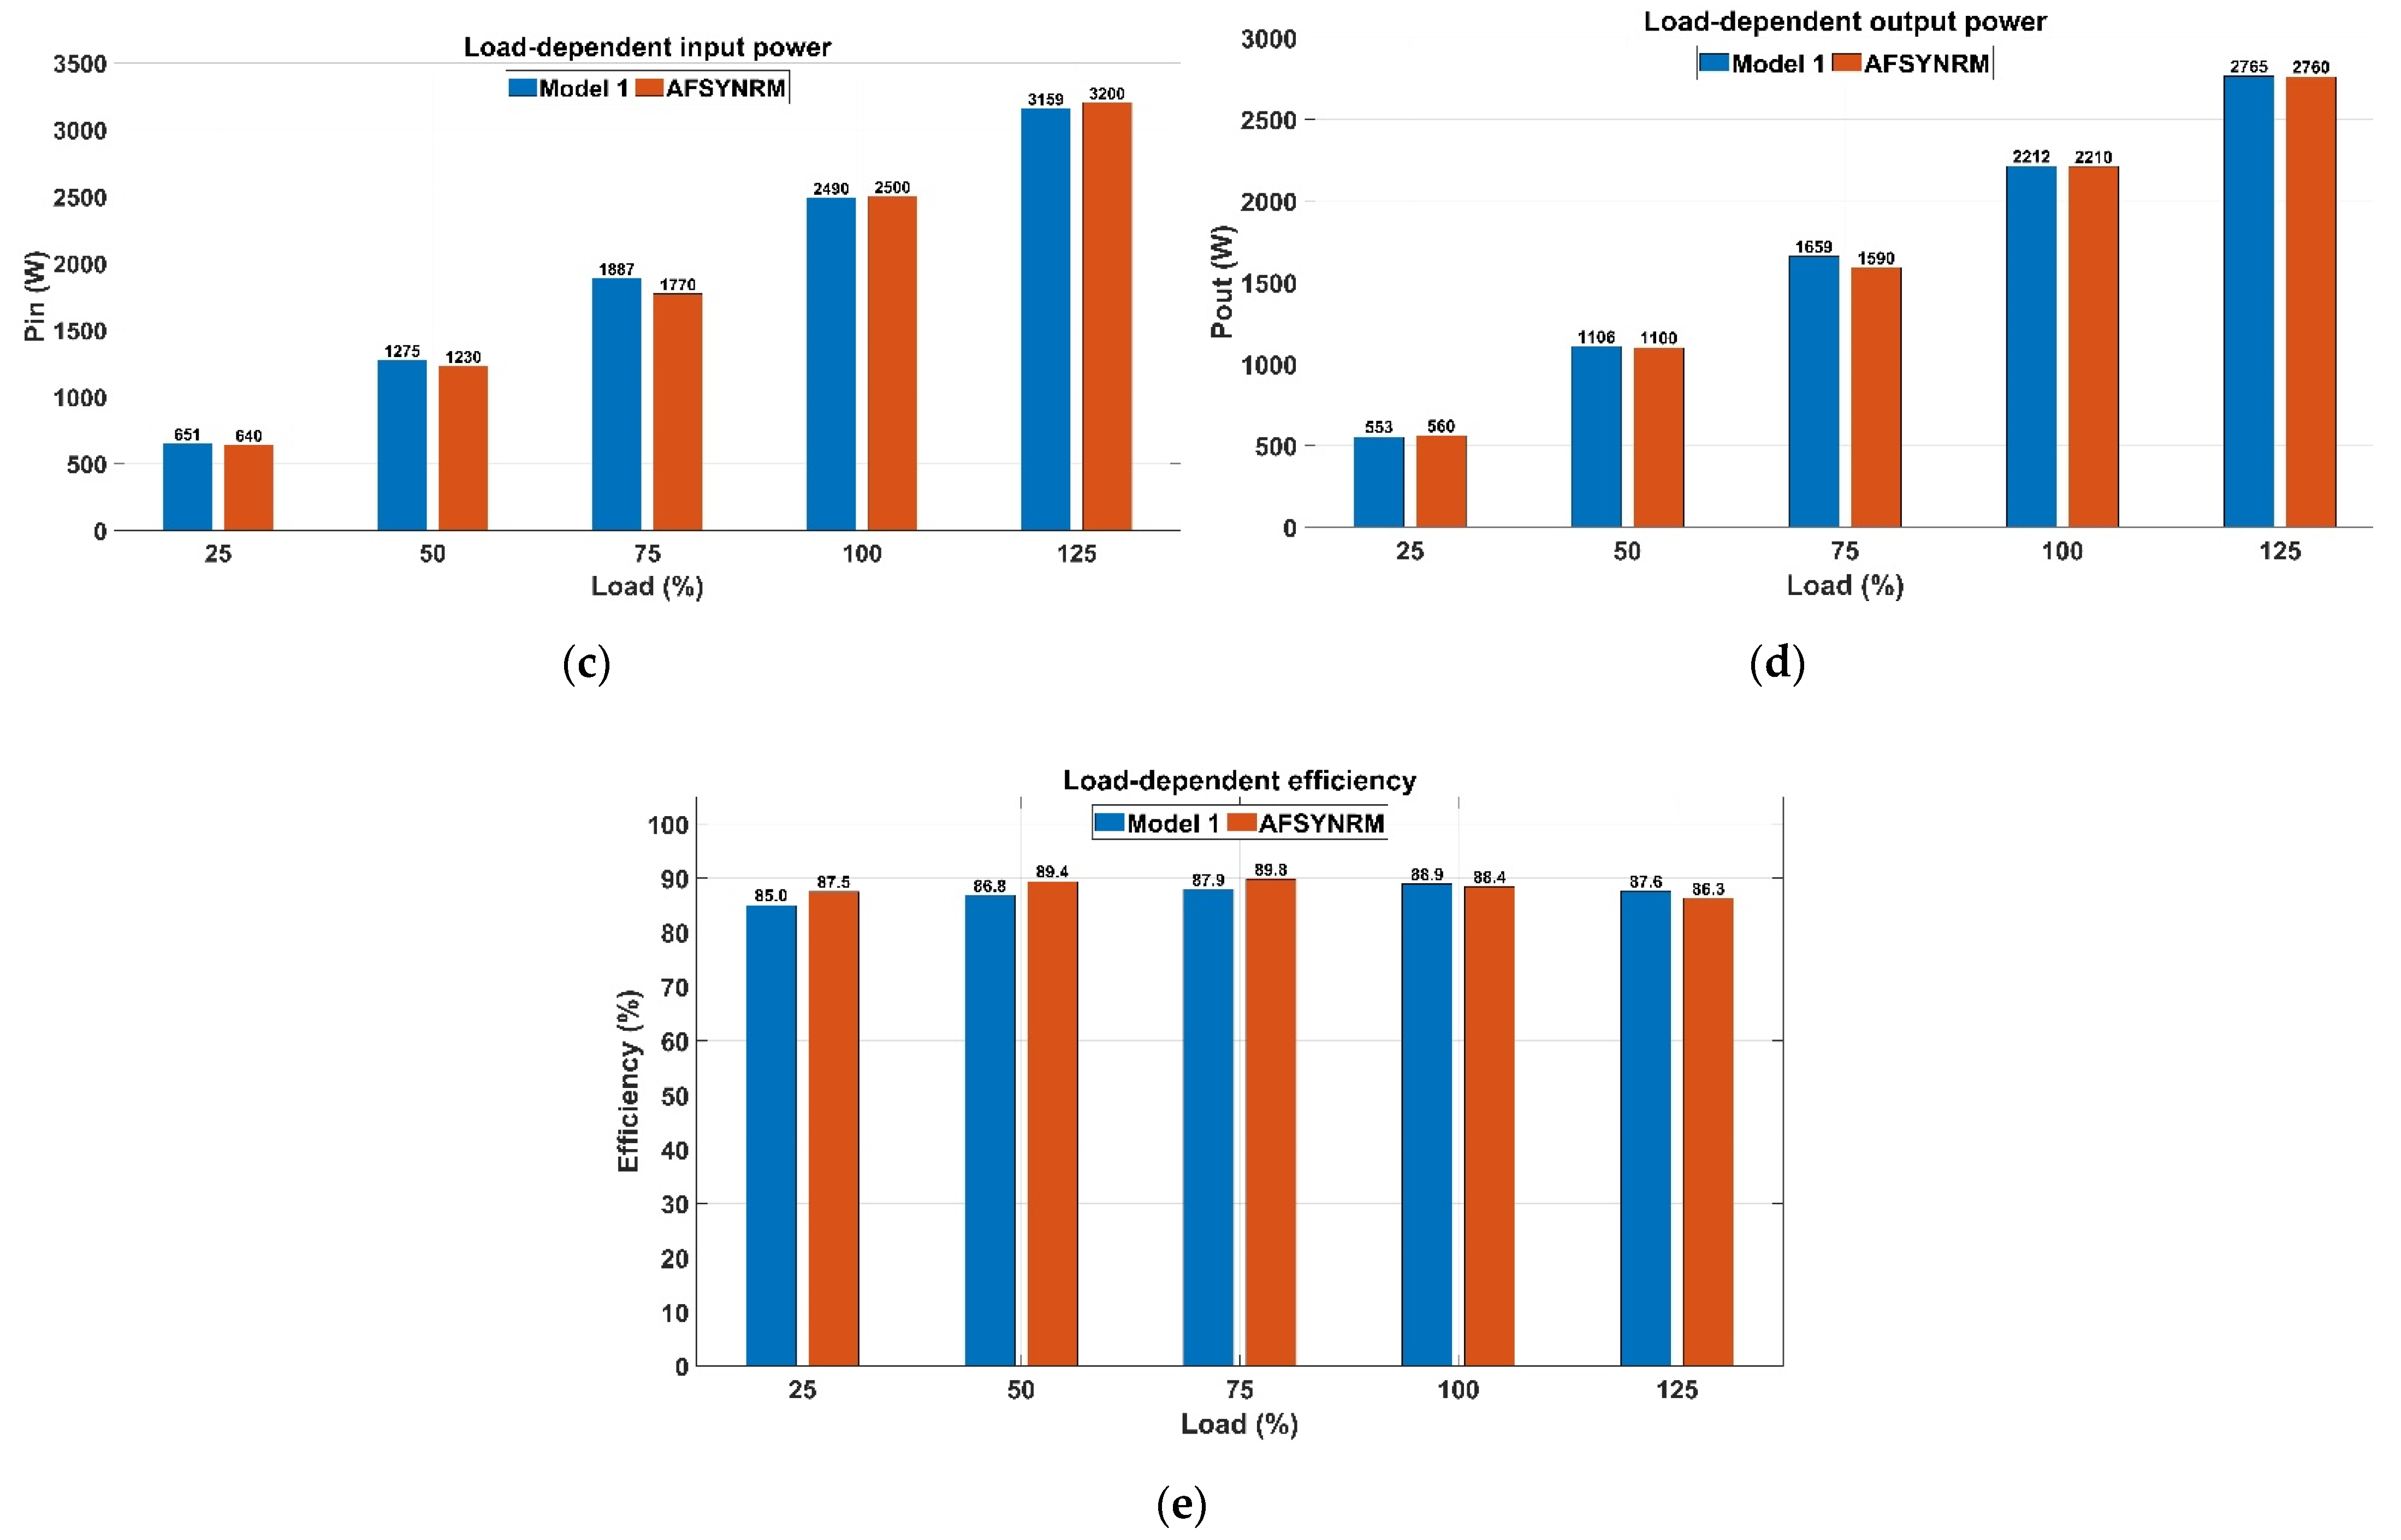
In order to make the obtained results more meaningful, the experimental results were compared with radial flux motors of the same output power. The motor referenced as Model 1 is 2.2 kW and 1500 rpm [
31]. The other motor, referred to as Model 2, has 2.2 kW and 3000 rpm [
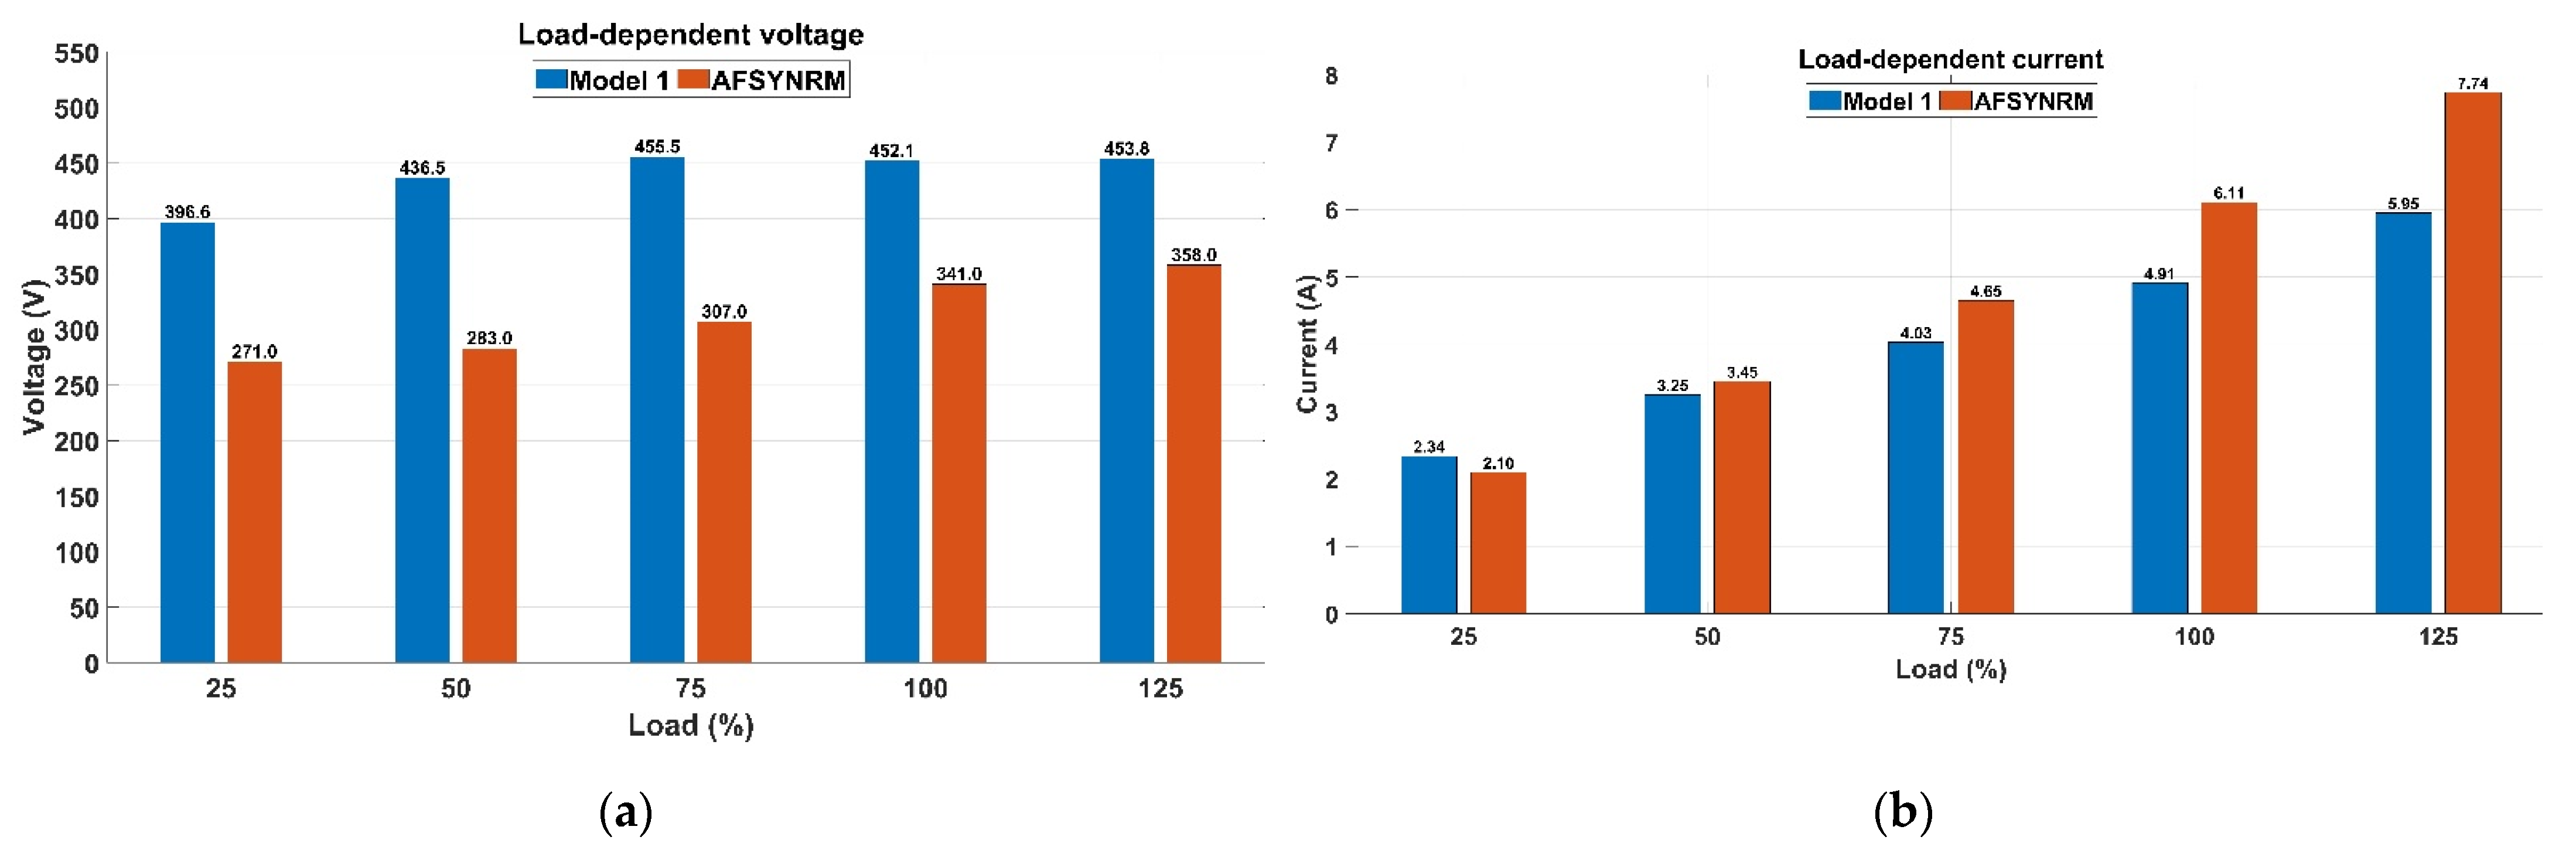
32]. The comparison results of the AF-SynRM and Model 1 are presented in
Figure 14.
As can be seen in
Figure 14, although the voltage and current levels of the motors have different values due to the drivers used, the input and output power levels are close to each other at the same load torque values. According to the performance values measured at 1500 rpm, the AF-SynRM motor efficiency values are better than the radial flux motor below the full load value, while the efficiency value is 1.25% lower than the rated load. At full load, the efficiency values of both motors are very close to each other.
Another study used for comparison purposes is the study published by Jorge and Estima [
32]. In this study, 2.2 kW 1500 rpm and 3000 rpm motor test data were taken as references. According to the efficiency map graph obtained for 2.2 kW 1500 rpm motor test data, the highest efficiency value is 88.4%, and this value is around the full load and nominal speed. These values are similar to the proposed AF-SynRM performance values, and the presented values are consistent. One of the factors affecting efficiency at high speeds is the material structure used in the motor. Since the rotor is manufactured of solid, non-laminated steel, it is necessary to calculate the rotor losses. Higher harmonics can cause significant losses even though the rotor rotates at synchronous speed. When the motor operates at high speeds, the inverter supply frequency also increases. Depending on the frequency increase, the losses in the cores increase. In addition, the manufactured motor was optimized for 2.2 kW 1500 rpm, and the experimental studies were realized at the different drive and current angles. As a result of this, while the published test data for 2.2 kW 3000 rpm motor, the efficiency value is 88.4% at full load values, this value is 86.2% for AF-SynRM. It is seen that there is a difference of approximately 2%. According to the comparison results for both models, the performance values of the presented motor model are within the given regulation limits. They are similar to the radial flux motors manufactured and optimized for industrial purposes.
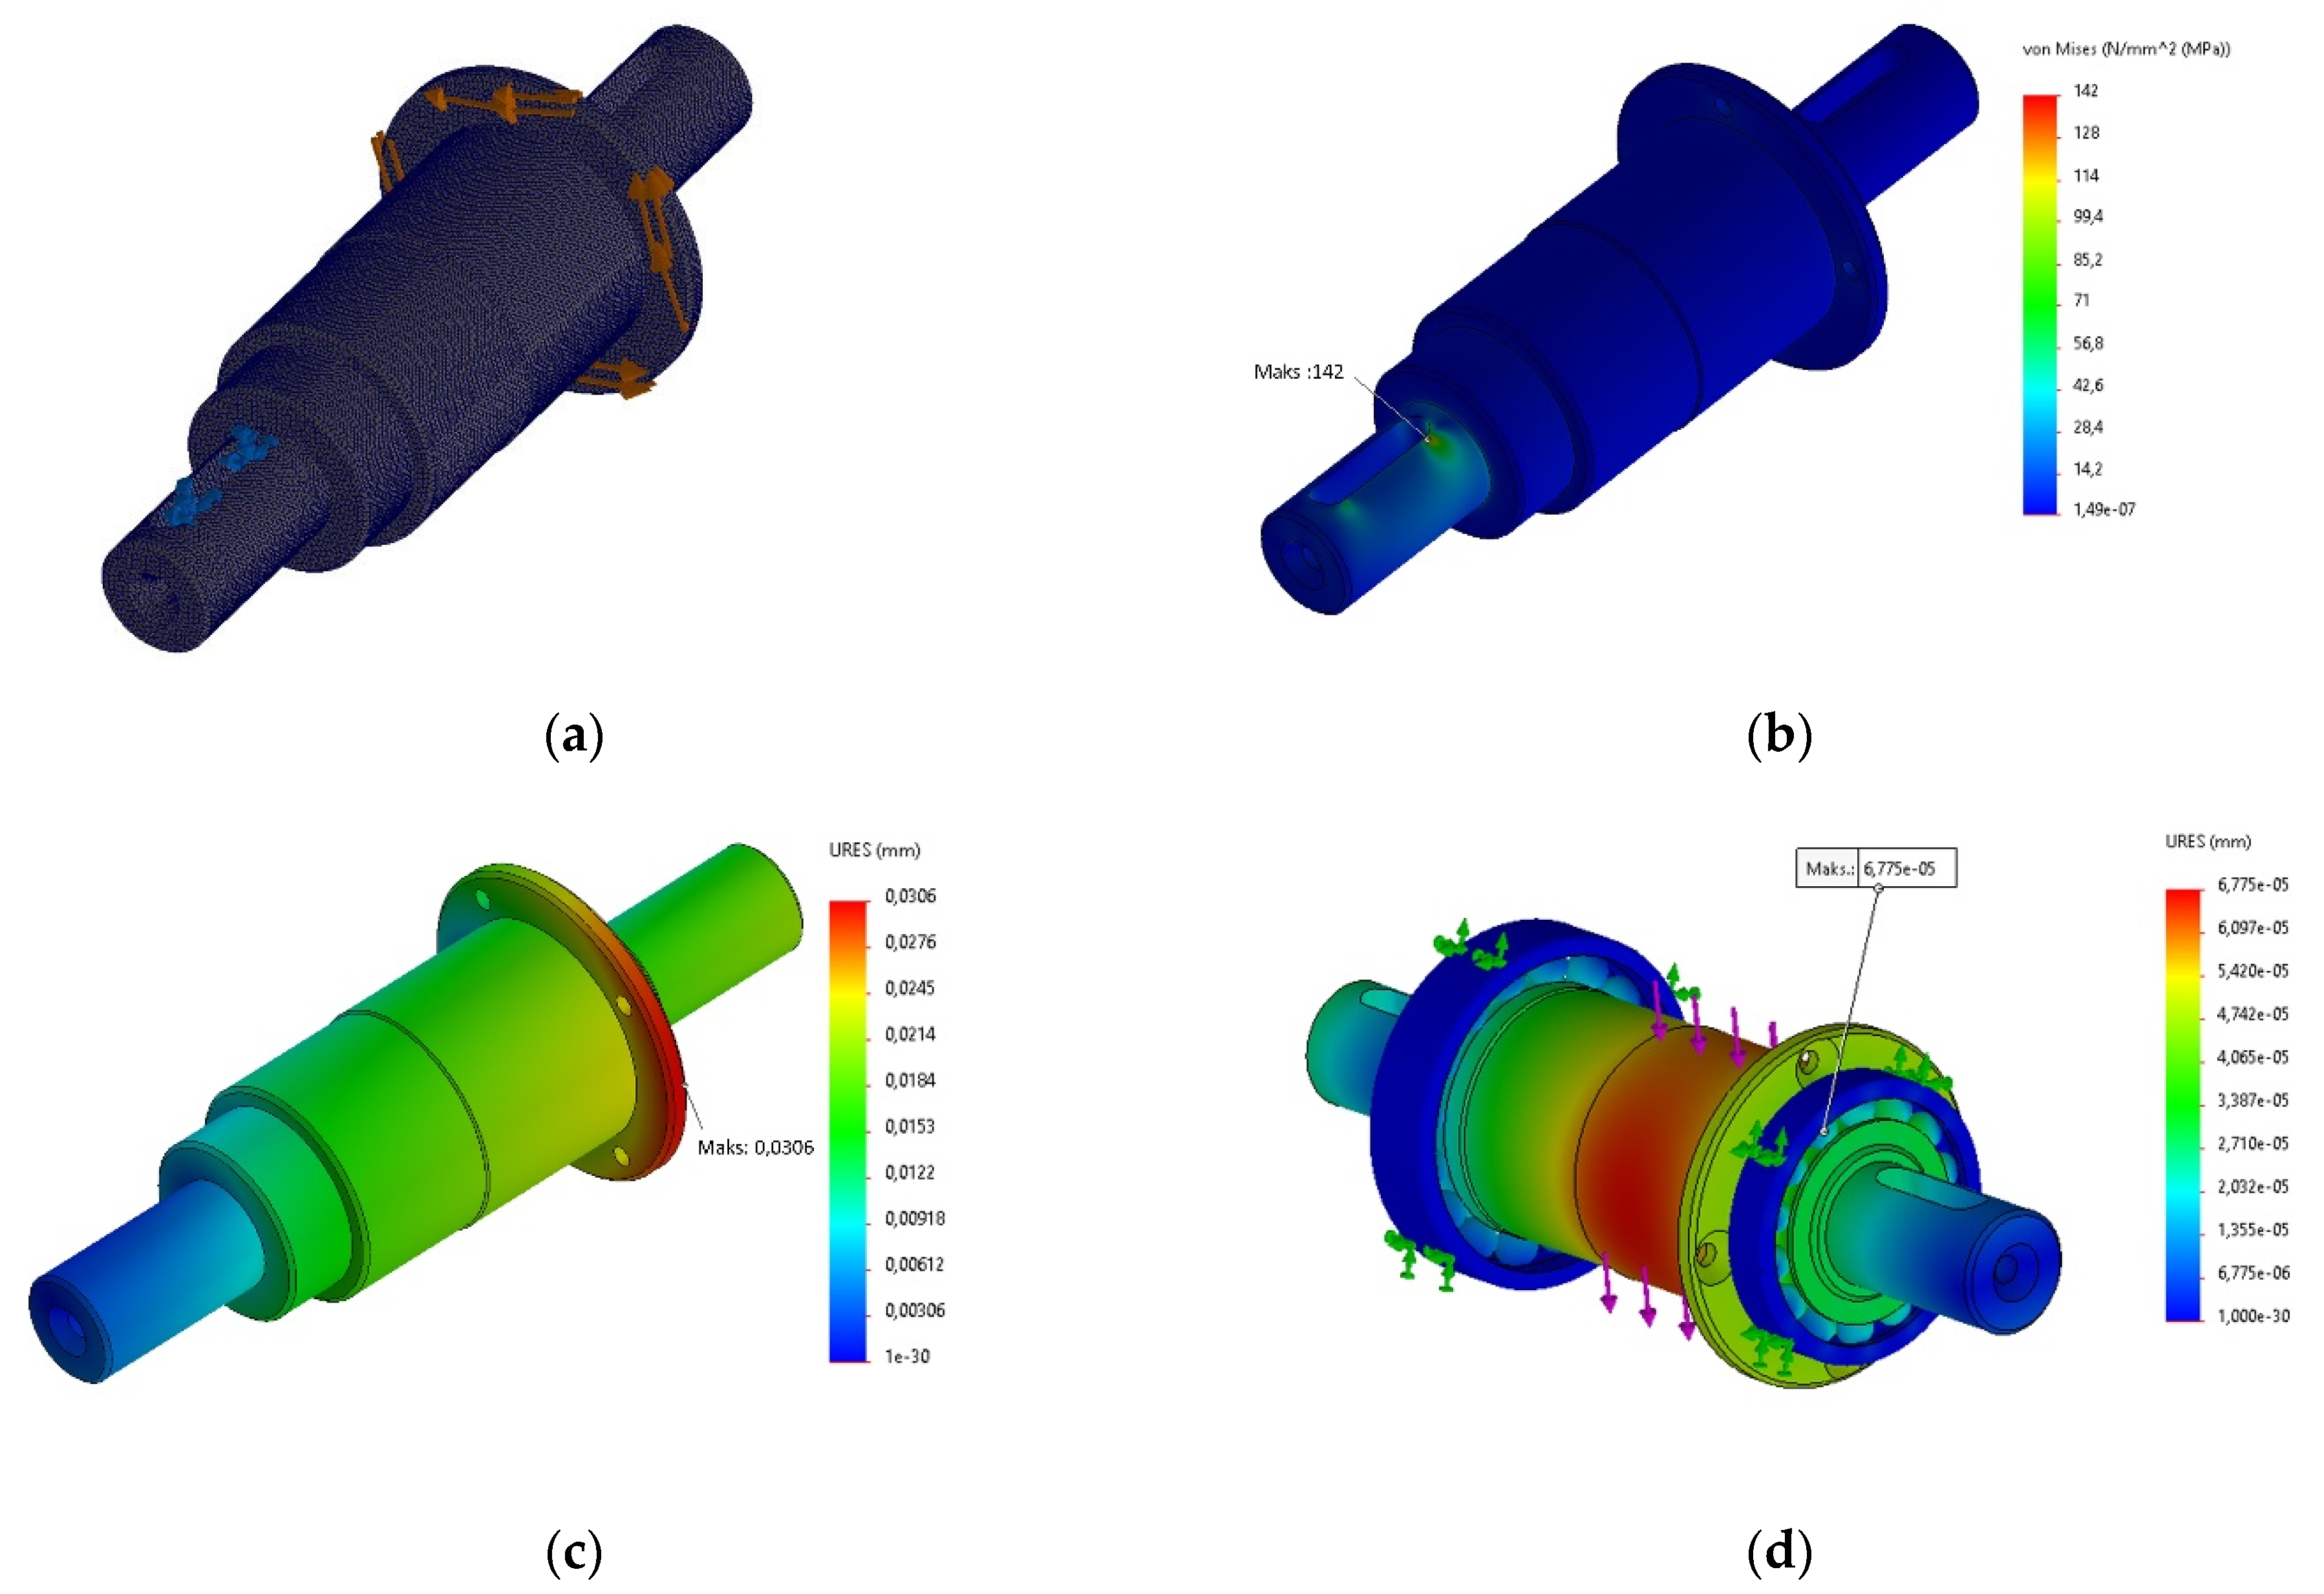
One of the conditions that affect the motor performance in the energy efficiency of the motor is its structural features. A structural deformation will directly affect motor efficiency and acoustic level. The structural strengths of the motor as stator and rotor are suitable for its nominal speed. In this study, since the motor was tested above the nominal operating conditions, structural changes that may occur in the moving parts of the motor were also examined. Moreover, in the AF-SynRM, flux barriers are negatively affected by irregular axial traction. This mechanical strength depends on the electrical load applied to the stator windings. The magnetic pulling force was tested with FEM at the maximum load and obtained as 2.3443 kN. This magnetic pull force caused a displacement of 0.000074226 mm in the rotor. The point where the displacement occurs is at the top (thinnest) barrier on the surface of the rotor [
23]. The motor was analyzed with the mechanical effects occurring in the bearings and motor shaft under 7 Nm, 14 Nm, and 17.5 Nm loads.
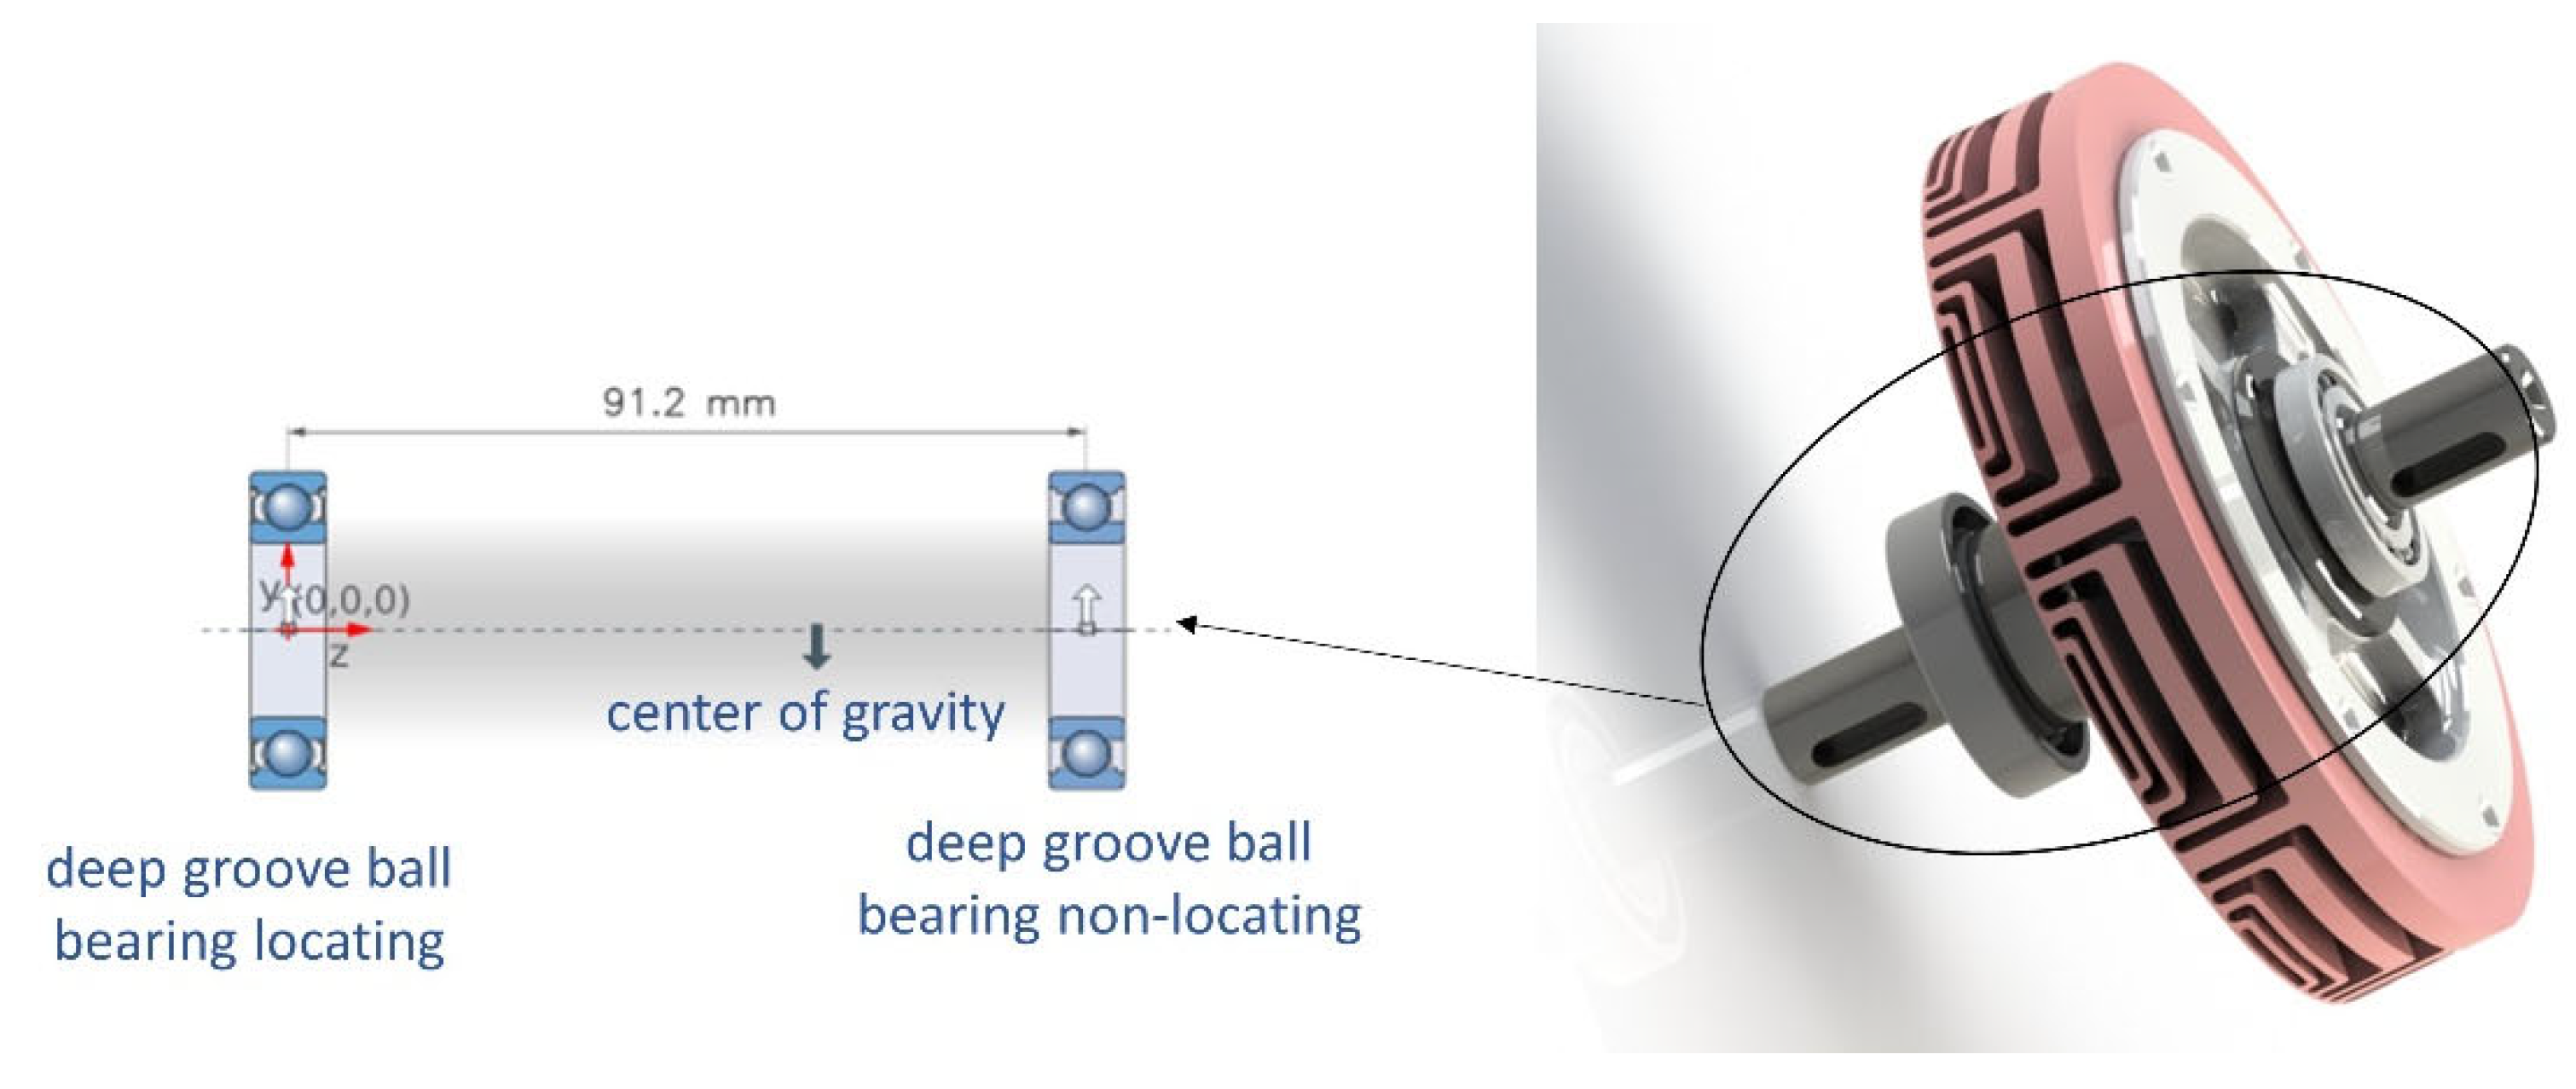
Figure 15 shows the bearings mounted on the shaft and their positions.
Figure 15 shows the distance between bearings and the center of gravity. The life calculation of the bearings is based on Equation (16) [
33].
where
is the lifetime of the bearings (hrs),
is the rotational speed (rpm),
is the dynamic load number,
is the equivalent load, and
is the life coefficient (3 for ball bearings and 10/3 for roller bearings). Accordingly, lifetime calculations and general catalog data of bearings are given in
Table 2.
As can be seen in
Figure 15, the forces acting on the skf brand 6008 and 16,006 series bearings are the shaft, rotor, and rotor fastener. The effects of these forces on the bearing were calculated, and 130 N was applied at the center of gravity point between the two bearings. When the catalog data of 6008 and 16,006 bearings are examined, the static load coefficients are given as 17.8 kN and 7.35 kN, respectively [
34]. When evaluated in this context, there is no deformation on the bearings.
Figure 16 shows the model designed for the structural analysis of the shaft and bearings and the results of the analysis.
A standard solid mesh type was created for the analysis. As a result of the mesh, a total of 761,637 total nodes were created. The forces applied to the moving parts of the motor while the motor was tested under 7 Nm, 14 Nm, and 17.5 Nm load were calculated, and structural analysis of the moving parts was carried out. The maximum values obtained in these analyzes occurred under a 17.5 Nm load. For this reason, only the graphs for the 17.5 Nm load case are given in
Figure 16. The maximum von Mises stress in the shaft under the effect of the maximum applied torque of 17.5 Nm torsional moment was obtained as 142 MPa. When the torsional effect is considered, the shear stress of the material is taken into account. This value is approximately 0.58 times the flexural yield strength. In this case, the shear stress limit of the material is 435 MPa. Thus, the shaft was 3.06 times safer under the effect of torsional moment. According to the deformation analysis, the maximum displacement of the shaft was obtained as a very low value of 30.6 µm in the rotor connection area. Therefore, the shaft operates in the safe region under maximum output torque.
5. Conclusions
This paper presents the efficiency mapping of an 8-pole AF-SynRM with a rated power of 2.2 kW for variable speed applications. In the torque speed graph of AF-SynRM, the motor performance in constant torque and constant power regions is analyzed by FEM, and the results are verified experimentally for the first time. It is also observed that the motor current and power factor vary depending on the load. The power factor is obtained as 0.85 at low speeds under load. It was measured as 0.7 in and around the nominal operating region and was measured as 0.6 at high speeds. Mechanical losses and core losses increase in high-speed regions. The results obtained show that the efficiency of the proposed AF-SynRM is around 90% at nominal speed and 50% load level. At high speeds and loads lower than 50%, AF-SynRM operates with an efficiency of 86% with a 4% decrease in motor efficiency. In addition, the structural analysis of the presented motor at high speeds and under overload is tested by FEM. In the results obtained, a 0.000074226 mm displacement occurred in the thinnest flux barrier of the rotor due to the magnetic pulling force, while the other motors and fasteners were within the safety coefficient limit values.
The results are also compared with radial-flux motors with the same output power. The results obtained from the presented AF-SynRM are generally very close to the radial flux SynRM results of equivalent power. Although the efficiency of AF-SynRM is better for values below the rated speed and rated load, it is observed that the radial flux topology is 2% more efficient than the AF-SynRM topology for high-speed cases.
As a result, it is shown that AF-SynRM can be preferred as an alternative to other motor types, especially in variable speed applications such as electric vehicles. The study is unique in that the efficiency map of the AF-SynRM topology is obtained for the first time, and the results are experimentally verified.


