Abstract
The large differences in the load peak and valley of rural distribution networks always bring severe problems to system planners and operators. Given this issue, this paper deals with the hot-spot temperature (HST) of the transformer and its overload capability, and proposes a modeling method-based online monitoring of practical parameters. In the current work, a temperature-fluid coupling field of the 315 kVA vegetable oil distribution transformer is developed in both the two-dimensional and three-dimensional geometry, by which the convection and heat dissipation process can be studied. The grid of the model is divided into regions to increase the calculation speed and ensure the accuracy of the calculation. Secondly, tests related to the temperature rise of the transformer are carried out. The accuracy of the three-dimensional model is later discussed in terms of temperature and fluid velocity distribution. Finally, the temperature distribution laws of the amorphous alloy vegetable oil distribution transformers (AVDT) are compared and analyzed under different load conditions. Findings reveal that the AVDT has low no-load loss and strong overload capacity, which is capable of reducing the internal overheating accidents of the transformer.
1. Introduction
Distribution transformers are a critical and expensive component serviced in the power distribution network. According to statistics, the power loss of distribution transformers would reach 40–50% of the total value during power transmission [1]. In the framework of the smart grid (SG) paradigm, the demand for high-efficiency and energy-saving transformers in the distribution network is more and more crucial [2,3]. In the rural power grid system, the distribution network is under the operating conditions of long-term light load and seasonal overload, which leads to the large difference in the load peak and valley to impact the security of the SG. Therefore, more environmentally friendly and safer distribution transformers are required by the SG.
Relying on online monitoring, it is found that the temperature distribution of various parts of the transformer is not uniform during operation [4]. The durability and service life of transformers would be reduced once it is overheated locally [5]. In addition, hot-spot temperature (HST) is an important factor in transformer oil–paper insulation deterioration. Therefore, it is rather vital to accurately calculate the temperature rise and HST of the transformer to ensure its safe and stable operation [6,7,8,9].
At present, the commonly used methods for calculating HST mainly include the IEEE guide formula method, thermal circuit model method, and finite element method (FEM). The empirical formula is a fast and simple method. However, it bears considerable inaccuracies and needs correction, since the impact of the actual transformer parameters and ambient factors were not being considered [10,11]. The thermal circuit model considers the actual situation when calculating the HST of the transformer. This method mainly relies on experimental parameters, so it is difficult to promote and develop due to its poor universality [12,13]. On the contrary, research shows that the FEM has high efficiency and accuracy for calculating the HST of the transformer [14,15,16].
Referring to [17], the FEM was used to calculate the HST of the traditional silicon steel mineral oil transformer, then the velocity and temperature distribution of the local winding were obtained. Compared with mineral insulating oil, vegetable insulating oil has many advantages, including a wide range of sources, high biodegradability, high ignition point, and strong equipment overload capability [18,19,20]. Therefore, the research on vegetable oil transformers has attracted extensive attention; HST is determined by the load loss given these facts.
To improve the overload capacity of the transformer, Ref. [21] replaced mineral insulating oil with vegetable insulating oil and calculated HST of the silicon steel vegetable oil distribution transformer. However, given the long-term “migratory bird-style” load situation in rural distribution networks, traditional silicon steel transformers have drawbacks in dealing with the above-mentioned situation. As a result, the study of the amorphous alloy vegetable oil distribution transformers (AVDT) with lower magnetic density and lower no-load loss has engineering significance for reducing HST, improving equipment overload capacity, and extending equipment service life [22,23,24,25,26,27].
Given this issue, to reduce the no-load loss of the distribution network and improve the ability of overload operation, this paper constructs the HST simulation model of the AVDT under different load conditions and proposes a differentiated evaluation method considering the part and its performances. Based on this model, the characteristics of HST and load capacity of the AVDT have been fully analyzed. In this paper, (1) a two-dimensional and three-dimensional model of a new vegetable oil distribution transformer is constructed using the FEM, the HST of them has been calculated and compared by COMSOL; (2) an online monitoring heat transfer test platform for the transformer is built to verify the simulation results; (3) for state evaluation, the HST and temperature rising limit of the AVDT are compared and analyzed under different load coefficients.
The results show that the proposed model can be used to predict the HST of AVDT on the operation. This work is expected to promote the safe and stable operation of rural distribution networks. The working ideas of this paper are shown in Figure 1.
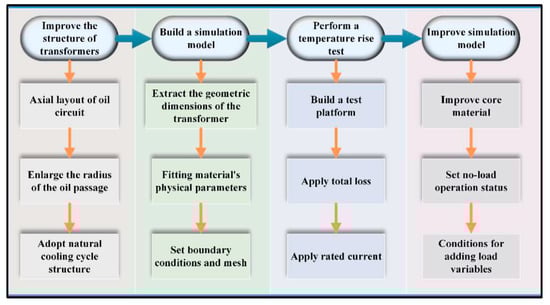
Figure 1.
Flow chart of the work of this paper.
2. Construction of the Transformer HST Prediction Model
In this paper, FEM is used to calculate the temperature distribution of the coupled multi-physical field of the transformer. The flow field-temperature field coupling field is calculated by the iteration method. The flowchart for calculating the transformer temperature rise is shown in Figure 2.
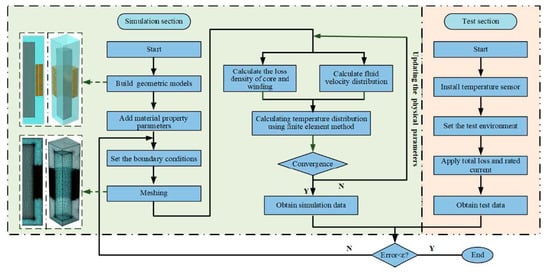
Figure 2.
Flowchart for temperature computation.
2.1. Theory of Multi-Physical Field Analysis
Before the numerical simulation, it was necessary to compare the viscosity, buoyancy, thermal, and inertial effects through the dimensionless Grashof number, Prandtl number, Rayleigh number, and Reynolds number. The flow regime was estimated, and the numerical settings of the modeling process were determined. Then the effects of buoyancy and viscous transportation were compared by Grashof number. The Grashof number is defined [28,29]:
where g is the acceleration of gravity; αp is the thermal expansion coefficient of the fluid; ΔT is the temperature change; l is the height of the transformer tank; v is the kinematic viscosity of the fluid. As shown below (1), gravity should be considered by this model.
Prandtl number is a dimensionless parameter in fluid mechanics, which is used to characterize the relative importance of momentum exchange and heat exchange in fluid flow.
where α is the thermal diffusivity of the fluid, the calculated Pr is 0.5, indicating that the system has reached thermal equilibrium.
The Rayleigh number is given as below (3). It is necessary to calculate and estimate the typical fluid velocity U0 when comparing the buoyancy effect and the thermal diffusion coefficient. When the fluid is guided only by buoyancy, according to the Grashof number, its typical velocity U0 can be estimated, as given in (4).
where v/l is the velocity generated by viscous friction.
Considering the thermal diffusion coefficient based on the speed U, the calculation result can be more accurate, as shown in (5). Ra = Pr(U0l/ν)2 can be rewritten as Ra = U2l/α.
When calculating the fluid velocity field and pressure field, determine the fluid module based on the comparison with the critical value of Reynolds number.
where Re is calculated to be 1271, which is less than the critical value of the laminar flow of 2000 [30], therefore, the laminar flow model is used for calculation.
2.2. Geometric Model
The two-dimensional and three-dimensional models were constructed for simulating the actual transformer, including the geometric structures and size of the equipment, as shown in the upper left of Figure 2. To simplify model construction and improve computational efficiency, the three-dimensional model was a 1/4 structure of the actual transformer intermediate phase winding. The two-dimensional model was derived from the three-dimensional model, and it was simplified for one side of the three-dimensional axis. The simplifications and assumptions were as follows when constructing the model.
- (1)
- Set the core and winding as heat sources. Consider the influence of the air duct velocity by the structure of the clamp and ignore the base part, which is less affected by heat dissipation and oil flow.
- (2)
- Set the physical parameters of the transformer core and windings as constants. It is assumed not to change with temperature changes.
- (3)
- Since the two-dimensional transformer model is axisymmetric, only one side of the axis is analyzed. That includes the tank wall, transformer oil, core, windings. In addition, the fuel tank, core, and winding of the temperature rise test platform are simplified into rectangles.
- (4)
- The three-dimensional model of the transformer includes the box, core, winding, and transformer oil. When constructing the geometry, the actual core is simplified to a cylinder, and the winding is simplified to a series of rings with the same core as the core. In addition, the three-dimensional model is improved, taking into account the axial distribution characteristics of the oil flow in the horizontal oil passage and the temperature distribution along the circumferential direction.
When calculating, we first divided the simulation model into non-overlapping grids, as shown in the lower left of Figure 2. To improve the calculation speed of the simulation, the calculation domain was divided by a structural grid. Since the temperature gradient at the fluid-solid interface was obtained from the temperature difference between the adjacent grid points, the mesh at the interface was divided into a higher degree of fineness. To ensure the accuracy of numerical simulation, a prismatic boundary layer grid was set in this area.
2.3. Boundary Conditions
In the calculation model, the boundary conditions of each area were set [31].
(1) Set the boundary conditions at the symmetry plane. In the heat transfer field, the heat flux boundary condition at the wall meets the Neumann boundary.
where k is thermal conductivity and q0 is the heat flux. At the symmetry plane, the left and right sides of the symmetry boundary are set to be error-free, so the flux is zero.
(2) Set the inlet boundary conditions. In this simulation, since convective heat transfer was dominant at the entrance, the temperature gradient and the conduction heat along the normal direction of the entrance boundary were transferred less. Assuming that the contribution of pressure to enthalpy is zero, the boundary conditions were set:
where Tup is the upstream temperature, Cp is the heat capacity and U is the velocity vector. Since Cp is a positive value, the inflow boundary condition is required to satisfy T = Tup. The above-mentioned inflow boundary condition can be equated to the Dirichlet boundary. It can be used to describe the boundary conditions of the upstream temperature of the inlet.
(3) Set the boundary conditions of the fuel tank wall. The heat exchange at the interface between the tank wall and the external environment is mainly convective heat exchange q0.
where Text is the external temperature; h is the heat transfer coefficient.
where Nu is Nusselt Number, which is the characteristic function of Ra. Nu can comprehensively consider the effects of convection and heat conduction.
(4) Set momentum boundary conditions. At the fluid-solid interface, the momentum boundary was set as a non-slip boundary condition.
Since the simulation is an axisymmetric model, the velocity and diffusion were both zero on the axis. Assuming the wall is relatively static, the relative velocity of the oil flow was set to zero when the fluid “film” was close to the wall.
3. Construction of Transformer HST Prediction Model
3.1. Test Setup
The prototype for simulation in this paper was the S-M-315/10-NX2 transformer, a 10 kV transformer insulated with environment-friendly vegetable oil. The high voltage winding and low voltage winding of the transformer were pie-shaped, which was wound by copper wires. For guaranteeing the overload capacity, the heat-resistant grade of the turn insulation was H. Besides, the materials used for other insulation structures were of various heat-resistant grades. The core, with the three-phase three-column structure, was laminated by silicon steel sheets. Compared with mineral oil, vegetable oil used in the test had a higher viscosity and weaker heat dissipation capacity. To meet the specified standards for the temperature rise and the HST, the transformer oil adopted a directional natural cooling circulation structure. The specific structure of the transformer is shown in Figure 3.
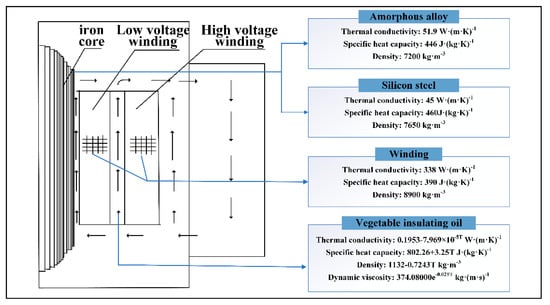
Figure 3.
Schematic diagram of the natural circulation of oil.
The transformer coils were pie-shaped, and the connection group was labeled YNd11. The rated voltage of the low-voltage winding is 0.4 kV and the rated current was 454.7 A. The rated voltage of the high-voltage winding was 10 kV and the rated current was 18.2 A. The specific parameters of the simulation are shown in Table 1.

Table 1.
Parameters of the simulation model.
In the calculation of the multi-physical coupling field of the transformer, silicon steel and amorphous alloy were used for the core comparison. In addition, vegetable oil was used for the transformer oil, and copper was used for the winding material. The physical parameters are shown in Figure 3. When the temperature, pressure, and other parameters in the tank change, the physical parameters such as the density, thermal conductivity, and viscosity coefficient of the transformer oil will change accordingly. The law of change can be fitted to the above mathematical function.
3.2. Comparison and Analysis of Temperature Rise Calculation Results and Test Data
3.2.1. Simulation Results of the Temperature Field
The two-dimensional and three-dimensional temperature field distribution of the transformer is obtained by the FEM, and the results were compared with the test data. The temperature rise in the winding area was caused by the winding loss [32]. Transformer core loss and winding loss were used as initial heat sources, and they were coupled to the temperature field according to the grid nodes. Under rated load operating conditions, the distribution of transformer temperature rise was simulated. Through the transformer temperature rise test, the no-load loss and the load loss are obtained. For silicon steel and amorphous alloy transformers, their core materials were different, so no-load losses were different. When the heat source was loaded, for the convenience of calculation, the average loss density was uniformly applied to each heating element. The heat generation rate of the heating part of the transformer is shown in Table 2.
Table 2.
Loss and heat generation rate of silicon steel transformer and amorphous alloy motor transformer.
When the axial height increased, the temperature of the core and winding increased, as shown in Figure 4 and Figure 5. Under the effect of losses, such as the copper loss and the iron loss, the transformer continues to generate heat, causing the internal temperature to rise. When the temperature of the transformer oil in the oil passage rises after being heated, oil density will decrease, resulting in poor buoyancy. As a result, the insulating oil flows upward along the oil passage, and the internal oil flow outlet temperature will be higher than the inlet temperature. Since the lower end of the transformer has a better heat dissipation effect than the upper end, the temperature of the upper end is higher than the lower end. When the transformer was running stably, its HST was about 9/10 of the upper part of the low-voltage winding. The reason is shown as:
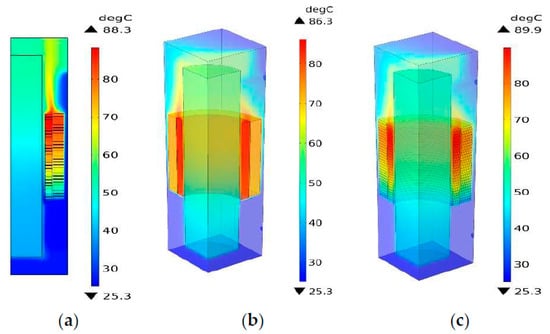
Figure 4.
Temperature field distribution of the transformer. (a) Two-dimensional temperature field distribution diagram; (b) three-dimensional temperature field distribution diagram; (c) improved three-dimensional temperature field distribution diagram.
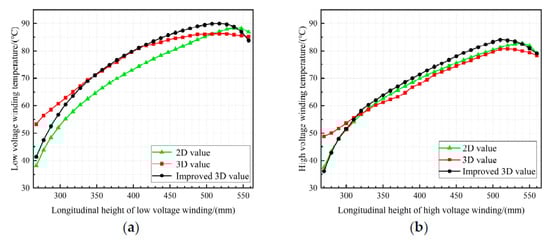
Figure 5.
Simulated values on winding temperature; (a) Longitudinal temperature rise curve of low voltage winding, (b) Longitudinal temperature rise curve of high voltage winding.
(1) During operation, the heat generation rate by the low voltage winding was higher than that of the high voltage winding. (2) The low-voltage winding had a poor heat dissipation ability because it was located between the high-voltage winding and the core. (3) The upper and lower ends of the winding had a larger contact surface with the transformer oil, which was beneficial to dissipate heat and reduce temperature. (4) The outer side of the high-voltage winding had a large contact area with the transformer oil, so the oil flowed violently here. The last two points were conducive to convection heat dissipation, and radiant heat dissipation to the wall of the fuel tank and the radiator could be improved. The heat dissipation effect was better than that of low-voltage winding. Therefore, the internal HST of the transformer was located at the position of the low-voltage winding, which conforms to the actual distribution.
3.2.2. Simulation Results of Oil Flow Field
The key factor that affects the heat dissipation of the transformer was the oil flow circulation, and its driving force was the difference in buoyancy caused by the distribution of oil flow density [33]. To simulate the flow field distribution efficiently and accurately in the transformer, (1) the natural oil circulation was adopted in the fluid field; (2) the winding was refined; (3) the influence of the transverse winding on the flow velocity of the oil duct was considered; (4) the part that had less influence on the heat dissipation was ignored.
The distribution diagram of the transformer fluid field is shown in Figure 6. The direction of the oil flow velocity is represented by red arrow. The transformer oil flows through the inlet, splits into various oil ducts, then mergers and flows out at the outlet. The speed of the oil flow at the inlet and outlet and the wide side of the high-voltage winding is relatively high, which is consistent with the heat dissipation effect of the temperature field there. The oil flow has the same velocity distribution at the inlet and outlet, and the incompressibility of the liquid is satisfied. In addition, due to the influence of the core and winding, the inner oil flow is subjected to the pressure of the outer oil flow, causing a small vortex to form below the inlet. These are in line with the theory of fluid mechanics, and the validity of the calculation method in this paper has been verified.
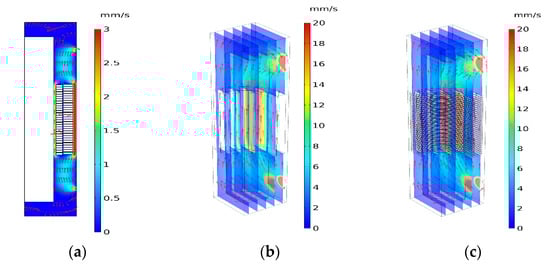
Figure 6.
Fluid field distribution of the transformer. (a) Distribution diagram of two-dimensional flow field; (b) distribution diagram of three-dimensional flow field; (c) distribution diagram of the improved three-dimensional flow field.
3.2.3. Transformer HST Calculation and Test Verification
To verify the rationality and accuracy of the simulation model, the short-circuit test method was used in this paper to conduct a temperature rise test. The actual test data were used as a standard and then compared with the simulation results. The test platform is shown in Figure 7 and Figure 8.
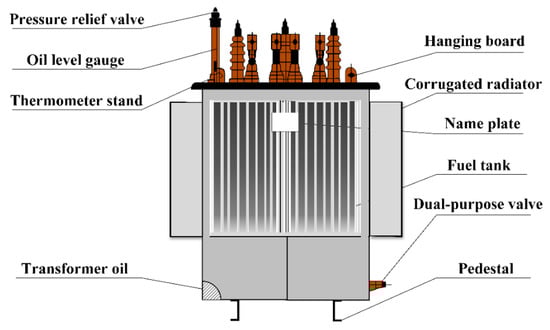
Figure 7.
Design of S-M-315/10-NX2 distribution transformer.
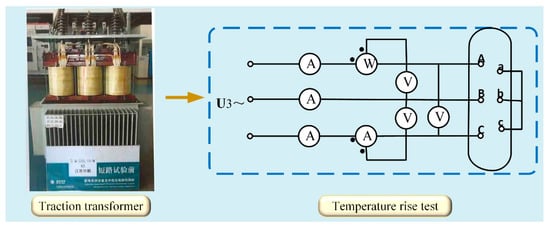
Figure 8.
Wiring diagram of temperature rise test.
When calculating the HST of winding and measuring the cooling effect of the transformer, the influence of the top oil temperature rise and the average oil temperature rise is considered. Therefore, the above data is determined in the temperature rise test.
Given the small rated capacity of the test transformer, only one temperature sensor needs to be installed on the thermometer seat on the tank cover to take the temperature of top oil, which is used to determine the temperature of the top oil. In addition, to measure the temperature of the bottom liquid, another temperature sensor is installed at the header where the corrugated radiator returns to the fuel tank. The temperature sensors are installed at the measurement points of the high-voltage winding and the low-voltage winding, respectively. The average temperature of the oil can be calculated from test data,
where θo is the top oil temperature, θb is the bottom oil temperature.
The test data of temperature rise is shown in Figure 9. It can be seen that the top oil temperature was 71 °C, and the bottom oil temperature was 54.4 °C when the thermal equilibrium was reached. The comparison of simulation result data and test results are shown in Table 3, and the relative error is shown in Table 4.
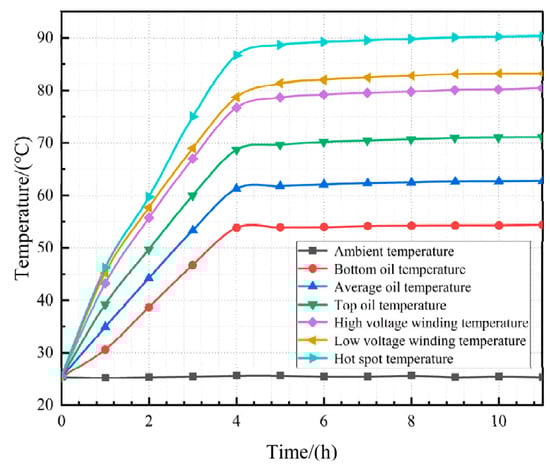
Figure 9.
The test data of temperature rise.
Table 3.
Temperature rise calculated results and test data.
Table 4.
The relative error of temperature rise results.
Synthesizing Table 3 and Table 4, for the calculation of the HST of the transformer, the error rate of the improved three-dimensional model was 0.31%, the three-dimensional simplified model was 5.86%, and the two-dimensional model was 2.78%. The accuracy of the improved three-dimensional model was significantly improved, and the calculation results are more in line with the actual HST of the transformer. Comprehensive analysis of the velocity field and temperature field, the improved three-dimensional calculation method proposed in this paper deviates from the two-dimensional and three-dimensional calculation results in some aspects: (1) the two-dimensional model does not consider the gradient change of the transformer temperature field along the circumferential direction. (2) The three-dimensional grid is a second-order element, which is inconsistent with the grid elements used in the two-dimensional model. (3) In the actual transformer, when the actual parameters are converted into the initial conditions of the plane simulation, where the error is relatively large. (4) The three-dimensional, simplified model does not consider the influence of oil flow in the axial direction on the heat dissipation of the winding. Therefore, compared with the actual transformer, the calculation results of the improved three-dimensional model are more in line with the internal distribution.
4. Performance Analysis of AVDT
4.1. Performance of AVDT under Rated Load
AVDT belongs to a major scientific and technological research field with far-reaching development prospects in high-efficiency energy-saving and green power. To evaluate the performance of AVDT, the temperature distribution was calculated through the improved three-dimensional model as mentioned above. The loss of each component was applied uniformly to each heating element as a heat source. By comparing the temperature law of silicon steel transformer and amorphous alloy transformer, the special performance of amorphous alloy transformer could be determined.
The amorphous alloy has the characteristics of high magnetic saturation, high permeability, low coercivity, and low saturation magnetic density, which results in a smaller no-load loss of the corresponding transformer, and a smaller heat source is applied to the transformer during no-load operation. Therefore, the average temperature rise of the core was lower than that of the traditional silicon steel transformer. The temperature rise of the core components when the transformer is running at no load is shown in Figure 10. It can be seen that the average temperature rise of the core using amorphous alloy material dropped by 4.66 K. Therefore, the use of amorphous alloys in the transformer core has engineering significance in the application of energy-saving for rural distribution networks.
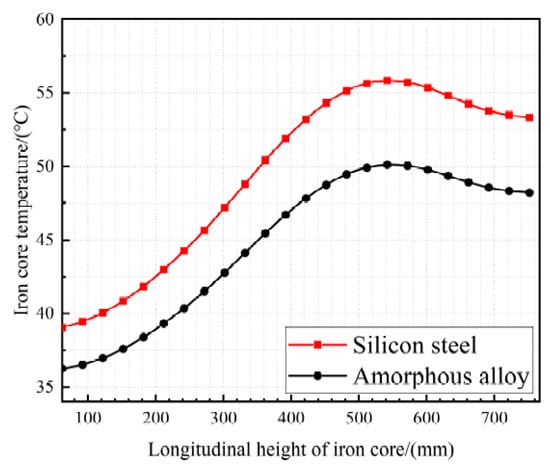
Figure 10.
Longitudinal temperature curve of the core.
The temperature distribution cloud diagram of the two transformers under rated load is shown in Figure 11. For the AVDT, the HST is still located at about 9/10 of the upper part of low-voltage winding. The distribution trend of the temperature field inside the transformer is the same as that of the silicon steel transformer, and the theoretical results of the temperature field are in line. However, under the rated operating load, the temperature of each part of the amorphous alloy transformer is slightly lower than that of the silicon steel transformer. These include a decrease in the average temperature rise of the core low-voltage by 1.25 K. For transformers of the same structure, the iron loss of amorphous alloy cores is lower than that of transformers using silicon steel materials. As a result, not only the no-load loss is reduced, but also the internal temperature rise and the HST is decreased. In addition, with the help of the decline of the electrical stress on the internal insulation, the reliability of operation is increased. Subsequently, the service life of the transformer can be prolonged.
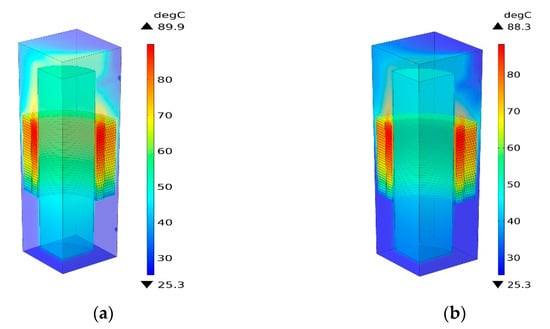
Figure 11.
Temperature distribution of silicon steel transformer and amorphous alloy motor transformer. (a) Temperature field of silicon steel transformer; (b) Temperature field of amorphous alloy transformer.
4.2. Performance of AVDT under Overload
The HST of the transformer is an essential factor that affects the deterioration of the transformer oil-paper insulation. Excessive HST will accelerate the thermal aging of the transformer, which will have negative impacts on the performance of the transformer. In addition, load capacity is one of the critical factors that determine the HST. Therefore, to obtain various HST, different load coefficients are applied to the transformer to assess the ability of the transformer to withstand overload by analyzing the change of the HST with the load parameters and comparing the HST with the temperature rise limit.
The temperature rise distribution of the transformer under different load coefficients was obtained by changing the load parameters (K) during the simulation. Then, the overload capacity assessment of the AVDT is carried out. The comparison results of the hot-spots are shown in Table 5. Figure 12 represents the temperature rise of the winding.
Table 5.
The calculated results of temperature rise.
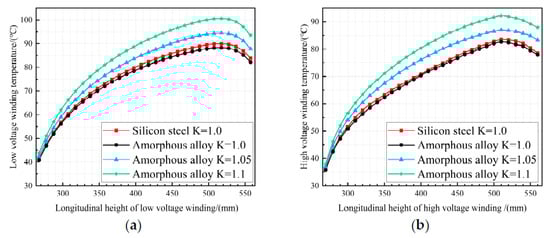
Figure 12.
Temperature distribution of silicon steel transformer and amorphous alloy motor transformer. (a) Longitudinal temperature rise curve of low voltage winding; (b) longitudinal temperature rise curve of high voltage winding.
When the amorphous alloy transformer is overloaded, the temperature rise of the winding gradually increases with the increase of the load coefficients, as can be seen in Figure 12. Under different load coefficients, the comparison results of the internal temperature rise and hot-spot of the transformer and its temperature limit are shown in Table 5. It can be seen that when the ambient temperature is 25.3 °C, and the load coefficients are 1.05 and 1.1, the HST and the temperature rise in each area of the transformer are less than the temperature rise limit. It indicates that under the working condition of K = 1.1 and the transformer can run for a long time without overheating. Therefore, it has a strong overload capacity. The characteristics of the AVDT can not only reduce the load loss during light-load operation but also improve the capacity of the rural distribution network during overload operation. It is of great significance to alleviate the problem of the sizeable peak-valley difference of the rural distribution network load. In the SG paradigm, transformers could be loaded beyond their nameplate rating in favorable thermal conditions, without loss of rated life or breakdown.
5. Conclusions
In this paper, the temperature distribution inside the silicon steel transformer is comparatively analyzed by two-dimensional and three-dimensional fluid-temperature field coupling models. Furthermore, the thermal characteristics of AVDT under different load coefficients are analyzed. Finally, the calculation of temperature rise prediction of winding HST, and evaluation of the overload ability to withstand overload is realized for the AVDT. The conclusions are summarized:
- (1)
- By improving the three-dimensional model to analyze multi-physical fields of transformer and using different shapes of grids to divide different areas, the distribution of temperature field can be studied more accurately inside the transformer, and the inaccurate calculation of the traditional two-dimensional model and three-dimensional model are overcome.
- (2)
- Compared with the silicon steel core as the core, the saturation magnetic density of amorphous alloy is low, which leads to the reduction of the no-load loss of the transformer and the reduction of the longitudinal thermal conductivity. The average temperature rise of the transformer insulated with amorphous alloy core decreases. When the distribution network is running under light load, the energy-saving effect of the AVDT is significant.
- (3)
- The overload capacity of the transformer under different load coefficients has been analyzed. It can be seen that the AVDT can withstand the overload of K = 1.1 for a long time within the limit of temperature rise. It is of practical significance to prolong the service life of the equipment and maintain the stable operation of the rural distribution network because of its strong overload capacity.
Author Contributions
Conceptualization, J.G.; methodology, J.G.; software, B.Y.; validation, K.F.; formal analysis, B.Y.; investigation, K.F.; resources, B.Y.; data curation, J.G.; writing—original draft preparation, J.G.; writing—review and editing, H.Z.; visualization, Q.P.; supervision, H.Z.; project administration, K.F.; software, H.Y.; formal analysis, H.Y.; funding acquisition, H.Z. All authors have read and agreed to the published version of the manuscript.
Funding
This work was supported in part by the National Natural Science Foundation of China under Grant 51907034, and in part by the Specific Research Project of Guangxi for Research Bases and Talents under Grant 2020AC19010.
Institutional Review Board Statement
Not applicable.
Informed Consent Statement
Not applicable.
Data Availability Statement
Not applicable.
Conflicts of Interest
The authors declare no conflict of interest.
References
- Bracale, A.; Carpinelli, G.; Pagano, M.; De Falco, P. A probabilistic approach for forecasting the allowable current of oil-immersed transformers. IEEE Trans. Power Deliv. 2018, 33, 1825–1834. [Google Scholar] [CrossRef]
- Li, Y.; Wang, Y.; Chen, Q. Optimal dispatch with transformer dynamic thermal rating in adns incorporating high pv penetration. IEEE Trans. Smart Grid 2020, 12, 1989–1999. [Google Scholar] [CrossRef]
- Saeed Uz Zaman, M.; Haider, R.; Bukhari, S.B.A.; Ashraf, H.M.; Kim, C.H. Impacts of responsive loads and energy storage system on frequency response of a multi-machine power system. Machines 2019, 7, 34. [Google Scholar] [CrossRef] [Green Version]
- Bochkarev, I.V.; Bryakin, I.V.; Khramshin, V.R.; Sandybaeva, A.R.; Litsin, K.V. Developing new thermal protection method for ac electric motors. Machines 2021, 9, 51. [Google Scholar] [CrossRef]
- Shiravand, V.; Faiz, J.; Samimi, M.H.; Djamali, M. Improving the transformer thermal modeling by considering additional thermal points. Int. J. Electr. Power Energy Syst. 2021, 128, 106748. [Google Scholar] [CrossRef]
- Najar, S.; Tissier, J.F.; Cauet, S.; Etien, E. Improving thermal model for oil temperature estimation in power distribution transformers. Appl. Therm. Eng. 2017, 119, 73–78. [Google Scholar] [CrossRef]
- Yang, L.J.; Sun, W.; Gao, S.; Hao, J. Thermal aging test for transformer oil–paper insulation under over-load condition temperature. IET Gener. Transm. Distrib. 2018, 12, 2846–2853. [Google Scholar] [CrossRef]
- Rommel, D.P.; Di Maio, D.; Tinga, T. Transformer hot spot temperature prediction based on basic operator information. Int. J. Electr. Power Energy Syst. 2021, 124, 106340. [Google Scholar] [CrossRef]
- Cui, Y.; Ma, H.; Saha, T.; Ekanayake, C.; Martin, D. Moisture-dependent thermal modelling of power transformer. IEEE Trans. Power Deliv. 2016, 31, 2140–2150. [Google Scholar] [CrossRef]
- Power Transformers—Part 7: Loading Guide for Oil-Immersed Power Transformers; IEC 60076–7; IEEE: Piscataway, NJ, USA, 2005.
- IEEE Guide for Loading Mineral-Oil-Immersed Transformers and Step-Voltage Regulators; IEEE Std C57.91-2011; IEEE: Piscataway, NJ, USA, 2012.
- Radakovic, Z.R.; Sorgic, M.S. Basics of detailed thermal-hydraulic model for thermal design of oil power transformers. IEEE Trans. Power Deliv. 2010, 25, 790–802. [Google Scholar] [CrossRef]
- Susa, D.; Lehtonen, M.; Nordman, H. Dynamic thermal modeling of distribution transformers. IEEE Trans. Power Deliv. 2005, 20, 1919–1929. [Google Scholar] [CrossRef]
- Xu, J.; Kubis, A.; Zhou, K.; Ye, Z.; Luo, L. Electromagnetic field and thermal distribution optimisation in shell-type traction transformers. IET Electr. Power Appl. 2013, 7, 627–632. [Google Scholar] [CrossRef]
- Meng, F.; Xi, J. Numerical and experimental investigation of temperature distribution for dry-clutches. Machines 2021, 9, 185. [Google Scholar] [CrossRef]
- Faizov, S.; Sarafanov, A.; Erdakov, I.; Gromov, D.; Svistun, A.; Glebov, L.; Bykov, V.; Bryk, A.; Radionova, L. On the direct extrusion of solder wire from 52in-48sn alloy. Machines 2021, 9, 93. [Google Scholar] [CrossRef]
- Taghikhani, M.A. Modeling of heat transfer in layer-type power transformer. PrzegladElektrotechniczny 2011, 87, 121–123. [Google Scholar]
- Martins, M.A.G. Vegetable oils, an alternative to mineral oil for power transformers-experimental study of paper aging in vegetable oil versus mineral oil. IEEE Electr. Insul. Mag. 2010, 26, 7–13. [Google Scholar] [CrossRef]
- Zheng, H.; Jeong, J.I.; An, J.S.; Huh, C.S. Accelerated aging effects of mineral and vegetable transformer oils on medium voltage power transformers. IEEE Trans. Dielectr. Electr. Insul. 2012, 19, 156–161. [Google Scholar]
- Zheng, H.; Li, X.; Feng, Y.; Yang, H.; Lv, W. Investigation on Micro-Mechanism of Palm Oil as Natural Ester Insulating Oil for Overheating Thermal Fault Analysis of Transformers; High Voltage: Nanning, China, 2021; pp. 1–13. [Google Scholar] [CrossRef]
- Santisteban, A.; Delgado, F.; Ortiz, A.; Fernández, I.; Renedo, C.J.; Ortiz, F. Numerical analysis of the hot-spot temperature of a power transformer with alternative dielectric liquids. IEEE Trans. Dielectr. Electr. Insul. 2017, 24, 3226–3235. [Google Scholar] [CrossRef] [Green Version]
- Azuma, D.; Ito, N.; Ohta, M. Recent progress in Fe-based amorphous and nanocrystalline soft magnetic materials. J. Magn. Magn. Mater. 2020, 501, 166373. [Google Scholar] [CrossRef]
- Feil, D.L.P.; Silva, P.R.; Bernardon, D.P.; Marchesan, T.B.; Sperandio, M.; Medeiros, L.H. Development of an efficient distribution transformer using amorphous core and vegetable insulating oil. Electr. Power Syst. Res. 2017, 144, 268–279. [Google Scholar] [CrossRef]
- Hasegawa, R. Present status of amorphous soft magnetic alloys. J. Magn. Magn. Mater. 2000, 215, 240–245. [Google Scholar] [CrossRef]
- Ng, H.W.; Hasegawa, R.Y.U.S.U.K.E.; Lee, A.C.; Lowdermilk, L.A. Amorphous alloy core distribution transformers. Proc. IEEE 1991, 79, 1608–1623. [Google Scholar] [CrossRef]
- Li, Y.; Zhu, J.; Li, Y.; Wang, H.; Zhu, L. Modeling dynamic magnetostriction of amorphous core materials based on Jiles–Atherton theory for finite element simulations. J. Magn. Magn. Mater. 2021, 529, 167854. [Google Scholar] [CrossRef]
- Tomczuk, B.Z.; Koteras, D.; Waindok, A. Electromagnetic and temperature 3-D fields for the modular transformers heating under high-frequency operation. IEEE Trans. Magn. 2014, 50, 317–320. [Google Scholar] [CrossRef]
- Cengel, Y.A. Introduction to Thermodynamics and Heat Transfer; McGraw-Hill: New York, NY, USA, 1997. [Google Scholar]
- Liao, C.; Ruan, J.; Liu, C.; Wen, W.; Du, Z. 3-D coupled electromagnetic-fluid-thermal analysis of oil-immersed triangular wound core transformer. IEEE Trans. Magn. 2014, 50, 8401904. [Google Scholar] [CrossRef]
- Ying, P.; He, Y.; Tang, H.; Ren, Y. Numerical and experimental investigation of flow and heat transfer in heat exchanger channels with different dimples geometries. Machines 2021, 9, 72. [Google Scholar] [CrossRef]
- Stebel, M.; Kubiczek, K.; Rodriguez, G.R.; Palacz, M.; Garelli, L.; Melka, B.; Haida, M.; Bodys, J.; Nowak, A.J.; Lasek, P.; et al. Thermal analysis of 8.5 MVA disk-type power transformer cooled by biodegradable ester oil working in ONAN mode by using advanced EMAG–CFD–CFD coupling. Int. J. Electr. Power Energy Syst. 2022, 136, 107737. [Google Scholar] [CrossRef]
- Jansak, L.; Zizek, F.; Jelinek, Z. Loss analysis of a model transformer winding. IEEE Trans. Appl. Supercond. 2003, 13, 2352–2355. [Google Scholar] [CrossRef]
- Formato, G.; Romano, R.; Formato, A.; Sorvari, J.; Koiranen, T.; Pellegrino, A.; Villecco, F. Fluid–structure interaction modeling applied to peristaltic pump flow simulations. Machines 2019, 7, 50. [Google Scholar] [CrossRef] [Green Version]
Publisher’s Note: MDPI stays neutral with regard to jurisdictional claims in published maps and institutional affiliations. |
© 2022 by the authors. Licensee MDPI, Basel, Switzerland. This article is an open access article distributed under the terms and conditions of the Creative Commons Attribution (CC BY) license (https://creativecommons.org/licenses/by/4.0/).