Abstract
In gas turbines used for airplane propulsion, the number of sensors are kept at a minimum for accurate control and safe operation. Additionally, when data are communicated between the airplane main computer and the various subsystems, different systems may have different constraints and requirements regarding what data transmit. Early in the design process, these parameters are relatively easy to change, compared to a mature product. If the gas turbine diagnostic system is not considered early in the design process, it may lead to diagnostic functions having to operate with reduced amount of data. In this paper, a scenario where the diagnostic function cannot obtain airplane installation effects is considered. The installation effects in question is air intake pressure loss (pressure recovery), bleed flow and shaft power extraction. A framework is presented where the unknown installation effects are estimated based on available data through surrogate models, which is incorporated into the diagnostic framework. The method has been evaluated for a low-bypass turbofan with two different sensor suites. It has also been evaluated for two different diagnostic schemes, both determined and underdetermined. Results show that, compared to assuming a best-guess constant-bleed and shaft power, the proposed method reduce the RMS in health parameter estimation from 26% up to 80% for the selected health parameters. At the same time, the proposed method show the same degradation pattern as if the installation effects were known.
1. Introduction
There are multiple principles on how to construct a gas turbine diagnostic system. It can either be based on a model of the system to be diagnosed or make use of machine learning algorithms, signal processing, expert knowledge or hybrid approaches [1,2]. For gas turbine diagnostics, the first condition based diagnostic method that came into use is the model based Gas Path Analysis (GPA) method [3], where a software model of the gas turbine is used to calculate estimated degradations based on available measurements. These analyses can either be based on steady state [4] or transient data [5,6]. There are also methods for handling underdetermined systems [7,8]. More advanced methods related to GPA make use of multiple operating point analysis [9] where the target is to find the degradation that best satisfy all operating points. There are also methods developed where expected degradation relationships are taken into consideration in the analysis [10]. A sequential approach to GPA was explored in [11] where the state of the components was diagnosed one after another along the gas path. Another physics-based method is the Kalman Filter (KF) [12,13], where an estimate of the upcoming time-step is calculated based on previous observations. This method is well suited for sensor diagnostics where multiple filters can be tailored to a specific sensor [14]. An approach where an Extended Kalman Filter (EKF) was tuned to an underdetermined gas turbine diagnostic problem has been explored in [15]. Kalman Filters may also be used for sensor measurement reconstruction after sensor or actuator faults have been identified [16].
Data-driven methods look for mathematical relationships and patterns regardless of their physical implication. There are several different methods that are commonly used for diagnostics. A common method is Neural Networks (NN) [17] where a network is created by different layers of neurons. Each neuron contain an activation function and the threshold for these functions are determined when a network is trained to replicate a set of data. NN may be constructed in a number of ways depending on the application. To mention a few, the simplest type is the Multilayer Perceptron (MLP), which is constructed with an input and output layer connected by one or more hidden layers. This type of networks are quite common and are used both for general gas turbine diagnostics [18,19] as well as identifying specific faults or tasks. Examples include optimizing washing cycles of an industrial gas turbine [20], identifying an afterburner liner burn through [21] and diagnostics of a marine diesel engine [22] where the NN was trained to exhibit the behavior of a healthy engine, which then was compared to operational data. Another type of network is the Auto Associative Neural Network, (AANN) which utilizes a bottleneck layer. It is commonly used for noise filtering and outlier removal [23,24]. A fault detection method using an Extreme Learning Machine (ELM) showed promising results compared to many other data-driven methods [25]. Other types of networks may use feedback loops, such as the Nonlinear Auto-Regressive Exogenous model (NARX) which operates on time-series data. A method incorporating this for fault detection on a single spool power generation gas turbine was presented in [26] where the suitability for performing fault detection at various operating conditions was highlighted.
Another data-driven method is Bayesian Networks (BN) that makes use of statistical methods to estimate the most probable cause of an observation. This method can either be used for diagnostics [27,28] or be incorporated into decision-making systems [29]. A thorough investigation of the applicability of using BN for diagnostics on a stationary gas turbine used for power generation is presented in [30,31].
There are also countless ways to combine physics-based and data-driven methods by fusing them in different ways. To mention a few, one could either combine different methods to enhance the fault estimation accuracy [32], or incorporate a decision support system [33], or have a data-driven tuning algorithm to continuously estimate correction factors for the physical estimation [34]. In [35], a diagnostic framework is presented where AANN are used for sensor data filtering, physics-based GPA is performed to extract degradation patterns and a MLP is used for estimating bleed valve leakage.
Each method has its advantages and disadvantages [36] and may be more or less suitable for solving the problem at hand. Common for all numerical methods is that the quality of the data going in dictates the quality of the results coming out. This relates both to the level of noise and uncertainty of the data, as well as the specific measurements available for diagnostics [37]. The importance of handling uncertainties in measurements is highlighted in [38]. A fundamental principle is that, regardless of method, a coupling between the available measurements and the fault or degradation to be estimated must be present [39]. This is known as the identifiability problem. This implies that not knowing parameters, coupled to the fault or degradations, may influence the overall accuracy in a negative way independent of the selected diagnostic method. In the open literature on gas turbine diagnostics, there seems to be a shortcoming in taking the airplane installation effects into account. The effects are mainly the air inlet pressure loss (hereby denoted pressure recovery), bleed air extraction and shaft power extraction [40]. These parameters are sometimes mentioned, but seldom considered, and they are mainly assumed to be known entities [41].
If erroneous airplane installation effects are introduced into a diagnostic analysis, the result will be negatively influenced. For instance, a too high-pressure recovery may be interpreted as a fan degradation while too low bleed flow extraction will look like a restriction of the compressor flow path. In this paper, a framework for estimating unknown installation effects in the presence of gradual degradation is presented. The pressure recovery is estimated from a database which is constructed and continuously updated during gas turbine operation. The bleed flow and shaft power is estimated by training neural networks to extract the effects during an assumed degradation pattern. When a better degradation pattern estimation is available, these networks are retrained to improve the accuracy. Through these estimations, the major part of negative effect on diagnostic results can be mitigated.
The novelty of the work consist of two major parts:
- Creation of an installation effect estimation framework for GPA diagnostics. The importance of knowing the installation effects, which is often neglected in diagnostic analyses, is highlighted and discussed.
- Performance evaluation of an underdetermined solver based on the pseudo-inverse of the Jacobian matrix. This type of solver is sometimes mentioned in the open literature [10,42], but no publications has been found where it is actually being evaluated.
The paper is structured in the following way~: In Section 2, the performance code and test data used for the study are presented. From Section 2.6, the methodology of estimating the installation effects, as well as the complete diagnostic framework, is shown in detail. In Section 3, the results are presented. First, a sensitivity analysis to highlight the importance of the installation effects and explain the physical relationships in play is presented. After that, the installation estimation framework effectiveness for diagnostics is presented. Section 4 contains conclusions drawn from the study.
2. Methodology
In this section, the methodology of the installation effect estimation methods is presented as well as the resources used for the study. Section 2.1 and Section 2.2 describe the gas turbine performance code and solvers. Section 2.3 and Section 2.4 present the measurements and health parameters and how they map together. Section 2.5 describes the test data, Section 2.6 presents the estimation methodologies and Section 2.7 shows the overarching structure when performing diagnostics with the estimated installation effects.
2.1. Gas Turbine Performance Modelling
All simulations are performed with the in-house gas turbine performance code EVA [43,44]. The program is physics based and makes use of performance maps for the characteristics of the rotating components. It is a generalized performance program that solves the system of non-linear equations by assuming conservation of mass and energy under the assumption of ideal gas as well as Gibbs free energy. The performance of each component in the gas turbine is calculated from the upstream discharge conditions and user requirements. The user needs to specify a set of state and target parameters. The target parameters also need numerical values as input. The program solves the system of non-linear equations iteratively by updating the state parameters until the desired target values are achieved. Being an in-house code, full access to all parameters of the gas turbine is granted and the user can freely select the variables going in to the system of equations, as long as a sound mathematical solution can be obtained.
The gas turbine model used for the work is a two-spool low-bypass turbofan in the thrust class of an F414-GE-400, designed and manufactured by GE Aviation, Cincinnati, OH, USA. It is modelled from performance data found in [45] and engineering judgment. A principle sketch of the model and its station numbering can be seen in Figure 1. The bleed flow extraction takes place at station 3 after the high-pressure compressor (HPC) and the shaft power (Horse Power Extraction, HPX) is extracted from the high-pressure spool.
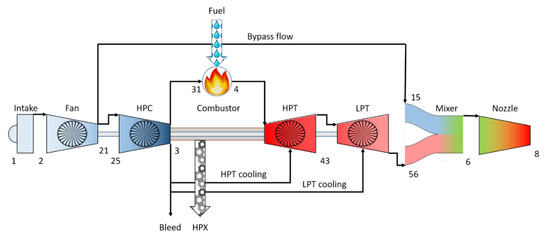
Figure 1.
Layout of the gas turbine model and station numbering.
2.2. Solver Description and Gas Path Analysis (GPA)
There are different solver principles in EVA depending on the problem at hand. The default is for solving square system of equations, hereby denoted as determined, where the number of target variables, M, and state variables, N, is equal. The solver is based on the Jacobian matrix containing the first-order partial derivatives of the target relative to the state parameters. In general, the target parameters are set as measurable quantities, such as gas path measurements, thrust, etc., while the state variables are parameters that may be adjusted to affect the target parameters, such as component map beta values, bypass ratio, health parameters, etc. State and target variable vectors are shown in Equations (1) and (2). From these parameters, the Jacobian matrix J can be derived as in Equation (3).
where represents the state parameter vector of size N and represents the target parameter vector of size M. When solving determined problems, a quasi-Newton method proposed by Broyden [46,47] is used where the Jacobian is updated according to analytically approximations. Thereby, the full Jacobian does not need to be recalculated each iteration, thus reducing the computational cost.
When calculating the operating condition of a healthy gas turbine, only the bare necessary parameters goes into the state and target parameter vectors. The part of the Jacobian containing these derivatives is hereby denoted the base Jacobian. When solving Gas Path Analysis (GPA) problems, additional parameters are added. Health parameters, representing degradations, are added to the state vector and relevant measurements are added to the target vector. The size of the Jacobian increases and this variant is hereafter denoted as the full Jacobian. The part containing the health parameters are called the health Jacobian. To estimate the change in health parameters, the system of equations represented by the full Jacobian is solved.
When performing GPA, the same solver principle as described above applies. The main difference is, as mentioned, that the state and target variables related to GPA is added to the vectors and . The system of equations is then solved for all target and state variables and from there, the health parameter values can be extracted. Commonly, this process is mathematically described by mapping the deltas in measurements to deltas in health parameters through a Health Coefficient Matrix (HCM). This is shown in Equation (4). In practice, the HCM is the inverse of the health Jacobian.
The formulation in Equation (4) only consider a linear relationship valid close to the current operating conditions. Since gas turbine operational behavior is highly nonlinear, this will lead to large errors if not considered. To overcome this, an iterative approach is used where each linear result is used as the starting point for a new linear solution with an updated HCM. The principle is shown in Figure 2.

Figure 2.
Iterative approach for solving non-linear GPA.
When running the solver for underdetermined systems, where M < N, the Jacobian matrix is not square and thus it cannot be inverted, effectively prohibiting it to be solved with the Broyden solver. Instead, a pseudo-inverse is calculated according to Equation (5). The pseudo-inverse Jacobian is then used for calculating the stepping direction to reach the final solution.
Since there are infinite number of solutions to an underdetermined problem, the final solution is dependent on the initial condition when using gradient based solvers, such as the pseudo-inverse method. To ensure the solver will always converge to the same solution for a given set of measurements, the solution from only using the base Jacobian is used as the initial condition for the pseudo-inverse solver. Once converged, the health Jacobian is added to the base Jacobian to create the full Jacobian and the undetermined system is then solved.
Another concern with underdetermined solvers in non-linear problems is that the final solution is also depending on the step size during the iterations. If large steps are taken to achieve a fast convergence, overshoots may occur, leading to a different solution than with a smaller step size. During the first iterations, when the distance between the actual and converged solution is at its greatest, the potential impact due to step size is most critical. To mitigate this, a small initial step size is used which is gradually increased as the solution reaches the converged state.
2.3. Measurements and Health Parameters
The measurements used for diagnostics are split into three categories, the first for ambient measurements, the second for on-board gas path measurements and the third for airplane measurements. The respective measurements can be seen in Table 1, Table 2 and Table 3 with the related measurement uncertainties. The health parameters sought after by the diagnostic algorithm can be seen in Table 4.

Table 1.
Ambient sensors.

Table 2.
Gas turbine sensors.

Table 3.
Airplane sensors and derived parameters.

Table 4.
Health parameters.
The gas turbine measurements are chosen according to the typical instrumentation found on a GE-F414-class engine [48] while the airplane measurements are chosen based on expectations of what might be found, either directly or indirectly from other measurements, in a well instrumented airplane system. Two different measurement setups are used in this study. One setup where all ambient and gas turbine sensors are present, denoted limited sensor suite, and another setup when also T3 from Table 3 is included, denoted full sensor suite.
The health parameters are deltas in efficiency and flow capacity for all rotating components. The definition of the health parameters is according to Equations (6) and (7). This means a baseline gas turbine without any degradations will have a delta in efficiency Δη of 0 and a delta in flow capacity ΔW of 1.
2.4. Matching Scheme
Since there are fewer measurements available for diagnostics than health parameters, a choice has to be made on how to handle the issue for the determined matching scheme. Either some health parameters are withdrawn from the analysis or a priori relations between the health parameters are incorporated. For this study, the latter option is selected to give a more representative view when comparing the results to the underdetermined diagnostic system.
To determine a baseline matching scheme, i.e., a system that is mathematically solvable and robust in the presence of measurement noise, a modified version of the framework presented in [49] is adopted. This ensures a functional setup is provided regarding numerical stability and convergence. From the framework in [49], a matching scheme is obtained by discarding both measurements and health parameters if they have a too high correlation to any other parameter until a determined system is achieved. In this paper, there are two differences from this method. The first is that no health parameters are discarded due to correlation to other health parameters. This does not impact the numerical robustness, even though it may be hard to distinguish two or more highly correlated health parameter in the diagnostic evaluation. The second difference is that for each health parameter discarded due to insufficient number of measurements, a new estimation of that specific health parameter is introduced. Depending on the case, Equations (8)–(11) apply:
- If a turbine efficiency is discarded, set:
- If a turbine flow capacity is discarded, set:
- If a fan or compressor efficiency is discarded, set:
- If a fan or compressor flow capacity is discarded, set:
The variables , , , and represent the interrelationship of degradation between the respective components. For this work, it is assumed that these values are unknown and a value need to be selected. Picking an incorrect value will lead to an erroneous estimated degradation pattern. It will be shown later that having an erroneous degradation pattern is more challenging for the installation effect routines. Therefore, to challenge the installation effect routines more, a value of one is chosen for the variables to , even though it is an incorrect value.
Whenever Equations (8)–(11) are used, it is hereafter denoted as equal hurt. For the case of the underdetermined problems, all available direct measurements are used in combination with all health parameters. The various matching schemes are presented in table format in Appendix A. Note that the assumptions in Equations (8)–(11) are just one of many possible setup. Another method could be to set the change in flow capacity as a function of the change in efficiency for each turbine.
2.5. Test Data
The data used for the analysis are limited to synthesized data using the performance model. The gas turbine operating condition is set according to the flight envelope depicted in Figure 3. The shaded areas represent all possible operating conditions and the nominal ambient condition marker represent the most likely operation conditions. Each test data point is randomly selected with a Gaussian distribution in Mach and altitude, while the fan speed is uniformly distributed with the min and max limits determined by the Mach number.

Figure 3.
Operational envelop.
The effect on diagnostic accuracy due to erroneous airplane installation effects has been simulated. The nominal and erroneous values are found in Table 5. Note that the levels of the different installation effects do not represent a specific airplane system but should rather be viewed as estimated (but still realistic) values. These data go into the sensitivity analysis presented in Section 3.1.

Table 5.
Installation effect nominal and erroneous values.
A gradual degradation pattern has been simulated according to Table 6. The degradation levels are taken from [50] and a linear degradation from healthy to a fully degraded state over 5000 cycles is assumed. Note that since the gas turbine configuration differs to the one used in ProDIMES, from where the degradation pattern is taken, the degradation of the fan in Table 6 relates to the degradation of the LPC in ProDIMES, since they are the most geometrically similar components. The relative degradation pattern (where 0 indicates a healthy condition) can also be seen in Figure 4.

Table 6.
Gradual degradation pattern.

Figure 4.
Relative degradation pattern used as target data.
2.6. Installation Effect Estimation
Before the installation effects are estimated, a choice must be made whether they should be estimated independent of each other or in a sequence. For this study, the sequential option was selected based on the results from the installation effect sensitivity analysis, which is described in Section 3.1 later in this paper. From that analysis it can be concluded that the pressure recovery effect on the fan efficiency is not influenced by either the bleed flow or shaft power extraction. Therefore, the pressure recovery effect can be isolated, making it a suitable candidate to be estimated first. In a second step the bleed flow is estimated since it has a higher influence on the health parameters when compared to the shaft power. In other words, an unknown shaft power extraction will influence the bleed flow estimation less than the other way around.
2.6.1. Pressure Recovery Estimation
In the case of pressure recovery, first-order effects are a function of the geometrical shape of the air intakes and ducts, Mach number, corrected air flow and angle of attack (AoA) and sideslip (AoSS). Second-order effects may include Reynold number effects. Since the air intake mass flow is not measured, a common approach is to use corrected fan speed instead [51]. Because no pressure measurement is available in front of the fan, it is not possible to directly determine the pressure recovery from measurements. Instead, the fan discharge pressure is utilized, where the estimated fan pressure ratio is deducted to get an indirect measurement of the pressure P2. When the fan health status is unknown, this pose an uncertainty.
To perform the pressure recovery estimation, GPA is used. The matching scheme is built up by using the installation effects, i.e., pressure recovery, bleed-flow and shaft power, as state variables and the pressures P21, P3 and P5 as target variables. All health parameters adopt the values from the previous cycle. The rationale for selecting the pressures as target values for the pressure recovery can be seen in Figure 5. The bars show the sensitivity in measurements as a function of changes in installation effects. Larger values mean a strong coupling between the measurement and installation effect.
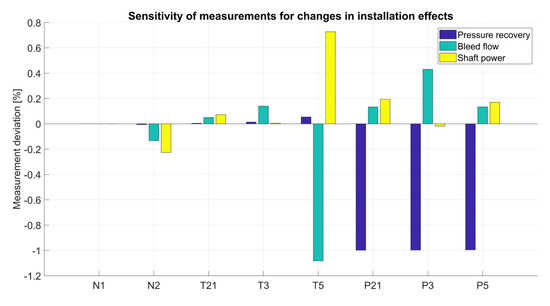
Figure 5.
Sensitivity of measurements at different degradation patterns.
During operation, data from each cycle are collected, from which the pressure recovery is estimated. Once a predefined number of pressure recovery data points has been gathered (in this work set to 40), a scattered database, from which the pressure recovery can be interpolated, is created through a Delaunay triangulation [52]. For the pressure recovery estimation, it is assumed that the pressure recovery is a function of Mach number and corrected fan speed. An example of a pressure recovery scattered data grid can be seen in Figure 6. Each grid node correspond to a pressure recovery value. Once the grid is created with the predefined set of data points, the pressure recovery can be calculated by interpolating from the nearest nodes. If an operating condition outside the grid occurs, a new value is estimated through the GPA process and added to the database, effectively increasing the total size of the grid.
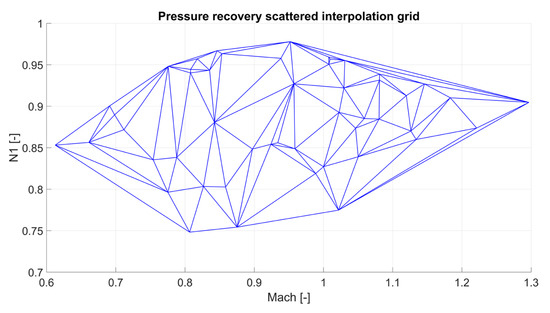
Figure 6.
Example of pressure recovery interpolation grid.
To reduce the effect of measurement noise, a smoothing of the estimated values in the Delaunay grid is performed. As a first step, the length between the connected nodes is calculated. If a length is below a predefined threshold, the nodes are replaced with a new node in the center of the two nodes holding the average value of the two original nodes. This process is continued until all node lengths are above the threshold. After this, an interpolation to the center points of the triangular elements is performed. These new data then replace all internal data points in the grid, reducing the effect of noise but at a small cost of smoothed-out curvatures in the grid.
2.6.2. Bleed Flow and Shaft Power Estimation
Bleed flow and shaft power are highly dependent on the airplane subsystem operating conditions. Bleed flow is commonly extracted to drive the environmental control system (ECS), responsible for pressurizing and heating the cabin as well as cooling electronic equipment. Mechanical shaft power drives the hydraulic system and generators through a gearbox. The power consumption may vary significantly if certain equipment, such as a radar or jamming equipment, is either on or off.
Both the installation effects and the current health status of the gas turbine affect the measurements. Therefore, it is not possible to estimate the installation effects only by analysis of synthesis, since this requires the health parameters to be known. Trying to extract both the installation effects and health parameters this way will lead to a continuously increasing fault. Therefore, each estimation of the installation effect is performed only through the available measurements and known operating conditions. To do this, a feedforward neural network (NN) is trained to estimate the bleed flow and shaft power, respectively. The setup for estimating the bleed flow with the full sensor suite can be seen in Figure 7. In the case of the limited sensor suite, the T3 input node is removed. When the shaft power is considered, the network also use the estimated bleed flow as an additional input.
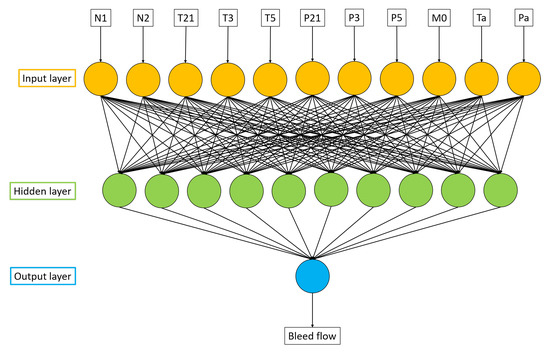
Figure 7.
Neural network for estimating the bleed flow.
A Multi-Layer Perceptron (MLP) network was selected since it is expected to perform fairly well for the type of data fitting problem. It make use of sigmoid transfer functions and it was trained with a Levenberg–Marquardt backpropagation algorithm. All available measurements was selected as input to the networks. Even though some measurements are hardly influenced by certain installation effects, as seen in Figure 5, including more measurements provides more interrelationships between measurements, thereby enabling a better noise filtration by the networks. The number of nodes selected for the hidden layer was based on previous experience for this type of network. There are most likely other NN designs that can perform better than the selected design, but optimization of the NN selection process is out of scope for this study.
The data used for training the networks come from simulations where a predefined degradation pattern is assumed. Initial training is here chosen as a uniform degradation of −3% for all health parameters. This approach means that the networks are tailored to a specific degradation pattern and, if it is correctly assumed, the outputs estimated will have a high accuracy. If however the assumed degradation pattern deviate from the actual, the assumed installation effects will also deviate. To overcome this, yet another assumption is made:
- It is assumed that the average bleed flow and shaft power are constant over time.
It is worth noticing that this assumption may not be exactly correct since mechanical constructions, such as valves, pressure vessels, etc., tend to leak more when they age. This could potentially cause an old airplane to consume more bleed air than a new. If actual values of increased leakage is known it could be included in the assumption to further enhance it. In the proposed work, no additional leakage due to ageing is considered.
Through the assumption, correction factors for the bleed flow and shaft power can be established by looking at the change in the moving average over time. To get the correction factors, an average value over a window size of 10 cycles was taken from the network outputs. The average data were then used in a linear regression intersecting origo to get the derivative . Multiplied with the current cycle, , the correction factor, , is calculated according to Equation (12). The final estimated installation effect, is then calculated by adding the correction factor to the network output, according to Equation (13).
Note that this method implies a constant change in health parameter degradation over the cycles. If the data for the correction factor are taken at instances where the change in degradation between them is not constant, the cycle positions need to be transformed to values representing a constant degradation.
When the correction factors for either the bleed flow or the shaft power exceed a predefined threshold, in the present work set to 1% and 50 kW for the bleed flow and shaft power, respectively, a recalibration or limitation of both networks is triggered. If the estimated health parameters indicate a degradation pattern other than the pattern used for training the networks, new networks are retrained with the current degradation pattern. If there are only minor changes in degradation pattern, instead of retraining, a limiter is applied to the network output where the minimum and maximum of the previously estimated installation effects are used as the limits. This is completed to dampen the large fluctuations that may arise when the correction factor may continuously grow to values larger than the network estimations.
2.7. Diagnostic Framework
When performing diagnostics with the estimated installation effects, the process is according to Figure 8. For each of the 5000 cycles, the following steps are executed. Note that these steps are also numbered in Figure 8.
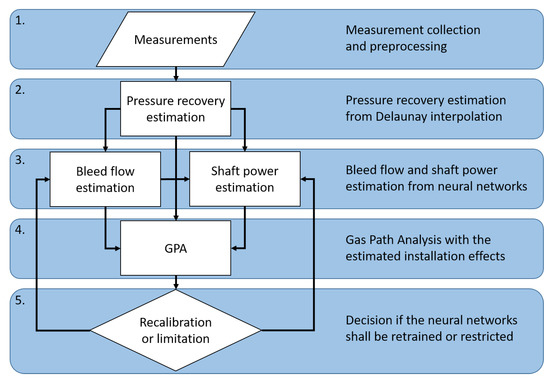
Figure 8.
Diagnostic principle flowchart.
- The measurements are filtered an outliers are removed. Since this study is performed on simulated data, this process is already taken care of in the data creation process.
- The pressure recovery is estimated according to the process described in Section 2.6.1.
- The bleed flow and shaft power is estimated according to the process described in Section 2.6.2.
- GPA diagnostics is performed using the estimated installation effects and for all combinations of solvers and matching schemes. The GPA process and solvers are described in Section 2.2 and the matching schemes in Section 2.4.
- A check is performed if the bleed flow and shaft power estimations are still valid by evaluating the correction factors from Equation (12). If any correction factor exceeds the threshold specified in Section 2.6.2, an event is triggered. If the current degradation pattern from step 4 differs from the one used for training the bleed and shaft power NN, they are retrained with the current degradation pattern. If not, the min- and maximum value of the correction factor is limited to the lowest and highest values obtained up to this cycle.
3. Results and Discussion
In this section, a sensitivity analysis and the effectiveness of the proposed diagnostic framework is presented. In Section 3.1, the effect on diagnostic accuracy in the presence of erroneous installation effects is thoroughly covered. Section 3.2 present the performance of the proposed method for the two different solvers and matching schemes. Comparisons to best constant guess and exact installation effects are also included.
3.1. Installation Effect Sensitivity Analysis
A sensitivity analysis was performed to assess the effect of erroneous airplane installation effects on a healthy gas turbine. It was performed by varying the installation effects according to Table 5 at a cruise operating condition. Measurement noise was according to Table 1, Table 2 and Table 3. In Figure 9, the effect on the fan and compressor health parameters can be seen. The installation effects are grouped on the y-axis of the chart while the different solvers and matching schemes are represented by the various markers. The location of the marker show the average deviation from the nominal value while the bars represent the maximum level of scatter due to the implanted measurement noise.
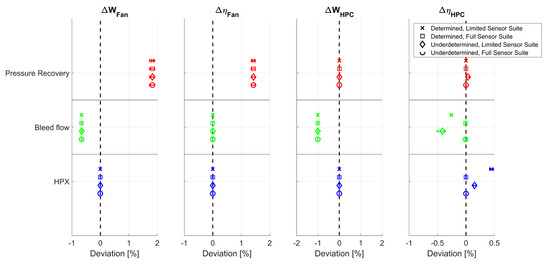
Figure 9.
Fan and compressor sensitivity to erroneous installation effects.
From Figure 9, it is obvious that the pressure recovery has a major impact on the fan health parameters. Having an erroneous pressure recovery is directly proportional to performing the analysis at a biased fan pressure ratio. Here, the gas turbine model believes that the fan pressure ratio is higher than it is, leading to a higher component map β-value. The corresponding mass flow from the component map is subsequently lower due to the higher pressure ratio at a constant speed, while the actual mass flow, as dictated by the HPT flow capacity, remains unchanged. To account for the lower estimated mass flow from the component map, the delta in flow capacity is increased.
The increase in efficiency is also an effect of the erroneous increase in the pressure ratio. This cause the corresponding temperature for an isentropic compression to increase, thus reducing the delta between the actual and isentropic discharge temperature, which is interpreted as an increased isentropic efficiency.
An interesting feature related to the effect from the pressure recovery is that the effect on the flow capacity health parameter is highly dependent on the component map operating point. The reason for the corresponding flow capacity amplifying the predicted fault (1% error in pressure recovery leading to >1% fault in flow capacity) is the correlation between the pressure ratio and corrected mass flow at a constant speed line. If second-order effects, such as potential influence from a slightly wrong HPT capacity due to the erroneous pressure recovery, are neglected and the angle α in Figure 10 is 45°, the ratio between pressure ratio and corrected mass flow is 1:1. Such an operating point is seen at location A in the figure. A lower angle gives an amplification of the estimated health parameter, as in location B, and a higher angle a reduced influence from the pressure recovery, as in location C. This means that the health parameter estimation is less sensitive to errors in pressure recovery at high power settings, where the speed-lines are more vertical, than at part-power settings. Another effect worth keeping in mind is the uncertainty of erroneous pressure recovery also become higher at small fan pressure ratios. This is because the ratio of the magnitude of the fault compared to the fan pressure ratio is higher than at high pressure ratios.
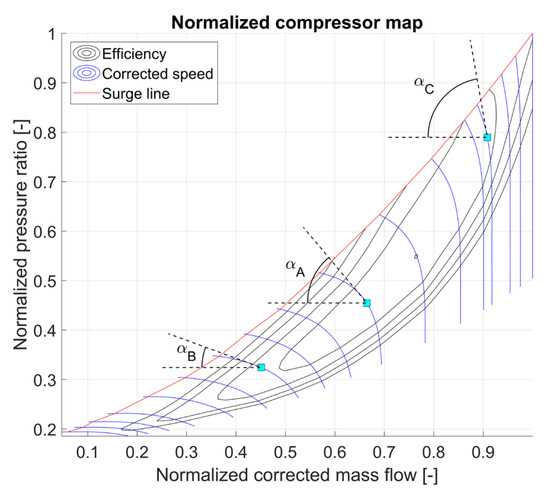
Figure 10.
Arbitrary compressor map and effect of speed line slope.
From Figure 9, it is also clear that the customer bleed flow extraction is of importance when estimating the fan flow capacity. This is an effect of the mismatch between the actual and estimated mass flow going through the fan and compressor. Since the erroneous bleed flow indicates a smaller mass flow fraction extracted than it actually is, the mass flow through the fan and compressor is estimated to a higher value. To match the downstream HPT capacity, the delta in flow capacity is decreased. On a first-order basis, the magnitude of the decrease in flow capacity is a function of the bypass ratio according to Equation (14). The term is the magnitude of the erroneous bleed flow estimation in percent and is the bypass ratio. denotes high order terms neglected in this simplification. It then becomes clear that high-bypass turbofans are less sensitive to erroneous customer bleed flow extraction when estimating the fan performance.
Regarding the HPC flow capacity, the only installation effect having a significant impact on it is the customer bleed flow extraction. The effect is the same as discussed for the fan and the magnitude can be described by Equation (15), considering that all mass flow from the HPC will enter the HPT. The effect on the delta in HPC efficiency is slightly more scattered and is dependent on the numerical solver principle and sensors available. It can be seen that if a full sensor suite is applied, i.e., including the HPC discharge temperature T3 in the analysis, the effect on the efficiency is negligible. This is due to having a complete knowledge of the pressure and temperature ratio over the HPC, which are the main parameters for the isentropic efficiency. Removing T3 from the analysis, as in the limited sensor suite, causes some variation in the results. The effect from pressure recovery on the HPC is relatively small and can be neglected, but an erroneous bleed flow level has a noticeable impact on HPC performance predictions.
For both the determined and underdetermined solver, a negative delta in HPC efficiency is estimated due to erroneous bleed flow. This is due to a slightly overestimated value of T3. To understand this effect, the effect of the HPT and LPT, as seen in Figure 11, needs to be taken into account. Since the modelled bleed flow is lower than the actual value, the mass flow going through the fan is reduced while the temperature ratio, and thus the change in enthalpy, remains constant. The reduced mass flow cause the power of the LP shaft to be underestimated, thereby reducing the work produced by the LPT, leading to a lower temperature ratio over the LPT. Since T5 is known, it manifests as an underestimation of the turbine intermittent temperature T47. As a result, the combustion outlet temperature T4 is also reduced to keep the HPT power in balance with the HPC, causing the fuel flow to be reduced. For the turbines, the reduction in shaft power is seen as a reduction in the temperature ratio and a corresponding drop in isentropic efficiency, while the HPC efficiency is also reduced due to increased T3 and reduced mass flow.
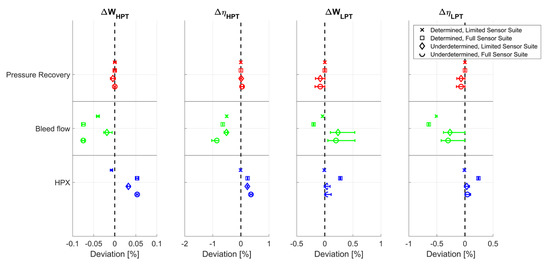
Figure 11.
Turbine sensitivity to erroneous installation effects.
The effect of erroneous shaft power extraction vary significantly depending on the solver and sensor suite. For instance, if a full sensor suite is used, the HPC degradation is correctly identified and the fault instead ends up on the turbine health estimation. Since a lower shaft power is assumed, compared to the actual shaft power extracted from the HP shaft, and the temperature ratio and mass flow over the HPC is known, the power consumed by the HPC is correctly estimated. The power delivered by the HPT directly follows the energy balance in accordance with Equation (16). The variable denotes shaft power while the prefix c, t and x stands for compressor, turbine and extraction (external shaft power extraction). is the mechanical efficiency of the shaft. The notation implies a positive value of the turbine power and negative for the compressor and extraction.
From Equation (16), it is seen that the turbine power will be matched to the compressor and the reduced shaft power extraction leads to a reduced turbine power. Since the LPT outlet temperature T5 is matched and the LP shaft power is in essence unaffected by the erroneous shaft power extraction, the intermittent turbine temperature T47 remains correct. To balance the system, the fuel flow is increased, thus increasing the HPT inlet temperature and HPT temperature ratio, leading to the increase in HPT isentropic efficiency. The LPT isentropic efficiency is also increased for the determined solver as a consequence of the assumed turbine equal hurt. The deviation in HPT corrected mass flow come as a secondary effect due to the change in fuel flow. The magnitude of these uncertainties is, however, very small. In the limited sensor suite, the principle is the same but the error tends to be smeared over the turbines and the HPC instead of just the turbines.
As a general difference in behavior between the two sensor suites, it is clear that the full sensor suite pushes the effect of the erroneous installation effects toward the turbines, unless a compressing component is directly affected. Between the two different solvers, it is apparent that the underdetermined solver experience a lot more scattered results, an effect of the theoretically infinite number of mathematical solutions. The scatter seems to be mostly focused on the turbines, since those are poorly instrumented and, therefore, have a higher degree of freedom in the estimated health parameters.
3.2. Assessment of Proposed Method
To assess the effectiveness of the diagnostic framework, as proposed in Figure 8, it was applied to a dataset with a linear increase in degradation over 5000 cycles. In Figure 12 and Figure 13, probability density functions (PDF) of the uncertainties of the estimated installation effects can be seen. Both figures show results from the determined matching scheme with the full sensor suite. Figure 12 is without measurement noise and Figure 13 is with noise. The absolute deviation shown in the histogram use the definition for the pressure recovery and bleed flow according to Equation (17) and the shaft power according to Equation (18). denotes the absolute deviation, while and represent estimated and actual installation effect values. The dashed lines show the average estimation error.
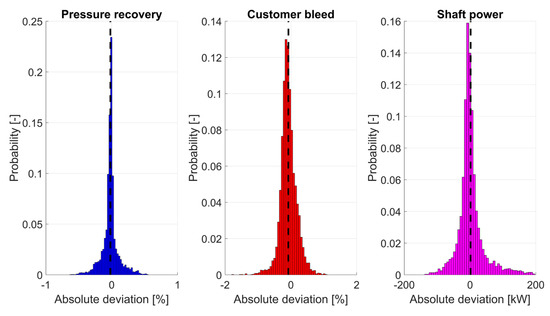
Figure 12.
PDF of the error in the estimated installation effects, without measurement noise.
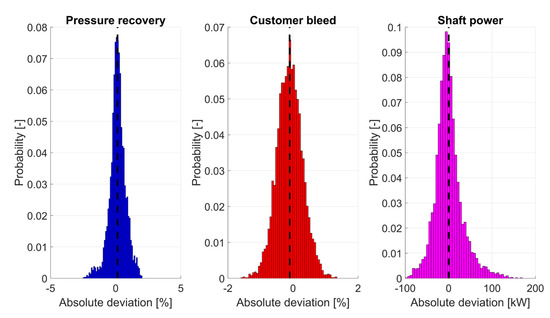
Figure 13.
PDF of the error in the estimated installation effects, with measurement noise.
At first glance, the noise-free results in Figure 12 suggest that the best estimation is achieved for the pressure recovery. This is an expected result since the unknown variables in the estimation are mainly the fan health. All other unknowns have either none or only a secondary effect on the pressure recovery estimation, thereby reducing the number of potential uncertainties. Thereafter comes the bleed flow with slightly more spread-out results, since there are more dependencies to the various health estimations. The least accurate estimation is for the shaft power. This is because of the relatively small influence an erroneous shaft power has on the measurements. Additionally, the NN estimating the shaft power use the bleed flow estimation as input.
Comparing the noise-inclusive result in Figure 13 with the noise-free in Figure 12, a significant increase in uncertainty in pressure recovery is noted. This is a drawback of the method chosen where the errors from the pressure recovery database creation influence all subsequent estimations. This effect could be reduced either by increased smoothing the database, at the risk of smearing out potential curvatures, or continuously updating the database to get a sample size large enough for the noise to be filtered out. Both the bleed flow and shaft power estimations show fairly similar results as the noise-free case when it comes to the minimum and maximum deviations but with a slightly larger spread in the results for the noise-inclusive cases. A summary of the mean and standard deviation of the absolute deviation for the installation effects for both the noise-free and noise-inclusive results can be seen in Table 7 and Table 8.

Table 7.
Estimated installation effect deviation, without measurement noise.

Table 8.
Estimated installation effect deviation, with measurement noise.
From Table 7, it is clear that the pressure recovery estimation accuracy is unaffected by the matching scheme as well as the sensor suite selection. This seems reasonable having in mind that the fan instrumentation remain unchanged for all combinations. The mean error is very small and the standard deviation also show relatively limited scatter. This observation dictates that the deviations between the matching schemes and sensor suite regarding the pressure recovery seen in Table 8 is only a product of the measurement noise, indicating that the pressure recovery estimation routine suffers from lack of robustness.
For the bleed flow estimation, some differences between the setups takes place. Without noise, the mean error is about the same for all cases but the standard deviation varies. For the noise-inclusive results, the scatter is in general higher but it is clear that the determined matching scheme yields better results than the underdetermined method. Since this behavior is not seen without noise, it could either be a random effect by the noise or an effect of the neural networks having to deal with both the noise and a wider solution space in the training data.
The shaft power estimation shows a pattern with lower mean error and a higher scatter for the limited sensor suite compared to the full sensor suite for the noise-free cases. However, noise inclusive cases indicate the opposite. It is noted that the scatter of the noise-free-determined matching scheme with limited sensor suite does not, however, follow this trend. The reason for this will be highlighted later in this section. The mean error for the noise-free cases indicates that it is a disadvantage to include the measurement T3 in the estimation, which makes sense given the sensitivity shown in Figure 5. Including measurement noise, however, shows the opposite. This is an effect of better noise filtering from the network, since more measurements means more interrelationships to be used to separate noise from physical changes in the measurements.
As mentioned above, the standard deviation of the estimated shaft power for the determined matching scheme with the limited sensor suite does not follow the general trend. This can be traced to the correction factor described in Equation (12). In Figure 14, all correction factors for the noise-free results can be seen. A high correction factor implies that the network is performing estimations at conditions far away from the data it was trained on, thereby indicating a reduced accuracy.
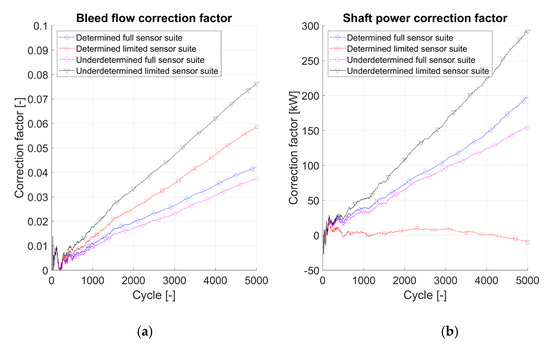
Figure 14.
Correction factors, without measurement noise. (a) Bleed flow correction factor. (b) Shaft power correction factor.
An interesting feature from Figure 14 is the correction factor for the shaft power. It is seen that the correction factor for the determined solver with limited sensor suite is very close to zero during the complete set of cycles. Therefore, the threshold for limiting the network output was never triggered and toward the end of the cycles, several unphysical outliers showing negative power extraction occurred.
A low correction factor could be a sign of an estimated degradation pattern close to the actual pattern but, as will be shown later, it is not the case here. However, training the network on a degradation pattern different to the actual does not guarantee that the estimations will diverge. For this specific case the issue could have been identified and handled since the error in bleed flow estimation, which is trained on the same data, steadily increases. Worth noticing in the shaft power estimation is that even though the correction factor is low the scatter, and thereby the RMS value of the estimated shaft power, steadily increased with the cycles. For this particular case, RMS would have been a better estimator for when limiters should be applied to the estimation.
In Table 9 and Table 10, the actual as well as the estimated degradation patterns can be seen without and with measurement noise. For the compressing components the results are fairly good for all cases, apart from the compressor efficiency when the limited sensor suite is used. This is because the compressor discharge temperature T3 is highly correlated to the compressor efficiency. Without it, the compressor degradation will be smeared out over the compressor and turbines. The impact from not considering a T3 measurement is also shown in the poor HPT flow capacity estimation. Therefore, the combustor inlet temperature is off, leading to an erroneous fuel flow, thereby affecting the HPT flow capacity.

Table 9.
Actual and estimated degradation patterns, without measurement noise. * Efficiency equal hurt assumed. ** Flow capacity equal hurt assumed.

Table 10.
Actual and estimated degradation patterns, with measurement noise. * Efficiency equal hurt assumed. ** Flow capacity equal hurt assumed.
To evaluate the performance of the proposed model, simulations representing best and worst-case estimations has been performed. In the best case, the exact values of all installation effects are assumed while constant values for the bleed flow and shaft power are assumed for the worst-case scenario. In the worst-case scenario, constant-bleed flow and shaft power is assumed. The values adopted are the average over the total number of cycles, implying the user know the overall operational profile of the installation effects but not the actual value at a given instance. Additionally, two different estimation methods for the pressure recovery has been used for the worst case. One where the pressure recovery is estimated by the proposed model and one where the pressure recovery is assumed to be unknown and estimated in accordance with MIL-E-5007 [53]. The results from the noise-free cases for the determined solver and full sensor suite can be seen in Table 11.

Table 11.
Actual and estimated degradation patterns, without measurement noise for various installation effect estimation methods. * Efficiency equal hurt assumed. + Pressure recovery according to proposed model. ++ Pressure recovery according to MIL-E-5007.
From Table 11, it can be concluded that there are only minor differences between the proposed model and both the best and worst-case scenarios when it comes to the estimated degradation pattern. The fan degradation estimation is however slightly worse for the worst-case scenario when the proposed pressure recovery model is used. This is an effect of the poor bleed flow estimation, causing a slightly erroneous health estimation in the phase where the pressure recovery scattered interpolation grid is constructed. Those errors then become permanent since the pressure recovery model is used throughout the cycles.
It is clear from Table 11 that the effect of erroneous pressure recovery only has an impact on the fan degradation. When comparing the two worst-case results, the MIL-E-5007 pressure recovery estimation is always higher than the actual value. It is manifested through a higher magnitude of the efficiency degradation and, to balance the equations, the mass flow degradation is also estimated at a higher value. This is expected according to the sensitivity analysis shown in Figure 9. All other health parameter estimations downstream are identical between the two worst-case scenarios.
For the compressor, the largest deviation is for the efficiency where it differs approximately 0.2%. Interestingly, the model prediction is slightly better than the best case. This comes from the small underestimation in the average predicted bleed flow of approx. −0.07%, as can be seen in Table 7. From the sensitivity analysis in Figure 9, it is also clear that a lower bleed flow estimation cause a lower compressor efficiency and flow capacity health parameter estimation, just like the result shows. Note that since the result from the proposed model incorporates installation effects estimations from neural networks that has been trained on data where noise was added, the proposed model results could potentially differ slightly when rerun. It is, therefore, not possible to conclude that the model always will perform better than the best case only based on one case.
The differences in turbine health parameters are mainly an effect of the erroneous equal hurt assumption, resulting in the health estimations being smeared out over the turbines. Since the erroneous assumption of uniform equal hurt for the turbine efficiency prohibits an exactly correct health parameter estimation, no method will get it correct. Based on the numerical values between the methods, all cases seem to be performing roughly similarly.
The fact that all cases in Table 11 show such similar result, except for the fan health parameters estimation when using the MIL-E-5007 pressure recovery estimation, is expected since the average value of all installation effects are correct, thereby causing the degradation pattern to be similar. If the average estimation of any installation effect are to be incorrect, the fault in degradation pattern will be seen with a magnitude proportional to the results seen in the sensitivity analyses in Figure 9 and Figure 11.
The major deviations between the methods is seen in the scatter of the health parameter estimations. In Table 12, the RMS values for each health parameters are presented. Note the scaling factor for making the table more readable. Just like in Table 11, only the results for the determined solver with the full sensor suite is shown.

Table 12.
Actual and estimated RMS value of health parameters, without measurement noise for various installation effect estimation methods. * Efficiency equal hurt assumed. + Pressure recovery according to proposed model. ++ Pressure recovery according to MIL-E-5007.
From Table 12, it is clear that the proposed model significantly reduces the scatter compared with the constant installation effects estimations, except for the compressor efficiency where all methods show similar results. It is also clear that better installation effect estimations can reduce the scatter even further. Compared to the constant installation effect estimation (with the proposed pressure recovery model), the proposed model is able to reduce the RMS value by 26% for up to 80% for .
4. Conclusions
In this paper, a framework for estimating airplane installation effects to mitigate the negative impact on GPA diagnostic results is presented. The installation effect estimation framework is reasonably accurate when excluding measurement noise but suffers from poor robustness to measurement noise in the case of the pressure recovery estimation. The methodology of using a correction factor to account for unknown degradation patterns shows good performance, but could benefit from improved tuning related to limitations in shaft power estimation. The proposed method shows the same degradation pattern as when all installation effects are known. Furthermore, compared to assuming the most accurate, but constant, installation effects, the proposed method manages to reduce the scatter in health parameter estimation from 26% (for the fan efficiency) to 80% (for the HPC flow capacity).
Author Contributions
Conceptualization, M.S. and K.K.; methodology, M.S. and K.K.; formal analysis, M.S.; writing—original draft preparation, M.S.; writing—review and editing, K.K.; project administration, K.K. All authors have read and agreed to the published version of the manuscript.
Funding
This research was funded by the Swedish Knowledge Foundation (KKS) under the project DIAGNOSIS, grant number 20160133.
Acknowledgments
The authors would like to acknowledge the support from Valentina Zaccaria for the discussions on the topic of diagnostics and Amare Desalegn Fentaye for support on neural networks.
Conflicts of Interest
The authors declare no conflict of interest. The funders had no role in the design of the study; in the collection, analyses, or interpretation of data; in the writing of the manuscript, or in the decision to publish the results.
Nomenclature
| AANN | Auto Associative Neural Network |
| AoA | Angle of Attack |
| AoSS | Angle of Sideslip |
| BN | Bayesian Network |
| BPR | Bypass Ratio |
| ECS | Environmental Control System |
| EKF | Extended Kalman Filter |
| ELM | Extreme Learning Machine |
| EVA | Environmental Assessment |
| GE | General Electric |
| GPA | Gas Path Analysis |
| HCM | Health Coefficient Matrix |
| HOT | High Order Term |
| HP | High Pressure |
| HPC | High-Pressure Compressor |
| HPT | High-Pressure Turbine |
| HPX | Horse Power Extraction (and Shaft Power Extraction) |
| KF | Kalman Filter |
| LP | Low Pressure |
| LPT | Low-Pressure Compressor |
| MLP | Multilayer Perceptron |
| NARX | Nonlinear Auto-Regressive Exogenous model |
| NN | Neural Network |
| RMS | Root Mean Square |
Appendix A
In this appendix, the various diagnostic matching schemes used throughout the paper is presented. Note that the fan speed is not included. This is because it is used to control the fuel flow and therefore not included in the diagnostic matching scheme.

Table A1.
Determined solver, full sensor suite.
Table A1.
Determined solver, full sensor suite.
| Target Variables | State Variables |
|---|---|
| N2 | ΔηFan |
| T21 | ΔWFan |
| T3 | ΔηHPC |
| T5 | ΔWHPC |
| P21 | ΔηHPT = ΔηLPT |
| P3 | ΔWHPT |
| P5 | ΔWLPT |

Table A2.
Determined solver, limited sensor suite.
Table A2.
Determined solver, limited sensor suite.
| Target Variables | State Variables |
|---|---|
| N2 | ΔηFan |
| T21 | ΔWFan |
| T5 | ΔηHPC |
| P21 | ΔWHPC |
| P3 | ΔηHPT = ΔηLPT |
| P5 | ΔWHPT = ΔWLPT |

Table A3.
Underdetermined solver, full sensor suite.
Table A3.
Underdetermined solver, full sensor suite.
| Target Variables | State Variables |
|---|---|
| N2 | ΔηFan |
| T21 | ΔWFan |
| T3 | ΔηHPC |
| T5 | ΔWHPC |
| P21 | ΔηHPT |
| P3 | ΔWHPT |
| P5 | ΔηLPT |
| ΔWLPT |

Table A4.
Underdetermined solver, limited sensor suite.
Table A4.
Underdetermined solver, limited sensor suite.
| Target Variables | State Variables |
|---|---|
| N2 | ΔηFan |
| T21 | ΔWFan |
| T5 | ΔηHPC |
| P21 | ΔWHPC |
| P3 | ΔηHPT |
| P5 | ΔWHPT |
| ΔηLPT | |
| ΔWLPT |
References
- Gao, Z.; Cecati, C.; Ding, S.X. A Survey of Fault Diagnosis and Fault-Tolerant Techniques—Part I: Fault Diagnosis With Model-Based and Signal-Based Approaches. IEEE Trans. Ind. Electron. 2015, 62, 3757–3767. [Google Scholar] [CrossRef]
- Gao, Z.; Cecati, C.; Ding, S.X. A Survey of Fault Diagnosis and Fault-Tolerant Techniques Part II: Fault Diagnosis with Knowledge-Based and Hybrid/Active Approaches. IEEE Trans. Ind. Electron. 2015, 62, 3768–3774. [Google Scholar] [CrossRef]
- Urban, L.A. Gas Path Analysis Applied to Turbine Engine Condition Monitoring. J. Aircr. 1973, 10, 400–406. [Google Scholar] [CrossRef]
- Tang, L.; Volponi, A.J.; Prihar, E. Extending Engine Gas Path Analysis Using Full Flight Data. In Proceedings of the ASME Turbo Expo 2019: Power for Land, Sea, and Air, GT2019-90161, Phoenix, AZ, USA, 17–21 June 2019. [Google Scholar] [CrossRef]
- Merrington, G.L. Fault Diagnosis of Gas Turbine Engines From Transient Data. J. Eng. Gas Turbines Power 1989, 111, 237–243. [Google Scholar] [CrossRef]
- Tsoutsanis, E.; Meskin, N.; Benammar, M.; Khorasani, K. Transient Gas Turbine Performance Diagnostics Through Nonlinear Adaptation of Compressor and Turbine Maps. J. Eng. Gas Turbines Power 2015, 137, 091201. [Google Scholar] [CrossRef]
- Doel, D.L. An Assessment of Weighted-Least-Squares-Based Gas Path Analysis. J. Eng. Gas Turbines Power 1994, 116, 366–373. [Google Scholar] [CrossRef]
- Mathioudakis, K.; Kamboukos, P. Assessment of the Effectiveness of Gas Path Diagnostic Schemes. J. Eng. Gas Turbines Power 2004, 128, 57–63. [Google Scholar] [CrossRef]
- Stamatis, A.G. Evaluation of gas path analysis methods for gas turbine diagnosis. J. Mech. Sci. Technol. 2011, 25, 469–477. [Google Scholar] [CrossRef]
- Li, Y.G. Gas Turbine Performance and Health Status Estimation Using Adaptive Gas Path Analysis. J. Eng. Gas Turbines Power 2010, 132, 041701. [Google Scholar] [CrossRef]
- Chen, Y.-Z.; Zhao, X.-D.; Xiang, H.-C.; Tsoutsanis, E. A sequential model-based approach for gas turbine performance diagnostics. Energy 2020, 220, 119657. [Google Scholar] [CrossRef]
- Kalman, R.E. A New Approach to Linear Filtering and Prediction Problems. J. Basic Eng. 1960, 82, 35–45. [Google Scholar] [CrossRef]
- Gelb, A. (Ed.) Applied Optimal Estimation; The MIT Press: Cambridge, MA, USA, 1974; ISBN 978-0262570480. [Google Scholar]
- Kobayashi, T.; Simon, D.L. Application of a Bank of Kalman Filters for Aircraft Engine Fault Diagnostics; GT2003-38550; ASME Turbo Expo: Atlanta, GA, USA, 2003. [Google Scholar] [CrossRef]
- Lu, F.; Ju, H.; Huang, J. An improved extended Kalman filter with inequality constraints for gas turbine engine health monitoring. Aerosp. Sci. Technol. 2016, 58, 36–47. [Google Scholar] [CrossRef]
- Jin, P.; Lu, F.; Huang, J.; Kong, X.; Fan, M. Life cycle gas path performance monitoring with control loop parameters uncertainty for aeroengine. Aerosp. Sci. Technol. 2021, 115, 106775. [Google Scholar] [CrossRef]
- Bose, N.K.; Liang, P. Neural Network Fundamentals with Graphs, Algorithms, and Applications; McGraw-Hill: New York, NY, USA, 1996; ISBN 978-0070066182. [Google Scholar]
- Loboda, I.; Rios, U.E.; Sanchez, C.E. Probabilistic Neural Networks for Gas Turbine Fault Recognition. Aerospace Technol. 2012, 8, 53–58. [Google Scholar]
- Tayarani-Bathaie, S.S.; Vanini, Z.S.; Khorasani, K. Dynamic neural network-based fault diagnosis of gas turbine engines. Neurocomputing 2014, 125, 153–165. [Google Scholar] [CrossRef]
- Fast, M.; Assadi, M.; De, S. Development and multi-utility of an ANN model for an industrial gas turbine. Appl. Energy 2009, 86, 9–17. [Google Scholar] [CrossRef]
- Stenfelt, M.; Kyprianidis, K. Gas Turbine Mixer Modelling Strategies and Afterburner Liner Burn-Through Diagnostics. In Proceedings of the 24th International Symposium on Air Breathing Engines (ISABE) Conference, ISABE-2019-24147, Canberra, Australia, 22–27 September 2019. [Google Scholar]
- Khelil, Y.; Graton, G.; Djeziri, M.A.; Ouladsine, M.; Outbib, R. Fault Detection and Isolation in Marine Diesel Engines: A Generic Methodology. IFAC Proc. Vol. 2012, 45, 964–969. [Google Scholar] [CrossRef]
- Kramer, M. Autoassociative neural networks. Comput. Chem. Eng. 1992, 16, 313–328. [Google Scholar] [CrossRef]
- Vanini, Z.N.S.; Meskin, N.; Khorasani, K. Multiple-Model Sensor and Components Fault Diagnosis in Gas Turbine Engines Using Autoassociative Neural Networks. J. Eng. Gas Turbines Power 2014, 136, 091603. [Google Scholar] [CrossRef]
- Pérez-Ruiz, J.L.; Tang, Y.; Loboda, I. Aircraft Engine Gas-Path Monitoring and Diagnostics Framework Based on a Hybrid Fault Recognition Approach. Aerospace 2021, 8, 232. [Google Scholar] [CrossRef]
- Bai, M.; Liu, J.; Chai, J.; Zhao, X.; Yu, D. Anomaly detection of gas turbines based on normal pattern extraction. Appl. Therm. Eng. 2019, 166, 114664. [Google Scholar] [CrossRef]
- Romessis, C.; Mathioudakis, K. Bayesian Network Approach for Gas Path Fault Diagnosis. J. Eng. Gas Turbines Power 2004, 128, 64–72. [Google Scholar] [CrossRef]
- Lee, Y.K.; Mavris, D.N.; Volovoi, V.V.; Yuan, M.; Fisher, T. A Fault Diagnosis Method for Industrial Gas Turbines Using Bayesian Data Analysis. J. Eng. Gas Turbines Power 2010, 132, 041602. [Google Scholar] [CrossRef]
- DePold, H.R.; Gass, F.D. The Application of Expert Systems and Neural Networks to Gas Turbine Prognostics and Diagnostics. J. Eng. Gas Turbines Power 1999, 121, 607–612. [Google Scholar] [CrossRef]
- Zaccaria, V.; Fentaye, A.D.; Kyprianidis, K. Assessment of Dynamic Bayesian Models for Gas Turbine Diagnostics, Part 1: Prior Probability Analysis. Machines 2021, 9, 298. [Google Scholar] [CrossRef]
- Zaccaria, V.; Fentaye, A.D.; Kyprianidis, K. Assessment of Dynamic Bayesian Models for Gas Turbine Diagnostics, Part 2: Discrimination of Gradual Degradation and Rapid Faults. Machines 2021, 9, 308. [Google Scholar] [CrossRef]
- Zaccaria, V.; Fentaye, A.D.; Stenfelt, M.; Kyprianidis, K.G. Probabilistic Model for Aero-Engines Fleet Condition Monitoring. Aerospace 2020, 7, 66. [Google Scholar] [CrossRef]
- Tang, L.; Volponi, A.J. Intelligent Reasoning for Gas Turbine Fault Isolation and Ambiguity Resolution. J. Eng. Gas Turbines Power 2018, 141, 041023. [Google Scholar] [CrossRef]
- Brotherton, T.; Volponi, A.; Luppold, R.; Simon, D.L. eSTORM: Enhanced Self Tuning On-Board Real-Time Engine Model. In Proceedings of the 2003 IEEE Aerospace Conference Proceedings (Cat. No.03TH8652), Big Sky, MT, USA, 8–15 March 2003. [Google Scholar] [CrossRef]
- Fentaye, A.; Zaccaria, V.; Kyprianidis, K. Discrimination of Rapid and Gradual Deterioration for an Enhanced Gas Turbine Life-cycle Monitoring and Diagnostics. Int. J. Progn. Health Manag. 2021, 12. [Google Scholar] [CrossRef]
- Fentaye, A.D.; Baheta, A.T.; Gilani, S.I.; Kyprianidis, K.G. A Review on Gas Turbine Gas-Path Diagnostics: State-of-the-Art Methods, Challenges and Opportunities. Aerospace 2019, 6, 83. [Google Scholar] [CrossRef]
- Chen, M.; Hu, L.Q.; Tang, H. An Approach for Optimal Measurements Selection on Gas Turbine Engine Fault Diagnosis. J. Eng. Gas Turbines Power 2015, 137, 071203. [Google Scholar] [CrossRef]
- Liao, Z.; Wang, J.; Liu, J.; Geng, J.; Li, M.; Chen, X.; Song, Z. Uncertainties in gas-path diagnosis of gas turbines: Representation and impact analysis. Aerosp. Sci. Technol. 2021, 113, 106724. [Google Scholar] [CrossRef]
- Volponi, A.; Brotherton, T.; Luppold, R. Development of an Information Fusion System for Engine Diagnostics and Health Management. In Proceedings of the AIAA 1st Intelligent Systems Technical Conference, AIAA 2004-6461, Chicago, IL, USA, 20–22 September 2004. [Google Scholar] [CrossRef][Green Version]
- Walsh, P.P. and Fletcher, P. Gas Turbine Performance, 2nd ed.; Blackwell Science: Hoboken, NJ, USA, 2004; ISBN 0-632-06434-X. [Google Scholar]
- Verbist, M.L.; Visser, W.P.J.; Van Buijtenen, J.P. Experience with Gas Path Analysis for On-Wing Turbofan Condition Monitoring. J. Eng. Gas Turbines Power 2013, 136, 011204. [Google Scholar] [CrossRef]
- Tsoutsanis, E.; Li, Y.G.; Pilidis, P.; Newby, M. Gas Path Analysis Applied to an Aeroderivative Gas Turbine Used for Power Generation. In Proceedings of the 5th International Conference on Condition Monitoring & Machinery Failure Prevention Technologies, Edinburgh, UK, 15–18 July 2008. [Google Scholar]
- Kyprianidis, K.G.; Quintero, R.F.C.; Pascovici, D.S.; Ogaji, S.O.T.; Pilidis, P.; Kalfas, A.I. EVA: A Tool for EnVironmental Assessment of Novel Propulsion Cycles. In Proceedings of the ASME Turbo Expo 2008: Power for Land, Sea, and Air, GT2008-50602, Berlin, Germany, 9–13 June 2008. [Google Scholar] [CrossRef]
- Kyprianidis, K. An Approach to Multi-Disciplinary Aero Engine Conceptual Design. In Proceedings of the International Symposium on Air Breathing Engines, ISABE-2017-22661, Manchester, UK, 3–8 September 2017; Available online: http://urn.kb.se/resolve?urn=urn%3Anbn%3Ase%3Amdh%3Adiva-43151 (accessed on 15 November 2021).
- Gunston, B. Jane´s Aero Engines; Janes Information Group: Coulsdon, UK, 2004; Issue 16; ISBN 9780710612056. [Google Scholar]
- Broyden, C.G. A class of methods for solving nonlinear simultaneous equations. Math. Comput. 1965, 19, 577–593. [Google Scholar] [CrossRef]
- Broyden, C.G. Quasi-Newton methods and their application to function minimisation. Math. Comput. 1967, 21, 368–381. [Google Scholar] [CrossRef]
- Eustace, R.; Leylek, Z.; Fakhry, J.; Anderson, M. F414 Engine Performance Condition Monitoring and Sensor Fault Detection Using Take-Off Data. In Proceedings of the International Symposium on Air Breathing Engines, ISABE-2019-24423, Canberra, Australia, 22–27 September 2019. [Google Scholar]
- Stenfelt, M.; Zaccaria, V.; Kyprianidis, K. Automatic gas turbine matching scheme adaptation for robust GPA diagnostics. In Proceedings of the ASME Turbo Expo 2019, Phoenix, AZ, USA, 17–21 June 2019. [Google Scholar] [CrossRef]
- Simon, D.L. Propulsion Diagnostic Method Evaluation Strategy (ProDIMES) User’s Guide, 2010. NASA/TM-2010-215840. Available online: https://purl.fdlp.gov/GPO/gpo14418 (accessed on 15 November 2021).
- Kurzke, J. GasTurb 13 User´s Manual. Des. Off-Des. Perform. Gas Turbines 2017. [Google Scholar]
- Lee, D.T.; Schachter, B.J. Two algorithms for constructing a Delaunay triangulation. Int. J. Parallel Program. 1980, 9, 219–242. [Google Scholar] [CrossRef]
- Military Specification Engines, Aircraft, Turbojet and Turbofan, General Specification for, Military Specifications and Standards, MIL-E-5007D. 1973. Available online: https://www.techstreet.com/standards/mil-mil-e-5007d?product_id=54288#jumps (accessed on 15 November 2021).
Publisher’s Note: MDPI stays neutral with regard to jurisdictional claims in published maps and institutional affiliations. |
© 2022 by the authors. Licensee MDPI, Basel, Switzerland. This article is an open access article distributed under the terms and conditions of the Creative Commons Attribution (CC BY) license (https://creativecommons.org/licenses/by/4.0/).