1. Introduction
Solving nonlinear equations , where is a real function defined in an open interval I, is a classical problem with many applications in several branches of science and engineering. In general, to calculate the roots of , we must appeal to iterative schemes, which can be classified in methods without or with memory. In this manuscript, we are going to work only with iterative methods without memory, that is algorithms that to calculate a new iteration only evaluate the nonlinear function (and its derivatives) on the previous one.
There exist many iterative methods of different orders of convergence, designed to estimate the roots of
(see for example [
1,
2] and the references therein). The efficiency index is a tool defined by Ostrowski in [
3] that allows classifying these algorithms in terms of their order of convergence
p and the number of function evaluations
d needed per iteration to reach it. It is defined as
; the higher the efficiency index of an iterative scheme, the better it is. Moreover, this concept is complemented with Kung–Traub’s conjecture [
4] that establishes an upper bound for the order of convergence to be reached with a specific number of functional evaluations,
. Those methods whose order reaches this bound are called optimal methods, being the most efficient ones among those with the same number of functional evaluations per iteration.
Newton’s method is a well-known technique for solving nonlinear equations,
starting with an initial guess
. This method fascinates many researchers because it is applicable to several kinds of equations such as nonlinear equations, systems of nonlinear algebraic equations, differential equations, integral equations, and even to random operator equations. However, as is well known, a major difficulty in the application of Newton’s method is the selection of initial guesses, which must be chosen sufficiently close to the true solution in order to guarantee the convergence. Finding a criterion for choosing these initial guesses is quite cumbersome, and therefore, more effective globally-convergent algorithms are still needed.
In this paper, we use the weight function technique (see, for example [
5,
6,
7]) to design a general class of second order iterative methods including Newton’s scheme and also other known and new schemes. These methods appear when specific weight functions (that may depend on one or more parameters) are selected. Therefore, we will choose among those methods with wider areas of converging initial estimations, able to converge when Newton’s method fails. In order to get this aim, we work with the associated complex dynamical system, finding their fixed and critical points, analyzing their asymptotic convergence, and those values that simplify the corresponding rational function. This procedure is widely used in this area of research, as can be found in [
8,
9,
10].
3. Complex Dynamics of the Family
In this section, a stability analysis of family
is made in the context of complex dynamics. First, we are going to recall some concepts of this theory. Further information can be found in [
12].
Let be a rational function, where denotes the Riemann sphere. The orbit of a point is defined as the set of its successive images by R, i.e., . When a point satisfies , it is called a fixed point. In particular, a fixed point , when where , is called a strange fixed point of R. If the point satisfies , but for , it is a T-periodic point.
The orbits of the fixed points are classified depending on the value of their corresponding fixed point multiplier,
. If
is a fixed point of
R, then it is attracting when
. In particular, it is a superattracting point if
. The point is called repelling when
and neutral in the case
. When the operator has an attracting point
, we define its basin of attraction,
, as the set:
A point is called a critical point when , being a free critical point when , where satisfies .
In this paper, we use two graphical tools to visualize the dynamical behavior of the fixed points in the complex plane: the dynamical and the parameter planes. We can find reference texts around these dynamic tools in works such as [
9,
13].
Dynamical planes represent the basins of attraction associated with the fixed points of the rational operator corresponding to an iterative method. For its implementation, the complex plane is divided into a mesh of values where the X-axis represents the real part of a point and the Y-axis its imaginary part. Then, each pair of points of the mesh corresponds to a complex number that is taken as the initial estimation to iterate the method. The initial guess is depicted in a color depending on where its orbit has converged. In this way, the basins of attraction of the fixed or periodic points are observed, and we can determine if the method has wide regions of convergence.
Parameter planes are used to study the dynamics of a family of iterative methods with at least one parameter. In this case, the complex plane is divided into a mesh of complex values for the parameter, the X-axis and the Y-axis being the real and imaginary parts of the parameter, respectively. Each point of the plane corresponds to a value of the parameter and, therefore, to a method belonging to the family. For each value of the parameter, the corresponding method is applied successively starting as the initial estimation with a free critical point of the operator, so there are as many parameter planes as independent (under conjugation) free critical points of the operator. The points in the plane are plotted with a non-black color when there is convergence to any of the attracting fixed points, remaining in black in other cases. This representation allows choosing the values of the parameter that give rise to the most stable methods of the family.
Next, the iterative family is applied on nonlinear quadratic polynomials in order to check its dependence on the initial estimations.
Taking into account that the method under study does not satisfy the scaling theorem, the quadratic polynomials under study will be , , and . When family is applied on these polynomials, three rational functions are obtained. Then, we analyze the asymptotic behavior of their fixed and critical points, and we represent the corresponding dynamical and parameter planes. Therefore, some conclusions are reached that can be extended to any quadratic polynomial and, up to some extent, to any nonlinear function.
By applying the family
on the quadratic polynomials under consideration, the resulting rational functions are:
for
,
, and
, respectively. The following result analyzes the number and also the asymptotical performance of the fixed points of operators (
6).
Lemma 1. The fixed points of the rational operators,, and(6) agree with the roots of their associated polynomials, being superattracting forand. For operator, the fixed point is attracting. In addition,is a strange fixed point of all three operators, being in all cases neutral. Proof. For the rational operator
, we must solve
, that is,
or equivalently,
The solution of (
7) is obtained from the numerator by solving
. The only solutions are
and
, the roots of
. The proof for the rational operator
is completely analogous, so we obtain that the fixed points of
are the roots of the polynomial
, denoted by
and
.
To check that
is a fixed point of any rational operator
,
, we define the operator
. Then,
∞ is a fixed point of
when the point
is a fixed point of
. For operators
and
, we have, respectively,
From this, it is straightforward that , so infinity is a strange fixed point of all of them.
In the case of polynomial
, the fixed points are the solution of:
so the fixed point of
is
, and it is denoted by
.
Regarding the operator associated with infinity, we have for
:
and also, infinity is a strange fixed point of
, as
.
In order to analyze the stability of the fixed points, the derivatives of (
6) are required:
It is easy to prove from the term
in (
8) that
and
, for
, are superattracting points of the corresponding operators. It is also immediate from (
9) to prove that
is attracting, as
.
The stability of infinity is studied throughout the value of the corresponding derivatives of
for each operator:
in
. For the three considered cases, we have
and
, so infinity is a neutral point. □
The critical points of the rational operators that are calculated by solving are presented in the following result.
Lemma 2. Critical points of operators,, and(see (6)) satisfy:
- (a)
For, the fixed pointsandare critical points. In addition, if,, operatorhas two free critical points:and. When, the operator does not have free critical points.
- (b)
If,, the critical points of operatorare the roots of the polynomial,and, and the free critical pointsand. When, the only critical points are the roots of.
- (c)
If, operatorhas two free critical points:and. In this case, the root ofis not a critical point of.
Let us remark that case corresponds to Newton’s method, whose associated complex dynamics are well known. The proof of Lemma 2 uses the same procedures as in Lemma 1, so we do not extend on it.
As the family depends on parameter , it is useful to draw the parameter planes associated with each critical point given in the previous result. This tool will allow us to choose values of and compare the resulting dynamical planes.
In this paper, all the planes are plotted using the software MATLAB R2018b. For the parameter plane, is taken over a mesh of values in the complex plane in . Taking a critical point as initial estimation, the method is iterated until it reaches the maximum of 50 iterations or until there is convergence to any of the fixed points. The convergence is set when the difference between the iterate and one of the attracting fixed point is lower than . When there is convergence to any of them, the initial point is represented in the color red in the plane. In other cases, it is represented in black. In addition, the intensity in the color red means that more iterations are required to reach the convergence (the brighter the color, lower is the number of iterations needed).
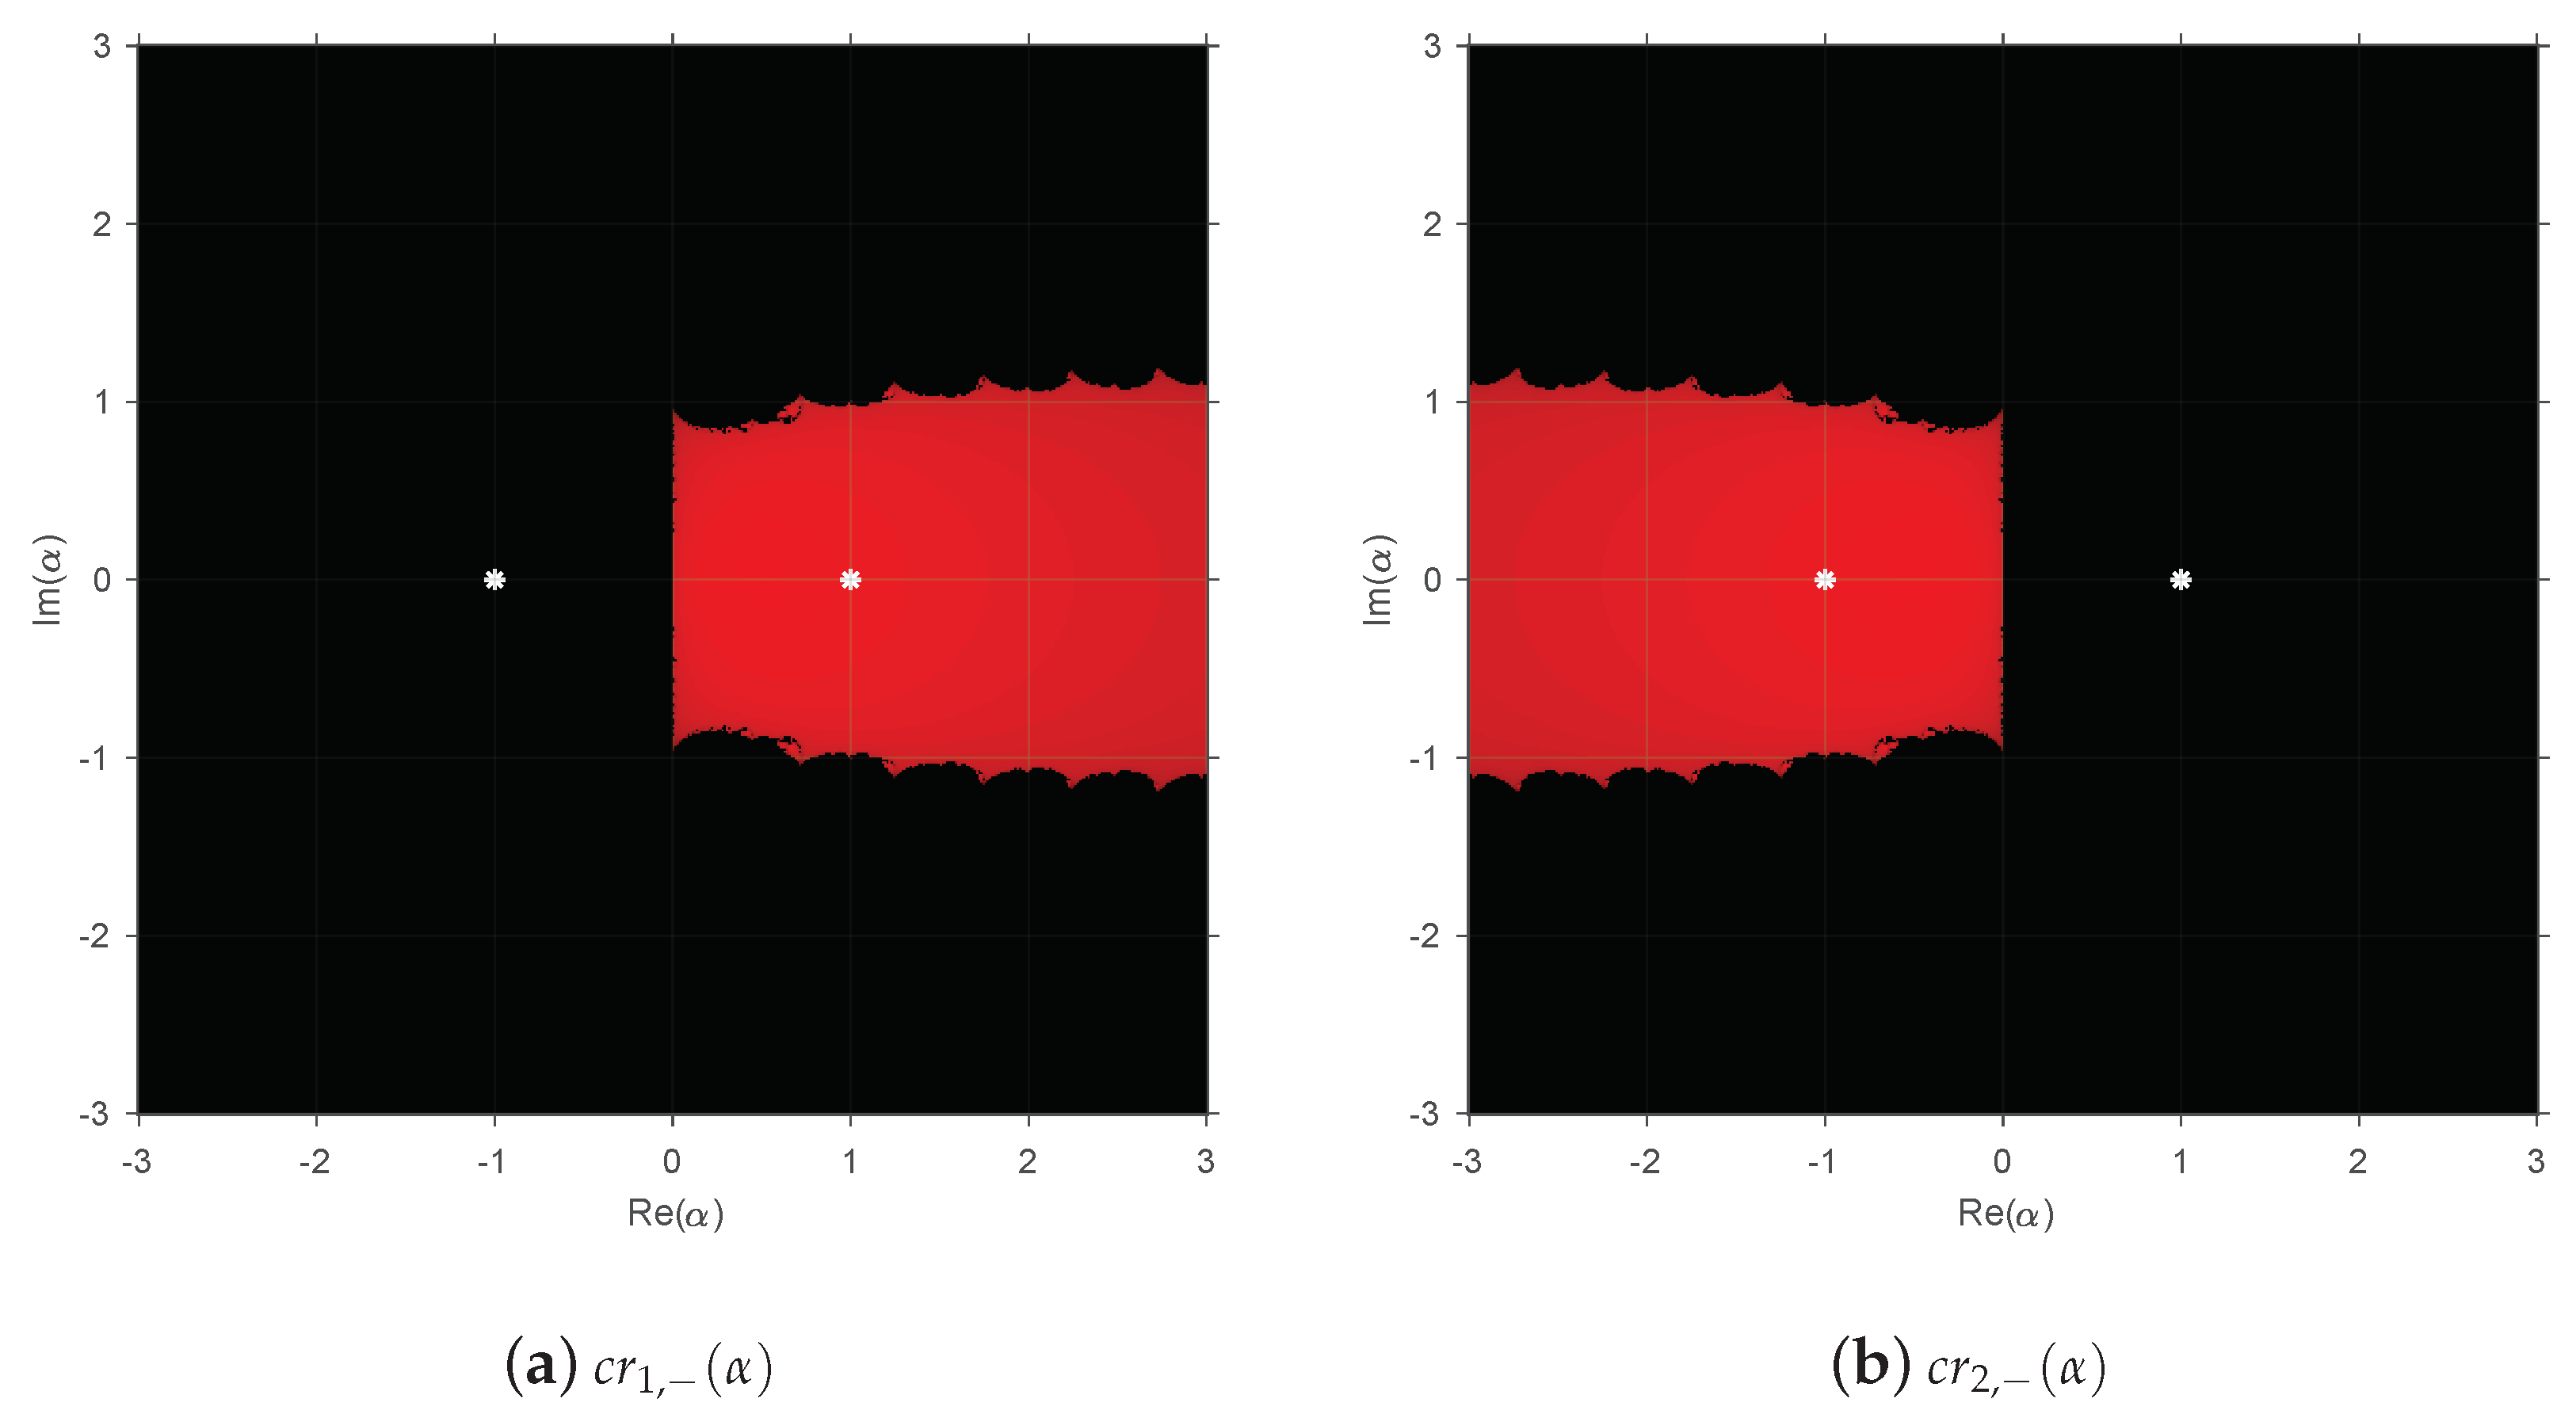
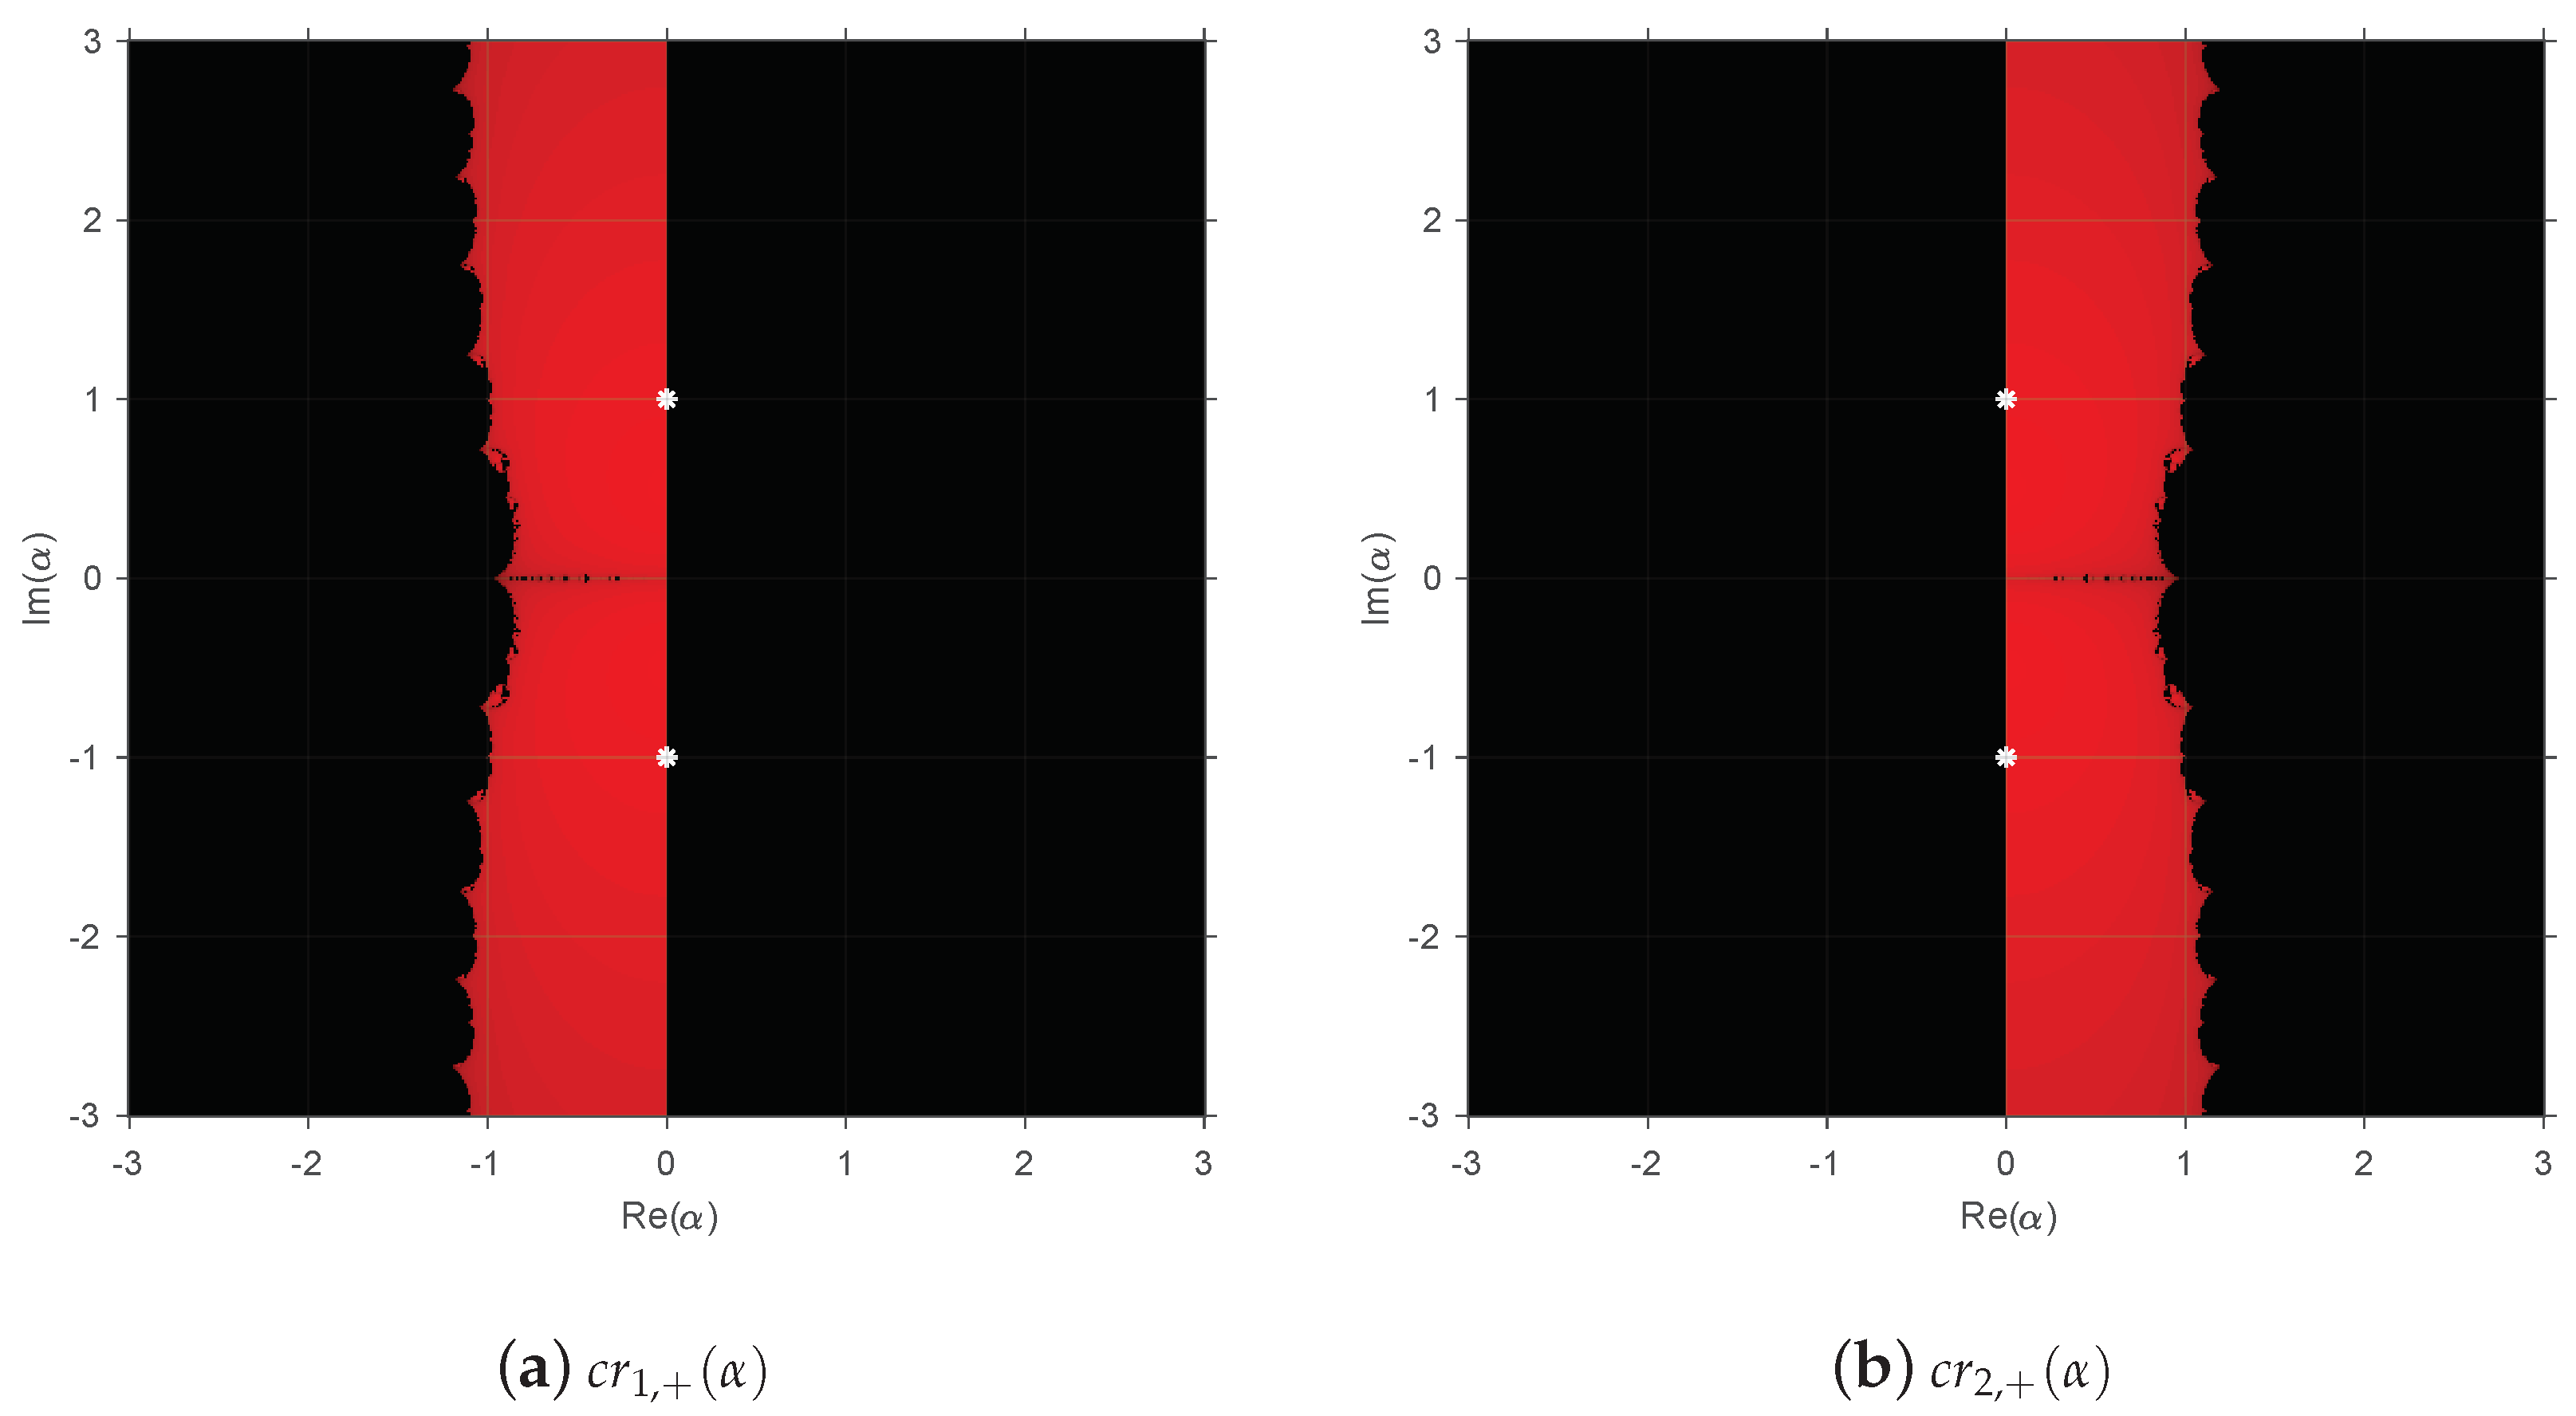
Figure 1,
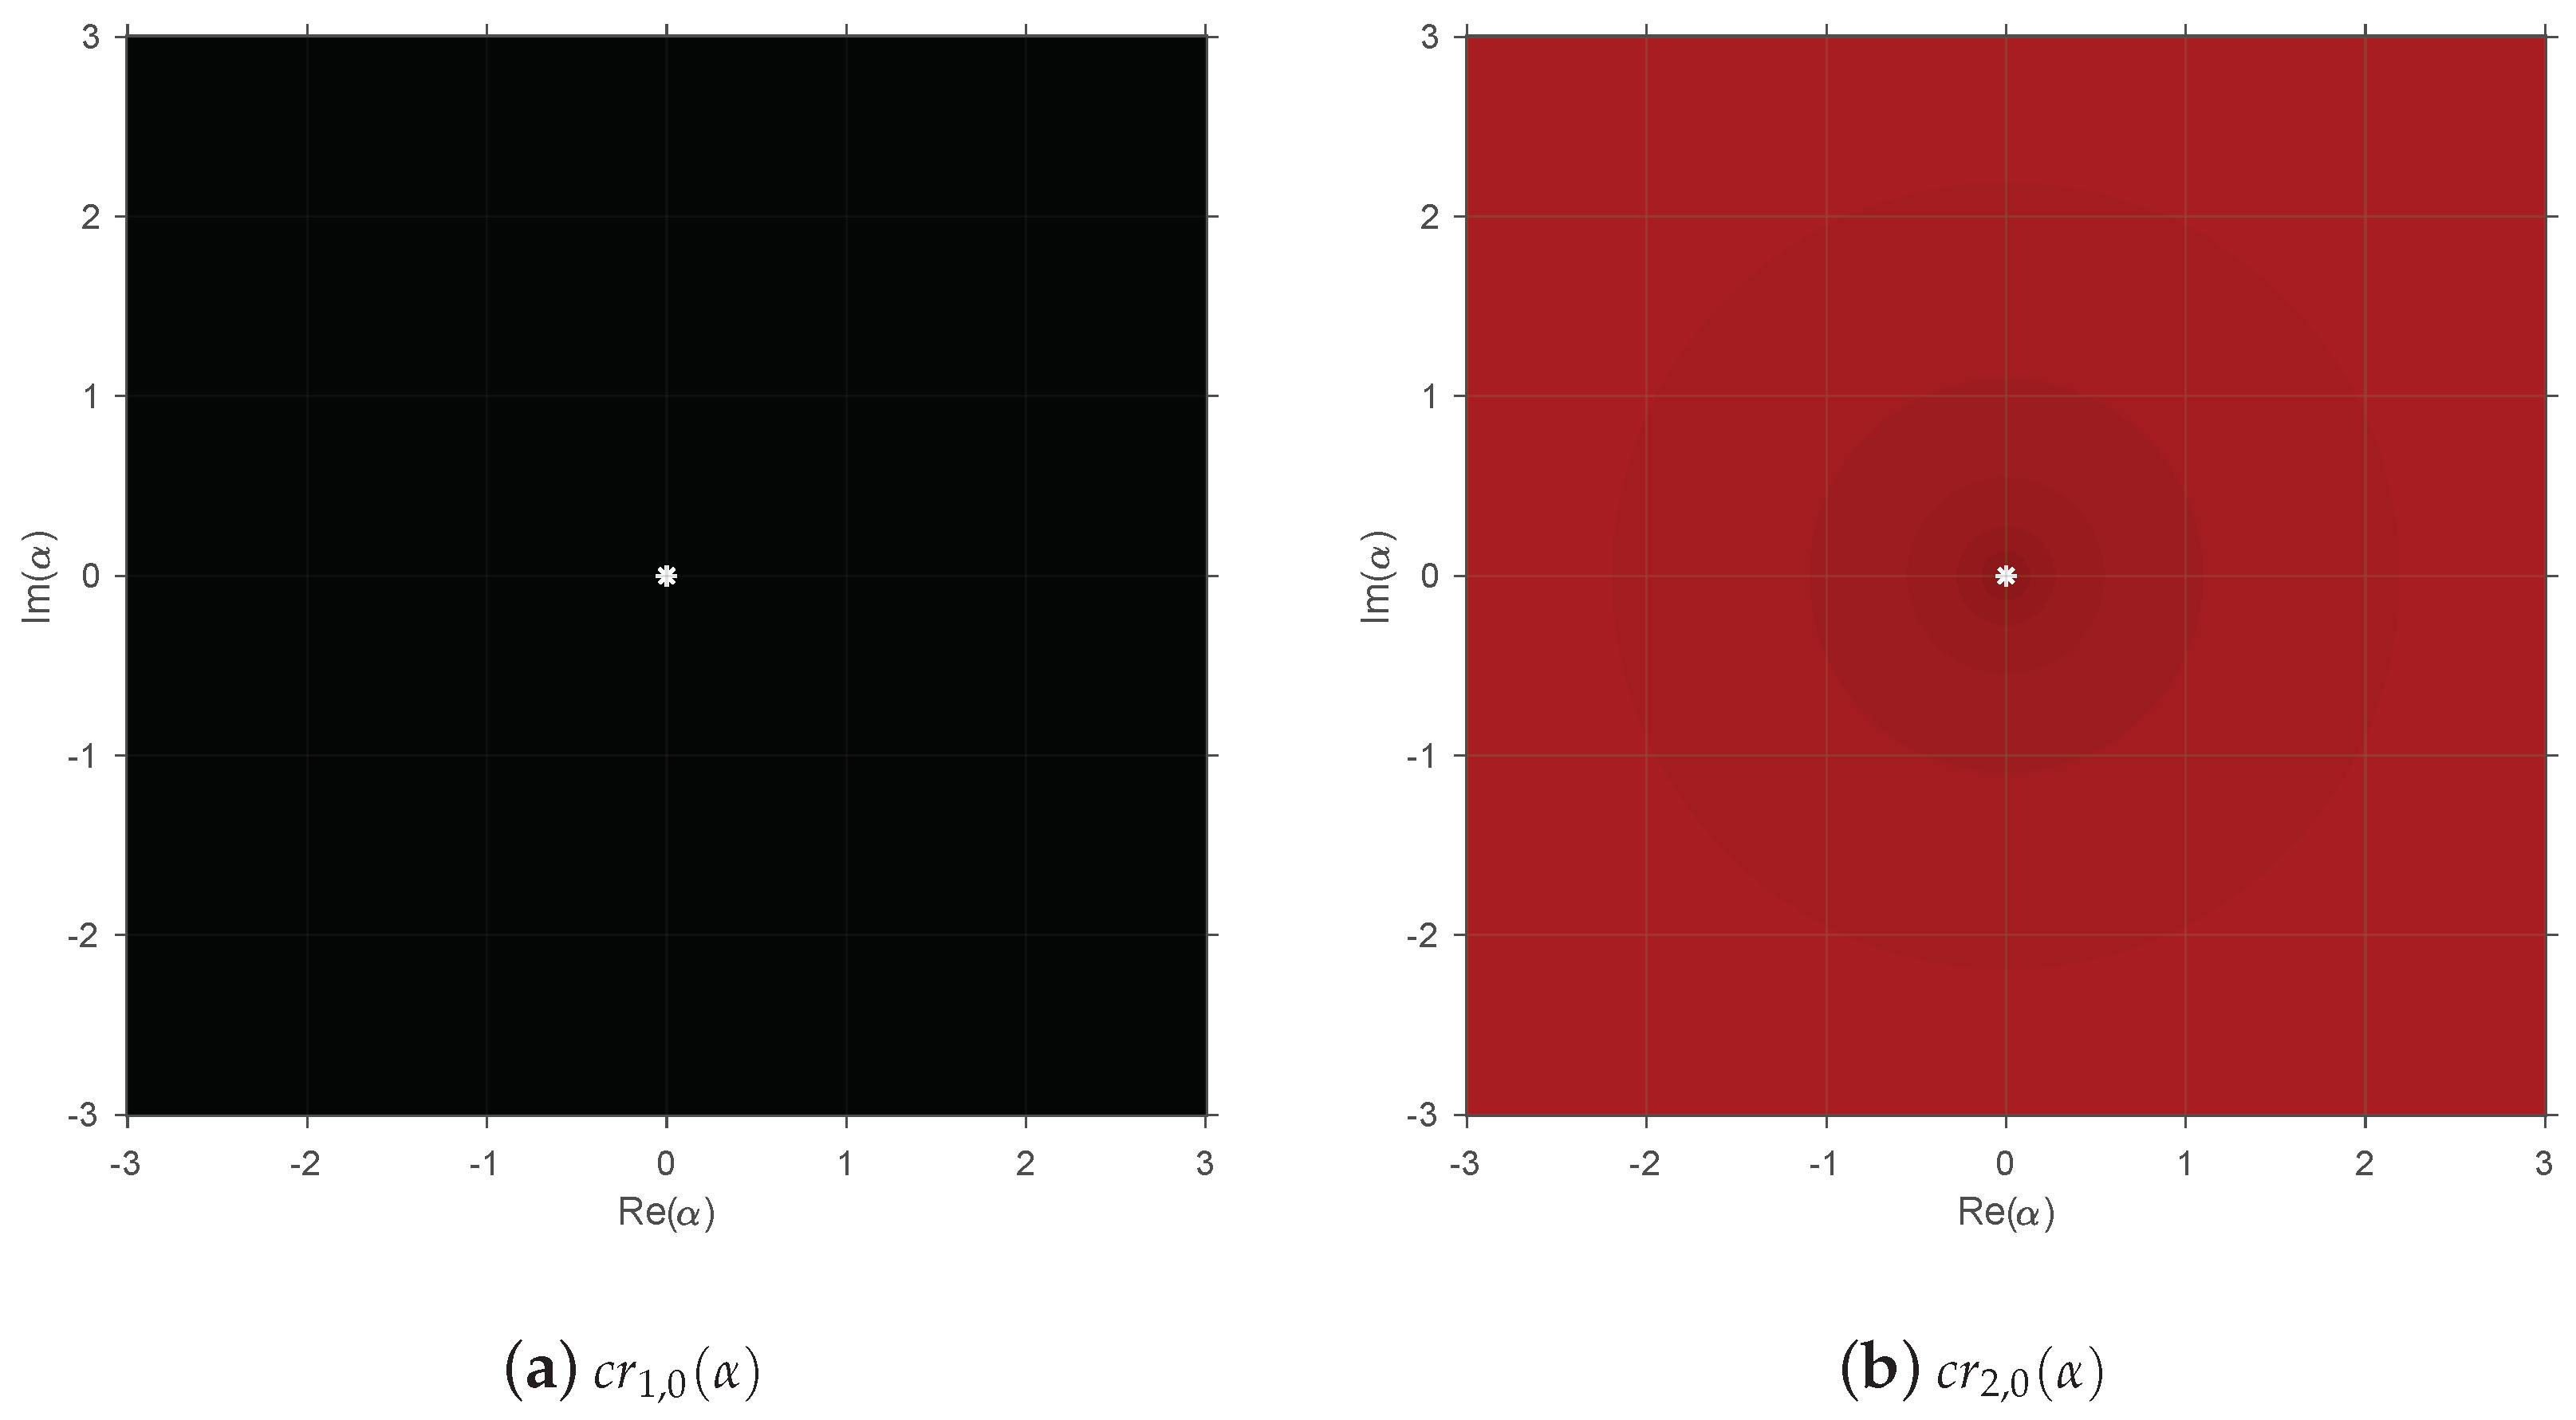
Figure 2 and
Figure 3 show the parameter planes of the considered operators for their associated free critical points. Each parameter plane depicts the values of
in the complex plane that give rise to methods for which there is convergence to the attracting fixed points, represented as white stars.
In
Figure 1a, it is observed that only values of
with a positive real part are depicted in red.
Figure 1b is symmetric with respect to the imaginary line. The rest of the complex plane is black, so we must avoid these values of
in order to select the most stable methods of the family.
For the rational operator
,
Figure 2 shows a very similar behavior to
Figure 1, but now, the values of
that provide more stable methods are located around the complex line in the plane, showing a vertical band to the left part of the origin in
Figure 2a and another one to the right part of the origin in
Figure 2b.
In
Figure 3 is observed a completely different dynamical behavior, as the critical point
provides a black parameter plane, and for the point
, the parameter plane is all depicted in red; that is, one free critical point belongs to the basin of attraction of the root
for any value of
, and the other one appears in a different basin of attraction with the independence of
.
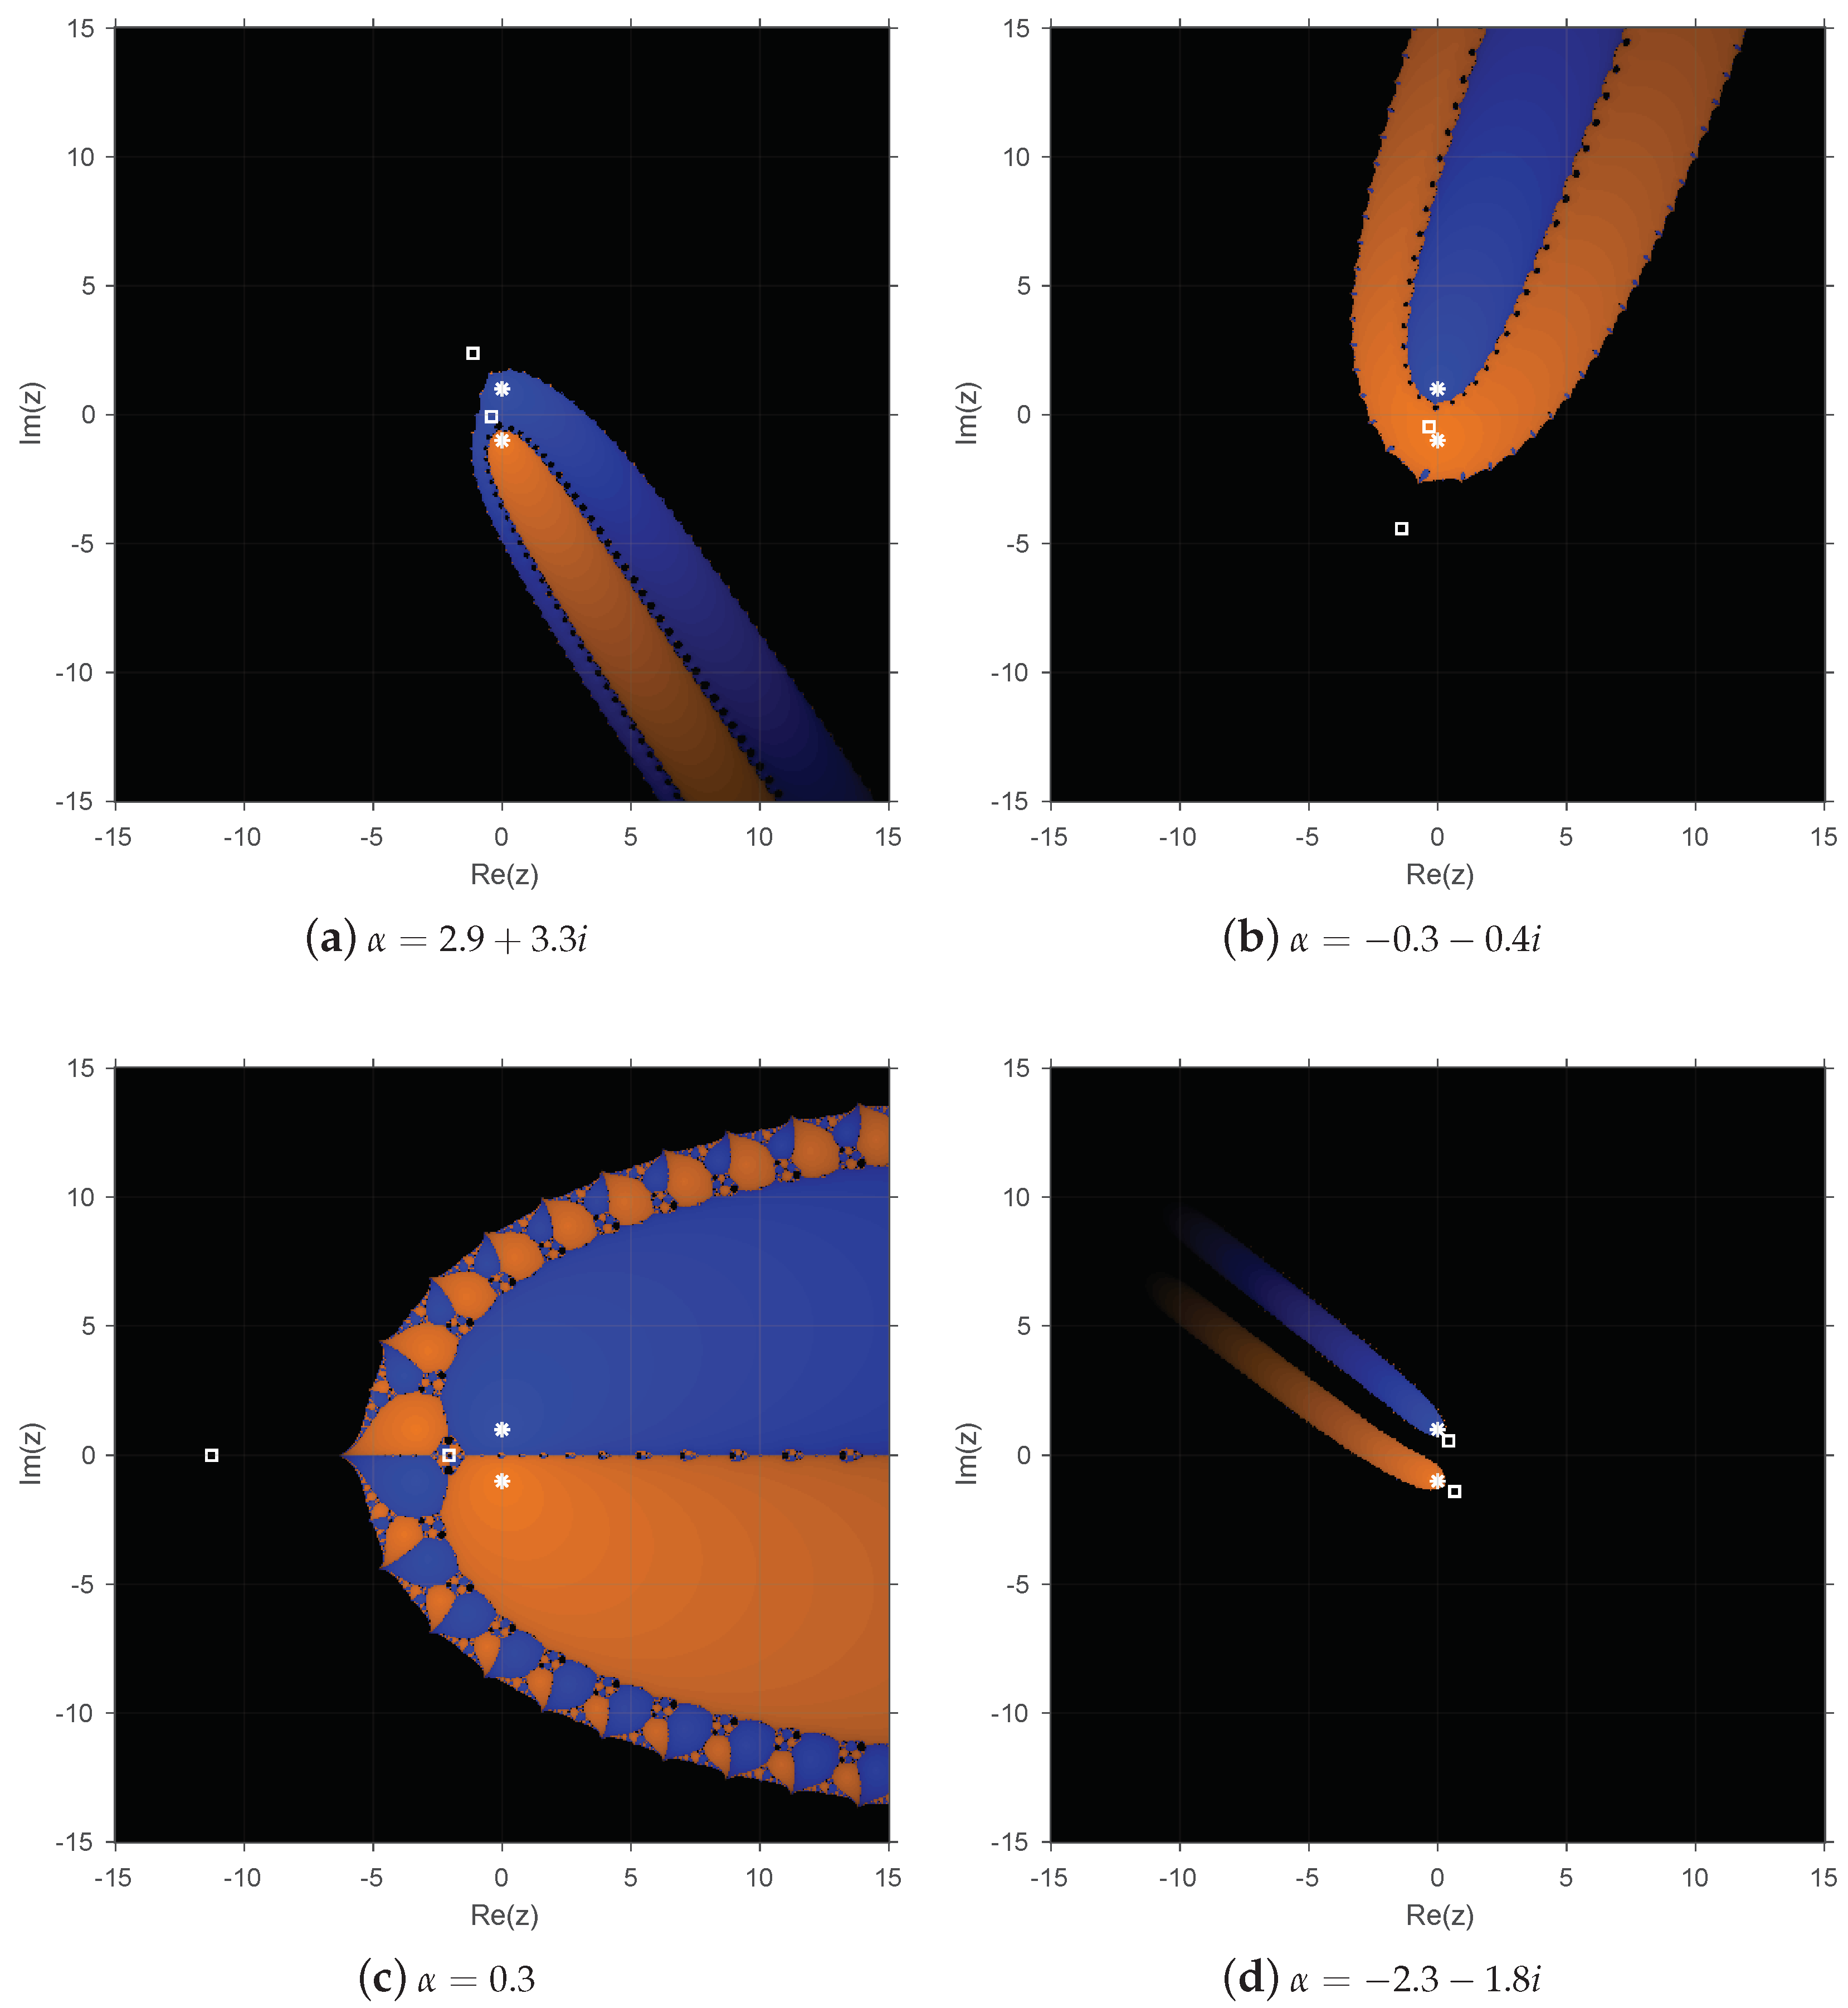
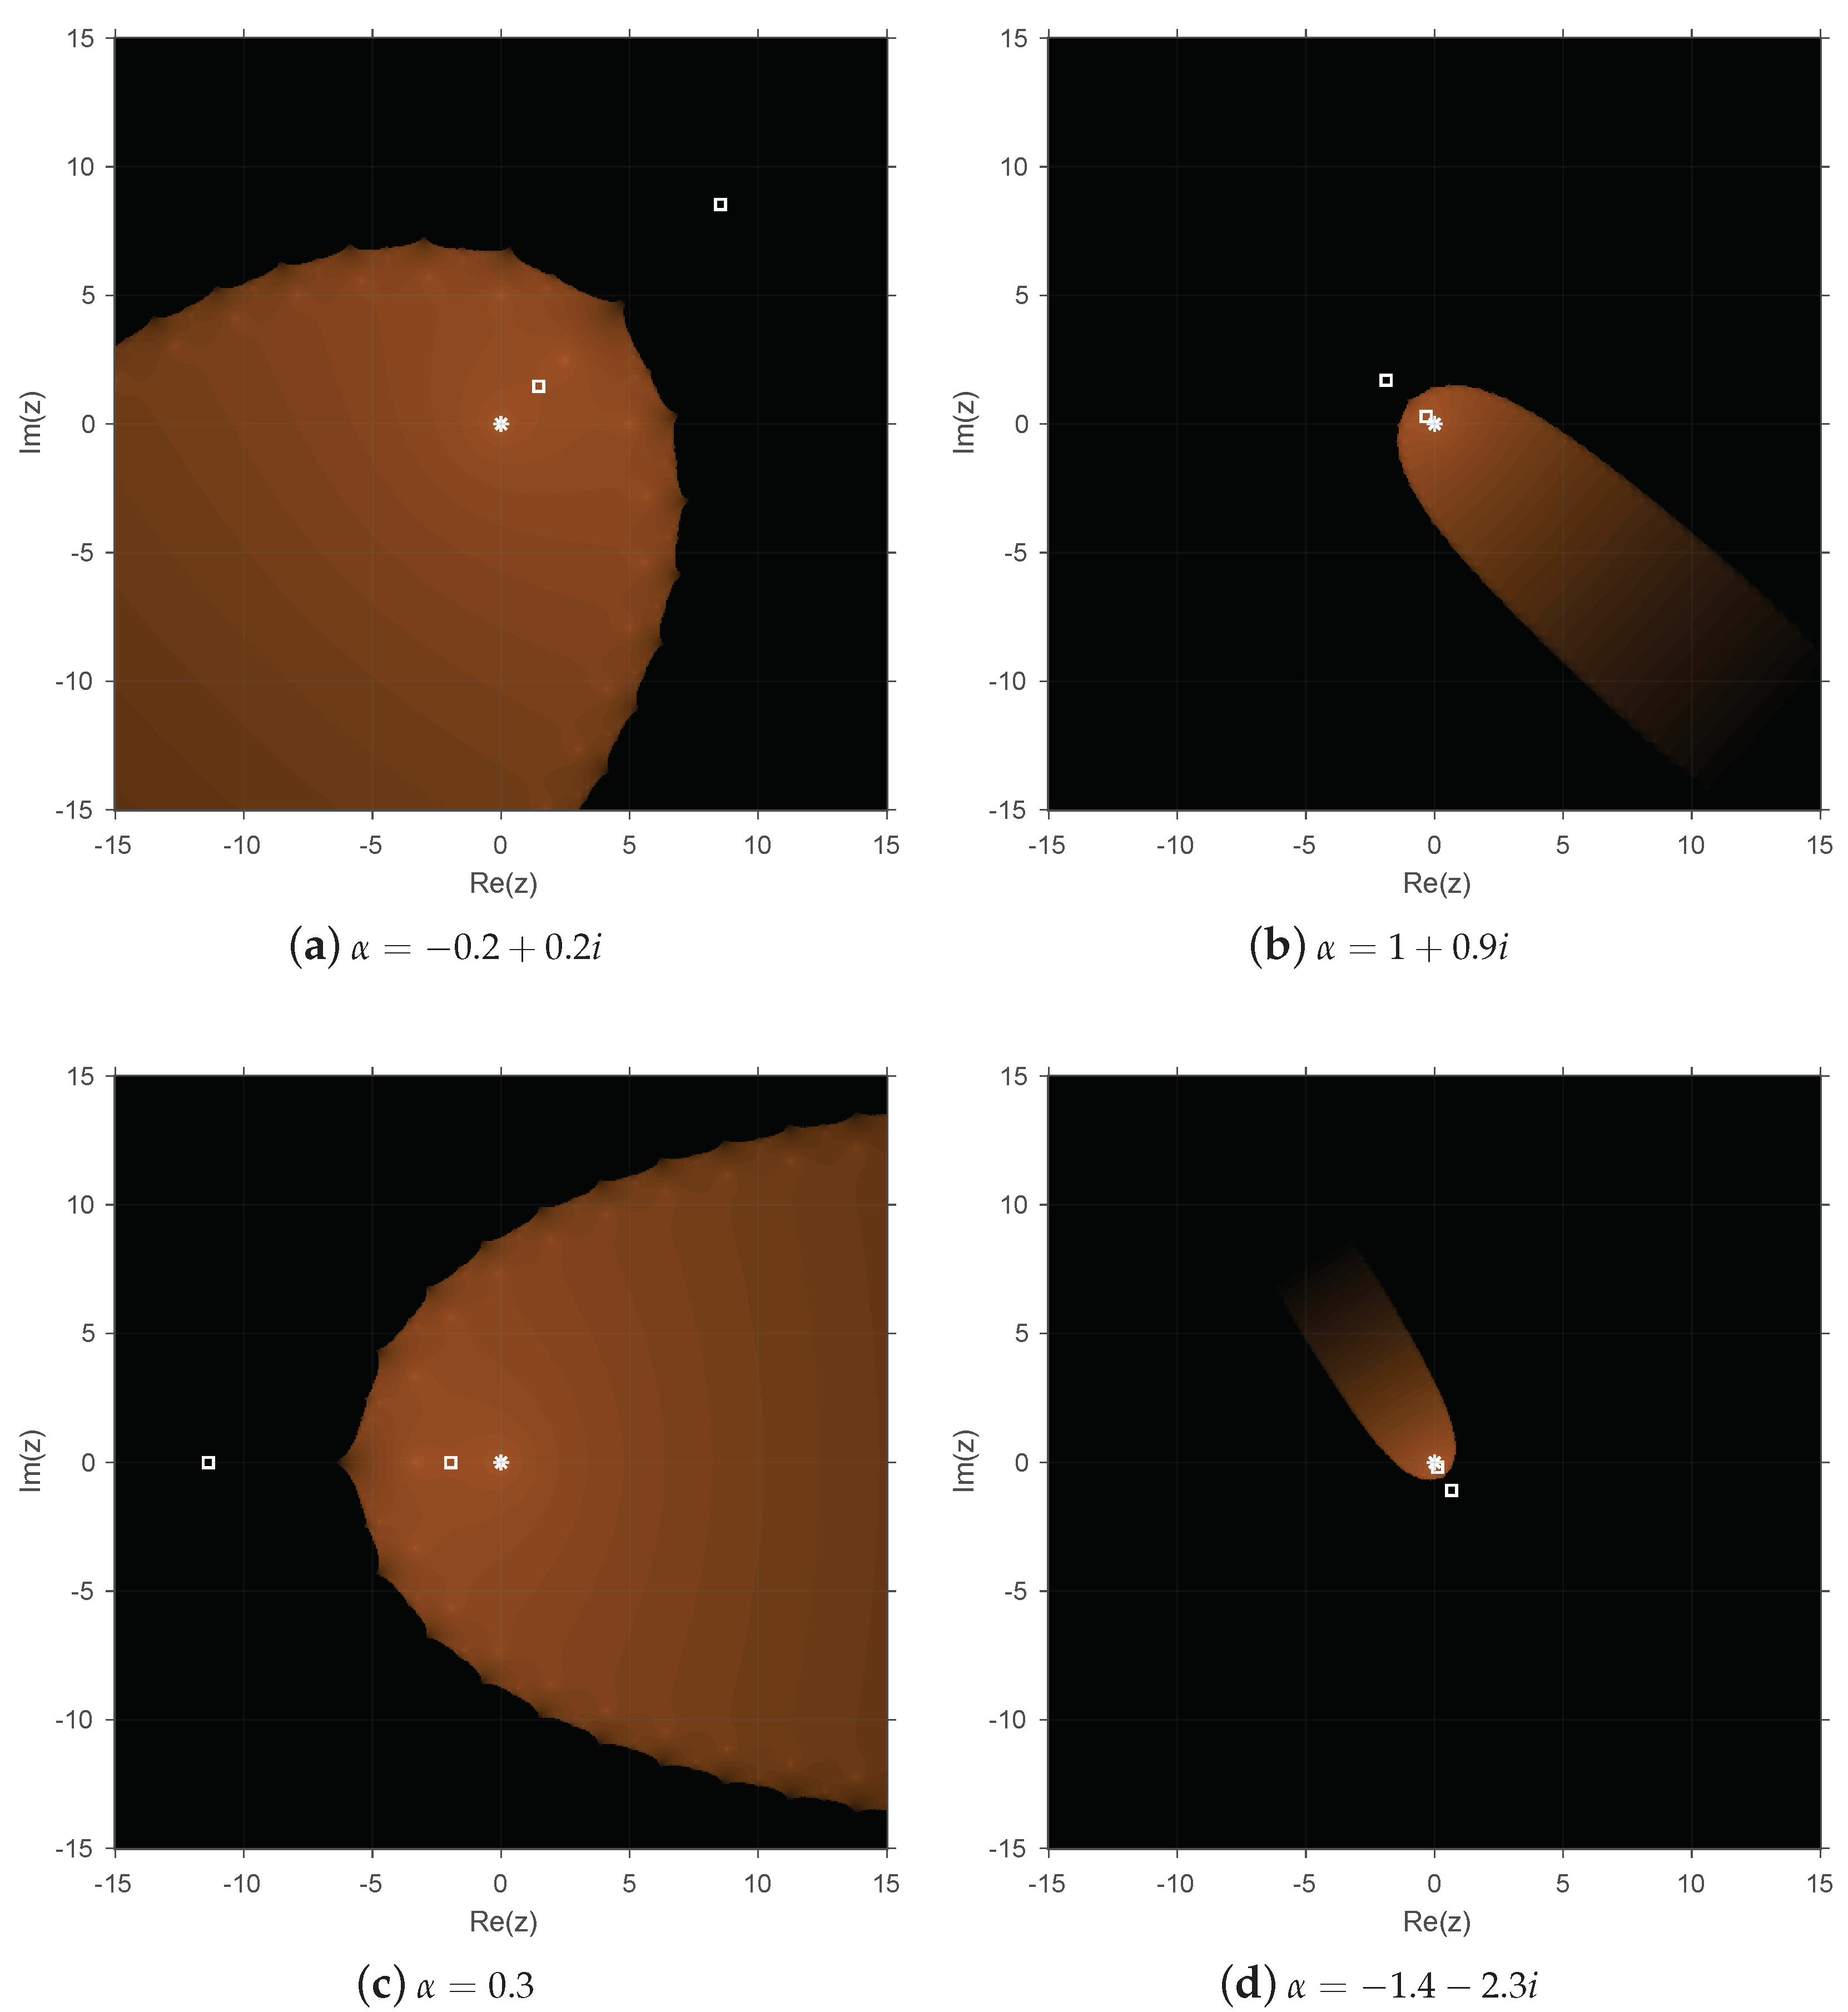
Below, some dynamical planes are shown that confirm the previous results for the three operators, as the different values of to generate them have been chosen from the obtained results in the corresponding parameter planes.
The implementation in MATLAB of the dynamical planes is similar to that of the parameter planes (see [
9]). To perform them, the real and imaginary parts of the initial estimations are represented on the two axes over a mesh of
points in
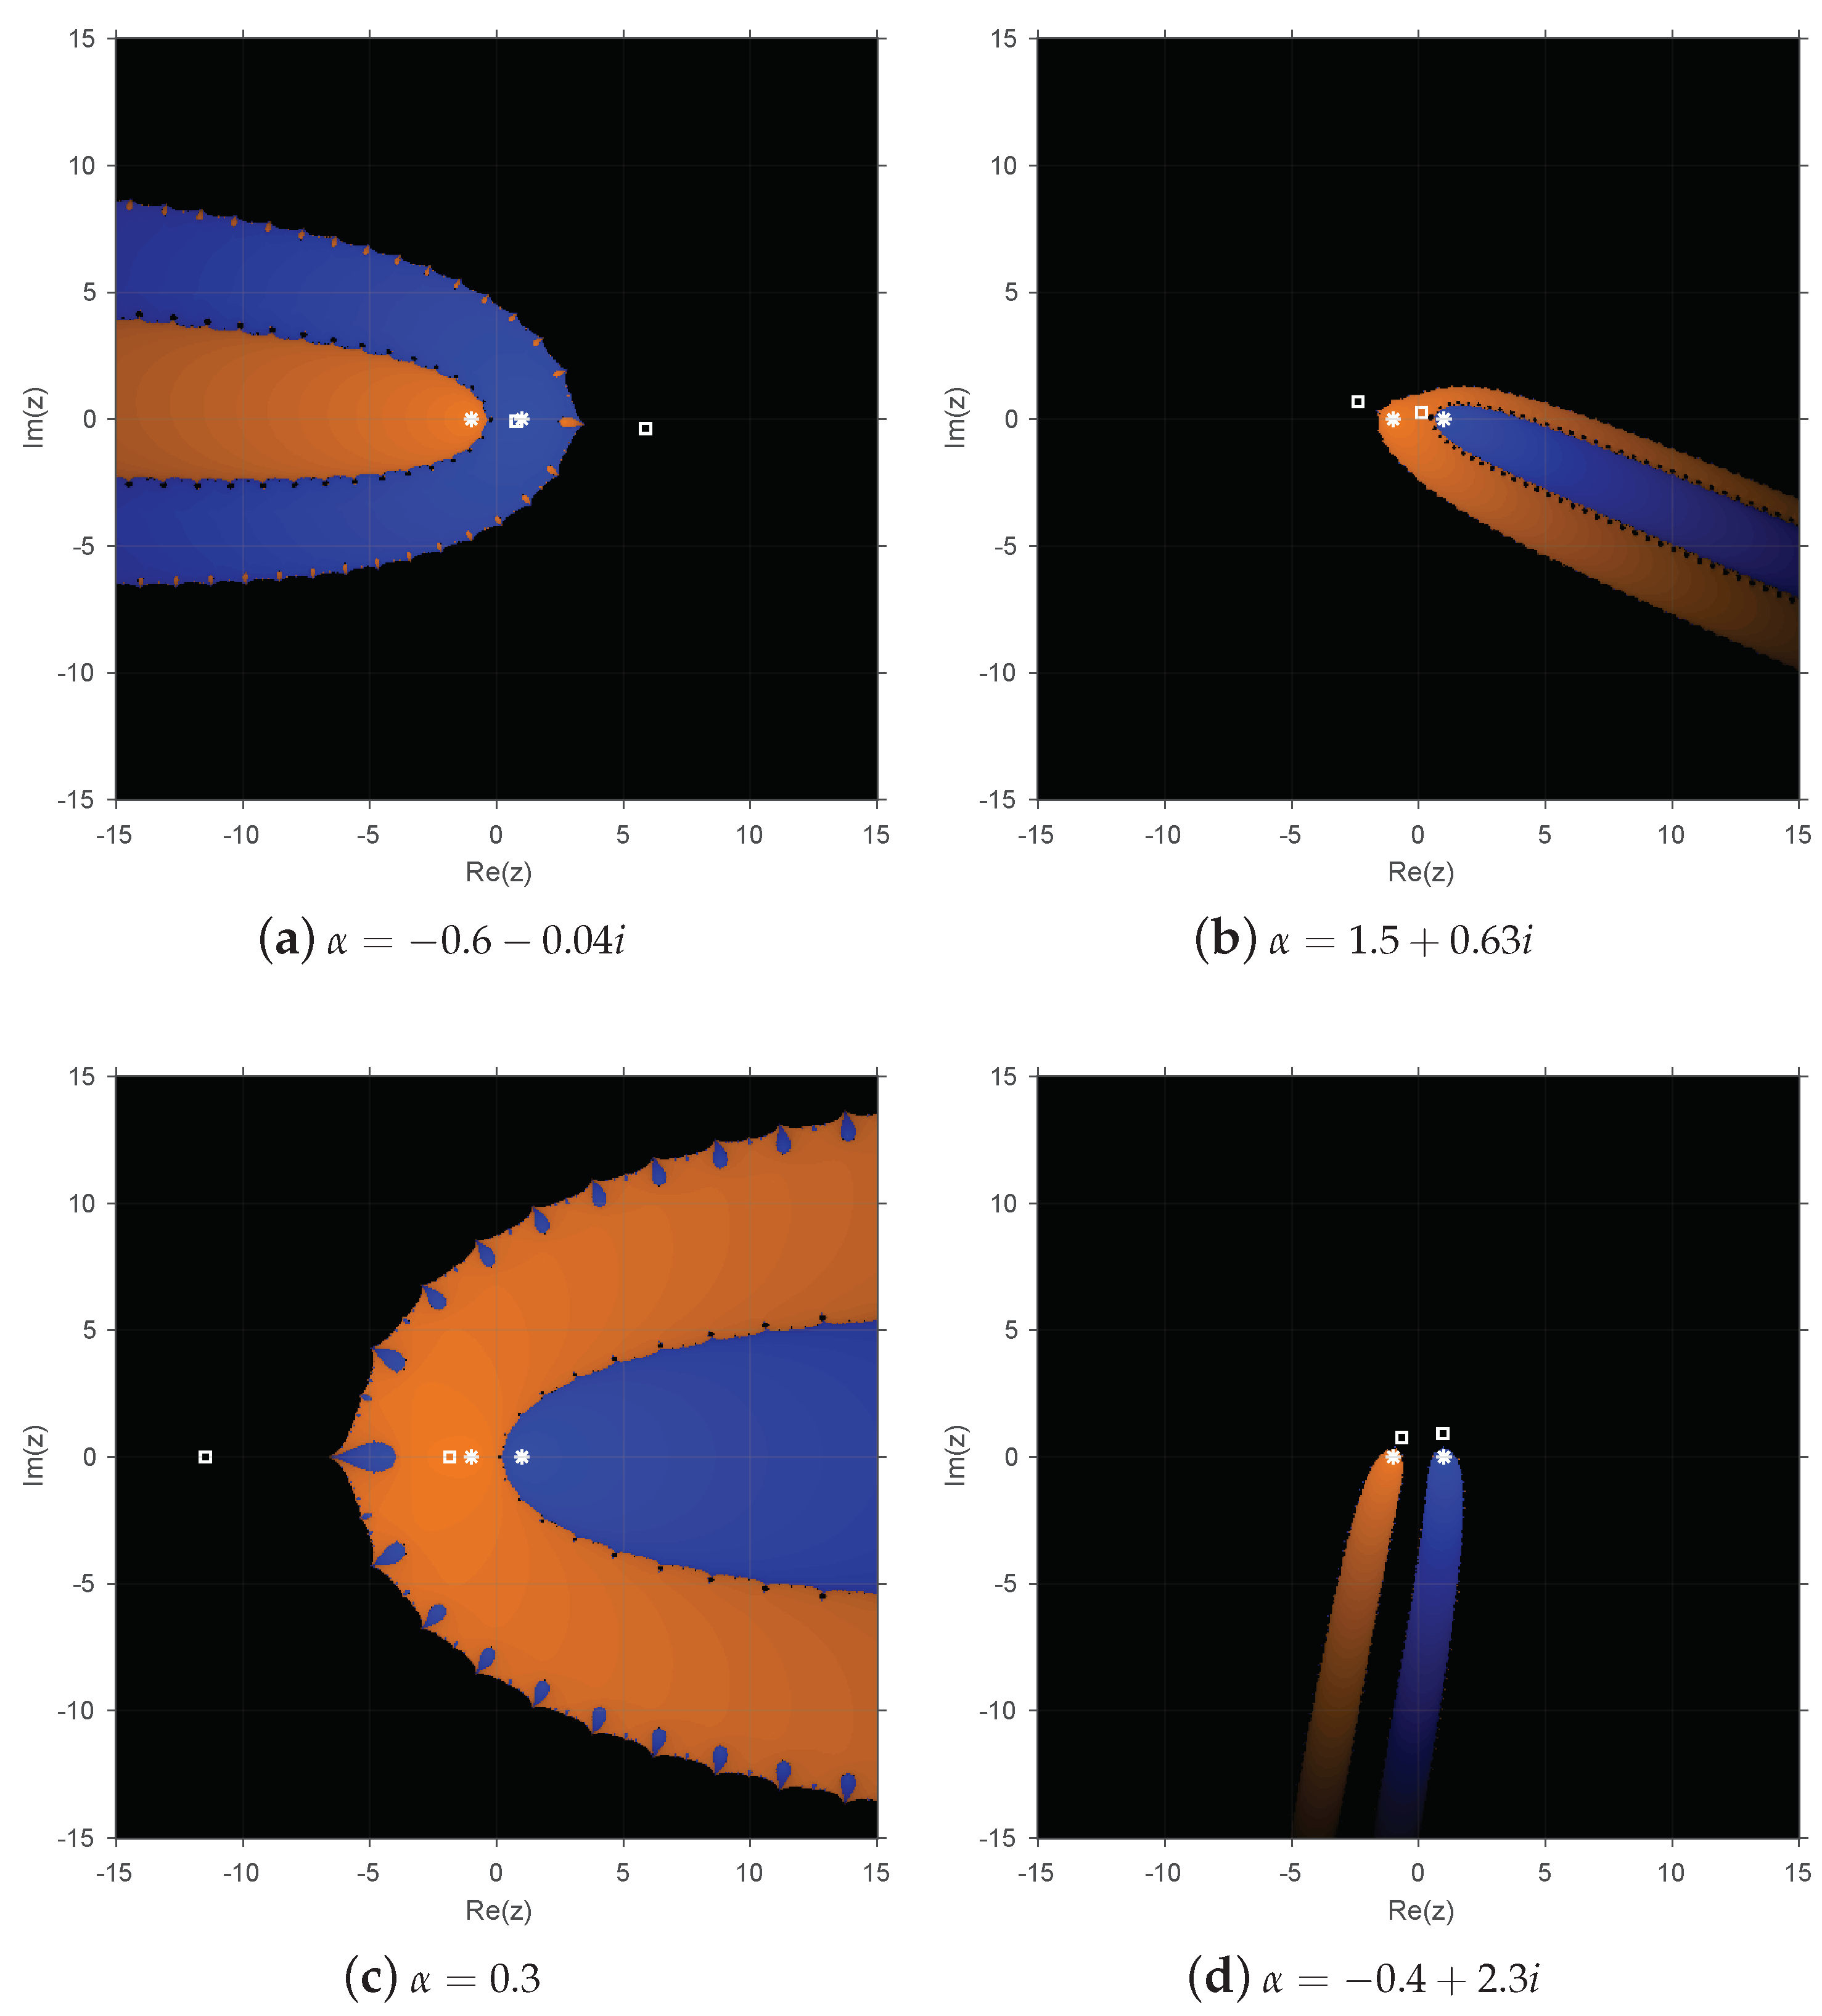
in the complex plane. The convergence criteria are the same as in the parameters plane, but now, different colors are used to indicate to which fixed point the method converges. Orange color represents the convergence to
,
, and
for the associated operator, and blue represents the convergence to
and
. The attracting fixed points are depicted in the dynamical planes with white stars, while the free critical points are depicted with white squares.
Figure 4,
Figure 5 and
Figure 6 show the dynamical planes corresponding to operators
,
, and
, respectively, by varying the value of
. In all cases, the parameter has been chosen in order to show different performances from
Figure 1,
Figure 2 and
Figure 3. On the one hand, in
Figure 4a,b and
Figure 5a,b, the parameter is taken from the red regions shown in
Figure 1 and
Figure 2 and quite close to the attracting fixed points. On the other hand,
Figure 4d and
Figure 5d correspond to values of the parameter located in the black region of the parameter planes. As was expected, when
is taken from a red region of the parameter plane, the corresponding basins of attraction in the dynamical plane are bigger than in other cases (
Figure 4d and
Figure 5d). However, there is a wide black region in all the dynamical planes that corresponds to the basin of attraction of infinity, which generates its own basin of attraction. Furthermore, in the most dynamical planes, a free critical point belongs to the basin of attraction of infinity, the others remaining in the basin of attraction of a root of the corresponding polynomial. Moreover, in
Figure 4d and
Figure 5d, those with more black color, the two free critical points belong to the basin of attraction of infinity. From
Figure 6, we can observe that the basin of attraction of
is bigger when
is close to
, one free critical point being inside this basin of attraction. As in the other operators, infinity behaves as the attracting point with a free critical point laying in its basin of attraction.
The conclusions observed in the parameter planes can be checked in
Figure 4c and
Figure 6c, where the value
, which is close to the origin of the complex plane, gives rise to the broadest basins of attraction. For this reason, to perform the numerical experiments in the next section, we selected this value of
, which shows the stability of our proposed method.
4. Numerical Results
In this section, numerical experiments are performed in order to check the efficiency of the family to calculate the solution of several nonlinear functions. This section also allows verifying that the stability analysis of the previous section is correct, and in fact, it is possible to obtain values of that provide methods of the family that guarantee more stability in the root finding process. For this purpose, let us consider the following nonlinear test functions:
; ,
; ,
; ,
; ,
; ,
; ,
where is the exact solution.
The weighted iterative family (
1) includes many iterative schemes, due the generality and simplicity of its structure. In
Section 2, we have seen that Newton’s method and the
family can be obtained with weight functions
and
, respectively, from the family (
1). Moreover, some well-known methods were obtained from different selections of the weight function. By choosing:
the resulting class is the iterative family presented by Kou and Li in [
14], which has order of convergence two for any value of parameters
and
. According to the results presented by the authors in [
14], for the numerical performance, the method obtained when
and
was used, denoting the resulting one by KL. On the other hand, the weight function:
gives rise to an iterative family presented by Noor et al. [
15], which converges quadratically for all
. Let us denote by Noor1 the associated method for
.
In this section, a numerical comparison between the Newton, KL, and Noor1 methods with our proposed family
is carried out in order to show the performance of different methods with similar structures and the same order of convergence. Taking into account the dynamical results in
Section 3, the values for the parameter
that provide the methods of
with more stability are those that are close to the complex origin. For this reason, the numerical results were done with
, denoting the resulting method by
.
Table 1 and
Table 2 show the results obtained for the considered nonlinear test functions
and different initial estimations. The numerical tests have been performed using the software MATLAB R2018b with variable precision arithmetics with 50 digits of mantissa. These tables show the number of iterations that each method needs to reach the convergence, which was set when
or
. After a maximum number of 200 iterations, the method did not reach the solution of the equation. Moreover, a computational approximation of the order of convergence of the methods was given by the ACOC [
16] calculated as the following quotient:
As we can observe in the results provided by
Table 1 and
Table 2, Newton’s method did not always converge for the nonlinear test functions considered, especially when the initial estimation was far from the solution. A similar behavior can be observed in the methods KL and Noor1 for some of the proposed examples. In addition, all three known methods often required a higher number of iterations. This fact shows the efficiency of
, as the method was always convergent to the root of the functions, and it needed fewer iterations.
