Article

Two-Dimensional Time Fractional River-Pollution Model and Its Remediation by Unsteady Aeration

by
Priti V. Tandel
1,†,
Manan A. Maisuria
1,† and
Trushitkumar Patel
2,*
1
Department of Mathematics, Veer Narmad South Gujarat University, Surat 395007, Gujarat, India
2
Department of General Studies, University of the People, Pasadena, CA 91101, USA
*
Author to whom correspondence should be addressed.
These authors contributed equally to this work.
Axioms 2024, 13(9), 654; https://doi.org/10.3390/axioms13090654
Submission received: 10 August 2024 / Revised: 15 September 2024 / Accepted: 19 September 2024 / Published: 23 September 2024
(This article belongs to the Special Issue Fractional Calculus and the Applied Analysis)

Abstract

:
This study contains a mathematical model for river pollution and its remediation for an unsteady state and investigates the effect of aeration on the degradation of pollutants. The governing equation is a pair of nonlinear time-fractional two-dimensional advection-diffusion equations for pollutant and dissolved oxygen (DO) concentration. The coupling of these equations arises due to the chemical interactions between oxygen and pollutants, forming harmless chemicals. The Fractional Reduced Differential Transform Method (FRDTM) is applied to provide approximate solutions for the given model. Also, the convergence of solutions is checked for efficacy and accuracy. The effect of longitudinal and transverse diffusion coefficients of pollutant and DO on the concentration of pollutant and DO is analyzed numerically and graphically. Also, we checked the effect of change in the river’s longitudinal and transverse seepage velocity on pollutant and DO concentration numerically and graphically. We analyzed the comparison of change in the value of half-saturated oxygen demand concentration for pollutant decay on pollutant and DO concentration numerically and graphically. Also, numerical and graphical analysis examined the effect of fractional parameters on pollution levels.

1. Introduction

Several factors must be considered when evaluating river water quality, including the concentration of dissolved oxygen, the presence of nitrates, chlorides, and phosphates, the amount of suspended solids, the occurrence of environmental hormones, the chemical oxygen demand, heavy metals, and the presence of bacteria. Pollutants originating from agricultural activities can be considered a substantial factor in the degradation of surface and groundwater quality. The advection-dispersion equations are relevant in several fields, such as water pollution, groundwater hydrology, chemical engineering, biosciences, environmental sciences, and petroleum engineering [1]. Huang et al. built a mathematical model to study the movement of solutes in porous materials with varying properties, considering the effect of scale-dependent dispersion. They hypothesized that the dispersion coefficient is directly proportional to the velocity of the pore water, having a linear relationship [2]. Pimpunchat et al. developed a fundamental mathematical model to study river pollution and examined the effects of aeration on reducing pollutants [3].
Hussain et al. examined a mathematical model that enables estimating river-pollutant concentration levels for the steady-state in a one-dimensional region without dispersion. The concentrations of pollutants and DO are determined by a set of coupled equations that include the processes of reaction, diffusion, and advection [4]. Ibrahim et al. analyzed a study on river-pollution cleanup. They examined the use of unstable aeration with arbitrary initial and boundary conditions [5]. On a finite domain, Liu et al. solved a space-time fractional advection-dispersion equation using an implicit difference method (IDM) and an explicit difference method (EDM). They also verified the convergence and stability of the methods [6]. Attia et al. used a numerical approach to find an approximate solution of the time-fractional advection–diffusion equation (FADE) under the Atangana–Baleanu derivative in Caputo sense (ABC) with Mittag–Leffler kernel by using reproducing kernel Hilbert space method (RKHSM) [7].
Mardani et al. used a very effective and precise meshless technique to solve the time fractional advection-diffusion equation with variable coefficients. This approach is based on the moving least square (MLS) approximation [8]. Maisuria et al. [9] applied the fractional reduced differential transform method (FRDTM) to derive a solution for the time-fractional two-dimensional advection-dispersion equation. The equation considered variable dispersion coefficients, velocities, decay constant of the first order, production rate coefficient for the solute at the zero-order level, and retardation factor. Fractional-order models provide more versatility in describing complex dynamic phenomena because of their continuous nature which can more accurately represent real-world dynamics. Nonlinear fractional partial differential equations are often more challenging to solve than linear ones. Furthermore, no technique provides a precise solution for the fractional-order differential equation. Therefore, the presence of fractional-order nonlinear PDEs improves the significance of the study. They can provide more precise analyses of systems that possess memory and hereditary features. Fractional-order models explicitly include non-local memory effects, while integer-order models assume just local memory. Nevertheless, fractional-order models have some disadvantages. They may possess more mathematical complexity and provide a more demanding analysis compared to models based on integer order. Solving fractional-order differential equations needs the use of specific methods.
In this work, we have used the latest method available, the FRDTM—an effective and reliable approach to solving the coupled non-linear time-fractional two-dimensional advection-diffusion equations that characterize the concentration of dissolved oxygen (DO) and the amount of pollution. For nonlinear time-fractional differential equations, the FRDTM produces very accurate numerical answers without needing spatial discretization, linearization, transformation, or perturbation. The originality of our work is that the FRDTM can be used to generate a wide range of coupled fractional-order nonlinear equations with different physical structures that arise in science.
The structure of the manuscript is as follows. Section 2 presents the mathematical formulation of the problem. In Section 3, the core concepts of the fractional reduced differential transform method and the associated convergence analysis are introduced. Section 4 provides a detailed discussion of the numerical results, including three-dimensional graphical comparisons and tabulated data. Finally, Section 5 offers a summary of the conclusions.

2. Mathematical Formulation of the Problem

In this study, a two-dimensional mathematical model is discussed to represent turbulent river flow. The advection-diffusion equation can be the best fit to approximate river pollution. The cross-sectional area of river is assumed to be constant. The two-dimensional nature of the unstable flow in the river defined by distances x * ( m ) and y * ( m ) measured from the origin with x * = 0 and y * = 0 have been considered for the present study. The governing equations have been described as follow [1,10,11]:
A * p * t * = D p x * 2 A * p * x * 2 + D p y * 2 A * p * y * 2 u x * A * p * x * u y * A * p * y * k 1 * q * q * + k * A * p * + f *
A * q * t * = D q x * 2 A * q * x * 2 + D q y * 2 A * q * y * 2 u x * A * q * x * u y * A * q * y * k 2 * q * q * + k * A * p * + β * K * q *
where 0 x * L * , 0 y * W * , t * 0
Let us consider the following non-dimensional variables and parameters [1,12]
x = x * L * ,   y = y * L * ,   t = k 2 * t * ,   p = p * p 0 * ,   q = q * q 0 * ,   W = W * L * ,   D p x = D p x * L * 2 k 1 * ,   D p y = D p y * L * 2 k 1 * u x = u x * L * k 1 * ,   u y = u y * L * k 1 * ,   k = k * q 0 * ,   f = f * A * k 1 * p 0 * ,   D q x = D q x * L * 2 k 1 * ,   D q y = D q y * L * 2 k 1 * ,   k 3 = k 2 * k 1 * ,   β = β * A * k 1 * ,   K = K * q 0 *
Hence, governing Equations (1) and (2) have been converted in the given form:
p t = D p x 2 p x 2 + D p y 2 p y 2 u x p x u y p y q q + k p + f
q t = D q x 2 q x 2 + D q y 2 q y 2 u x q x u y q y k 3 q q + k p + β K q
where 0 x 1 , 0 y W , t 0
The initial conditions of Equations (3) and (4) are [12,13]:
p ( x , y , 0 ) = C 1 e x + y D p y D p x
q ( x , y , 0 ) = C 2 e x + y D q y D q x

3. Fractional Reduced Differential Transform Method (FRDTM)

This section contains an explanation of several fundamental concepts and properties of fractional calculus theory [14,15].
Definition 1.
The fractional derivative of the function m C μ of order α 0 , in the sense of Caputo, is denoted by D α m ( τ ) and is defined as
D α m ( τ ) = 1 Γ ( k α ) 0 1 ( τ t ) m k ( t ) d t , f o r k 1 < α k , k N , τ > 0 , m C μ k , μ 1
Let ψ ( φ , ϰ , τ ) be a function of three variables, which can be expressed as ψ ( φ , ϰ , τ ) = a ( φ ) b ( ϰ ) c ( τ ) . The differential transform’s characteristics can be used to determine the representation of the function ψ ( φ , ϰ , τ ) .
ψ ( φ , ϰ , τ ) = k = 0 Ψ k ( φ , ϰ ) τ α k
where Ψ k ( φ , ϰ ) is a t-dimensional spectrum function. The transformed function of ψ ( φ , ϰ , τ ) is Ψ k ( φ , ϰ ) . The fundamental concepts and operations of FRDTM are as outlined below:
The operator R D represents the reduced differential transform, whereas R D 1 represents the inverse reduced differential transform.
Definition 2.
Assuming that ψ ( φ , ϰ , τ ) is analytic and continuous differentiable with respect to φ, ϰ, and τ inside the domain of interest. The reduced differential transformations for the function ψ ( φ , ϰ , τ ) is defined as follows [16,17]:
R D ψ ( φ , ϰ , τ ) Ψ k ( φ , ϰ ) = 1 Γ ( α k + 1 ) α k τ α k ψ ( φ , ϰ , τ ) τ = 0
The time-fractional order derivative is represented by the symbol α.
Definition 3.
The inverse differential transformations of the function Ψ k ( φ , ϰ ) is presented as:
R D 1 Ψ k ( φ , ϰ ) ψ ( φ , ϰ , τ ) = k = 0 Ψ k ( φ , ϰ ) τ α k
From Equations (9) and (10), we obtain
ψ ( φ , ϰ , τ ) = k = 0 1 Γ ( α k + 1 ) α k τ α k ψ ( φ , ϰ , τ ) τ = 0 τ α k
We examine the general fractional non-linear non-homogeneous partial differential equation in order to understand the operation of the FRDTM [18].
M ψ ( φ , ϰ , τ ) + A ψ ( φ , ϰ , τ ) + N ψ ( φ , ϰ , τ ) = g ( φ , ϰ , τ )
with initial condition
ψ ( φ , ϰ , 0 ) = Ξ ( φ , ϰ )
where M = α τ α , the linear operator A has partial derivatives, whereas the operator N ψ ( φ , ϰ , τ ) is non-linear, and g ( φ , ϰ , τ ) represents an inhomogeneous term.
We can derive the following iteration formula from the concepts of the FRDTM:
Γ ( α ( k + 1 ) + 1 ) Γ ( α k + 1 ) Ψ k + 1 ( φ , ϰ ) = G k ( φ , ϰ ) A Ψ k ( φ , ϰ ) N Ψ k ( φ , ϰ )
The functions Ψ k ( φ , ϰ ) , A Ψ k ( φ , ϰ ) , N Ψ k ( φ , ϰ ) , and G k ( φ , ϰ ) represent the transformations functions of the ψ ( φ , ϰ , τ ) , A ψ ( φ , ϰ , τ ) , N ψ ( φ , ϰ , τ ) , and g ( φ , ϰ , τ ) functions, respectively.
From the initial condition (13), we obtain
Ψ 0 ( φ , ϰ ) = Ξ ( φ , ϰ )
By substituting Equation (15) into Equation (14) and carrying out a basic iterative computation, we obtain the values of Ψ k ( φ , ϰ ) as follows. Subsequently, the inverse translation of the set of values Ψ k ( φ , ϰ ) k = 0 n yields the n-terms approximation solution in the following manner.
ψ n ( φ , ϰ , τ ) = k = 0 n Ψ k ( φ , ϰ ) τ α k
Therefore, the exact answer is provided by
ψ ( φ , ϰ , τ ) = lim n ψ n ( φ , ϰ , τ )
Theorem 1.
If ψ ( φ , ϰ , τ ) = k = 0 Ψ k ( φ , ϰ ) τ α k is a given series [19,20,21];
1 . If   0 < λ < 1 such that Ψ k + 1 Ψ k λ then the given series solution is convergent.
2 . If   λ > 1 such that Ψ k + 1 Ψ k λ then the given series solution is divergent.
The proof of Theorem 1, which is a particular case of Banach’s fixed point theorem, can be found in the literature.
Corollary 1.
The series solution k = 0 Ψ k ( φ , ϰ , τ ) exhibits convergence towards the exact solution ψ ( φ , ϰ , τ ) with the condition that 0 χ n < 1 , where n is a whole number and for every n [19,20,21]:
χ n = Ψ n + 1 Ψ n , Ψ n 0 0 , Ψ n = 0
The fundamental mathematical operations of the FRDTM are shown in Table 1.

4. Results and Discussion

This section shows the effect of various parameters on concenteration functions as well as the numerical and graphical outcomes of the obtained solutions.
We fractionalized Equations (3) and (4) into time-fractional partial differential equations in order to comprehend the anomalous behavior of the coupled system of equations. These equations are provided by
λ p t λ = D p x 2 p x 2 + D p y 2 p y 2 u x p x u y p y q q + k p + f
λ q t λ = D q x 2 q x 2 + D q y 2 q y 2 u x q x u y q y k 3 q q + k p + β K q
where 0 λ 1 .
Applying FRDTM to both sides of Equations (18) and (19), we obtain
Γ ( λ ( ( k + 1 ) + 1 ) ) Γ ( λ k + 1 ) P k + 1 = D p x 2 P k x 2 + D p y 2 P k y 2 u x P k x u y P k y r = 0 k G r P k r + f δ ( k λ )
Γ ( λ ( ( k + 1 ) + 1 ) ) Γ ( λ k + 1 ) Q k + 1 = D q x 2 Q k x 2 + D q y 2 Q k y 2 u x Q k x u y Q k y k 3 r = 0 k G r P k r + β ( K δ ( k λ ) Q k )
P k + 1 = Γ ( λ k + 1 ) Γ ( λ ( ( k + 1 ) + 1 ) ) D p x 2 P k x 2 + D p y 2 P k y 2 u x P k x u y P k y r = 0 k G r P k r + f δ ( k λ )
Q k + 1 = Γ ( λ k + 1 ) Γ ( λ ( ( k + 1 ) + 1 ) ) D q x 2 Q k x 2 + D q y 2 Q k y 2 u x Q k x u y Q k y k 3 r = 0 k G r P k r + β ( K δ ( k λ ) Q k )
where G r is the transformation function of g = q q + k . From the initial conditions (5) and (6), we write
P 0 ( x , y ) = C 1 e x + y D p y D p x
Q 0 ( x , y ) = C 2 e x + y D q y D q x
Putting (24) and (25) into (22) and (23), we obtain the approximate analytical solution as follows:
p ( x , y , t ) = P 0 ( x , y ) + P 1 ( x , y ) t λ + P 2 ( x , y ) t 2 λ + P 3 ( x , y ) t 3 λ + . . . = χ 0 + χ 1 + χ 2 + χ 3 + . . .
q ( x , y , t ) = Q 0 ( x , y ) + Q 1 ( x , y ) t λ + Q 2 ( x , y ) t 2 λ + Q 3 ( x , y ) t 3 λ + . . . = ψ 0 + ψ 1 + ψ 2 + ψ 3 + . . .
where
P 1 ( x , y ) = f + D p x C 1 e x y D p y D p x + u x C 1 e x y D p y D p x + u y C 1 e x y D p y D p x D p y D p x + D p y 2 C 1 e x y D p y D p x D p x + C 1 C 2 e x y D p y D p x e x y D q y D q x k + C 2 e x y D q y D q x 2 Γ λ + 1
P 2 ( x , y ) = u y D p x p e x y D p y D p x D p y D p x + C 1 C 2 2 e x y D p y D p x e 2 x 2 y D q y D q x D q y D q x + u x C 1 e x y D p y D p x D p y D p x + D p y 2 C 1 e x y D p y D p x D p y D p x D p x + D p y u y C 1 e x y D p y D p x D p x + C 1 C 2 e x y D p y D p x e x y D q y D q x D p y D p x k + C 2 e x y D q y D q x 2 + C 1 C 2 e x y D p y D p x e x y D q y D q x D q y D q x k + C 2 e x y D q y D q x 2 Γ 2 λ + 1
+ D p y D p y C 1 e x y D p y D p x + 2 C 1 C 2 2 e x y D p y D p x e 2 x 2 y D q y D q x D p y D p x D q y D q x + D p y 3 C 1 e x y D p y D p x D p x 2 + D p y u x C 1 e x y D p y D p x D p x + 3 D q y C 1 C 2 2 e x y D p y D p x e 2 x 2 y D q y D q x D q x + D p y u y C 1 e x y D p y D p x D p y D p x D p x + D p y C 1 C 2 e x y D p y D p x e x y D q y D q x k + C 2 e x y D q y D q x 2 D p x + D q y C 1 C 2 e x y D p y D p x e x y D q y D q x k + C 2 e x y D q y D q x 2 D q x + 2 C 1 C 2 e x y D p y D p x e x y D q y D q x D p y D p x D q y D q x k + C 2 e x y D q y D q x 2 Γ 2 λ + 1
+ D p x D p x C 1 e x y D p y D p x + u x C 1 e x y D p y D p x + 5 C 1 C 2 2 e x y D p y D p x e 2 x 2 y D q y D q x + u y C 1 e x y D p y D p x D p y D p x + D p y 2 C 1 e x y D p y D p x D p x + 4 C 1 C 2 e x y D p y D p x e x y D q y D q x k + C 2 e x y D q y D q x 2 Γ 2 λ + 1
+ u x u x C 1 e x y D p y D p x + C 1 C 2 2 e x y D p y D p x e 2 x 2 y D q y D q x + u y C 1 e x y D p y D p x D p y D p x + D p y 2 C 1 e x y D p y D p x D p x + 2 C 1 C 2 e x y D p y D p x e x y D q y D q x k + C 2 e x y D q y D q x 2 + D p x C 1 e x y D p y D p x Γ 2 λ + 1
+ C 1 Γ λ + 1 e x y D p y D p x C 2 e x y D q y D q x + k 2 β K C 2 e x y D q y D q x + u x C 2 e x y D q y D q x + D q x C 2 e x y D q y D q x + u y C 2 e x y D q y D q x D q y D q x + D q y 2 C 2 e x y D q y D q x D q x + k 3 C 1 C 2 e x y D p y D p x e x y D q y D q x k + C 2 e x y D q y D q x 2 Γ λ + 1 + C 2 e x y D q y D q x β K C 2 e x y D q y D q x + u x C 2 e x y D q y D q x + D q x C 2 e x y D q y D q x + u y C 2 e x y D q y D q x D q y D q x + D q y 2 C 2 e x y D q y D q x D q x + k 3 C 1 C 2 e x y D p y D p x e x y D q y D q x k + C 2 e x y D q y D q x 2 Γ λ + 1 Γ 2 λ + 1
+ C 2 e x y D q y D q x C 2 e x y D q y D q x + k 2 f + D p x C 1 e x y D p y D p x + u x C 1 e x y D p y D p x + u y C 1 e x y D p y D p x D p y D p x + D p y 2 C 1 e x y D p y D p x D p x + C 1 C 2 e x y D p y D p x e x y D q y D q x k + C 2 e x y D q y D q x 2 Γ 2 λ + 1
Q 1 ( x , y ) = β K C 2 e x y D q y D q x + u x C 2 e x y D q y D q x + D q x C 2 e x y D q y D q x + u y C 2 e x y D q y D q x D q y D q x + D q y 2 C 2 e x y D q y D q x D q x + k 3 C 1 C 2 e x y D p y D p x e x y D q y D q x k + C 2 e x y D q y D q x 2 Γ λ + 1
Q 2 ( x , y ) = u x u x C 2 e x y D q y D q x + D q x C 2 e x y D q y D q x β C 2 e x y D q y D q x + u y C 2 e x y D q y D q x D q y D q x + D q y 2 C 2 e x y D q y D q x D q x + k 3 C 1 C 2 2 e x y D p y D p x e 2 x 2 y D q y D q x + 2 k 3 C 1 C 2 e x y D p y D p x e x y D q y D q x k + C 2 e x y D q y D q x 2 Γ 2 λ + 1 + u y u x C 2 e x y D q y D q x D q y D q x + D q x C 2 e x y D q y D q x D q y D q x β C 2 e x y D q y D q x D q y D q x + D q y 2 C 2 e x y D q y D q x D q y D q x D q x + u y D q y C 2 e x y D q y D q x D q x + k 3 C 1 C 2 2 e x y D p y D p x e 2 x 2 y D q y D q x D q y D q x + k 3 C 1 C 2 e x y D p y D p x e x y D q y D q x D p y D p x k + C 2 e x y D q y D q x 2 + k 3 C 1 C 2 e x y D p y D p x e x y D q y D q x D q y D q x k + C 2 e x y D q y D q x 2 Γ 2 λ + 1
+ D q x u x C 2 e x y D q y D q x + D q x C 2 e x y D q y D q x β C 2 e x y D q y D q x + u y C 2 e x y D q y D q x D q y D q x + D q y 2 C 2 e x y D q y D q x D q x + 5 k 3 C 1 C 2 2 e x y D p y D p x e 2 x 2 y D q y D q x + 4 k 3 C 1 C 2 e x y D p y D p x e x y D q y D q x k + C 2 e x y D q y D q x 2 Γ 2 λ + 1
+ C 2 D q y C 2 e x y D q y D q x + D q y 3 C 2 e x y D q y D q x D q x 2 + u x D q y C 2 e x y D q y D q x D q x D q y β C 2 e x y D q y D q x D q x + u y D q y C 2 e x y D q y D q x D q y D q x D q x + 2 k 3 C 1 C 2 2 e x y D p y D p x e 2 x 2 y D q y D q x D p y D p x D q y D q x + 2 k 3 C 1 C 2 e x y D p y D p x e x y D q y D q x D p y D p x D q y D q x k + C 2 e x y D q y D q x 2 + D p y k 3 C 1 C 2 e x y D p y D p x e x y D q y D q x k + C 2 e x y D q y D q x 2 D p x + 3 D q y k 3 C 1 C 2 2 e x y D p y D p x e 2 x 2 y D q y D q x D q x + D q y k 3 C 1 C 2 e x y D p y D p x e x y D q y D q x k + C 2 e x y D q y D q x 2 D q x Γ 2 λ + 1
β β K C 2 e x y D q y D q x + u x C 2 e x y D q y D q x + D q x C 2 e x y D q y D q x + u y C 2 e x y D q y D q x D q y D q x + D q y 2 C 2 e x y D q y D q x D q x + k 3 C 1 C 2 e x y D p y D p x e x y D q y D q x k + C 2 e x y D q y D q x 2 Γ 2 λ + 1
+ k 3 Γ λ + 1 C 1 e x y D p y D p x C 2 e x y D q y D q x + k 2 β K C 2 e x y D q y D q x + u x C 2 e x y D q y D q x + D q x C 2 e x y D q y D q x + u y C 2 e x y D q y D q x D q y D q x + D q y 2 C 2 e x y D q y D q x D q x + k 3 C 1 C 2 e x y D p y D p x e x y D q y D q x C 2 e x y D q y D q x + k 2 Γ λ + 1 + C 2 e x y D q y D q x β K C 2 e x y D q y D q x + u x C 2 e x y D q y D q x + D q x C 2 e x y D q y D q x + u y C 2 e x y D q y D q x D q y D q x + D q y 2 C 2 e x y D q y D q x D q x + k 3 C 1 C 2 e x y D p y D p x e x y D q y D q x C 2 e x y D q y D q x + k 2 Γ λ + 1 + C 2 e x y D q y D q x C 2 e x y D q y D q x + k 2 f + D p x C 1 e x y D p y D p x + u x C 1 e x y D p y D p x + u y C 1 e x y D p y D p x D p y D p x + D p y 2 C 1 e x y D p y D p x D p x + C 1 C 2 e x y D p y D p x e x y D q y D q x C 2 e x y D q y D q x + k 2 Γ λ + 1 Γ 2 λ + 1
In addition, to analyze the convergence of an individual series solution, we compute the terms ξ k using Corollary 1. For the series solution of p ( x , y , t ) , we obtain ξ 0 = χ 1 χ 0 = 0.91992 < 1 , ξ 1 = χ 2 χ 1 = 0.75091 < 1 . And for the series solution of q ( x , y , t ) , we obtain ξ 0 = ψ 1 ψ 0 = 0.23513 < 1 , ξ 1 = ψ 2 ψ 1 = 0.05883 < 1 . This observation verifies that the FRDTM produces a series solution for p and q, demonstrating convergence towards the exact answer.
Now, we have obtained the following tables of numerical values and graphs of the concentration functions using MATLAB 2023 for fixed parameters D p x = 1 , D p y = 0.1 , u x = 1 , u y = 0.1 , f = 1 , D q x = 1 , D q y = 0.1 , k 3 = 0.5 , β = 2 , K = 2 , k = 1 .
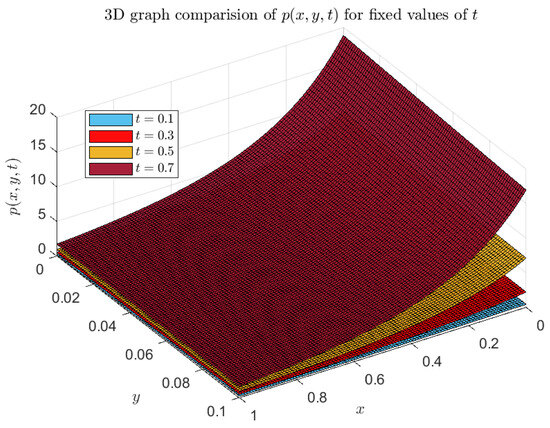
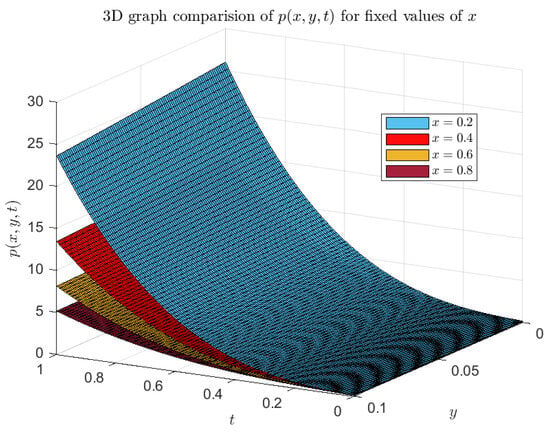
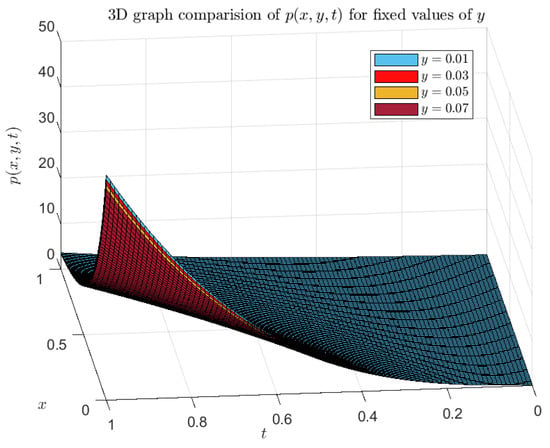
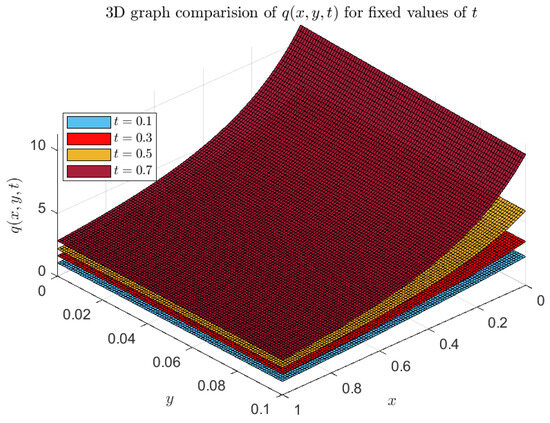
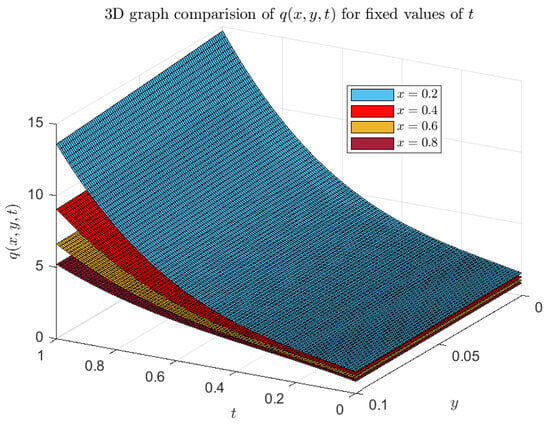
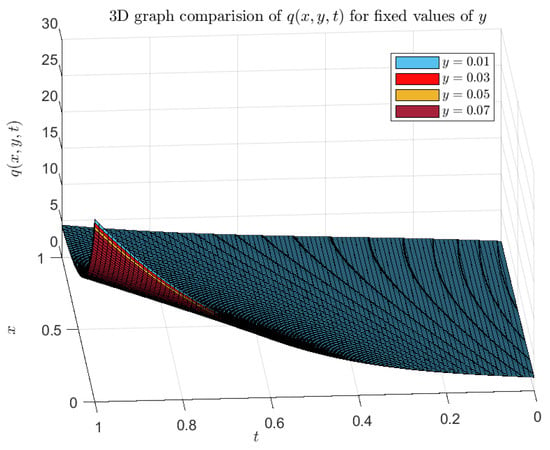
The numerical values of pollutant concentration for fixed t = 0.1 , 0.5 are in Table 2 and Table 3. The numerical values of DO concentration for fixed t = 0.1 , 0.5 , respectively, are given in Table 4 and Table 5. The impact of change in time on pollutant and DO concentration can be seen graphically in Figure 1 and Figure 2, respectively. The numerical values of p and q for fixed x = 0.4 , 0.8 are given in Table 6, Table 7, Table 8 and Table 9. Figure 3 and Figure 4 give the three-dimensional graphical comparison of pollutant and DO concentration function for fixed x, respectively. The numerical values of p and q for fixed y = 0.01 , 0.05 are given in Table 10, Table 11, Table 12 and Table 13. The impact of change in y on pollutant and DO concentration functions can be seen graphically in Figure 5 and Figure 6, respectively. It has been seen that the amount of pollution and DO concentration rises as t rises. And the levels of p and q decrease when x and y rise.
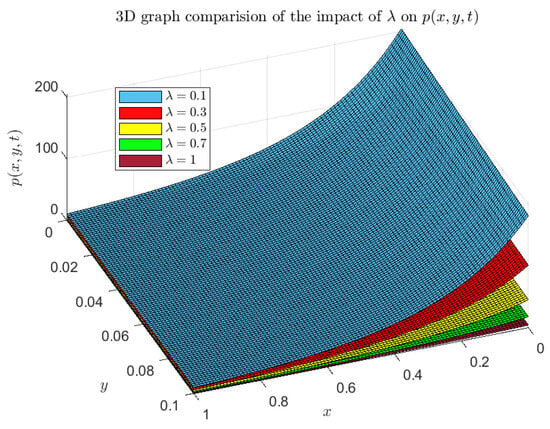
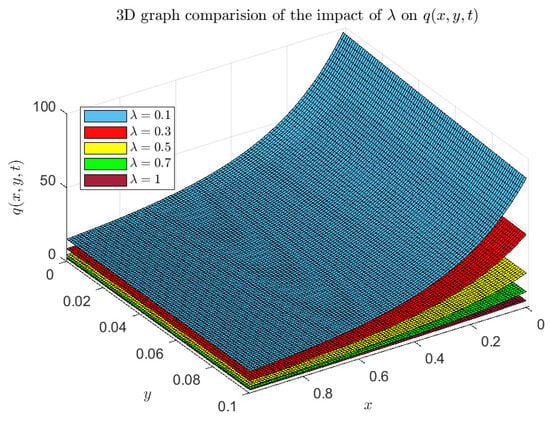
Table 14 and Table 15 provide the numerical values of pollutant and DO concentration for various values of λ ( λ = 0.1 , 0.3 , 0.5 , 0.7 , 1 ). The graphical representation of Figure 7 and Figure 8 illustrates the effect of variations in λ on the functions of pollutant and DO concentration. The numerical tables and figures provided show that when the value of λ has increased from 0 to 1, then the values of p and q are reduced.
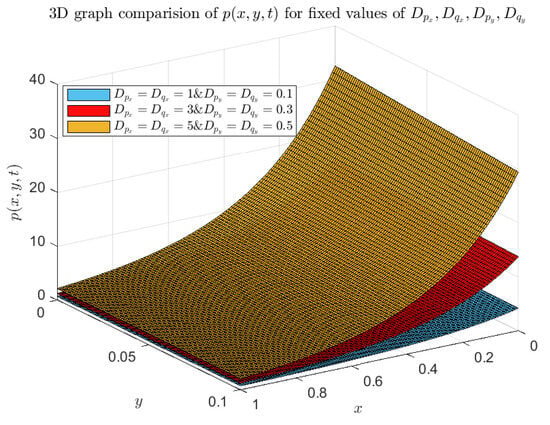
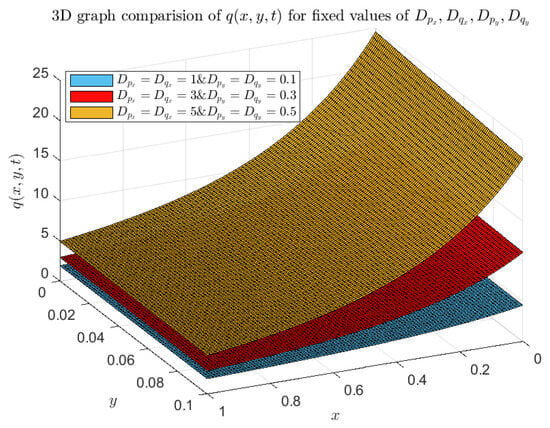
The numerical values of the pollutant and DO concentration for various values of D p x , D q x , D p y , D q y ( D p x = D q x = 1 , 3 , 5 & D p y = D q y = 0.1 , 0.3 , 0.5 ) are provided in Table 16 and Table 17. The three-dimensional graphical comparison of p and q for various values of D p x , D q x , D p y , D q y is shown in Figure 9 and Figure 10. If the values of D p x , D q x , D p y , D q y are increased, then the values of p and q are raised.
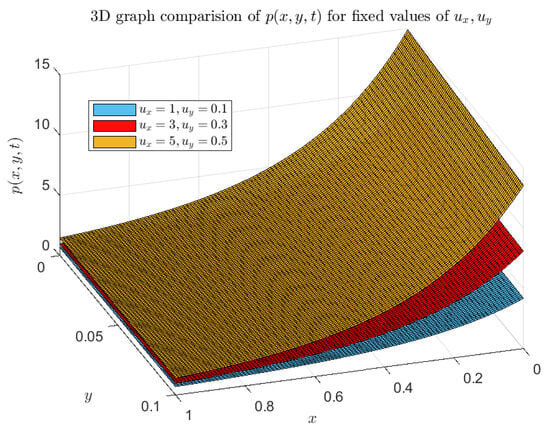
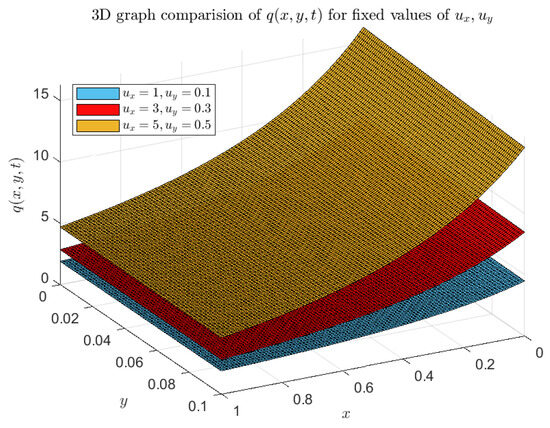
The numerical values of the pollutant and DO concentrations for the different u x , u y values ( u x = 1 , 3 , 5 and u y = 0.1 , 0.3 , 0.5 ) are given in Table 18 and Table 19. The impact of variations in u x , u y on the functions of pollutant and DO concentration is shown graphically in Figure 11 and Figure 12. We observe that when the values of u x , u y rise, the values of p and q also rise.
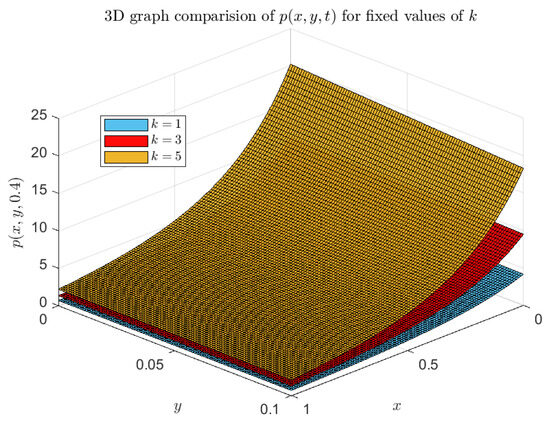
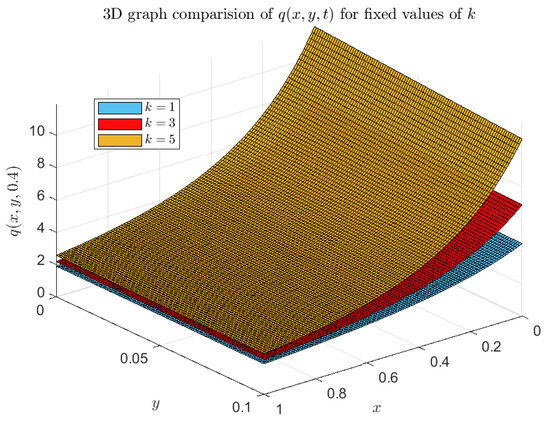
Table 20 and Table 21 provide the numerical values of the pollutant and DO concentrations for the various k values ( k = 1 , 3 , 5 ). In Figure 13 and Figure 14, the effects of changes in k on the functions of pollutant and DO concentration are graphically displayed. We can observe that when the value of k increases, the values of p and q rise.

5. Conclusions

In the present study, we have presented the two-dimensional time fractional mathematical model for river pollution and its remediation for an unsteady state and investigated the effect of aeration. We successfully applied the fractional reduced differential transform method to solve the coupled nonlinear two-dimensional time fractional advection-diffusion equations. The research area is supposed to be initially polluted in the exponentially decayed form. We have observed that the concentration of DO and the value of pollutants decrease as the length and width of the river increase. The concentration value of DO and pollutants increases as time increases. When fractional order values rise from 0 to 1, the concentration of pollutant and DO decreases. We also checked the effect of different parameters on concentrations. We observed that the concentration of pollutant and DO increases as the longitudinal and transverse diffusion coefficients of the pollutant and DO increase. Also, the concentration of contaminants and DO will rise as the river’s longitudinal and transverse seepage velocity increases, and it will increase if the half-saturated oxygen demand concentration for pollutant degradation increases.

Author Contributions

Methodology, P.V.T.; Software, M.A.M.; Validation, M.A.M.; Formal analysis, P.V.T.; Investigation, M.A.M.; Resources, T.P.; Writing—original draft, M.A.M.; Writing—review & editing, T.P.; Supervision, P.V.T. All authors have read and agreed to the published version of the manuscript.

Funding

This research received no external funding.

Data Availability Statement

The original contributions presented in the study are included in the article, further inquiries can be directed to the corresponding author.

Acknowledgments

Manan A. Maisuria acknowledges the Council of Scientific and Industrial Research (CSIR) India for providing a fellowship in the form of CSIR JRF/SRF for this research.

Conflicts of Interest

There are no conflicts of interest regarding the publication of this manuscript.

Nomenclature

β * The mass transfer of oxygen from air to water m 2 day
A * River’s cross section area ( m 2 )
D p x * Longitudinal diffusion coefficient of pollutant ( m 2 day )
D p y * Transverse diffusion coefficient of pollutant ( m 2 day )
D q x * Longitudinal diffusion coefficient of DO ( m 2 day )
D q y * Transverse diffusion coefficient of DO ( m 2 day )
f * The added pollutant rate along the river kg m day
K * Saturated oxygen concentration kg m 3
k * Half-saturated oxygen demand concentration for pollutant decay kg m 3
k 1 * Degradation rate coefficient of pollutant 1 day
k 2 * Degradation rate coefficient of DO 1 day
p * Pollutant concentration at position ( x * , y * ) and time t * ( kg m 3 )
q * DO concentration at position ( x * , y * ) and time t * ( kg m 3 )
t * Time (days)
u x * Longitudinal seepage velocity of the river m day
u y * Transverse seepage velocity of the river m day
x * Length of the river from origin (m)
y * Width of the river (m)

References

  1. Hadouda, M.K.A.; Wahid, T.Z.A. On the Numerical Solution for Pollution in a River and Its Remediation by Two-Dimensional Unsteady Aeration. Int. J. Appl. Eng. Res. 2017, 12, 24. [Google Scholar]
  2. Kangle, H.; van Genuchten, M.T.; Renduo, Z. Exact solutions for one-dimensional transport with asymptotic scale-dependent dispersion. Appl. Math. Model. 1996, 20, 298–308. [Google Scholar] [CrossRef]
  3. Pimpunchat, B.; Sweatman, W.L.; Triampo, W.; Wake, G.C.; Parshotam, A. Modelling river pollution and removal by aeration. In Proceedings of the MODSIM 2007: International Congress on Modelling and Simulation, Land, Water & Environmental Management: Integrated Systems for Sustainability, Modelling and Simulation Society of Australia and New Zealand, Christchurch, New Zealand, 10–13 December 2007; pp. 2431–2437. [Google Scholar]
  4. Hussain, S.A.; Atshan, W.G.; Najam, Z.M. Mathematical model for the concentration of pollution and dissolved oxygen in the diwaniya river (Iraq). Am. J. Sci. Res. 2012, 78, 33–37. [Google Scholar]
  5. Ibrahim, F.N.; Dimian, M.F.; Wadi, A.S. Remediation of pollution in a river by unsteady aeration with arbitrary initial and boundary conditions. J. Hydrol. 2015, 525, 793–797. [Google Scholar] [CrossRef]
  6. Liu, F.; Zhuang, P.; Anh, V.; Turner, I.; Burrage, K. Stability and convergence of the difference methods for the space–time fractional advection–diffusion equation. Appl. Math. Comput. 2007, 191, 12–20. [Google Scholar] [CrossRef]
  7. Attia, N.; Akgul, A.; Seba, D.; Nour, A. On solutions of time-fractional advection-diffusion equation. Numer. Methods Partial. Differ. Equ. 2023, 39, 4489–4516. [Google Scholar] [CrossRef]
  8. Mardani, A.; Hooshmandasl, M.R.; Heydari, M.H.; Cattani, C. A meshless method for solving the time fractional advection–diffusion equation with variable coefficients. Comput. Math. Appl. 2018, 75, 122–133. [Google Scholar] [CrossRef]
  9. Maisuria, M.A.; Tandel, P.V.; Patel, T. Solution of two-dimensional solute transport model for heterogeneous porous medium using fractional reduced differential transform method. Axioms 2023, 12, 1039. [Google Scholar] [CrossRef]
  10. Pimpunchat, B.; Sweatman, W.L.; Wake, G.C.; Triampo, W.; Parshotam, A. A mathematical model for pollution in a river and its remediation by aeration. Appl. Math. Lett. 2009, 22, 304–308. [Google Scholar] [CrossRef]
  11. Manitcharoen, N.; Pimpunchat, B. Analytical and numerical solutions of pollution concentration with uniformly and exponentially increasing forms of sources. J. Appl. Math. 2020, 2020, 9504835. [Google Scholar] [CrossRef]
  12. Hadhouda, M.K.; Hassan, Z.S. Mathematical model for unsteady remediation of river pollution by aeration. Inf. Sci. Lett. 2022, 11, 323–329. [Google Scholar]
  13. Saleh, A.; Ibrahim, F.N.; Hadhouda, M.K. Remediation of pollution in a river by releasing clean water. Inf. Sci. Lett. 2022, 11, 127–133. [Google Scholar]
  14. Patel, H.; Patel, T.; Pandit, D. An efficient technique for solving fractional-order diffusion equations arising in oil pollution. J. Ocean Eng. Sci. 2023, 8, 217–225. [Google Scholar] [CrossRef]
  15. Alshammari, S.; Abuasad, S. Exact solutions of the 3D fractional helmholtz equation by fractional differential transform method. J. Funct. Spaces 2022, 2022, 7374751. [Google Scholar] [CrossRef]
  16. Patel, T.; Patel, H. An analytical approach to solve the fractional-order (2 + 1)-dimensional Wu–Zhang equation. Math. Methods Appl. Sci. 2023, 46, 479–489. [Google Scholar] [CrossRef]
  17. Osman, M.; Xia, Y.; Omer, O.A.; Hamoud, A. On the fuzzy solution of linear-nonlinear partial differential equations. Mathematics 2022, 10, 2295. [Google Scholar] [CrossRef]
  18. Al-Amr, M.O. New applications of reduced differential transform method. Alex. Eng. J. 2014, 53, 243–247. [Google Scholar] [CrossRef]
  19. Moosavi Noori, S.R.; Taghizadeh, N. Study of convergence of reduced differential transform method for different classes of differential equations. Int. J. Differ. Equ. 2021, 2021, 6696414. [Google Scholar] [CrossRef]
  20. Noori, S.R.M.; Taghizadeh, N. Study of convergence of reduced differential transform method for different classes of nonlinear differential equations. Authorea Prepr. 2020. [Google Scholar]
  21. Varsoliwala, A.C.; Singh, T.R. Mathematical modeling of atmospheric internal waves phenomenon and its solution by Elzaki Adomian decomposition method. J. Ocean Eng. Sci. 2022, 7, 203–212. [Google Scholar] [CrossRef]
  22. Tandel, P.; Patel, H.; Patel, T. Tsunami wave propagation model: A fractional approach. J. Ocean Eng. Sci. 2022, 7, 509–520. [Google Scholar] [CrossRef]
  23. Singh, B.K.; Kumar, P. FRDTM for numerical simulation of multi-dimensional, time-fractional model of Navier–Stokes equation. Ain Shams Eng. J. 2018, 9, 827–834. [Google Scholar] [CrossRef]
  24. Abuasad, S.; Moaddy, K.; Hashim, I. Analytical treatment of two-dimensional fractional Helmholtz equations. J. King Saud Univ.-Sci. 2019, 31, 659–666. [Google Scholar] [CrossRef]
  25. Al-rabtah, A.; Abuasad, S. Effective Modified Fractional Reduced Differential Transform Method for Solving Multi-Term Time-Fractional Wave-Diffusion Equations. Symmetry 2023, 15, 1721. [Google Scholar] [CrossRef]
Figure 1. Comparison of pollutant concentration for fixed t.
Axioms 13 00654 g001
Figure 2. Comparison of DO concentration for fixed t.
Axioms 13 00654 g002
Figure 3. Comparison of pollutant concentration for fixed x.
Axioms 13 00654 g003
Figure 4. Comparison of DO concentration for fixed x.
Axioms 13 00654 g004
Figure 5. Comparison of pollutant concentration for fixed y.
Axioms 13 00654 g005
Figure 6. Comparison of DO concentration for fixed y.
Axioms 13 00654 g006
Figure 7. Comparison of pollutant concentration for different values of λ .
Axioms 13 00654 g007
Figure 8. Comparison of DO concentration for different values of λ .
Axioms 13 00654 g008
Figure 9. Comparison of pollutant concentration for fixed D p x , D q x , D p y , D q y .
Axioms 13 00654 g009
Figure 10. Comparison of DO concentration for fixed D p x , D q x , D p y , D q y .
Axioms 13 00654 g010
Figure 11. Comparison of pollutant concentration for fixed u x , u y .
Axioms 13 00654 g011
Figure 12. Comparison of DO concentration for fixed u x , u y .
Axioms 13 00654 g012
Figure 13. Comparison of pollutant concentration for fixed k.
Axioms 13 00654 g013
Figure 14. Comparison of DO concentration for fixed k.
Axioms 13 00654 g014
Table 1. Transform table [22,23,24,25].
FunctionTransformation
ψ ( φ , ϰ , τ ) Ψ i ( φ , ϰ ) = 1 Γ ( α i + 1 ) α i τ α i ψ ( φ , ϰ , τ ) τ = 0
c o ( φ , ϰ , τ ) ± d p ( φ , ϰ , τ ) c O i ( φ , ϰ ) ± d P i ( φ , ϰ ) , c and d are constant.
o ( φ , ϰ , τ ) p ( φ , ϰ , τ ) k = 0 i O k ( φ , ϰ ) P i k ( φ , ϰ )
α k τ α k ψ ( φ , ϰ , τ ) Γ ( i α + k α + 1 ) Γ ( i α + 1 ) Ψ i + k ( φ , ϰ )
k φ k ψ ( φ , ϰ , τ ) k φ k Ψ i ( φ , ϰ ) .
k ϰ k ψ ( φ , ϰ , τ ) k ϰ k Ψ i ( φ , ϰ ) .
φ m ϰ j τ k φ m ϰ j δ ( i α k ) where δ ( i α k ) = 1 i α = k 0 , i α k .
Table 2. p ( x , y , 0.1 ) .
xy0.010.020.030.040.050.060.070.080.090.1
0.10.4137360.4119740.4102270.4084940.4067750.4050690.4033780.40170.4000350.398383
0.20.3642690.3628930.3615280.3601720.3588270.3574910.3561660.354850.3535440.352248
0.30.3252840.3241890.3231010.3220210.3209490.3198830.3188250.3177740.316730.315694
0.40.2939990.2931120.292230.2913550.2904850.289620.2887610.2879070.2870590.286216
0.50.2684750.2677450.267020.2662990.2655830.264870.2641620.2634580.2627580.262062
0.60.2473420.2467340.2461290.2455270.2449290.2443340.2437420.2431530.2425680.241985
0.70.2296130.22910.2285890.228080.2275750.2270710.2265710.2260730.2255770.225084
0.80.2145670.2141290.2136920.2132580.2128260.2123960.2119680.2115430.2111190.210697
0.90.2016670.201290.2009140.200540.2001670.1997960.1994270.199060.1986940.19833
10.1905110.1901830.1898560.1895310.1892070.1888850.1885640.1882450.1879260.18761
Table 3. p ( x , y , 0.5 ) .
xy0.010.020.030.040.050.060.070.080.090.1
0.15.7323745.679445.6271315.5754385.5243545.4738695.4239775.3746685.3259365.277773
0.24.3247274.2880164.2517154.215824.1803254.1452264.1105164.0761924.0422474.008678
0.33.3397953.3138373.2881543.2627423.2375993.2127213.1881053.1637473.1396453.115795
0.42.6373962.6186982.6001872.5818622.563722.545762.5279782.5103732.4929422.475685
0.52.127332.1136242.1000482.08662.073282.0600862.0470162.0340692.0212452.00854
0.61.7505711.7403571.7302361.7202051.7102651.7004141.6906511.6809751.6713851.661881
0.71.4678251.4600981.4524371.4448411.437311.4298431.4224391.4150981.4078191.400602
0.81.252491.2465611.240681.2348471.229061.2233211.2176281.2119811.2063791.200823
0.91.0862491.081641.0770661.0725281.0680251.0635561.0591221.0547221.0503551.046022
10.9562850.9526580.9490590.9454850.9419380.9384170.9349220.9314520.9280080.924589
Table 4. q ( x , y , 0.1 ) .
xy0.010.020.030.040.050.060.070.080.090.1
0.12.1266432.1207152.1148112.1089292.1030692.0972322.0914172.0856242.0798542.074105
0.21.9496761.9444151.9391721.9339491.9287451.9235611.9183951.9132481.908121.903011
0.31.7922411.787551.7828751.7782171.7735751.768951.7643421.759751.7551741.750614
0.41.651641.6474441.6432611.6390941.6349411.6308021.6266781.6225681.6184721.61439
0.51.525711.5219461.5181961.5144581.5107321.507021.503321.4996331.4959581.492296
0.61.412671.4092891.4059191.402561.3992121.3958761.3925511.3892371.3859341.382642
0.71.3110311.3079891.3049561.3019341.2989211.2959181.2929261.2899431.286971.284007
0.81.2195241.2167831.2140511.2113281.2086141.2059091.2032121.2005251.1978461.195176
0.91.1370541.1345821.1321191.1296641.1272171.1247771.1223461.1199221.1175071.115099
11.062671.060441.0582171.0560021.0537931.0515921.0493981.0472111.0450311.042859
Table 5. q ( x , y , 0.5 ) .
xy0.010.020.030.040.050.060.070.080.090.1
0.15.1666595.1385865.1108085.0833215.056125.0292045.0025664.9762044.9501154.924294
0.24.4048014.3844084.3642124.3442084.3243954.304774.2853314.2660764.2470034.228108
0.33.844053.828813.8137023.7987273.7838813.7691633.7545723.7401073.7257653.711546
0.43.4197273.4080313.3964263.3849143.3734933.3621613.3509183.3397633.3286943.317712
0.53.090333.0811343.0720033.0629393.053943.0450053.0361333.0273253.0185793.009895
0.62.82872.8213132.8139752.8066862.7994442.792252.7851022.7780012.7709462.763937
0.72.6166932.6106492.6046432.5986722.5927382.5868392.5809762.5751472.5693542.563595
0.82.441922.4368982.4319032.4269372.4219982.4170872.4122032.4073462.4025162.397712
0.92.2957352.2915052.2872972.2831112.2789482.2748052.2706842.2665852.2625062.258449
12.1719612.1683592.1647752.1612092.1576592.1541282.1506132.1471162.1436352.140172
Table 6. p ( 0.4 , y , t ) .
ty0.010.020.030.040.050.060.070.080.090.1
0.10.2939990.2931120.292230.2913550.2904850.289620.2887610.2879070.2870590.286216
0.20.5566340.5543050.5519970.5497070.5474380.5451880.5429570.5407440.5385510.536376
0.30.9894660.9841010.9787850.9735210.9683050.9631390.9580210.9529510.9479290.942953
0.41.6604141.6497981.6392861.6288781.6185711.6083651.598261.5882521.5783421.568528
0.52.6373962.6186982.6001872.5818622.563722.545762.5279782.5103732.4929422.475685
0.63.9883313.9581013.9281783.8985583.8692373.8402133.8114813.7830383.754883.727005
0.75.7811375.7353085.6899475.6450485.6006075.5566185.5130745.4699725.4273055.38507
0.88.0837348.0176197.9521837.8874177.8233147.7598657.6970647.6349017.5733697.512462
0.910.9640410.8723310.7815710.6917510.6028410.5148510.4277510.3415510.2562210.17176
114.4899714.3667614.2448114.1241214.0046813.8864613.7694513.6536413.5390113.42556
Table 7. q ( 0.4 , y , t ) .
ty0.010.020.030.040.050.060.070.080.090.1
0.11.651641.6474441.6432611.6390941.6349411.6308021.6266781.6225681.6184721.61439
0.22.0126672.0078642.0030821.9983211.993581.988861.984161.979481.974821.97018
0.32.397682.3915972.3855472.3795322.373552.3676012.3616852.3558022.3499512.344132
0.42.8516962.84342.8351612.8269792.8188532.8107822.8027672.7948052.7868982.779043
0.53.4197273.4080313.3964263.3849143.3734933.3621613.3509183.3397633.3286943.317712
0.64.1467894.1302464.1138474.0975894.0814724.0654934.0496524.0339464.0183754.002935
0.75.0778955.0548045.0319255.0092564.9867944.9645374.9424834.9206294.8989734.877512
0.86.258066.2264616.1951646.1641656.1334616.1030496.0729246.0430836.0135235.98424
0.97.7322977.6899757.6480687.606577.5654787.5247857.4844877.444587.4050587.365918
19.5456229.4901049.4351399.3807229.3268469.2735039.2206889.1683939.1166139.065342
Table 8. p ( 0.8 , y , t ) .
ty0.010.020.030.040.050.060.070.080.090.1
0.10.2145670.2141290.2136920.2132580.2128260.2123960.2119680.2115430.2111190.210697
0.20.3704690.3695790.3686950.3678160.3669440.3660770.3652160.364360.3635110.362666
0.30.5801690.5783410.5765260.5747240.5729370.5711620.5694010.5676540.5659190.564197
0.40.8665490.8631040.8596870.8562960.8529330.8495960.8462850.8430010.8397420.836509
0.51.252491.2465611.240681.2348471.229061.2233211.2176281.2119811.2063791.200823
0.61.7608741.7514011.7420071.7326891.7234481.7142821.705191.6961731.6872291.678357
0.72.414582.4003162.3861692.3721382.3582232.3444212.3307332.3171562.303692.290334
0.83.2364923.2159953.1956683.1755083.1555133.1356833.1160153.0965083.0771613.057972
0.94.249494.2211314.1930054.1651114.1374474.110014.0827994.055814.0290414.002491
15.4764565.4384125.4006835.3632645.3261535.2893475.2528435.2166385.1807295.145112
Table 9. q ( 0.8 , y , t ) .
ty0.010.020.030.040.050.060.070.080.090.1
0.11.2195241.2167831.2140511.2113281.2086141.2059091.2032121.2005251.1978461.195176
0.21.5365791.5336571.5307471.5278471.5249581.5220791.519211.5163521.5135041.510666
0.31.8284751.8251681.8218741.8185941.8153271.8120751.8088361.805611.8023981.799199
0.42.1214952.1175142.1135522.109612.1056862.1017822.0978972.0940312.0901842.086355
0.52.441922.4368982.4319032.4269372.4219982.4170872.4122032.4073462.4025162.397712
0.62.8160312.809522.8030492.7966172.7902262.7838732.777562.7712852.7650492.75885
0.73.270113.2615813.2531093.2446933.2363323.2280273.2197773.211583.2034383.195349
0.83.8304383.8192833.8082053.7972053.7862813.7754343.7646613.7539633.7433383.732786
0.94.5232964.5088254.4944594.4801964.4660374.4519784.4380214.4241634.4104044.396743
15.3749665.356415.3379915.3197095.3015615.2835465.2656645.2479125.230295.212797
Table 10. p ( x , 0.01 , t ) .
xt0.10.20.30.40.50.60.70.80.91
0.10.4137360.9118181.8484283.3973525.7323749.02728113.4558619.1918926.4091635.28146
0.20.3642690.7560921.4635462.6114754.3247276.7281499.94658714.1048919.327925.74046
0.30.3252840.6419361.1890032.0578393.3397955.1262257.5084810.5779114.4258819.14372
0.40.2939990.5566340.9894661.6604142.6373963.9883315.7811378.08373410.9640414.48997
0.50.2684750.4917290.8418481.3699942.127333.1650184.5342196.2860978.47181411.14253
0.60.2473420.4414960.7308031.1541861.7505712.5588813.6180424.9669786.6446138.689872
0.70.2296130.4019950.6459540.9912961.4678252.1053482.933673.9825955.281936.86148
0.80.2145670.3704690.5801690.8665491.252491.7608742.414583.2364924.249495.476456
0.90.2016670.3449590.5284650.7697181.0862491.4955922.0152782.662843.455814.411722
10.1905110.3240540.4873070.6936060.9562851.2886781.7041212.2159482.8374943.582093
Table 11. q ( x , 0.01 , t ) .
xt0.10.20.30.40.50.60.70.80.91
0.12.1266432.5887183.1896444.0190735.1666596.7220568.77491811.414914.7316518.81483
0.21.9496762.3657322.86773.5244384.4048015.5776467.1118319.0762111.5396414.57098
0.31.7922412.1761192.6095253.1472423.844054.7547315.9340667.4368379.31782411.63181
0.41.651642.0126672.397682.8516963.4197274.1467895.0778956.258067.7322979.545622
0.51.525711.8702742.2205252.6145233.090333.6860074.4396165.3892196.5728768.028648
0.61.412671.7452212.0700852.420252.82873.328423.9523954.733615.7050516.899702
0.71.3110311.6347091.9407532.2583522.6166933.0449633.572354.2280435.0412276.041092
0.81.2195241.5365791.8284752.1214952.441922.8160313.270113.8304384.5232965.374966
0.91.1370541.4491171.7302452.0044472.2957352.6281193.0256113.5122214.1119614.84884
11.062671.3709381.6437731.903382.1719612.4717212.8248643.2535943.7801164.426632
Table 12. p ( x , 0.05 , t ) .
xt0.10.20.30.40.50.60.70.80.91
0.10.4067750.8892361.7919983.2815425.5243548.68691612.9357118.4372325.3579533.86436
0.20.3588270.7396731.4236092.5305284.1803256.4928939.58812613.5859218.6061624.76875
0.30.3209490.6297611.1601952.0001683.2375994.9604067.25650710.2138213.9202618.46376
0.40.2904850.5474380.9683051.6185712.563723.8692375.6006077.82331410.6028414.00468
0.50.2655830.4846610.8260361.3391092.073283.0779474.4025116.0963718.20892710.78958
0.60.2449290.4359740.7187971.131021.7102652.4941533.5203064.8263466.4498938.42857
0.70.2275750.3976140.6367010.9736581.437312.0564792.859993.8766665.135336.664806
0.80.2128260.3669440.5729370.8529331.229061.7234482.3582233.1555134.1374475.326153
0.90.2001670.3420850.5227380.7590691.0680251.466551.9715892.6000873.3689894.29524
10.1892070.3216820.4827160.6851780.9419381.2658671.6698342.1667082.7693613.490661
Table 13. q ( x , 0.05 , t ) .
xt0.10.20.30.40.50.60.70.80.91
0.12.1030692.5583473.1445923.9483385.056126.5544758.52993611.0690414.2583218.18431
0.21.9287452.340082.8319553.4711384.3243955.4584936.9401988.83627811.213514.13863
0.31.7735752.1541212.5804563.1059273.7838814.6676625.8106167.2660919.08743111.32798
0.41.6349411.993582.373552.8188533.3734934.0814724.9867946.1334617.5654789.326846
0.51.5107321.8535642.2001552.5878373.053943.6357954.3707325.2960836.4491787.867347
0.61.3992121.7304892.0526572.3981612.7994443.2889513.8991254.662415.611256.778089
0.71.2989211.6216521.925682.2397832.5927383.0133223.5303124.1724854.9686185.947489
0.81.2086141.5249581.8153272.1056862.4219982.7902263.2363323.7862814.4660375.301561
0.91.1272171.4387411.7186981.9908472.2789482.6067592.9980413.4765534.0660544.790305
11.0537931.361651.6335791.8915812.1576592.4538162.8020523.224373.7427724.379261
Table 14. p ( x , 0.07 , 0.4 ) for different values of λ .
x λ = 0.1 λ = 0.3 λ = 0.5 λ = 0.7 λ = 1
0.1131.94831673.800401633.171672613.21083993.225622782
0.294.1368333152.871856423.967759819.6998573892.491370321
0.368.2997831638.536204517.63515357.2667184061.972220367
0.450.3019404828.525429813.193300395.5479362661.59825953
0.537.5296057421.403632110.019417934.311356521.32409346
0.628.30433116.24706787.7114888483.4062331931.119740513
0.721.5303755212.45155586.0056321592.7330133820.96505829
0.816.480213259.615168494.7256623672.2248191910.846285232
0.912.662461997.465908093.7519146641.8359521310.753864312
19.739543695.816552923.0017283311.5346614890.681053708
Table 15. q ( x , 0.07 , 0.4 ) for different values of λ .
x λ = 0.1 λ = 0.3 λ = 0.5 λ = 0.7 λ = 1
0.166.0539085637.446535717.845929248.4858601913.913953704
0.250.0323740928.486352213.801854956.8391559683.445155514
0.339.1913700322.390262211.017423585.6767224573.085736626
0.431.6892131218.1464629.0535609494.8344342042.8027665
0.526.3796034515.12374657.6350898594.2085174262.574740807
0.622.5383604412.9223096.5867901453.7322173722.387303087
0.719.7006308411.28475955.7951828153.3617976882.230643742
0.817.5629047110.04249835.1854403813.0680425592.097897281
0.915.923422549.083052284.7072819242.8310380141.984140789
114.645537368.329958834.3262573772.6369275241.885758787
Table 16. p ( x , 0.07 , 0.4 ) for different values of D p x , D q x , D p y , D q y .
x D p x = D q x = 1 & D p y = D q y = 0.1 D p x = D q x = 3 & D p y = D q y = 0.3 D p x = D q x = 5 & D p y = D q y = 0.5
0.13.22562278210.3510030822.15170425
0.22.4913703217.68678220616.33898209
0.31.9722203675.78475472112.15687743
0.41.598259534.4126252249.126022393
0.51.324093463.4133228426.915223144
0.61.1197405132.6791986345.29313882
0.70.965058292.1355364724.096574258
0.80.8462852321.7298710873.209395814
0.90.7538643121.4249715852.548326985
10.6810537081.1941683122.053258012
Table 17. q ( x , 0.07 , 0.4 ) for different values of D p x , D q x , D p y , D q y .
x D p x = D q x = 1 & D p y = D q y = 0.1 D p x = D q x = 3 & D p y = D q y = 0.3 D p x = D q x = 5 & D p y = D q y = 0.5
0.13.9139537049.18768544718.65057115
0.23.4451555147.62269885815.20393681
0.33.0857366266.44449639712.59892502
0.42.80276655.54090303710.60017544
0.52.5747408074.8357236339.044135138
0.62.3873030874.2763541637.815633855
0.72.2306437423.8258955946.832548434
0.82.0978972813.458064346.035625304
0.91.9841407893.1538606025.381634143
11.8857587872.8993556744.838701197
Table 18. p ( x , 0.07 , 0.4 ) for distinct values of u x , u y .
x u x = 1 , u y = 0.1 u x = 3 , u y = 0.3 u x = 5 , u y = 0.5
0.13.2256227826.18439510.36456421
0.22.4913703214.694647477.829728301
0.31.9722203673.6274378315.99953251
0.41.598259532.8524671174.663582708
0.51.324093462.2825754053.678457678
0.61.1197405131.8585513132.945060114
0.70.965058291.5395731012.394058674
0.80.8462852321.2971057221.976393285
0.90.7538643121.1109464371.656992113
10.6810537080.9666241831.410554156
Table 19. q ( x , 0.07 , 0.4 ) for distinct values of u x , u y .
x u x = 1 , u y = 0.1 u x = 3 , u y = 0.3 u x = 5 , u y = 0.5
0.13.9139537047.2642376513.17560781
0.23.4451555146.25252835811.29058683
0.33.0857366265.4660325739.801609533
0.42.80276654.8414550118.603480282
0.52.5747408074.3359900147.623323371
0.62.3873030873.9200943266.809704515
0.72.2306437423.5729593166.125655747
0.82.0978972813.2796321015.544134335
0.91.9841407893.0291567225.045020123
11.8857587872.8133547254.613098884
Table 20. p ( x , 0.07 , 0.4 ) for distinct values of k.
x k = 1 k = 3 k = 5
0.13.2256237.29248313.93789
0.22.491375.56110910.50596
0.31.972224.335218.074585
0.41.598263.4529546.32677
0.51.3240932.8078825.052338
0.61.1197412.3289564.11013
0.70.9650581.9681073.404136
0.80.8462851.6923612.868241
0.90.7538641.4787942.456363
10.6810541.3112592.136
Table 21. q ( x , 0.07 , 0.4 ) for distinct values of k.
x k = 1 k = 3 k = 5
0.13.9139545.7320028.794366
0.23.4451564.8050467.069187
0.33.0857374.1238535.825489
0.42.8027673.6117154.911947
0.52.5747413.2181794.228409
0.62.3873032.909523.707685
0.72.2306442.6628283.304071
0.82.0978972.4622772.986054
0.91.9841412.296752.731601
11.8857592.1583052.525098
Disclaimer/Publisher’s Note: The statements, opinions and data contained in all publications are solely those of the individual author(s) and contributor(s) and not of MDPI and/or the editor(s). MDPI and/or the editor(s) disclaim responsibility for any injury to people or property resulting from any ideas, methods, instructions or products referred to in the content.