1. Introduction
Investigating the dynamical motion of vibrating systems is an important area of nonlinear dynamics. These systems vary depending on the motion of blocks connected by springs that move horizontally, vertically, or on inclined surfaces. We also have such vibrations in the planar motion of various connected pendulums with small or large masses (which in many cases may be represented by rigid bodies) with linear or nonlinear oscillators.
In various research publications, including [
1,
2,
3,
4,
5], the planar movement of a pendulum was examined to describe its motion. The pivot point of a simple pendulum was restricted in [
1] to follow an elliptic route. Some instances were studied to illustrate the various motions of this point. In [
2,
3,
4], the chaotic behavior of a parametrically activated pendulum was examined experimentally, analytically, and numerically. In [
5], the authors investigated the sinusoidal motion of the nonlinear oscillations of an energized auto-parametric dynamical system. The system’s response was evaluated using the method of harmonic balance [
6]. In [
7], this approach is employed to determine the analytical outcomes for the oscillatory movement of an auto-parametric system that is coupled with a nonlinear spring pendulum (SP) near one of the emerging resonances. The authors validated their findings by comparing the obtained results to the numerical solutions.
To derive the approximations of the regulating equations of motion (EOMs) of such relevant dynamical systems, the MSM [
6] is employed in a number of published papers, including [
8,
9,
10,
11,
12,
13,
14,
15,
16]. In [
8,
9,
10], the oscillations of an SP are studied under the action of external harmonic moments and forces when the suspension points move along various paths with constant angles of rotation. For the stable motion, the probable fixed points and the associated steady-state solutions were identified. In [
11], the authors used a fixed pivot point, focusing on the exploration of oscillatory motion in a rigid body acting as a pendulum. The generalizations for the oscillatory movement of a damped rigid body pendulum with linear and nonlinear stiffness were examined in [
12,
13], respectively, with the motion of the pendulum’s supported point constrained to be on an elliptical path. The resulting solutions are illustrated with potential resonance curves for various parameters of the system. An additional extension was developed in [
14], where the supported point’s route resembles a Lissajous curve. The analytical and numerical outcomes were contrasted to demonstrate their substantial degree of consistency and to confirm the high degree of accuracy of the applied analytical technique. In [
15], a 3DOF double pendulum moving under the impact of two harmonic moments and forces was studied. The initial pendulum was constrained to be rigid, where its first point is restricted to moving on an ellipse, whereas its second end is connected by a damped SP. The achieved solutions were plotted and compared to the numerical solutions. In [
16], the resonance curves that correspond to the stability regions and instability ones of a 2DOF mathematical model were studied. The motion was restrained to be in a plane, influenced by harmonic forces applied at the SP’s free end and a harmonic moment at the pivot point.
In [
17], the authors explored how a damped SP moves when a resistance force is present, in addition to a torque at a fixed point and a harmonic force at the pendulum’s free end. In [
18], the authors investigated how well the 2DOF spring-damper responds to the drag and buoyancy forces and to an excitation force. All resonant instances are identified, and the solutions at the steady state are verified under the solvability requirements. A significant contribution to the field of nonlinear dynamics and mechanical systems by advancing the understanding of energy interactions in complex coupled systems is examined in [
19]. The outcomes have potential applications in various engineering and physical systems where such quadratic couplings and resonances are presented.
Numerous investigations, including those in [
20,
21,
22,
23,
24,
25,
26], have used numerical or analytical analysis to study the resonances for the systems of a Duffing pendulum. In [
20], the method of harmonic balance is employed to examine the reactions of an auto-parametric system that consists of a mass, a spring, and a damper. In [
21], the analytical solutions of an auto-parametric model that consisted of a coupled damped pendulum and a nonlinear oscillating model close to the major area of resonance were investigated. In [
22], the author looked at the vibrations of a 2DOF dynamically autonomous system formed of coupled oscillators with the nonlinearity of self-excitation of a Duffing type. In [
23], the behavior of an auto-parametric model under a harmonic external force was explored. To enhance the system’s dynamics and regulate movements, the authors considered using a nonlinear spring and a semi-active magnetic damper. The harmonic balance approach was used in [
24] to generate the analytical solutions for this system, which are then validated by comparison with numerical outcomes. The analysis of the oscillation reduction and energy harvesting for a similar system was studied [
25], where the concepts of vibration absorber and energy harvesting are extremely similar. In [
26], numerical analysis was used to explore a model of a dynamical pendulum that was subjected to a forced Duffing oscillator, and an analysis of the pendulum’s bifurcation was carried out.
The study of nonlinear dynamics in structural mechanics has grown in importance as a tool for studying the complex behaviors of composite structures and modern engineered materials. The aspects of nonlinear resonance and dynamic responses have been explored in depth recently, revealing phenomena that were previously unknown or poorly understood. Therefore, significant contributions from recent works in this field were highlighted.
In [
27], the authors focused on the behavior of rotating graphene platelets reinforced with metal foam plates in thermal settings by examining the nonlinear resonance and chaotic dynamics of these materials. That work shed light on the complex interplay between material composition, structural geometry, and environmental factors. In [
28], the nonlinear combined resonance of axially moving conical shells was examined, focusing on the interaction between transverse and parametric modes. This work provided valuable insights into the dynamic response of these structures under varying loading conditions. In [
29], the coupled resonance of cylindrical shells made of metal foam reinforced with graphene platelets and spinning motion under nonlinear forced vibration was investigated. This research advances our understanding of the dynamic behavior of composite cylindrical shells under intricate loading conditions. In [
30], the nonlinear low-velocity impact of magneto-electro-elastic plates was examined while taking into account the impact of initial geometric flaws. An examination of how these plates react to impact loading was developed, with implications for aerospace applications.
In this study, the stability behavior of a 2DOF vibrating cart is investigated. The mechanical governing equations are established using Lagrange’s equations of the second kind and solved analytically using the MSM to the third approximation. To obtain the conditions of solvability, secular terms are removed. All emerging cases of resonance are categorized, and two of these are then simultaneously examined. As a result, the equations of modulation are created with a focus on the polar form representations of the unknown complex function. By using the associated fixed points, the steady-state solutions are found. The obtained solutions are plotted to show their dependence on the system’s acting parameters and are verified by comparison with the NS of the system’s original equations. This comparison shows their consistency with the NS, which provides evidence of the method’s high degree of accuracy. The nonlinear stability of Routh–Hurwitz criteria is used to assess the stability and instability zones according to various plots for resonance curves. The main difference between the current work and previous research lies in the wider range of parameters, such as mass distribution, damping, and stiffness, under which the structural characteristics and mode of oscillation are studied. While some systems may resonate strongly at specific frequencies, others may exhibit a complex behavior, including chaotic oscillations or multiple mode interactions. The studied model has a stationary behavior during the time interval under study. The model’s numerous applications, including those for ship motion, swaying structures, transportation infrastructure, and rotor dynamics, highlight its importance. Moreover, this work presents contributions to both theoretical understanding and practical applications of resonance phenomena in dynamic systems. Its insights might pave the way for improved system design, control, and risk management across various engineering disciplines.
2. Dynamical Modelling
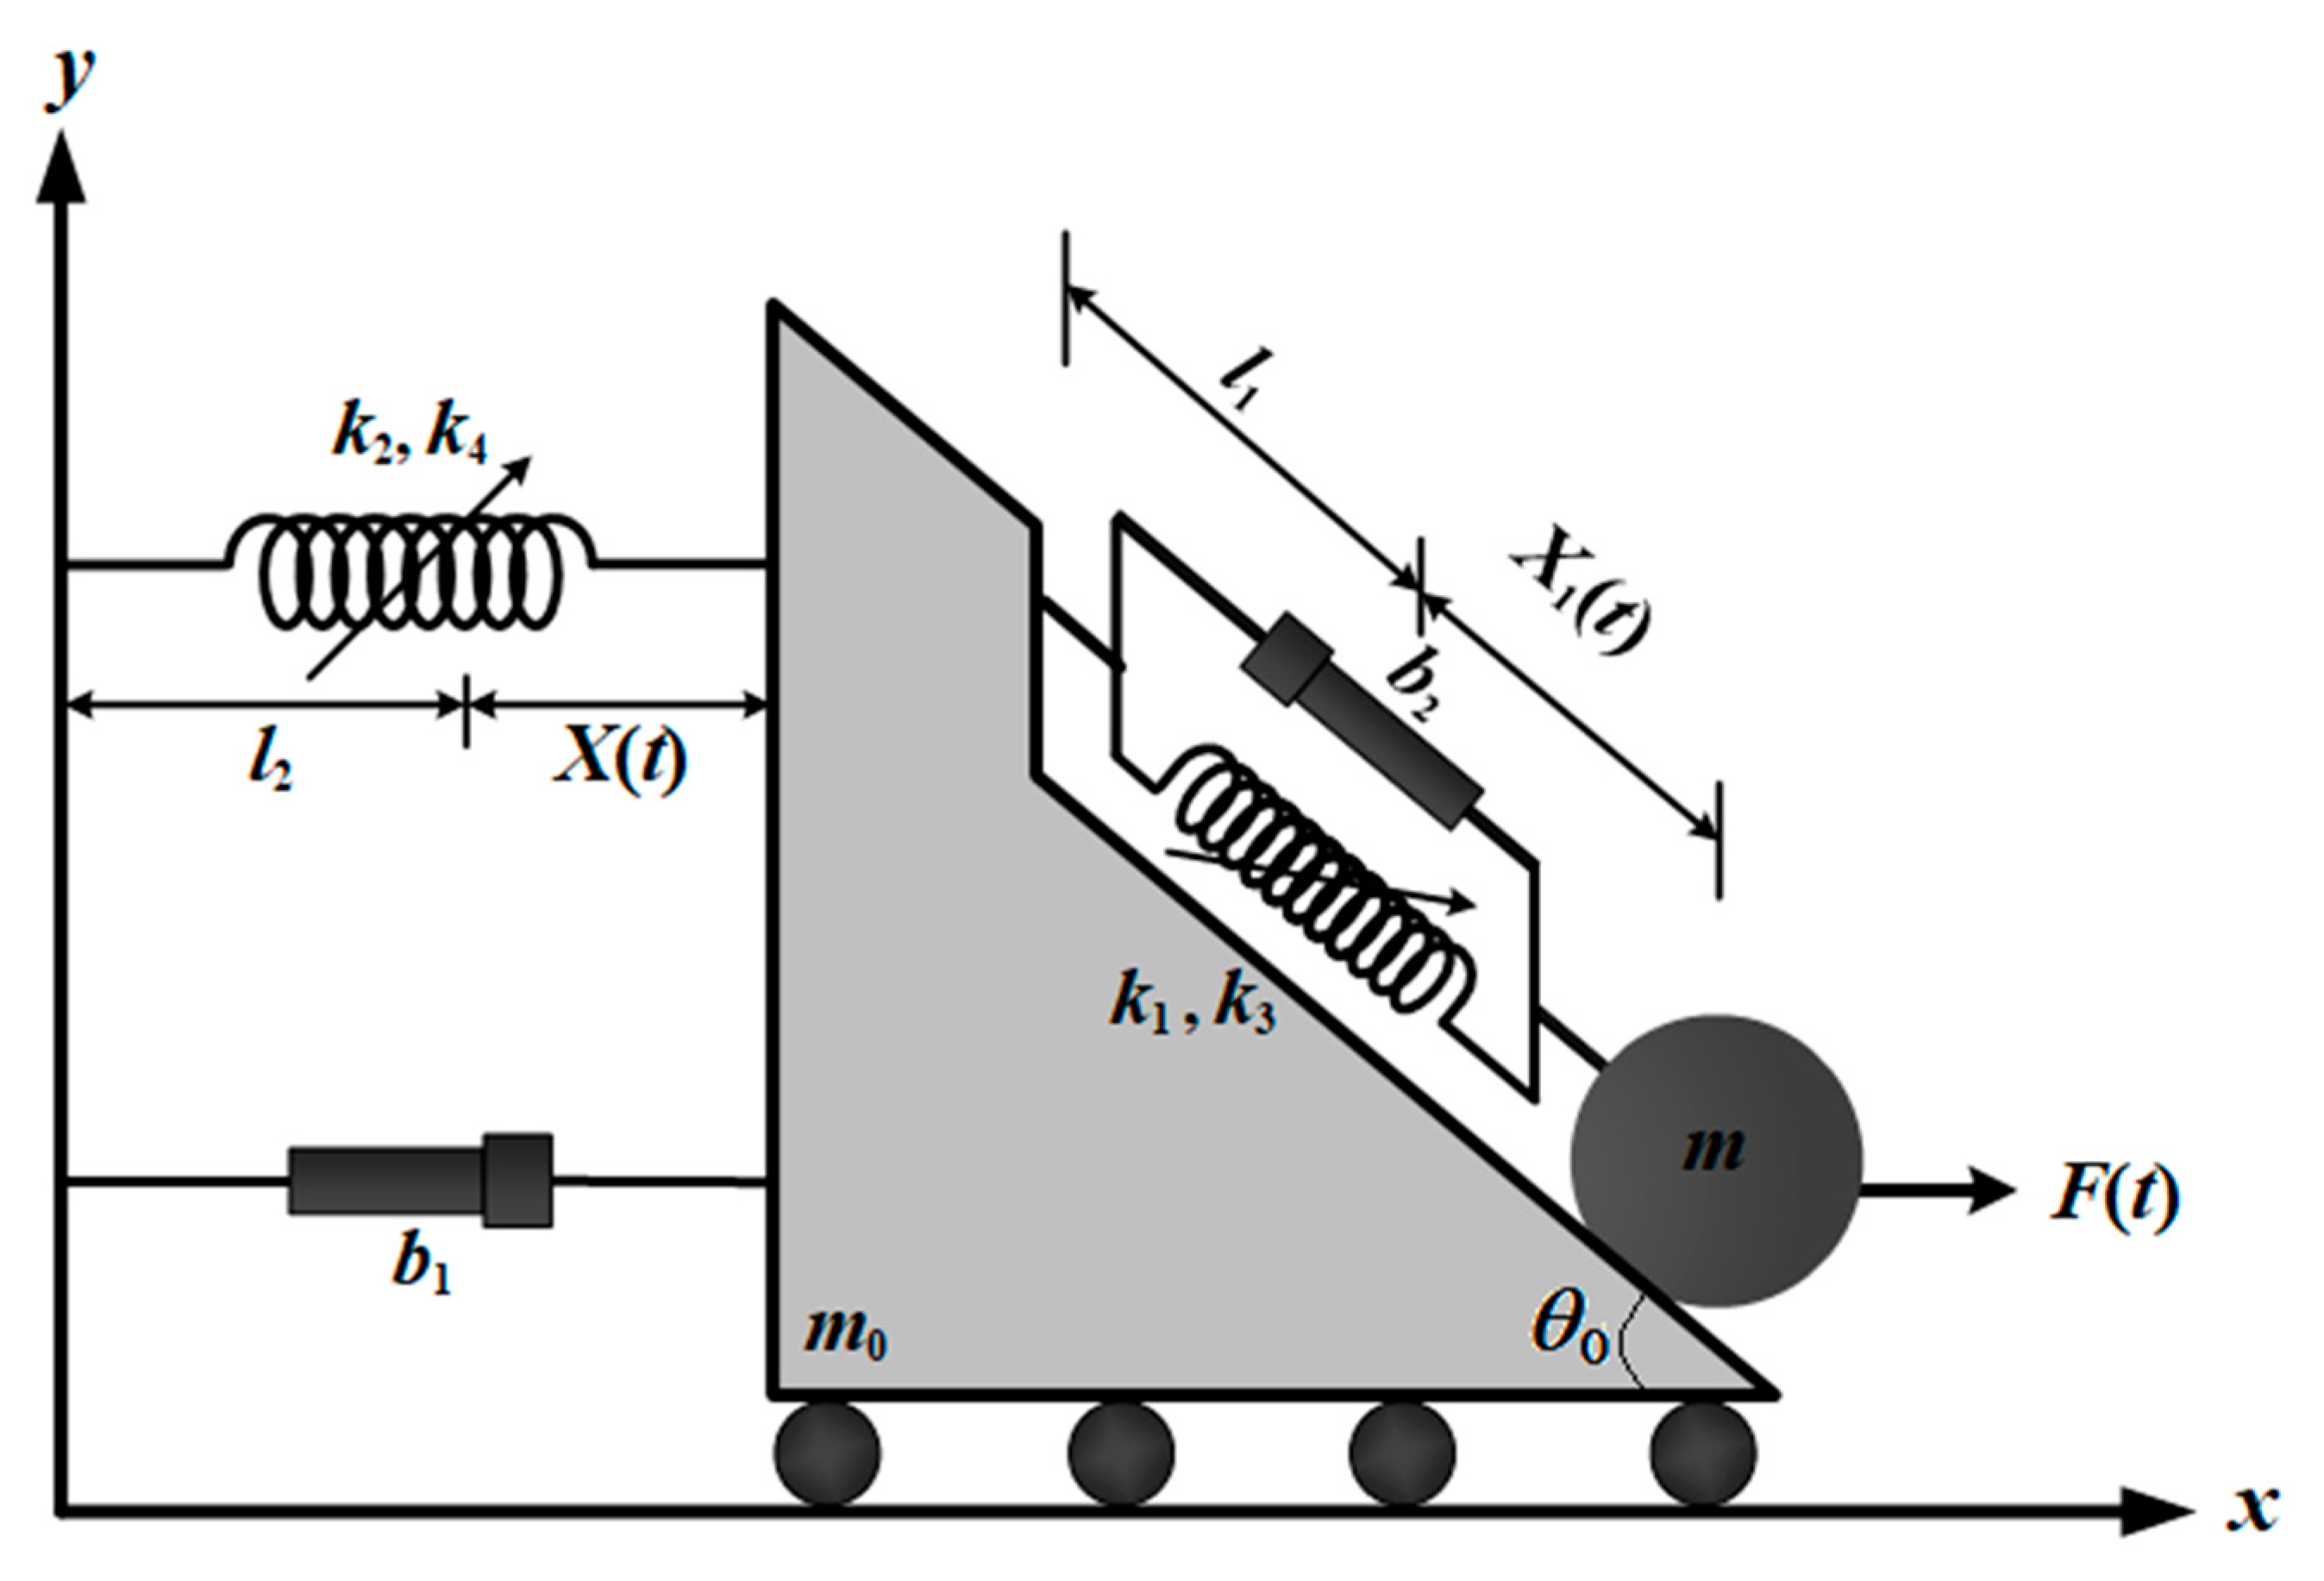
This study examines a 2DOF dynamical system composed of two components. The first component is a cart with an inclined surface and mass
attached to a nonlinear spring with length
, stiffness coefficients
and
, and a damper with constant
, with the inclined surface making an angle
with the horizontal surface. The second component is a uniform disc of mass
that rolls on the cart’s inclined surface and maintains contact with
. The mass
is restricted by a damper with a coefficient
and a nonlinear spring with stiffness
,
and length
whose other end is fixed to the cart. The constants
and
are considered to be linear and nonlinear stiffness coefficients, respectively. A horizontal harmonic external force
is applied to the center of the mass
; see
Figure 1.
Mathematically, the system’s potential and kinetic energies are expressed by the follwing:
where
depicts the cart’s horizontal position,
is the corresponding oblique position at time
, and the differentiation with respect to time is represented by a dot. The horizontal force applied to the center of
is expressed by
, where
and
are the forcing frequency and amplitude of the force
, respectively. Using the Lagrangian
, the EOMs are expressed by Lagrange’s equations.
where
and
are the generalized coordinates, and the generalized forces
and
are expressed by, respectively:
Using (1)–(3), we obtain the dimensionless expressions of the EOMs in the forms
where we used the following frequencies and variables
The system of Equations (4) and (5) are two nonlinear ordinary differential equations (ODEs) in the variables and .
3. Analytical Solution
In nonlinear dynamics, the MSM stands out as a powerful analytical tool for investigating the behavior of complex systems. This approach is especially valuable for systems with multiple time scales, where traditional perturbation techniques may not fully and accurately capture the full range of dynamic behaviors. Additionally, the MSM have the following properties:
- (a)
Accuracy and efficiency: One of the key advantages of this method is its ability to provide accurate solutions for systems with nonlinearities while maintaining computational efficiency. By incorporating multiple time scales, this approach offers a more comprehensive representation of the system’s dynamics than traditional perturbation methods [
6].
- (b)
Capture of higher-order effects: This method may capture higher-order effects, which results in more precise predictions of system behavior. This is in contrast to linear perturbation methods, which normally only take into account first-order approximations. This is particularly important for systems whose dynamics exhibit a significant nonlinear behavior [
31].
- (c)
Applicability to different systems: Due to its adaptability, the MSM can be used to solve a variety of scientific and engineering problems [
32].
- (d)
Deeper understanding of nonlinear processes: By using this method, researchers can understand the underlying nonlinear processes that control the behavior of the system. By breaking down the dynamics into various time scales, the method clarifies the interactions and mechanisms behind the observed behavior [
33].
- (e)
Validation and Verification: Despite the many advantages of the MSM, it is necessary to verify its results by using numerical simulations. This guarantees the precision and dependability of the AS obtained by this approach, especially for intricate systems, where obtaining AS may present difficulties [
34].
Overall, the solution of the MSM represents a significant milestone in the study of nonlinear dynamics, offering a powerful framework for analyzing and understanding complex systems across various disciplines. There are many other methods that can be used to achieve the desired solutions, such as the Lindstedt–Poincaré method [
6], the harmonic balance method [
35], the homotopy perturbation method and its modification [
36,
37,
38], the optimal auxiliary functions method [
39], and others.
The primary goal of the present section is to apply the MSM and derive the AS of the dimensionless form of the EOMs (4) and (5). Additionally, we deal with resonance, obtain solvability criteria, and arrive at the equations of modulation. Since all oscillations are expected to have small amplitudes, we can model them with using a small parameter
, i.e.,
This parameter serves as a measure of how “small” the perturbation is compared to the main quantities or parameters of the system.
In the context of the MSM, the desired analytic solutions
and
are expanded as follows [
6]
where
are different time scales [
19]. In terms of these scales, the derivatives will have the following form
In (8), terms with an
or higher can be ignored. The following parameters of the generalized forces’ amplitudes, damping coefficients, and others are assumed to be minimal, i.e.,
where
and
are considered quantities of order 1.
Making use of (6)–(9), substituting into (4) and (5), and subsequently equating the coefficients of the equal powers of , we obtain the following groups of partial differential equations (PDEs).
The preceding six PDEs will be solved later. Equations (10) and (11) are homogeneous; so, we may formulate their general solutions as follows:
where
and
are complex functions of
and
, and their complex conjugate. Secular terms are produced by the substitution of (16) and (17) into (12) and (13). Eliminating the secular terms requires that
Consequently, we may express the second-order solutions as:
where
is the complex conjugate of the preceding terms. Based on the previous simulations, secular terms are produced by applying (16), (17), (20), and (21) to the third-order Equations (14) and (15). The following equations are needed to drop these secular terms
Therefore, the third-order solutions become
The complex conjugates of the preceding terms are represented by
. The undetermined functions
may be obtained using Equations (18), (19), (22) and (23), and the following initial conditions.
where
are constant quantities.
4. Resonance Analysis
In this section, we categorize the resonance cases, obtain the modulation equations, and examine two cases. It is known that resonance occurs when a system is subjected to a periodic force at a frequency that matches the system’s natural frequency. This causes the system to oscillate with a significantly larger amplitude than it would at other frequencies. The resonance cases can be identified by the vanishing of the denominators of the obtained solutions [
40], and they can be classified as major external resonance, which occur primarily at
or
, and internal one, when
. It should be noted that the system will exhibit a complicated behavior if one of these resonance conditions is satisfied. If the system’s oscillations do not approach resonance, the above asymptotic solutions will be valid. Therefore, it is necessary to regulate the utilized method if any of these cases are satisfied. Here, we explore both major external resonances. Thus, we consider the cases
and
. To accomplish this, the following detuning parameters
are introduced [
41].
In a forced oscillator, the detuning parameters measure the differences between the natural frequencies of the oscillator and the frequencies of the external driving force. It quantifies the distance between the oscillatory motion and the stringent resonance condition [
42]. The following is the expression of those parameters using the parameter
Substituting (26) and (27) into the set of PDEs in Equations (12)–(15), and then eliminating the secular terms, one arrives at the following solvability conditions:
Regarding the approximation of second-order
Regarding the approximation of third-order
We can see from the last conditions that the model’s secular conditions consist of a system of four nonlinear PDEs in the function
. These functions are dependent only on
and can expressed in the polar form as
where
and
are the real phase and amplitude functions for the solutions
and
, respectively.
Clearly,
is independent of
and
. Hence, we may write the first-order derivatives as follows:
Using (32), the PDEs (29) and (30) become ODEs. The adjusted phases can then be expressed as follows:
Substituting (31)–(33) into (29) and (30), and separating the real and imaginary components, we obtain the following system.
The above system consists of four first-order ODEs in the amplitudes
and modified phases
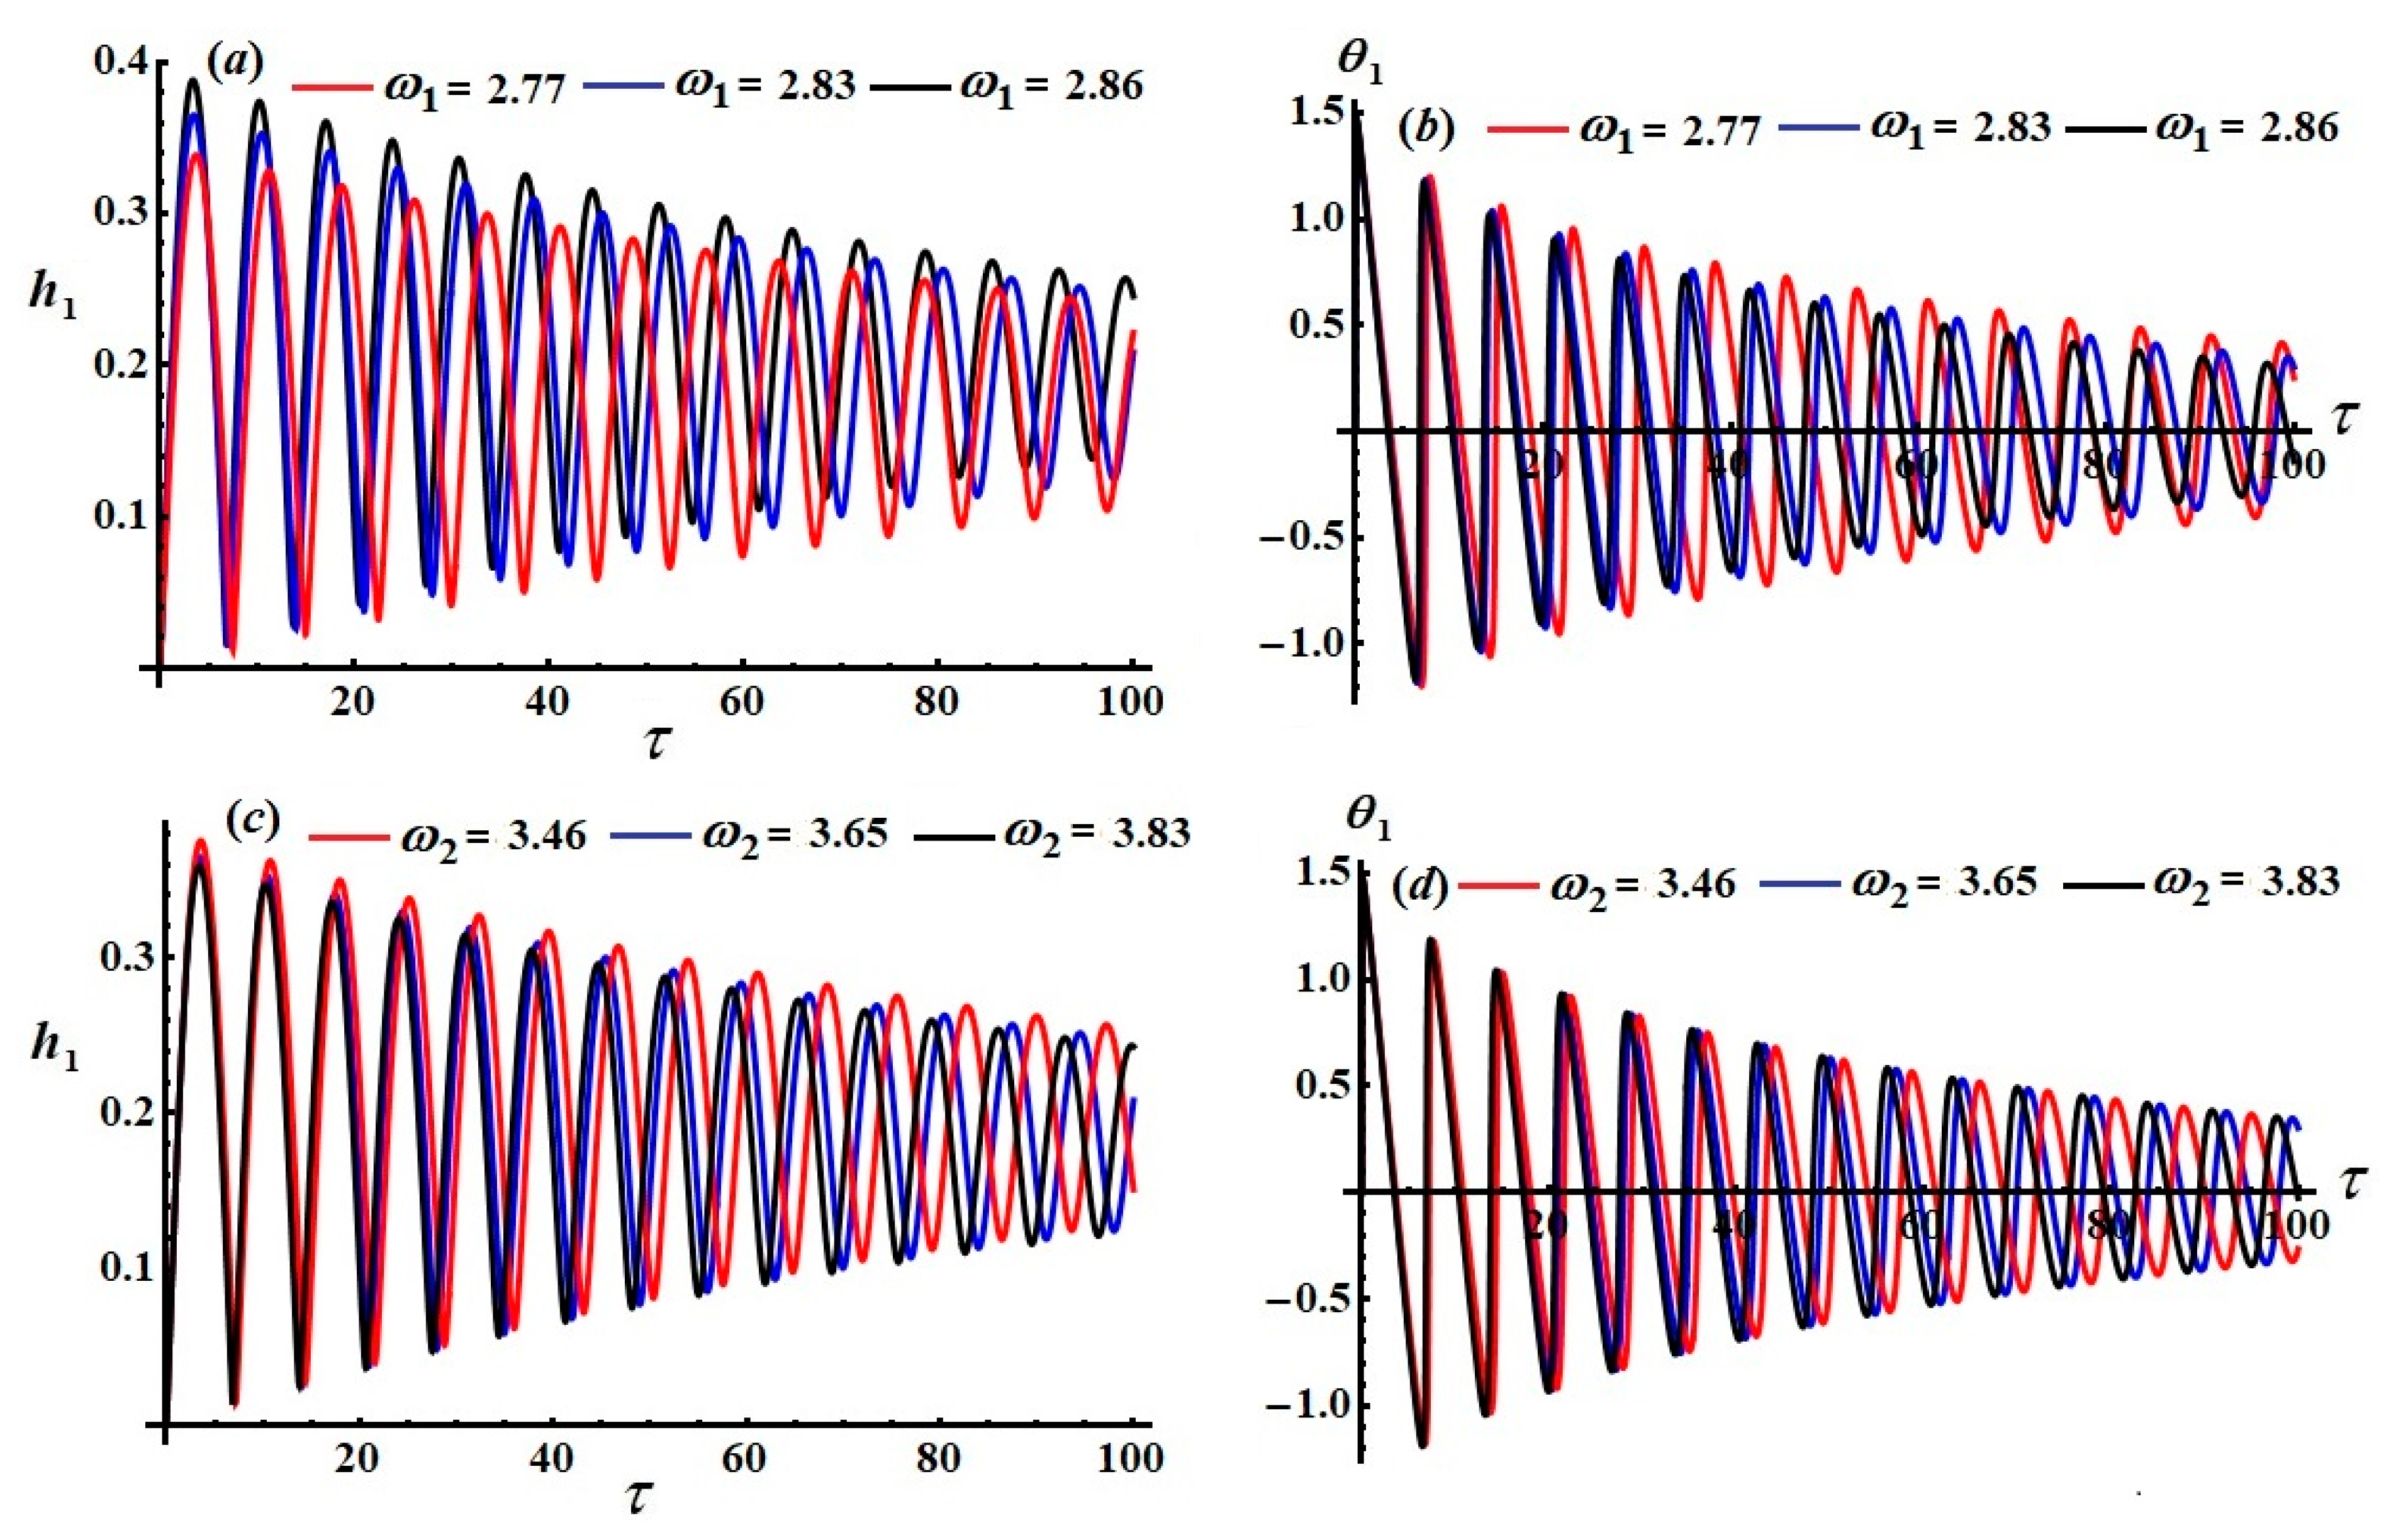
. The above system (34) can be solved numerically as an initial value problem. One can predict that
and
will decay before reaching a stable behavior. Their plots as a function of
are drawn in
Figure 2 and
Figure 3 for selected values of
, where we used
In these figures, one can see the time variations in
and
for various values of
and the above values of the other parameters. The curves in
Figure 2 exhibit decay over the analyzed time interval, with the decay becoming faster when
increases.
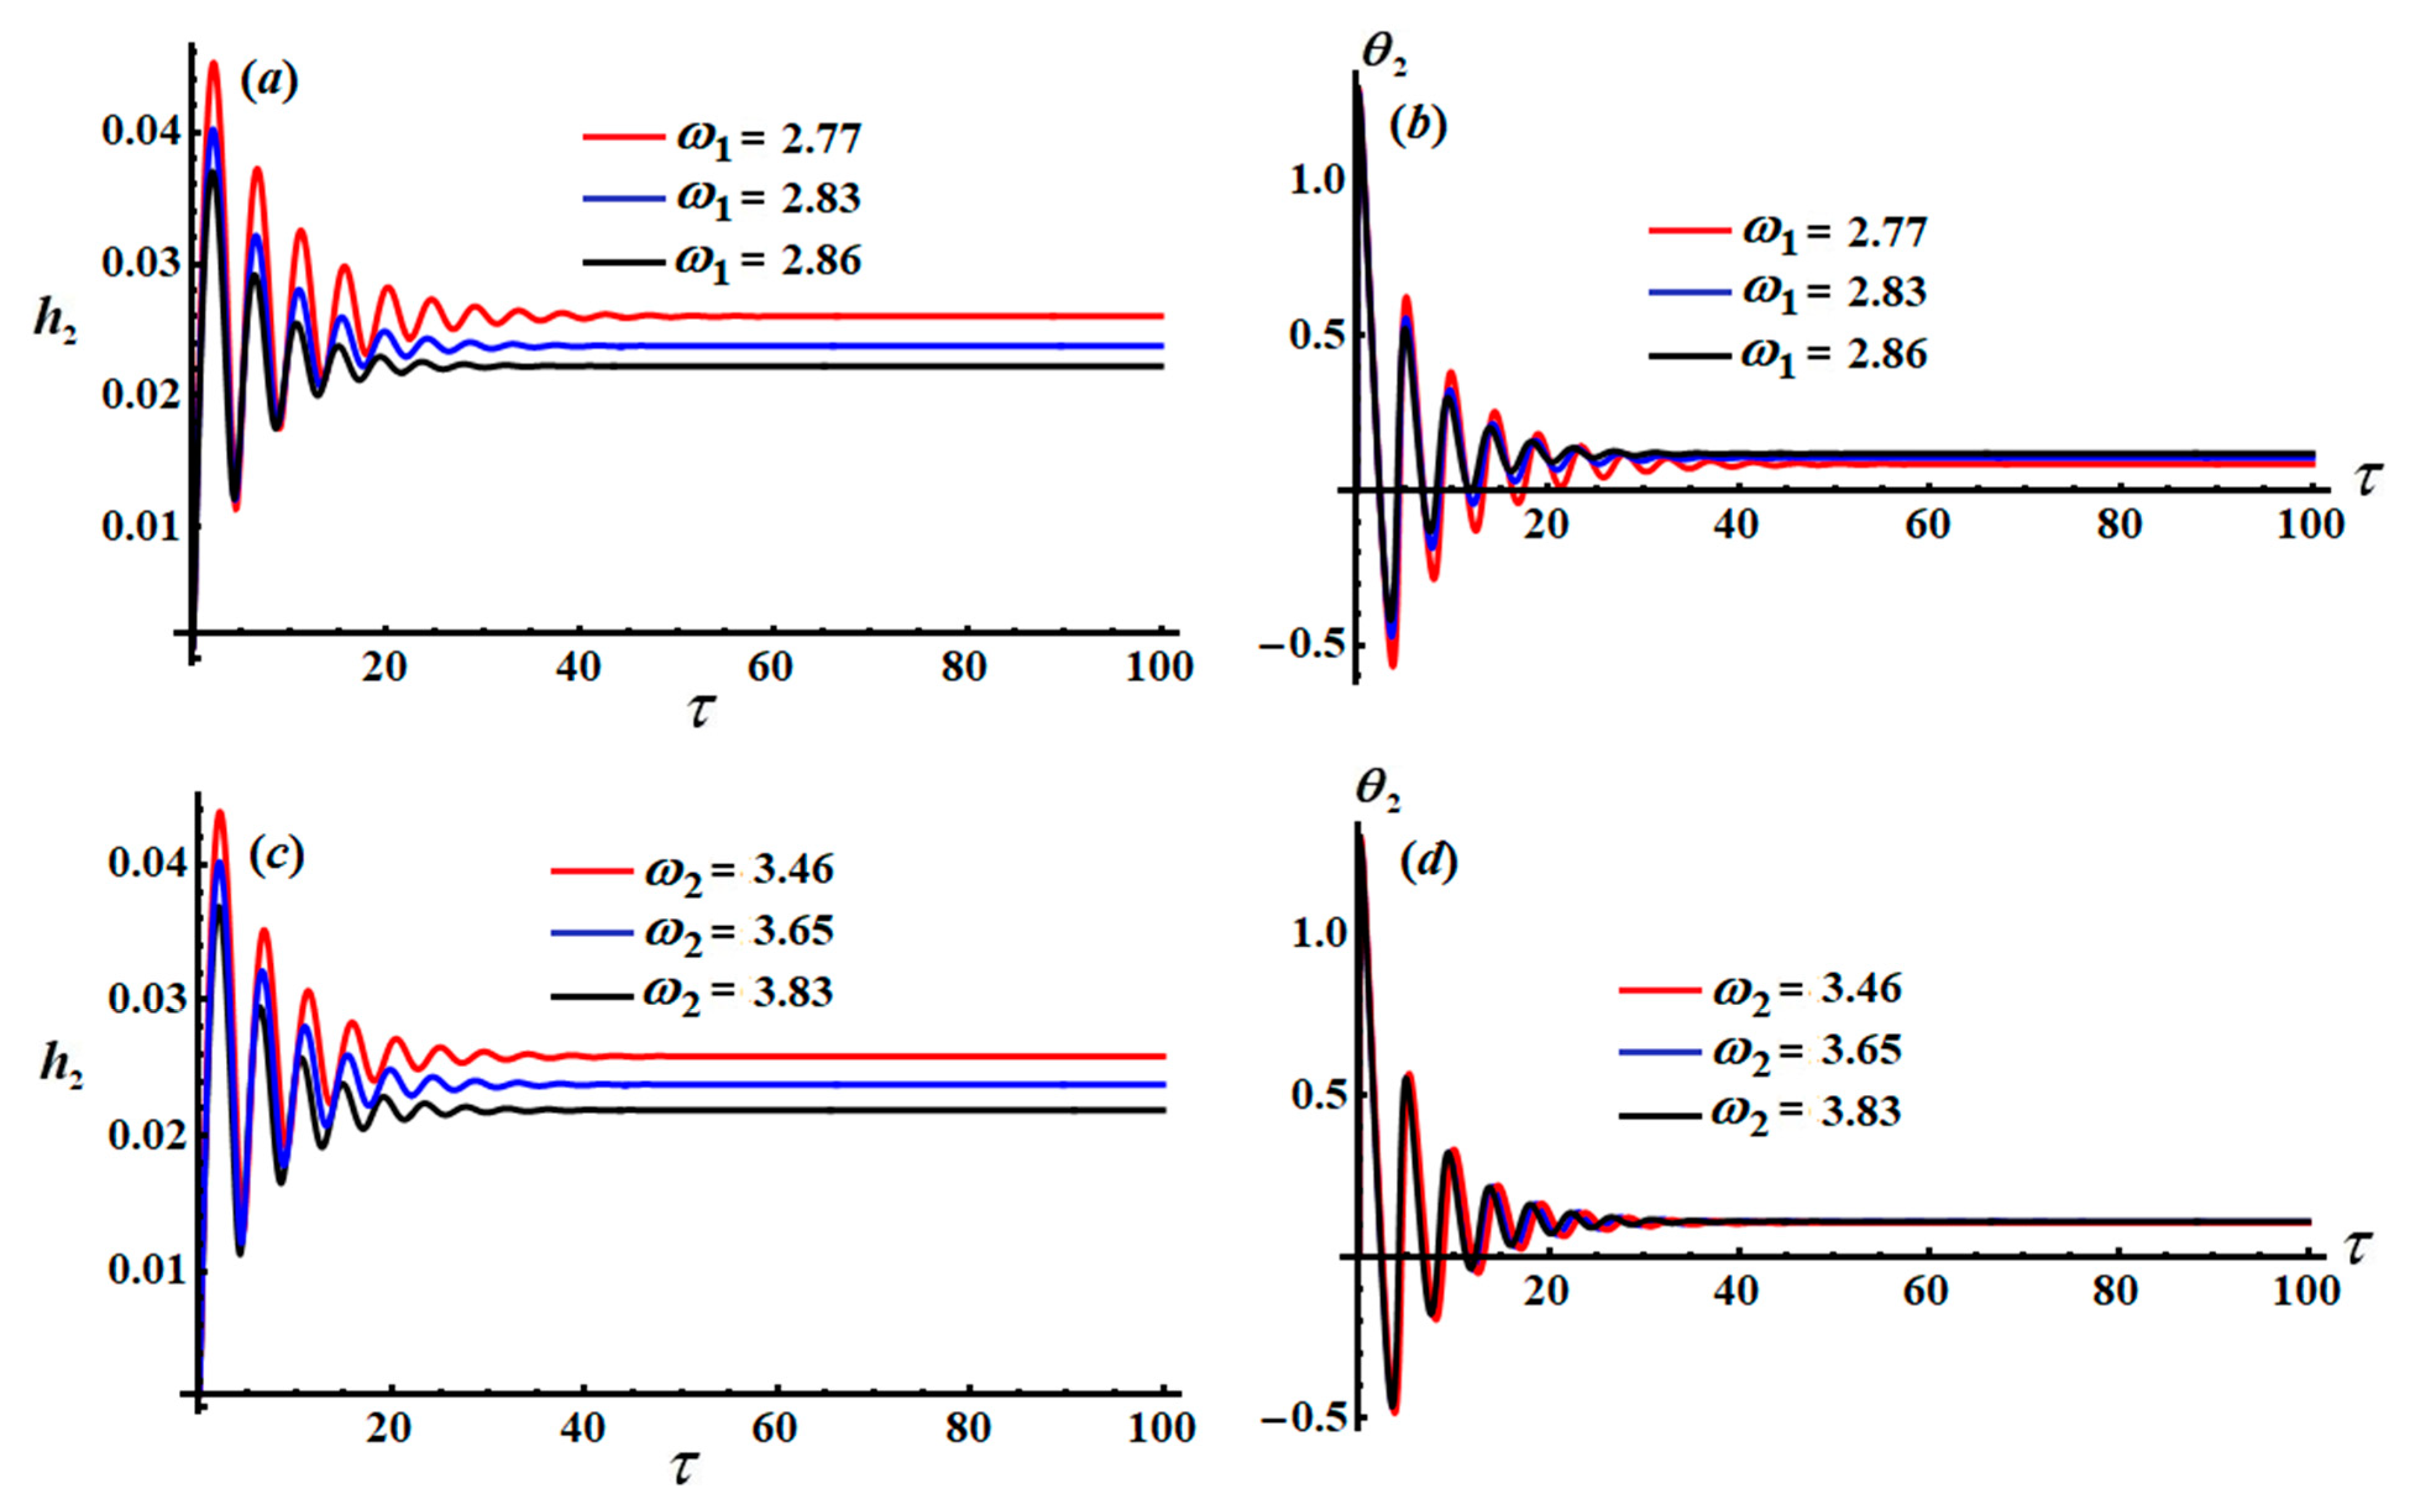
The variations in the functions
and
are shown in
Figure 3. In
Figure 3a–d, these waves are shown for
and
. The chosen values for
are calculated according to the dimensionless parameters in view of selected values of their related parameters, such as the masses
and
and the stiffness coefficient
.
Figure 3a shows that, for the selected values of
, the curves oscillate in the first quarter of the examined time interval, and then decay with the increase in
. The oscillations rapidly diminished with the curves becoming stationary after the sconed quarter. The amplitudes of the plotted waves decrease with the increase in
. This holds for different values of
, as shown in
Figure 3c. On the other hand,
Figure 3b,d illustrate the similarity between the behavior of
for different values of
and
. This similarity is to be expected from examining Equation (34). At all times, the behavior of the modified phase
and amplitude
is stable and free of chaos.
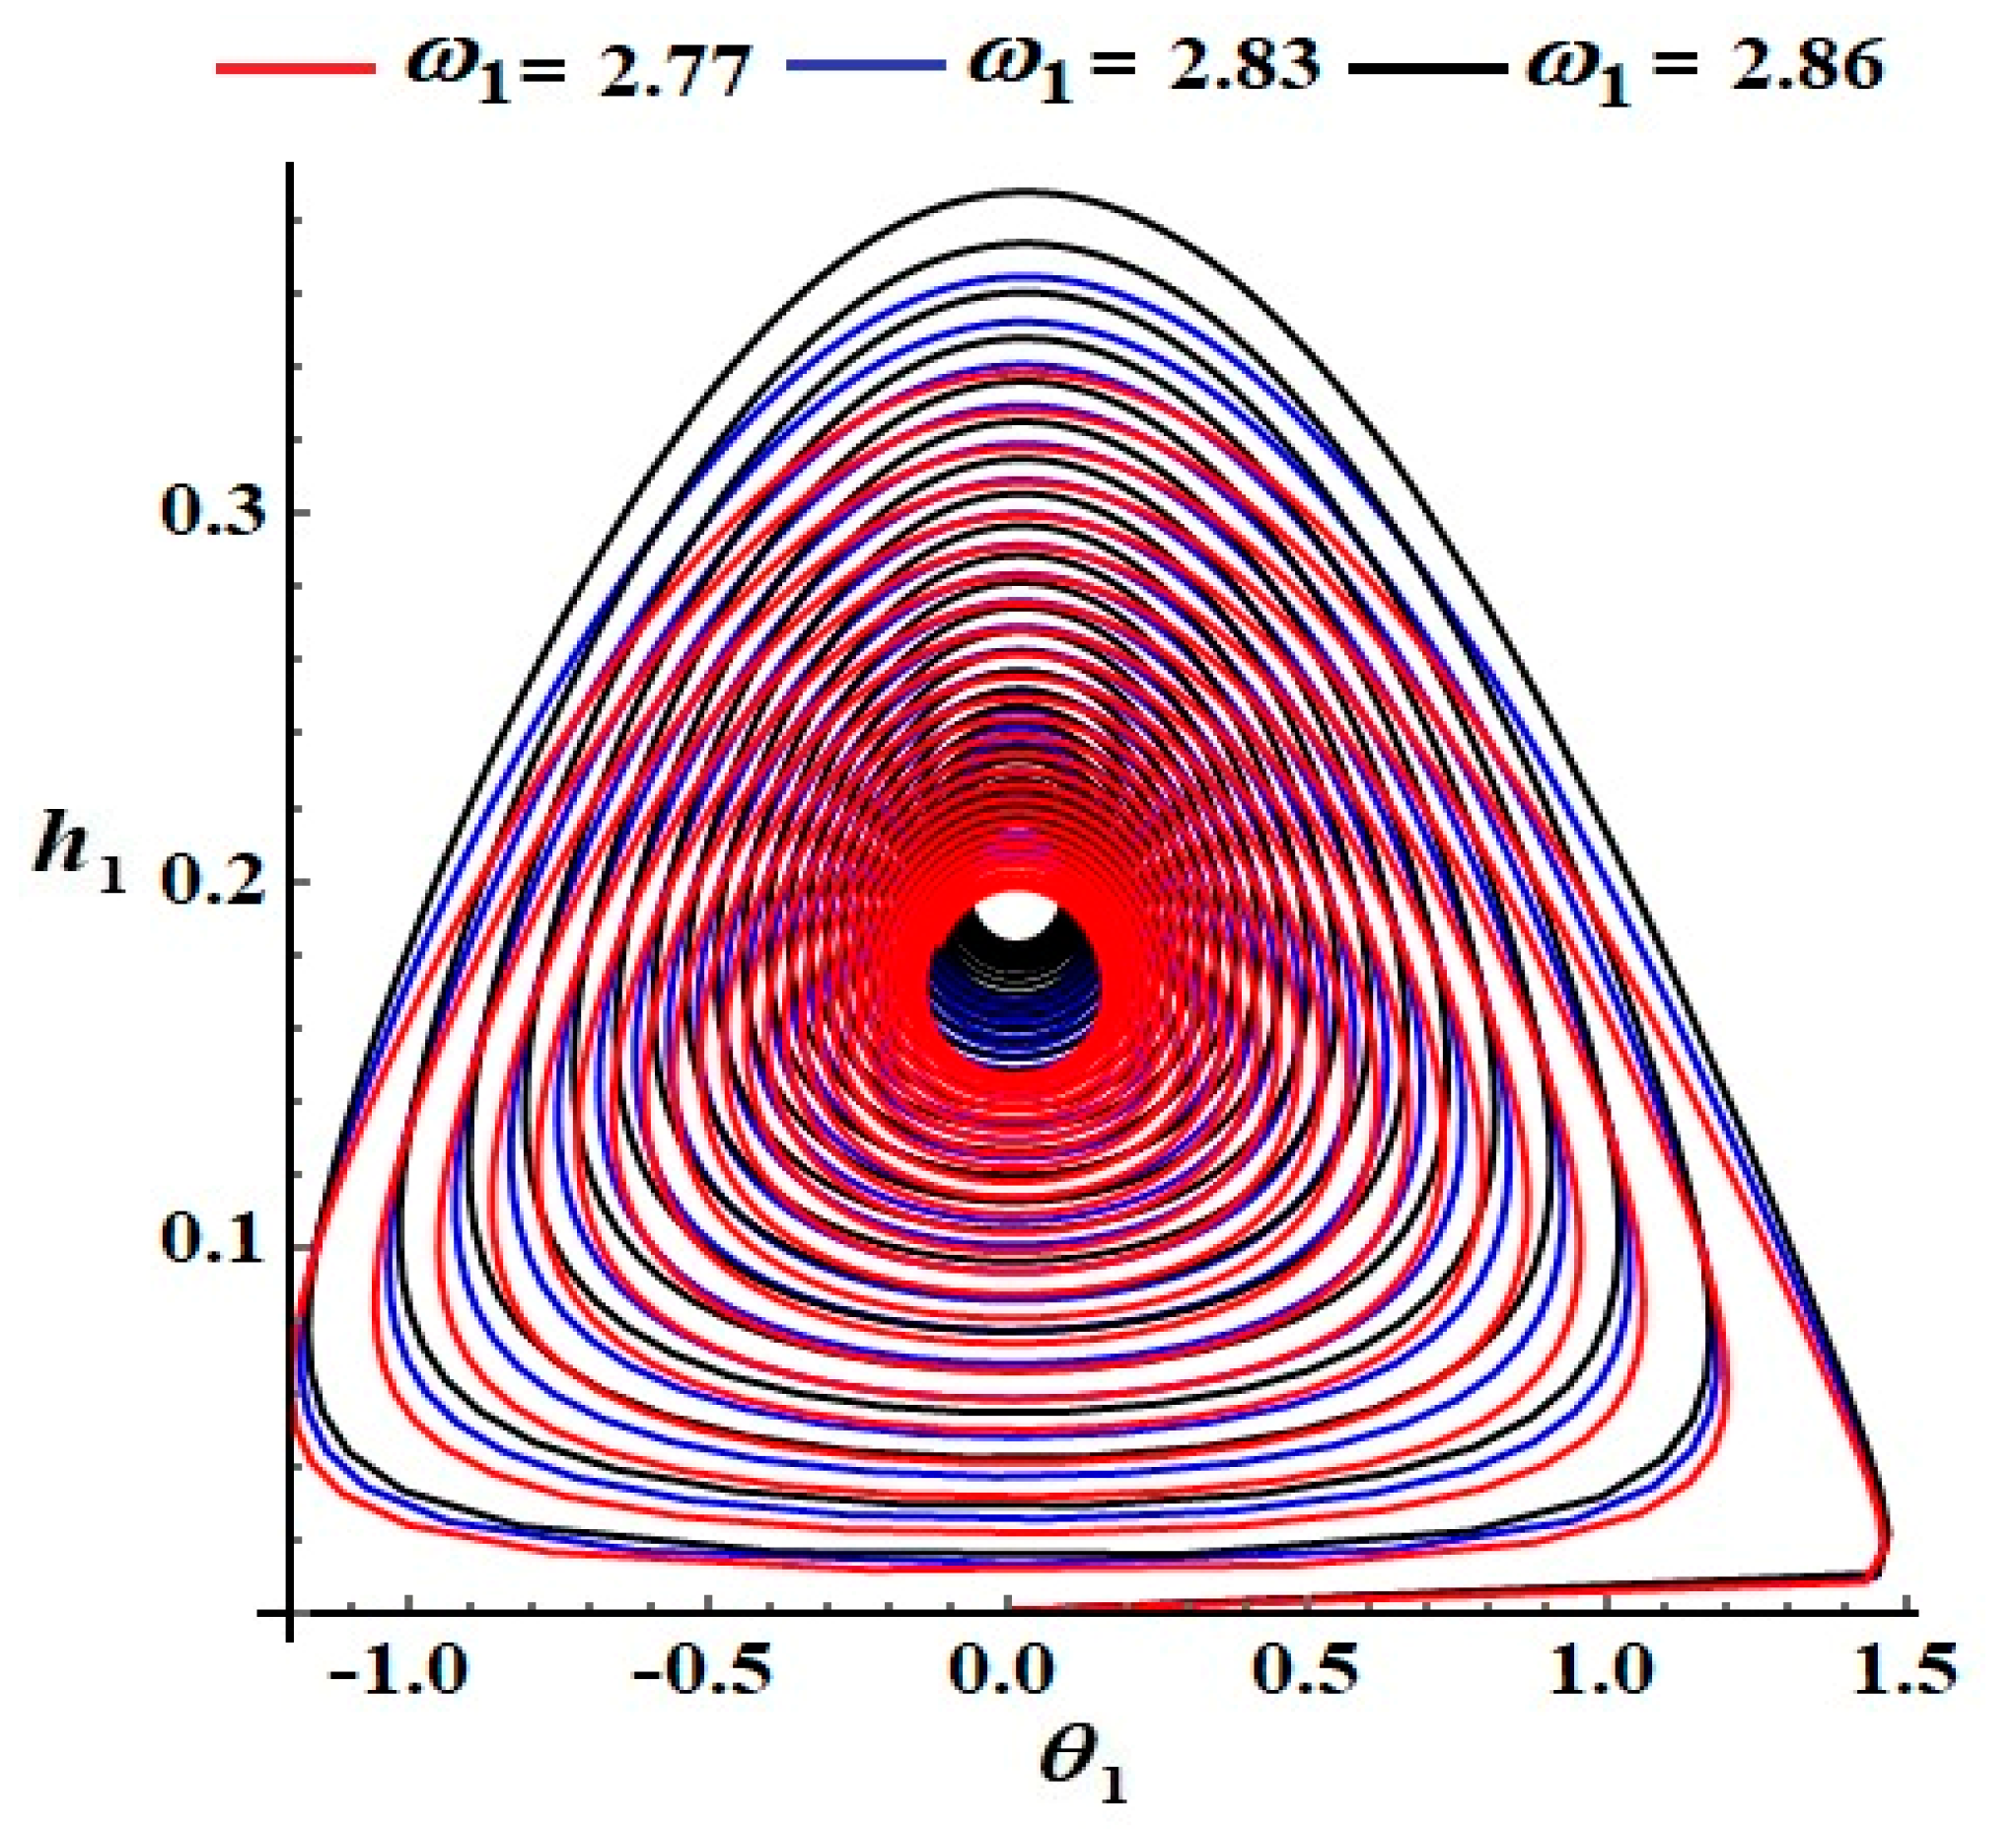
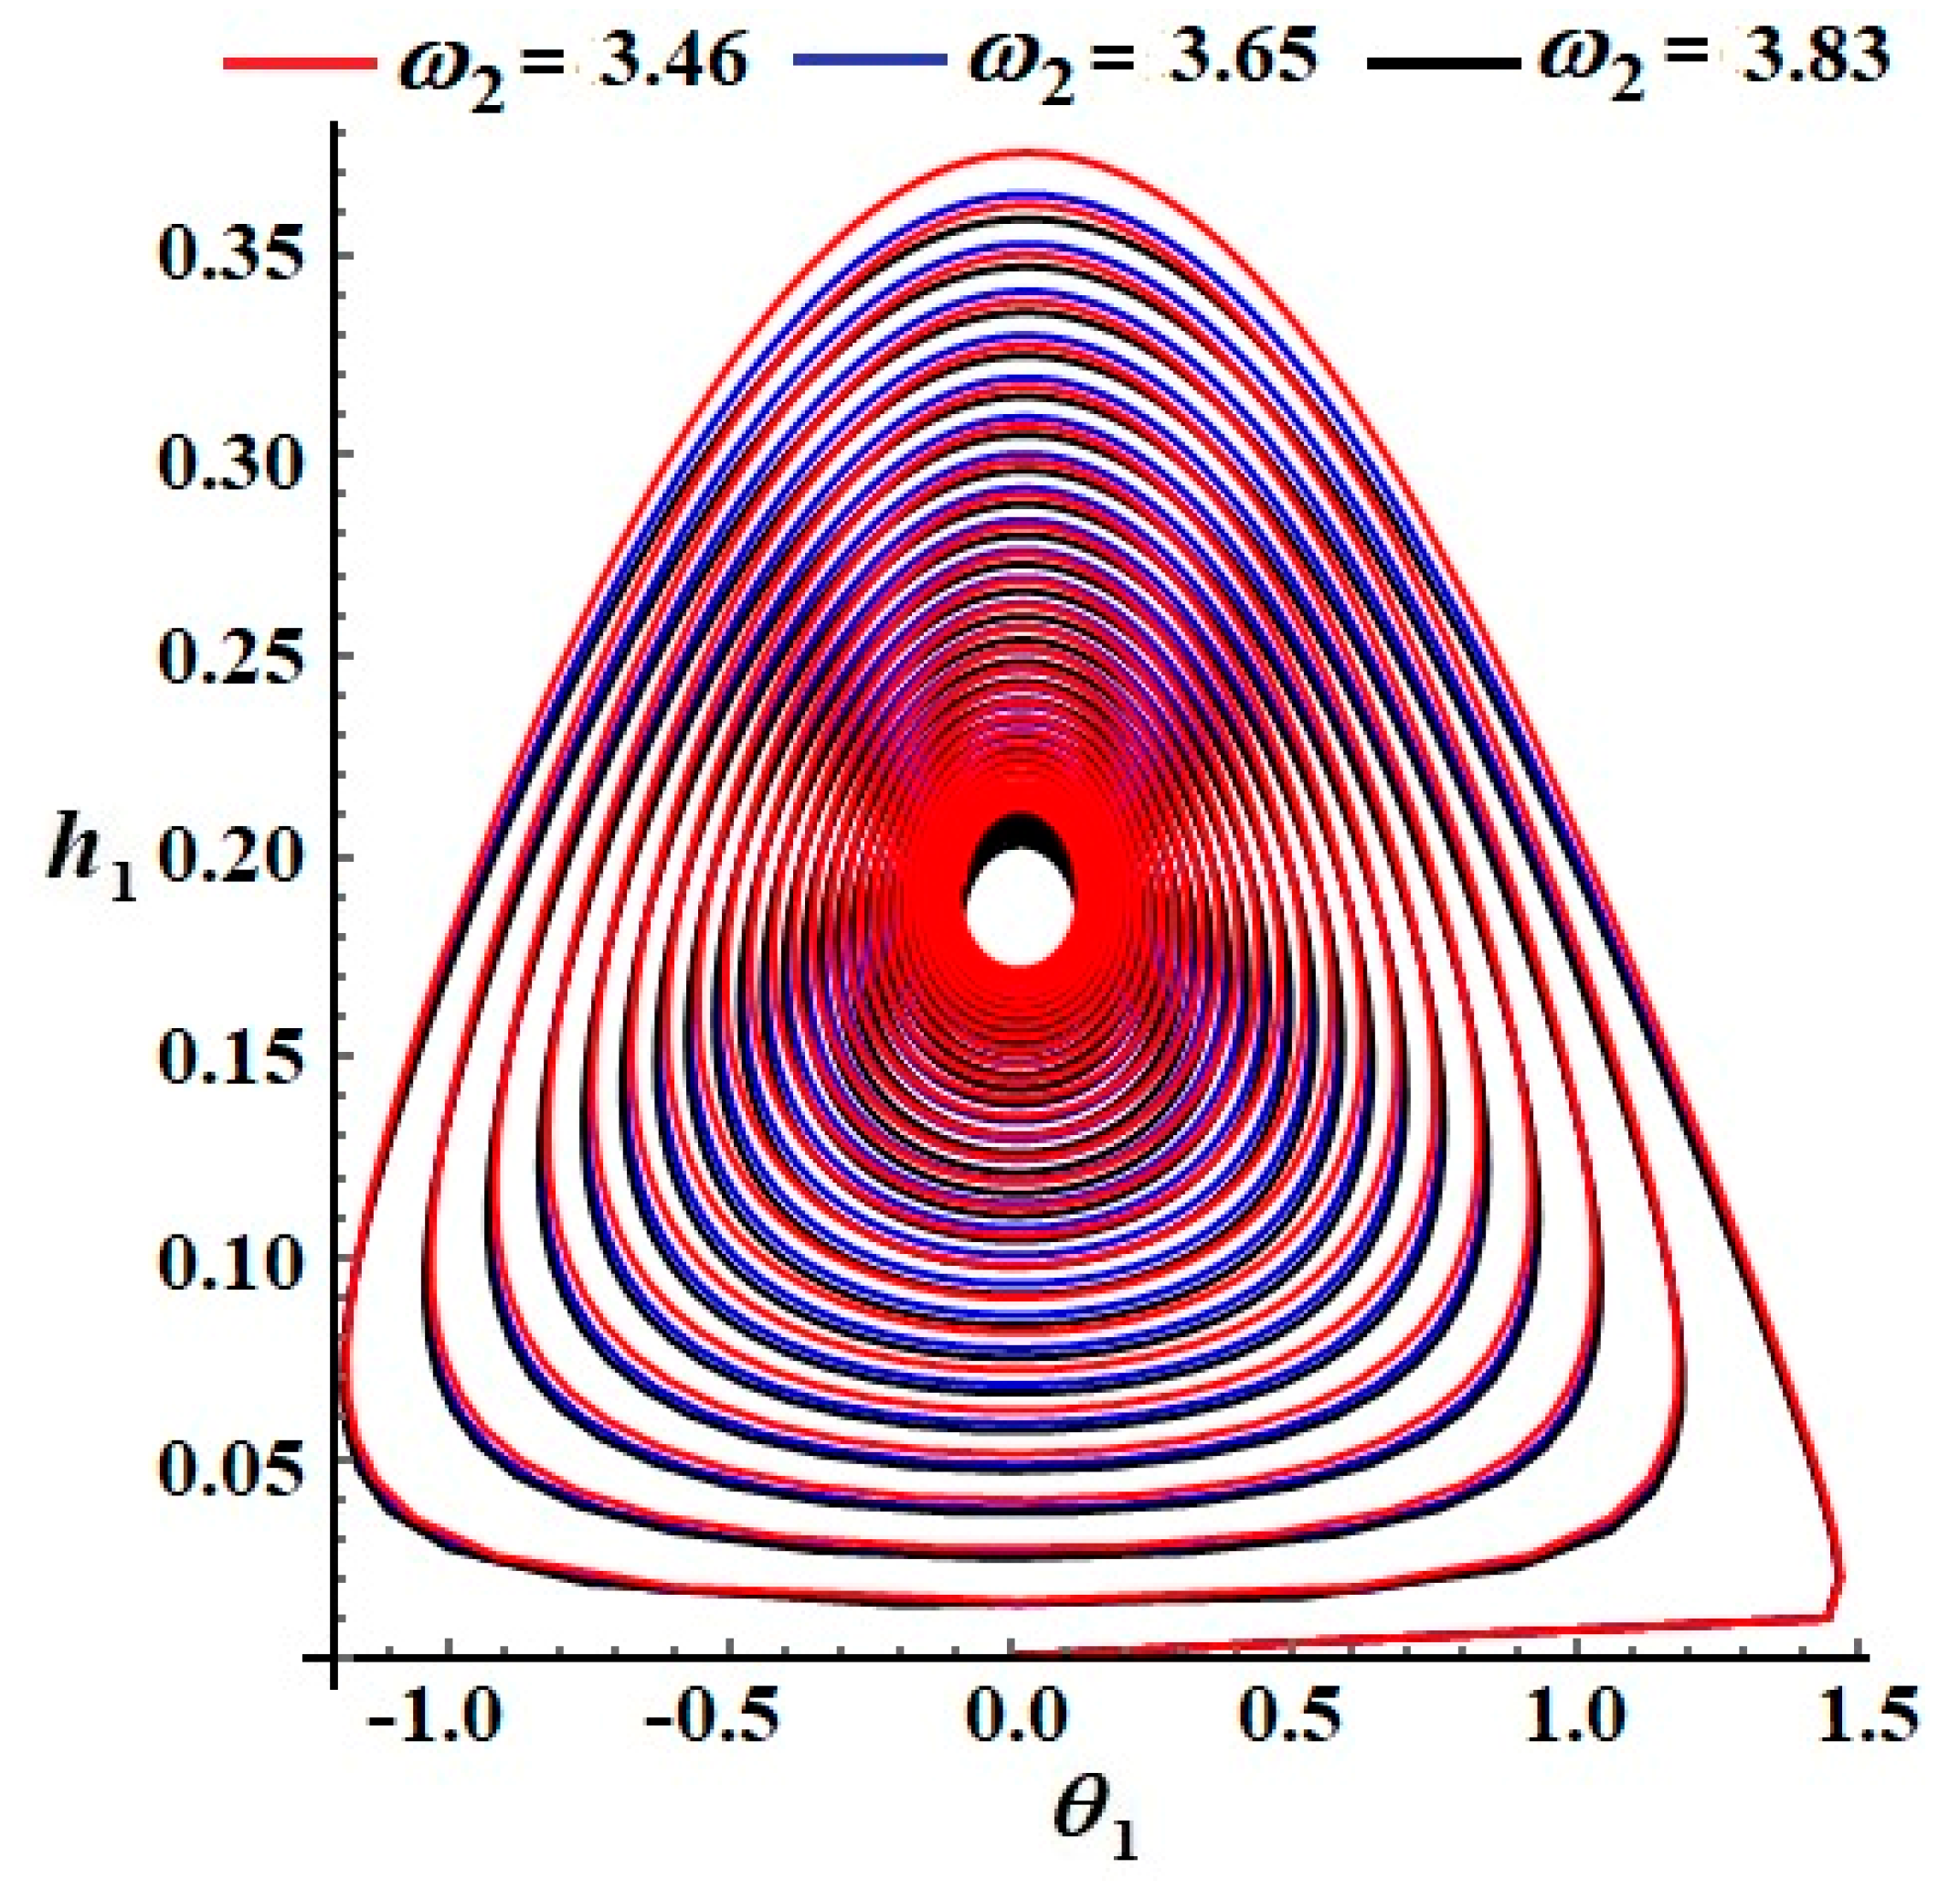
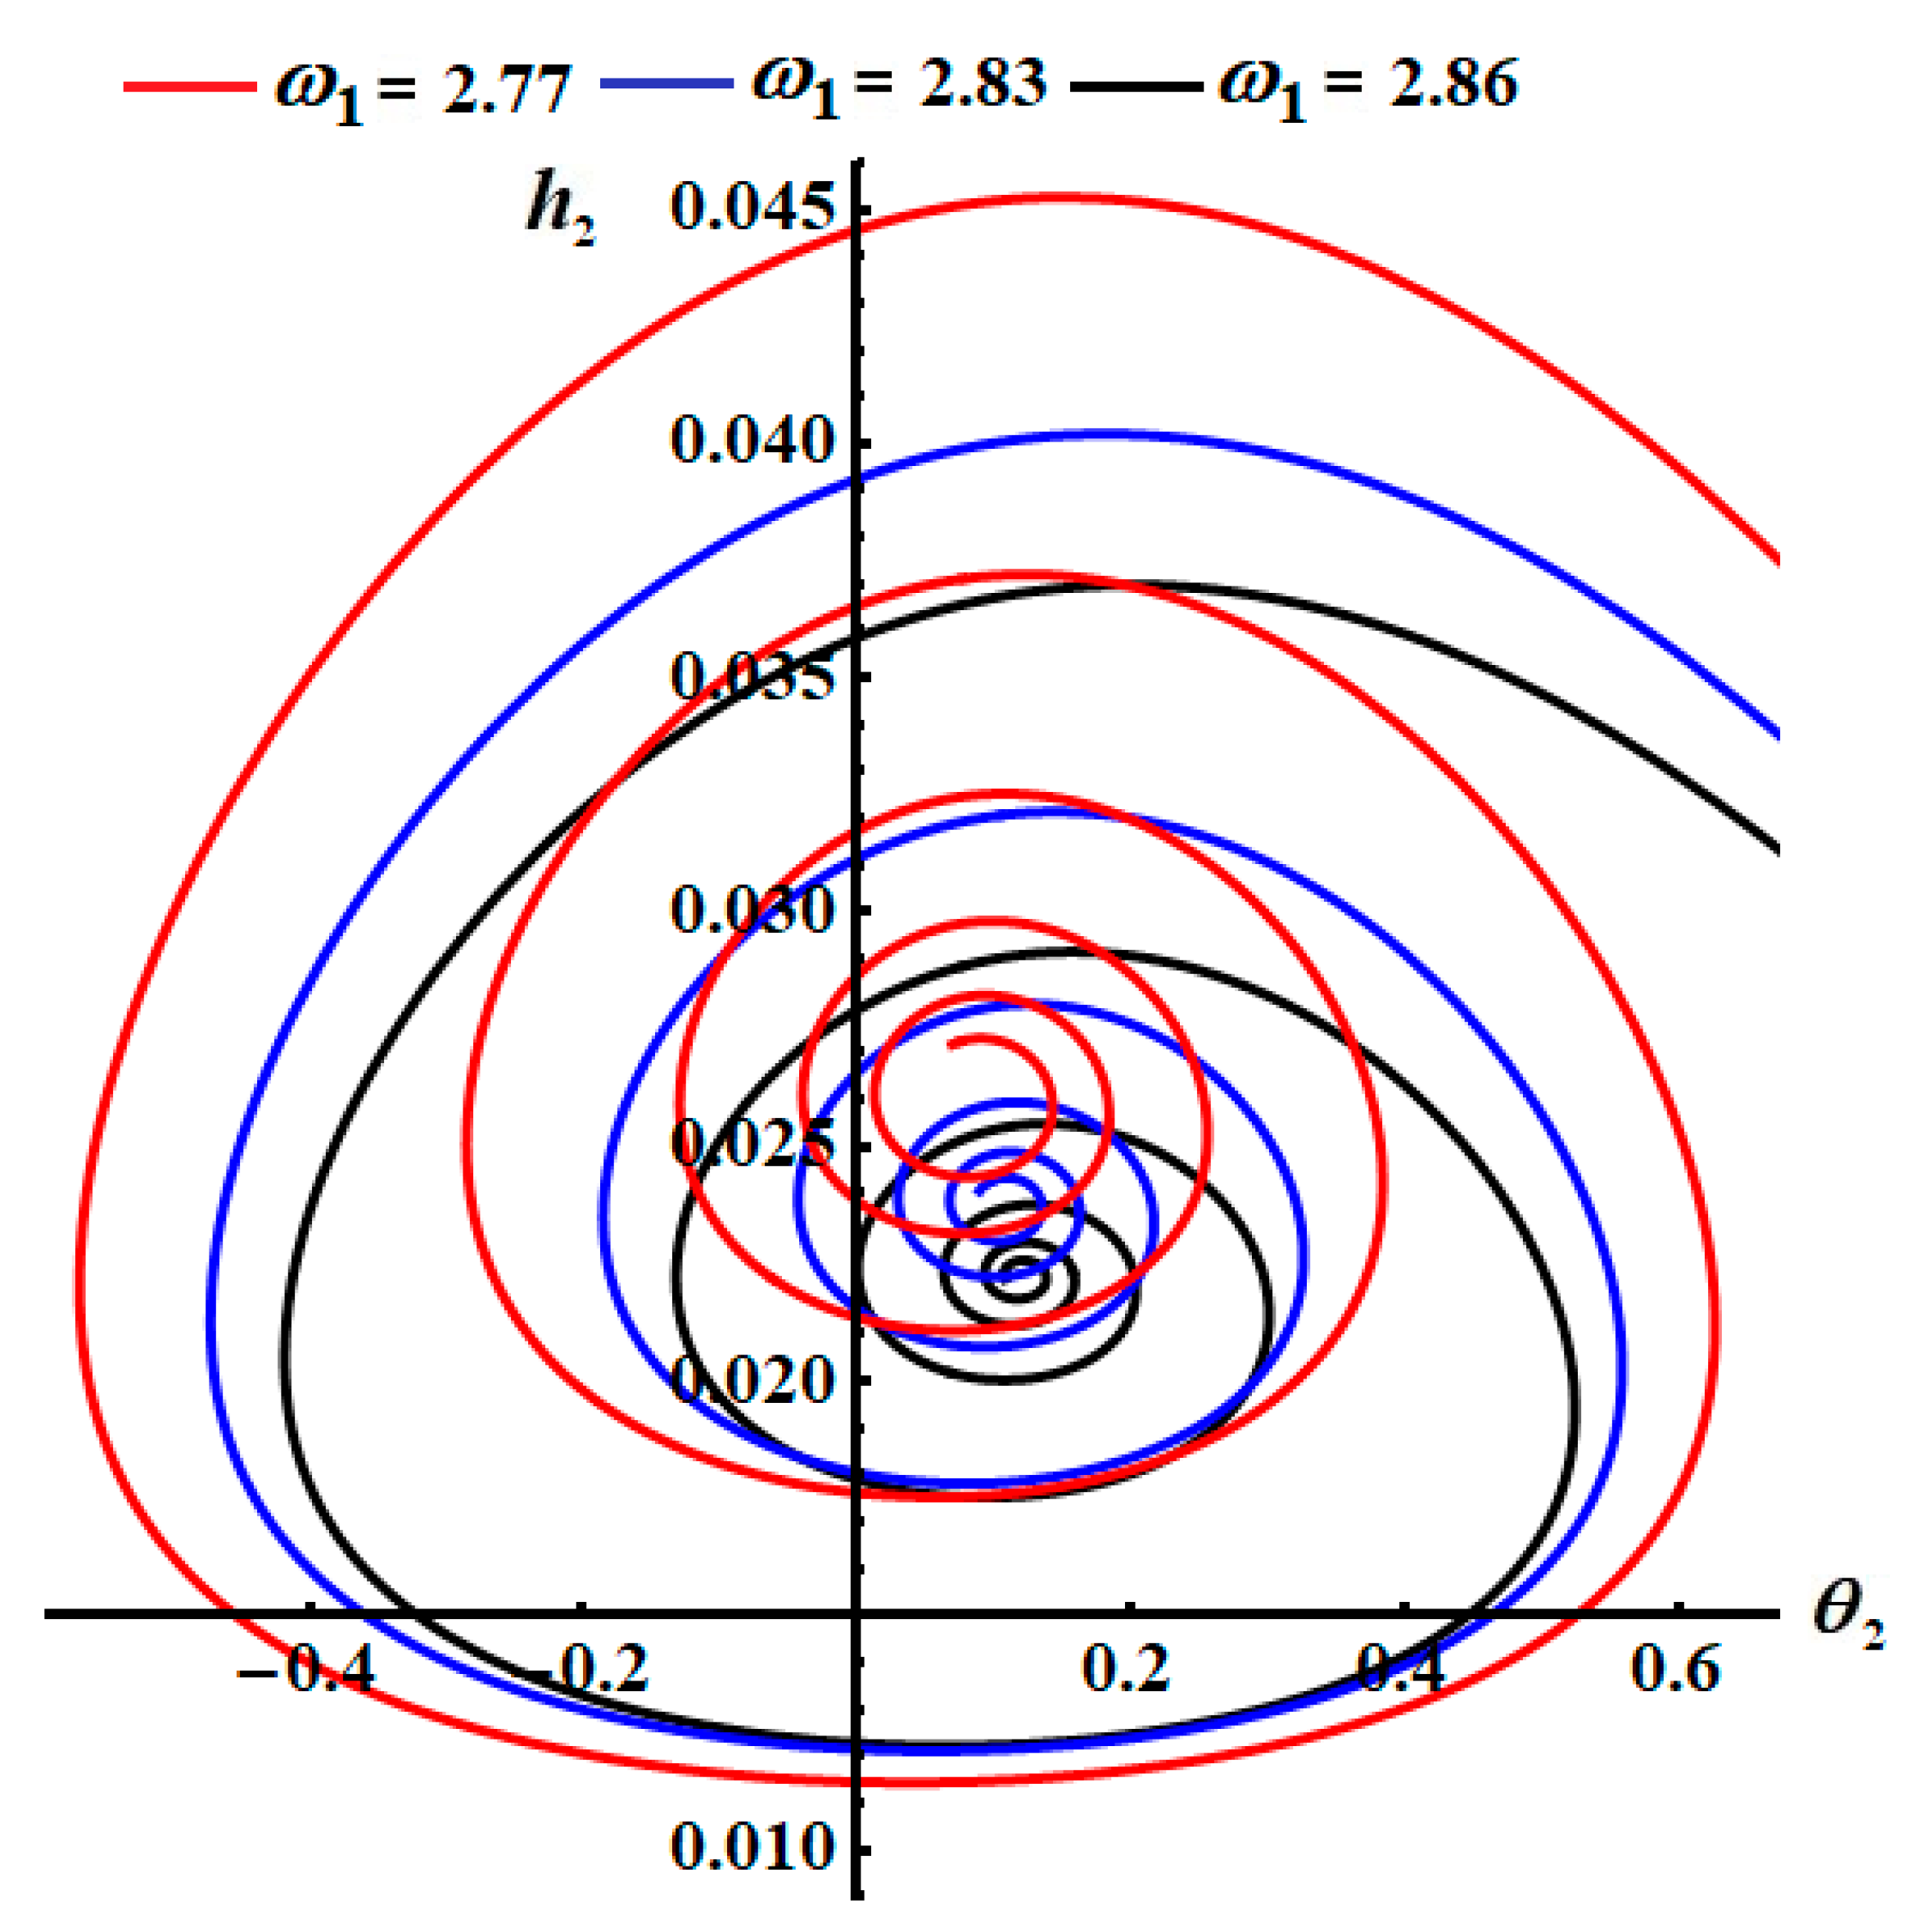
The stable behavior of the waves drawn in the previous figures can be verified by drawing the corresponding phase plane diagrams. This can be achieved by dropping time from these plots, obtaining phase curves in the
plane
, shown in
Figure 4,
Figure 5,
Figure 6 and
Figure 7. The curves in
Figure 4 and
Figure 5 use the same values of
and
, respectively, used in
Figure 2 and
Figure 3. These curves have the form of spiral paths, directed towards a single point, indicating that these trajectories exhibit a stable behavior. In
Figure 6 and
Figure 7, the curves in the
phase plane are drawn for the same values of
and
. Each of these curves spirals to one point, indicating stability in this case also.
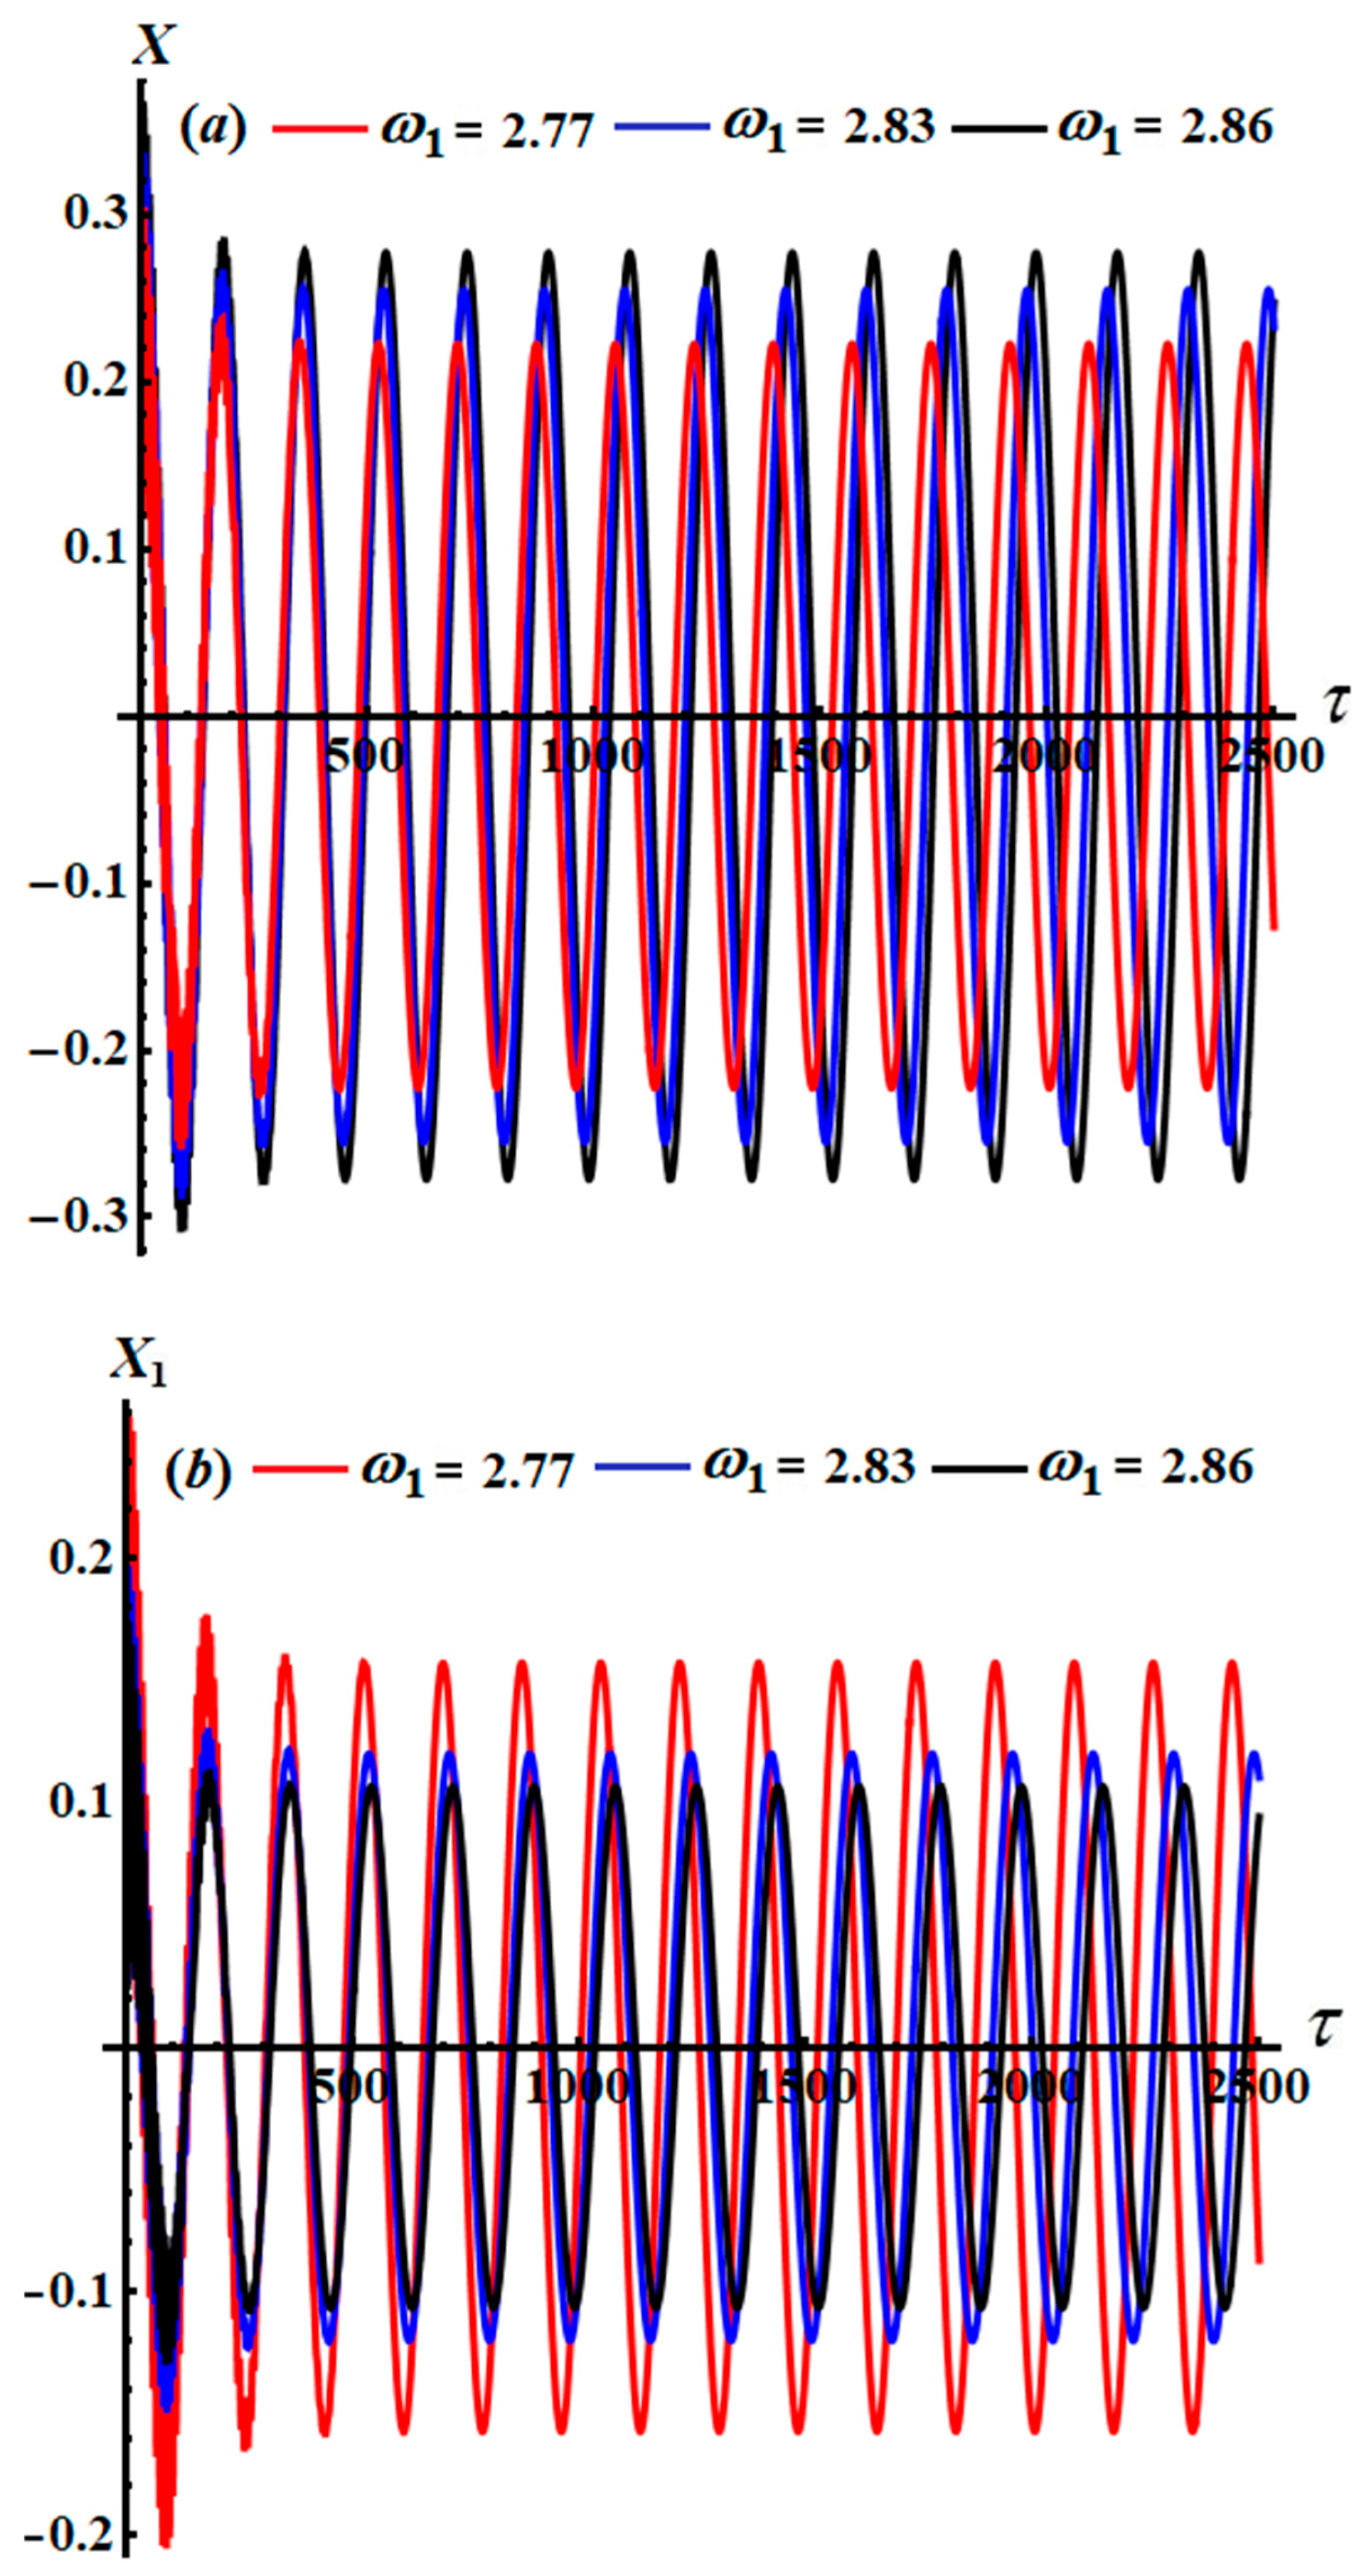
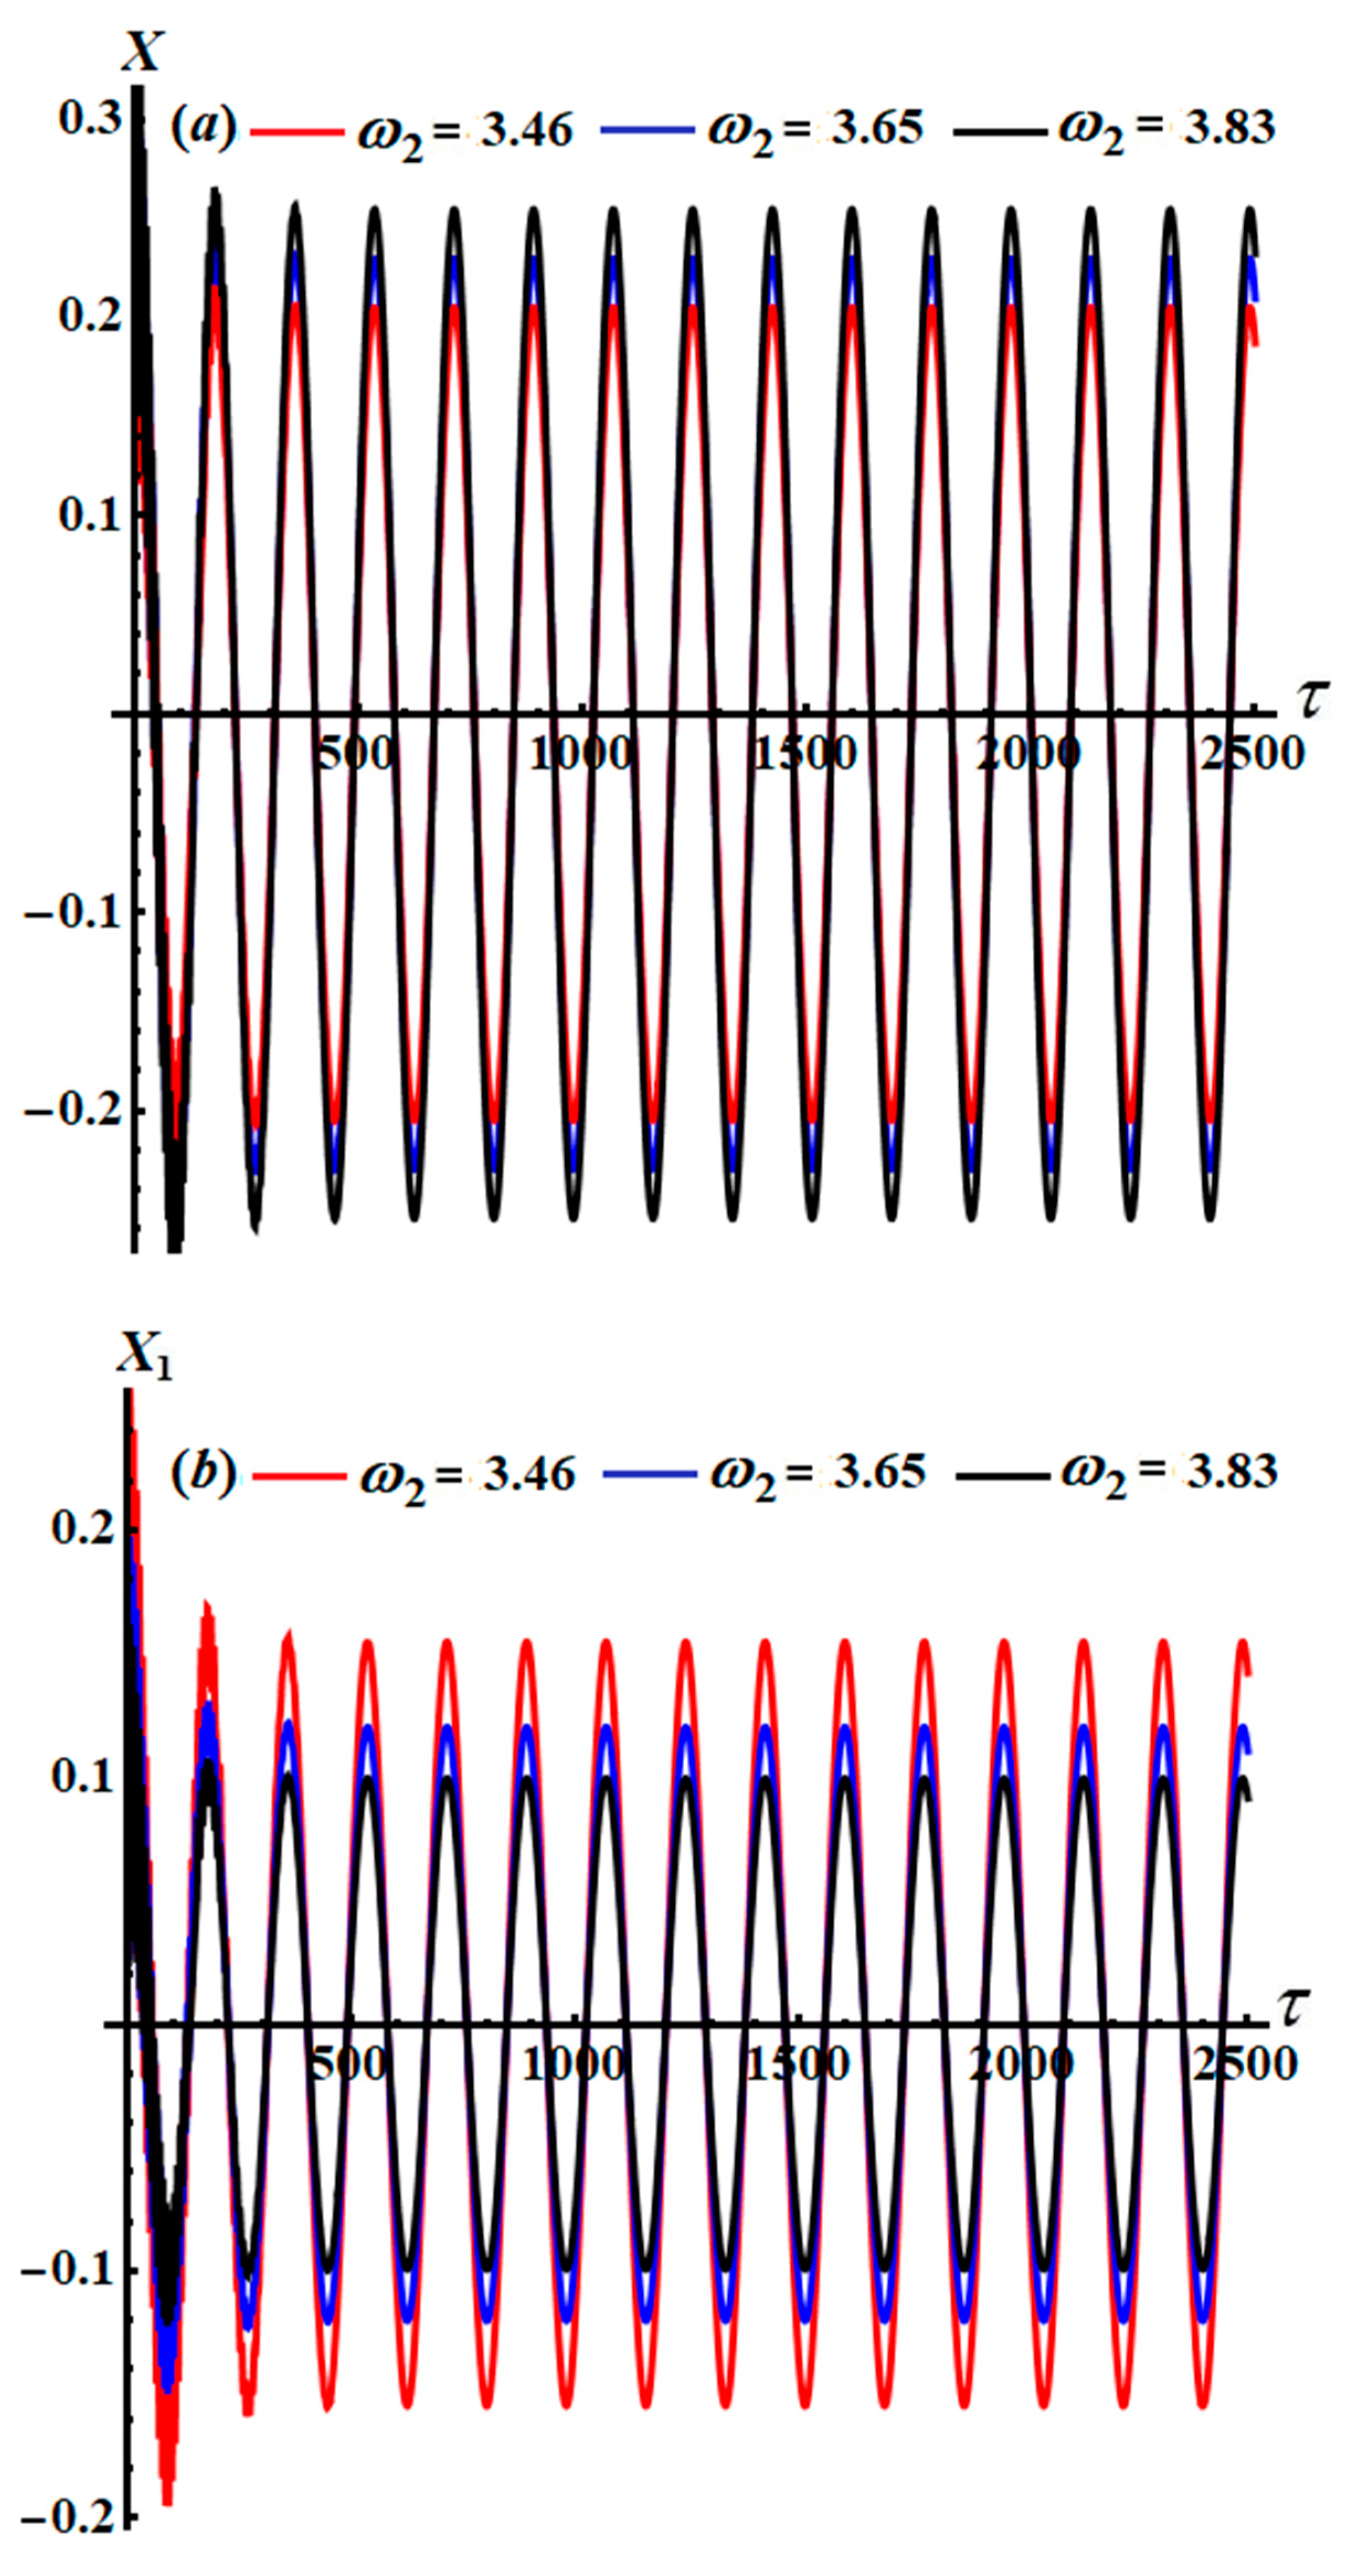
The time behavior of the AS is shown graphically in
Figure 8 and
Figure 9, where the same values of
as above were used. The included waves in these figures initially have fast vibrations, and then they have periodic behaviors. From
Figure 8a, we can see that the amplitudes of these waves increase with higher values of
, while the number of oscillations decreases to some extent. On the other hand, an increase in
produces fast vibrations at the beginning of the studied time interval, after which the curves have the form of periodic oscillations, as seen in
Figure 8b. Furthermore, the oscillation’s amplitude decreases with the rise in
, and their number increases slightly. Standing periodic waves are observed for the curves in
Figure 9 for different values of
. The waves’ amplitudes increase and decrease when
increases, as seen in
Figure 9a and
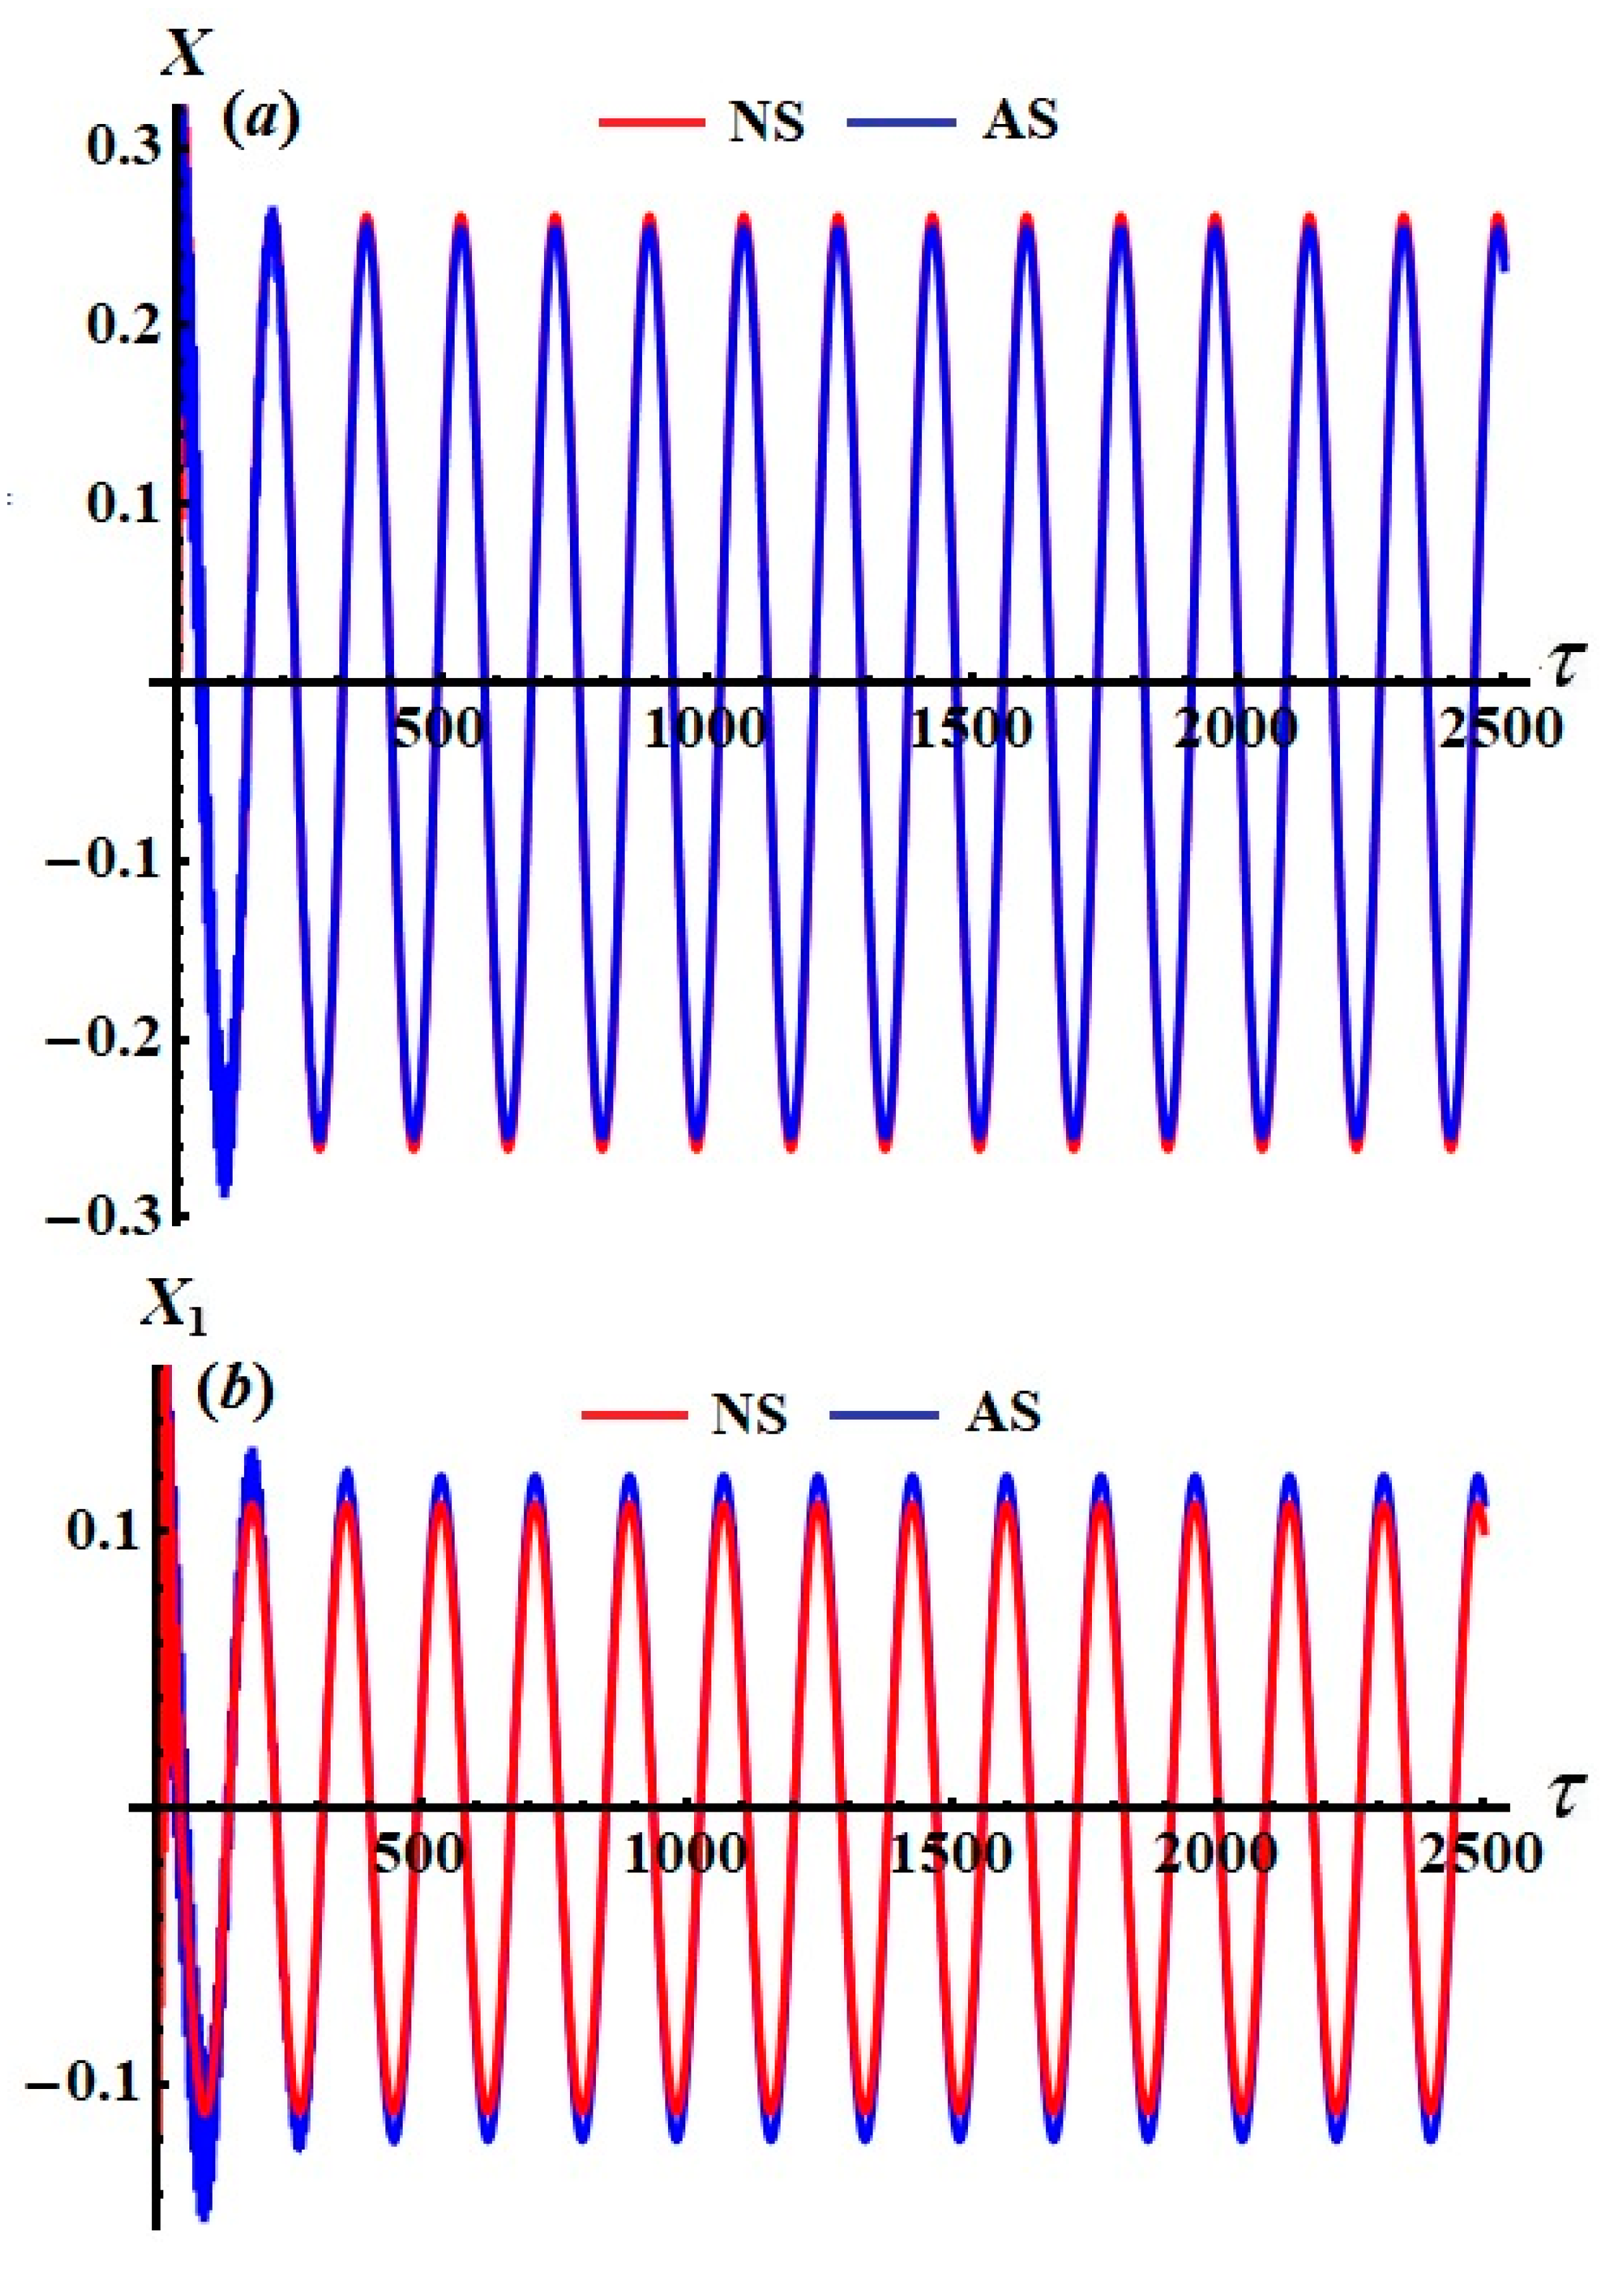
Figure 9b, respectively. Moreover, these waves have the same wavelength and number of oscillations. The NS of the original EOMs were calculated using the Runge–Kutta method and compared to the achieved AS when
, as shown in
Figure 10. A detailed examination of the figure reveals a strong agreement between AS and NS, indicating a high level of consistency between them.
5. Solutions at the Steady-State Situation
The major aim of this section is to examine the oscillations of the model at the steady state. Studying the solutions for the steady state of a vibrating dynamical system is highly useful for several reasons:
The steady-state response represents the long-term behavior of the system after any transients have died out. This is important for predicting how the system will behave over time in a real-world situation. Engineers and designers can use the solutions in this case to design systems that meet specific performance criteria, ensuring that the system operates safely and efficiently under steady-state conditions. Additionally, the analysis of the steady-state solution can help in identifying resonant frequencies where the system’s response can become excessively large, potentially leading to failure. Such analysis also aids in assessing the stability of the system under continuous operation. By understanding the behavior of the steady state, one can optimize the system for energy efficiency. For example, reducing unwanted vibrations can lead to less wear and tear and lower energy consumption. In many applications, the performance of the system is evaluated based on its steady-state response.
The adjusted amplitudes and phases at the steady state can be obtained by setting the derivatives of the left-hand sides of (34) to zero, i.e.,
[
43].
Doing so will provide us with the following algebraic system in
and
Removing the modified phases
and
from (35) produces the two related algebraic equations below with the amplitudes and frequencies and the detuning parameter
.
A great deal of importance is placed on stability evaluation, which is considered one of the most important aspects of oscillations at the steady state. The system’s behavior can be examined near the locations of the fixed points. To accomplish this, we consider small perturbations of the
and
expressed as
where
and
denote the solutions at the steady state, while
and
represent small perturbations.
The process of confirming the accuracy of steady-state solutions usually combines numerical simulation and theoretical study. The following are some typical steps:
Theoretical Analysis: This consist of constructing equations characterizing the behavior of the system by mathematical modeling and theoretical analysis.
Numerical Simulation: Numerical simulations can still play a crucial role in verifying steady-state solutions. Simulations can help to validate whether the system behavior matches the expected steady-state response under various conditions. This involves running simulations with different parameters and initial conditions to confirm that the system indeed settles into the expected steady state.
We may derive the linearized equations by substituting of (37) into (34) to obtain
Note that small perturbations
and
are unknown perturbed functions. Therefore, we can think of each solution as a linear combination of terms of the form
. Here,
are constants, while
is the related eigenvalue, which can easily be obtained. For the solutions
and
to be asymptotically stable, the roots of the following characteristic equation should have a negative real value.
where
are functions of
and
, expressed by
By Routh–Hurwitz conditions, the necessary and sufficient conditions for stability are
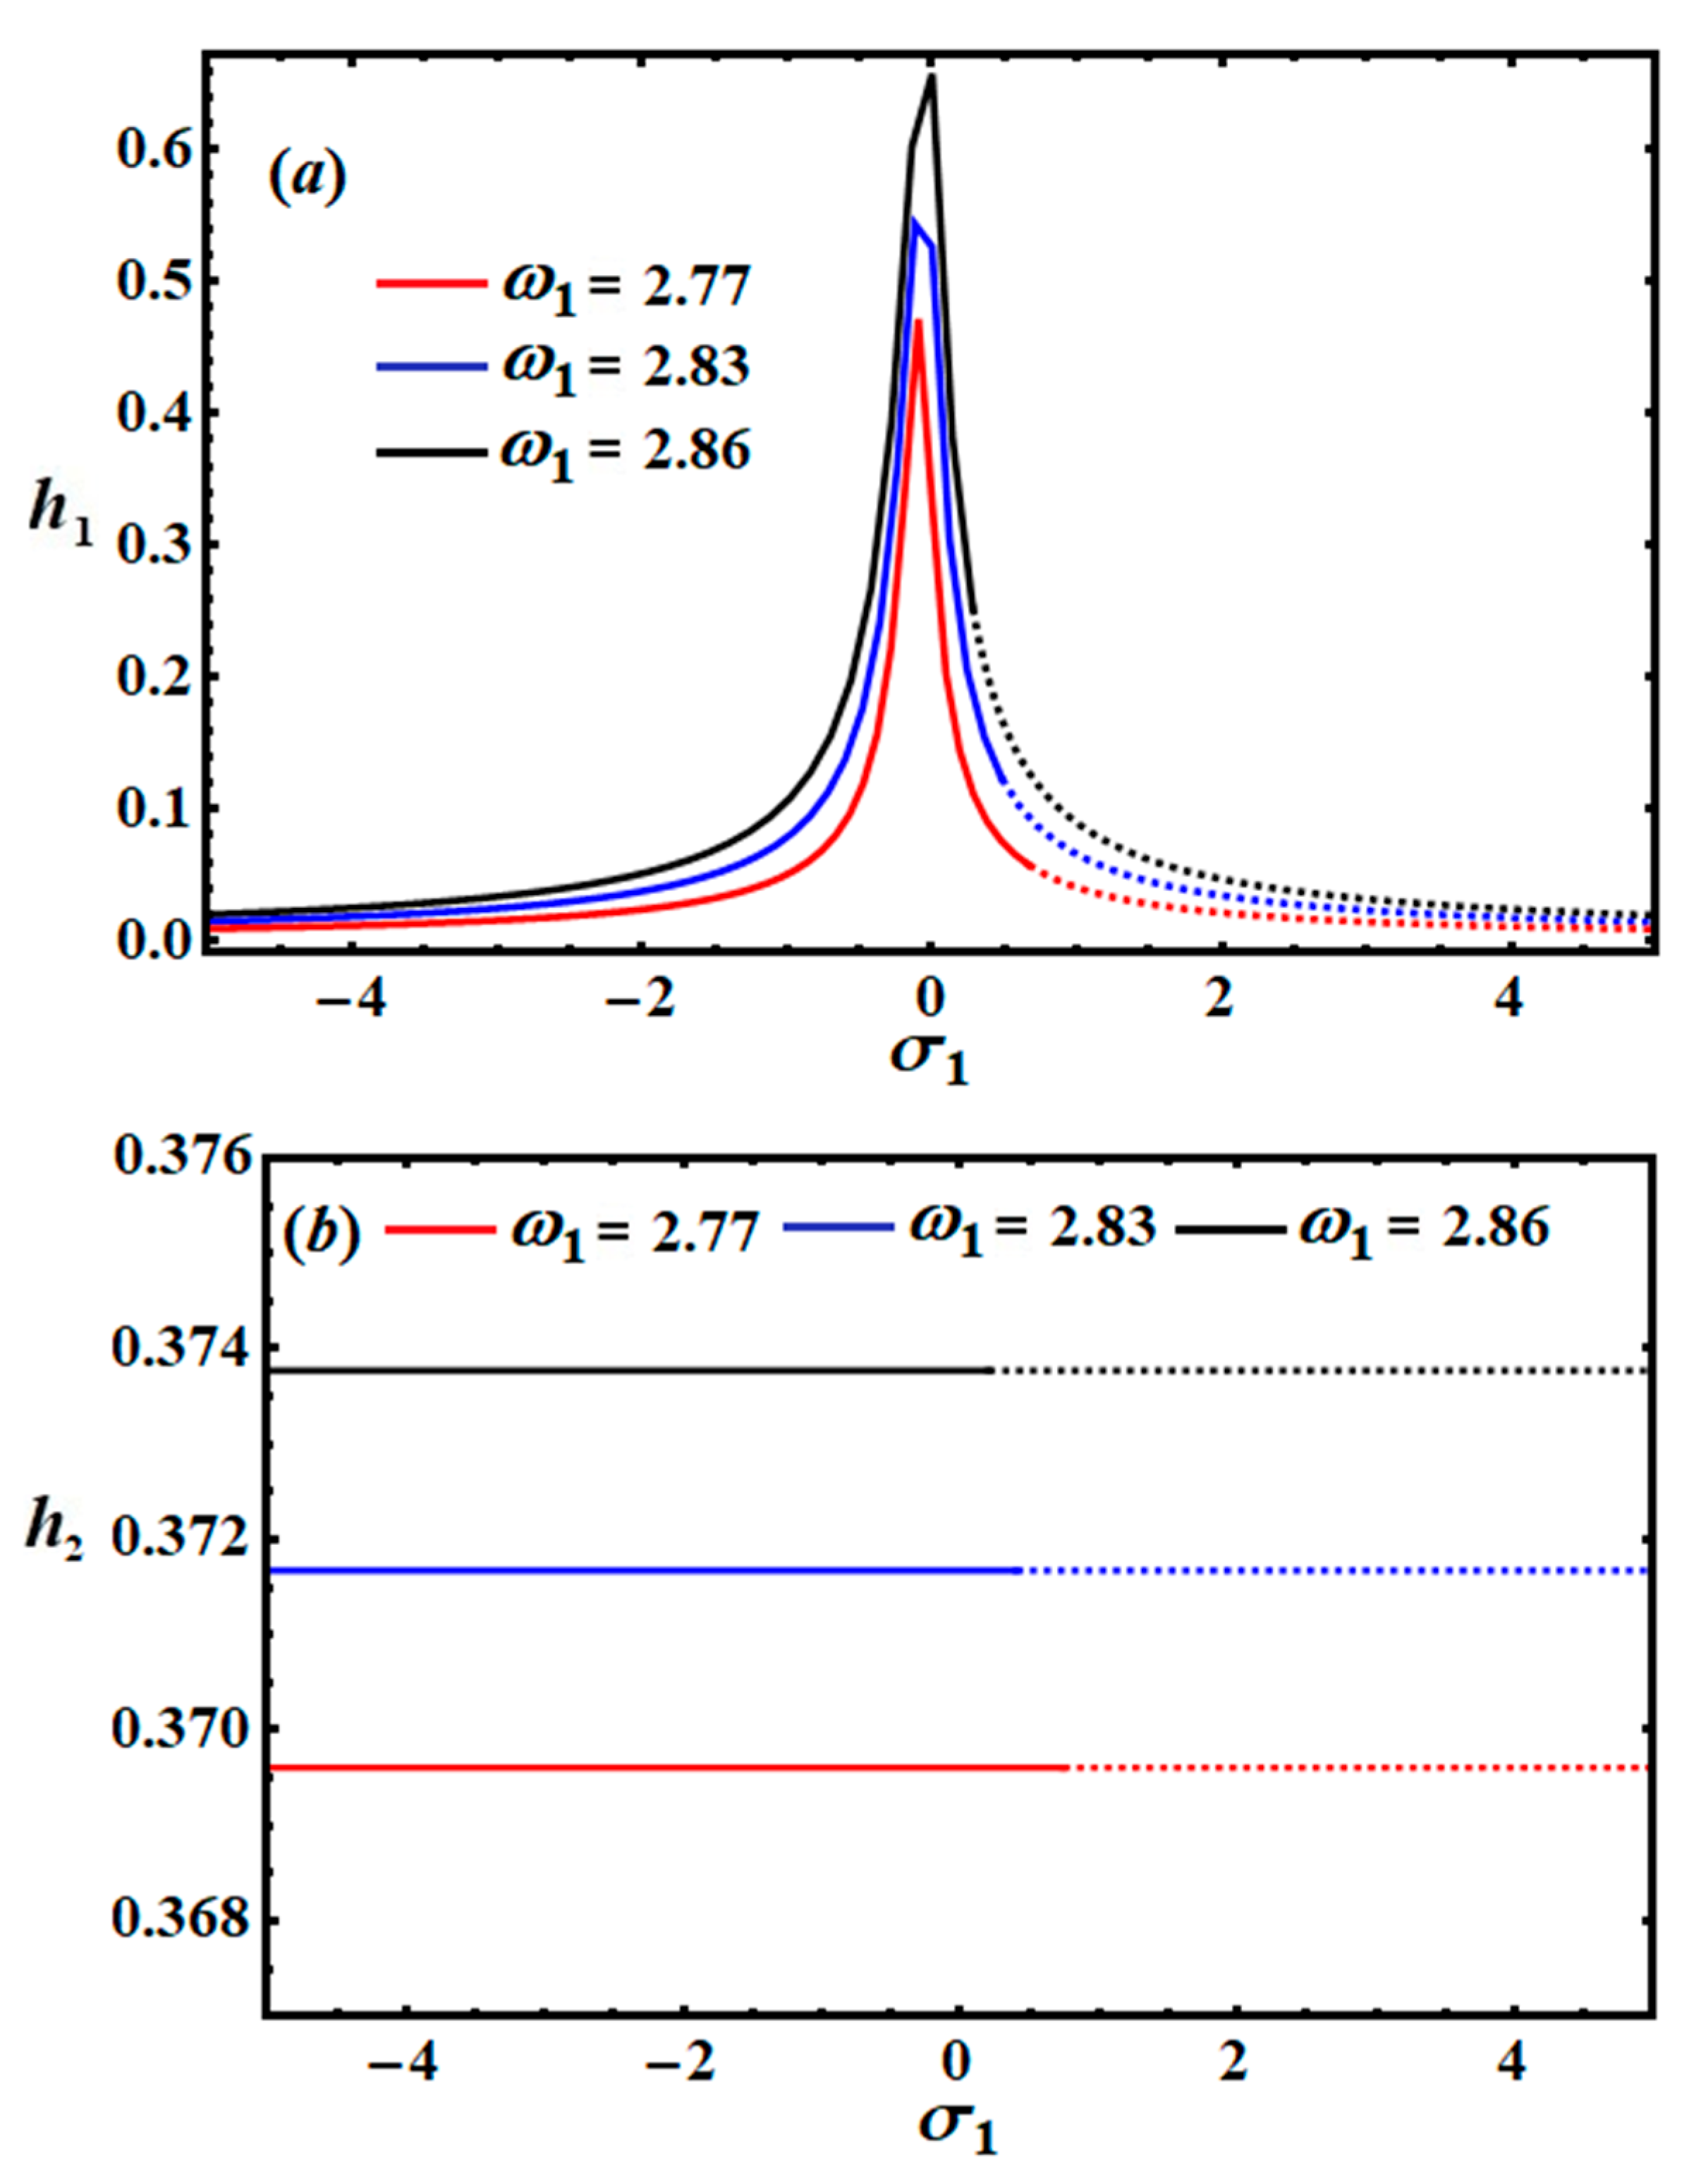
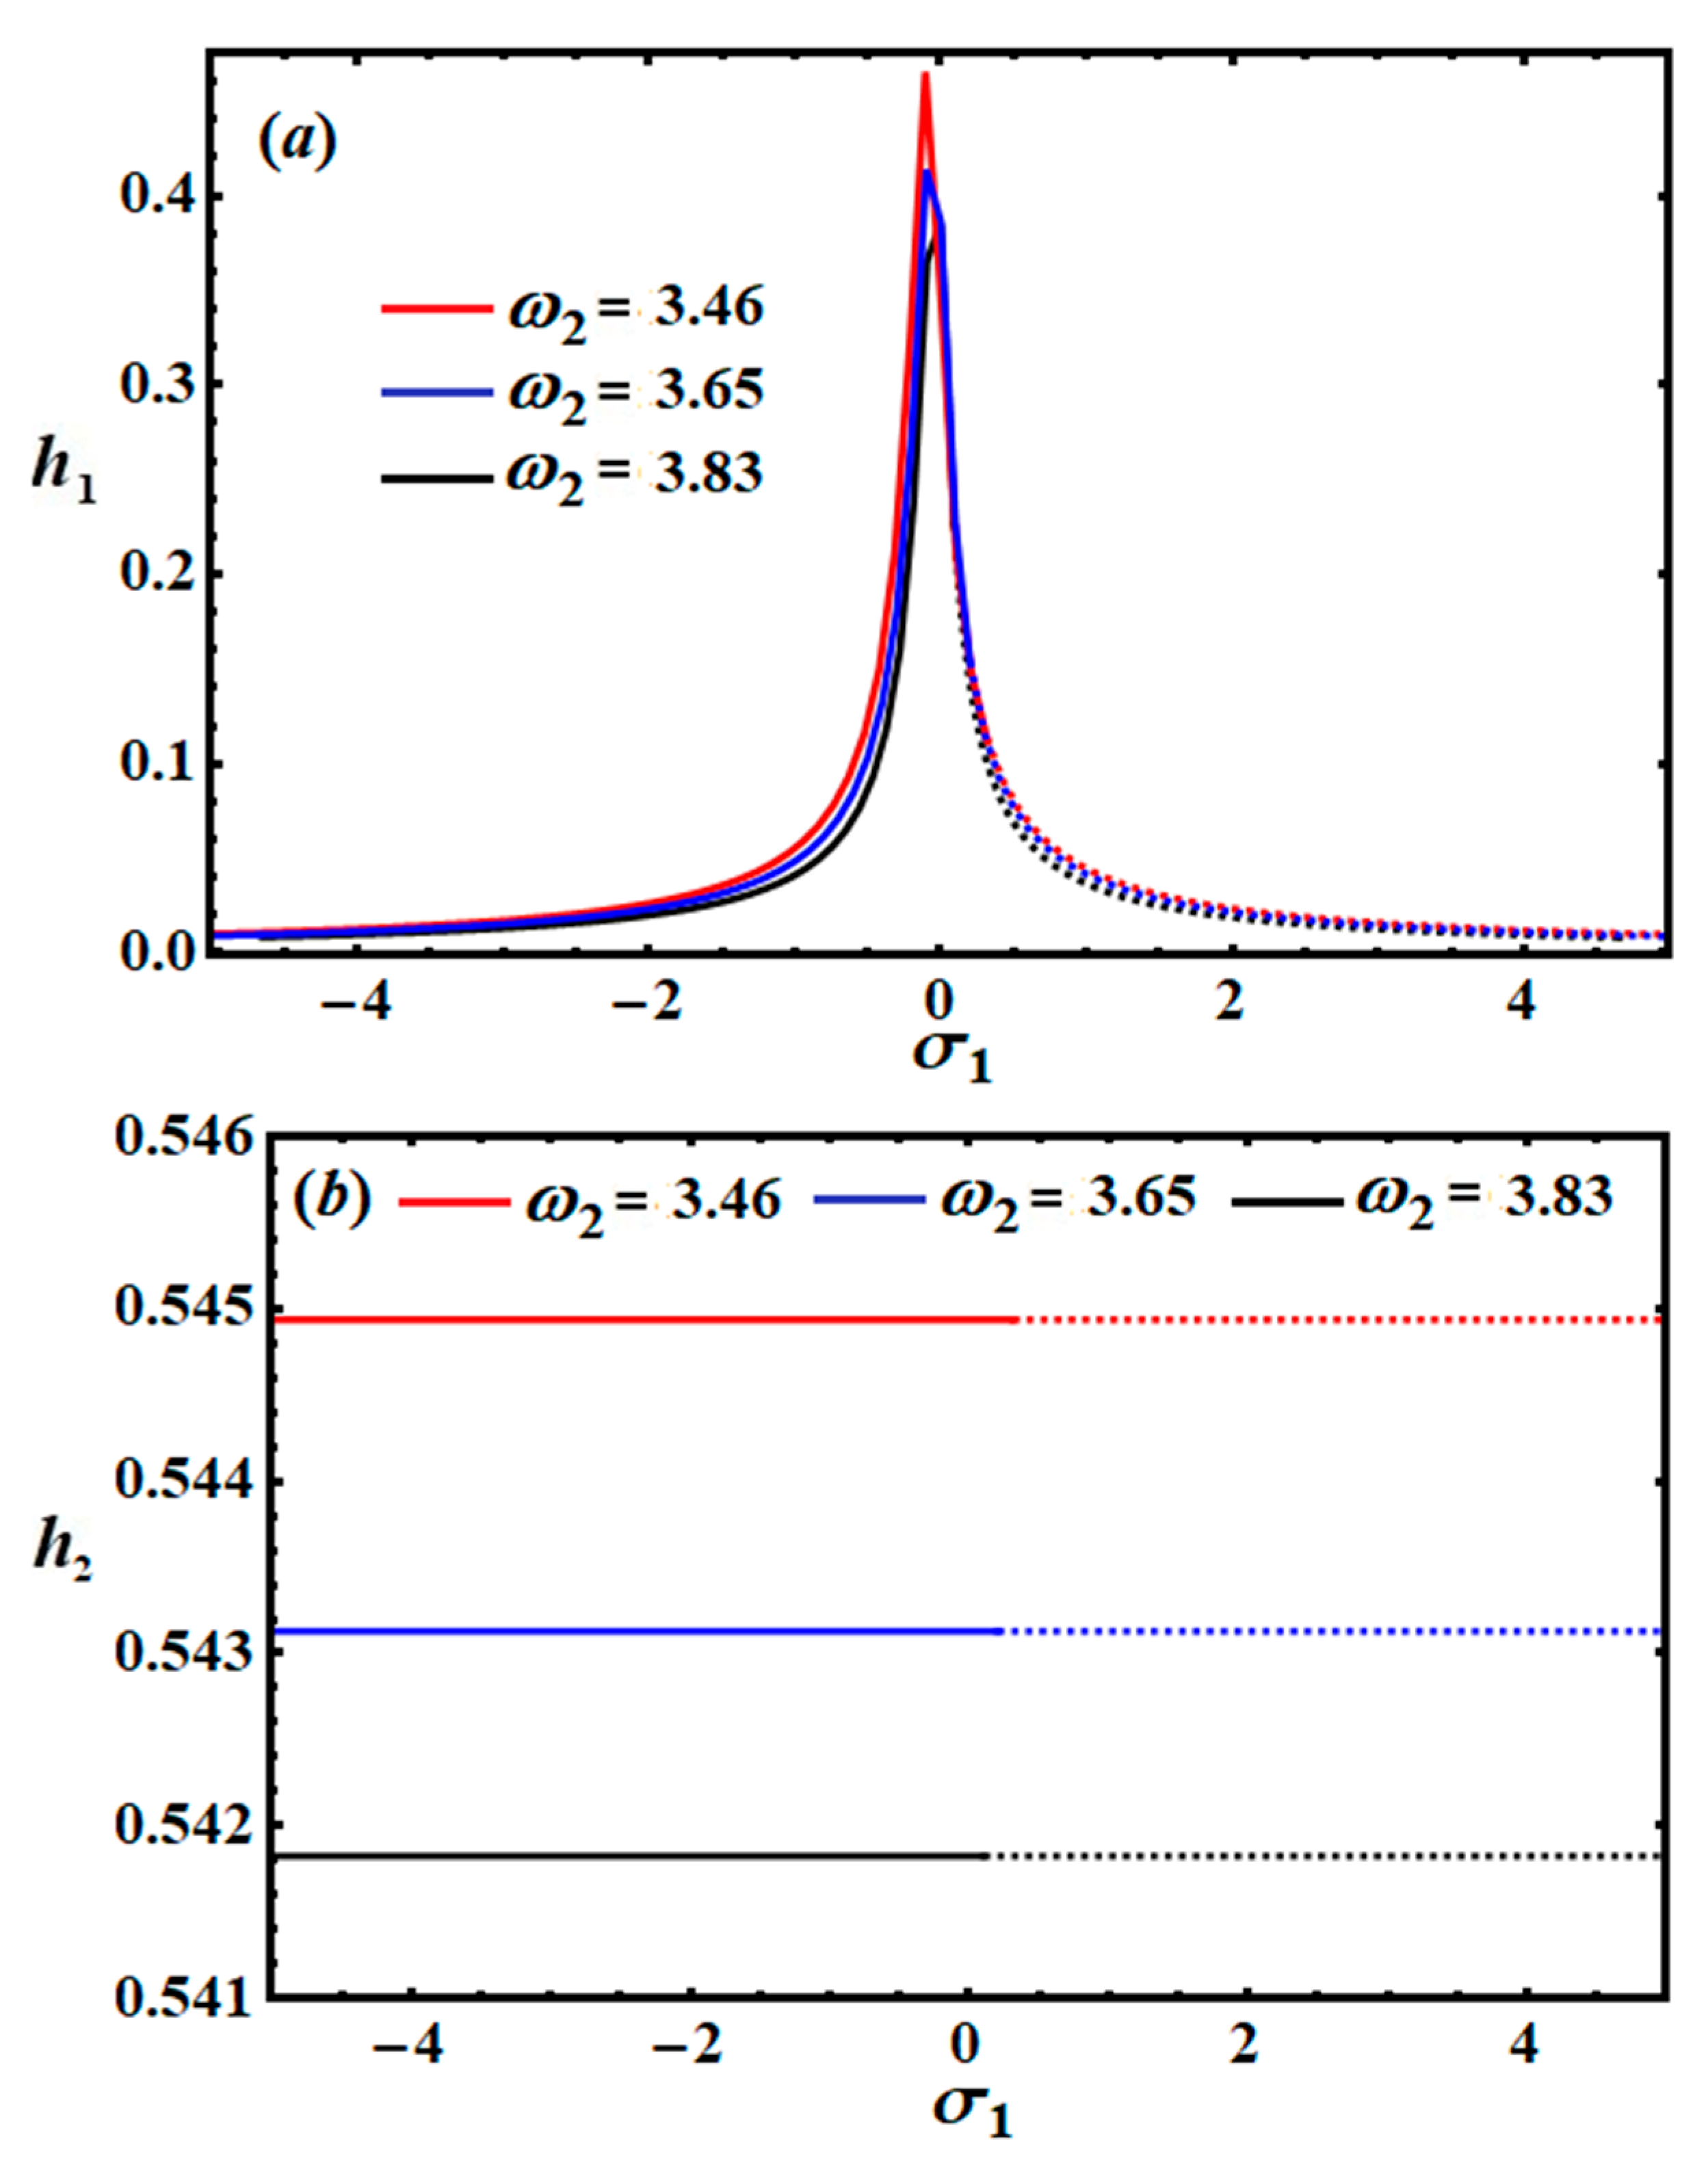
In
Figure 11 and
Figure 12, the amplitudes
are graphed against the parameter
to display the frequency response curves at distinct values of
when
. The drawn curves hold the arising possible fixed points. In each graph, the stable region is shown in solid and the unstable region in dashed rendering. These regions vary with the natural frequencies
. More specifically, a closer look at
Figure 11 reveals that the stability ranges and instability ones of the red curves, corresponding to
, are
and
, respectively. On the other hand, when
, the blue curves represent the stability and instability ranges, in which they are located in the domains
and
, respectively. Finally, the black curves point to the areas of stability and instability when
, which can be seen in the domains
and
, respectively.
Figure 12 delineates the distinct stability domains, with the red regions denoting stability areas based on the range
, while the instability areas correspond to the range
. At
, the blue curves show the stability and instability areas that are founded, respectively, in the ranges
and
, while the black ones explore the regions of stability and instability at
in the ranges
and
, respectively. The separated fixed point between any two areas of stability is known as the critical fixed point, while any peak fixed point may be located in one of stability and instability areas. In other words, each critical fixed point may be considered a peak point, while the reverse is not always true.
