1. Introduction
The need to include uncertainty and risk in supply chain planning has become more pronounced due to the rapid rate of change and unforeseen occurrences in technology, market dynamics, and the larger business environment. Supply chain risks are the effects of uncertainty on supply chain functioning or performance [
1]. Uncertainty could arise from, for example, the lack of accurate information or knowledge pertaining to attributes such as supplier capability and performance or the variability associated with certain decision parameters such as demand, lead time, and cost. There is a substantial body of literature on the topic of supply chain uncertainty and risk management that proposes a range of modelling approaches to deal with business-as-usual conditions, such as variations in demand, cost, and capacity [
1,
2,
3]. These situations, which usually represent operational risks, are often modelled using techniques such as stochastic programming, fuzzy sets, and Monte Carlo to arrive at optimal supply chain designs or operating conditions that are capable of maintaining desired performance levels [
4,
5,
6].
One key decision area in which the impact of these risks can be proactively dealt with is supplier evaluation and selection (SES). SES is a strategic decision, which determines the configuration of a supply chain. Therefore, SES decisions have a long-term and pervasive impact on the supply chain functioning and performance [
7]. A number of studies have made valuable contributions towards addressing risks through SES decisions from multiple perspectives, resulting in a variety of models, approaches, and techniques to address the key challenges, including uncertainty and risks. Kull and Talluri [
8] propose a conceptual framework that integrates the analytic hierarchy process and goal programming methodologies. This framework aims to effectively include supply risk metrics in the process of evaluating suppliers. Tirkolaee et al. [
9] present a unique approach that integrates fuzzy decision-making with multi-objective programming as a means to effectively tackle the supplier selection issue and enhance supply chain optimization. Ahmadi and Amin [
10] created a multi-objective model to address developing and enhancing a closed-loop supply chain network for mobile phones, specifically focusing on the process of supplier selection. Puška et al. [
11] developed a novel hybrid Multiple-Criteria Decision-Making (MCDM) model. This model incorporates fuzzy Stepwise Weight Assessment Ratio Analysis (SWARA), fuzzy Multi-Attributive Border Approximation Area Comparison (MABAC), Measurement Alternatives and Ranking according to the Compromise Solution (MARCOS), and Compromise Ranking of Alternatives from Distance to Ideal Solution (CRADIS) methodologies to effectively evaluate and pick green suppliers within the agricultural sector. This research highlights the significance of considering parameters pertaining to price and quality while engaging in the selection process.
However, there is still a dearth of integrated approaches that account for multiple factors associated with uncertainty, risk, and performance outcomes concurrently and holistically. The current business trends that affect supply chains and the increasing strategic significance of SES decisions may also mean that efforts directed at building more comprehensive and effective decision support systems need to be continued.
The main gaps in the literature and contributions of this study are indicated below:
The main objective of this study was to provide an FSIM that utilizes the Fuzzy Analytical Hierarchy Process (FAHP), Fuzzy Evaluation Based on Distance from Average Solution (EDAS-F), and fuzzy stochastic goal programming (FSGP) methodologies with the aim of mitigating both capacity- and performance-related risks in SES problems involving quantity discounts and multiple planning periods when faced with uncertain or stochastic situations. The methods used in this study were preferred in this study for the following reasons. Although the Fuzzy SWARA method has simpler calculation steps compared to the FAHP method, the consistency of decision-makers cannot be measured with the Fuzzy SWARA method. In addition, the FAHP method has simpler computation steps compared to the Fuzzy BWM and Fuzzy FUCOM methods, which are other valuable weighting methods. Therefore, the FAHP method was preferred in weighting the criteria. One of the main distinctions between EDAS and other approaches is the way it normalizes data. VIKOR and TOPSIS, traditional MCDM methods, were developed to identify the best option according to anti-ideal and ideal solutions. However, a higher distance to an anti-ideal solution and a lower distance to an anti-ideal solution would not guarantee to achieve the most appropriate solution in real-life decision-making problems. As a result, the goal of EDAS is to identify the optimal option using a normalizing technique based on an average solution [
21]. For this reason and to address uncertainty, the EDAS-F method was used in this study. The FSGP method handles both fuzzy data and stochastic data. Therefore, it evaluates more different data types compared to the Fuzzy Goal Programming method. Therefore, it was preferred in this study. The proposed method can be adapted to suit different procurement contexts or industry-specific requirements, by considering specific criteria at the pre-selection phase or adding parameters to represent specific competitive priorities in the objective function, to be considered in the detailed evaluation phase.
The paper is organized as follows. In the following section, a comprehensive examination of existing studies pertaining to the SES issue is provided, with specific emphasis on strategies for addressing uncertainty and risk. The literature review covers three key aspects, i.e., fuzzy and stochastic models, quantity discount, and multiple-period models and methods used for model validation. In the next section, the approach followed in developing the proposed FSIM is outlined. The application of the proposed FSIM model is then illustrated, in the following section, using a case study. In the conclusion section, the findings of the study are summarized, along with a brief account of limitations and future directions.
2. Literature Review
The SES issue has been examined from multiple viewpoints, e.g., enhancing supplier collaboration and integration, dealing with the impact of uncertainty and risks, and optimal order allocation, over an extended period. These studies have also addressed the SES issue at different levels of detail, for example, product category, business unit, and supply chain. They can also be classified in terms of procurement context (e.g., novel assignment, altered repurchase, straight repurchase, tactical repurchase), decision-making context (e.g., individual vs. team decisions), and environmental context (e.g., green sourcing, closed-loop supply chain, circular economy), that are considered when handling the SES issue. This study aims to address the SES issue by using a risk-minimizing approach at both the merchandise category and company unit levels. Therefore, the literature research consists of a comprehensive analysis of the elements that contribute to operational risks at the company unit level. Additionally, it explored various methods and strategies used in order allocation, taking into account quantity discounts and numerous planning periods. A rather comprehensive review of multi-attribute decision-making approaches by Keshavarz-Ghorabaee et al. [
22] has examined the SES issue in fuzzy environments. By comparison, this section provides a summary review of fuzzy stochastic mathematical models used in the area of SES.
Stochastic approaches are often used, supported by mathematical models, to deal with the uncertainty related to SES, particularly to deal with variability in demand and capacity. These approaches can generate precise and robust solutions compared to what is achieved through other approaches such as Fuzzy methods. However, their applications are often limited to situations where historical data are available. By comparison, Fuzzy methods can provide useful decision support in situations where imprecise information is used or certain intangible attributes are considered. In general, hybrid models aim to compensate for the limitations of certain methods or techniques against the strengths of others, considering their complementarities. In the remainder of this section, summary reviews of the literature on fuzzy stochastic methods and approaches used in model validation are presented separately.
In this paper, the SES issue is considered from a risk-minimizing approach at the company unit and merchandise category levels. The literature review is therefore focused on examining the elements leading to operational risks at the level of the company unit and alternative approaches for the distribution of orders, consisting of various measures used at the product category level. Also, the recent studies about FAHP and EDAS-F methods have been reviewed.
2.1. Fuzzy and Stochastic Models
There has been a growing trend of developing hybrid methods to solve the SES problem over the past decade or so. Some early examples of such methods are the bi-random chance-constrained Multi-Objective Programming (MOP) method proposed by Xu and Ding [
14] and the Two-stage Stochastic Programming and fuzzy Technique for Order Preference by Similarity to an Ideal Solution (TOPSIS) method used by Kara [
15]. In particular, the latter approach proposed to address the SES issue in three stages: the pre-search stage, the pre-assessment stage, and the assessment stage. Searching potential suppliers, determining the selection criteria, and defining the model elements were undertaken in the pre-search stage. In the second stage, fuzzy TOPSIS was employed to prioritize suppliers based on qualitative criteria. Two-stage stochastic programming was then used in the third stage to evaluate the performance of the ranked suppliers under the conditions of stochastic demand. Li and Zabinsky [
12] suggested an alternative methodology that combines stochastic programming with Chance-Constrained Linear Programming (CCLP) in a two-stage process. This technique takes into account quantity discounts in order to obtain the most optimum order size. This approach included coefficients of penalty and probability distributions to deal with capacity and demand constraints, considering multiple scenarios. By comparison, Zhou et al. [
23] used a stochastic dynamic programming approach with an integer-valued inventory, under finite-horizon planning conditions with stochastic demand. This study used a heuristic approach to solve the stochastic dynamic programming problem. A similar model was proposed by Zhang and Zhang [
24] to deal with the SES issue on the stochastic demand situation, in which the branch-and-bound algorithm was used. A stochastic model enhanced with a Genetic Algorithm (GA) was proposed by Yang et al. [
25] to maximize predicted revenue by simultaneously meeting service level standards and adhering to budget restrictions in the context of SES. In separate research, Bilsel and Ravindran [
13] applied the CCLP methodology to address the SES issue. Specifically, their research focused on multiple-period planning and multiple-product procurement, aiming to optimize expenses and delivery time, maximize quality, and ensure compliance with demand and supply limitations. A study by Guo and Li [
26] developed a Mixed-Integer Nonlinear Programming (MINLP) approach involving a multi-echelon supply chain to address the SES issue, as well as inventory problem, under varying demand conditions. A similar MINLP-based approach with a coded GA was proposed by Meena and Sarmah [
16] to address the SES issue more comprehensively to consider factors such as fail possibilities, capacity, price reductions, and reimbursement opportunities in the context of varied demand conditions. Ghadimi et al. [
27] suggested a strategy involving the use of a Multi-Agent Systems (MASs) framework to effectively handle the process of evaluating and selecting sustainable suppliers. This approach aims to offer a suitable dialogue canal, facilitate organized knowledge swapping, and enhance transparency between suppliers and producers. Kannan [
28] presented a decision support system for addressing the sustainable supplier selection issue in the textile sector of India. The approach is based on the CSF theory, Fuzzy Delphi, the Analytic Network Process (ANP), and grey Complex Proportional Assessment (COPRAS-G). It takes into account the perspectives of several stakeholders in the context of sustainability. Lo [
29] introduced a data-driven decision support system as a means to carry out the supplier assessment procedure including the use of the variable precision-dominance-based rough set approach to determine the key criteria, the Criteria Importance Through Inter-Criteria Correlation (CRITIC) technique to determine the significance of the criteria, and a modified classifiable TOPSIS to successfully incorporate the performance scores of providers in the presence of newly introduced alternative suppliers. In the study conducted by Gupta [
30], a comprehensive framework is proposed that integrates the MABAC, Weighted Aggregated Sum Product Assessment (WASPAS), and TOPSIS methodologies for the purpose of selecting green suppliers. This selection process is based on both environmental and conventional factors. In order to address the challenges posed by probabilistic uncertainty, a unique model combining Monte Carlo (MC) simulation with hybrid multi-criteria decision analysis was developed by Koç et al. [
31]. The integration of MC simulation using the Beta-PERT distribution was used in conjunction with the AHP and TOPSIS methodologies. This integration facilitated the determination of criterion weights and the subsequent assessment of suppliers.
2.2. Approaches to Model Validation
Numerous research documented in the existing body of literature have also endeavored to evaluate the effectiveness of the suggested SES approaches using various methodologies. The range of validation methods adopted includes experimental design, scenario-based evaluation, cross-validation with sample data, comparisons using statistical tests, and using primary empirical data collected through interviews and questionnaire surveys.
Experimental approaches were used to verify SES models in two studies [
17,
18]. These studies have changed the values of parameters such as: the quantity of suppliers, the quantity of products, vendors, and discount brackets, respectively, to examine how changes in these parameters affect SES results. Aguezzoul and Pierre [
32] considered two scenarios involving transportation costs for assessing the efficacy of a nonlinear multi-objective programming model in handling the SES issue. Kull and Talluri [
8] used goal programming (GP) to mitigate the risk of failure to meet performance requirements on a range of dimensions. The authors in this study also evaluated the effectiveness of the proposed under various conditions. The model developed by Wu and Blackhurst [
33] was assessed by the use of the k-fold cross-validation procedure, with a limited dataset for evaluation purposes. Similarly, two hypotheses were formulated in another study [
19] to assess the effectiveness of their suggested grey model, and a
t-test was used to compare the proposed model against existing grey models. In their study, Golmohammadi et al. [
34] used neural networks to construct an approach for analyzing the SES issue. Additionally, the researchers conducted a comparative analysis by juxtaposing their findings with the rankings offered by two professionals working in managerial roles. Vinodh et al. [
20] used a questionnaire survey to evaluate the feasibility of the FANP model they developed to solve the SES issue. Fallahpour et al. [
35] assessed the reliability of the method with two techniques: the consistency ratio (CR) and various defuzzification techniques such as bisector of area (BOA) and smallest of maximum (SOM). In order to establish the advantage of the new model, Liu et al. [
36] conducted a comprehensive comparative analysis. Ecer [
37] validated the reliability of the proposed model for green supplier selection with Spearman’s rank correlation coefficient and sensitivity analysis on the findings. In order to establish the validity of the findings, Rani et al. [
38] used sensitivity and comparison analyses.
Furthermore, several research studies have been documented in the literature that have formulated SES approaches with the intention of addressing industry-specific contexts.
Table 1 presents the summary of distinct approaches reviewed in this paper.
2.3. The Recent Studies about FAHP and EDAS-F
Çalık [
46] provides an FAHP and FTOPSIS methodology for the purpose of green supplier selection in the context of Industry 4.0. The suggested methodology involves the use of linguistic phrases based on Pythagorean fuzzy numbers to represent the assessments provided by various experts. The criterion weights are determined using the interval-valued Pythagorean FAHP approach. In the study conducted by Tavana et al. [
47], the FAHP methodology is proposed as a means of facilitating the evaluation of supply chain risk–benefit. FAHP establishes the relationships among criteria, subcriteria, and options in a hierarchical framework, facilitating their evaluation. It employs the expertise of professionals to provide significance weights to individual risk and benefit criteria as well as their respective subcriteria. Zavadskas et al. [
48] used the FAHP methodology to determine the most suitable source for procuring the materials required in the manufacturing of pre-insulated pipes. The methods are systematically classified according to their respective approaches in representation, aggregation, defuzzification, and consistency assessment. Nguyen et al. [
49] examined the quality of port services (PSQ) by using a combined approach of FAHP and Importance-Performance Analysis (IPA) as perceived by port customers. The initial establishment of the hierarchical structure of the Patient Satisfaction Questionnaire (PSQ) was derived from a comprehensive review of relevant literature and an interview conducted with experts in the field. This hierarchical structure encompasses six dimensions and consists of a total of 29 criteria. Kutlu Gündoğdu and Kahraman [
50] modified the conventional AHP by introducing the spherical fuzzy AHP (SF-AHP) approach in a case study on renewable energy site selection. Additionally, a comparison analysis between neutrosophic AHP and SF-AHP has been conducted. The use of the SF-AHP allows decision-makers to include their uncertainties in the decision-making process by using a linguistic assessment scale that is rooted in spherical fuzzy sets. Sergi and Ucal Sari [
51] examined the use of Industry 4.0 technologies in public services with the aim of meeting the needs of citizens with fuzzy Z-AHP and fuzzy Z-WASPAS methodologies. Fuzzy logic is often used in analytical processes to effectively manage uncertain information that arises from the unexpected results of digitalized services and advancements. However, as compared to traditional fuzzy numbers, Z numbers have more capability in representing human knowledge due to their capacity to include both limitation and dependability.
Vesković et al. [
52] created a novel integrated model including fuzzy Pivot Pairwise Relative Criteria Importance Assessment (F-PIPRECIA) and EDAS-F with the aim of addressing the business equilibrium of a passenger rail operator while aligning with the transportation policy of the European Union. Liu et al. [
53] presented a novel framework that incorporates the assessment based on EDAS with Pythagorean fuzzy sets (PFSs) to address the selection of sustainable circular suppliers in the manufacturing industry. The process of selecting the most suitable supplier is typically influenced by the subjective nature of human behavior. This selection process is further complicated by the presence of uncertain information. Pythagorean fuzzy sets (PFSs) provide a significant advantage in addressing the challenges posed by high ambiguity, uncertainty, and inaccuracy in MCDM approach. Zhang et al. [
54] developed a picture fuzzy EDAS model and demonstrated the use of the novel technique in the choosing of green suppliers. This model is more accurate and efficient to take into account the conflicting criteria. Jana and Pal [
55] used the EDAS-F technique in the context of infrastructure development with bipolar fuzzy numbers (BFNs). The suggested methodology demonstrated validity and accuracy in its approach to addressing conflicting features. Yanmaz et al. [
56] introduced the use of interval-valued Pythagorean fuzzy numbers to address the automobile selection decision-making problem. This approach offered a broader membership domain, hence enhancing the flexibility of the decision-making process.
As can be seen, many extensions of the AHP and EDAS methods are available in the literature. Although each extension of these two methods is valuable, the FAHP and EDAS-F methods were preferred to be used in this study as they contain very simple computation steps.
3. Materials and Methods
In the proposed methodology, we have included two main stages: the pre-selection stage and the assessment stage. The pre-selection stage is used to initially filter out suppliers to a manageable level using FAHP [
57] and EDAS-F [
58]. In the assessment stage, the total weighted scores reflecting all qualitative parameters acquired in the pre-selection stage are utilized as objective function coefficients in FSGP to choose the optimal suppliers and assign orders among these suppliers. In FSGP, objective functions (goals) and stochastic constraints (capacity of supplier and order quantity) are examined.
This section consists of five subsections, each providing details about the proposed methodology. The first subsection presents the steps of FAHP. The second subsection explains the process of EDAS-F, and the third subsection presents the formulation for the proposed model based on the FSGP applied to select and assess suppliers.
General arithmetic operations regarding fuzzy numbers are given in
Appendix A.
3.1. Steps of FAHP
FAHP is used to compare qualitative criteria to determine the weights for qualitative criteria and objectives of fuzzy stochastic goal programming. FAHP stages are discussed below:
Stage 1: Decision-makers present their judgments about the pairwise comparison of qualitative criteria with linguistic terms. These are first transformed into triangular fuzzy numbers (TFNs) using
Table 2.
In this study, Equation (1) is used for the aggregation of the preferences of decision-makers. Fuzzy comparison scores obtained from decision-makers are determined with Equations (1)–(3) to create a fuzzy decision matrix (
), as follows:
where
denotes lower score for
while
denotes medium score and
denotes higher score. The consistency index (
) and consistency ratio (
) are computed to test the consistency of
. Please see
Appendix A for more information.
Stage 2: Equation (4) is utilized to compute fuzzy relative row sum (
) for each row in
as:
Stage 3: The weights of criteria are obtained from fuzzy relative row sum values (
).
Stage 4: Fuzzy weight (
) is transformed into crisp weight
by Equation (6):
Stage 5: The normalized crisp weight of the
th criterion is obtained by Equation (7):
The fuzzy weights obtained in this phase will be used in the next phase for EDAS-F, and normalized crisp weights will be used as weights of objective functions in FSGP.
3.2. Steps of EDAS-F Method
The EDAS-F method is utilized to assess supplier performance considering qualitative criteria and to pre-select suppliers with respect to their crisp assessment scores. The steps of EDAS-F can be summarized as:
Stage 1: First, decision-makers express the linguistic assessment score indicating the performance of suppliers under each of the selection criteria. These scores are converted into TFNs by using
Table 3. These scores are combined by using Equation (8) to create a fuzzy decision matrix.
Stage 2: For each criterion, the fuzzy mean value is found with Equations (9) and (10), and the fuzzy mean values matrix (
) is created.
Stage 3: For each criterion, the fuzzy positive distance from average (
) and fuzzy negative distance from average (
) are calculated with respect to type of criteria (beneficial and non-beneficial) to create matrixes (fuzzy positive distance from average (
) and fuzzy negative distance from average (
)). If the criterion is beneficial, Equations (11) and (12) are used. Otherwise, Equations (13) and (14) are used.
Stage 4: For each alternative, the fuzzy weighted sums of
and
are calculated by using Equations (17) and (18) to obtain the fuzzy weighted total positive value (
) and the fuzzy weighted total negative value (
), respectively.
Stage 5: For each alternative, fuzzy normalized weighted positive (
) and negative (
) values are computed by using Equations (19) and (20).
Stage 6: These fuzzy values (
,
) are converted into crisp values (
,
) by using Equation (6). Then, the crisp assessment score (
) for each alternative is computed as follows:
First, the crisp assessment score for each alternative will be used to pre-select suppliers, and then the crisp assessment score of pre-selected suppliers is utilized as a coefficient of total purchasing value (TPV) objective function in FSGP.
3.3. Subsection
In the proposed model, the fuzzy stochastic goal programming (FSGP) model consists of three additional fuzzy stochastic objective functions—(i) minimizing total purchasing cost, (ii) minimizing late delivery, and (iii) minimizing faults apart from (iv) maximization of TPV (fuzzy objective function). The preliminaries on the FSGP model are detailed in
Appendix A for more information. Equation (22) indicates the minimizing total purchasing cost where
is the fuzzy purchasing price for the
th supplier and
th quantity discount,
is the fuzzy holding cost for the
th period,
is the order quantity for the
th supplier and
th quantity discount,
is the stock quantity for the
th period. Mathematically,
Equation (23) indicates the minimization of late delivered units in which
denotes the fuzzy percentage of late delivered units for the
th supplier in the
th period, and
is the order quantity for the
th supplier in the
th period.
Equation (24) presents the minimization of faulty units where
denotes the fuzzy faulty percentage for the
th supplier in the
th period.
This model takes the 4th objective function (maximizing TPV) into account containing the crisp coefficient indicated in Equation (25). The fourth objective function (
) is written as:
In Equation (25),
indicates the purchasing value of the
th supplier. The proposed model includes stochastic constraints (production capacity of supplier and order quantity). To convert stochastic constraints into deterministic equivalents, the chance-constrained method is utilized. Equation (26) indicates the stochastic supplier production capacity constraint, and
shows the production capacity of the
th supplier and
is the confidence interval for the
th supplier.
This constraint is transformed to a deterministic constraint with the chance-constrained method:
Equation (28) represents the constraint for crisp order quantity, which was transformed from a stochastic constraint with the chance-constrained method.
denotes the order quantity in the
th period, and
is the confidence interval for the
th period.
Equations (29)–(31) denote constraints of quantity discount.
is the highest purchased quantity from the
th supplier at the
th quantity discount level.
is slightly lower than
, and
is the highest quantity purchased from the
th supplier at the
th quantity discount level.
denotes a binary integer variable.
Equation (32) shows the order quantity for periods and quantity discounts:
Equation (33) shows the product balance constraint:
After determining the fuzzy membership of fuzzy stochastic objectives and fuzzy objective, the satisfaction level (
) of fuzzy stochastic objectives and satisfaction level (
) of fuzzy objectives can be integrated in a single-objective function (
), which is called total utility function, as in Equation (34):
Normalized objective functions weights (
) are obtained in Stage 5 of FAHP. Fuzzy membership functions (
and
) of fuzzy stochastic goals are in Equations (35) and (36). Moreover, the fuzzy membership (
) of fuzzy objectives is indicated in Equation (37). The satisfaction degree of objective functions (fuzzy stochastic objectives and fuzzy objective) may be presented as below:
In order to solve the whole problem, Equations (27)–(34) are considered together with Equations (35)–(38). This ensures that selected suppliers, and optimal order distribution among these suppliers, can be achieved for quantity discount condition.
4. Case Study of a Turkish Textile Industry
The proposed fuzzy stochastic model is validated using the data drawn from a reputed Turkish Textile business. This business is referred to as Textila in this paper to maintain anonymity for confidentiality reasons. It is a large-scale garment manufacturing business which produces casual clothing for men, women, and children. The company has over 1100 employees, has several branches in Turkey, and supplies to both local and international markets. It has been active in the Turkish textile industry for more than 20 years. Textila is one of the most advanced manufacturers with a significant production capacity in the region and engages in the design, development, and supply of high-quality garments. The full range of garments are produced in their own factories with no sub-contractors involved. As such, the competitive priorities of the business are considered to be quality and delivery performance, while cost plays an order qualifier role.
Textila’s main suppliers are the manufacturers of material such as threads, fabrics, dyes, and accessories (buttons, beads etc.). Textila has procurement agreements with a number of international companies. Given the reputation of the company and its scale of operations, Textila is in a position to negotiate its terms of contract to attract quantity discounts and delivery commitments from its suppliers.
Since three senior managers of the business—purchasing manager, factory manager and operations manager—were following the purchasing process, a preliminary meeting was held with these three managers. Criteria and objective functions that have been used before in the literature were presented to these managers. Managers were asked to determine the criteria and objective functions related to the problem. Managers determined the criteria and objective functions (except TPV) to be used in this study. The TPV objective function was explained to the managers by the researchers, and the managers accepted the TPV objective function. All qualitative data used in validating the proposed model have been collected through a questionnaire that has been administered involving these managers. Historical data used in validating the proposed model have been provided by the purchasing manager. Given that the suppliers of Textila offer quantity discounts, the quantity discount model is used in the supplier assessment and order distribution stage.
4.1. Pre-Selection Stage
Evaluation begins with the pre-selection stage, where the FAHP and EDAS-F methods are employed for screening a relatively large number of candidate suppliers. For determining the weights of each capability-based risk, FAHP is used. The fuzzy weights used with qualitative evaluation criteria are given in
Table 4.
These fuzzy weights are then transferred into Stage 4 of EDAS-F. The results of EDAS-F are provided in
Table 5.
The supplier assessment scores given in
Table 5 are used to arrive at a manageable number of suppliers for detailed evaluation, by eliminating suppliers with low performance. Accordingly, the executives of the business agreed to select five suppliers with the best assessment scores. Thus, Supplier 6, Supplier 10, Supplier 11, Supplier 9, and Supplier 4, along with their related data, are considered in the detailed evaluation.
4.2. Evaluation Stage for Quantity Discount
The criteria used for evaluating the performance of shortlisted suppliers are cost, percentage of late deliveries, percentage of estimated defects, and stochastic capacities. First, the normalized weights of the objective functions are computed using FAHP. The normalized weights of the objective functions are shown in
Table 6.
The satisfaction degrees of the objective functions are used together with the respective normalized weights to obtain the final objective function, as indicated in Equation (34). In order to choose optimal suppliers and to distribute orders among them, Equations (27)–(34) are solved together with Equations (35)–(38). All computation in this process is performed using Lingo 19 software. The optimal order quantities obtained for suppliers in the respective time periods are shown in
Table 7.
As shown in
Table 7, Supplier 4 is not chosen in period 1, but it was selected to deliver 2412 units and 441 units of raw material in periods 2 and 3, respectively. Similarly, supplier 6 is not chosen in period 2, but 1203 and 3125 units from Supplier 6 is purchased in periods 1 and 3, respectively. Selected suppliers and order distributions in each of the three time periods can be seen from the results presented in
Table 7.
Table 8 provides the results of optimized objective functions and the satisfaction degrees of objective functions.
As per
Table 8, the total cost of purchasing the supplies considered is 610,795.8 Turkish Lira (TL). In terms of delivery performance, 1,525 units out of the total 18,922 units delivered were late. Also, 1,499 units were found to be faulty. The TPV for the scenario considered was found to be 14,643.67. The satisfaction degrees of the first and third objective functions (
) are fulfilled in their entirety, whereas the second and fourth objective functions (
) were satisfied to the tune of 85.8% and 73.6%, respectively.
The proposed model was compared with a possibilistic stochastic model including FAHP, COPRAS-F, and possibilistic stochastic programming to indicate the superiority of the proposed model. According to the results obtained, there was a huge difference between the results of the possibilistic stochastic model and the proposed model only in terms of cost. While the total cost in the possibilistic stochastic model was 718,920, the proposed model found the total cost to be 610,795 TL. Although the difference is a small amount of 108,125 TL, the proposed model has achieved the lower cost by comparison of the possibilistic stochastic model.
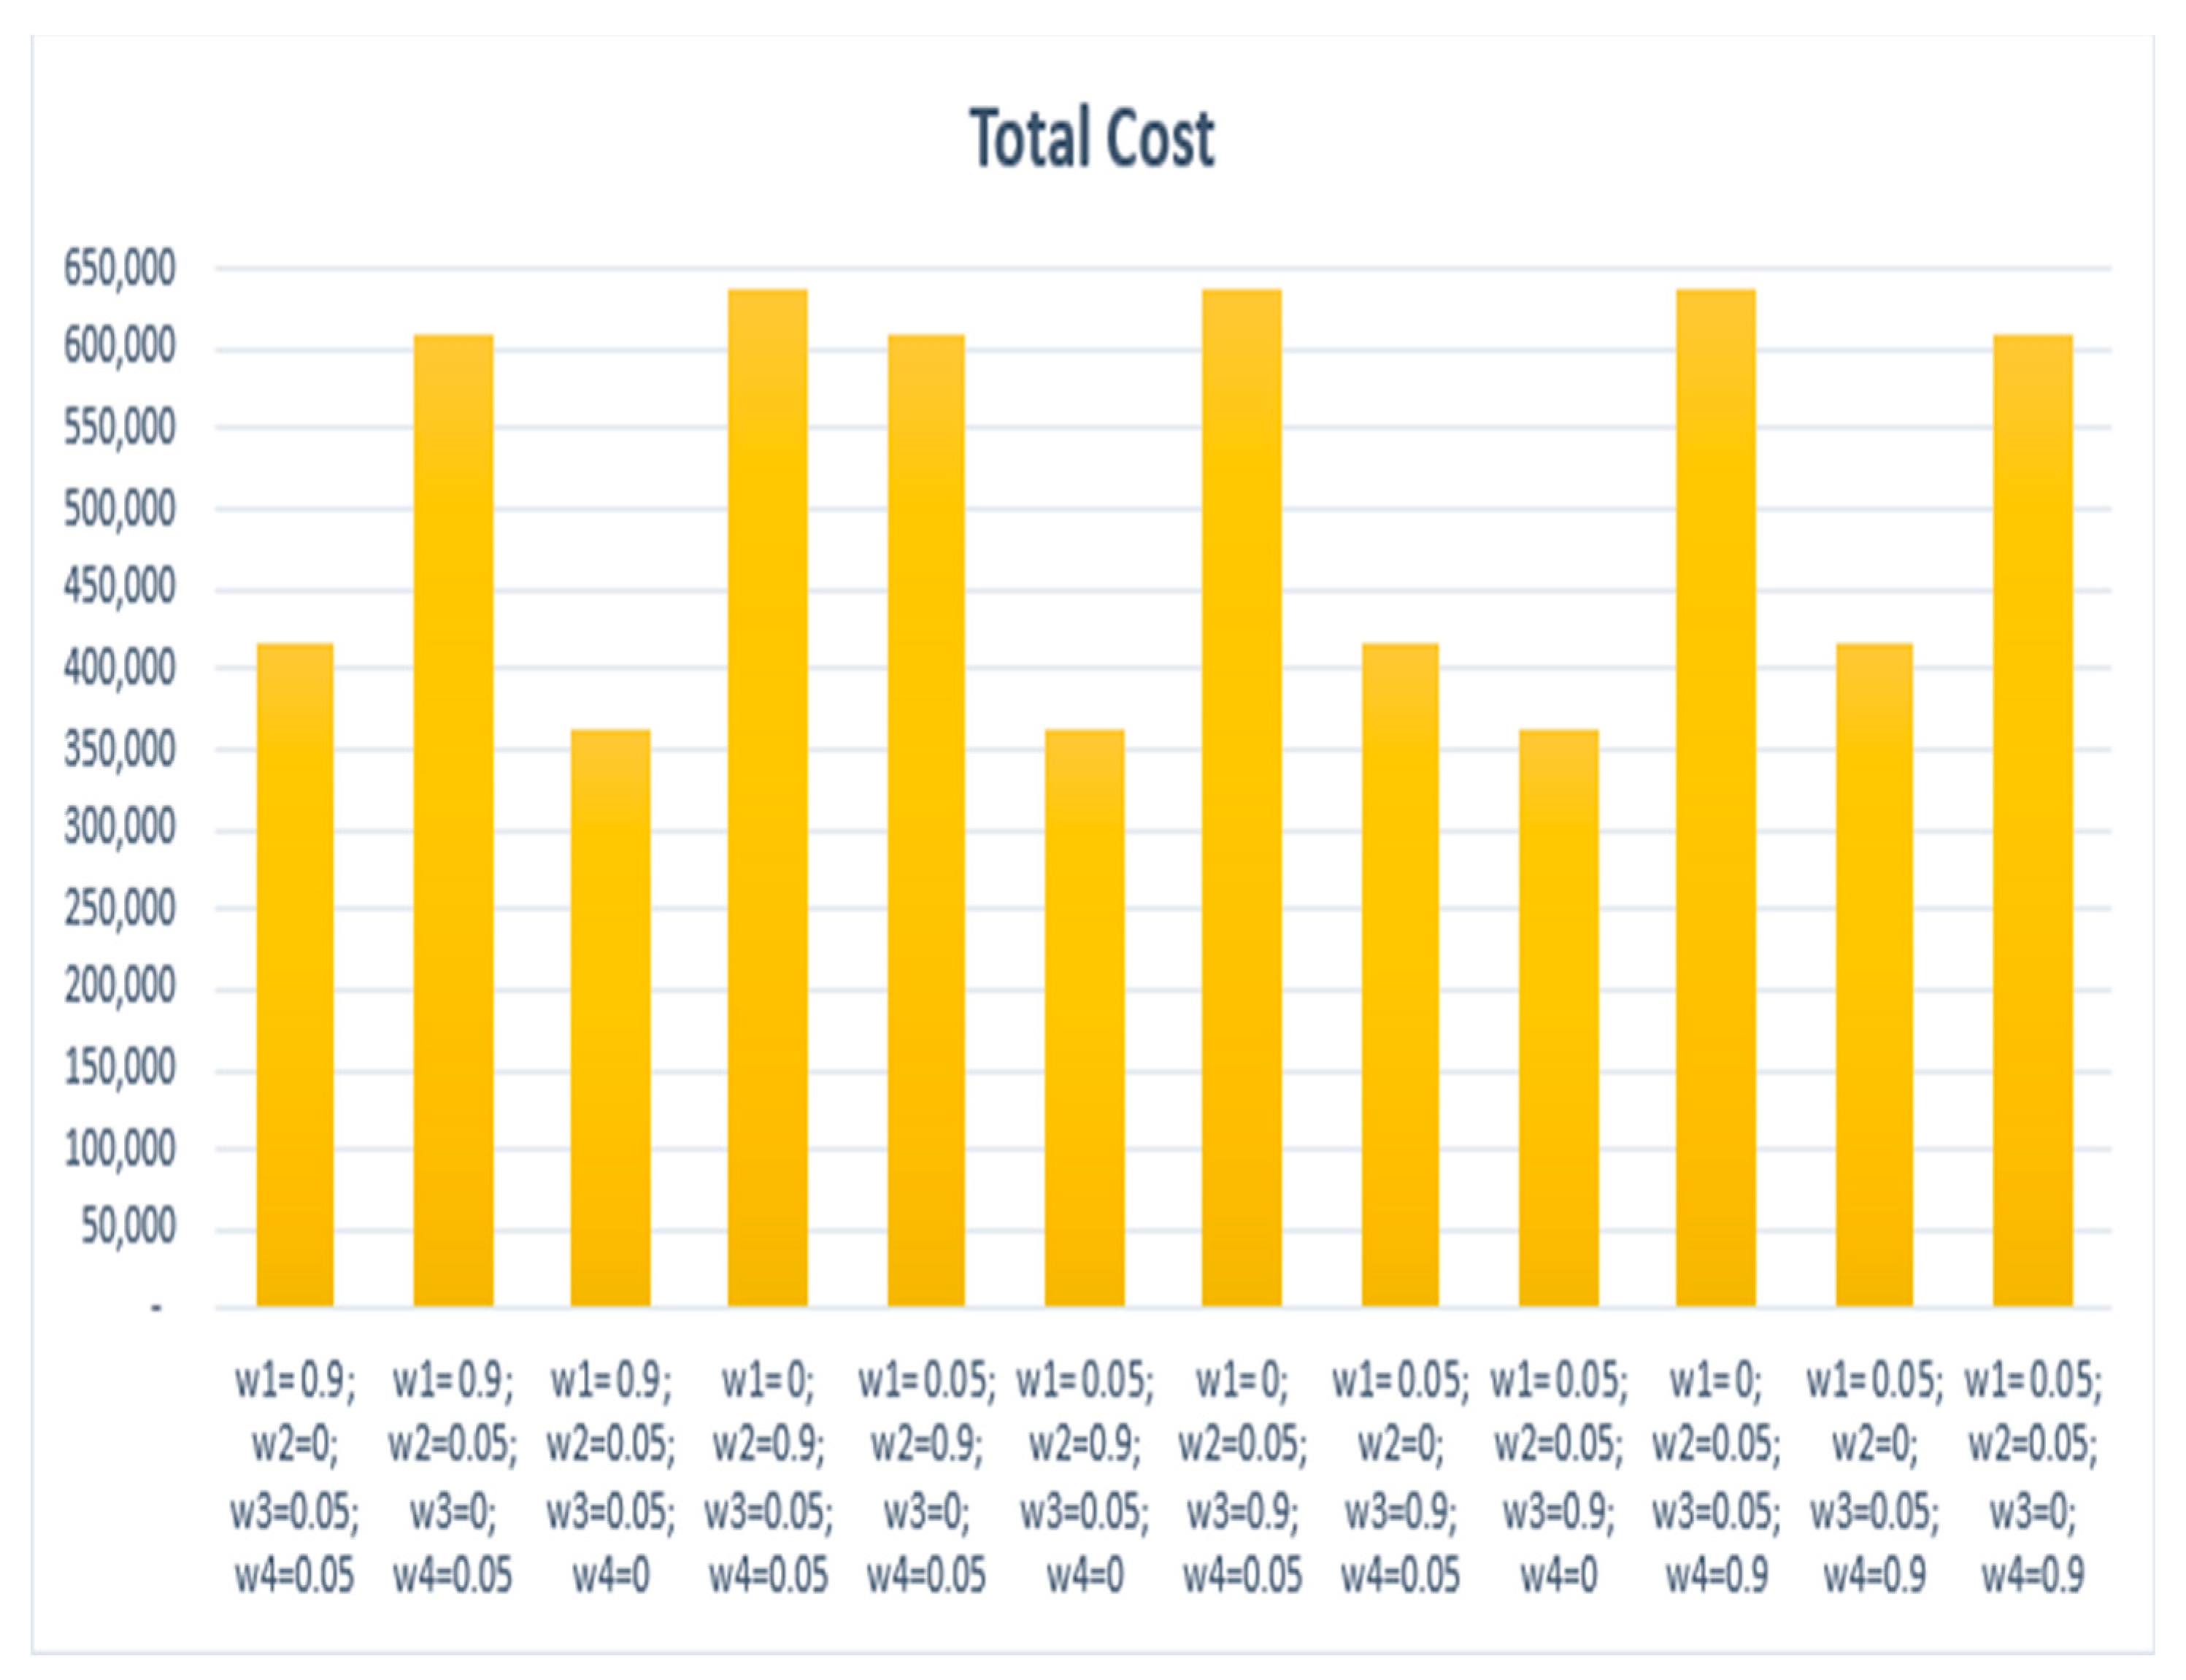
The weights of the objective functions in FSGP were changed to observe whether Total Cost, Late Delivered Units, Faulty Units, and Total Purchasing Value would change. First of all, in Mešić et al. [
59]’s approach, 30 different scenarios were created. The weight values obtained in the scenarios were placed in the FSGP, but no significant change was observed in the values of the 4 objective functions. Instead, the weight of objective function was taken as 0, the weight of another objective function was taken as 0.9, and the weights of the other objective functions were taken as 0.05. Thus, a total of 12 different scenarios were obtained. It has been observed that the most significant change in these scenarios is in the Total Cost objective function.
Figure 1 shows the change in the Total Cost objective function according to the scenarios.
As seen in
Figure 1, the lowest Total Cost value is when
is 0 and this value is 363,803 TL. In cases where Total Cost is highest, the value of
is 0 and this value is 638,054. As can be understood from here, the weight of the Total Cost objective function and the weight of the Total Purchasing Value objective function have a great impact on the value of the Total Cost objective function. Additionally, a questionnaire was conducted to test the reliability and feasibility of the proposed model. There are two questions in this questionnaire, and these questions were asked to the three senior managers from whom data were collected: (1) “Do you think the proposed model has achieved the correct results?”; (2) “Do you think the proposed model can be feasible for your company?” On a scale of 1 (certainly no) to 10 (absolutely yes), managers responded to every question. The results of the questionnaire are presented in
Table 9.
According to the average values in
Table 9, the results of the proposed model are correct for managers and can also be feasible in the company where the application is made.
5. Implications
The indicator of cost management is crucially determined by the overall expenditure of 610,795.8 Turkish Lira (TL) on the procurement of suppliers. It is essential for managers to diligently oversee and evaluate the many elements comprising this expenditure in order to uncover potential avenues for optimization, cost reduction, or negotiation with suppliers, hence augmenting the total cost-effectiveness.
The observation that 1525 units out of a total of 18,922 experienced delayed delivery serves as an indication of possible obstacles within the supply chain’s performance in terms of timely delivery. It is recommended that managers prioritize the optimization of logistics, including the streamlining of processes, the optimization of transportation routes, and the establishment of effective communication channels with suppliers. This approach aims to reduce lags and improve the overall efficiency of delivery operations.
The detection of 1499 defective units underscores the need of implementing rigorous quality control protocols. It is recommended that managers include rigorous quality inspections at several points throughout the supply chain in order to immediately identify and rectify any faults. Engaging in supplier collaboration to enhance the quality of goods has the potential to reduce the occurrence of defective units.
The Total Process Value (TPV) of 14,643.67 functions as a comprehensive metric that assesses the total effectiveness and worth produced across the various stages of the supply chain operations. Managers should strive to consistently enhance total process value (TPV) via the identification and elimination of inefficiencies, cost reduction, and the enhancement of delivery performance and product quality.
The levels of satisfaction for the objective functions () provide valuable insights into the attainment of certain objectives. Although the first and third goals have been fully achieved, the second and fourth objectives have been partially completed, with a satisfaction rate of 85.8% and 73.6%, respectively. It is recommended that managers conduct a comprehensive examination of these goals, ascertain the underlying factors contributing to the limited level of satisfaction, and execute specific tactics aimed at enhancing performance.
The statistics on claimed satisfaction levels and the percentage of objective function fulfillment are helpful for informing decision-making processes. Managers must use this information in order to make choices based on facts, give priority to areas that require development, and strategically deploy resources to solve crucial problems and take advantage of successful methods.
6. Conclusions
This paper proposed a comprehensive decision support model to mitigate the capability-based and performance-based risks in the context of SES. It involved FAHP, EDAS-F, and FSGP for evaluating qualitative and quantitative criteria for choosing supplier and distributing orders. The proposed FSIM was applied in a real case study drawn from the textile manufacturing industry, where quantity discounts and multiple planning periods are readily applicable. In this case study, the company purchased fabric from a set of suppliers with the condition of quantity discounts. At the beginning, the business’s managers provided a set of information to be used in assessing supplier capabilities to create a supplier profile to arrive at a shortlist of preferred suppliers. The combined scores of the decision-makers collected by FAHP and EDAS-F for each supplier were assessed in the pre-selection stage to screen the suppliers. Then, a group of suppliers were selected, and orders were distributed among them using the FSGP model in the detailed evaluation stage. The results confirmed that the proposed FSIM is capable of delivering significant benefits when making SES decisions involving quantity discounts.
FAHP and EDAS-F have been used in the proposed FSIM model to decrease the supplier number to a reasonable level in terms of capability-based risks, and fuzzy stochastic goal programming (FSGP) is applied to minimize performance-based risks, to choose suppliers and to distribute orders among these suppliers. The proposed FSIM contributes to the literature with its capacity to concurrently handle data that are qualitative, fuzzy, and stochastic objectives. Thus, this model helps firms to address the SES problem under uncertainty while considering a broad range of factors.
The integration of stochastic data into FSIM helps generate more stable and efficient solutions than fuzzy data alone. This model also can include different planning periods in the evaluation of candidate suppliers. Order quantity can be different for different periods; thus, the FSIM model can be beneficial in understanding the uncertainty involved with ordering over several periods. Additionally, FSIM considers quantity discounts as suppliers can offer different levels of discounts in different circumstances. The FSIM model may be useful for businesses seeking quantity discounts at the individual order level. Moreover, to solve the SES problem, FSIM incorporates stochastic objectives and fuzzy objectives. The FSIM model thus allows for solving the SES problem more comprehensively by taking both stochastic and fuzzy objectives into account.
In the future, transportation costs could be added to the proposed model to account for alternative transportation modes such as seaway, railway, or airway or any combination of those modes. The proposed FSIM model may also be modified to cover less-than-truckload (LTL) cases and other variations associated with shipping. For solving the SES issue in these cases, both stochastic coefficients and fuzzy objectives may need to be modified. Businesses which use stochastic and fuzzy data may also find this model useful. For instance, other qualitative factors related to SES such as financial liquidity and supply chain visibility may be considered with minimal changes to the proposed model.
From a model validation perspective, the proposed FSIM can be tested in other industry contexts with a large sample of organizations or datasets to further refine and improve its generalizability. With such future improvements, the proposed model could demonstrate its potential to serve as a practically useful SES tool.


