Article

A Hybrid Rule-Based Rough Set Approach to Explore Corporate Governance: From Ranking to Improvement Planning

Department of Banking and Finance, Chinese Culture University, Taipei 11114, Taiwan
Axioms 2024, 13(2), 119; https://doi.org/10.3390/axioms13020119
Submission received: 15 January 2024 / Revised: 8 February 2024 / Accepted: 9 February 2024 / Published: 11 February 2024

Abstract

:
This research introduces a rule-based decision-making model to investigate corporate governance, which has garnered increasing attention within financial markets. However, the existing corporate governance model developed by the Security and Future Institute of Taiwan employs numerous indicators to assess listed stocks. The ultimate ranking hinges on the number of indicators a company meets, assuming independent relationships between these indicators, thereby failing to reveal contextual connections among them. This study proposes a hybrid rough set approach based on multiple rules induced from a decision table, aiming to overcome these constraints. Additionally, four sample companies from Taiwan undergo evaluation using this rule-based model, demonstrating consistent rankings with the official outcome. Moreover, the proposed approach offers a practical application for guiding improvement planning, providing a basis for determining improvement priorities. This research introduces a rule-based decision model comprising ten rules, revealing contextual relationships between indicators through if–then decision rules. This study, exemplified through a specific case, also provides insights into utilizing this model to strengthen corporate governance by identifying strategic improvement priorities.

1. Introduction

According to a renowned survey by Shleifer and Vishny [1], corporate governance is a critical issue for the long-term prospect of a company. In their research, they stated, “Corporate governance deals with the ways in which suppliers of finance to corporations assure themselves of getting a return on their investment”. Therefore, to shareholders, corporate governance is as essential to a company as profitability [2] in the long-term.
Suppose there is a significant problem with a company’s corporate governance; this not only exposes the company to operational risks but could also result in bankruptcy and delisting, causing substantial losses for investors [3]. For example, the scandals involving Enron and Volkswagen sent shockwaves through the stock markets [4]. Enron engaged in accounting fraud, and Volkswagen installed software in their diesel cars to manipulate emissions during testing. These incidents have prompted both academia and industry professionals to closely monitor the evolution of corporate governance.
Though various theories compete to explain the root cause of the corporate governance problem, agency theory [5], emphasizing the principal–agent relationship, might be the most prevailing one. This study mainly employs agency theory to expound on the dynamics between shareholders and managers, taking the standpoint of shareholders (or principals) to assess agents.
While agency theory is widely acknowledged, it has its limitations, as highlighted by scholars such as Shleifer and Vishny [1] and Daily et al. [6]. The theory presupposes a contractual agreement between the principal and agent. Despite the theory’s assertion that contracting can resolve the agency problem, practical implementation encounters obstacles like information asymmetry, fraud, and transaction costs. Shareholders’ primary concern is profit maximization, yet their influence within the firm is constrained. Directors are primarily tasked with monitoring managers. The theory portrays managers as opportunistic, overlooking their competencies [5]. While adhering to agency theory, this study also acknowledges its limitations.
In Taiwan, the Securities and Future Institute (SFI), aware of its importance, launched the Corporate Governance Evaluation System (CGES) in 2014 [7], which requires listed companies to be evaluated. However, CGES incorporates over 80 indicators across four dimensions, posing challenges for investor comprehension. Additionally, the model assumes independent relationships between its indicators, a premise deemed unrealistic. Consequently, this study seeks to establish a model that avoids the need for assuming independence among its indicators. Furthermore, the evaluation model aims to uncover contextual relationships between essential indicators.
In other words, the theoretical foundation of this study is the agency theory, which leverages the framework—four evaluation dimensions—from the CGES model. The four dimensions cover over 80 indicators, and this work extracts 13 indicators based on experts’ opinions in the previous research [8] to construct a novel corporate governance evaluation model.
To address these objectives, rough set theory (RST) [9] is applied. RST concentrates on the indiscernibility of objects, leading to the induction of decision rules. In contrast to statistical methods, RST does not require assumptions about the probability distribution of a dataset [10]. Instead, it derives logical relations between the condition and decision attributes, referred to as decision rules.
Furthermore, this study employs a two-stage rough approximation approach. The initial stage involves a major approximation using larger granules, under the assumption that larger granules may induce typical knowledge, while smaller granules capture non-typical knowledge. The major approximation is geared towards achieving a broader understanding of the data. Following the generation of the major group of rules, this study proceeds to the second stage, conducting a minor approximation using smaller granules. This two-stage approach facilitates the exploration of various granule sizes and refines the rules obtained in the process.
To sum up, this study proposes a multiple-rule-based approach [11] to evaluating corporate governance. The proposed approach is based on RST, which will be briefly discussed in the next section. The significant contributions of this study are two-fold: (1) proposing a novel multiple-rule-based approach to evaluate corporate governance and (2) inducing the associated knowledge for ranking and improvement planning.
The following discusses the four dimensions of corporate governance and related works based on RST. Section 3 explains the rule-based rough set approach. Section 4 discusses the outcome and how to use the model for improvement planning. And Section 5 concludes this work.

2. Literature Review

The theoretical landscape of corporate governance has seen significant advancements in recent research, reflecting the dynamic complexities of contemporary business environments. Jensen and Meckling’s seminal contribution [12] to agency theory has been particularly influential, establishing the groundwork by delving into principal–agent relationships and formulating governance structures.
Subsequent to this, Davis, Schoorman, and Donaldson [13] introduced the Stewardship Theory, offering a different perspective that emphasizes trust, shared values, and long-term relationships between managers and shareholders.
Freeman’s Stakeholder Theory [14] has gained prominence in stakeholder engagement by broadening the focus beyond shareholders to include various stakeholders. This approach underscores the significance of considering the interests of all stakeholders for sustainable and ethical business practices.
In summary, recent theoretical developments in corporate governance draw from diverse perspectives, encompassing insights ranging from agency theory to Stewardship Theory and Stakeholder Theory. These frameworks contribute to a nuanced understanding of governance practices and relationships, reflecting the multifaceted nature of corporate governance.
The agency problem [11] is a fundamental concept yielded from the agency theory in corporate governance, reflecting the inherent conflicts of interest between various stakeholders in a company. It arises when the goals and interests of company managers or directors (agents) differ from those of the shareholders (principals). The divergence of interests may lead agents to prioritize their welfare over shareholder value.
Another important concept, information asymmetry [15], is when one party in a relationship possesses more or superior information than the other. In the context of corporate governance, information asymmetry can lead to challenges and conflicts of interest between various stakeholders, particularly between company management and shareholders. Effective corporate governance practices aim to mitigate information asymmetry and ensure the transparency, accountability, and fair treatment of all stakeholders.
Several key aspects of the relationship between information asymmetry and corporate governance are (1) Disclosure and Transparency [16], (2) Board Oversight [17], (3) Auditing and External Reviews [18], (4) Fair Treatment of Shareholders [19], and (5) Communication Strategies [20].
Companies are required to disclose relevant information to the public and shareholders regularly. Timely and accurate financial reporting and comprehensive disclosure of material information help to reduce information asymmetry by providing all stakeholders with the necessary information to make informed decisions.
Corporate governance structures typically involve a board of directors overseeing managerial decisions. An independent and well-informed board can act as a check on potential abuses of information by management, ensuring that decisions align with the interests of shareholders.
Effective audits conducted by independent parties contribute to reducing information asymmetry. Internal auditing also plays an influential role in information asymmetry. Corporate governance principles often emphasize the Fair Treatment of Shareholders. Companies can adopt effective Communication Strategies to bridge information gaps. Regular communication with stakeholders through investor relations activities, conferences, and online publications can enhance understanding and reduce uncertainty.
In addition to the three discussed theories or concepts, corporate social responsibility (CSR) represents another crucial dimension of corporate governance. CSR and corporate governance are interlinked components reflecting a company’s dedication to ethical, social, and environmental responsibility and the structures governing its operations. In their study, Hajoto and Jo [21] found that CSR engagement positively influences operating performance and firm value, using a large sample of firms during the 1993 to 2004 period. On the other hand, the empirical results from listed companies in Taiwan indicate that controlling shareholders with entrenched control, as evidenced by CEO/chairman duality and family control, are less inclined to engage in CSR activities [22]; they also found that CSR performance is positively correlated with a firm’s financial performance. Therefore, past research indicates a positive relationship between CSR, company operations, and financial performance.
This study contributes to the field by demonstrating its unique features and distinguishing characteristics from prior research into corporate governance. It sets itself apart through innovative methodologies, a nuanced approach to key concepts, and incorporating recent developments and references. By providing fresh perspectives, addressing existing gaps, and introducing rule-based insights, this study enriches the understanding of corporate governance, making it a valuable addition to the existing body of knowledge in the field.
The aforementioned agency theory, agency problem, information asymmetry, and CSR in corporate governance shape the theoretical foundation for devising an evaluation system. Further discussions will be provided in Section 2.1.
The following addresses three main topics. Initially, it delves into the assessment dimensions of corporate governance using CGES, and discusses the theoretical foundation or origins of the four crucial dimensions. Secondly, it explores the application of RST in modeling. Lastly, it discusses the utilization of RST as an innovative approach for investigating corporate governance.

2.1. Four Dimensions of Corporate Governance

The ultimate goal of the CGES is to help investors to identify firms with effective corporate governance and, thus, superior financial performance in the long term [23]. Critical components of corporate governance include the protection of shareholders’ interests, a capable board of directors, effective communication with shareholders, and the sustainability of firms. Likewise, the CGES divides the evaluation of corporate governance into four dimensions:
(1)
Protecting shareholders’ rights and interests and treating shareholders equitably;
(2)
Enhancing board composition and operation;
(3)
Increasing information transparency;
(4)
Putting CSR (corporate social responsibility) into practice.
The first dimension focuses on protecting shareholders’ interests and treating shareholders equitably. Due to the agency problem, from the principal’s perspective, it is necessary to employ various means to safeguard their interests and prevent expropriation by the agent. Ensuring investor protection is essential due to the widespread occurrence of the expropriation of minority shareholders and creditors by controlling shareholders.
According to [24], “corporate governance is, to a large extent, a set of mechanisms through which outside investors protect themselves against expropriation by the insiders”. The expropriation could be the remuneration to board directors, which is too high considering its net profits. A well-defined dividend policy [25] and performance-based compensation to board directors [26] may render shareholders to be treated equitably. Moreover, protecting shareholders’ interests [27] is a fundamental aspect of corporate governance, ensuring that the company’s management and board of directors act to maximize shareholder value and treat shareholders equitably.
H1. 
Protecting shareholder rights and interests and treating shareholders equitably positively relate to higher corporate governance performance.
The second dimension is related to board composition and operation. This aspect connects information asymmetry and the influence of governance structures to the operations of management. The composition and functioning of the board play a pivotal role in corporate governance. As a critical element in the governance structure, the board of directors is responsible for overseeing the company’s management and ensuring alignment with shareholders’ interests. Independence, diversity, and expertise are the key concerns of board composition. Based on [28], the composition of a board of directors would influence the sustainability performances of firms. Weisbach [29] claimed that outside directors are crucial in monitoring management. Previous research [30,31] generally agrees that different aspects of board composition influence a firm’s financial performance. The prevailing perspective in empirical finance suggests a strong association between the level of board independence and its composition. It is commonly assumed that the board’s independence grows proportionally with an increased number of external directors [32]. In the meantime, several symptoms of board composition may lead to inferior corporate governance. Negative examples are family members or relatives serving as members of the board of directors [33]. How a board operates also matters. For instance, the head of the internal audit committee attends board meetings and provides internal audit reports as supporting evidence of a well-operated board.
H2. 
Superior board composition and operation positively relate to higher corporate governance performance.
Thirdly, information transparency is essential to ensure effective corporate governance [34]. This aspect, based on information asymmetry, requires enhancing information transparency to improve corporate governance. In practice, the accounting and auditing information are the keys to communicating with shareholders. Transparency involves the clear and open disclosure of relevant information to stakeholders, such as shareholders, investors, employees, customers, and regulators. Aside from standard information requested from the authority, providing the detailed remuneration of directors and supervisors and the financial forecast of a firm are recognized as positive signals to corporate governance. According to [35], voluntary disclosure and corporate governance are positively associated with firm value.
H3. 
Increasing information transparency positively relates to higher corporate governance performance.
The fourth dimension is putting CSR into practice. CSR refers to a company’s proactive endeavor to integrate social and environmental concerns into its operations and seek business sustainability. Chan et al. [36] found that companies filing CSR reports have better and higher audit committee quality. Investors are aware of the importance of CSR [37], which suggests that CSR actions boost firms’ long-term prospects. Also, according to [38], CSR engagement positively influences corporate financial performance; companies that spend more on CSR experience a corresponding increase in revenue and profitability. In contrast to accounting performance, which solely assesses business performance, the ESG score considers environmental, social, and governance factors, thereby reflecting long-term performance [39].
H4. 
Putting CSR into practice positively relates to higher corporate governance performance.
In reviewing the literature on corporate governance, the measurement of corporate governance is often approached through various frameworks, with the CGES model being a notable reference. The CGES model encompasses four critical dimensions for assessing corporate governance. As researchers and practitioners seek to enhance the understanding of corporate governance, the CGES model offers a comprehensive framework for evaluating and benchmarking governance practices across these four critical dimensions.

2.2. Rough Set Theory

As proposed by Pawlak [40], RST deals with the indiscernibility among a set of objects. RST assumes that for every object of the universe of discourse, some information (knowledge) is associated [41]. The mathematical foundation of RST includes set operation, discernibility matrices, and information systems. The core idea of RST lies in dividing data into lower and upper approximations (which will be explained in Section 3) and identifying patterns while incomplete or vague information exists. Its rough approximation capability allows us to reach conclusions on the form of decision rules.
RST has been used in various fields, such as feature selection, rule induction, and classification tasks, showing a unique approach to analyzing uncertainty and incomplete information. RST has been applied in decision-making, ranging from rule extraction and attribute reduction to knowledge discovery. Its contributions to certain decision-making problems are evident.
However, the classical RST cannot process preferential attributes with dominance relation, often required in decision-making problems. To bridge the gap, Refs. [42,43] introduced the dominance-based rough set approach (DRSA) to connect the RST and decision-making research. DRSA focuses on capturing dominance relationships within data. In DRSA, if an object i dominates an object j on all the considered condition attributes, its decision attribute should also dominate object j, which is called consistent in DRSA. The DRSA has been applied in various applications, ranging from finance [44,45] to marketing [46]; its extension is variable-consistency DRSA (VC-DRSA) [47].
The proposed approach, by this study, leverages the dominance-based rough approximations [42] to obtain two groups of rules: (1) a major and (2) a minor group of decision rules. The two groups of rules indicate the requirements (antecedents) for a company to be included in the superior decision class (i.e., superior performance in corporate governance). The above discussion indicates the need for new analytical approaches in corporate governance and the development of innovative assessment models. A model based on RST is well suited to this task. In Section 3, we will introduce RST and how it can be applied in constructing a corporate governance model.

2.3. Corporate Governance and Rough Set Theory

Corporate governance plays a pivotal role in shaping organizations’ strategic direction and performance. As businesses become more complex and interconnected, the need for effective governance mechanisms becomes increasingly apparent. Researchers have recently explored innovative approaches for analyzing corporate governance processes. One such approach is the integration of RST, a mathematical framework to deal with imprecision and vagueness in decision-making.
Several empirical studies have explored the potential benefits of integrating RST into corporate governance or ESG (environment, social, and governance) practices. These studies often focus on the analysis of financial data, risk management, and strategic decision-making. For instance, Garcia et al. [48] used corporate financial performance to forecast the ESG rating using a rough set approach. Their result shows that the variables under consideration prove valuable for predicting the ESG rank within the context of firms grouped into three or four equally balanced clusters. Another study [49] used financial and non-financial variables, including corporate governance, to forecast the financial distress of Chinese listed firms. Those works adopt the classification capability of RST to analyze data. Karimi and Hojati [50] used a hybrid rough and grey set to create a rule model system to measure the sustainability of banks. The studies mentioned earlier focused on either ESG or sustainability, and the emphasis on the application of corporate governance is still to be explored.

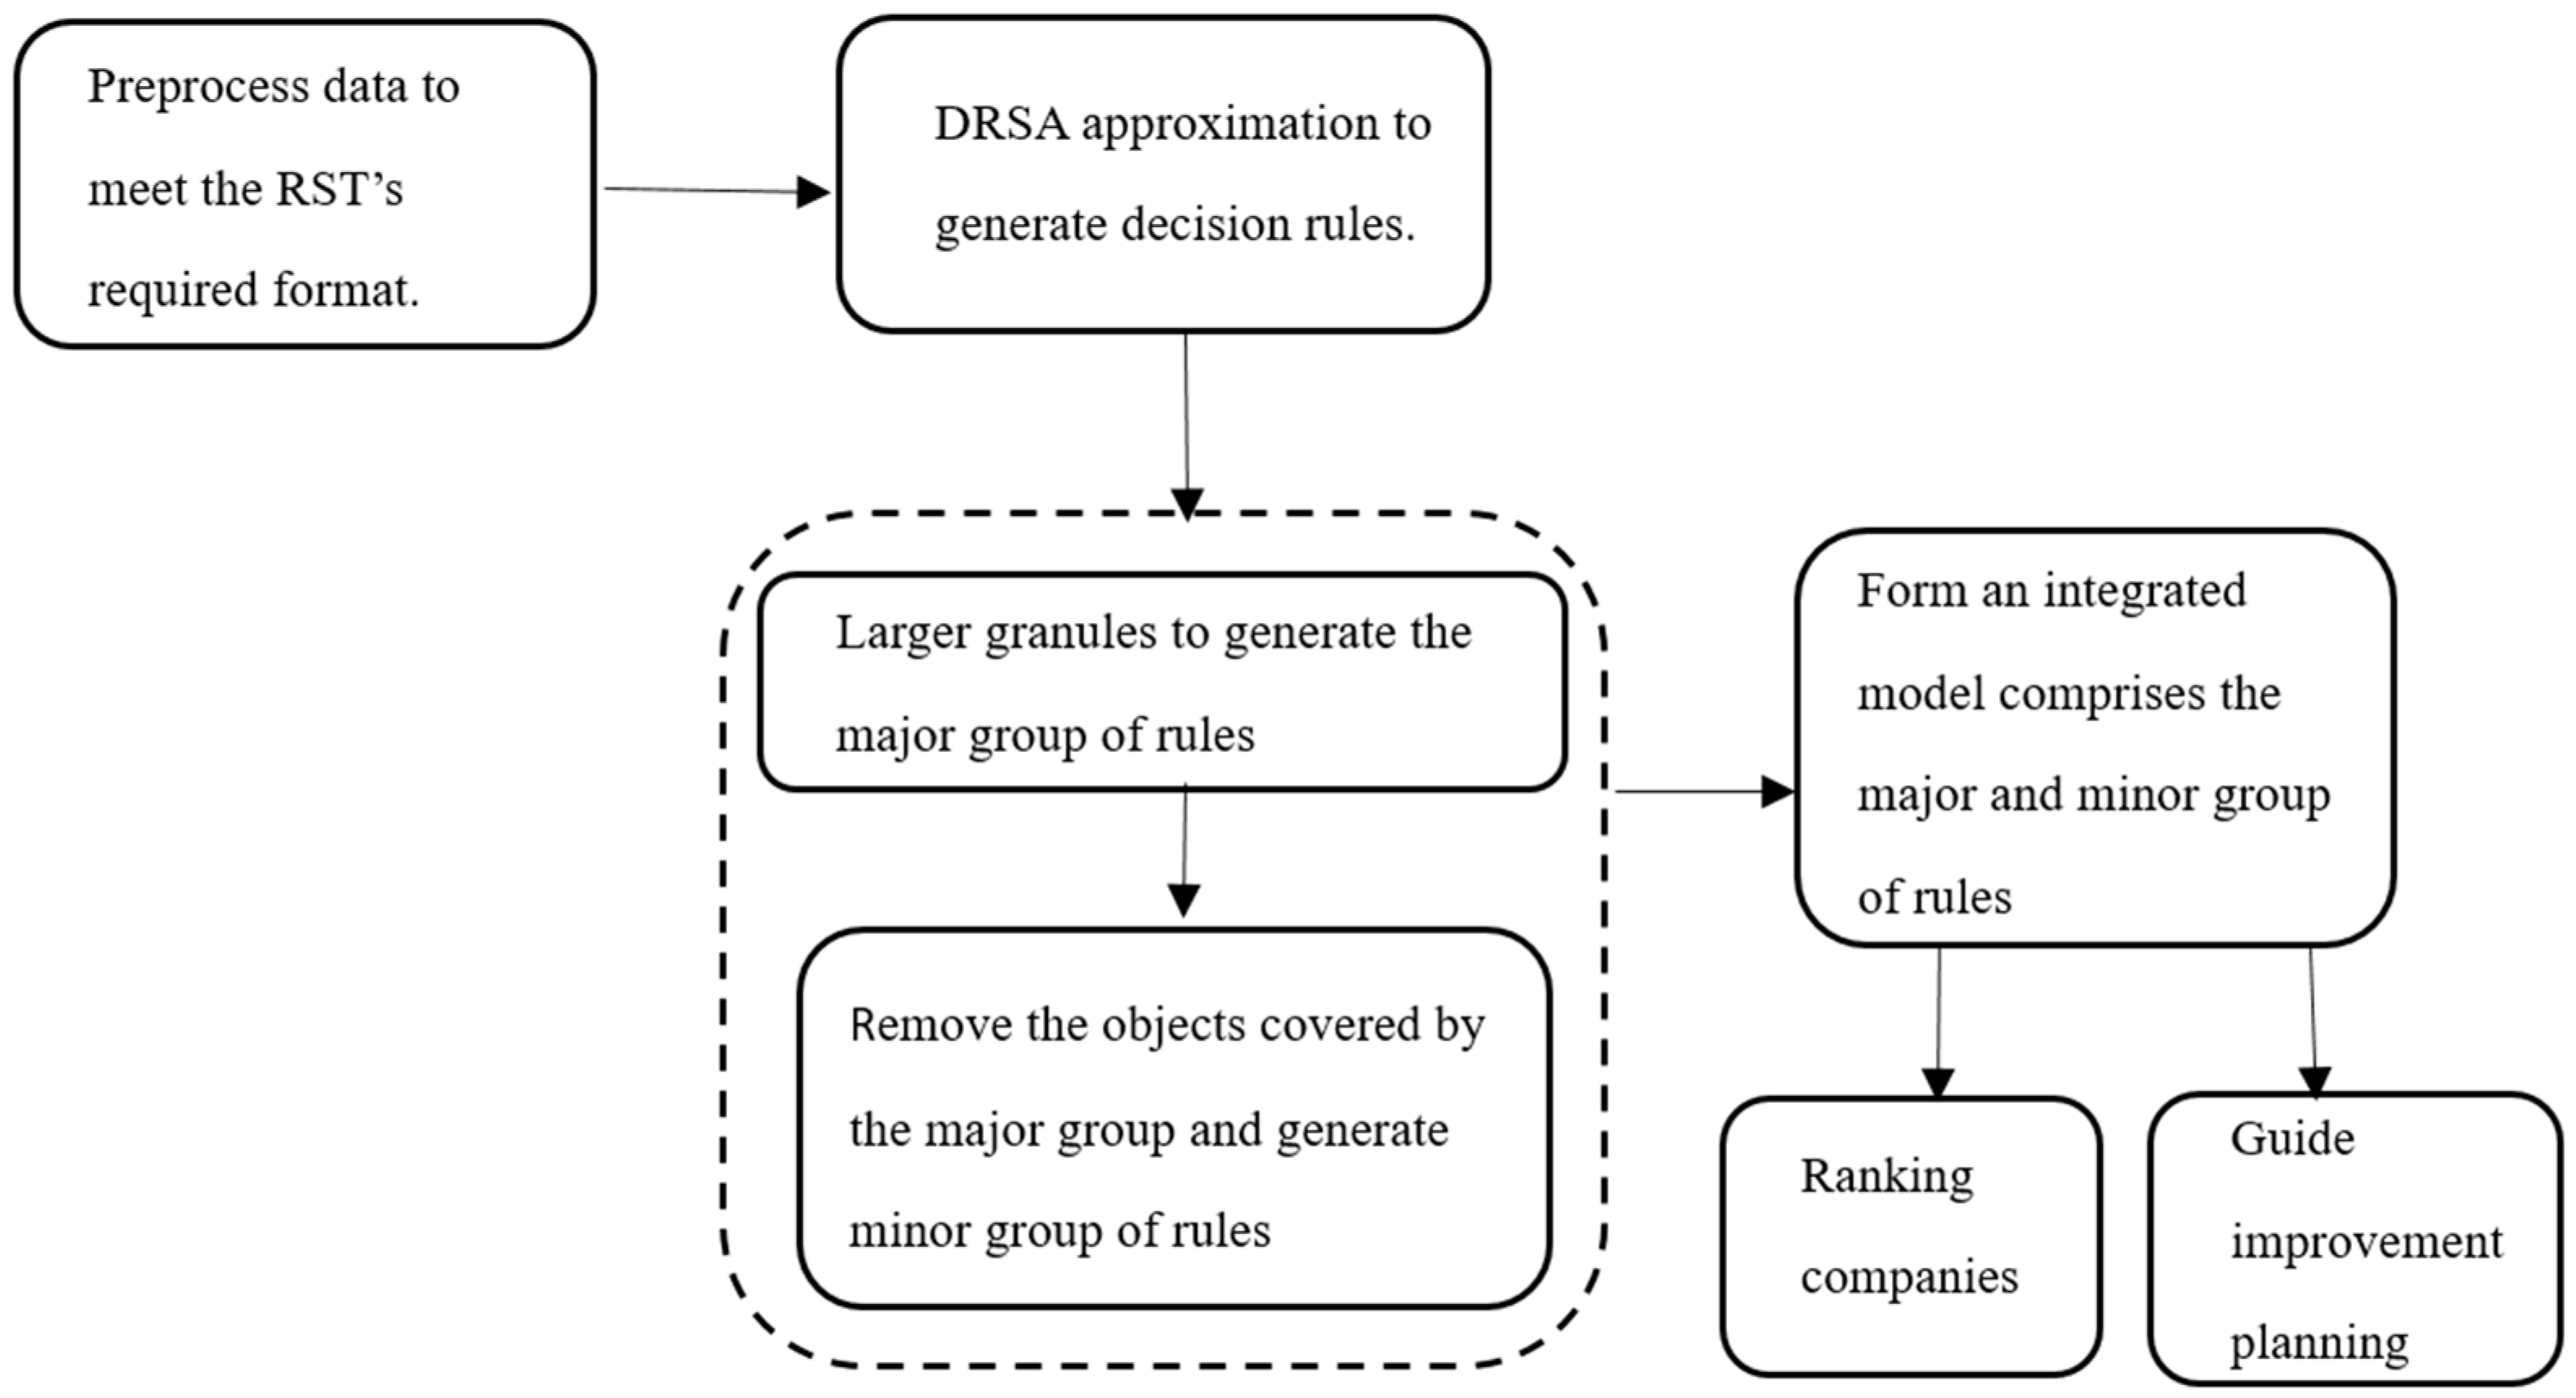
3. Multiple Rule-Based Decision-Making Model

The research comprises four parts: (1) preprocessing data, (2) conducting DRSA approximation, (3) selecting decision rules from the two groups to form a weighting system, and (4) evaluating sample stocks. The four stages are summarized below. The research flow is shown in Figure 1.

3.1. Data Preprocessing

As mentioned earlier, this study adopted the data from the SFI and reorganized it in the form of a decision table. It was based on a previous work [8], which applied the Delphi method to retrieve 13 refined attributes from the 85 indicators of the CGES [8], as shown in Table 1. This study selected 72 and 86 sample stocks from the SFI reports in 2018 and 2019, respectively. The 13 attributes denoted the condition attributes of an object (i.e., a sample stock), and the ranked result from the SFI was regarded as the decision attribute. Each condition attribute was assigned as Low (1), Mid (2), or High (3) based on the domain expert’s opinions. The expert possesses more than two decades of experience, having served as a CEO, general manager, and board member in multiple securities companies in Taiwan. Additionally, the expert brought extensive experience in board operations. The expert received each company’s associated annual reports and highlighted figures, providing the grading for each condition attribute of the companies. The decision attribute was divided into three (major) and five (minor) classes based on the SFI’s reports.
In Table 1, the indicators employed in this study are drawn from CGES, having only conceptual relevance to prior research and lacking direct operational definitions. For instance, concerning C2, a preceding study identified a negatively significant relationship between the stock pledge ratio and corporate governance quality [52]. C4 is linked to the family control variable [53]. Furthermore, regarding C8 and the voluntary disclosure of financial forecasts, the prior literature typically utilized disclosure indices to depict voluntary disclosure [35,54,55,56,57].

3.2. Rough Approximations

Rough approximation begins by defining a 4-tuple information system: I S = U , A , V , f , where U is a finite set of universe with n objects, and A is a finite set of p attributes that comprises p-1 condition attributes (i.e., C) and one decision attribute a D (i.e., A = C D and C D = ). V is the value domain of A, where f is a total function that f x , a k V (for each x U and a k A ). An object can be categorized in only one class among a finite set of classes (Cls), such that C l = C l t : C l 1 , C l 2 , , C l h for t = 1, …, h. An outranking relation can be defined as ¯ a k for any a k A and o i , o j U . If o i ¯ a k o j   ( i n , j n ; i j ) , it means “ o i is at least as good as o j regarding the condition attribute a k ”. The predefined preference order, thus, constitutes an upward and a downward union of Cls: (1) C l t ¯ = s ¯ t C l s and (2) C l t ¯ = s ¯ t C l s . Thus, if o i dominates o j on a partial set of C (i.e., P C ), it is a set of objects in U that dominates o i considering P , which can be denoted as o i P o j . Thus, if a set of objects is dominating o i regarding P, this set is denoted as D P o i = o j U : o i P o j (i.e., the P -dominating set); similarly, if a set of objects is dominated by o i regarding P , D P o i = o j U : o j P o i (i.e., the P -dominated set). And P -lower and P -upper approximations of an upward union of Cls are defined in Equations (1) and (2):
P ¯ C l t = o U : D P o i C l t
The boundary region of approximation is B o u P = P ¯ C l t ¯ P ¯ C l t ¯ . Thus, the three types of rough approximations support generating decision rules. The details are found in [42]. Furthermore, the quality of approximation ϖ P C l is defined as Equation (3), and the rough approximation aims to generate decision rules with high-quality approximation. In addition, the DOMLEM algorithm [43] was adopted to generate decision rules for this work, which attempts to induce a minimal set of rules covering all objects in a decision data table.
ϖ P C l = U t 2 , , T B o u P C l t ¯ / U
In this study, there were 13 condition attributes (i.e., p = 14 ), referring to [7] (Table 1). Also, a D (D) was assigned as three (i.e., Bad (B), Mid (M), Good (G)) at first, then five (Vbad (VB), Bad (B), Mid (M), Good (G), Vgood (VG)) Cls to generate a major and a minor group of rules, respectively. Since fewer decision classes implied rougher approximations, the one assigned three decision classes was regarded as the major group, and the one with five decision classes was the minor group.
After obtaining the major group of rules, we excluded the covered objects in the selected decision rules and subdivided the decision class (DC) into five to obtain minor rules. This gradual process, called progressive exploration in this study, was derived from a rough division to a more detailed exploration.

3.3. Rules Selection

While selecting rules, this study only considered upward unions of classes. The data from 2018 were used as the training set, and the data from 2019 were used as the testing set. The reclassification of the major group of rules in 2018 and 2019 reached 58.33% and 68.61%, respectively. Using the 2018 rules to reclassify 2019′s data, it reached 58.14%. The details are shown in Table 2. The rules associated with at least Mid (M) and Good (G) DC were selected; the rules related to “at most” are shown in Table A1 of Appendix A. In the first approximation, the model generated the major group of rules (i.e., only three DCs), shown in Table 3. Only the ones associated with at least Mid or Good were selected to form the model. After removing those objects covered by the rules from the major group, the remaining data were further divided into five DCs and conducted rough approximation. Similarly, only the rules associated with at least Mid, Good, or VGood were selected. The rules obtained termed the minor group of rules, are listed in Table 4. The rules associated with “at most” are shown in Table A2.
The minimal reclassification rate was set at 50%; all the figures passed this threshold, which indicates the consistency of this model.

3.4. Evaluate Sample Stocks

The final corporate governance performance was calculated by synthesizing the scores on each rule. In Equation (4), · is cardinality and w i is the weighted support of the i-th rule. R i is the number of antecedents of the i-th decision rule, and P i j is the performance score of the object j that satisfies the antecedents on the i-th rule. In Equation (4), d k = 1, 2, and 3 while the R i is associated with Mid, Good, and VGood, respectively. w i , P i j , R i are from the major group of rules, and w k * , P k j * , R k * are from the minor group.
S j = α × i = 1 n w i × P i j R i × d k + 1 α k = 1 m w k * × P k j * R k * × d k , where   i = 1 , 2 , , n   and   j = 1 , 2 , , m .
After assigning α = 80 % to the major group and 20% to the minor one, the final weighting can be achieved. The data from the 2018 sample reached 58.33% classification accuracy. The major group selected six upward decision rules based on their supports. The supports of a rule denote the number of objects that satisfy the requirements of a rule. The higher, the better. And four decision rules from the minor group were selected. The major and minor groups of rules are shown in Table 3 and Table 4, respectively.
Take the rule with the highest weighted supports for instance R5: (C1 3), (C5 3), (C6 3), and (C12 3) => D ¯ Mid . The conjunction of the four requirements leads to DC ( D ¯ Mid ). c1 is the “Ratio of remuneration of directors and supervisors to net profit before distribution of dividends”. c5 is “Independent directors put forward opinions on major proposals on the board of directors and deal with them.” c6 is “Audit committee’s handling of major proposals”. c12 is “Proactively reveal the identity of interested parties and establish communication channels and response methods”. The four criteria must be as good as “high”, which leads DC to be at least as good as Mid.
The ratio of remuneration of directors and supervisors to net profit before the distribution of dividends is intertwined with corporate governance principles, emphasizing the importance of fairness and alignment with overall company performance. The involvement of independent directors on the board of directors in major proposals is essential for upholding corporate governance principles. Their independence, objectivity, and active participation contribute to effective decision-making processes that prioritize the company’s and its stakeholders’ long-term interests. The audit committee’s handling of major proposals is integral to corporate governance by ensuring that decision-making processes align with the company’s objectives [59]. This oversight helps foster trust among stakeholders and contributes to the long-term success and sustainability of the organization. This contextual relationship suggests the importance of independent directors and supervisors. Also, the internal control function of the audit committee is crucial [60]. Rule 5 shows that those requirements must all be high (3) for an object to be categorized in at least Mid (M).
The two groups of rules were synthesized by assigning 80% to the major group (six rules) and 20% to the minor group (four rules). Those decision rules examined four sample stocks’ (i.e., TSMC, Foxconn, Secom, and Zinwell) corporate governance performances in 2019. If a rule has six antecedents, and a company satisfies four of them, its score on that rule will be 4/6. The four companies’ corporate governance scores for the 13 criteria are shown in Table A3.
The first company was TSMC. Since it satisfied all the antecedents, its score was 100%. The second company was Foxconn, the most prominent EMS (Electronics Manufacturing Services) company. The third company was Secom, the largest security company in Taiwan. The fourth was Zinwell, a communication equipment manufacturing company. Their scores were as follows:
Foxconn = 80 % × 8 % × 4 6 + 18 % × 1 2 + 17 % × 2 3 + 14 % × 3 4 + 22 % × 3 4 + 21 % × 3 4 + 20 % × 23.08 % × 2 4 + 30.77 % × 1 3 + 23 . 08 % × 1 3 + 23 . 08 % × 3 4 = 80 % × 68.42 % + 20 % × 46.80 % = 64.09 %
Secom = 80 % × 8 % × 3 6 + 18 % × 1 2 + 17 % × 1 3 + 14 % × 2 4 + 22 % × 3 4 + 21 % × 2 4 + 20 % × 23.08 % × 2 4 + 30.77 % × 1 3 + 23 . 08 % × 0 3 + 23 . 08 % × 2 4 = 48.80 %
Zinwell = 80 % × 8 % × 3 6 + 18 % × 0 2 + 17 % × 1 3 + 14 % × 1 4 + 22 % × 1 4 + 21 % × 1 4 + 20 % × 23.08 % × 1 4 + 30.77 % × 0 3 + 23 . 08 % × 0 3 + 23 . 08 % × 0 4 = 20.24 %
The final scores of each company are shown in Table 5. The ranking result is consistent with the one from the SFI (i.e., TSMC Foxconn Secom Zinwell), which suggests the validity of this model. Moreover, for the robustness of the result, α = 90 % (90% and 10%) and α = 70 % (70% and 30%) weightings for the two groups of rules were conducted, which also suggests the same ranking, as shown in Table 5.

3.5. Research Limitations of MCDM Methods

One of the significant limitations of this model is that this approach heavily relies on the expert’s judgments. However, most MCDM (multiple-criteria decision-making) research requires opinions from domain experts or decision-makers as inputs to form a subjective weighting system; examples are the well-known AHP (Analytic Hierarchy Process) [60], ANP (Analytic Network Process) [61], DEMATEL (Decision-Making Trial and Evaluation Laboratory) [62], and DANP (DEMATEL-based ANP) [10,63] methods.
This study’s key difference was that experts did not judge the relative importance of each criterion; instead, it asked the expert to judge the relative performance of each object on each condition attribute, ranging from three to one. The RST, not the expert, approximated the relative importance of each rule. This method’s advantage lay in its ability to generate objective support weights without the need for pairwise comparisons of criteria, as required in conventional MCDM methods [10].
Compared to CGES, CGES does not determine the weights of individual criteria. Instead, it assesses whether over 80 indicators have been met, using this information to calculate the scores for individual companies. The outcome involves various indicators, such as A, B, AA, A+, Extra Plus, and Extra Minus [7]. The two EXTRA indicators do not have specific grading guidance, having heterogeneous impacts on a company’s overall evaluation, which are not included in the four dimensions.
Summarizing the three approaches of scoring methods mentioned above, each had advantages and disadvantages, all requiring expert assessment. The following section will compare the ranking results obtained from these three approaches to explore the effectiveness of this study.

3.6. Comparison with the DANP Approach

By leveraging previous research [8], incorporating DANP weights [10], and integrating expert evaluations for the 13 criteria pertaining to these four companies, we computed their scores and rankings. The DANP weights and final scores of the four companies are shown in Table 6.
The ranking result was consistent with the proposed approach and the CGES (i.e., TSMC Foxconn Secom Zinwell), which shows the validity of this work.

4. Discussion

4.1. Implications of the Critical Criteria

This model not only aids in assessing individual stocks but also allows for further analysis (Table 7) to demonstrate the relative importance of each criterion within the set of ten rules.
In Table 7, it is shown that C6 C1 = C3 = C4 C12 C5 = C8 = C13 C2 = C11 C7 = C9 = C10. Below, I will discuss the relationship between significant criteria and the previous literature to obtain a more comprehensive understanding.
In this rule-based model, C6 appears in seven rules and is the most important. C6 is “The company exposes the results of the resolution of the audit committee on the major proposals and the degree of disclosure of the company’s handling,” which indicates the critical role of the audit committee. Previous research [18,59,64] concluded that audit committee independence and frequent audit committee meetings improve corporate governance performance. Moreover, voluntary disclosure of the company’s handling of these major proposals can enhance information transparency. Thus, the foundation of C6 is information transparency. In addition, C6 falls under “Enhancing board composition and operation” (dimension 2), supporting hypothesis H2.
In the next aspect, the importance of C1, C3, and C4 is identical, with each criterion appearing in six rules. C1 is “Ratio of remuneration of directors and supervisors to net profit before distribution of dividends”, C3 is “The proportion of seats held by government agencies or single-listed companies and their subsidiaries on the board of directors,” and C4 is “Proportion of general manager (executive director) board members, spouse or second-degree relatives among board members”. These two indicators, C1 and C3, belong to “Protecting shareholder rights and interests and treating shareholders equitably” (D1), supporting hypothesis H1.
In C1, this ratio has implications for corporate governance. Excessive remuneration relative to net profit may raise governance concerns, as it could signify issues related to transparency, fairness, or potential conflicts of interest. Corporate governance involves overseeing and aligning the interests of various stakeholders, and remuneration practices play a crucial role in this alignment. Previous research [26,51] suggests that firms with weaker governance structures have more significant agency problems, and CEOs with greater agency problems receive higher compensation. Therefore, the foundation of this indicator is the agency problem. In C3 and C4, Ameer et al. [65] found that boards with a high representation of outside directors, such as government, are associated with better performance. Also, a previous study [53] finds that lower managerial ownership and significant government ownership are associated with increased disclosure. In companies with ongoing ownership within the founding family and a limited presence of independent directors, the firm’s performance could be better than those of non-family firms. In addition, the percentage of family members on the board is negatively related to the extent of voluntary disclosure, which suggests inferior information transparency [33,53] and a potential agency problem.
The next indicator is C12, which appears in four rules. C12 is “Proactively reveal the identity of interested parties and establish communication channels and response methods”. This indicator is linked to a voluntary disclosure and communication strategy. Akhtaruddin et al. [57] found that the extent of voluntary disclosure is negatively related to family control. This insight links C4 and C12. In [55], they also found that government ownership positively relates to voluntary disclosure. It associates C3 with C12. Therefore, in R3, we can see that C4 and C12 appear as antecedents, while C3 and C12 appear in R4. C12 belongs to “Putting CSR into practice” (D4), supporting hypothesis H4.
C8 and C13 both appear in two rules, reflecting their equal importance. C8 is “The company voluntarily discloses its financial forecast quarterly and without having any corrections ordered by the authority or having any demerits imposed by the TWSE”, and C13 is “The company adopts and discloses in detail on its website a whistleblower system for company insiders and outsiders to report illegal behavior (including corruption) and unethical behavior”. C8 also relates to voluntary disclosure [54,55], which can decrease information asymmetry. C13 encompasses various stakeholders disclosing unethical behaviors, which enables external and internal stakeholders to monitor managers and boards. Previous research [58] shows that whistleblowing is an effective corporate governance control tool that benefits firms’ corporate governance performance. C8 falls under “Increasing information transparency” (D3), supporting hypothesis H3.
Based on the preceding discussion, all four hypotheses received support from the respective rules. Two concepts in these criteria deserve special attention. Firstly, the functionality and operation of the audit committee, and secondly, the influence of voluntary disclosure across multiple indicators.

4.2. Improvement Planning

Based on the obtained model, if a company wishes to improve its corporate governance performance, it can begin by calculating the performance gap in each rule. This study assumes that a company can only change/improve one antecedent at a time. The improved performance gap of each rule is shown in Table 6. We may learn that improvement in the R2 of the major group of rules yields the highest performance improvement (i.e., 18% × 1/2 = 9.00%). In Secom’s case, it only satisfies C6 3 in R2, which suggests that C4 3 has not been reached. If Secom decides to improve c4, it may cause side effects in R1 and R3, which will be 8% × 1/6 = 1.33% and 17% × 1/3 = 5.67%, respectively. In this regard, it connects the relationships between the rules.
C4 is “Proportion of general manager (executive director) board members, spouse or second-degree relatives among board members”. It raises considerations related to independence, conflicts of interest, board diversity, transparency, and overall governance practices aimed at ensuring the company’s long-term success. A higher involvement of family power may hurt board independence; therefore, in the long term, there may be an increased risk of divergence between family and company interests. If C4 can be improved to meet the requirement, R1 and R3 will also be improved, referring to Table 8. The conflict of interest might be the most crucial one among those considerations. The principal–agent theory [12] helps to analyze the relationships between various stakeholders within a corporation. In corporate governance, the key players are the shareholders (principals) and the management or executives (agents). The theory helps to identify and address the potential conflicts of interest that may arise between these two groups. Conflicts of interest may occur when the goals and interests of shareholders differ from those of the management. For example, executives may prioritize their compensation or job security over shareholder value [17].
If c4 cannot be resolved, we can refer to Table 8 and shift the attention to the second rule (i.e., R3) of gaps. Still, we use the Secom as an example; its scores on c1 and c4 fail to meet the requirements. Since c4 has been excluded, c1 should be the following priority criterion. c1 is the “Ratio of remuneration of directors and supervisors to net profit before distribution of dividends”. It is an important metric that can be used to assess the alignment of executive compensation with corporate performance. It is often considered in the context of corporate governance to evaluate whether executive pay is reasonable to the company’s financial performance. A lower ratio may indicate that executive compensation is relatively modest compared to the company’s earnings, suggesting good alignment with shareholder interests. On the other hand, a higher ratio may raise concerns regarding excessive executive pay, especially if it is not commensurate with the company’s financial performance. If Secom improved c1, it would further cause positive side effects in R1 (+1.33%), R5 (+5.50%), and R6 (+5.25%), respectively.
Similarly, shifting our attention to the minor rules, in Table 9, R8: (C3 3), (C4 3), and (C6 3) => D Good exhibits the most significant performance gap, reaching 10.26%. Secom falls short in meeting two requirements (antecedents) related to C3 and C4. If it opts to address C3, it may inadvertently impact R7, R9, and R10, resulting in an aggregated increase of 29.49% (5.77% + 10.26% + 7.69% + 5.77%). Conversely, focusing on enhancing c4 would only increase R7 and R8 by 5.77% and 7.69%, respectively, totaling 23.72% (5.77% + 10.26% + 7.69%). Consequently, within the minor rule set, addressing c3 emerges as the preferred improvement option for Secom, promising the most substantial enhancement.
C3 is “The proportion of seats held by government agencies or single-listed companies and their subsidiaries on the board of directors”. The higher this proportion, the more substantial external influence on corporate governance. From the principal–agent theory, more significant external influence may help outside investors to protect themselves against expropriation by the insiders [24].
The application of this model allows for the ranking of companies based on their corporate governance performance and serves as a tool for guiding improvements. Valuable insights into corporate governance can be derived through a clear and understandable logical framework.

5. Conclusions

In conclusion, applying RST to explore corporate governance yielded valuable insights into the intricate relationships within organizational structures. The analysis not only provided a systematic framework for ranking companies based on governance performance but also uncovered patterns that traditional methodologies may overlook. This study employs the agency theory to assess the behaviors of agents that may be detrimental to the interests from the principal’s perspective.
This study reflects that, in a comprehensive assessment of corporate governance models, the most important top four indicators are C6, C1, C3, and C4. C6 reflects the importance of the audit committee. Previous research mostly evaluated the performances of audit committees based on their independence or meeting frequency. However, in this study, C6 emphasizes how the audit committee handles major proposals and the disclosure of such handling. C1 is consistent with past discussions on board remuneration, it is acknowledged that excessively high relative remuneration can harm the interests of the principal (shareholders). C3 reflects the presence of external directors, particularly from government agencies or other listed companies, on the board. Past research has found that a higher proportion of external directors typically enhances the independence of the board and, therefore, improves corporate governance. C4 represents the proportion of board members who are family representatives. A higher proportion of family representatives indicates greater family control over the board, which, in turn, reduces the board’s independence and may potentially harm the interests of shareholders.
In addition to emphasizing the importance of the audit committee, this study identifies several indicators linked to voluntary disclosure. C6, C8, C9, C10, and C12 are all associated with the voluntary disclosure of information, underscoring the significance of voluntary disclosure in corporate governance. Returning to the primary foundation of this study, within the framework of agency theory, agents’ willingness to disclose crucial governance information is a critical aspect of positive corporate governance. This study highlights how the board discloses its handling of major proposals raised by the audit committee (C6), voluntarily providing financial forecasts (C8), disclosing long-term and short-term operational development plans (C9), revealing individual compensation of directors and supervisors (C10), and proactively disclosing the identities of interested parties (C12). Since previous studies of voluntary disclosure have used disclosure indices as proxies, these pieces of information can be incorporated into disclosure indices in the future to enhance the effectiveness of the disclosure indices.
The discerned decision rules shed light on the dependencies between various corporate governance indicators, offering a deeper understanding of the factors influencing corporate governance performance. The flexibility of RST in handling imprecise and uncertain information proved particularly advantageous for capturing the complex and dynamic nature of governance practices. Therefore, the first contribution of this study is constructing a rule-based corporate governance evaluation system.
Secondly, categorizing and ranking companies based on their governance scores is a practical tool for shareholders and firms to assess the governance performance. For shareholders, rules can be applied to assess the governance performances of different companies and identify those with better corporate governance performances. Shareholders play a crucial role in this context, as they face the risk of interest impairment and must ensure that companies effectively fulfill their governance responsibilities. For firms, the focus can be on allocating resources to improve criteria with vertical effects and understanding the differences between themselves and their competitors. Firms should prioritize criteria with synergy effects to ensure the efficient allocation of resources and, at the same time, compare themselves with industry peers to identify areas for improvement and enhance their overall governance performance.
The identified patterns offer actionable insights for decision-makers seeking targeted improvements in specific governance areas. Furthermore, the model provides a priority for companies to plan for stepwise improvement. In this rule-based evaluation system, improving one antecedent may cause side effects on the other rules, which shows the interdependence of the rules.
While this study has contributed valuable perspectives to corporate governance, it is essential to acknowledge its limitations. Firstly, this study adopts the previous research’s findings and uses the 13 refined indicators to construct a model. Secondly, the values of each indicator of a company were graded by an expert. The expert’s judgment and knowledge determine the decision table. Thirdly, each antecedent of a rule is assumed to be equally important. Fourth, this study adopts the minimal reclassification accuracy of 50%. Since different industries may exhibit distinct characteristics or traits, future research endeavors could explore the applicability of RST to a specific sector and consider additional contextual factors that may influence governance dynamics.
This study relies on expert opinions. In MCDM research, it is common to use expert opinions to form the weights of assessment models. In this study, expert knowledge and experience were utilized to evaluate the relative performance of each company for each criterion, and objective support weights were obtained through rough approximation. This is a major limitation of this study, but it is also a limitation commonly encountered in MCDM research methods.
In essence, this paper underscores the potential of RST as an innovative approach to unravel the intricacies of corporate governance. By providing a holistic and data-driven framework, RST contributes to the ongoing dialogue on governance effectiveness and offers a pathway for organizations to navigate the complexities of contemporary business environments. As corporate governance continues to evolve, embracing innovative analytical tools like RST ensures a comprehensive and intuitive understanding that goes beyond traditional paradigms.

Funding

This research was funded by National Science and Technology Council of Taiwan, grant number 109-2410-H-034 -037 -MY2.

Data Availability Statement

The raw data supporting the conclusions of this article will be made available by the authors on request.

Acknowledgments

I would like to sincerely thank the expert for his invaluable assistance in grading the data table. His insightful feedback and dedicated effort significantly contributed to the quality and rigor of the evaluation process.

Conflicts of Interest

The authors declare no conflicts of interest.

Appendix A

Table A1. Major group of “at most” rules.
ConditionsDecisionSupports
(C11 2)D Bad2
(C3 1) and (C4 2)D Bad2
(C2 2) and (C8 1)D Bad1
(C2 1) and (C13 1)D Bad1
(C5 2) and (C12 2)D Bad4
(C6 1) and (C13 2)D Bad3
(C5 2) and (C13 2)D Bad4
(C13 2)D Mid14
(C1 1)D Mid9
(C12 2)D Mid9
(C8 2)D Mid6
(C4 1) and (C6 2)D Mid3
Table A2. Minor group of “at most” rules.
ConditionsDecisionSupports
(C2 1) and (C13 2)D Vbad6
(C3 1) and (C4 2)D Vbad2
(C2 2) and (C8 1)D Vbad1
(C5 2) and (C12 2)D Vbad4
(C13 2)D Bad11
(C12 2)D Bad9
(C1 1)D Bad6
(C11 2)D Bad2
(C4 1) and (C6 2)D Bad3
(C8 2)D Good5
Table A3. The corporate governance performances of the four sample companies in 2019.
CriteriaC1C2C3C4C5C6C7C8C9C10C11C12C13
TSMC3333333333333
Foxconn3122333333333
Secom1221333333233
Zinwell2321323333323

References

  1. Shleifer, A.; Vishny, R.W. A survey of corporate governance. J. Financ. 1997, 52, 737–783. [Google Scholar] [CrossRef]
  2. Naciti, V.; Cesaroni, F.; Pulejo, L. Corporate governance and sustainability: A review of the existing literature. J. Manag. Gov. 2021, 26, 55–74. [Google Scholar] [CrossRef]
  3. Md Nasir, N.A.; Hashim, H.A. Corporate governance performance and financial statement fraud: Evidence from Malaysia. J. Financ. Crime 2021, 28, 797–809. [Google Scholar] [CrossRef]
  4. Kabeyi, M.J.B. Corporate governance in manufacturing and management with analysis of governance failures at Enron and Volkswagen Corporations. Am. J. Oper. Manag. Inf. Syst. 2020, 4, 109–123. [Google Scholar]
  5. Panda, B.; Leepsa, N.M. Agency theory: Review of theory and evidence on problems and perspectives. Indian J. Corp. Gov. 2017, 10, 74–95. [Google Scholar] [CrossRef]
  6. Daily, C.M.; Dalton, D.R.; Rajagopalan, N. Governance through ownership: Centuries of practice, decades of research. Acad. Manag. J. 2003, 46, 151–158. [Google Scholar] [CrossRef]
  7. CGES. Available online: https://cgc.twse.com.tw/evaluationCorp/listEn (accessed on 10 January 2024).
  8. Huang, J.Y.; Shen, K.Y.; Shieh, J.C.; Tzeng, G.H. Strengthen financial holding companies’ business sustainability by using a hybrid corporate governance evaluation model. Sustainability 2019, 11, 582. [Google Scholar] [CrossRef]
  9. Pawlak, Z. Rough sets. Int. J. Comput. Inf. Sci. 1982, 11, 341–356. [Google Scholar] [CrossRef]
  10. Tzeng, G.H.; Shen, K.Y. New Concepts and Trends of Hybrid Multiple Criteria Decision Making; CRC Press: Boca Raton, FL, USA, 2017. [Google Scholar]
  11. Shen, K.Y.; Zavadskas, E.K.; Tzeng, G.H. Updated discussions on ‘Hybrid multiple criteria decision-making methods: A review of applications for sustainability issues’. Econ. Res.-Ekon. Istraživanja 2018, 31, 1437–1452. [Google Scholar] [CrossRef]
  12. Jensen, M.C.; Meckling, W.H. Theory of the firm: Managerial behaviour, agency costs and ownership structure. J. Financ. Econ. 1976, 3, 305–360. [Google Scholar] [CrossRef]
  13. Davis, J.H.; Schoorman, F.D.; Donaldson, L. Toward a stewardship theory of management. Acad. Manag. Rev. 1997, 22, 20–47. [Google Scholar] [CrossRef]
  14. Freeman, R.E. Strategic Management: A Stakeholder Approach; Pitman: Boston, MA, USA, 1984. [Google Scholar]
  15. Kao, T.H.; Wei, H.S. The effect of IFRS, information asymmetry and corporate governance on the quality of accounting information. Asian Econ. Financ. Rev. 2014, 4, 226. [Google Scholar]
  16. Ştefănescu, C.A. Disclosure and transparency in corporate governance codes-comparative analysis with prior literature findings. Procedia-Soc. Behav. Sci. 2011, 24, 1302–1310. [Google Scholar] [CrossRef]
  17. Laux, V. Corporate governance, board oversight, and CEO turnover. Found. Trends Account. 2014, 8, 1–73. [Google Scholar] [CrossRef]
  18. Baker, C.R.; Owsen, D.M. Increasing the role of auditing in corporate governance. Crit. Perspect. Account. 2002, 13, 783–795. [Google Scholar] [CrossRef]
  19. Jesover, F. Corporate governance in the Russian Federation: The relevance of the OECD principles on shareholder rights and equitable treatment. Corp. Gov. Int. Rev. 2001, 9, 79–88. [Google Scholar] [CrossRef]
  20. Deetz, S. Corporate governance, corporate social responsibility, and communication. In The Debate Over Corporate Social Responsibility; Oxford University Press: Oxford, UK, 2007; pp. 267–278. [Google Scholar]
  21. Harjoto, M.A.; Jo, H. Corporate governance and CSR nexus. J. Bus. Ethics 2011, 100, 45–67. [Google Scholar] [CrossRef]
  22. Shu, P.G.; Chiang, S.J. The impact of corporate governance on corporate social performance: Cases from listed firms in Taiwan. Pac.-Basin Financ. J. 2020, 61, 101332. [Google Scholar] [CrossRef]
  23. Singh, K.; Rastogi, S. Corporate governance and financial performance: Evidence from listed SMEs in India. Benchmarking Int. J. 2023, 30, 1400–1423. [Google Scholar] [CrossRef]
  24. La Porta, R.; Lopez-de-Silanes, F.; Shleifer, A.; Vishny, R. Investor protection and corporate governance. J. Financ. Econ. 2000, 58, 3–27. [Google Scholar] [CrossRef]
  25. Adjaoud, F.; Ben-Amar, W. Corporate governance and dividend policy: Shareholders’ protection or expropriation? J. Bus. Financ. Account. 2010, 37, 648–667. [Google Scholar] [CrossRef]
  26. Schöndube-Pirchegger, B.; Schöndube, J.R. On the appropriateness of performance-based compensation for supervisory board members–an agency theoretic approach. Eur. Account. Rev. 2010, 19, 817–835. [Google Scholar] [CrossRef]
  27. Mrabure, K.O.; Abhulimhen-Iyoha, A. Corporate governance and protection of stakeholders rights and interests. Beijing Law Rev. 2020, 11, 292. [Google Scholar] [CrossRef]
  28. Naciti, V. Corporate governance and board of directors: The effect of a board composition on firm sustainability performance. J. Clean. Prod. 2019, 237, 117727. [Google Scholar] [CrossRef]
  29. Weisbach, M.S. Outside directors and CEO turnover. J. Financ. Econ. 1988, 20, 431–460. [Google Scholar] [CrossRef]
  30. Bhagat, S.; Black, B. The uncertain relationship between board composition and firm performance. Bus. Lawyer 1999, 54, 921–963. [Google Scholar] [CrossRef]
  31. Duru, A.; Iyengar, R.J.; Zampelli, E.M. The dynamic relationship between CEO duality and firm performance: The moderating role of board independence. J. Bus. Res. 2016, 69, 4269–4277. [Google Scholar] [CrossRef]
  32. Madhani, P.M. Diverse roles of corporate board: Review of various corporate governance theories. IUP J. Corp. Gov. 2017, 16, 7–28. [Google Scholar]
  33. Giovannini, R. Corporate governance, family ownership and performance. J. Manag. Gov. 2010, 14, 145–166. [Google Scholar] [CrossRef]
  34. Fung, B. The demand and need for transparency and disclosure in corporate governance. Univers. J. Manag. 2014, 2, 72–80. [Google Scholar] [CrossRef]
  35. Assidi, S. Voluntary disclosure and corporate governance: Substitutes or complements for firm value? Compet. Rev. Int. Bus. J. 2023, in press. [Google Scholar]
  36. Chan, S.H.; Creel, T.S.; Song, Q.; Yurova, Y.V. Does CSR reporting indicate strong corporate governance? Int. J. Account. Inf. Manag. 2021, 29, 27–42. [Google Scholar] [CrossRef]
  37. Jain, T.; Jamali, D. Looking inside the black box: The effect of corporate governance on corporate social responsibility. Corp. Gov. Int. Rev. 2016, 24, 253–273. [Google Scholar] [CrossRef]
  38. Okafor, A.; Adeleye, B.N.; Adusei, M. Corporate social responsibility and financial performance: Evidence from US tech firms. J. Clean. Prod. 2021, 292, 126078. [Google Scholar] [CrossRef]
  39. Nareswari, N.; Tarczyńska-Łuniewska, M.; Al Hashfi, R.U. Analysis of environmental, social, and governance performance in Indonesia: Role of ESG on corporate performance. Procedia Comput. Sci. 2023, 225, 1748–1756. [Google Scholar] [CrossRef]
  40. Pawlak, Z. Rough Sets: Theoretical Aspects of Reasoning about Data; Springer Science & Business Media: New York, NY, USA, 1991; Volume 9. [Google Scholar]
  41. Pawlak, Z.; Skowron, A. Rudiments of rough sets. Inf. Sci. 2007, 177, 3–27. [Google Scholar] [CrossRef]
  42. Greco, S.; Matarazzo, B.; Slowinski, R. Rough approximation by dominance relations. Int. J. Intell. Syst. 2002, 17, 153–171. [Google Scholar] [CrossRef]
  43. Błaszczyński, J.; Greco, S.; Matarazzo, B.; Szeląg, M. Dominance-Based Rough Set Approach: Basic Ideas and Main Trends. In Intelligent Decision Support Systems: Combining Operations Research and Artificial Intelligence-Essays in Honor of Roman Słowiński; Springer International Publishing: Cham, Switzerland, 2022; pp. 353–382. [Google Scholar]
  44. Shen, K.Y.; Tzeng, G.H. A decision rule-based soft computing model for supporting financial performance improvement of the banking industry. Soft Comput. 2015, 19, 859–874. [Google Scholar] [CrossRef]
  45. Shen, K.Y.; Tzeng, G.H. DRSA-based neuro-fuzzy inference systems for the financial performance prediction of commercial banks. Int. J. Fuzzy Syst. 2014, 16, 173. [Google Scholar]
  46. Liou, J.J.; Tzeng, G.H. A dominance-based rough set approach to customer behavior in the airline market. Inf. Sci. 2010, 180, 2230–2238. [Google Scholar] [CrossRef]
  47. Greco, S.; Matarazzo, B.; Slowinski, R. Rough sets methodology for sorting problems in presence of multiple attributes and criteria. Eur. J. Oper. Res. 2002, 138, 247–259. [Google Scholar] [CrossRef]
  48. García, F.; González-Bueno, J.; Guijarro, F.; Oliver, J. Forecasting the environmental, social, and governance rating of firms by using corporate financial performance variables: A rough set approach. Sustainability 2020, 12, 3324. [Google Scholar] [CrossRef]
  49. Wang, Z.; Li, H. Financial distress prediction of Chinese listed companies: A rough set methodology. Chin. Manag. Stud. 2007, 1, 93–110. [Google Scholar] [CrossRef]
  50. Karimi, T.; Hojati, A. Corporate sustainability assessment based on rough-grey set theory. J. Model. Manag. 2022, 17, 440–455. [Google Scholar] [CrossRef]
  51. Core, J.E.; Holthausen, R.W.; Larcker, D.F. Corporate governance, chief executive officer compensation, and firm performance. J. Financ. Econ. 1999, 51, 371–406. [Google Scholar] [CrossRef]
  52. Shen, Y.V.; Wang, W.; Zhou, F. Insider pledging in the US. J. Financ. Stab. 2021, 53, 100830. [Google Scholar] [CrossRef]
  53. Chi, Y.L. The agency costs of family ownership: Evidence from innovation performance. J. Bank. Financ. 2023, 148, 106737. [Google Scholar] [CrossRef]
  54. Ho, S.S.; Wong, K.S. A study of the relationship between corporate governance structures and the extent of voluntary disclosure. J. Int. Account. Audit. Tax. 2001, 10, 139–156. [Google Scholar] [CrossRef]
  55. Alfraih, M.M.; Almutawa, A.M. Voluntary disclosure and corporate governance: Empirical evidence from Kuwait. Int. J. Law Manag. 2017, 59, 217–236. [Google Scholar] [CrossRef]
  56. Eng, L.L.; Mak, Y.T. Corporate governance and voluntary disclosure. J. Account. Public Policy 2003, 22, 325–345. [Google Scholar] [CrossRef]
  57. Akhtaruddin, M.; Hossain, M.A.; Hossain, M.; Yao, L. Corporate governance and voluntary disclosure in corporate annual reports of Malaysian listed firms. J. Appl. Manag. Account. Res. 2009, 7, 1–19. [Google Scholar]
  58. Tadu, R.; Mukonya, S. Challenges of whistle blowing as a corporate governance control tool in the Zimbabwean banking sector during 2000–2008. J. Res. Bus. Econ. Manag. 2016, 6, 954–963. [Google Scholar]
  59. Drogalas, G.; Arampatzis, K.; Anagnostopoulou, E. The relationship between corporate governance, internal audit and audit committee: Empirical evidence from Greece. Corp. Ownersh. Control 2016, 14, 569–577. [Google Scholar] [CrossRef]
  60. Saaty, T.L. What is the Analytic Hierarchy Process? Springer: Berlin/Heidelberg, Germany, 1988; pp. 109–121. [Google Scholar]
  61. Saaty, T.L. Decision Making with Dependence and Feedback: The Analytic Network Process; RWS Publications: Pittsburgh, PA, USA, 1996; Volume 4922. [Google Scholar]
  62. Shen, Y.C.; Lin, G.T.; Tzeng, G.H. A novel multi-criteria decision-making combining Decision Making Trial and Evaluation Laboratory technique for technology evaluation. Foresight 2012, 14, 139–153. [Google Scholar] [CrossRef]
  63. Shen, K.Y.; Yan, M.R.; Tzeng, G.H. Combining VIKOR-DANP model for glamor stock selection and stock performance improvement. Knowl.-Based Syst. 2014, 58, 86–97. [Google Scholar] [CrossRef]
  64. Turley, S.; Zaman, M. The corporate governance effects of audit committees. J. Manag. Gov. 2004, 8, 305–332. [Google Scholar] [CrossRef]
  65. Ameer, R.; Ramli, F.; Zakaria, H. A new perspective on board composition and firm performance in an emerging market. Corp. Gov. Int. J. Bus. Soc. 2010, 10, 647–661. [Google Scholar] [CrossRef]
Figure 1. Research flow.
Axioms 13 00119 g001
Table 1. The 13 indicators for corporate governance evaluation.
IndicatorDescription of the IndicatorsReference/Foundation
C1Ratio of remuneration of directors and supervisors to net profit before the distribution of dividends[51]/Agency problem
C2The average ratio of pledges by directors, supervisors, and substantial shareholders[52]/Agency problem
C3The proportion of seats held by government agencies or single-listed companies and their subsidiaries on the board of directorsAgency theory
C4Proportion of general manager (executive director) board members and spouse or second-degree relatives among board members[53]/Agency problem
C5Independent directors put forward opinions on major proposals on the board of directors and deal with themAgency theory
C6The company exposes the results of the resolution of the audit committee on the major proposals and the degree of disclosure of the company’s handling[54]/Information asymmetry
C7The head of internal audit/auditor attends the board of directors and proposes the internal audit report to each supervisor and independent director[54]/Agency theory
C8The company voluntarily discloses its financial forecast quarterly and without having any corrections ordered by the authority or having any demerits imposed by the TWSE[35,54,55]/Information asymmetry
C9The company discloses long-term and short-term business development plans in its annual report[55]/Information asymmetry
C10The company discloses the remuneration details of each director and supervisor in its annual report[56]/Information asymmetry
C11The company website discloses information related to the company’s finances, business and corporate governance[55,56]/Information asymmetry
C12The company proactively reveals the identity of interested parties and establishes communication channels and response methods[57]/Information asymmetry and CSR
C13The company adopts and discloses in detail on its website a whistle blower system for company insiders and outsiders to report illegal behavior (including corruption) and unethical behavior[58]/Information asymmetry, Stakeholder Theory, and CSR
This Table comes from the previous study [8] with minor modifications. The reference or foundation of each criterion is incorporated.
Table 2. Classification accuracy.
YearObject NumbersMajor Group’s
Reclassification
Minor Group’s
Reclassification
20187258.33%70.00%
20198668.61%60.94%
Table 3. Major group of rules.
RulesConditionsDecisionSupports
Weight
Weighted
Supports
R1(C1 3), (C3 3), (C4 3), (C5 3),
(C8 3), and (C13 3)
D G4 × 2 = 88% × 0.8
= 6.4%
R2(C4 3) and (C6 3)D M1818% × 0.8
= 14.4%
R3(C1 3), (C4 3), and (C12 3)D M1717% × 0.8
= 13.6%
R4(C3 3), (C6 3), (C11 3), and (C12 3)D M1414% × 0.8
= 11.2%
R5(C1 3), (C5 3), (C6 3), and (C12 3)D M2222% × 0.8
= 17.6%
R6(C1 3), (C2 3), (C6 3), and
(C12 3)
D M2121% × 0.8
= 16.8%
Table 4. Minor group of rules.
RulesConditions Decision Supports WeightWeighted
Supports
R7(C3 3), (C4 3), (C6 3), and (C8 3)D VG1 × 3 = 323.08% × 0.2
= 4.62%
R8(C3 3), (C4 3), and (C6 3)D G2 × 2 = 430.77% × 0.2
= 6.154%
R9(C1 3), (C3 3), and (C4 3)D M323.08% × 0.2
= 4.62%
R10(C1 3), (C3 3), (C6 3), and (C12 3)D M323.08% × 0.2
= 4.62%
Table 5. Sensitivity analysis of the final ranking.
WeightingTSMCFoxconnSecomZinwell
α = 90 % (rank)100% (1st)66.26% (2nd)50.73% (3rd)22.05% (4th)
α = 80 % (rank)100% (1st)64.09% (2nd)48.80% (3rd)20.24% (4th)
α = 70 % (rank)100% (1st)61.93% (2nd)46.87% (3rd)18.43% (4th)
Table 6. DANP weights and the scores of the four companies.
DANP WeightsTSMCFoxconnSecomZinwell
C18.73%3312
C25.62%3123
C35.11%3222
C46.12%3211
C57.59%3333
C67.29%3332
C76.53%3333
C86.12%3333
C95.33%3333
C107.06%3333
C116.79%3323
C1213.91%3332
C1313.79%3333
Scores
(ranking)
2.5863
(1st)
2.3615
(2nd)
2.1140
(3rd)
2.1134
(4th)
DANP weights are referenced from the previous study [8].
Table 7. Rule-criteria analysis.
R1R2R3R4R5R6R7R8R9R10Sum
C1 6 (2nd)
C2 1 (5th)
C3 6 (2nd)
C4 6 (2nd)
C5 2 (4th)
C6 7 (1st)
C7 0
C8 2 (4th)
C9 0
C10 0
C11 1 (5th)
C12 4 (3rd)
C13 2 (4th)
Table 8. Improvement priority in the major group of rules.
SecomR1R2R3R4R5R6
Change8% × 1/618% × 1/217% × 1/314% × 1/422% × 1/421% × 1/4
Improved gap1.33%9.00%
(1st)
5.67%
(2nd)
3.50%5.50%
(3rd)
5.25%
Side effects8% × 1/6
= 1.33%
17% × 1/3
= 5.67%
Table 9. Improvement priority in the minor group of rules.
SecomR7R8R9R10
Change23.08% × 1/430.77% × 1/323.08% × 1/323.08 × 1/4
Improved gap5.77%10.26%
(1st)
7.69%
(2nd)
5.77%
Side effects+5.77% +7.69%+5.77%
Disclaimer/Publisher’s Note: The statements, opinions and data contained in all publications are solely those of the individual author(s) and contributor(s) and not of MDPI and/or the editor(s). MDPI and/or the editor(s) disclaim responsibility for any injury to people or property resulting from any ideas, methods, instructions or products referred to in the content.

