Article

Parameter Estimation of the Exponentiated Pareto Distribution Using Ranked Set Sampling and Simple Random Sampling

by
Hossein Jabbari Khamnei
1,
Ieva Meidute-Kavaliauskiene
2,*,
Masood Fathi
3,4,
Asta Valackienė
5 and
Shahryar Ghorbani
6
1
Department of Statistics, Faculty of Mathematics-Statistics and Computer Science, University of Tabriz, Tabriz 5166616471, Iran
2
Faculty of Business Management, Vilnius Gediminas Technical University, Sauletekio al. 11, 10223 Vilnius, Lithuania
3
Division of Intelligent Production Systems, School of Engineering Science, University of Skövde, 54128 Skövde, Sweden
4
Division of Industrial Engineering and Management, Department of Civil and Industrial Engineering, Uppsala University, 75121 Uppsala, Sweden
5
Institute of Business and Economics, Faculty of Public Governance and Business, Mykolas Romeris University, Ateities Street 20, Room C-V-509, 08303 Vilnius, Lithuania
6
Production Management Department, University of Sakarya, Sakarya 54050, Turkey
*
Author to whom correspondence should be addressed.
Axioms 2022, 11(6), 293; https://doi.org/10.3390/axioms11060293
Submission received: 24 May 2022 / Revised: 9 June 2022 / Accepted: 11 June 2022 / Published: 15 June 2022

Abstract

:
In this paper, we have considered that ranked set sampling is able to estimate the parameters of exponentiated Pareto distribution. The method with which the maximum likelihood estimators for the parameters of exponentiated Pareto distribution is studied is numerical since there is no presence or possibility of a closed-form at the hands of estimators or any other intellectual. The numerical approach is a well-suited one for this study as there has been struggles in achieving it with any other technique. In order to compare the different sampling methods, simulation studies are performed as the main technique. As for the illustrative purposes, analysis of a simulated dataset is desired for the objective of the presentation. The conclusion that we can reach based on these is that the estimators based on the ranked set sample have far better efficiency than the simple random sample at the same sample size.

1. Introduction

A two-parameter distribution, called the exponentiated Pareto distribution EP β , λ , has been introduced by [1]. They provided the cumulative distribution function (cdf) and probability density function (pdf) of this distribution as follows:
F x ; β , λ = [ 1 ( 1 + x ) λ ] β ,         x > 0 ,
and
f x ; β , λ = β λ ( 1 + x ) λ + 1 [ 1 ( 1 + x ) λ ] β 1 ,         x > 0 ,
where β > 0 and λ > 0 . The parameters β and λ are two shape parameters. When β = 1 , the above distribution corresponds to the standard Pareto distribution of the second kind (see [2]). It is essential to mention here that when β is a positive integer, E P β , λ cdf is the cdf of the maximum of a random sample size β from the standard Pareto distribution of the second kind (see [3]). Therefore, the EP distribution has a survival function
S x ; β , λ = 1 [ 1 ( 1 + x ) λ ] β ,         x > 0 ,
and a hazard function
h x ; β , λ = β λ ( 1 + x ) λ + 1 [ 1 ( 1 + x ) λ ] β 1 1 [ 1 ( 1 + x ) λ ] β ,         x > 0 .
For β > 1 , the distribution has a unique model, which is ( λ β + 1 λ + 1 ) 1 λ 1 . The median of the distribution is ( 1 0.5 1 β ) 1 λ 1 .
Ref. [1] showed that the E P distribution could be used quite effectively in analyzing many lifetime data. The E P distribution can have decreasing and upside-down bathtub-shaped failure rates depending on the shape parameter M L E   β . The authors of [4] consider the maximum likelihood estimation of the different parameters of an EP distribution, and they studied how the different estimators of the unknown parameters of an E P distribution can behave for different sample sizes and for different parameter values. The authors of [5] studied the mixture of exponentiated Pareto and exponential distributions. The authors of [6] derived Bayes and classical estimators of the parameters of exponentiated Pareto distributions under different sample schemes. The authors of [7] introduced the generalized exponential distribution, which has been studied quite extensively. The authors of [8] also discussed a different method of estimations of a generalized exponential distribution of parameters. The authors of [9] derived the best linear unbiased estimates B L E U s and the maximum likelihood estimates M L E s of the location and scale parameters for the EP distribution based on progressively Type II right censored order statistics. Some of the gamma-Pareto and the exponentiated Pareto properties, including distribution shapes, limit behavior, hazard function, Renyi and Shannon entropies, moments, and deviations from the mean and median, are discussed in [10]. Ref. [11] applied four real datasets for the issues of parameter estimation and provided a visual inspection of the goodness-of-fit of the complementary beta model.
In this article, ranked set sampling R S S is considered. The M L E of the two parameters based on R S S will be investigated, and simulation will illustrate the mathematical finding.

2. Ranked Set Sampling

A method of sampling based on ranked sets is an efficient alternative to simple random sampling S R S that has been shown to outperform simple random sampling in many situations by reducing the variance of an estimator, thereby providing the same accuracy with a smaller sample size than is needed in S R S . The authors of [12] introduced R S S to estimate mean pasture yields. R S S can be applied in many studies where the exact measurement of an element is complicated (in terms of money, time, labor, and organization). Still, although not easily measurable, the variable of interest can be relatively easily ranked (order) at no cost or minimal additional cost. The ranking can be performed based on visual inspection, preliminary information, earlier sampling episodes, or other rough methods not requiring actual measurement. The procedure of using R S S is as follows
  • Select m units at random from a specified population.
  • Rank these m units with some expert judgment without measuring them.
  • Retain the smallest judged unit and return the others.
  • Continue the process until m ordered units are measured.
  • These m ordered observations X 1 i , , X m i are called a cycle.
  • Process repeated i = 1 , , k cycle to get k m observations.
These k m observations are called a standard ranked set sample.
The sample mean based on R S S is X ¯ R S S = 1 k m j = 1 m i = 1 k x j i where x j i is the unit of order j in cycle i . X ¯ R S S is an unbiased estimator for the population mean, with variance
V a r X ¯ R S S = σ x 2 k m 1 k m 2 j = 1 m ( μ x j μ x ) 2
R S S yields a sample of observations that tends to be more representative of the underlying population than a S R S of equivalent size. The authors of [13] established a foundation for the theory of R S S . The method has become widely applicable, and many modifications have been made. The authors of [14] showed that R S S is more efficient than S R S even with an error in ranking. The authors of [15] suggested using extreme R S S for estimating a population mean. The authors of [16] introduced median R S S to estimate the population mean. The authors of [17] considered double R S S , as a procedure that increases the efficiency of the R S S estimator without increasing the set size m. It was shown that the double R S S estimator of the mean is more efficient than that using R S S . For details on RSS, see [18,19]. The derivation of the parameter estimation based on Simple Random Sampling and Ranked Set Sampling for Gumbel distribution and logistic distribution are discussed by [20,21]. The derivation of the likelihood function for parameter estimation based on double-ranked set sampling D R S S designs were used by [22] for the estimation of the parameters of the power-generalized Weibull distribution. The authors of [23] derived the estimate of the finite population total under Ranked Set Sampling Without Replacement R S S W O R , employing the model relationship, especially Gamma Population Model (GPM), between the study and auxiliary variables. The authors of [24] considered the estimation of the scale parameter of Levy distribution using a ranked set sample; they derived the best linear unbiased estimator and its variance based on a ranked set sample.

3. Estimation Using Ranked Set Sampling
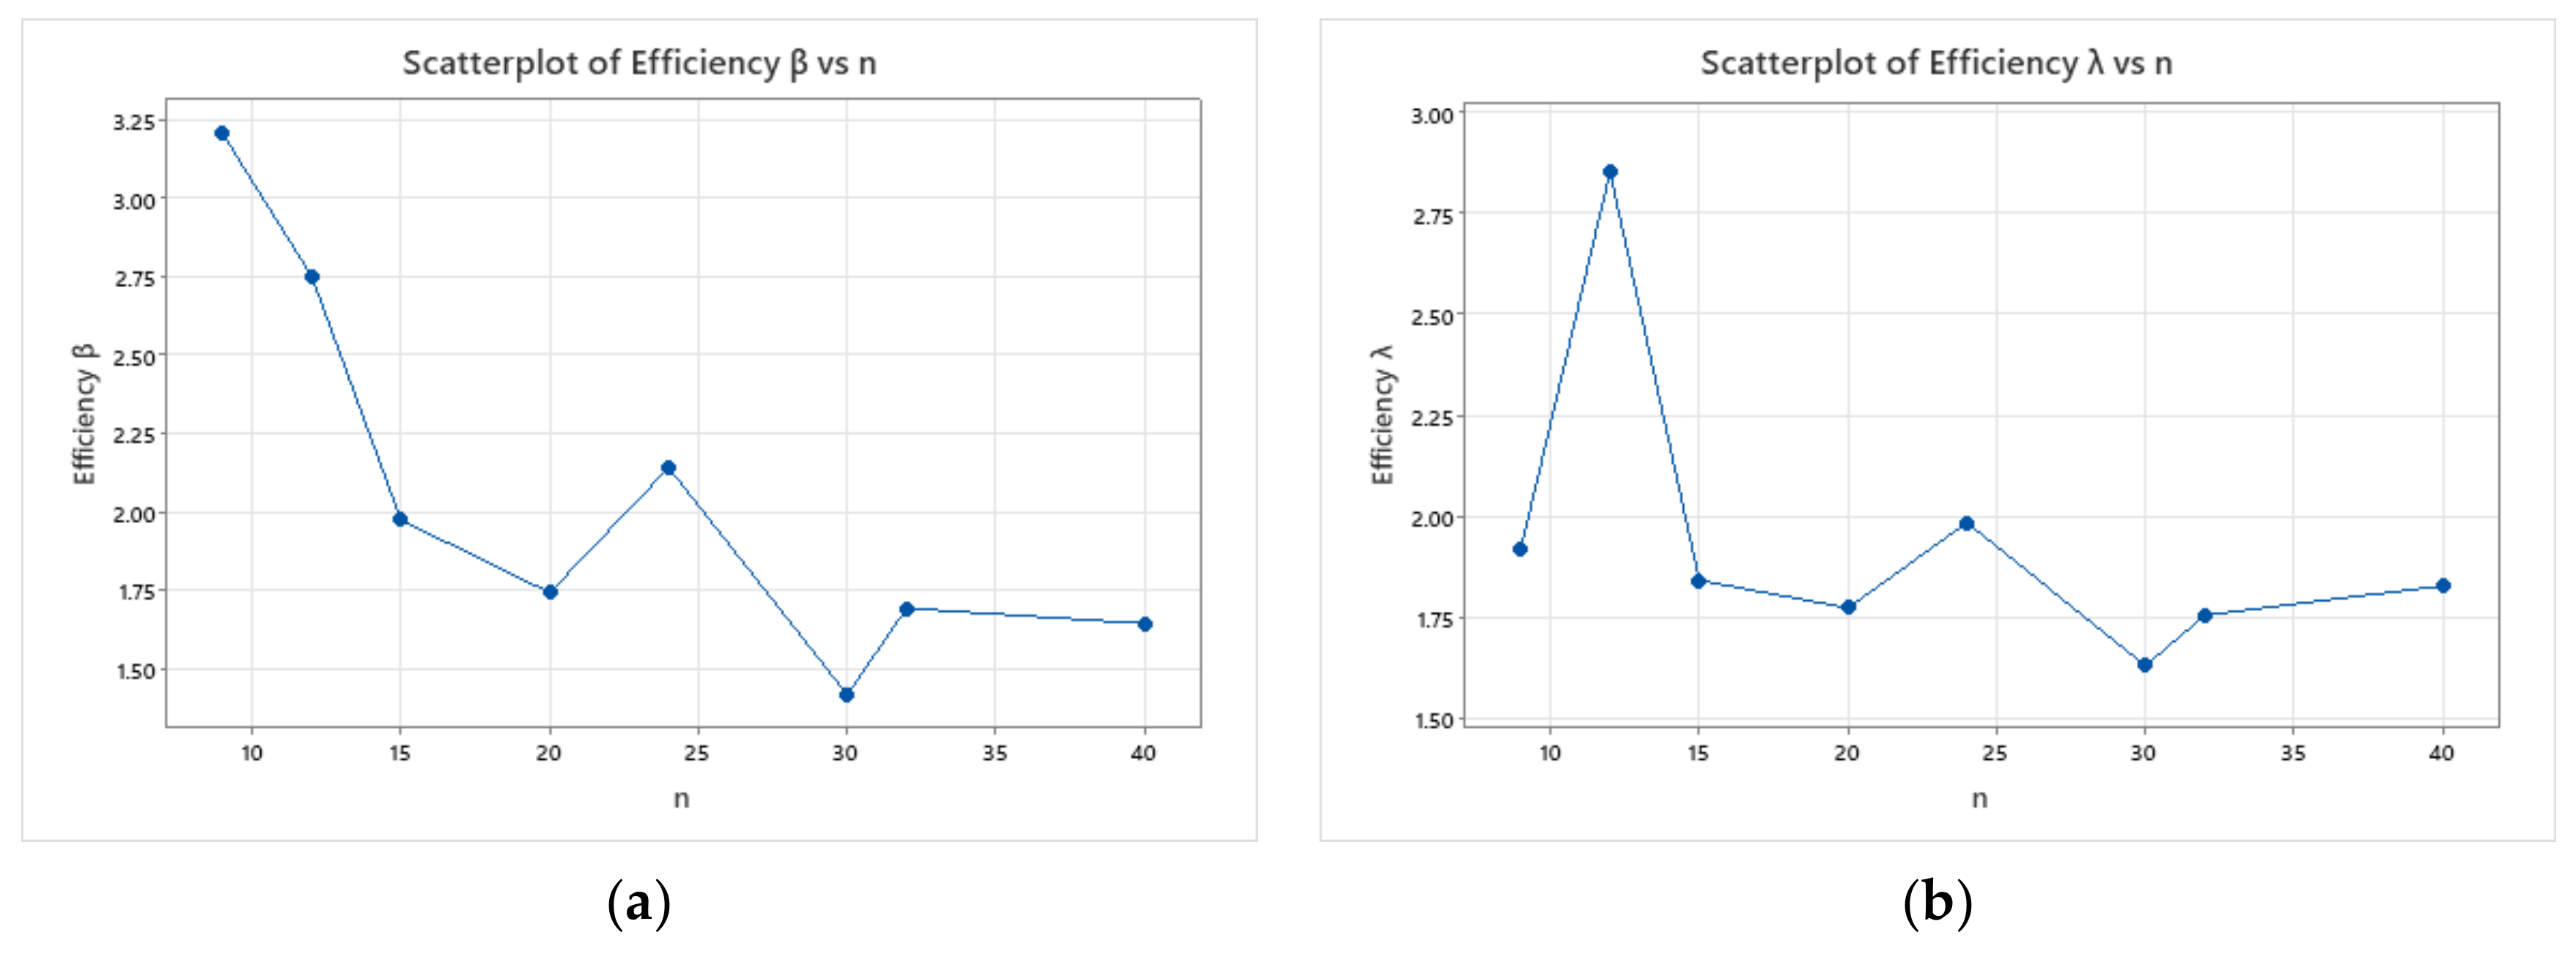
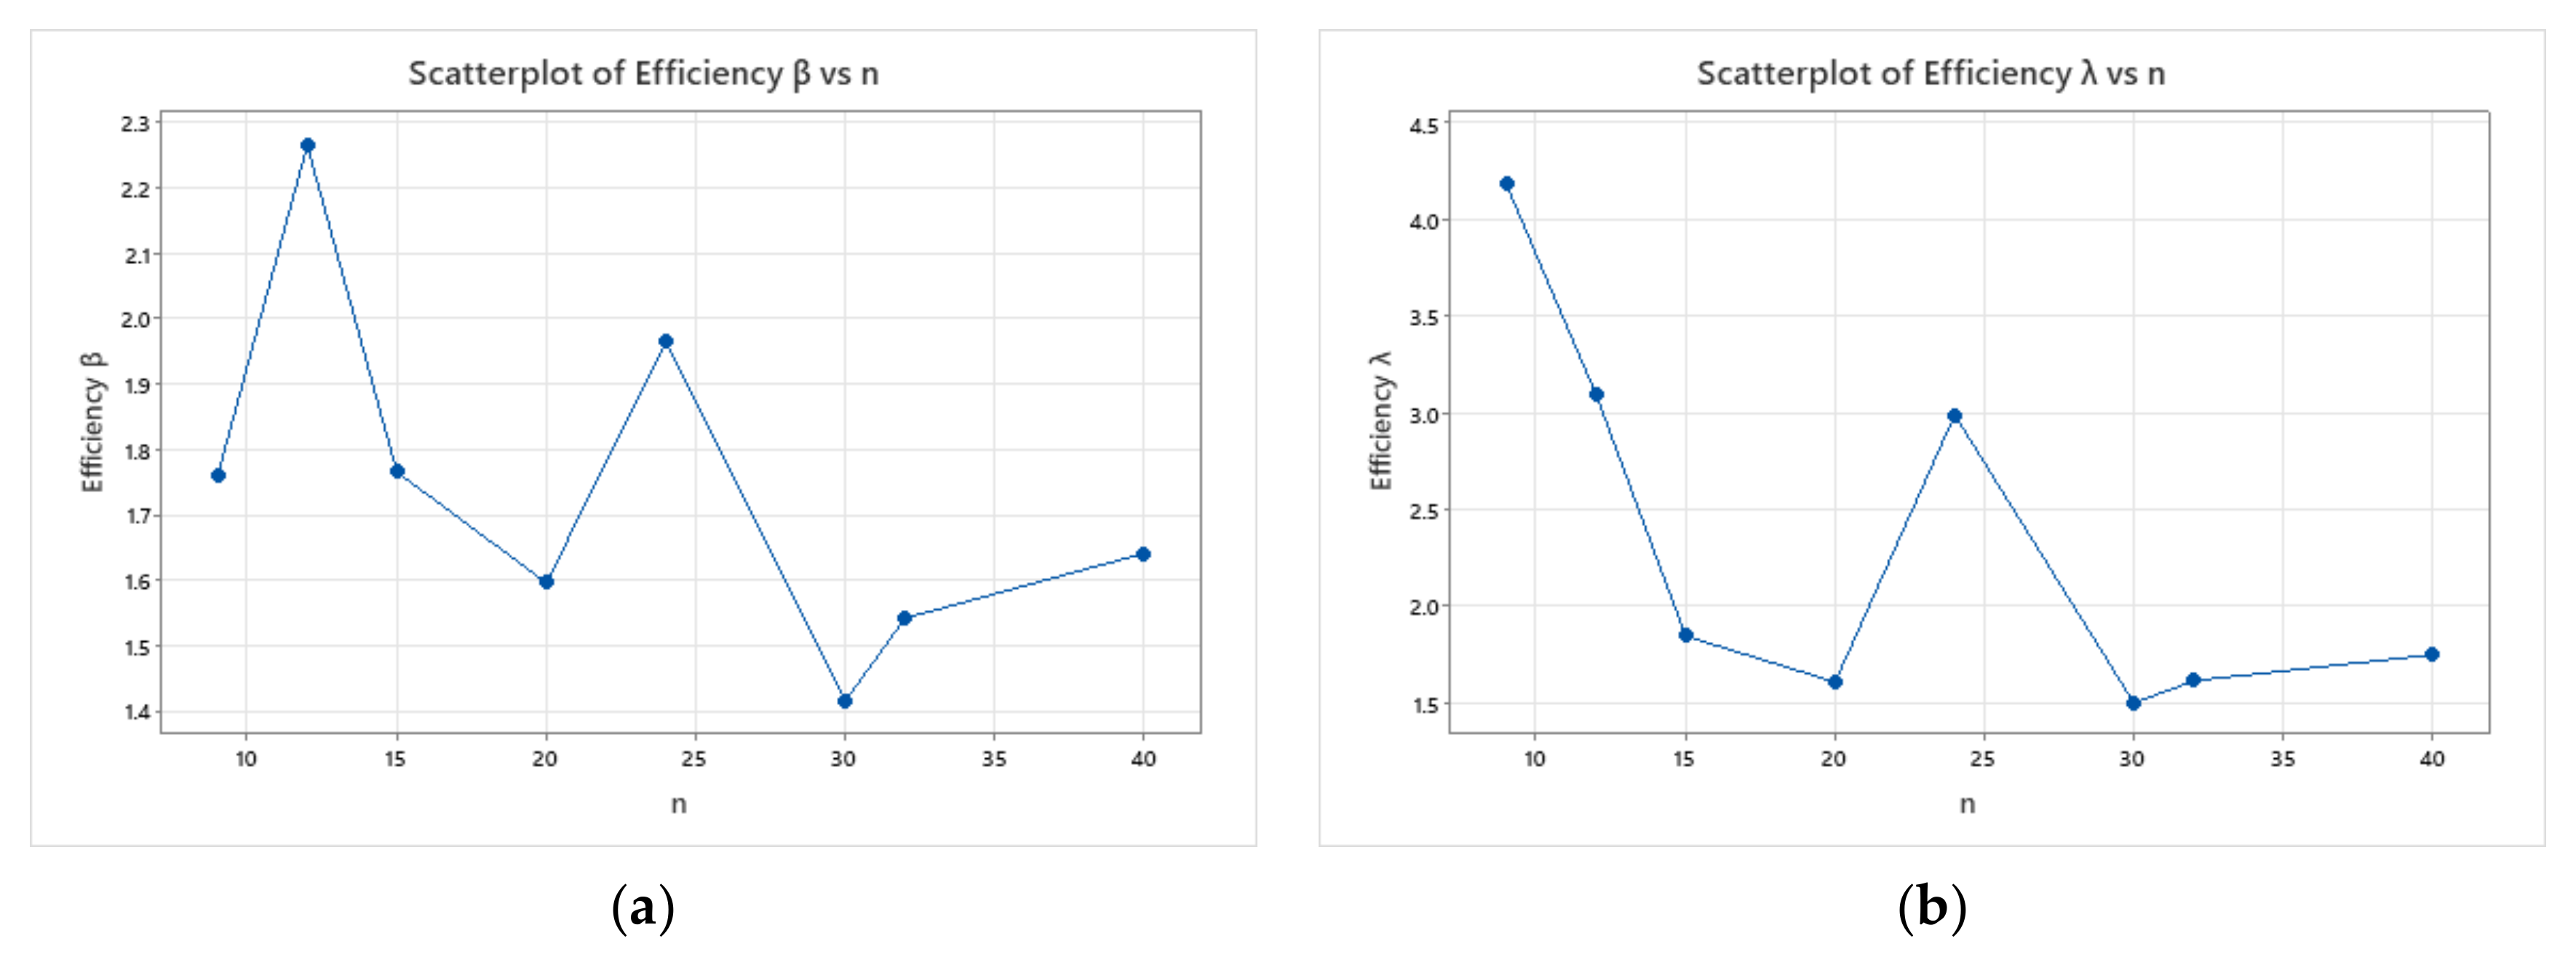
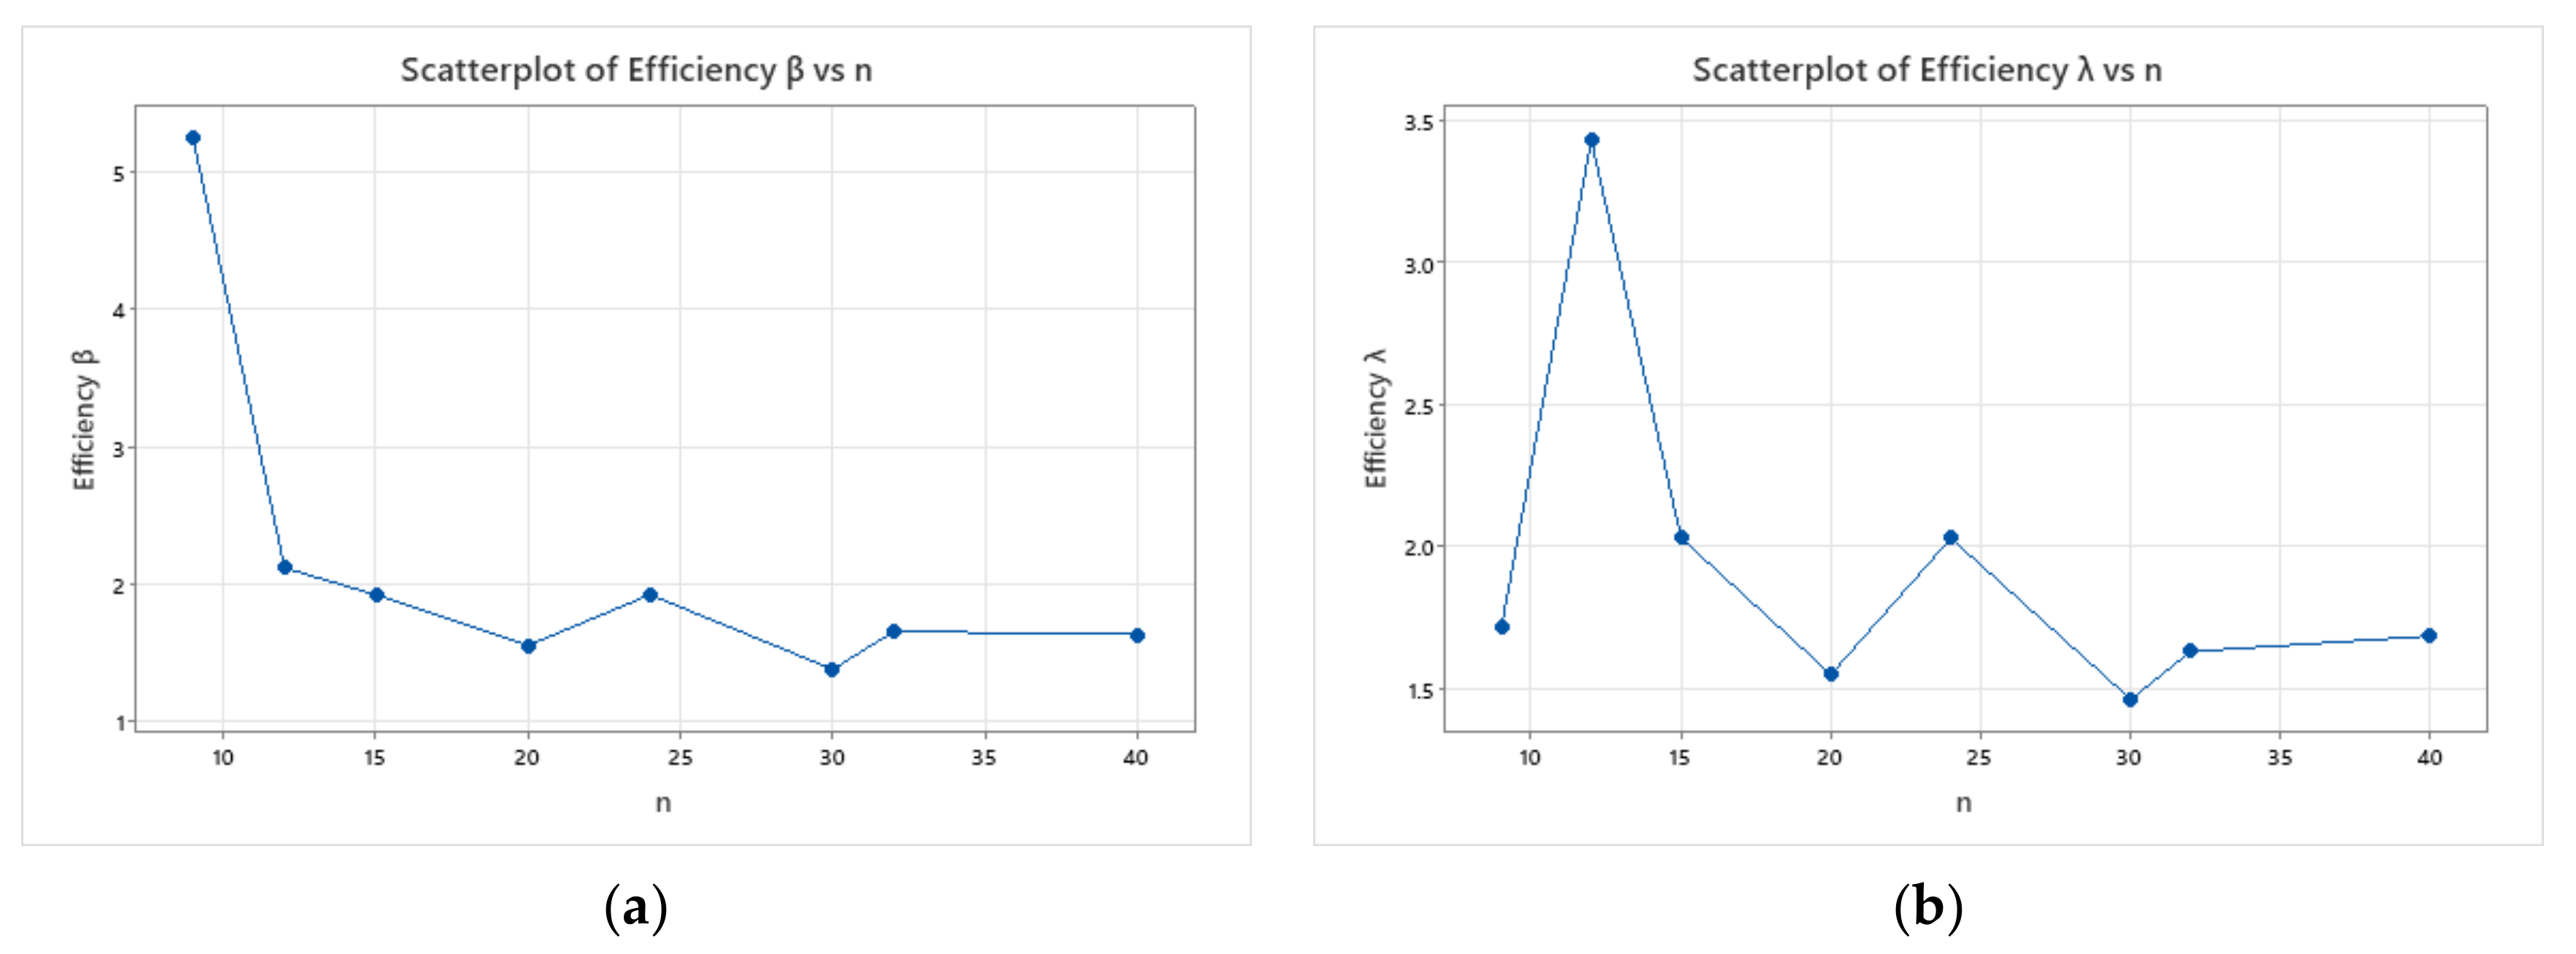
This section aims to find the M L E for the parameters β and λ of E P distribution using S R S and R S S .
The M L E of the parameters, when S R S is used, is the solution of the following equations given by [4].
If X 1 , X 2 , , X n is a random sample from E P β , λ , then the log-likelihood function, L β , λ , is
L β , λ = n l n β + n l n β λ + β 1 i = 1 n l n 1 1 + x i λ λ + 1 i = 1 n l n 1 + x i .
The normal equations become:
L β , λ β = n β + i = 1 n l n 1 1 + x i λ = 0
L β , λ λ = n λ i = 1 n l n 1 + x i + θ 1 i = 1 n 1 + x i λ l n 1 + x i 1 1 + x i λ = 0
From (5), we obtain the M L E of θ as a function of λ , say θ ^ λ , where
β ^ M L E = β ^ λ = n i = 1 n l n 1 1 + x i λ
Putting β ^ λ in the log-likelihood function, we obtain
g λ = L β ^ λ , λ = n l n n n l n i = 1 n l n 1 1 + x i λ + n l n λ n i = 1 n l n 1 1 + x i λ λ + 1 i = 1 n l n 1 + x i
Therefore, the M L E of λ , say λ ^ M L E , can be obtained by maximizing g λ with respect to λ . It is observed that g λ is a unimodal function, and the λ ^ M L E that maximizes g λ can be obtained from the fixed-point solution of h λ = λ , where
h λ = i = 1 n 1 + x i λ l n 1 + x i 1 ( 1 + x i ) λ i = 1 n l n 1 ( 1 + x i ) λ + 1 n i = 1 n l n 1 + x i 1 ( 1 + x i ) λ 1 .
Since λ ^ is a fixed-point solution of the nonlinear equation h λ = λ , therefore, it can be obtained by using a simple iterative scheme as follows:
h λ j = λ j + 1 ,
where λ j is the j t h iterate of λ ^ . The iteration procedure should be stopped when λ j λ j + 1 is sufficiently small.
Here we use the Newton–Raphson method to solve the nonlinear system of equations. It is shown in [25] that if the initial guess is sufficiently close to the exact solution, the Newton–Raphson method will be convergent to the exact solution.
These equations are solved numerically to compare the M L E based on S R S to that found on R S S .
Now to simplify notations, let Y i j : i = 1 , 2 , , m , j = 1 , 2 , , k denote the ranked set sample of size n = k m from an EP population, where m is the set size, and k is the number of cycles. Then, the pdf of Y i j is given by:
g i y i j = m ! i 1 ! m i ! F y i j ] i 1 1 F y i j ] m i f y i j = m ! i 1 ! m i ! β λ ( 1 + y i j ) λ + 1 [ 1 ( 1 + y i j ) λ ] β i 1 { 1 [ 1 ( 1 + y i j ) λ ] β } m i ;         y i j > 0
The likelihood function is given by
L β , λ = Π j = 1 k Π i = 1 m g i y i j = c β m k λ m k Π j = 1 k Π i = 1 m ( 1 + y i j ) λ + 1 [ 1 ( 1 + y i j ) λ ] β i 1 Π j = 1 k Π i = 1 m { 1 [ 1 ( 1 + y i j ) λ ] β } m i
where c is a constant. Then, the log-likelihood function is:
l o g L β , λ = l n l = l n c + m k l n β + m k l n λ λ + 1 j = 1 k i = 1 m l n 1 + y i j + j = 1 k i = 1 m β i 1 l n [ 1 1 + y i j ) λ + j = 1 k i = 1 m m i l n { 1 [ 1 ( 1 + y i j ) λ ] β }
By finding the first derivation of l o g L with respect to β and λ and setting them to zero, the following equations are found
β l o g L = m k β j = 1 k i = 1 m + i l n [ 1 1 + y i j ) λ j = 1 k i = 1 m m i [ 1 ( 1 + y i j ) λ ] β l n [ 1 1 + y i j ) λ 1 [ 1 ( 1 + y i j ) λ ] β = 0
λ l o g L = m k λ j = 1 k i = 1 m l n 1 + y i j + j = 1 k i = 1 m β i 1 ( 1 + y i j ) λ l n 1 + y i j 1 ( 1 + y i j ) λ β j = 1 k i = 1 m m i ( 1 + y i j ) λ [ 1 ( 1 + y i j ) λ ] β 1 l n 1 + y i j 1 [ 1 ( 1 + y i j ) λ ] β = 0
The M L estimators of β and λ , say β ¯ R S S   and   λ ¯ R S S , are the solution of the two nonlinear equations. Since it is difficult to find a closed-form solution for the parameters, a numerical technique is needed to solve them.

4. Simulation Study

In this section, a numerical study is considered to compare the M L estimators of the unknown parameters β and λ for E P distribution based on R S S and S R S . Comparison studies between these estimators will be carried out through M S E s , Bias, and relative efficiency. Monte Carlo simulation is applied for different set sizes, different numbers of cycles, and different parameter values. The simulation procedures are described through the following algorithm.
Step 1: A random sample of sizes n = 9 ,   12 ,   15 ,   20 ,   24 ,   30 ,   32 and 40 with set size m = 3 ,   4 , number of cycles k = 3 ,   5 ,   8 ,   10 , where n = m × k are generated from E P distribution.
Step 2: The parameter values are selected as β = 0.5 ,   1 ,   1.5 for λ = 1 in the estimation procedure.
Step 3: For the chosen set of parameters and each sample of size n , four estimators β ^ S R S ,   λ ^ S R S , β ¯ R S S , λ ¯ R S S are computed under S R S and R S S .
Step 4: Repeat the previous steps from 1 to 3 , N times representing different samples, where N = 1000 . Then, the M S E and Bias of the estimates are computed.
Step 5: Compute the efficiency of estimators, that defined as, E f f i c i e n c y = M S E S R S M S E R S S .
All simulated studies presented here are obtained via Maple. The results are reported in Table 1, Table 2 and Table 3. Each table contains the estimates of parameters for E P distribution under S R S and R S S , along with the efficiency of the estimators for S R S relative to R S S for the different sample sizes and parameters values.
From Table 1, Table 2 and Table 3, many conclusions can be made on the performance of both methods of estimation based on R S S and S R S . Further, the sensitivity analysis of results is very important [25] and Figure 1, Figure 2 and Figure 3 show the effectiveness of the results. These conclusions are summarized as follows:
  • Based on S R S , the bias and M S E for estimates of β and λ are more significant than that based on R S S .
  • For both methods of estimations, it is clear that the bias and M S E decrease as set sizes increase for fixed values of β .
  • As the value of β increases, the bias and M S E increase in almost all cases.
It is clear from Table 1, Table 2 and Table 3 and Figure 1, Figure 2 and Figure 3 that the efficiency of estimators increases as the sample sizes increase. The estimators based on R S S have a smaller M S E than the corresponding ones based on S R S . The efficiency of R S S estimators with respect to S R S estimators is greater than one and increases when the sample size increases.

5. Conclusions

This paper deals with the estimation problem of unknown parameters of an EP distribution based on R S S . Maximum likelihood estimators M L E for the parameters of E P distribution were investigated mathematically and numerically. It was found that the M L E s were not in closed form, so simulation was conducted to study the behaviors of the proposed estimators. The numerical results show that the bias and M S E of the estimates for both shape parameters relative to RSS are smaller than the corresponding S R S . This study revealed that the estimators based on RSS are more efficient than those from S R S at the same sample size.
It would be interesting to have a numerical application with real data to illustrate its usefulness in future work. The addition of this section was the kind suggestion of an anonymous referee of the journal.

Author Contributions

Conceptualization, H.J.K. and M.F.; methodology, S.G., H.J.K. and A.V.; software, H.J.K.; validation, I.M.-K., formal analysis, S.G.; investigation, I.M.-K. and A.V.; resources, S.G. and H.J.K.; writing—original draft preparation, H.J.K. and S.G.; writing—review and editing, I.M.-K. and M.F.; visualization, S.G. and A.V.; supervision, I.M.-K. All authors have read and agreed to the published version of the manuscript.

Funding

This research received no external funding.

Institutional Review Board Statement

Not applicable.

Informed Consent Statement

Not applicable.

Data Availability Statement

The data of this study are available from the authors upon request.

Conflicts of Interest

The authors declare no conflict of interest.

References

  1. Gupta, R.C.; Gupta, P.L.; Gupta, R.D. Modeling failure time data by Lehman alternatives. Commun. Stat. Theory Methods 1998, 27, 887–904. [Google Scholar] [CrossRef]
  2. Johnson, N.L.; Kotz, S.; Balakrishnan, N. Continuous Univariate Distributions; Wiley Series in Probability and Statistics; Wiley: New York, NY, USA, 1994; Volume 1. [Google Scholar]
  3. Ahsanullah, M.; Nevzorov, V.B.; Shakil, M. Order Statistics: An Introduction; Handbook of statistics; Springer: Berlin/Heidelberg, Germany, 1998; Volume 16, pp. 3–24. [Google Scholar]
  4. Shawky, A.I.; Abu-Zinadah, H.H. Exponentiated Pareto distribution: Different method of estimations. Int. J. Contemp. Math. Sci. 2009, 4, 677–693. [Google Scholar]
  5. Abuzinadah, H. A study on mixture of exponentiated pareto and exponential distributions. J. Appl. Sci. Res. 2010, 6, 358–376. [Google Scholar]
  6. Afify, W. On estimation of the exponentiated Pareto distribution under different sample schemes. Stat. Methodol. 2010, 7, 77–83. [Google Scholar] [CrossRef]
  7. Gupta, R.D.; Kundu, D. Theory & methods: Generalized exponential distributions. Aust. New Zealand J. Stat. 1999, 41, 173–188. [Google Scholar]
  8. Gupta, R.D.; Kundu, D. Generalized exponential distribution: Different method of estimations. J. Stat. Comput. Simul. 2001, 69, 315–337. [Google Scholar] [CrossRef]
  9. Mahmoud, M.A.E.; Yhiea, N.M.; El-Said, S.M. Estimation of parameters for the exponentiated Pareto distribution based on progressively type-II right censored data. J. Egypt. Math. Soc. 2016, 24, 431–436. [Google Scholar] [CrossRef] [Green Version]
  10. Alzaghal, A. The Exponentiated Gamma-Pareto Distribution with Application to Bladder Cancer Susceptibility. J. Stat. Appl. Probab. Lett. 2020, 7, 39–56. [Google Scholar]
  11. Makouei, R.; Khamnei, H.J.; Salehi, M. Moments of order statistics and k-record values arising from the complementary beta distribution with application. J. Comput. Appl. Math. 2021, 390, 113386. [Google Scholar] [CrossRef]
  12. McIntyre, G. A method for unbiased selective sampling, using ranked sets. Am. Stat. 2005, 59, 230–232. [Google Scholar] [CrossRef]
  13. Takahasi, K.; Wakimoto, K. On unbiased estimates of the population mean based on the sample stratified by means of ordering. Ann. Inst. Stat. Math. 1968, 20, 1–31. [Google Scholar] [CrossRef]
  14. Dell, T.R.; Clutter, J.L. Ranked set sampling theory with order statistics background. Biometrics 1972, 28, 545–555. [Google Scholar] [CrossRef]
  15. Samawi, H.M.; Ahmed, M.S.; Abu-Dayyeh, W. Estimating the population mean using extreme ranked set sampling. Biom. J. 1996, 38, 577–586. [Google Scholar] [CrossRef]
  16. Muttlak, H. Median ranked set sampling. J. Appl. Stat. Sci. 1997, 6, 245–255. [Google Scholar]
  17. Al-Saleh, M.F.; Al-Kadiri, M.A. Double-ranked set sampling. Stat. Probab. Lett. 2000, 48, 205–212. [Google Scholar] [CrossRef]
  18. Kaur, A.; Patil, G.P.; Sinha, A.K.; Taillie, C. Ranked set sampling: An annotated bibliography. Environ. Ecol. Stat. 1995, 2, 25–54. [Google Scholar] [CrossRef]
  19. Chen, Z.; Bai, Z.; Sinha, B. Ranked Set Sampling: Theory and Applications; Springer: Berlin/Heidelberg, Germany, 2004; Volume 176. [Google Scholar]
  20. Khamnei, H.J.; Mayan, S.R. Comparison of parameter estimation in the exponentiated Gumbel distribution based on ranked set sampling and simple random sampling. J. Math. Stat. Sci. 2016, 2016, 490–497. [Google Scholar]
  21. Khamnei, H.J.; Abusaleh, S. Estimation of parameters in the generalized logistic distribution based on ranked set sampling. Int. J. Nonlinear Sci. 2017, 24, 154–160. [Google Scholar]
  22. Sabry, M.H.; Almetwally, E.M. Estimation of the Exponential Pareto Distribution’s Parameters under Ranked and Double Ranked Set Sampling Designs. Pak. J. Stat. Oper. Res. 2021, 17, 169–184. [Google Scholar] [CrossRef]
  23. Ahmed, S.; Shabbir, J. On the use of ranked set sampling for estimating super-population total: Gamma population model. Sci. Iranica. Trans. E Ind. Eng. 2021, 28, 465–476. [Google Scholar] [CrossRef] [Green Version]
  24. Dorniani, S.; Mohammadpour, A.; Nematollahi, N. Estimation of the parameter of Le’vy distribution using ranked set sampling. AUT J. Math. Comput. 2021, 2, 53–60. [Google Scholar]
  25. Atkinson, K.E. An Introduction to Numerical Analysis; John Wiley & Sons: Hoboken, NJ, USA, 2008. [Google Scholar]
Figure 1. The efficiency of the M L E parameters β (a) and λ (b) when β = 1 and λ = 1 .
Axioms 11 00293 g001
Figure 2. The efficiency of the M L E parameters β (a) and λ (b) when β = 1 and λ = 1 .
Axioms 11 00293 g002
Figure 3. The efficiency of the M L E parameters β (a) and λ (b) when β = 1.5 and λ = 1 .
Axioms 11 00293 g003
Table 1. The bias M S E and efficiency of the M L E parameters β and λ when β = 0.5 and λ = 1 .
(k, s)RSSn S R S Efficiency
β λ β λ β λ
(3, 3)0.115 (0.091)0.328 (0.658)90.197 (0.291)0.493 (1.262)3.2071.918
(4, 3)0.072 (0.035)0.209 (0.298)120.127 (0.099)0.367 (0.819)2.7512.851
(3, 5)0.059 (0.031)0.171 (0.240)150.092 (0.057)0.282 (0.474)1.9751.841
(4, 5)0.043 (0.019)0.130 (0.149)200.063 (0.033)0.180 (0.260)1.7441.773
(3, 8)0.032 (0.013)0.087 (0.105)240.055 (0.025)0.180 (0.225)2.1421.984
(3, 10)0.026 (0.010)0.074 (0.082)300.036 (0.016)0.098 (0.116)1.4191.630
(4, 8)0.026 (0.009)0.077 (0.076)320.034 (0.015)0.108 (0.128)1.6941.755
(4, 10)0.021 (0.007)0.066 (0.057)400.031 (0.012)0.088 (0.094)1.6451.828
Table 2. The bias M S E and efficiency of the M L E parameters β and λ when β = 1 and λ = 1 .
(k, s)RSSn S R S Efficiency
β λ β λ β λ
(3, 3)0.318 (0.698)0.328 (0.320)90.552 (2.917)0.328 (0.563)1.7594.180
(4, 3)0.191 (0.233)0.147 (0.162)120.339 (0.721)0.243 (0.366)2.2633.096
(3, 5)0.155 (0.200)0.118 (0.131)150.239 (0.369)0.190 (0.231)1.7651.847
(4, 5)0.114 (0.121)0.092 (0.086)200.157 (0.194)0.122 (0.137)1.5961.609
(3, 8)0.081 (0.074)0.061 (0.061)240.140 (0.147)0.126 (0.120)1.9642.989
(3, 10)0.066 (0.058)0.052 (0.048)300.089 (0.087)0.069 (0.068)1.4161.501
(4, 8)0.068 (0.056)0.055 (0.045)320.085 (0.090)0.074 (0.073)1.5421.616
(4, 10)0.054 (0.039)0.047 (0.034)400.077 (0.068)0.062 (0.055)1.6411.751
Table 3. The bias M S E and efficiency of the M L E parameters β and λ when β = 1.5 and λ = 1 .
(k, s)RSSn S R S Efficiency
β λ β λ β λ
(3, 3)0.593 (2.496)0.193 (0.243)91.056 (3.094)0.280 (0.417)5.2441.716
(4, 3)0.345 (0.737)0.128 (0.127)120.620 (2.529)0.206 (0.269)2.1213.432
(3, 5)0.278 (0.624)0.103 (0.102)150.428 (0.426)0.108 (0.092)1.9272.030
(4, 5)0.204 (0.368)0.079 (0.068)200.277 (0.571)0.105 (0.106)1.5581.551
(3, 8)0.143 (0.210)0.053 (0.048)240.248 (0.426)0.108 (0.092)1.9272.030
(3, 10)0.117 (0.166)0.046 (0.039)300.155 (0.243)0.060 (0.054)1.3841.463
(4, 8)0.119 (0.161)0.047 (0.035)320.150 (0.262)0.063 (0.058)1.6601.631
(4, 10)0.095 (0.112)0.041 (0.027)400.133 (0.188)0.054 (0.044)1.6371.686
Publisher’s Note: MDPI stays neutral with regard to jurisdictional claims in published maps and institutional affiliations.

