
A GIS-MCDM Method for Ranking Potential Station Locations in the Expansion of Bike-Sharing Systems


Abstract
:1. Introduction
2. Related Work
2.1. Prior Research
2.2. Contributions of This Study
3. Materials and Methods
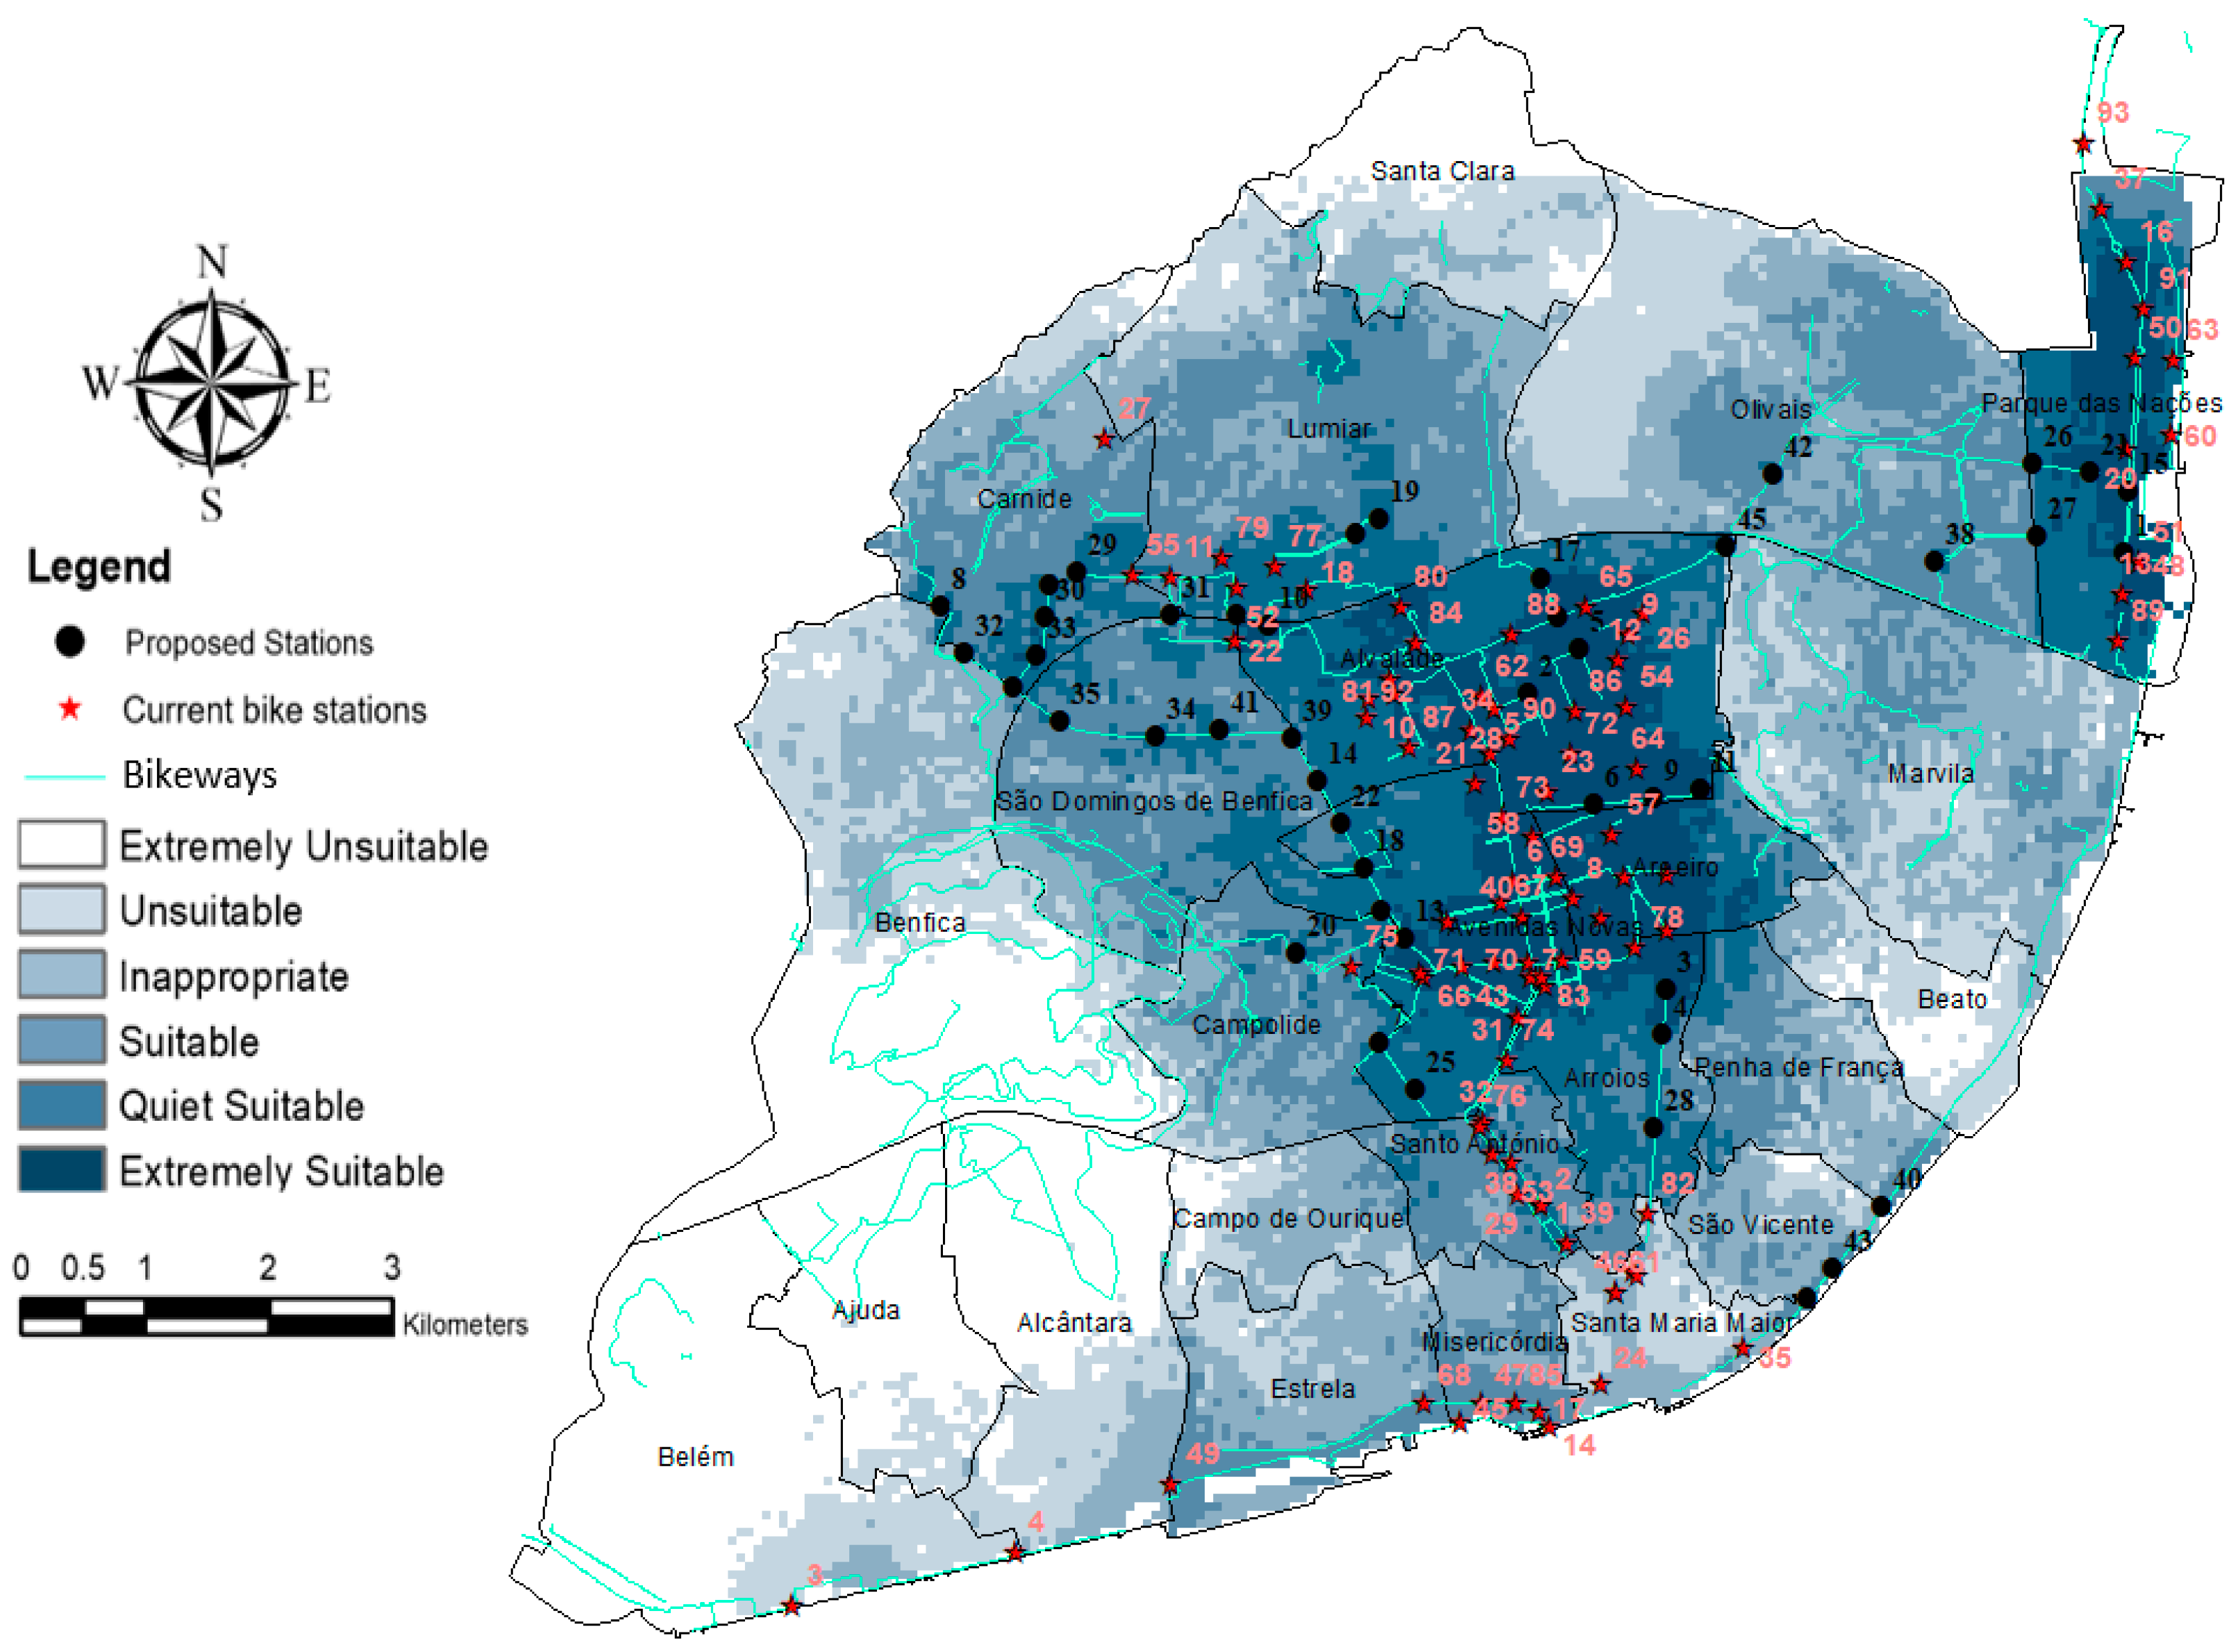
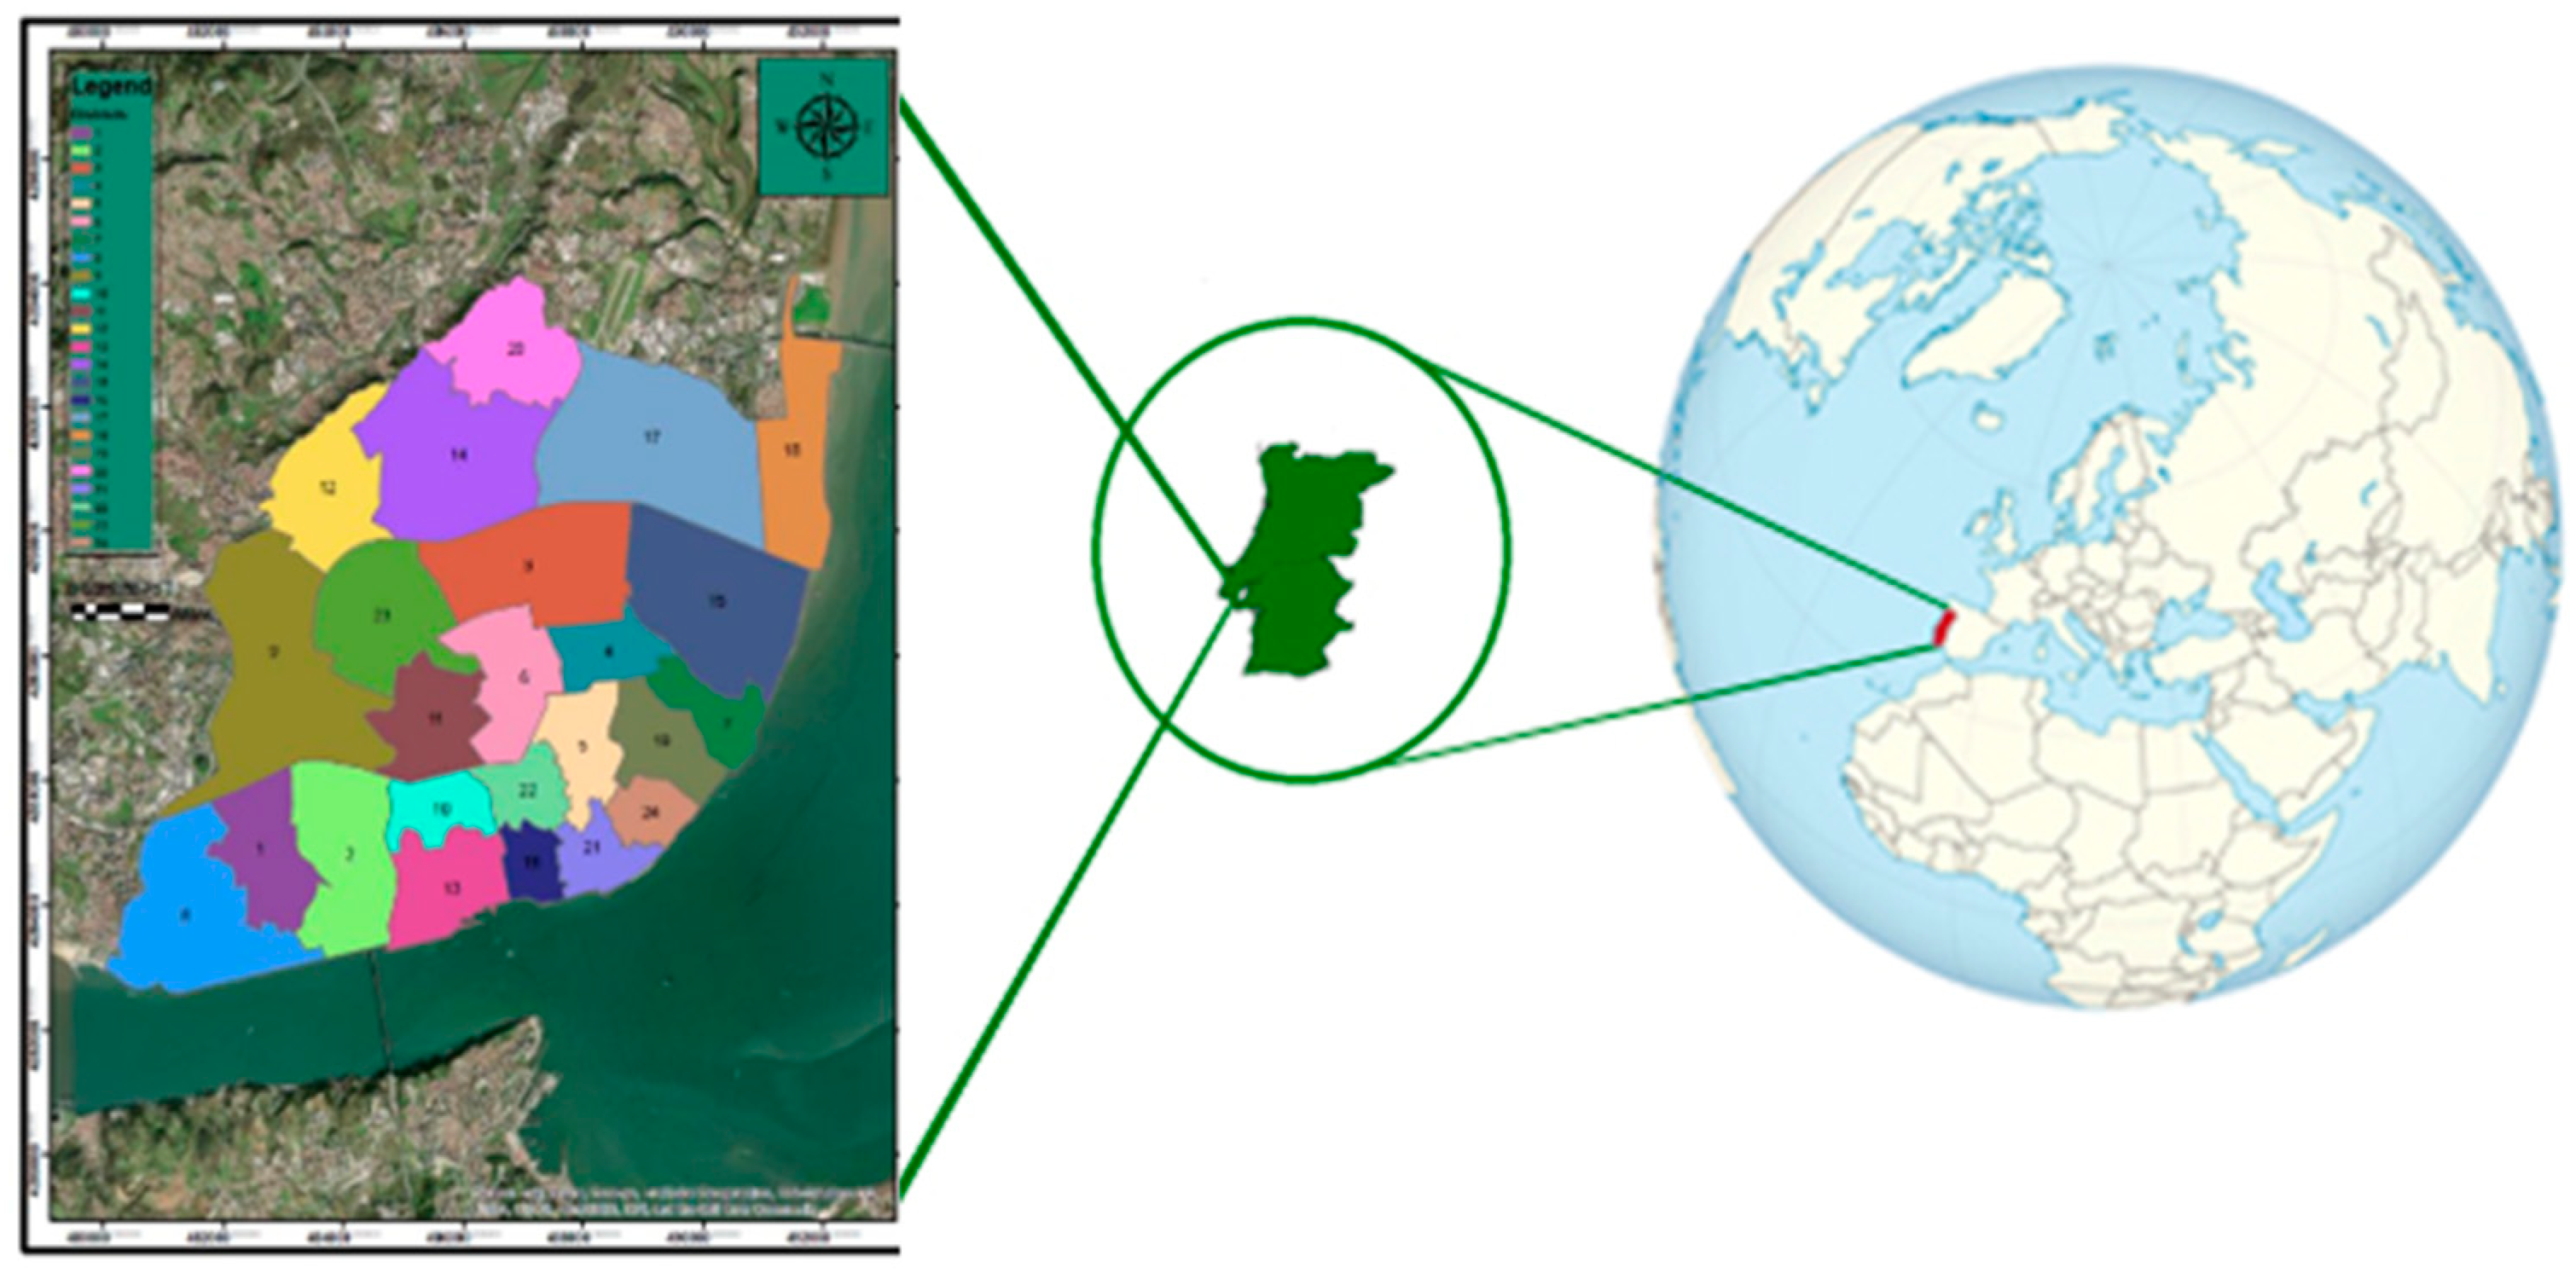
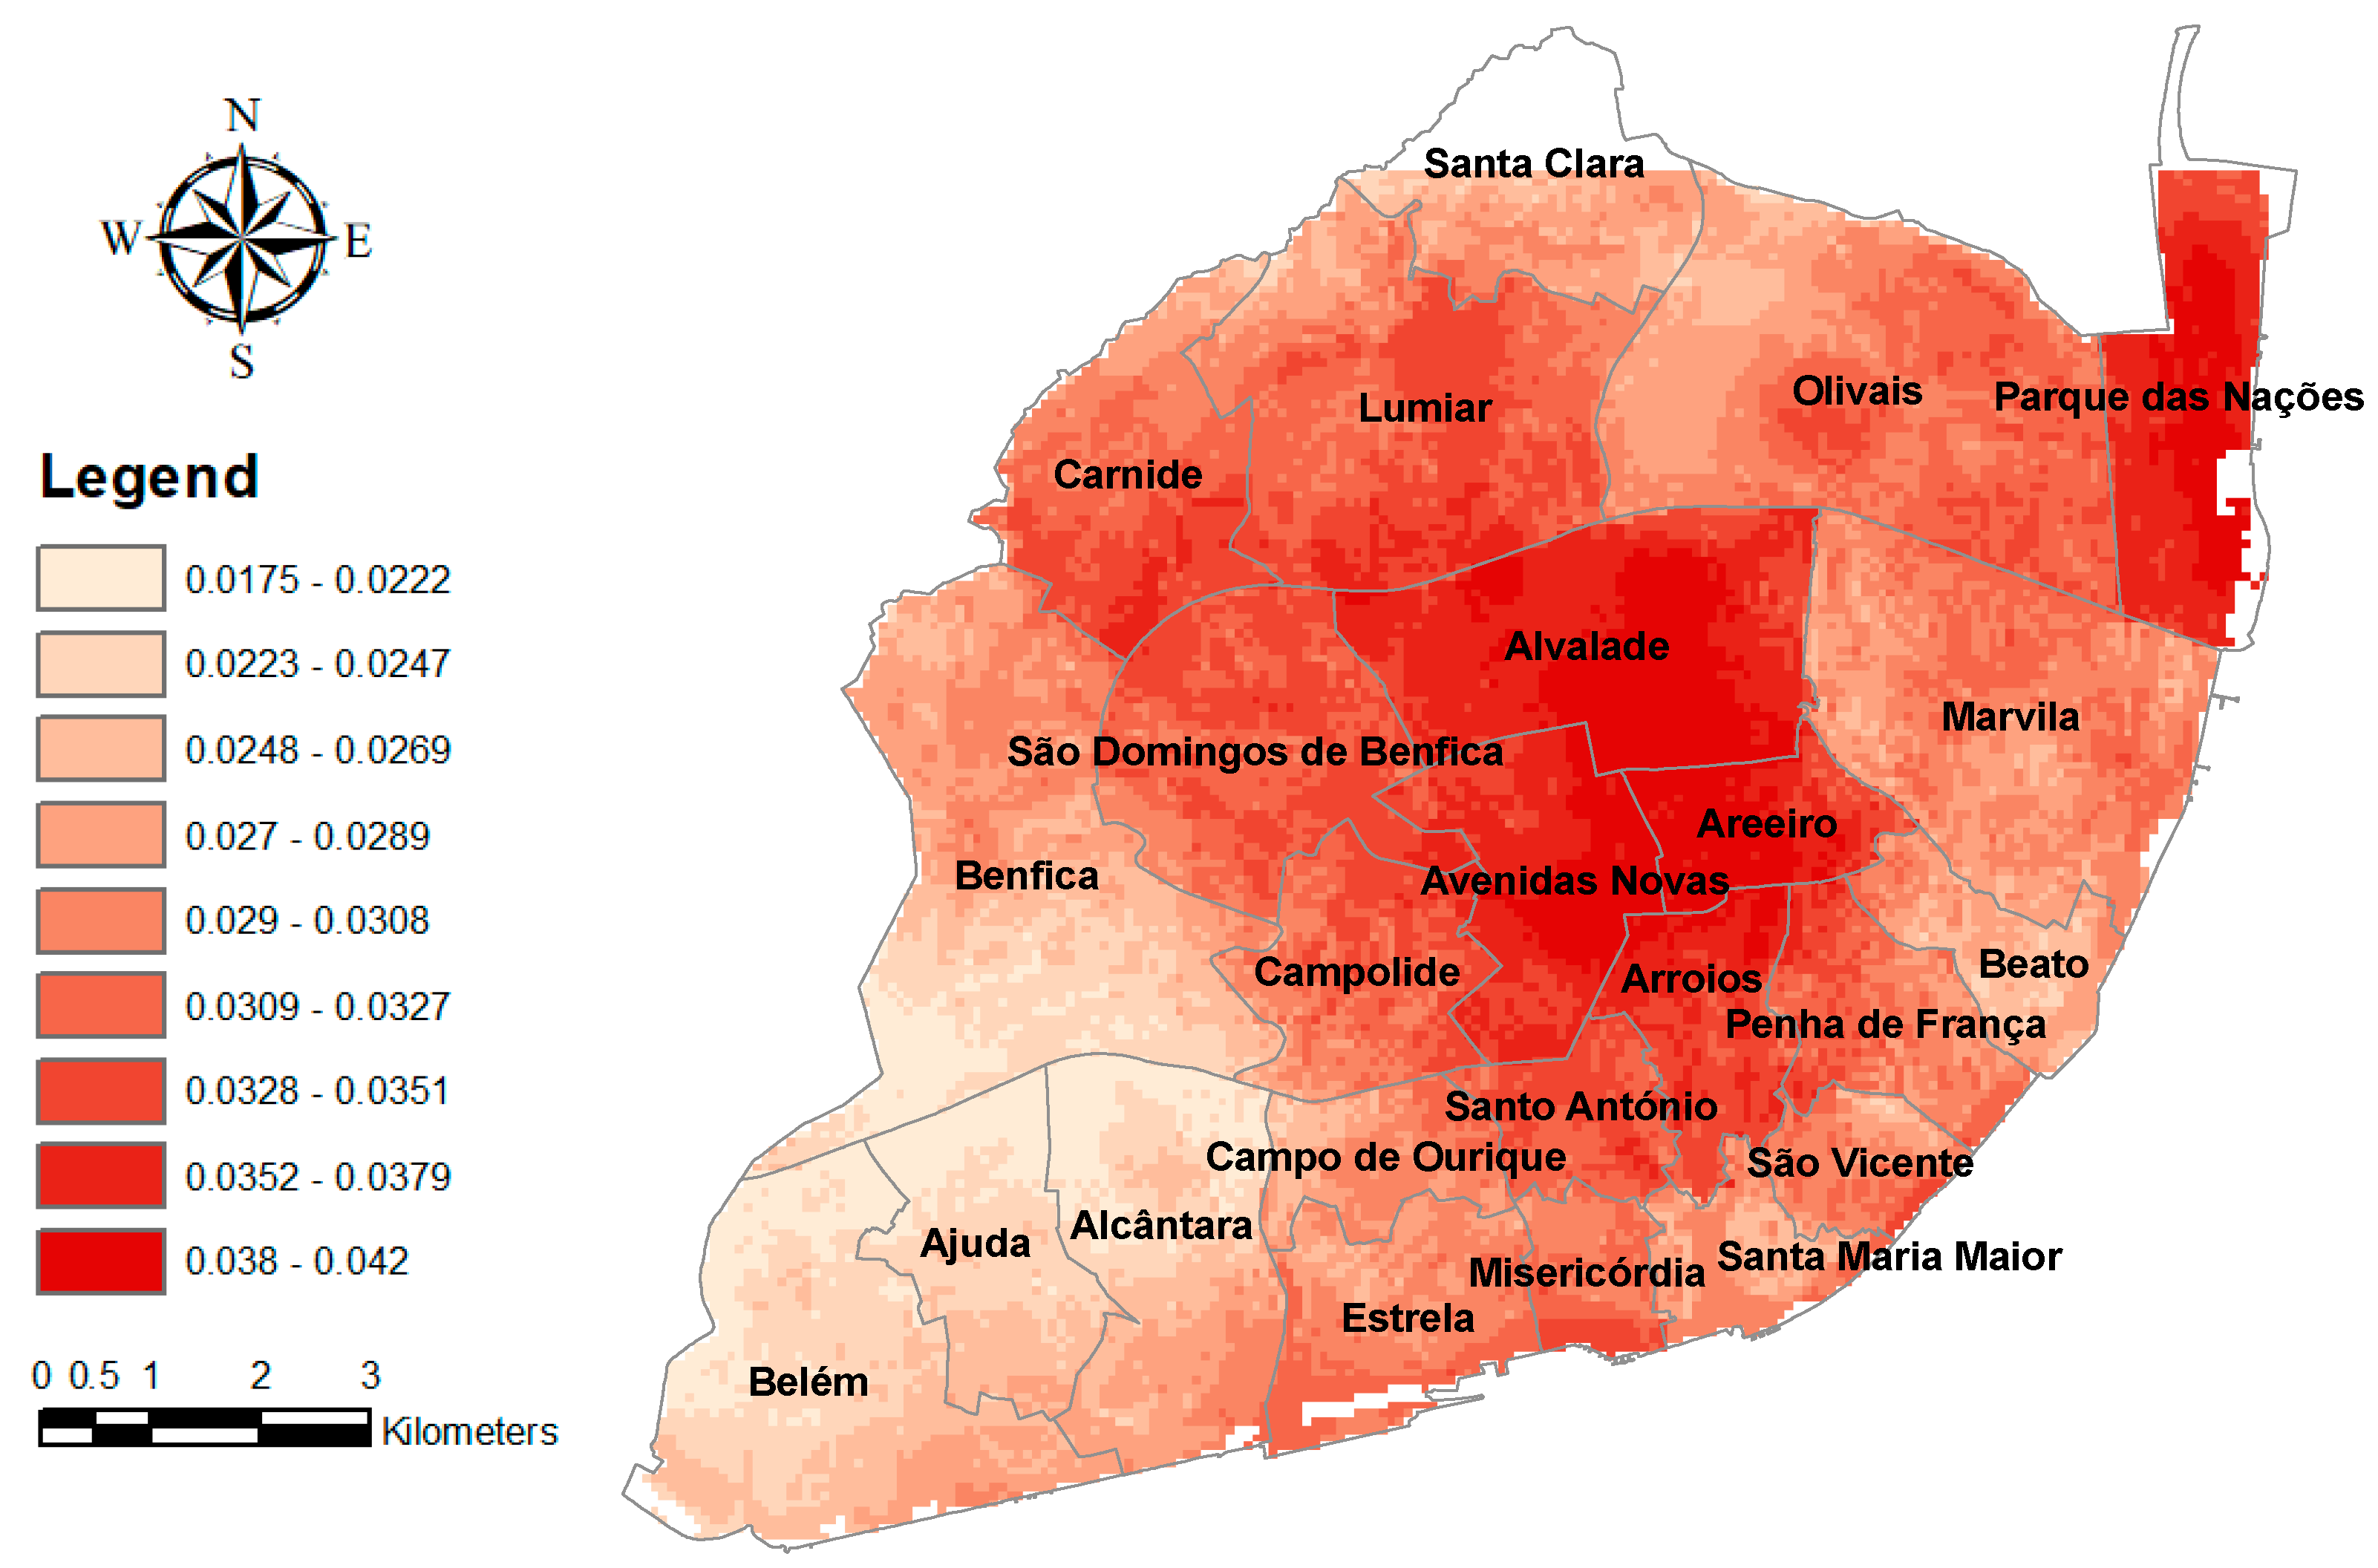
3.1. Study Area
3.2. Methods
- The criteria selection is detailed in Section 4.1;
- The MCDM method is described in Section 4.2;
- The GIS data processing is detailed in Section 4.3.
4. Results and Discussion
4.1. Criteria Selection
4.2. MCDM Technique
- Creating hierarchical model trees of assessment elements;
- Building a pairwise comparisons questionnaire using a scale of 1–9;
- Determining the weights of criteria;
- Analyzing the consistency.
- TOPSIS Approach
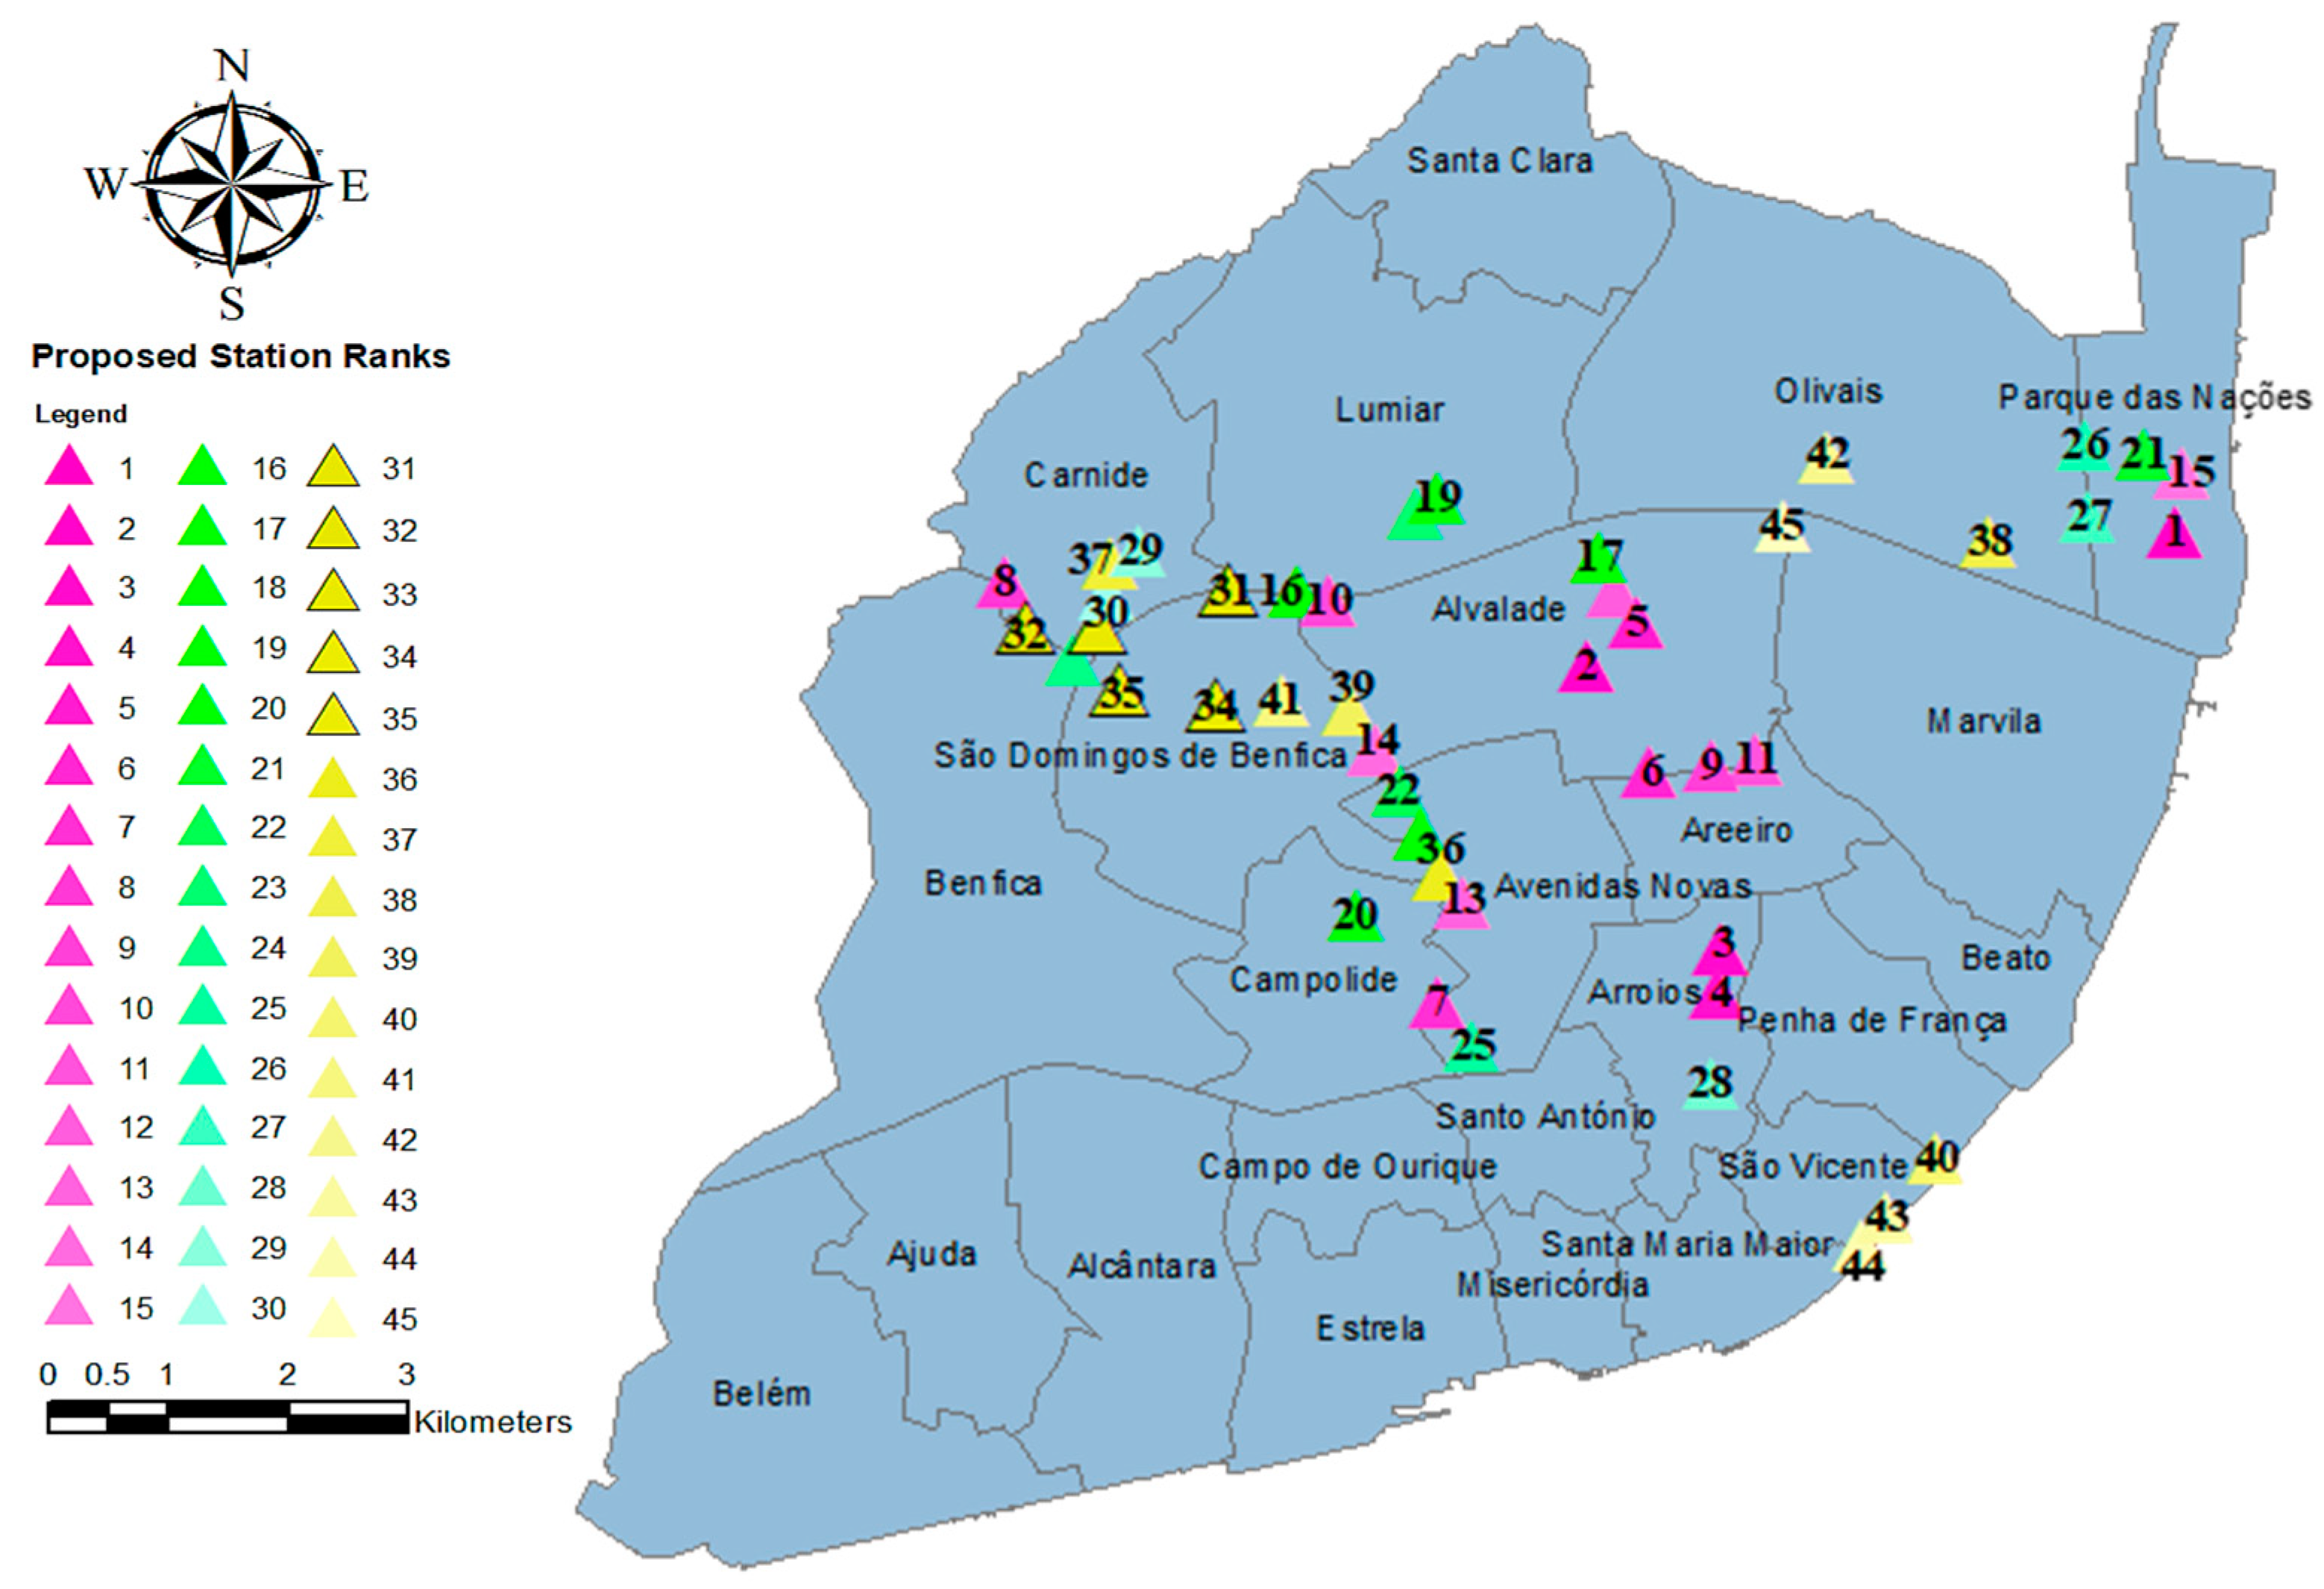
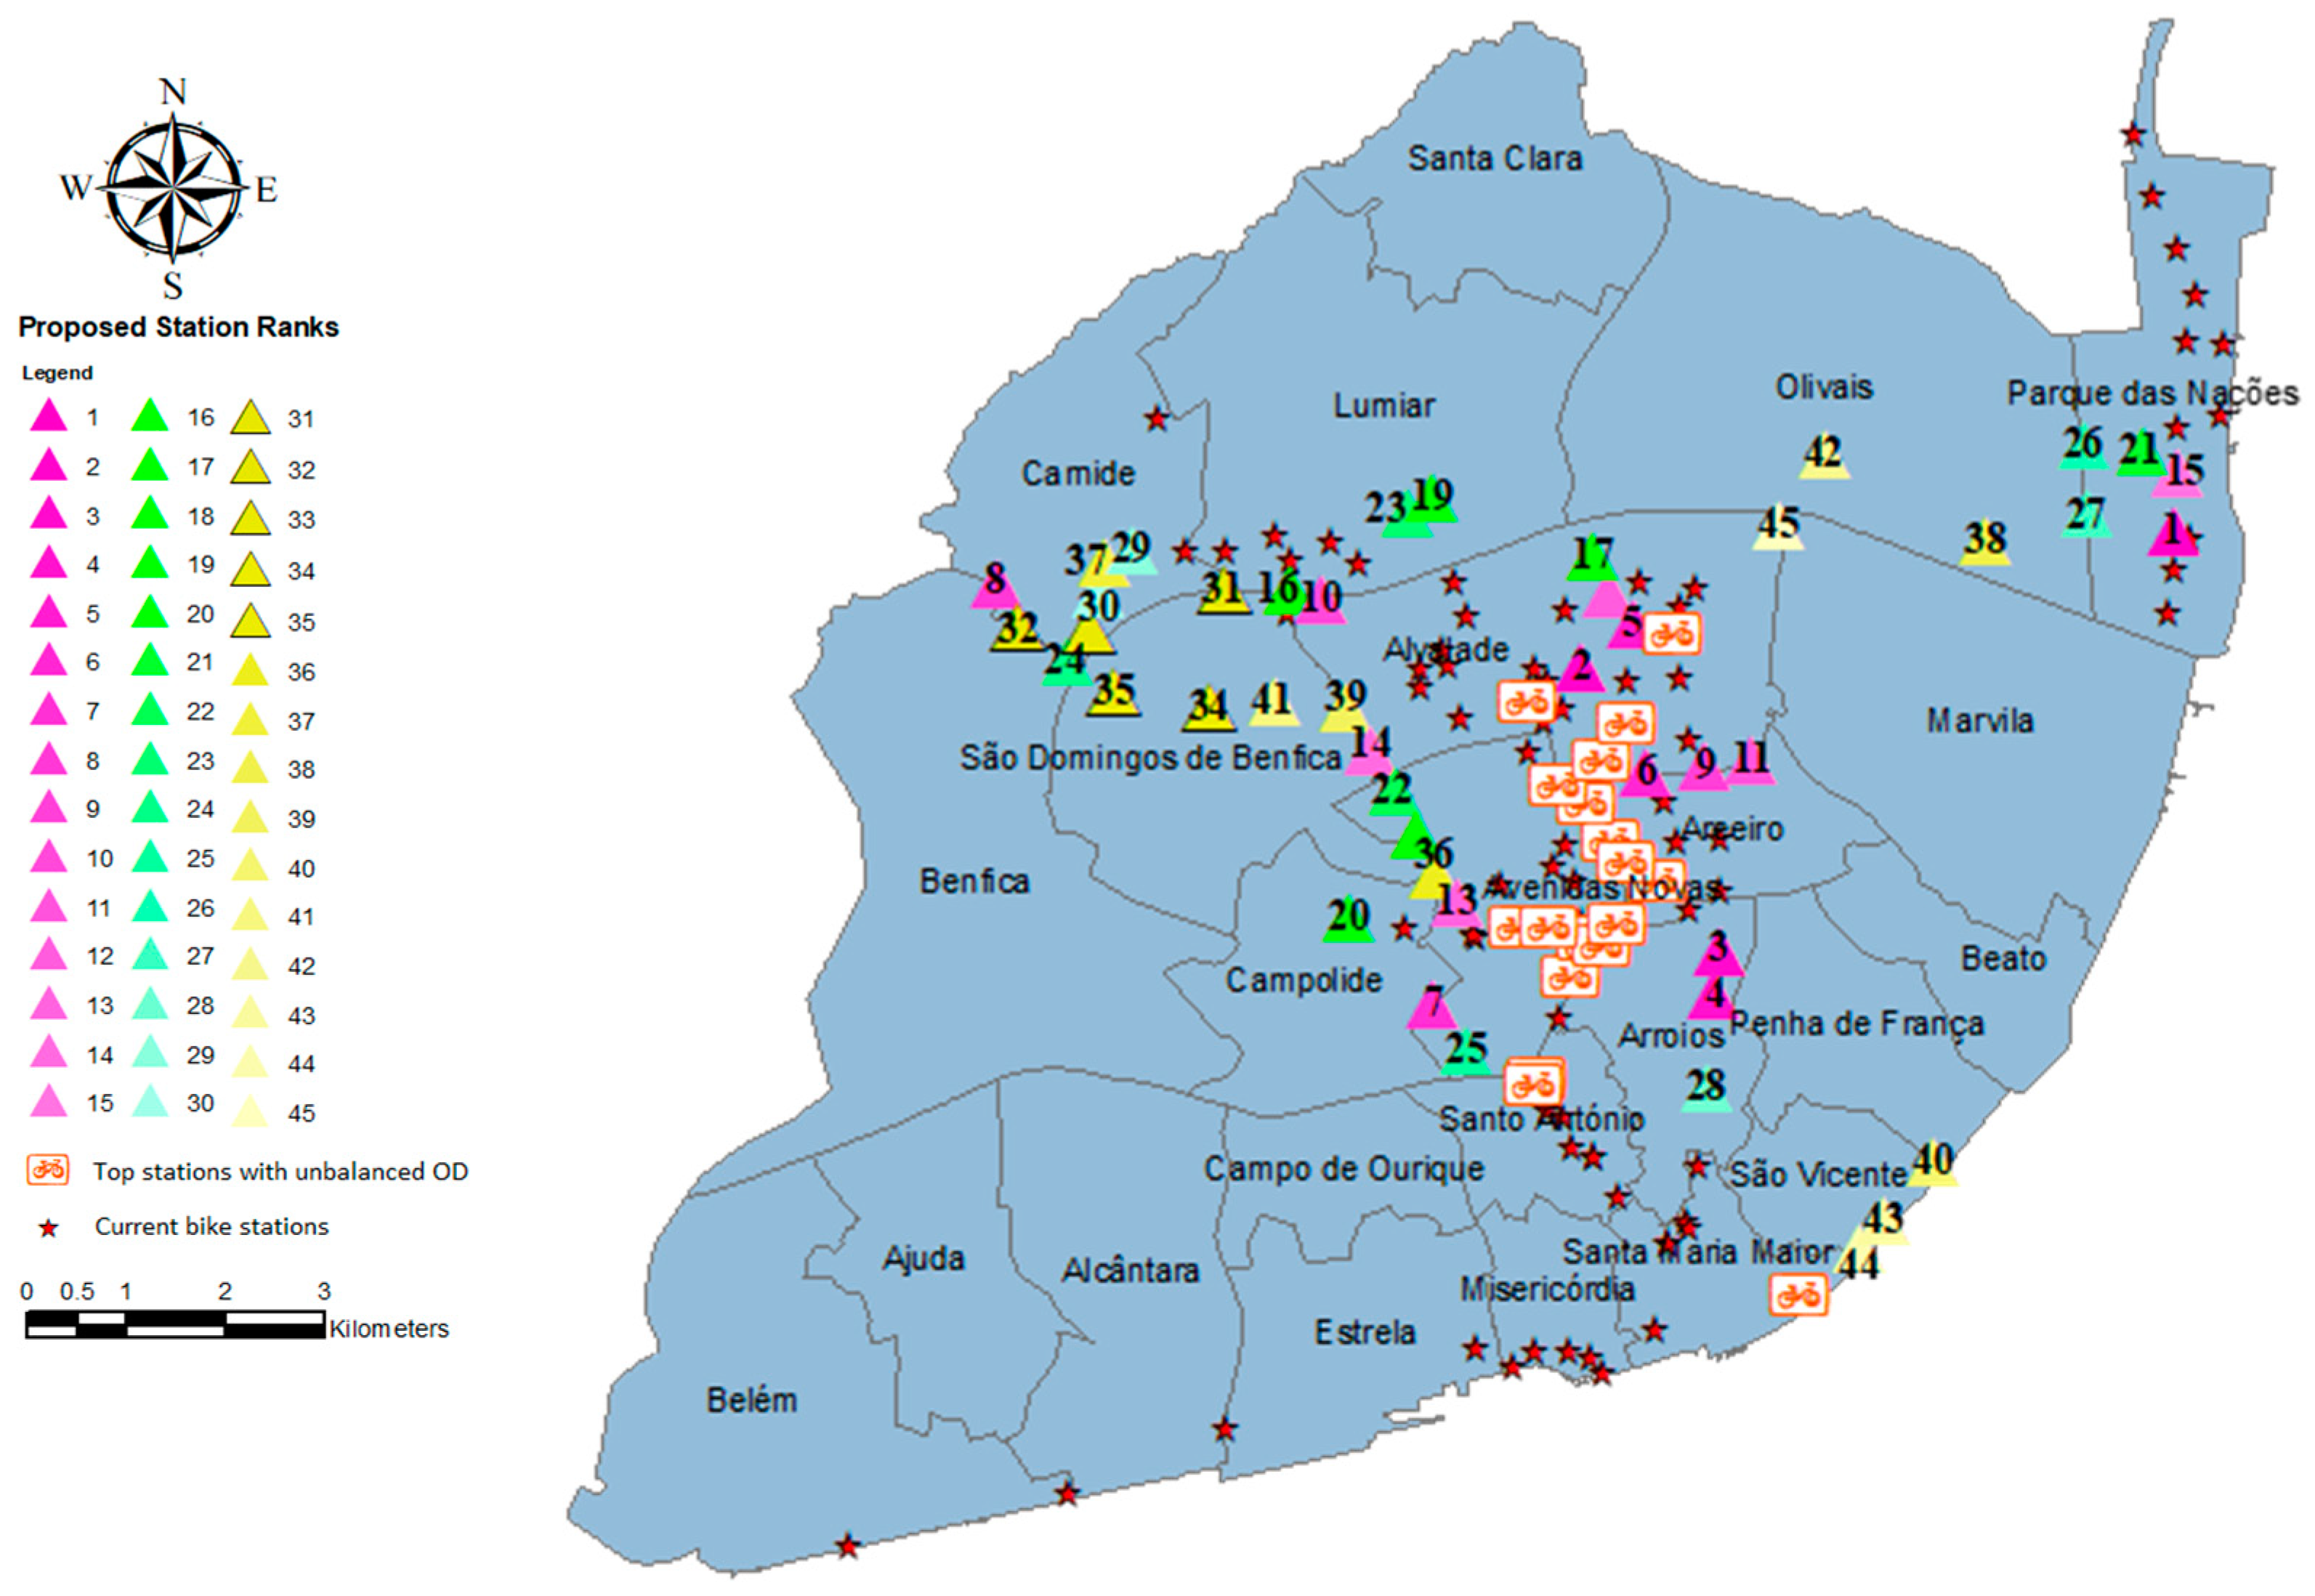
4.3. GIS Analysis
5. Conclusions
Author Contributions
Funding
Institutional Review Board Statement
Informed Consent Statement
Data Availability Statement
Conflicts of Interest
References
- Saltykova, K.; Ma, X.; Yao, L.; Kong, H. Environmental impact assessment of bike-sharing considering the modal shift from public transit. Transp. Res. Part D Transp. Environ. 2022, 105, 103238. [Google Scholar] [CrossRef]
- Caggiani, L.; Camporeale, R.; Marinelli, M.; Ottomanelli, M. User satisfaction based model for resource allocation in bike-sharing systems. Transp. Policy 2019, 80, 117–126. [Google Scholar] [CrossRef]
- Caggiani, L.; Camporeale, R.; Ottomanelli, M.; Szeto, W.Y. A modeling framework for the dynamic management of free-floating bike-sharing systems. Transp. Res. Part C Emerg. Technol. 2018, 87, 159–182. [Google Scholar] [CrossRef]
- Leclaire, P.; Couffin, F. Method for Static Rebalancing of a Bike Sharing System. IFAC-PapersOnLine 2018, 51, 1561–1566. [Google Scholar] [CrossRef]
- Cipriano, M.; Colomba, L.; Garza, P. A Data-Driven Based Dynamic Rebalancing Methodology for Bike Sharing Systems. Appl. Sci. 2021, 11, 6967. [Google Scholar] [CrossRef]
- Ban, S.; Hyun, K.H. Designing a User Participation-Based Bike Rebalancing Service. Sustainability 2019, 11, 2396. [Google Scholar] [CrossRef] [Green Version]
- Bahadori, M.S.; Gonçalves, A.B.; Moura, F. Fatores críticos na operação de sistemas de bicicletas partilhadas: Revisão do estado da arte. In Proceedings of the 9th Congress Rodoviário Português, Lisboa, Portugal, 28–30 May 2019; p. 11. [Google Scholar]
- Dębowska-Mróz, M.; Lis, P.; Pawłowski, S. Location of the city bike station as an element of shaping the communication policy in cities. Autobusy-Tech. Eksploat. Syst. Transp. 2019, 24, 394–399. [Google Scholar] [CrossRef]
- Liu, Y.; Tian, L. A graded cluster system to mine virtual stations in free-floating bike-sharing system on multi-scale geographic view. J. Clean. Prod. 2021, 281, 124692. [Google Scholar] [CrossRef]
- Bahadori, M.S.; Moura, F.; Gonçalves, A.B. What are mixed e-bike sharing systems? In Proceedings of the XVI Congress Ibérico “A Bicicleta e a Cidade Para além da Mobilidade”, Cascais, Portugal, 2–4 May 2019. [Google Scholar]
- Almannaa, M.H.; Elhenawy, M.; Rakha, H.A. Identifying Optimum Bike Station Initial Conditions using Markov Chain Modeling. Transp. Find. 2019. [Google Scholar] [CrossRef]
- Angelelli, E.; Mor, A.; Speranza, M.G. A simulation framework for the design of a station-based bike sharing system. arXiv 2021, arXiv:2106.10443. [Google Scholar]
- Kabak, M.; Erbaş, M.; Çetinkaya, C.; Özceylan, E. A GIS-based MCDM approach for the evaluation of bike-share stations. J. Clean. Prod. 2018, 201, 49–60. [Google Scholar] [CrossRef]
- Guler, D.; Yomralioglu, T. Location Evaluation of Bicycle Sharing System Stations and Cycling Infrastructures with Best Worst Method Using GIS. Prof. Geogr. 2021, 73, 535–552. [Google Scholar] [CrossRef]
- Guler, D.; Yomralioglu, T. Bicycle station and lane location selection using open source gis technology. In Open Source Geospatial Science for Urban Studies; Springer: Cham, Switzerland, 2021; pp. 9–36. [Google Scholar] [CrossRef]
- Bahadori, M.S.; Gonçalves, A.B.; Moura, F. A Systematic Review of Station Location Techniques for Bicycle-Sharing Systems Planning and Operation. ISPRS Int. J. Geo-Inf. 2021, 10, 554. [Google Scholar] [CrossRef]
- Ahmad, F.; Iqbal, A.; Ashraf, I.; Marzband, M.; Khan, I. Optimal location of electric vehicle charging station and its impact on distribution network: A review. Energy Rep. 2022, 8, 2314–2333. [Google Scholar] [CrossRef]
- Shatnawi, N.; Al-Omari, A.A.; Al-Qudah, H. Optimization of Bus Stops Locations Using GIS Techniques and Artificial Intelligence. Procedia Manuf. 2020, 44, 52–59. [Google Scholar] [CrossRef]
- Yang, J.; Chen, J.; Le, X.; Zhang, Q. Density-oriented versus development-oriented transit investment: Decoding metro station location selection in Shenzhen. Transp. Policy 2016, 51, 93–102. [Google Scholar] [CrossRef]
- Rybarczyk, G.; Wu, C. Bicycle facility planning using GIS and multi-criteria decision analysis. Appl. Geogr. 2010, 30, 282–293. [Google Scholar] [CrossRef]
- García-Palomares, J.C.; Gutiérrez, J.; Latorre, M. Optimizing the location of stations in bike-sharing programs: A GIS approach. Appl. Geogr. 2012, 35, 235–246. [Google Scholar] [CrossRef]
- Ghandehari, M.; Pouyandeh, V.H.; Hossein, M.; Javadi, M. Locating of Bicycle Stations in the City of Isfahan Using Mathematical Programming and Multi-Criteria Decision Making Techniques. Int. J. Acad. Res. Account. 2013, 3, 18–26. [Google Scholar]
- Félix, R.; Cambra, P.; Moura, F. Build it and give ‘em bikes, and they will come: The effects of cycling infrastructure and bike-sharing system in Lisbon. Case Stud. Transp. Policy 2020, 8, 672–682. [Google Scholar] [CrossRef]
- C40 Cities. A Global Network of Mayors Taking Urgent Action to Confront the Climate Crisis and Create a Future Where Everyone Can Thrive. Available online: https://www.c40.org/ (accessed on 21 April 2022).
- Félix, R. Bicycle Mobility Management—User’s Needs and Preferences for Network Planning and Management in the City of Lisbon. Master’s Thesis, Instituto Superior Técnico, Universidade Técnica de Lisboa, Lisbon, Portugal, 2012. [Google Scholar]
- EMEL. EMEL—Empresa de Mobilidade e Estacionamento de Lisboa. Available online: https://www.emel.pt/pt/ (accessed on 16 February 2022).
- Saaty, T.L. What is the analytic hierarchy process? In Mathematical Models for Decision Support; Mitra, G., Greenberg, H.J., Lootsma, F.A., Rijkaert, M.J., Zimmermann, H.J., Eds.; NATO ASI Series; Springer: Berlin/Heidelberg, Germany, 1988; Volume 48. [Google Scholar] [CrossRef]
- Opricovic, S.; Tzeng, G.-H. Compromise solution by MCDM methods: A comparative analysis of VIKOR and TOPSIS. Eur. J. Oper. Res. 2004, 156, 445–455. [Google Scholar] [CrossRef]
- Ghorui, N.; Ghosh, A.; Algehyne, E.A.; Mondal, S.P.; Saha, A.K. AHP-TOPSIS Inspired Shopping Mall Site Selection Problem with Fuzzy Data. Mathematics 2020, 8, 1380. [Google Scholar] [CrossRef]
- Yildiz, A.; Ayyildiz, E.; Gumus, A.T.; Ozkan, C. A Modified Balanced Scorecard Based Hybrid Pythagorean Fuzzy AHP-Topsis Methodology for ATM Site Selection Problem. Int. J. Inf. Technol. Decis. Mak. 2020, 19, 365–384. [Google Scholar] [CrossRef]
- Önüt, S.; Soner, S. Transshipment site selection using the AHP and TOPSIS approaches under fuzzy environment. Waste Manag. 2008, 28, 1552–1559. [Google Scholar] [CrossRef] [PubMed]
- Ishizaka, A.; Labib, A. Analytical hierarchy process and expert choice: Benefits and limitations. Oper. Res. Insight 2009, 22, 201–220. [Google Scholar] [CrossRef] [Green Version]
- Strategic Planning Software for Smarter Decisions. Available online: https://www.expertchoice.com/2021. (accessed on 21 April 2022).
- El-Assi, W.; Mahmoud, M.S.; Habib, K.N. Effects of built environment and weather on bike sharing demand: A station level analysis of commercial bike sharing in Toronto. Transportation 2017, 44, 589–613. [Google Scholar] [CrossRef]
- Shaheen, S.; Chan, N. Mobility and the sharing economy: Potential to facilitate the first-and last-mile public transit connections. Built Environ. 2016, 42, 573–588. [Google Scholar] [CrossRef]
- Zhou, B.; Liu, T.; Ryan, C.; Wang, L.-E.; Zhang, D. The satisfaction of tourists using bicycle sharing: A structural equation model—The case of Hangzhou, China. J. Sustain. Tour. 2020, 28, 1063–1082. [Google Scholar] [CrossRef]


| Main Criteria | Sub-Criteria | # Criteria | |
|---|---|---|---|
| (C1) Bike network | (C1-1) Cycling infrastructure | (C1-1-1) Proximity to the current bike stations | #1 |
| (C1-1-2) Proximity to the current bikeways | #2 | ||
| (C1-1-3) Proximity to the current bike parking spots | #3 | ||
| (C1-2) Proximity to the current bike stations with high transactions | #4 | ||
| (C1-3) Proximity to the zones with high user membership density | #5 | ||
| (C1-4) Proximity to top ten bike stations with high duration trips | #6 | ||
| (C2) Operator | (C2-1) Proximity to the bike stations with unbalanced OD | #7 | |
| (C3) User | (C3-1) Proximity to the users’ residence | #8 | |
| (C4) City infrastructure | (C4-1) Proximity to the points of interest (POI) | #9 | |
| (C4-2) Proximity to the zones with higher population density | #10 | ||
| (C4-3) Proximity to the public transport | (C4-3-1) Proximity to the metro and train stations | #11 | |
| (C4-3-2) Proximity to the taxi hubs | #12 | ||
| (C4-4) Proximity to the electric vehicle charging stations | #13 | ||
| (C4-5) Proximity to areas with a low slope | #14 | ||
| Scale of Importance | Interpretation |
|---|---|
| 1 | Equal importance |
| 3 | Moderate importance |
| 5 | Strong importance |
| 7 | Very strong or demonstrated importance |
| 9 | Extreme importance |
| 2, 4, 6, 8 | Compromise between the abovementioned values |
| n | 1 | 2 | 3 | 4 | 5 | 6 | 7 | 8 | 9 | 10 |
|---|---|---|---|---|---|---|---|---|---|---|
| RI | 0 | 0 | 0.58 | 0.9 | 1.12 | 1.24 | 1.32 | 1.41 | 1.45 | 1.49 |
| Layer | # Criteria | Weight |
|---|---|---|
| (C1-1-1) Proximity to current bike stations | #1 | 0.026 |
| (C1-1-2) Proximity to current bikeways | #2 | 0.084 |
| (C1-1-3) Proximity to present bike parking spots | #3 | 0.029 |
| (C1-2) Proximity to existing bike stations with high transactions | #4 | 0.098 |
| (C1-3) Proximity to zones with high user membership density | #5 | 0.095 |
| (C1-4) Proximity to top ten bike stations with high duration trips | #6 | 0.091 |
| (C2-1) Proximity to bike stations with unbalanced OD | #7 | 0.098 |
| (C3-1) Proximity to users’ residence | #8 | 0.070 |
| (C4-1) Proximity to points of interest (POI) | #9 | 0.038 |
| (C4-2) Proximity to zones with higher population density | #10 | 0.111 |
| (C4-3-1) Proximity to metro and train stations | #11 | 0.074 |
| (C4-3-2) Proximity to taxi hubs | #12 | 0.044 |
| (C4-4) Proximity to electric vehicle charging stations | #13 | 0.037 |
| (C4-5) Proximity to areas with low slope | #14 | 0.105 |
| Sum: | 1.000 |
| Name | Si+ | Si− | CI | Rank |
|---|---|---|---|---|
| A15 | 0.088882958 | 0.140040658 | 0.611735304 | 1 |
| A04 | 0.091233584 | 0.135940295 | 0.598397561 | 2 |
| A40 | 0.096605647 | 0.14394044 | 0.598390278 | 3 |
| A41 | 0.109656855 | 0.128021589 | 0.538633572 | 4 |
| A03 | 0.131059307 | 0.133650033 | 0.50489353 | 5 |
| A07 | 0.12560168 | 0.124561019 | 0.497920031 | 6 |
| A38 | 0.12669852 | 0.122971407 | 0.492535921 | 7 |
| A25 | 0.130357085 | 0.122987796 | 0.485456014 | 8 |
| A06 | 0.124052981 | 0.11478928 | 0.480607075 | 9 |
| A18 | 0.134845643 | 0.119024555 | 0.468840202 | 10 |
| A05 | 0.126527572 | 0.10821999 | 0.46100581 | 11 |
| A02 | 0.144632137 | 0.109240907 | 0.430297386 | 12 |
| A36 | 0.128454319 | 0.094168643 | 0.422996094 | 13 |
| A32 | 0.146582481 | 0.10209533 | 0.410552631 | 14 |
| A14 | 0.140414162 | 0.092141112 | 0.396211666 | 15 |
| A19 | 0.133052769 | 0.084490795 | 0.388385632 | 16 |
| A01 | 0.157939848 | 0.100213325 | 0.388193273 | 17 |
| A34 | 0.140539908 | 0.086731511 | 0.381620845 | 18 |
| A16 | 0.139251163 | 0.081144315 | 0.368175951 | 19 |
| A37 | 0.143721413 | 0.083153979 | 0.366518284 | 20 |
| A13 | 0.151684641 | 0.086628276 | 0.363506422 | 21 |
| A33 | 0.149902944 | 0.084849844 | 0.361443391 | 22 |
| A17 | 0.138844637 | 0.07729919 | 0.357628487 | 23 |
| A27 | 0.147309495 | 0.080128726 | 0.35230985 | 24 |
| A39 | 0.151795452 | 0.082127917 | 0.35108898 | 25 |
| A12 | 0.152617435 | 0.081748797 | 0.348807916 | 26 |
| A11 | 0.153948217 | 0.07998719 | 0.341919981 | 27 |
| A42 | 0.146373457 | 0.072104987 | 0.330032499 | 28 |
| A21 | 0.151286565 | 0.066995825 | 0.30692272 | 29 |
| A23 | 0.153283053 | 0.057215906 | 0.271810874 | 30 |
| A20 | 0.152817038 | 0.056022965 | 0.268257824 | 31 |
| A26 | 0.169204518 | 0.059491254 | 0.260132724 | 32 |
| A24 | 0.159746155 | 0.055040461 | 0.256256474 | 33 |
| A29 | 0.15048036 | 0.051577062 | 0.255259428 | 34 |
| A28 | 0.163754441 | 0.055762386 | 0.254023289 | 35 |
| A35 | 0.152205992 | 0.051237498 | 0.251851254 | 36 |
| A22 | 0.165782542 | 0.053489415 | 0.243940976 | 37 |
| A10 | 0.164065828 | 0.052597037 | 0.242759815 | 38 |
| A31 | 0.154227641 | 0.047843031 | 0.236763853 | 39 |
| A43 | 0.159672107 | 0.049148287 | 0.23536153 | 40 |
| A30 | 0.163431281 | 0.046659063 | 0.222090469 | 41 |
| A09 | 0.168982944 | 0.042669948 | 0.201603427 | 42 |
| A44 | 0.165982278 | 0.039410741 | 0.191879651 | 43 |
| A45 | 0.171071673 | 0.037698146 | 0.180572776 | 44 |
| A08 | 0.178627648 | 0.025676569 | 0.125678116 | 45 |
Publisher’s Note: MDPI stays neutral with regard to jurisdictional claims in published maps and institutional affiliations. |
© 2022 by the authors. Licensee MDPI, Basel, Switzerland. This article is an open access article distributed under the terms and conditions of the Creative Commons Attribution (CC BY) license (https://creativecommons.org/licenses/by/4.0/).
Share and Cite
Bahadori, M.S.; Gonçalves, A.B.; Moura, F. A GIS-MCDM Method for Ranking Potential Station Locations in the Expansion of Bike-Sharing Systems. Axioms 2022, 11, 263. https://doi.org/10.3390/axioms11060263
Bahadori MS, Gonçalves AB, Moura F. A GIS-MCDM Method for Ranking Potential Station Locations in the Expansion of Bike-Sharing Systems. Axioms. 2022; 11(6):263. https://doi.org/10.3390/axioms11060263
Chicago/Turabian StyleBahadori, Mohammad Sadegh, Alexandre B. Gonçalves, and Filipe Moura. 2022. "A GIS-MCDM Method for Ranking Potential Station Locations in the Expansion of Bike-Sharing Systems" Axioms 11, no. 6: 263. https://doi.org/10.3390/axioms11060263
APA StyleBahadori, M. S., Gonçalves, A. B., & Moura, F. (2022). A GIS-MCDM Method for Ranking Potential Station Locations in the Expansion of Bike-Sharing Systems. Axioms, 11(6), 263. https://doi.org/10.3390/axioms11060263