
Identifying Stock Prices Using an Advanced Hybrid ARIMA-Based Model: A Case of Games Catalogs


 ,
,
Abstract
:1. Introduction
1.1. Background and Motivation of the Research Problem
1.2. Research Priorities and Objectives
- (1)
- Construct the advanced hybrid ARIMA-based models to compare the stock prices predicted in the long, medium, and short term with the actual stock prices, and determine the optimal model. At the same time, use the optimal model to predict the next n days, and use the predicted stock price of n days to form the judgment of an upward or downward trend, so as to provide a warning effect in advance.
- (2)
- Use the optimal model to form a trend judgment and basis for buying, not taking action, or not selling, and use a two-month period as experimental data to compare the rate of return of transactions.
- (3)
- Use the monitoring indicator inquiry system of UNCTAD for the scores of 10 years as the historical data to implement and compare the investment strategies.
2. Literature Review
2.1. The Stock Market and Its Applications
2.2. Games Catalog Stock and Its Applications
3. Methodological Preliminaries
3.1. ARIMA Algorithm
- (1)
- Basic composition of the algorithm
- (2)
- Model construction
3.2. ARIMA-Related Application Fields
3.3. Monitoring Indicators and Related Applications
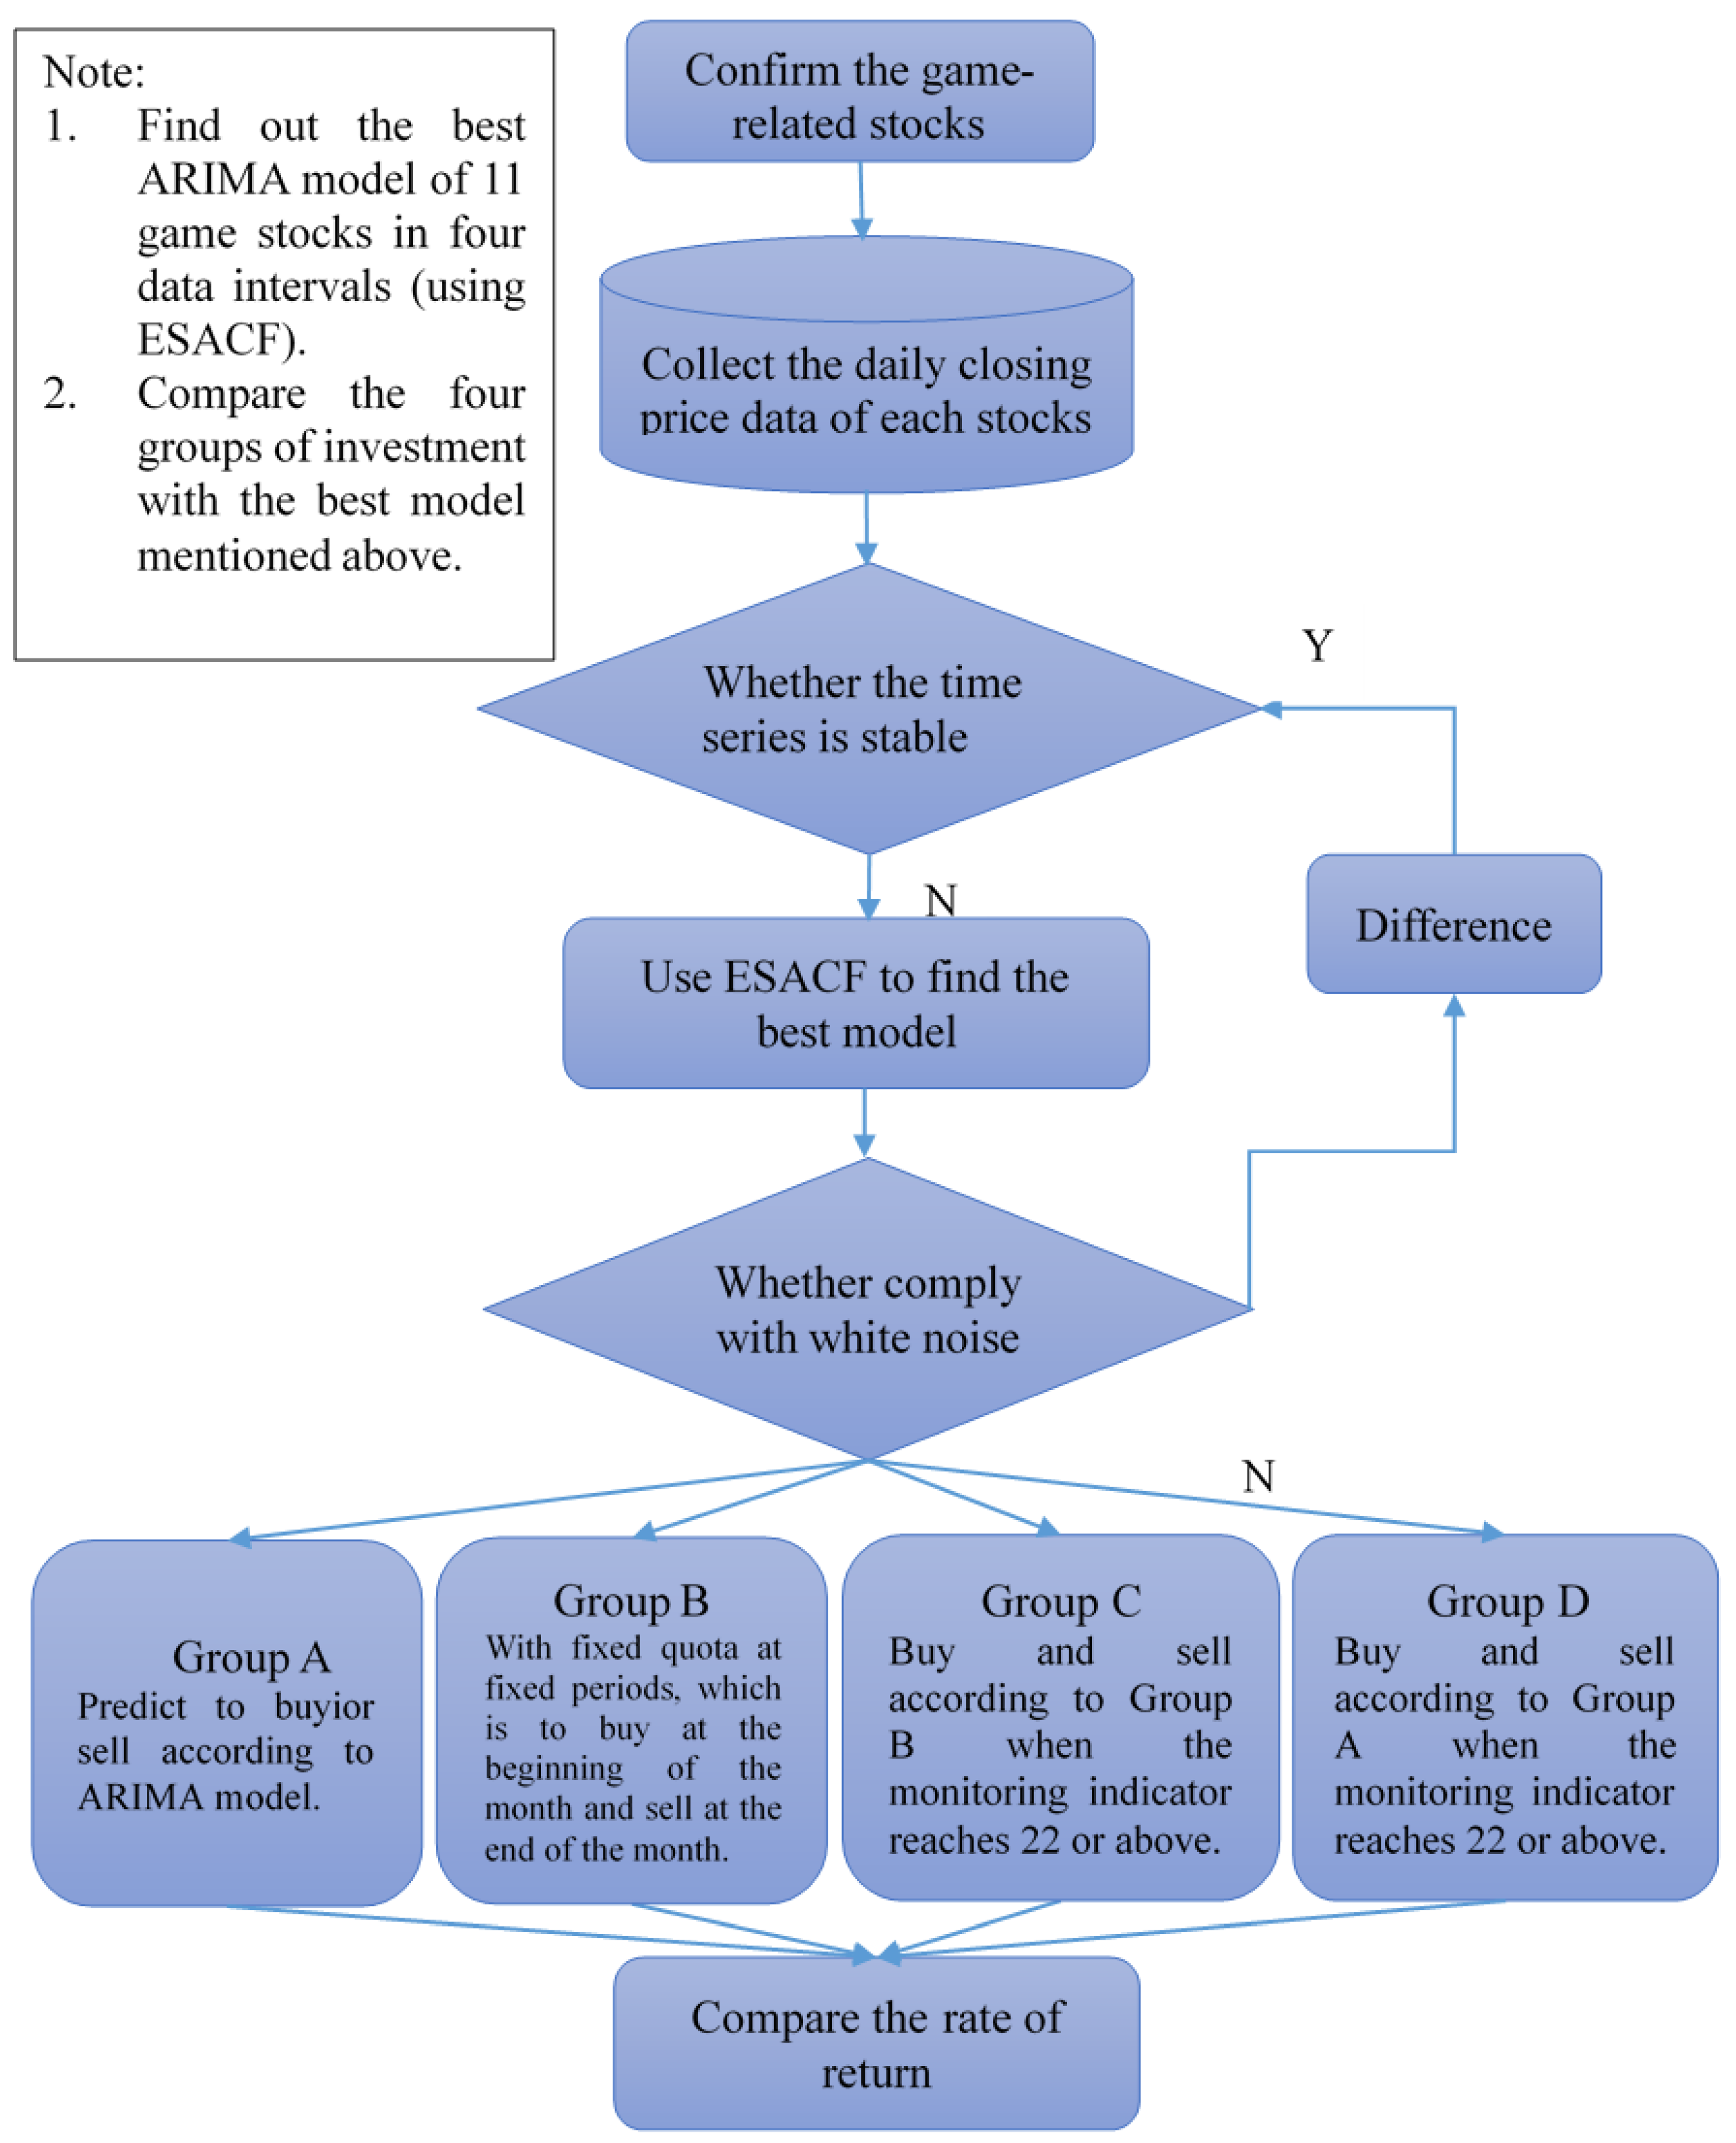
4. The Proposed Advanced Hybrid ARIMA-Based Model
4.1. Research Structure and Algorithmic Flow of the Proposed Model
4.2. Investment Strategy Design Simulation and Example Illustration
- (1)
- Firstly, taking the stock of 6111 Softstar as an example, the optimal ARIMA prediction model (ARIMA (1,1,0)) was used to predict the number of days, and the predicted values fell within the 95% confidence interval for three days. Therefore, the prediction for the next three days was made every day as the basis for judging the trends of rise and fall.
- (2)
- In group A, a simulation was conducted to buy and hold at the closing price of 1 July 2020. Since the predicted value of ARIMA showed a rising stock price from 2 July 2020 to 7 July 2020, it continued to hold until selling at the closing price when the predicted value fell on 8 July 2020.
- (3)
- Group B bought on 1 July 2020 and sold on 31 July 2020.
- (4)
- Groups C and D referred to the historical 10-year economic monitoring indicators (from July 2010 to June 2020), and used ARIMA to predict the indicator scores of July and August 2020. Using the optimal ARIMA (0,1,0) model, BIC = 1.829 and p = 0.809, we found that the score for July 2020 was 18, while that for August 2020 was 22, and 95% of the predicted values fell within the actual data range, as shown in Table 2. Therefore, group C had no trade in July 2020, buying and holding at the beginning of August 2020 and then selling at the end of the month.
- (5)
- Group D had no trade in July 2020, and traded in August 2020 following the strategy of group A.
- (6)
- Finally, we calculate the actual effects of the whole simulated investment strategy.

| Year–Month | Score of Monitoring Indicator | Forecasting Value | 95% Confidence Level |
|---|---|---|---|
| 2020–06 | 19 | 19 | True |
| 2020–07 | 21 | 18 | True |
| 2020–08 | 26 | 22 | True |
5. Empirical Results and Performance Evaluation
5.1. Empirical Results: Establishment of Optimal Model and Accurate Days
5.2. Performance Evaluation of the ROR of the Models
6. Conclusions
6.1. Research Findings
6.2. Research Contributions
6.3. Research Limitations
6.4. Future Research Directions
Author Contributions
Funding
Institutional Review Board Statement
Informed Consent Statement
Data Availability Statement
Conflicts of Interest
Appendix A. The Entire Simulated Trading Process of 6111 Stock
| A | B | C | D | A | B | C | D | |||
|---|---|---|---|---|---|---|---|---|---|---|
| Date | A.V. | F.V. | Buy/Sell | Buy/Sell | Buy/Sell | Buy/Sell | RoR | RoR | RoR | RoR |
| 1 July 2020 | 80.8 | 81.55 | Buy | Buy | ||||||
| 82.33 | ||||||||||
| 82.86 | ||||||||||
| 8 July 2020 | 84.5 | 82.84 | Sell | 4.58% | ||||||
| 82.21 | ||||||||||
| 81.73 | ||||||||||
| 9 July 2020 | 82.9 | 84.98 | Buy | |||||||
| 85.25 | ||||||||||
| 85.37 | ||||||||||
| 10 July 2020 | 80.1 | 81.78 | Sell | −3.38% | ||||||
| 80.97 | ||||||||||
| 80.38 | ||||||||||
| 14 July 2020 | 82.8 | 84.97 | Buy | |||||||
| 85.38 | ||||||||||
| 85.62 | ||||||||||
| 15 July 2020 | 81.3 | 81.76 | Sell | −1.81% | ||||||
| 81.03 | ||||||||||
| 80.49 | ||||||||||
| 17 July 2020 | 82.1 | 81.74 | Buy | |||||||
| 81.78 | ||||||||||
| 81.75 | ||||||||||
| 21 July 2020 | 80.2 | 78.36 | Sell | −2.31% | ||||||
| 77.26 | ||||||||||
| 76.45 | ||||||||||
| 30 July 2020 | 80.2 | 80.78 | Buy | |||||||
| 81.76 | ||||||||||
| 82.36 | ||||||||||
| 31 July 2020 | 79.3 | 80.80 | Sell | Sell | −1.12% | −1.86% | ||||
| 81.15 | ||||||||||
| 81.33 | ||||||||||
| 3 August 2020 | 78.2 | 78.92 | Buy | Buy | ||||||
| 78.70 | ||||||||||
| 78.55 | ||||||||||
| 5 August 2020 | 80.9 | 80.51 | Buy | Buy | ||||||
| 80.60 | ||||||||||
| 80.55 | ||||||||||
| 6 August 2020 | 80.2 | 81.12 | Sell | Sell | −0.87% | −0.87% | ||||
| 81.12 | ||||||||||
| 81.04 | ||||||||||
| 24 August 2020 | 72.5 | 71.97 | Buy | Buy | ||||||
| 72.35 | ||||||||||
| 72.37 | ||||||||||
| 25 August 2020 | 74.8 | 73.06 | Sell | Sell | 3.17% | 3.17% | ||||
| 73.13 | ||||||||||
| 73.05 | ||||||||||
| 26 August 2020 | 75.8 | 75.44 | Buy | Buy | ||||||
| 75.55 | ||||||||||
| 75.50 | ||||||||||
| 27 August 2020 | 74.9 | 76.03 | Sell | Sell | −1.19% | −1.19% | ||||
| 76.01 | ||||||||||
| 75.92 | ||||||||||
| 31 August 2020 | 74.7 | 75.47 | Sell | Sell | −4.48% | −4.48% | ||||
| 75.40 | ||||||||||
| 75.28 | ||||||||||
| Sum | −2.93% | −6.34% | −4.48% | 1.11% | ||||||
References
- WHO Coronavirus Disease (COVID-19) Dashboard. Available online: https://covid19.who.int/ (accessed on 15 June 2022).
- TechNews. Available online: https://technews.tw/2020/04/24/the-global-game-industry-is-ushering-in-a-big-change/ (accessed on 24 April 2020).
- Commercial Times. Available online: https://ctee.com.tw/news/tech/413127.html (accessed on 3 February 2021).
- Mirror Media (a). Available online: https://www.mirrormedia.mg/story/20200611fin013/ (accessed on 18 June 2020).
- Mirror Media (b). Available online: https://www.mirrormedia.mg/story/20200611fin011/ (accessed on 18 June 2020).
- Beran, J. Mathematical Foundations of Time Series Analysis; Springer International Publishing: Cham, Germany, 2017. [Google Scholar] [CrossRef]
- Štulajter, F. Predictions in Time Series Using Regression Models; Springer New York: New York, NY, USA, 2002. [Google Scholar] [CrossRef]
- Mills, T.C. Applied Time Series Analysis: A Practical Guide to Modeling and Forecasting; Academic Press: London, UK, 2019. [Google Scholar]
- Box, G.E.P.; Jenkins, G.M. Time Series Analysis: Forecasting and Control; Holden-Day: San Francisco, CA, USA, 1970. [Google Scholar]
- Rubio, L.; Alba, K. Forecasting Selected Colombian Shares Using a Hybrid ARIMA-SVR Model. Mathematics 2022, 10, 2181. [Google Scholar] [CrossRef]
- Samee, N.A.; Atteia, G.; Alkanhel, R.; Alhussan, A.A.; AlEisa, H.N. Hybrid Feature Reduction Using PCC-Stacked Autoencoders for Gold/Oil Prices Forecasting under COVID-19 Pandemic. Electronics 2022, 11, 991. [Google Scholar] [CrossRef]
- Wu, J.; Chen, Y.; Zhou, T.; Li, T. An Adaptive Hybrid Learning Paradigm Integrating CEEMD, ARIMA and SBL for Crude Oil Price Forecasting. Energies 2019, 12, 1239. [Google Scholar] [CrossRef]
- Hajirahimi, Z.; Khashei, M. A Novel Parallel Hybrid Model Based on Series Hybrid Models of ARIMA and ANN Models. Neural Process Lett. 2022, 54, 2319–2337. [Google Scholar] [CrossRef]
- Kumar, R.; Kumar, P.; Kumar, Y. Multi-Step Time Series Analysis and Forecasting Strategy Using ARIMA and Evolutionary Algorithms. Int. J. Inf. Tecnol. 2022, 14, 359–373. [Google Scholar] [CrossRef]
- Wu, D.; Wang, X.; Su, J.; Tang, B.; Wu, S. A Labeling Method for Financial Time Series Prediction Based on Trends. Entropy 2020, 22, 1162. [Google Scholar] [CrossRef]
- Islam, S.; Sikder, M.S.; Hossain, M.F.; Chakraborty, P. Predicting the Daily Closing Price of Selected Shares on the Dhaka Stock Exchange Using Machine Learning Techniques. SN Bus. Econ. 2021, 1, 58. [Google Scholar] [CrossRef]
- Shen, J.; Shafiq, M.O. Short-Term Stock Market Price Trend Prediction Using a Comprehensive Deep Learning System. J. Big Data 2020, 7, 66. [Google Scholar] [CrossRef]
- Altarawneh, G.A.; Hassanat, A.B.; Tarawneh, A.S.; Abadleh, A.; Alrashidi, M.; Alghamdi, M. Stock Price Forecasting for Jordan Insurance Companies Amid the COVID-19 Pandemic Utilizing Off-the-Shelf Technical Analysis Methods. Economies 2022, 10, 43. [Google Scholar] [CrossRef]
- Ghoddusi, H.; Creamer, G.G.; Rafizadeh, N. Machine learning in energy economics and finance: A review. Energy Econ. 2019, 81, 709–727. [Google Scholar] [CrossRef]
- Shobande, O.A.; Akinbomi, M.D. Competition dynamics in Nigerian aviation industry: A game theoretic approach. Future Bus. J. 2020, 6, 11. [Google Scholar] [CrossRef]
- Shobande, O.A.; Shodipe, O.T. Re-Evaluation of World Population Figures: Politics and Forecasting Mechanics. Econ. Bus. 2020, 34, 104–125. [Google Scholar] [CrossRef]
- Eapen, J.; Bein, D.; Verma, A. Novel deep learning model with CNN and bi-directional LSTM for improved stock market index prediction. In Proceedings of the 2019 IEEE 9th Annual Computing and Communication Workshop and Conference (CCWC), Las Vegas, NV, USA, 7–9 January 2019; pp. 264–270. [Google Scholar]
- Shah, D.; Isah, H.; Zulkernine, F. Stock Market Analysis: A Review and Taxonomy of Prediction Techniques. Int. J. Financ. Stud. 2019, 7, 26. [Google Scholar] [CrossRef]
- Rao, P.S.; Srinivas, K.; Mohan, A.K. A Survey on Stock Market Prediction Using Machine Learning Techniques. In Machine Learning and Applications, Lecture Notes in Electrical Engineering 2020; Kumar, A., Paprzycki, M., Gunjan, V., Eds.; Springer: Singapore; Volume 601, pp. 923–931. [CrossRef]
- Pang, X.; Zhou, Y.; Wang, P.; Lin, W.; Chang, V. An innovative neural network approach for stock market prediction. J. Supercomput. 2020, 76, 2098–2118. [Google Scholar] [CrossRef]
- Polamuri, S.R.; Srinivas, D.K.; Krishna Mohan, D.A. Multi-Model Generative Adversarial Network Hybrid Prediction Algorithm (MMGAN-HPA) for stock market prices prediction. J. King Saud Univ.-Comput. Inf. Sci. 2021, in press. [Google Scholar] [CrossRef]
- Noonan, K.; The Motley Fool. Best Video Game Stocks to Buy in 2022. Available online: https://www.fool.com/investing/stock-market/market-sectors/communication/video-game-stocks/ (accessed on 13 September 2022).
- Euromonitor. Video Games in Taiwan. Available online: https://www.euromonitor.com/video-games-in-taiwan/report (accessed on 13 September 2022).
- Statista. Video Games-Taiwan|Statista Market Forecast. Available online: https://www.statista.com/outlook/dmo/digital-media/video-games/taiwan (accessed on 13 September 2022).
- Clement, E.P. Using Normalized Bayesian Information Criterion (Bic) to Improve Box-Jenkins Model Building. Am. J. Math. Stat. 2014, 4, 214–221. [Google Scholar] [CrossRef]
- Christodoulos, C.; Michalakelis, C.; Varoutas, D. Forecasting with limited data: Combining ARIMA and diffusion models. Technol. Forecast. Soc. Change 2010, 77, 558–565. [Google Scholar] [CrossRef]
- Cao, R. Stock investment planning and analysis-take listed bank stocks as an example. Hsuan Chuang J. Manag. 2004, 1, 1–16. [Google Scholar]
- Chen, C. A Study for the Forecasting of the Closing Price for TAIEX Once Every Two Months. Master’s Thesis, National Cheng Kung University, Tainan, Taiwan, 2006. [Google Scholar]
- Almasarweh, M.; Wadi, S.A. ARIMA Model in Predicting Banking Stock Market Data. Mod. Appl. Sci. 2018, 12, 309. [Google Scholar] [CrossRef]
- Tsai, P. Relationship Between Monitoring Indicator Score and Stock Price Index. Master’s Thesis, National Chung Cheng University, Chiayi, Taiwan, 2014. [Google Scholar]
- Chu, M.; Huang, C.; Tsai, M. The Study of Taking the Strategies of Dollar Cost Averaging and Value Averaging on Investing in the Leading Stocks Taiwan. Manag. Inf. Comput. 2014, 3, 458–466. [Google Scholar]
- Huang, M.; Ma, K.; Chang, W. An Application Method and Empirical Performance Study on Individual Stock with Using Averaging Strategies-Evidences from Taiwanese Stock Markets. Int. J. Commer. Strategy 2019, 11, 307–334. [Google Scholar]
- Lin, Y. Influence of Monitoring Indicator to the Price of Financial and Insurance Stocks. Master’s Thesis, National Kaohsiung University of Applied Sciences, Kaohsiung City, Taiwan, 2016. [Google Scholar]
- Lewis, C.D. Industrial and Business Forecasting Methods: A Practical Guide to Exponential Smoothing and Curve Fitting; Butterworth Scientific: London, UK, 1982. [Google Scholar]


| Investment Strategy | Condition | |
|---|---|---|
| Buy | Sell | |
| Group A: ARIMA strategy | Judge the trend by ARIMA: Rise -> buy | Rise -> hold |
| Stable -> not buy | Stable -> hold | |
| Fall -> not buy | Fall -> sell | |
| Group B: strategy with fixed quotas at fixed periods | Buy at the beginning of the month | Sell at the end of the month |
| Group C: strategy of monitoring indicators + fixed quotas at fixed periods | Buy at the beginning of the month when the indicator prediction reaches 22 or above | Sell at the end of the month |
| Group D: strategy of monitoring indicators + ARIMA | Judge the trend by ARIMA when the indicator prediction reaches 22 or above: Rise -> buy Stable -> not buy Fall -> not buy | Rise -> hold Stable -> hold Fall -> sell |
| Date | Actual Value | 7-Year ARIMA(0,1,3) | 3-Year ARIMA(0,1,1) | 1-Year ARIMA(1,1,0) | 0.5-Year ARIMA(0,1,0) | ||||
|---|---|---|---|---|---|---|---|---|---|
| F.V. | 95% | F.V. | 95% | F.V. | 95% | F.V. | 95% | ||
| 1 July 2020 | 93.0 | 90.65 | True | 90.56 | True | 90.48 | True | 90.70 | True |
| 2 July 2020 | 96.8 | 90.67 | True | 90.60 | True | 90.42 | True | 90.70 | True |
| 3 July 2020 | 95.1 | 90.66 | True | 90.64 | True | 90.41 | True | 90.70 | True |
| Date | Actual Value | 7-Year ARIMA(1,1,0) | 3-Year ARIMA(0,1,3) | 1-Year ARIMA(1,1,1) | 0.5-Year ARIMA(0,1,0) | ||||
|---|---|---|---|---|---|---|---|---|---|
| F.V. | 95% | F.V. | 95% | F.V. | 95% | F.V. | 95% | ||
| 1 July 2020 | 18.30 | 18.70 | True | 18.52 | True | 18.61 | True | 18.42 | True |
| 2 July 2020 | 18.15 | 18.63 | True | 18.49 | True | 18.58 | True | 18.21 | True |
| 3 July 2020 | 18.70 | 18.71 | True | 18.52 | True | 18.56 | True | 17.99 | True |
| Date | Actual Value | 7-Year ARIMA(0,1,0) | 3-Year ARIMA(0,1,0) | 1-Year ARIMA(0,1,0) | 0.5-Year ARIMA(0,1,0) | ||||
|---|---|---|---|---|---|---|---|---|---|
| F.V. | 95% | F.V. | 95% | F.V. | 95% | F.V. | 95% | ||
| 1 July 2020 | 750 | 733.3 | True | 733.2 | True | 736.2 | True | 733.0 | True |
| 2 July 2020 | 817 | 733.6 | True | 733.3 | True | 739.4 | True | 733.0 | True |
| 3 July 2020 | 805 | 733.9 | True | 733.5 | True | 742.6 | True | 733.0 | True |
| Code | 7 Years | 3 Years | 1 Year | 0.5 Years | ||||||||
|---|---|---|---|---|---|---|---|---|---|---|---|---|
| (p,d,q) | BIC | W.N. | (p,d,q) | BIC | W.N. | (p,d,q) | BIC | W.N. | (p,d,q) | BIC | W.N. | |
| MAE | MSE | MAPE | MAE | MSE | MAPE | MAE | MSE | MAPE | MAE | MSE | MAPE | |
| 3083 | (0,1,3) | 0.728 | 0.566 | (0,1,1) | 0.863 | 0.286 | (1,1,0) | 1.499 | 0.619 | (0,1,0) * | 1.880 | 0.256 |
| 4.307 | 20.938 | 4.509 | 4.367 | 21.428 | 4.573 | 4.530 | 23.017 | 4.744 | 4.267 | 20.620 | 4.467 | |
| 3086 | (1,1,0) | 1.295 | 0.117 | (0,1,3) * | 0.874 | 0.051 | (1,1,1) | 1.012 | 0.061 | (0,1,0) | 0.183 | 0.789 |
| 0.297 | 0.130 | 1.628 | 0.247 | 0.065 | 1.346 | 0.293 | 0.100 | 1.604 | 0.297 | 0.174 | 1.594 | |
| 3293 | (0,1,0) | 4.105 | 0.113 | (0,1,0) | 4.140 | 0.171 | (0,1,0) * | 5.383 | 0.253 | (0,1,0) | 6.043 | 0.903 |
| 57.067 | 4096.550 | 7.089 | 57.367 | 4136.340 | 7.127 | 51.250 | 3366.470 | 6.361 | 57.667 | 4,176.330 | 7.164 | |
| 3546 | (0,1,3) | 1.417 | 0.216 | (1,1,1) | 1.462 | 0.186 | (0,1,3) | 1.771 | 0.366 | (3,1,3) * | 2.752 | 0.302 |
| 1.903 | 5.295 | 1.985 | 2.027 | 5.651 | 2.115 | 1.720 | 4.299 | 1.794 | 1.557 | 3.266 | 1.626 | |
| 3687 | (0,1,2) | 0.615 | 0.486 | (1,1,1) * | 0.095 | 0.172 | (0,1,1) | 0.815 | 0.368 | (0,1,0) | 1.356 | 0.538 |
| 0.697 | 1.272 | 0.011 | 0.650 | 1.155 | 0.010 | 0.683 | 1.027 | 0.011 | 0.713 | 0.960 | 0.011 | |
| 4946 | (0,1,6) | 0.535 | 0.675 | (0,1,3) | 0.503 | 0.326 | (0,1,2) * | 0.782 | 0.348 | (1,1,1) | −0.980 | 0.270 |
| 0.147 | 0.022 | 0.011 | 0.060 | 0.011 | 0.004 | 0.043 | 0.006 | 0.003 | 0.057 | 0.010 | 0.004 | |
| 4994 | (0,1,2) | 1.673 | 0.715 | (0,1,0) | 0.733 | 0.477 | (0,1,0) | 1.539 | 0.477 | (2,1,0) * | 1.256 | 0.276 |
| 2.440 | 6.590 | 0.035 | 2.317 | 5.853 | 0.033 | 2.317 | 5.853 | 0.033 | 2.032 | 4.400 | 0.029 | |
| 5478 | (0,1,0) | 0.994 | 0.163 | (0,1,0) | 0.716 | 0.990 | (0,1,0) * | 0.828 | 0.904 | (0,1,0) | 1.665 | 0.497 |
| 1.300 | 4.029 | 1.091 | 1.313 | 4.081 | 1.102 | 1.187 | 2.929 | 0.998 | 1.287 | 3.975 | 1.080 | |
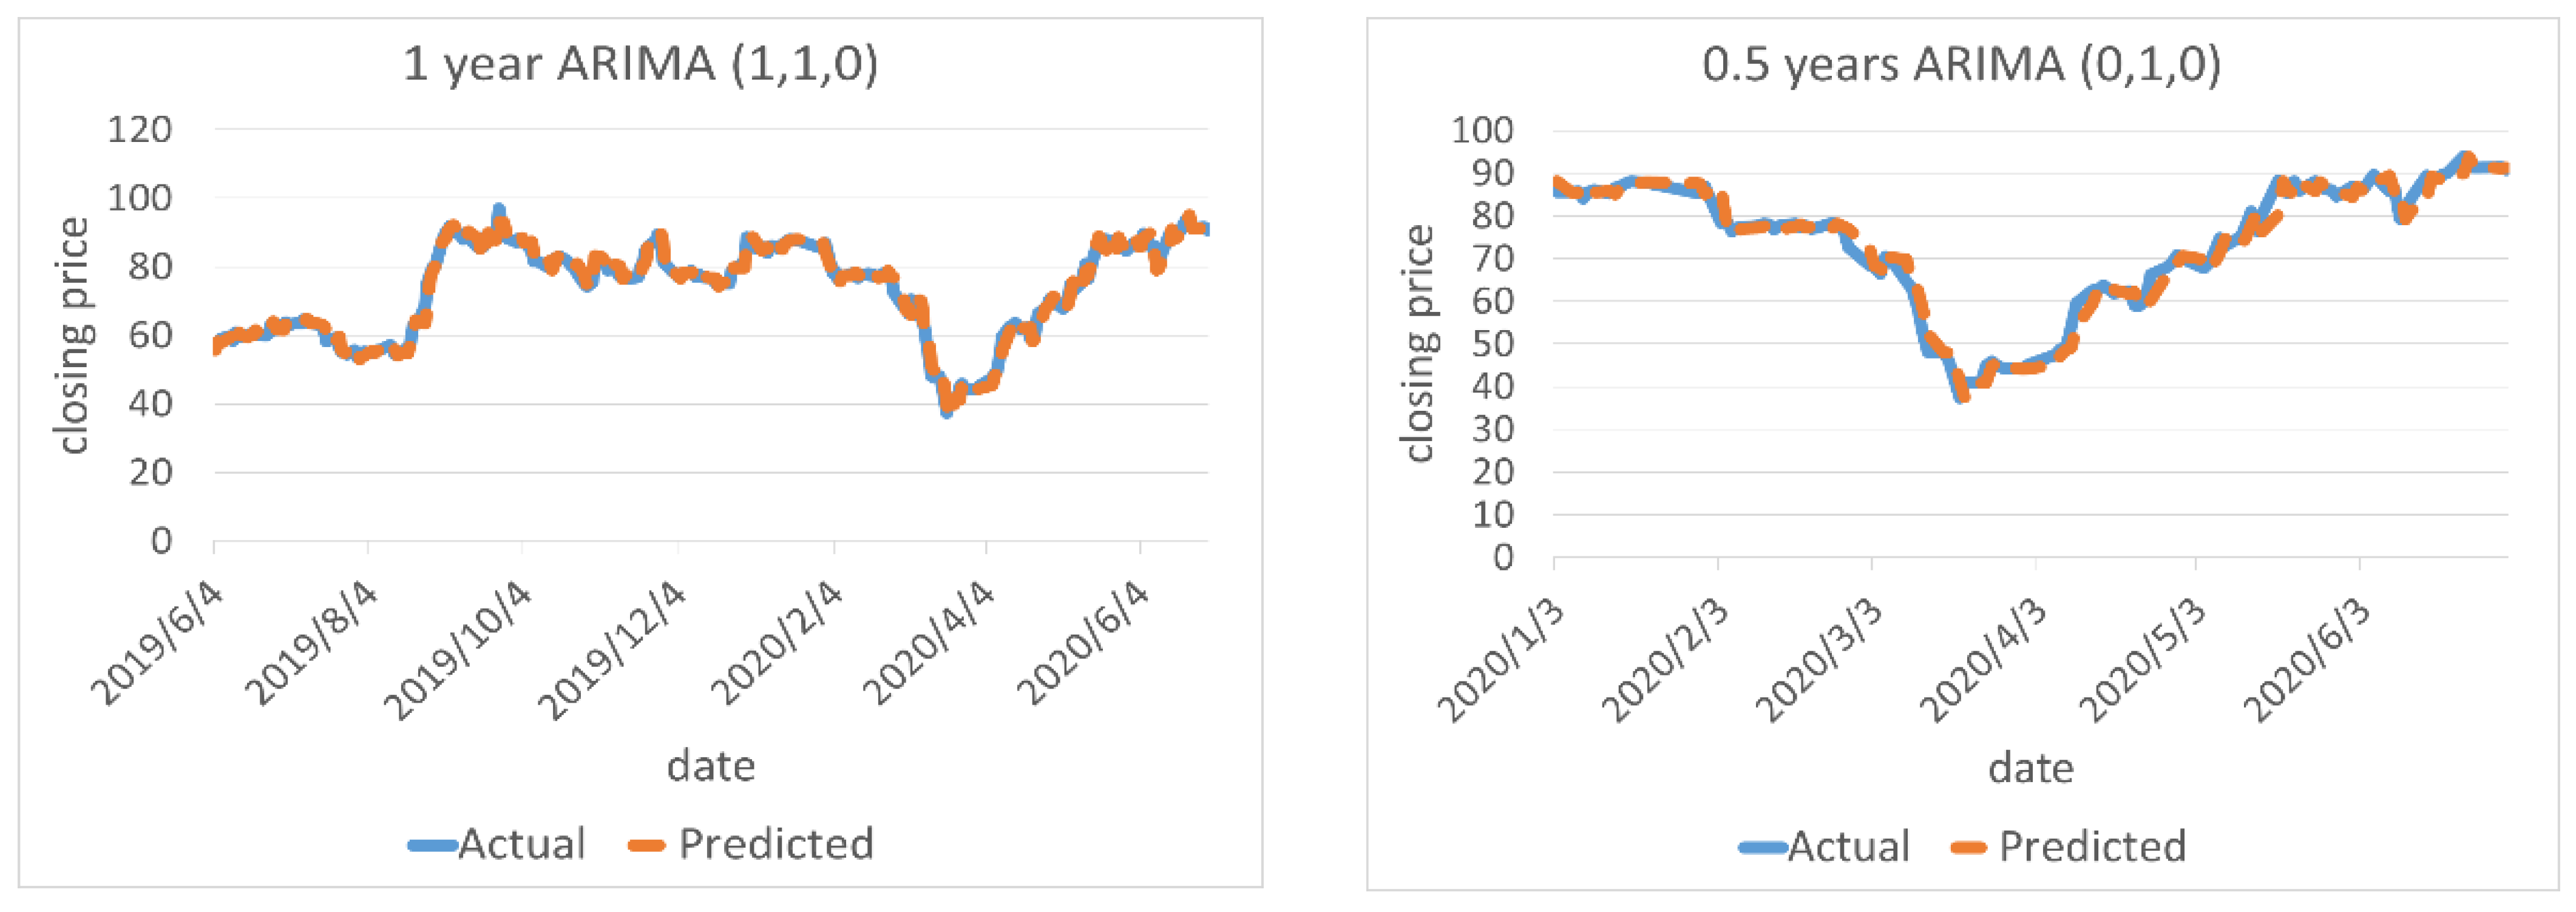
| 6111 | (0,1,2) | 2.581 | 0.061 | (2,1,0) | 2.800 | 0.478 | (2,1,9) | 1.964 | 0.873 | (1,1,0) * | 1.213 | 0.371 |
| 2.810 | 11.476 | 3.308 | 2.673 | 10.530 | 3.146 | 3.117 | 12.137 | 3.685 | 1.853 | 4.080 | 2.195 | |
| 6169 | (0,1,1) * | 0.179 | 0.866 | (0,1,0) | 0.564 | 0.217 | (1,1,0) | 0.839 | 0.369 | (0,1,0) | 1.489 | 0.308 |
| 0.990 | 1.491 | 1.617 | 1.100 | 1.502 | 1.785 | 1.123 | 1.697 | 1.843 | 1.187 | 1.649 | 1.943 | |
| 6180 | (0,1,3) | 0.617 | 0.625 | (1,1,3) * | 1.190 | 0.060 | (2,1,1) | 0.032 | 0.694 | (0,1,2) | 0.791 | 0.212 |
| 1.410 | 2.544 | 0.019 | 0.980 | 1.352 | 0.013 | 1.233 | 2.147 | 0.016 | 1.423 | 2.329 | 0.019 | |
| Group A | Group B | Group C | Group D | |
|---|---|---|---|---|
| Number of samples | 10 | 10 | 10 | 10 |
| Average rate of return | −8.92% | −21.96% | −6.97% | −4.77% |
| Standard deviation | 5.70% | 7.93% | 5.31% | 17.58% |
| Median | −5.48% | −18.83% | −3.95% | 0.00% |
| Maximum value | 20.44% | 17.33% | 18.80% | 21.52% |
| Minimum value | −44.89% | −74.61% | −45.53% | −43.72% |
| Code | Data Range | Best-Fitting Model | A-RoR | B-RoR | C-RoR | D-RoR |
|---|---|---|---|---|---|---|
| 3083 | 0.5 years | ARIMA(0,1,0) | −7.79% | −50.59% | −19.30% | 0.00% |
| 3293 | 1 year | ARIMA(0,1,0) | 20.44% | 17.33% | 18.80% | 21.52% |
| 3546 | 0.5 years | ARIMA(3,1,3) | 7.13% | −20.37% | −4.33% | 7.64% |
| 3687 | 3 years | ARIMA(1,1,1) | −20.69% | −19.60% | −3.57% | −19.25% |
| 4946 | 1 year | ARIMA(0,1,2) | −3.82% | −18.05% | 0.00% | 3.31% |
| 4994 | 0.5 years | ARIMA(2,1,0) | −5.44% | −10.86% | 2.07% | 0.00% |
| 5478 | 1 year | ARIMA(0,1,0) | −25.73% | −25.73% | −12.80% | −12.80% |
| 6111 | 0.5 years | ARIMA(1,1,0) | −2.93% | −6.33% | −4.48% | 1.11% |
| 6169 | 7 years | ARIMA(0,1,1) | −44.89% | −74.61% | −45.53% | −43.72% |
| 6180 | 3 years | ARIMA(1,1,3) | −5.52% | −10.83% | −0.59% | −5.57% |
| Sum | −89.24% | −219.64% | −69.73% | −47.76% |
| Groups | Degree of Freedom | t-Value | p-Value |
|---|---|---|---|
| A:B | 9 | 2.730 | 0.023 * |
| A:C | 9 | −0.660 | 0.526 |
| A:D | 9 | −3.137 | 0.012 * |
| B:C | 9 | −4.843 | 0.001 ** |
| B:D | 9 | −3.488 | 0.007 ** |
| C:D | 9 | −0.739 | 0.479 |
Publisher’s Note: MDPI stays neutral with regard to jurisdictional claims in published maps and institutional affiliations. |
© 2022 by the authors. Licensee MDPI, Basel, Switzerland. This article is an open access article distributed under the terms and conditions of the Creative Commons Attribution (CC BY) license (https://creativecommons.org/licenses/by/4.0/).
Share and Cite
Chen, Y.-S.; Chou, C.-L.; Lee, Y.-J.; Chen, S.-F.; Hsiao, W.-J. Identifying Stock Prices Using an Advanced Hybrid ARIMA-Based Model: A Case of Games Catalogs. Axioms 2022, 11, 499. https://doi.org/10.3390/axioms11100499
Chen Y-S, Chou C-L, Lee Y-J, Chen S-F, Hsiao W-J. Identifying Stock Prices Using an Advanced Hybrid ARIMA-Based Model: A Case of Games Catalogs. Axioms. 2022; 11(10):499. https://doi.org/10.3390/axioms11100499
Chicago/Turabian StyleChen, You-Shyang, Chih-Lung (Jerome) Chou, Yau-Jung (Mike) Lee, Su-Fen Chen, and Wen-Ju Hsiao. 2022. "Identifying Stock Prices Using an Advanced Hybrid ARIMA-Based Model: A Case of Games Catalogs" Axioms 11, no. 10: 499. https://doi.org/10.3390/axioms11100499
APA StyleChen, Y.-S., Chou, C.-L., Lee, Y.-J., Chen, S.-F., & Hsiao, W.-J. (2022). Identifying Stock Prices Using an Advanced Hybrid ARIMA-Based Model: A Case of Games Catalogs. Axioms, 11(10), 499. https://doi.org/10.3390/axioms11100499