1. Introduction
The total amount of shale gas resources in the world is about 456 × 1012 m3, while the technically recoverable shale gas resources are estimated at 182.8 × 10¹² m3. Among them, China’s shale gas resources are about 36.08 × 10¹² m3, ranking first in the world, and its recoverable resources are 21.8 × 10¹² m3, including 13.0 × 10¹² m3 of marine facies, 5.1 × 10¹² m3 of transitional (marine–terrestrial) facies, and 3.7 × 10¹² m3 of continental facies. However, the country’s cumulative proven geological reserves of shale gas are about 1 trillion cubic meters, and the proven rate is less than 5%.
In recent years, the successful development of unconventional shale gas has greatly satisfied the global energy demand for natural gas and enriched the global energy supply structure [
1,
2]. Compared with conventional clastic and carbonate reservoirs, shale gas reservoirs are characterized by low porosity (<10%) and low permeability (<1 mD) [
3,
4,
5,
6]. Porosity and gas saturation determine the amount of free gas and directly affect the geological reserves of shale gas fields. Permeability affects the flow mode of shale gas, which is a critical parameter for determining the gas production rate from shale gas wells. The mineralogical composition of shale reservoirs is highly complex, and both the abundance and types of minerals vary significantly among shale gas reservoirs from different sedimentary basins. Based on the types and contents of constituent minerals, shale reservoirs are divided into calcareous shale reservoirs rich in calcite, siliceous shale reservoirs rich in quartz, and clayey shale reservoirs rich in clay minerals. Studies on shale gas in North America show that: the abundance and maturity of organic matter are primary controls on the porosity of shale reservoirs [
7,
8]. Clay minerals can plug the pore throat and reduce the permeability of shale reservoirs [
9,
10], and the arrangement and relative proportions of pores directly affect the permeability of shale reservoirs. Shale permeability is influenced by pore density, pore geometry, and pore stiffness [
11]. The results of early Cambrian sedimentology, mineralogy, geochemistry, and petrophysics indicate that the shale gas enrichment in the upper reaches of the Yangtze River in China is controlled by paleo-environmental conditions, diagenetic evolution, and preservation conditions [
12]. The study of lower Paleozoic shale gas in southern China shows that the shale rich in organic matter has experienced strong burial and thermal effects [
13,
14,
15], and the effective stress and maturity are important factors to determine the shale physical properties. The comparison of shale reservoir characteristics in the Weiyuan and Fuling areas of China shows that the pore composition, permeability, and other petrophysical characteristics of shale reservoirs in different areas of China have obvious differences [
16,
17]. Therefore, in the process of shale gas development, it is necessary to analyze the characteristics of shale reservoirs and control factors of gas-bearing shale, and understand the storage and migration rules of shale gas [
18,
19,
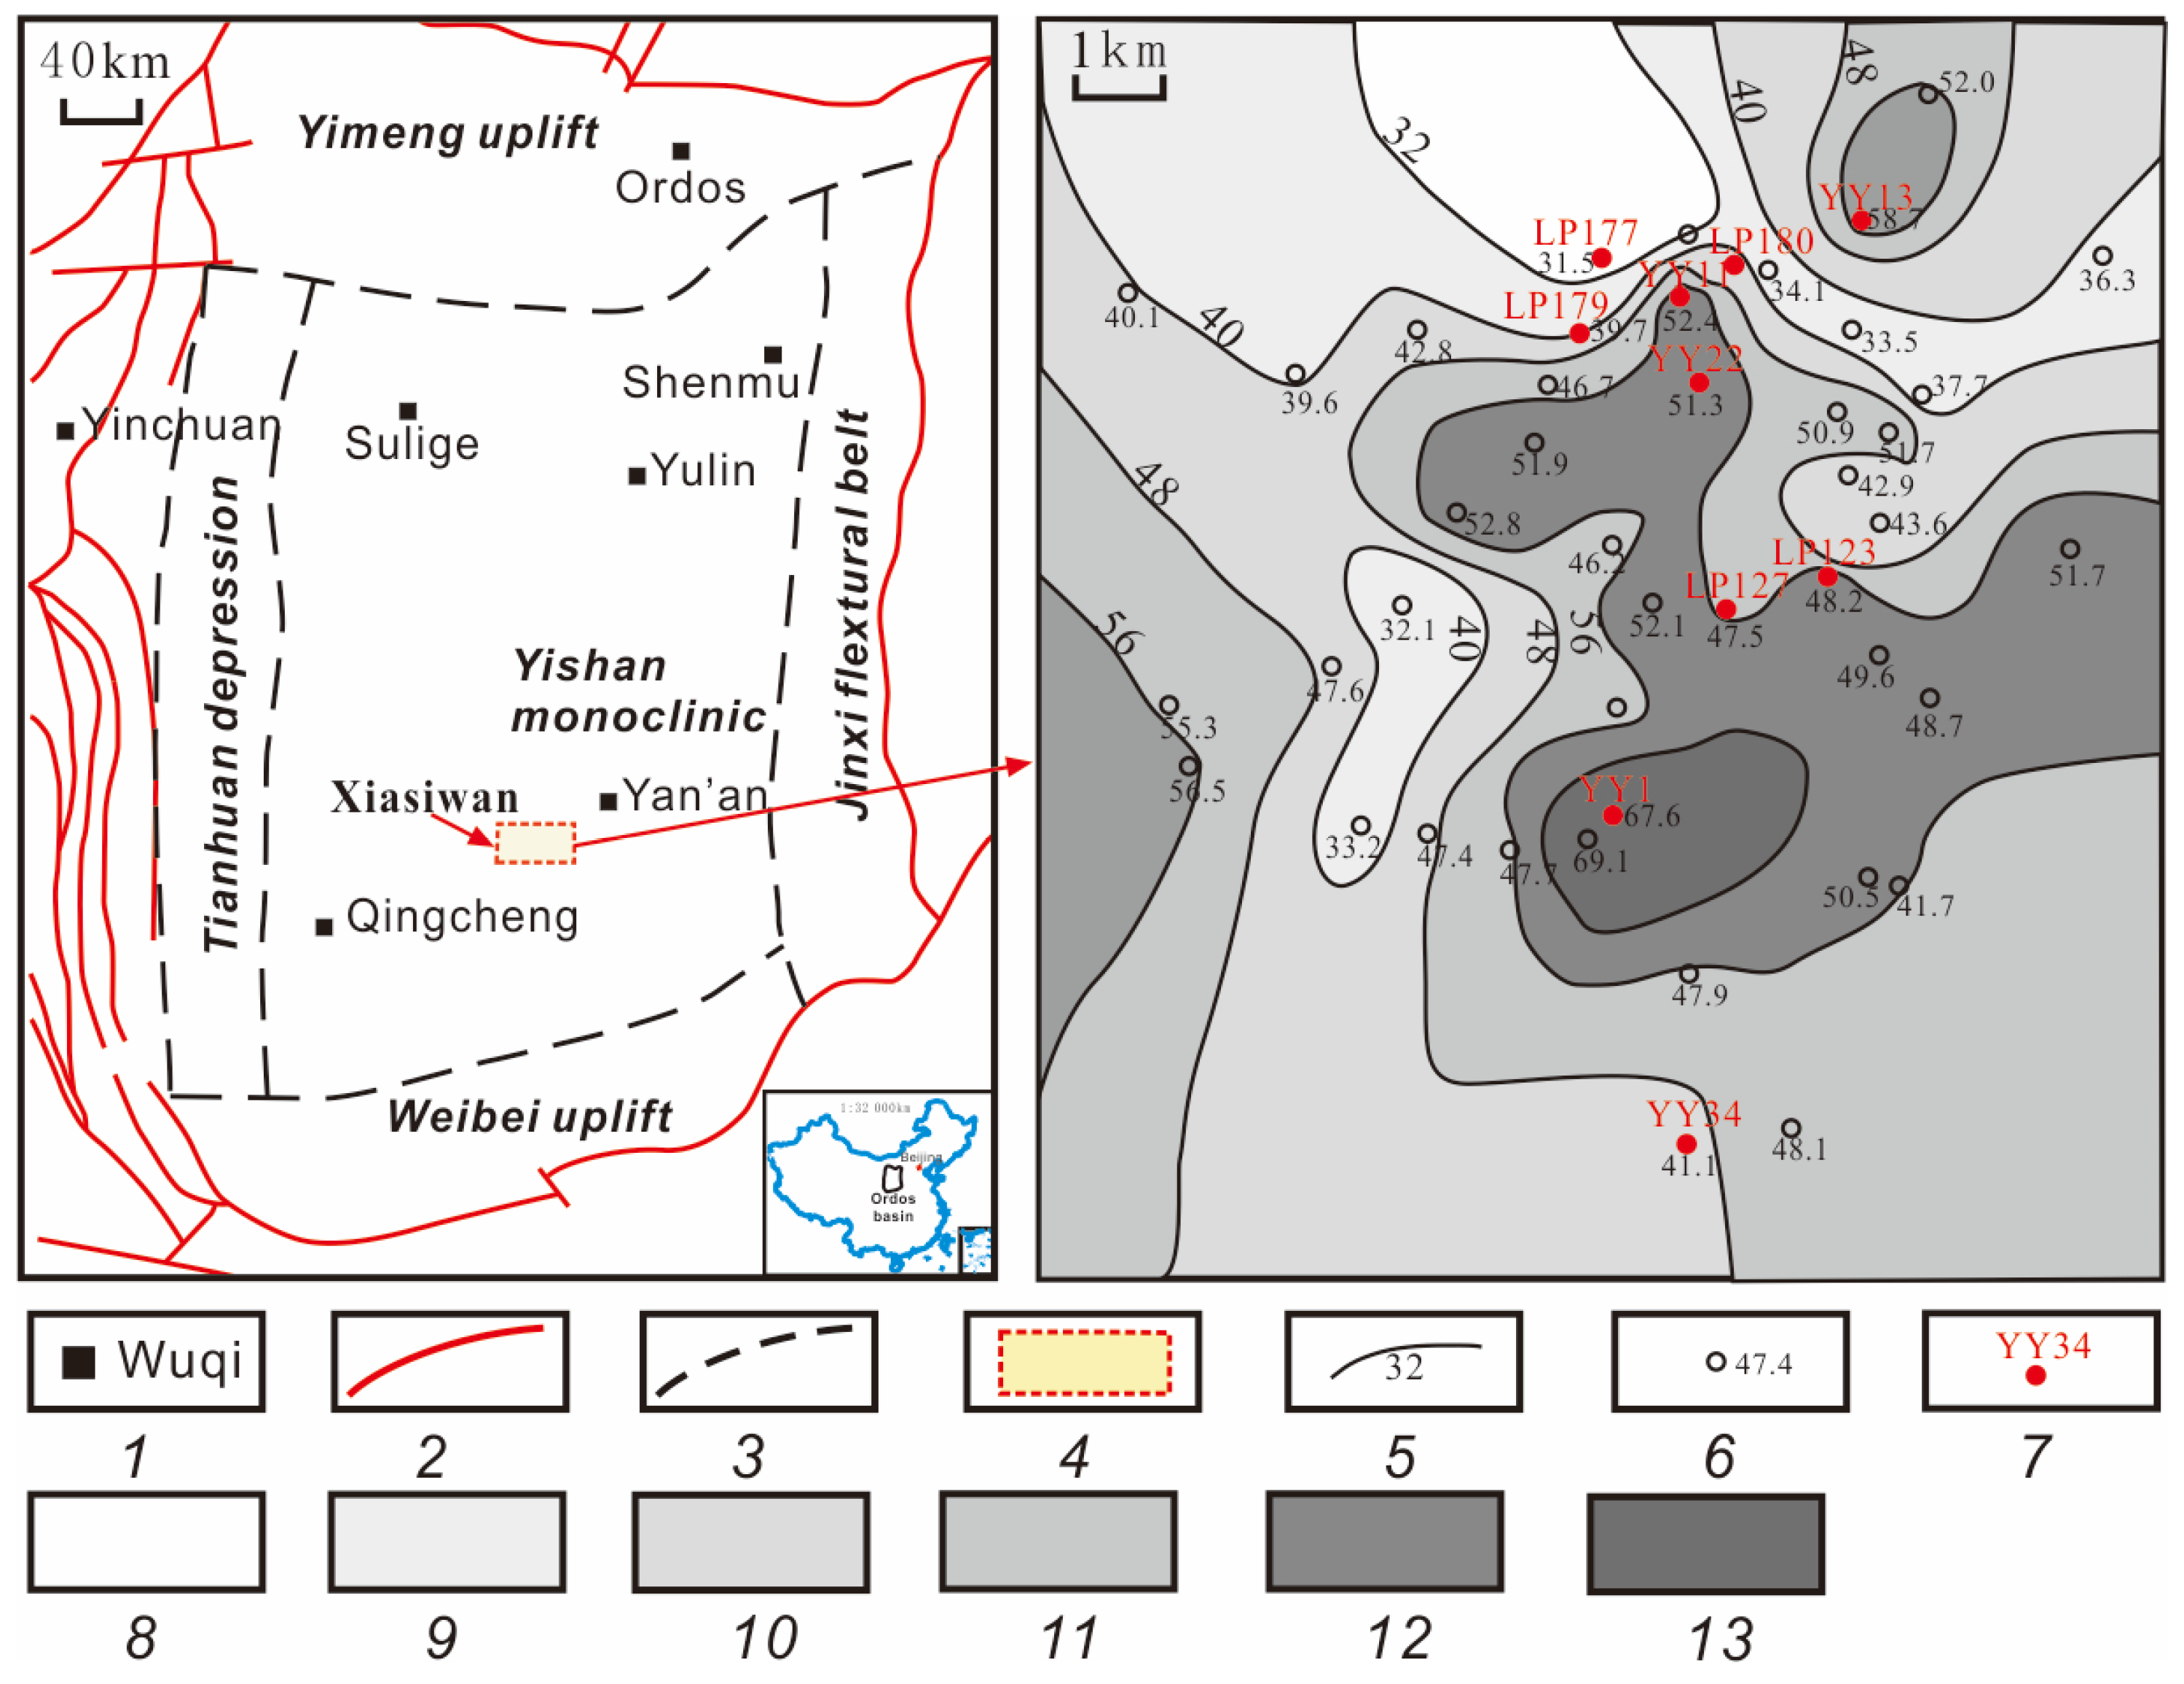
20]. This paper takes the Chang 7 Member shale in the Xiasiwan area of the Ordos Basin as an example (
Figure 1) to deeply analyze shale reservoir characteristics and control factors of gas-bearing shale, providing a theoretical basis for the prediction of the shale gas “sweet spot” area.
This study addresses the critical scientific question of what controls shale gas content and reservoir quality in continental shale systems, specifically within the Chang 7 Member of the Ordos Basin. By integrating geochemical, mineralogical, and petrophysical analyses, the research aims to identify the key factors influencing gas-bearing properties and provide a predictive basis for locating shale gas “sweet spots”. The findings reveal that mesopores, total organic carbon (TOC) content, and pressure are the primary controls on gas content, while clay minerals and thermal maturity play secondary roles. These insights advance the global understanding of continental shale gas systems, which remain underexplored compared to marine shales. The work offers a valuable comparative framework and supports the development of more accurate gas content prediction models, with implications for unconventional resource assessment in similar basins worldwide.
2. Geological Setting
The Ordos Basin is a cratonic marginal depression basin and the basement of the basin is the Archean and Proterozoic metamorphic rock crystal basement, on which there are Paleozoic, Mesozoic, and Cenozoic caprock deposits, with obvious dual structure [
21]. According to the tectonic evolution history and the present tectonic morphology, the Ordos Basin can be divided into six first-order tectonic units: the Yimeng Uplift, the Weibei Uplift, the Jinxi Flexural-Fold Belt, the North Shaanxi Slope, the Tianhuan Depression, and the West Margin Thrust Belt [
22,
23,
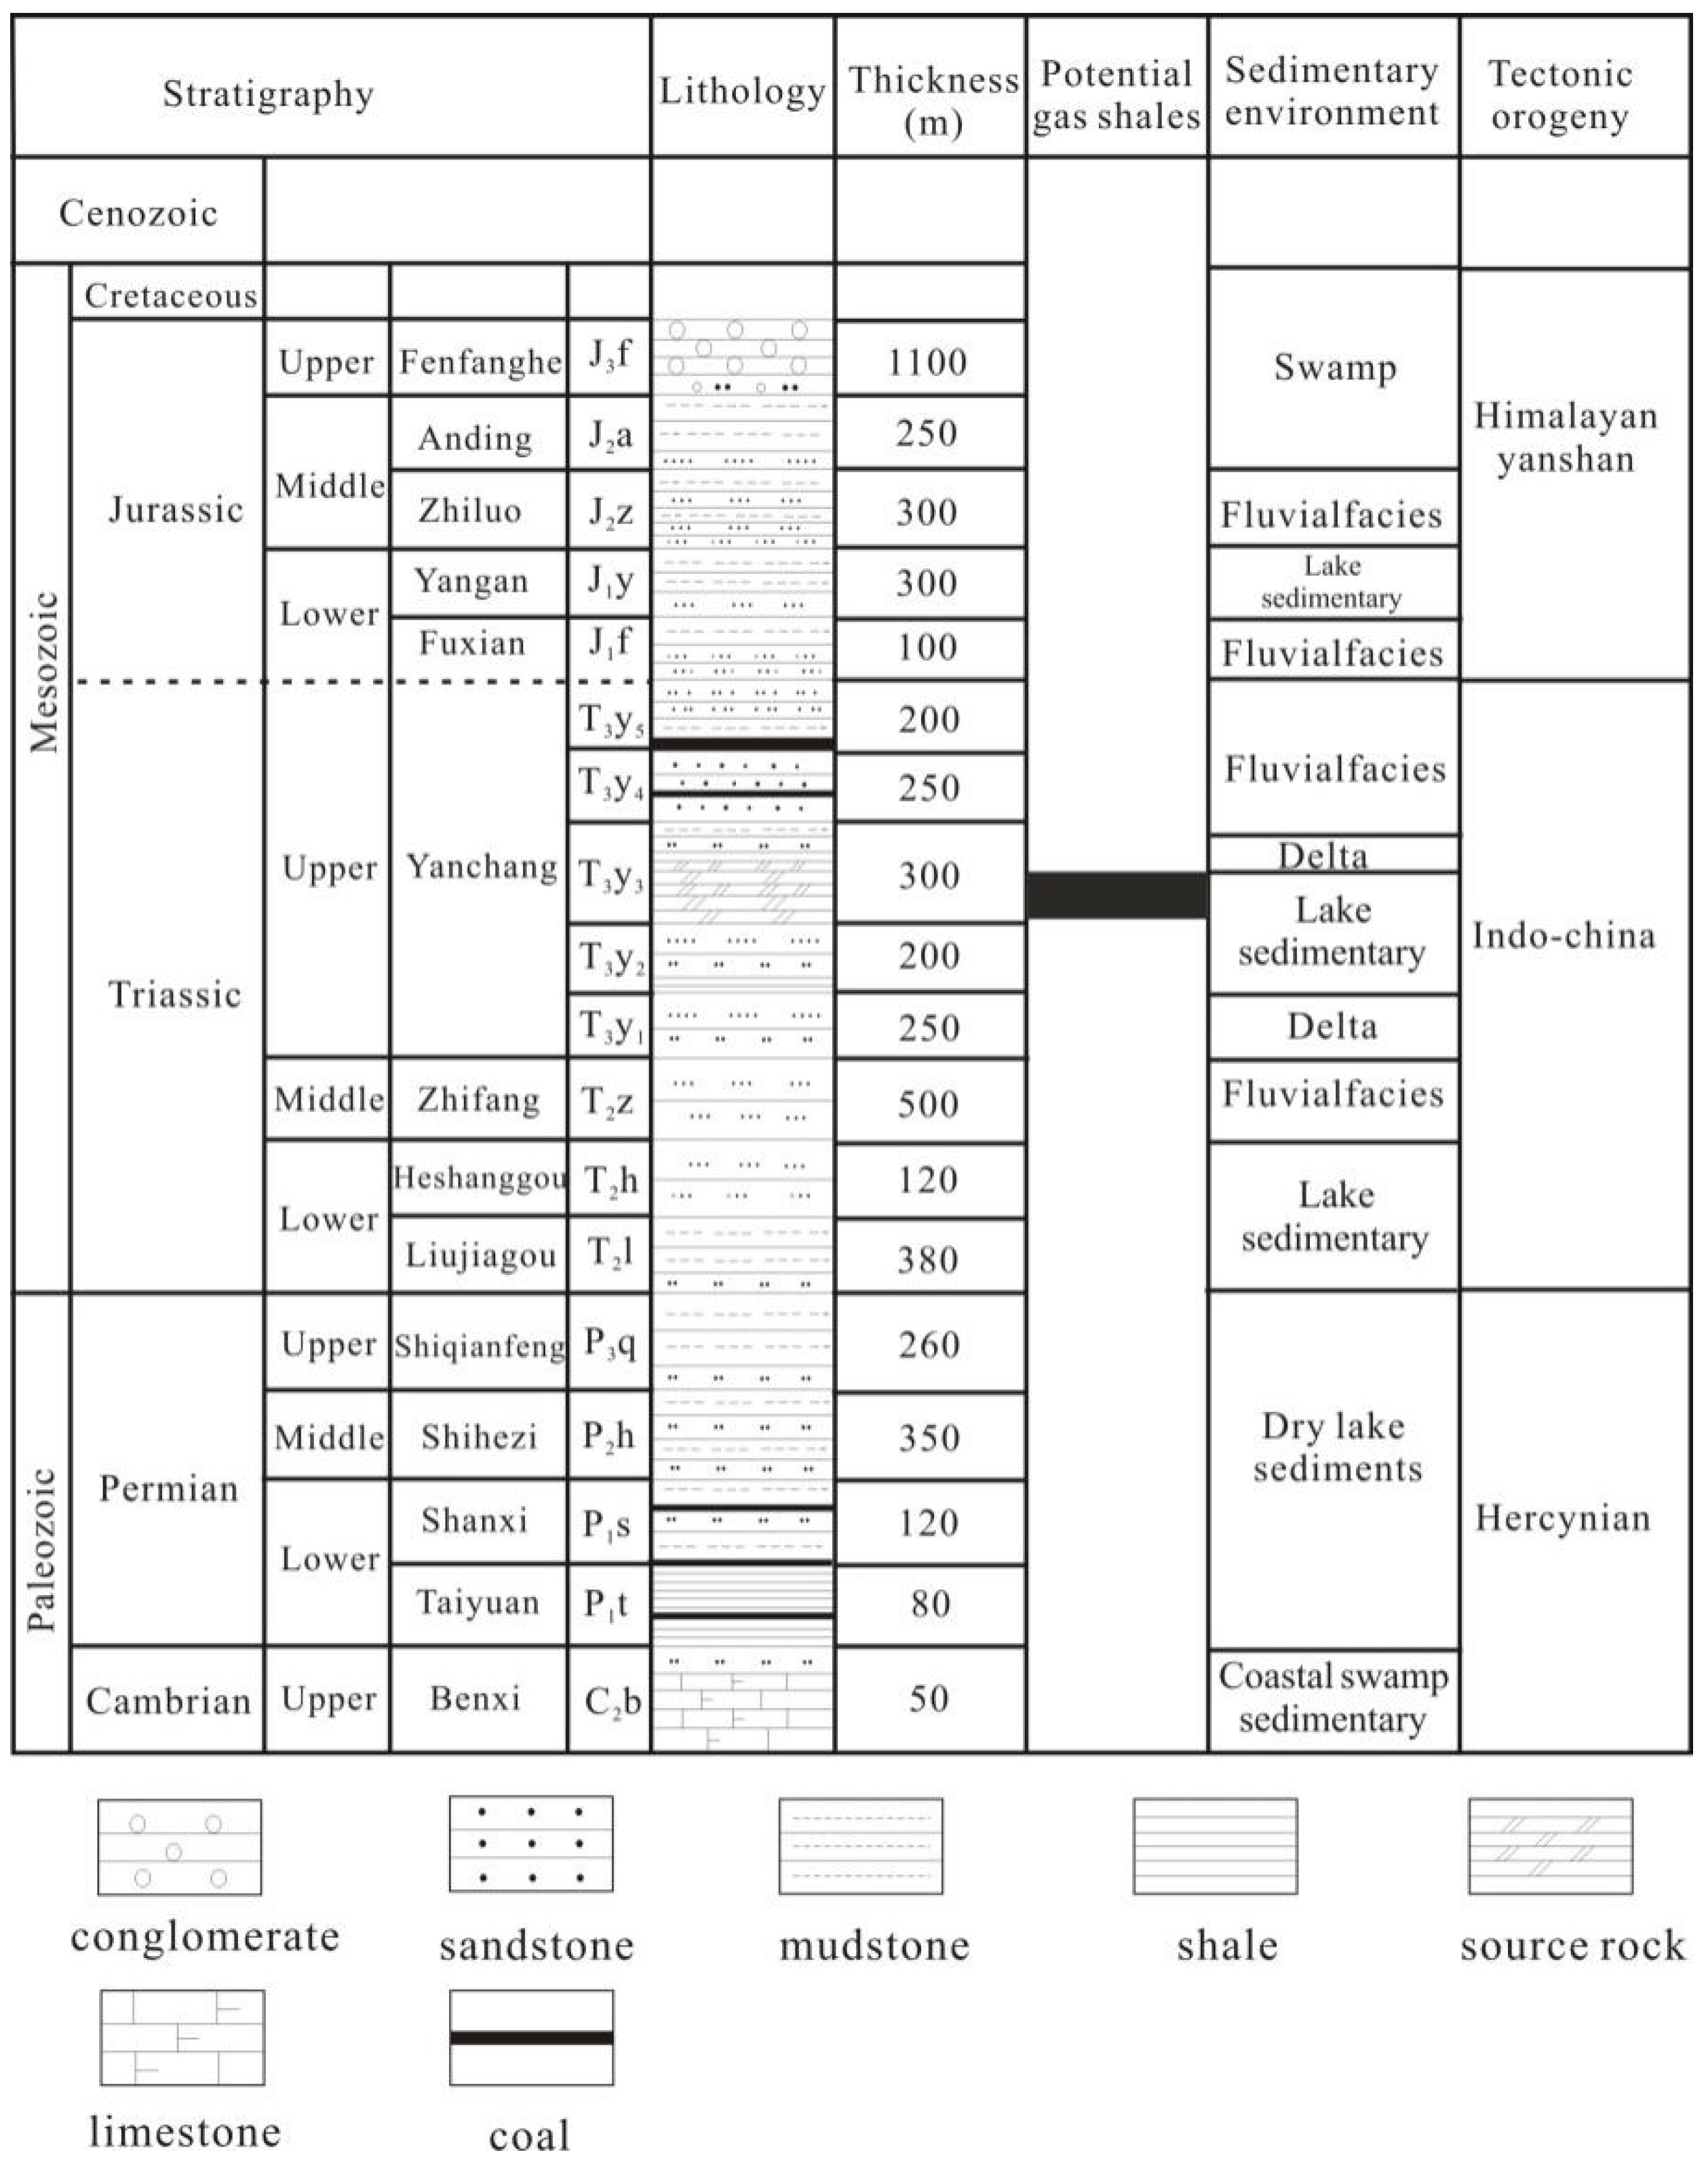
24]. The Triassic Yanchang Formation in the Ordos Basin is mainly composed of fluvial facies, delta facies, and lacustrine facies, and developed two sets of thick dark mudstone and oil shale in the Chang 9 Member and the Chang 7 Member (
Figure 2), which formed the most important hydrocarbon source rocks in the Ordos Basin [
25,
26,
27,
28]. Previous studies suggest that (1) the accumulated thickness of the Chang 7 shale is 10–110 m, with an average thickness of 35 m. The thickness contour extends from NW to SE, and the maximum accumulated thickness near Luochuan–Huachi–Dingbian reaches 100 m [
29]. (2) The organic matter in the Chang 7 shale is mainly from plankton, benthic algae, and other lower organisms, and the TOC content is 5%–18%, with an average of 13%. (3) The vitrinite reflectance (R
o) is between 0.5% and 1.13%, and the R
o in the Chang 7 Member is between 0.76% and 1.16% with an average of 1.00%, indicating that the source rocks have entered the hydrocarbon generation threshold and are in the peak oil generation stage, which is conducive to reservoir formation [
30,
31,
32].
3. Sample and Experiment
3.1. Samples
In this study, core data collected from 9 wells in the shale gas demonstration area were mainly analyzed by X-ray diffraction (XRD) (Bruker, Karlsruhe, Germany), scanning electron microscopy (SEM) (Thermo Fisher Scientific, Hillsboro, OR, USA), total organic carbon (TOC) (Elementar, Langenselbold, Germany), vitrinite reflectance (Ro) (ZEISS, Suzhou, China), and core radioactive element content determination, and the characteristics of shale reservoirs in the study area were analyzed. Meanwhile, the relationship between the adsorbed gas content of shale and temperature, pressure, TOC, and Ro were studied, and the control factors of the gas content of shale were analyzed.
The adsorption isotherm method was employed to quantify adsorbed and free gas volumes. Under isothermal conditions, system pressure was incrementally varied, and the total equilibrium gas volume was experimentally determined. The theoretical free gas volume at each corresponding temperature–pressure condition was computed using a real gas equation of state; adsorbed gas volume was then obtained by subtracting the calculated free gas volume from the measured total gas volume.
Desorption experiments were conducted under controlled thermal conditions: Well YY1 was tested at 40 °C with stepwise pressure reductions to 0.5, 0.8, 1.5, 2.0, 3.0, 4.0, 5.0, 8.0, and 10.0 MPa; Well LP17 was tested at 50 °C. Indirect gas content estimation was performed using the Langmuir adsorption model. The statistics of the number of analysis and testing items are shown in
Table 1.
3.2. Methods
3.2.1. XRD Analysis
The experimental instrument adopts Bruker (D8 ADVANCE) with the following parameter settings. The scanning method is continuous scanning, with a scanning range of (2θ). Whole rock analysis is usually between 5° and 70°, and clay mineral analysis needs to include small angle areas with a step size of 0.02°. This analysis method requires cleaning and processing oil containing rock samples to a fluorescence level of level four or below, drying at a temperature below 60 degrees Celsius, cooling to room temperature, and then storing for later use; subsequently, the rock sample is crushed into powder (<200 mesh) until all particle sizes are less than 40 microns or there is no graininess when rubbed with fingers. Under stable testing conditions, phase retrieval and semi quantitative/quantitative analysis will be performed using software based on the X-ray diffraction spectrum of the sample to determine the mineral type.
3.2.2. SEM Analysis Method
The experimental instrument adopts the Verios series, with the following parameter settings: the acceleration voltage is generally adjusted between 1.0 kV and 20 kV (low voltage is commonly used to observe non-conductive samples), the working distance (WD) is usually 8–15 mm, the beam spot size is adjusted according to the magnification and signal strength, and the probe mode is secondary electron imaging (SE) to observe the morphology. When the sample is installed on the pile, the observation surface should be fresh, flat, perpendicular to the surface of the cushion layer, and the thickness should not exceed 5 mm. After sample preparation, it should be kept naturally dry and dust prevention measures should be taken. Gold or carbon coating devices should be used to coat it to meet the conductivity requirements for sample analysis; the requirement is that the luminosity should not exceed 5 mm, and an argon ion polishing instrument should be used. After the sample is prepared, it is sent into the vacuum sample chamber through the exchange chamber. Then, the vacuum is applied, high pressure is applied, and the astigmatism and focal length are adjusted to obtain clear images. The structural characteristics of minerals and rock debris particles are observed, recorded, and described at a magnification of 300 times.
3.2.3. Ro Analysis
The experimental instrument adopts the Zeiss Axio Imager series, with a measurement wavelength of 546 nm (green light and fixed wavelength). The objective lens uses a 50× oil immersed lens and is calibrated using a standard plate with known reflectivity. At least 10 effective points are measured for each sample. The reflected light intensity is converted into current intensity through a photo multiplier tube and compared with the current intensity generated by a standard sample with known reflectivity under the same conditions. When preparing the optical film, the curing agent is mixed with the sample in a certain proportion to solidify it into a shape. The entire rock is sliced directly, ground with sandpaper or corundum powder, and then polished with polishing solution until the boundaries between the components are clear, with few scratches and pitting. The qualified light sheet is placed in a dryer for 12 h before conducting reflectance measurements. Due to slight differences in optical properties between vitrinite particles in the same sample, it is necessary to measure a sufficient number of reflectance values for different particles to ensure the representativeness of the measurement results. When the average reflectivity is less than 0.5% or greater than 2.0%, the number of measurement points should not be less than 30; when the average reflectivity is between 0.5% and 2.0%, the number of measurement points should not be less than 20. If the number of measurement points is less than 10, it should be noted that the data is for reference only.
3.2.4. Determination of TOC Content
This experiment was conducted using the German Elementalar (enviro TOC) instrument, with a combustion temperature typically at 900 °C, high-purity oxygen (purity > 99.99%), and an infrared detection cell (NDIR). Firstly, crush the sample and sieve it with a sieve smaller than 0.2 mm. Then, based on the lithology and color of the sample, weigh 0.01–1.00 g of the sample using a double balance and place it in the crucible in sequence. Slowly add 1:7 (volume ratio) hydrochloric acid and soak for 12–15 h until it does not pass through the crucible. Heat the glass dish in a water bath and control the temperature to ensure it does not exceed 80 degrees Celsius. Drop 1:7 hydrochloric acid directly into the crucible, and the sample does not react. Maintain a constant temperature for 30 min. Place the crucible on the vacuum filter, rinse it clean with distilled water, and then remove it in order. Place the sample in a constant temperature drying oven on a metal crucible rack and maintain it at 80 °C for 4 h before use. Place the crucible into the automatic sampling tray of the TOC analyzer, and the instrument burns in a high-temperature oxygen flow to detect the amount of CO2 produced. The software calculates the TOC content.
3.3. Results
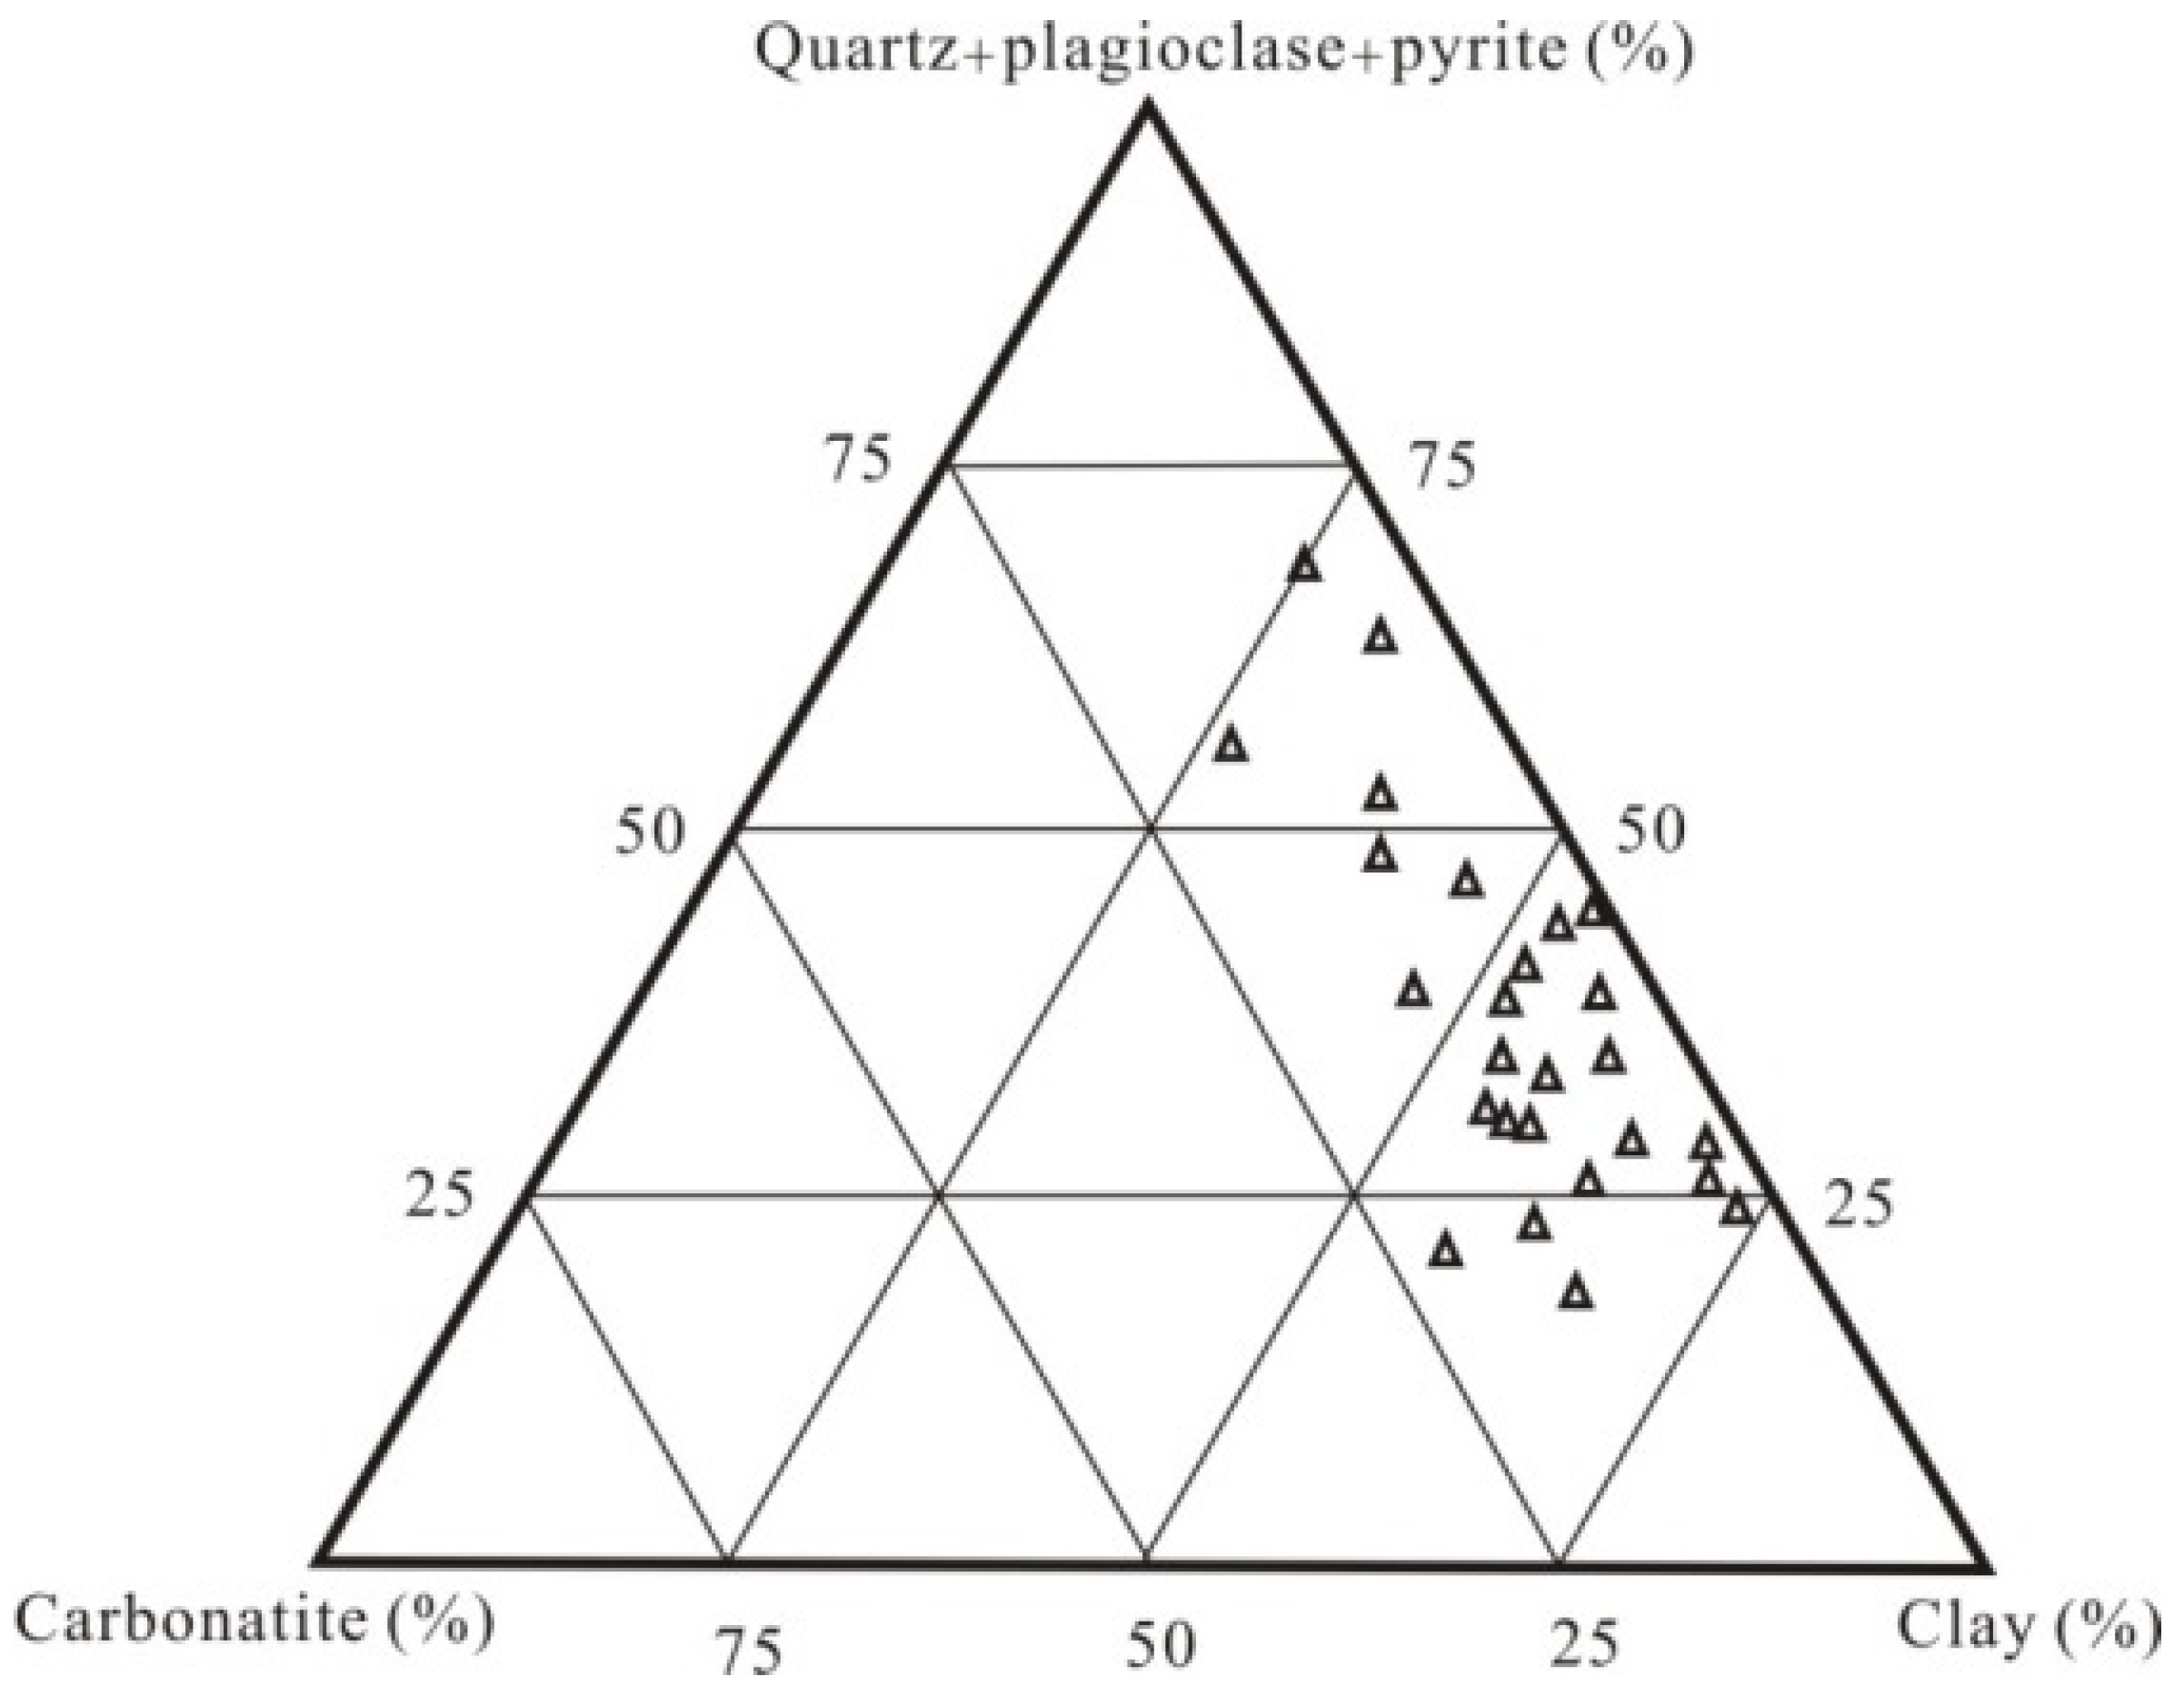
The XRD analysis results of Chang 7 shale show that (1) the clastic components in the shale are mainly quartz and feldspar, and a small amount of acid ejected rock, metamorphic rock, and other debris; quartz content is from 10.6% to 29.7%, generally ranging from 13.0% to 25.0% and 17.6% on average, which is lower than that of Barnett shale in North America and Cambrian–Silurian marine shale in the higher thermal evolution stage of the Paleozoic in South China, and higher than that of feldspar shale in North America. (2) Cement is mainly composed of clay minerals, calcite, iron dolomite, and pyrite, etc.; apart from clay minerals, the content of other cementing minerals is very low, where the average calcite content is 1.5%, the average iron dolomite content is 1.1%, and pyrite content is 1.7%. (3) The clay mineral content in shale is generally from 25.0% to 70.5%, with an average of 51.8%, higher than that of Barnett shale in North America and marine shale of the Paleozoic in southern China (with a clay mineral content of 10%–46%) [
33]. The clay mineral types are mainly I/montmorillonite, chlorite, and illite, in which the content of illite/montmorillonite +illite is generally from 19.5% to 62.0%, with an average of 42.3%, and the content of chlorite is generally from 5.5% to 12.0%, with an average of 9.3%. In general, the Chang 7 shale gas demonstration zone has a low content of petroliferous rocks and a high content of feldspar and clay minerals (
Figure 3).
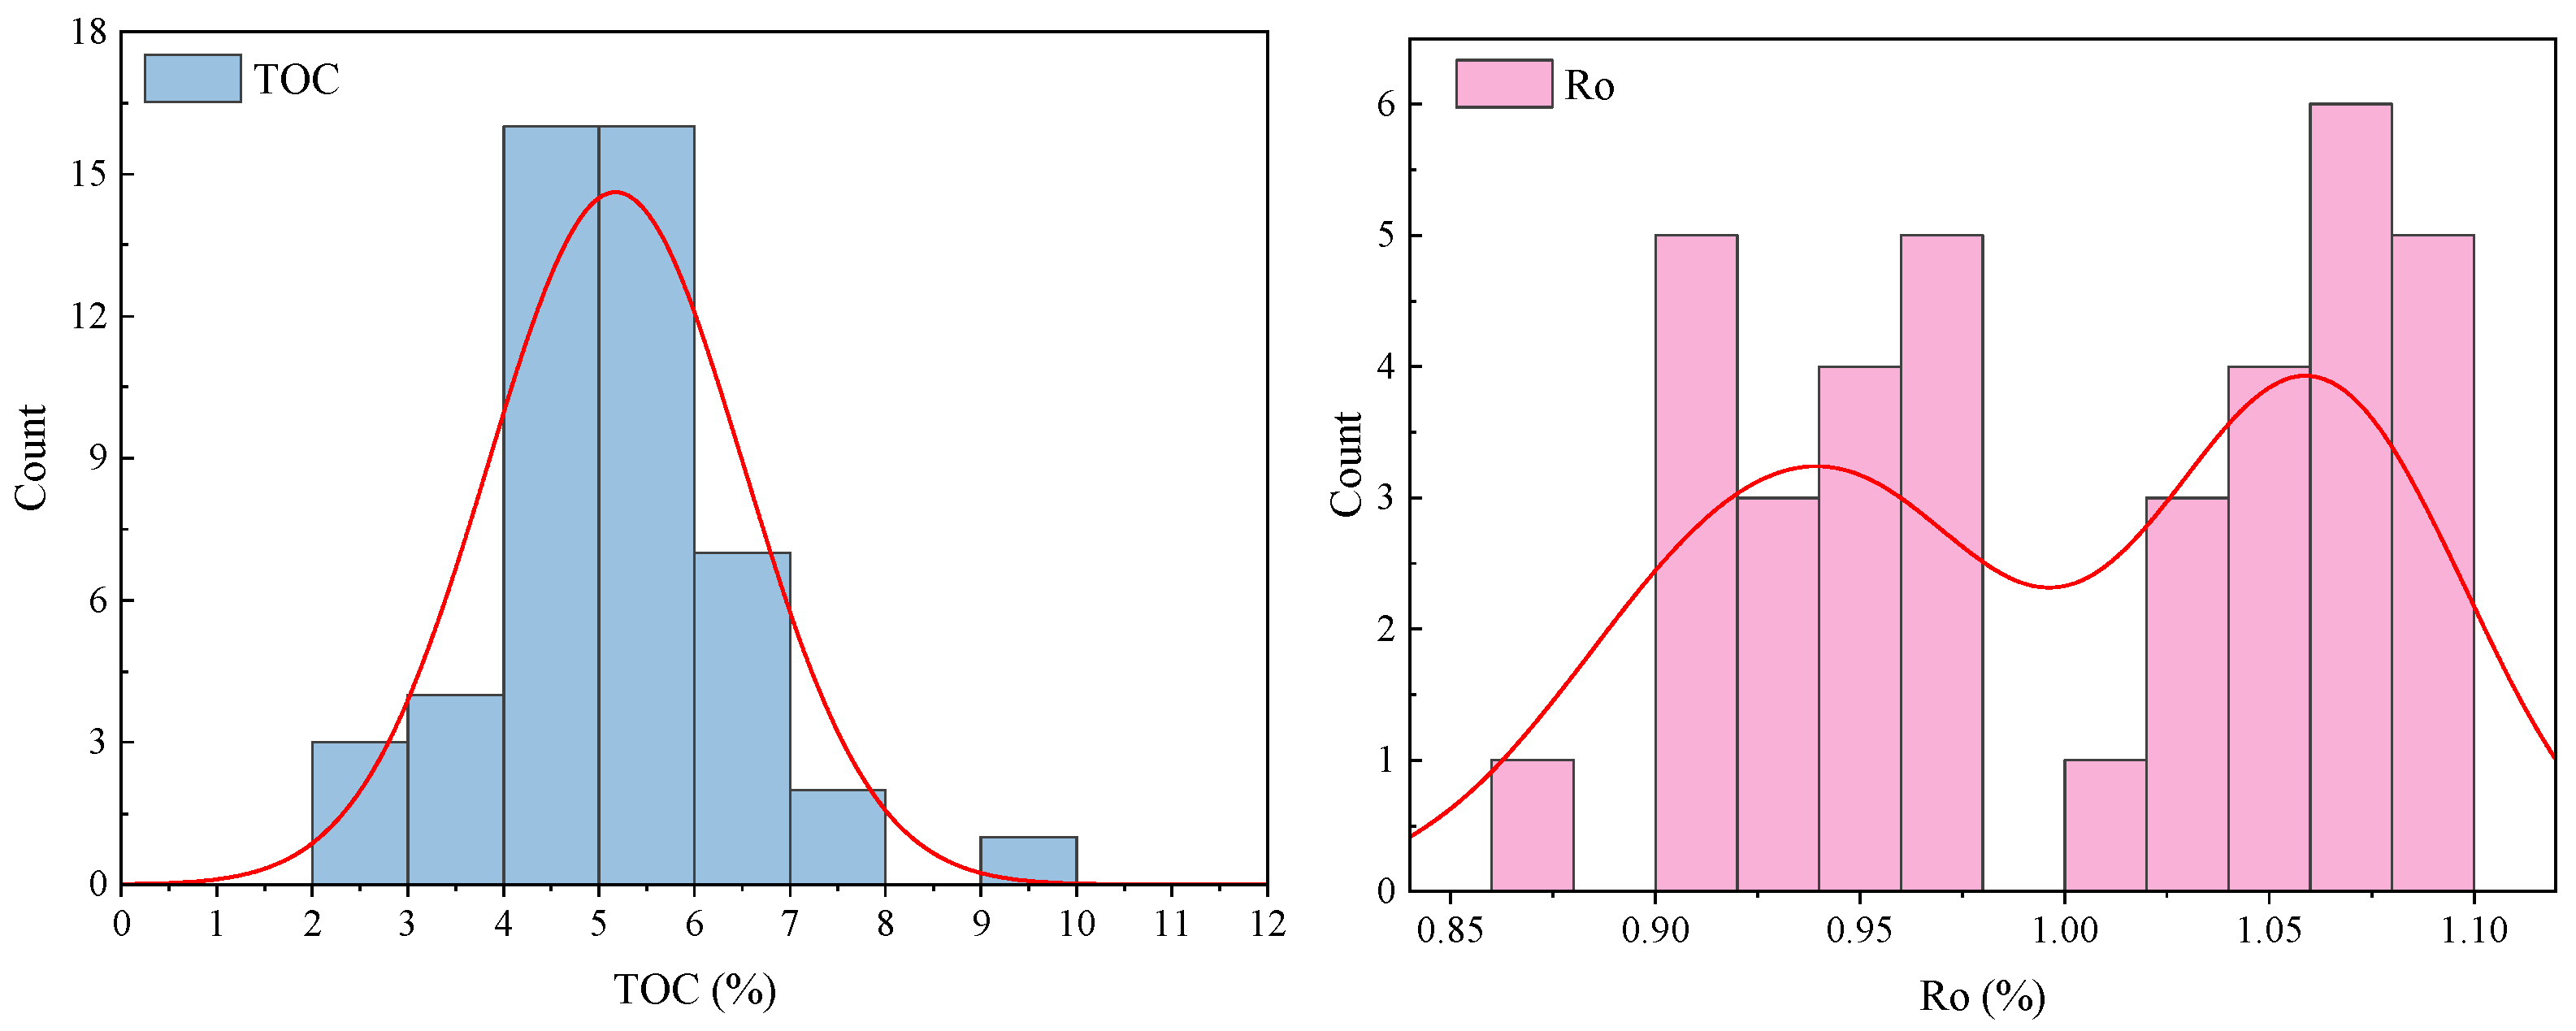
The TOC analysis results show that the organic carbon content in Chang 7 shale ranges from 0.46% to 9.8%, and the main frequency ranges from 2% to 6%. The total organic carbon content of 90% of the samples is more than 2%, and the TOC content in the Chang 7 shale is lower than that in the Barnett Formation and comparable to the Lewis Formation (0.45% to 2.50%) (
Figure 4). Kerogen maceral analysis results show that Chang 7 hydrocarbon source rock kerogen maceral is composed primarily of sapropel group, with a content of 77.2%–94.9%; the kerogen type is I and II
1, composed primarily of II
1. The results of kerogen element analysis showed that the H/C atomic ratio of the Chang 7 shale is from 0.47 to 1.07, with an average value of 0.88. The O/C atomic ratio is from 0.03 to 0.09, and the average value is 0.04.
The R
o analysis shows that the vitrinite reflectance (R
o) is from 0.80% to 1.13%, the mean value is 1.02%, and the main peaks are from 0.90% to 0.8% and from 1.0% to 1.1%, indicating that the shale organic matter in the study area is in the mature stage (
Figure 4).
Black shale and dark mudstone contrast test results show that the type of organic matter in the black mudstone is mainly II
1 and I, with an overall higher average TOC content. The pyrolysis experiment yields a relatively high S
1 value for sample S
1; dark mudstone, predominantly of organic matter types II
1 and II
2, exhibits a low average total organic carbon (TOC) content and a correspondingly low S
1 value. The T
max value of maximum pyrolysis peak temperature of shale kerogen samples shows that the maximum pyrolysis peak temperature of shale kerogen samples in the study area is mainly located at 449–460 °C (
Table 2).
SEM images provide useful information about the type, size, and arrangement of pores [
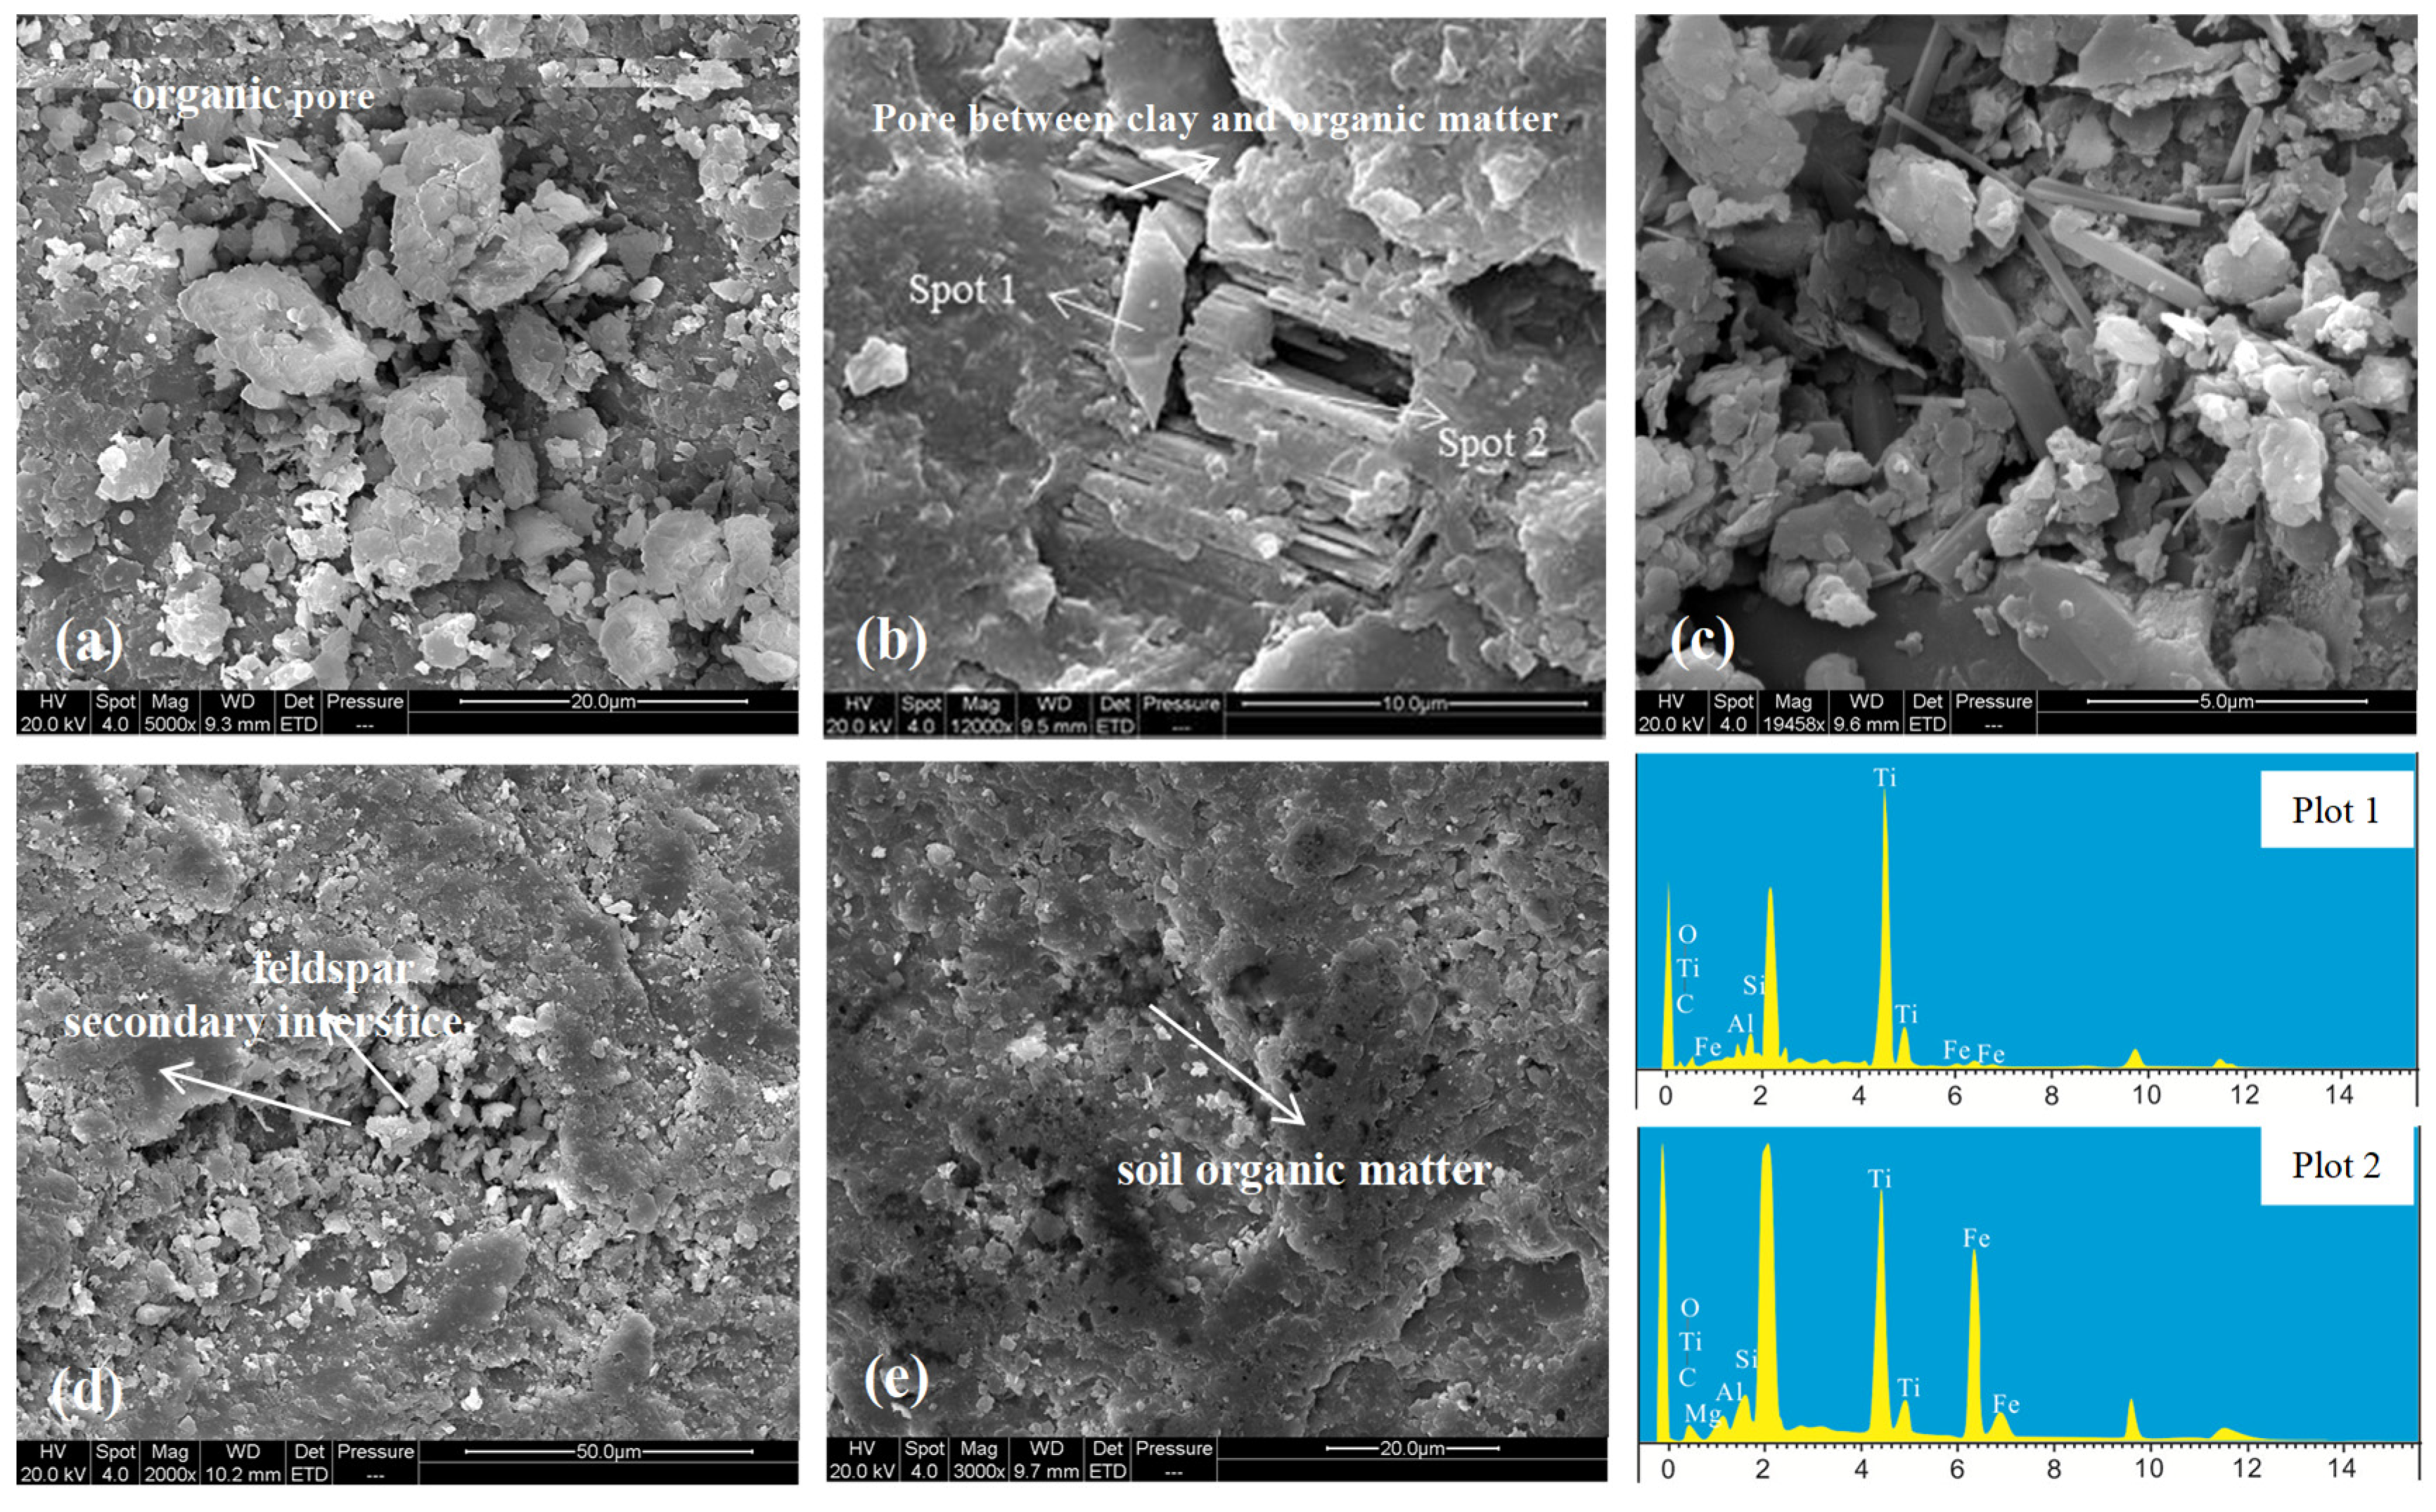
34]. The SEM results show that the pore types of Chang 7 shale are mainly intergranular pores, granular dissolved pores, and organic matter pores. Primary intergranular pores mainly include clay mineral intergranular pores and clastic intergranular pores. Intergranular pores of clay minerals are pore spaces surrounded by clay minerals. Three types of pore spaces can be observed under the resolution scale of SEM. The first type is equal-axial type, most of which are large pore grades, and the pore shapes are smooth and disorderly (
Figure 5a). The second type is long axis type, and the pore has a “slit” shape, which is distributed directionally along the bedding of clay minerals (
Figure 5b). The third type is irregular polygon, mainly developed in silty shale lamina or the intergranular pores formed by the accumulation of rigid debris particles such as quartz and feldspar, which are micron macropores (
Figure 5c). In the sandy lamina of shale, secondary pores formed by dissolution can be seen, which are mainly developed in feldspar particles and interstitial materials of clastic particles, and can form large dissolution holes of micron scale (
Figure 5d). In the shale rich in organic matter, a small number of organic matter pores are developed, mainly distributed in the kerogen margin area, with diameters of 1–10 microns, and are round, triangular, polygonal, and irregular long strips (
Figure 5e). The measurement and statistical results show that the pores in Chang 7 shale are mainly mesopores, accounting for 50% of the total pores, and the pore diameter is mainly 6–9 nm, with an average of 7.2 nm. The pore diameter of Barnett shale is less than 10 nm. The Chang 7 shale and Barnett shale have similar characteristics in terms of porosity.
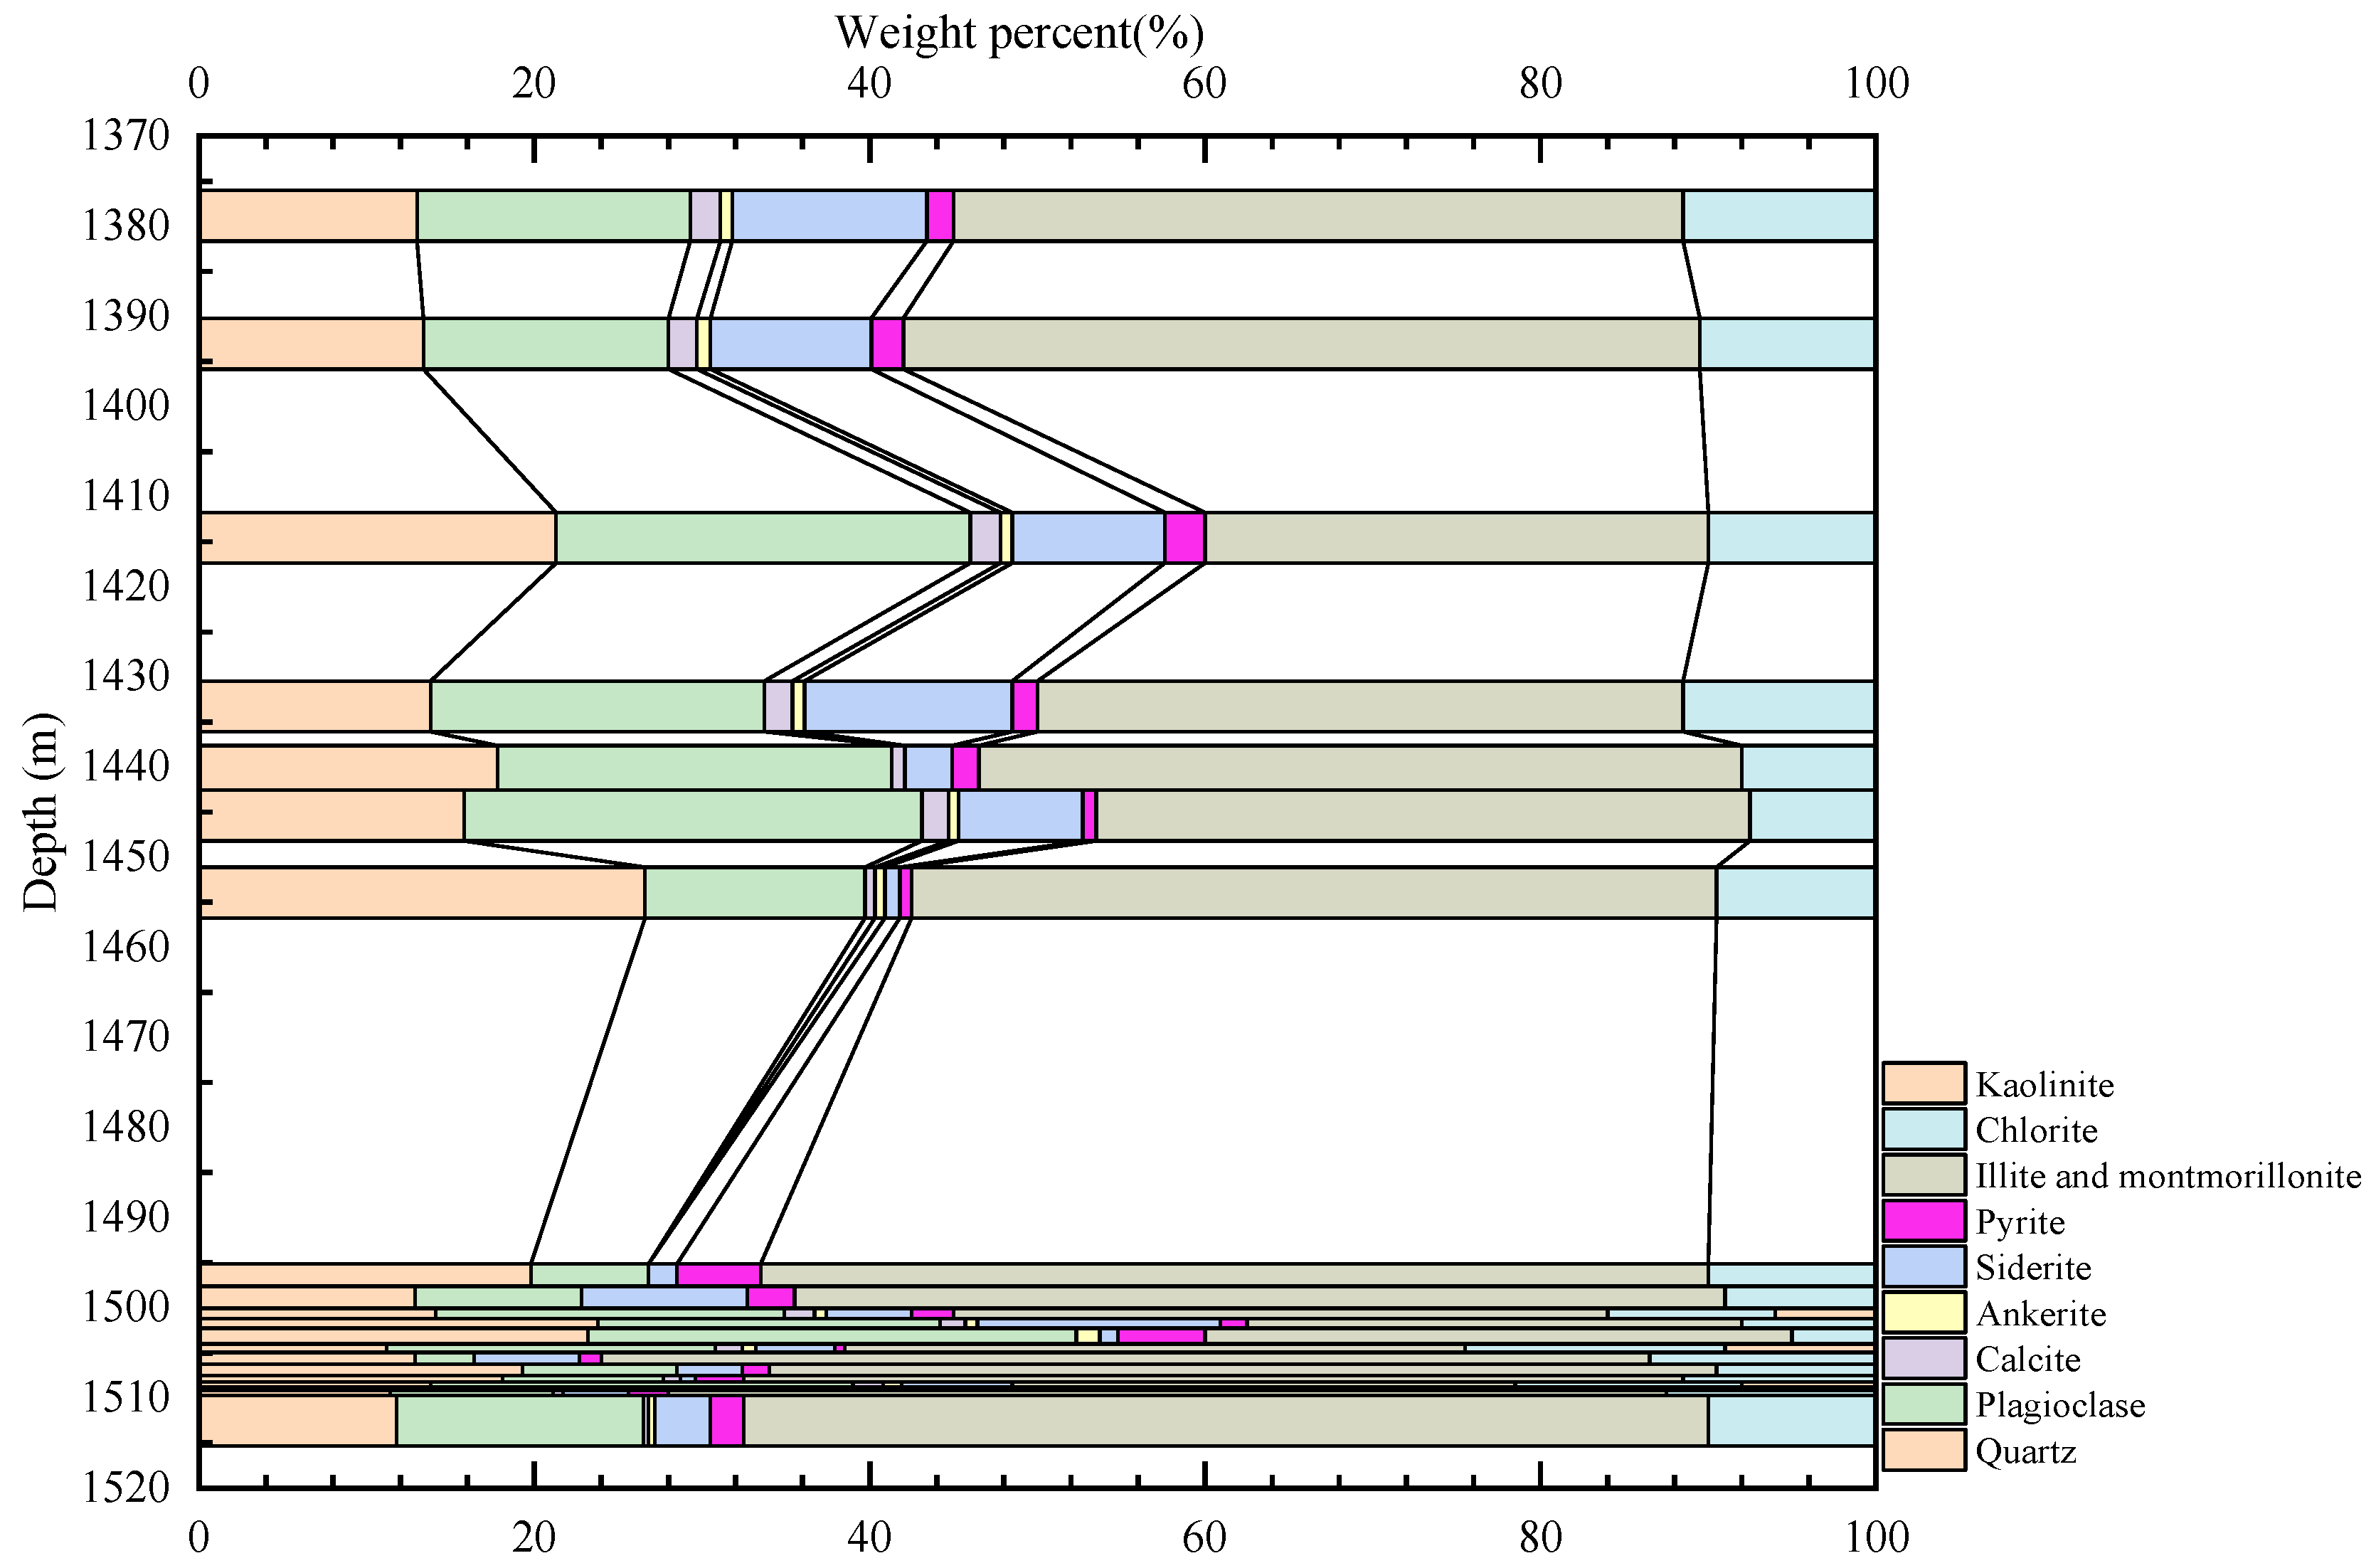
The whole rock analysis of the shale of the Chang 7 Member of the Yanchang Formation in Well YY1 was conducted by X-ray diffraction. The analysis results show that the content of quartz is 11.2%–26.6%, plagioclase is 3.5%–30.1%, calcite is 0.0%–1.8%, siderite is 0.9%–14.5%, and pyrite is 0.0%–5.2%. The content of illite and montmorillonite is 29.5%–62.5%, and the content of chlorite is 5.0%–15.5%. As the depth increased, the contents of illite and montmorillonite increased, the contents of plagioclase decreased, and the contents of quartz and chlorite basically remained stable (
Figure 6).
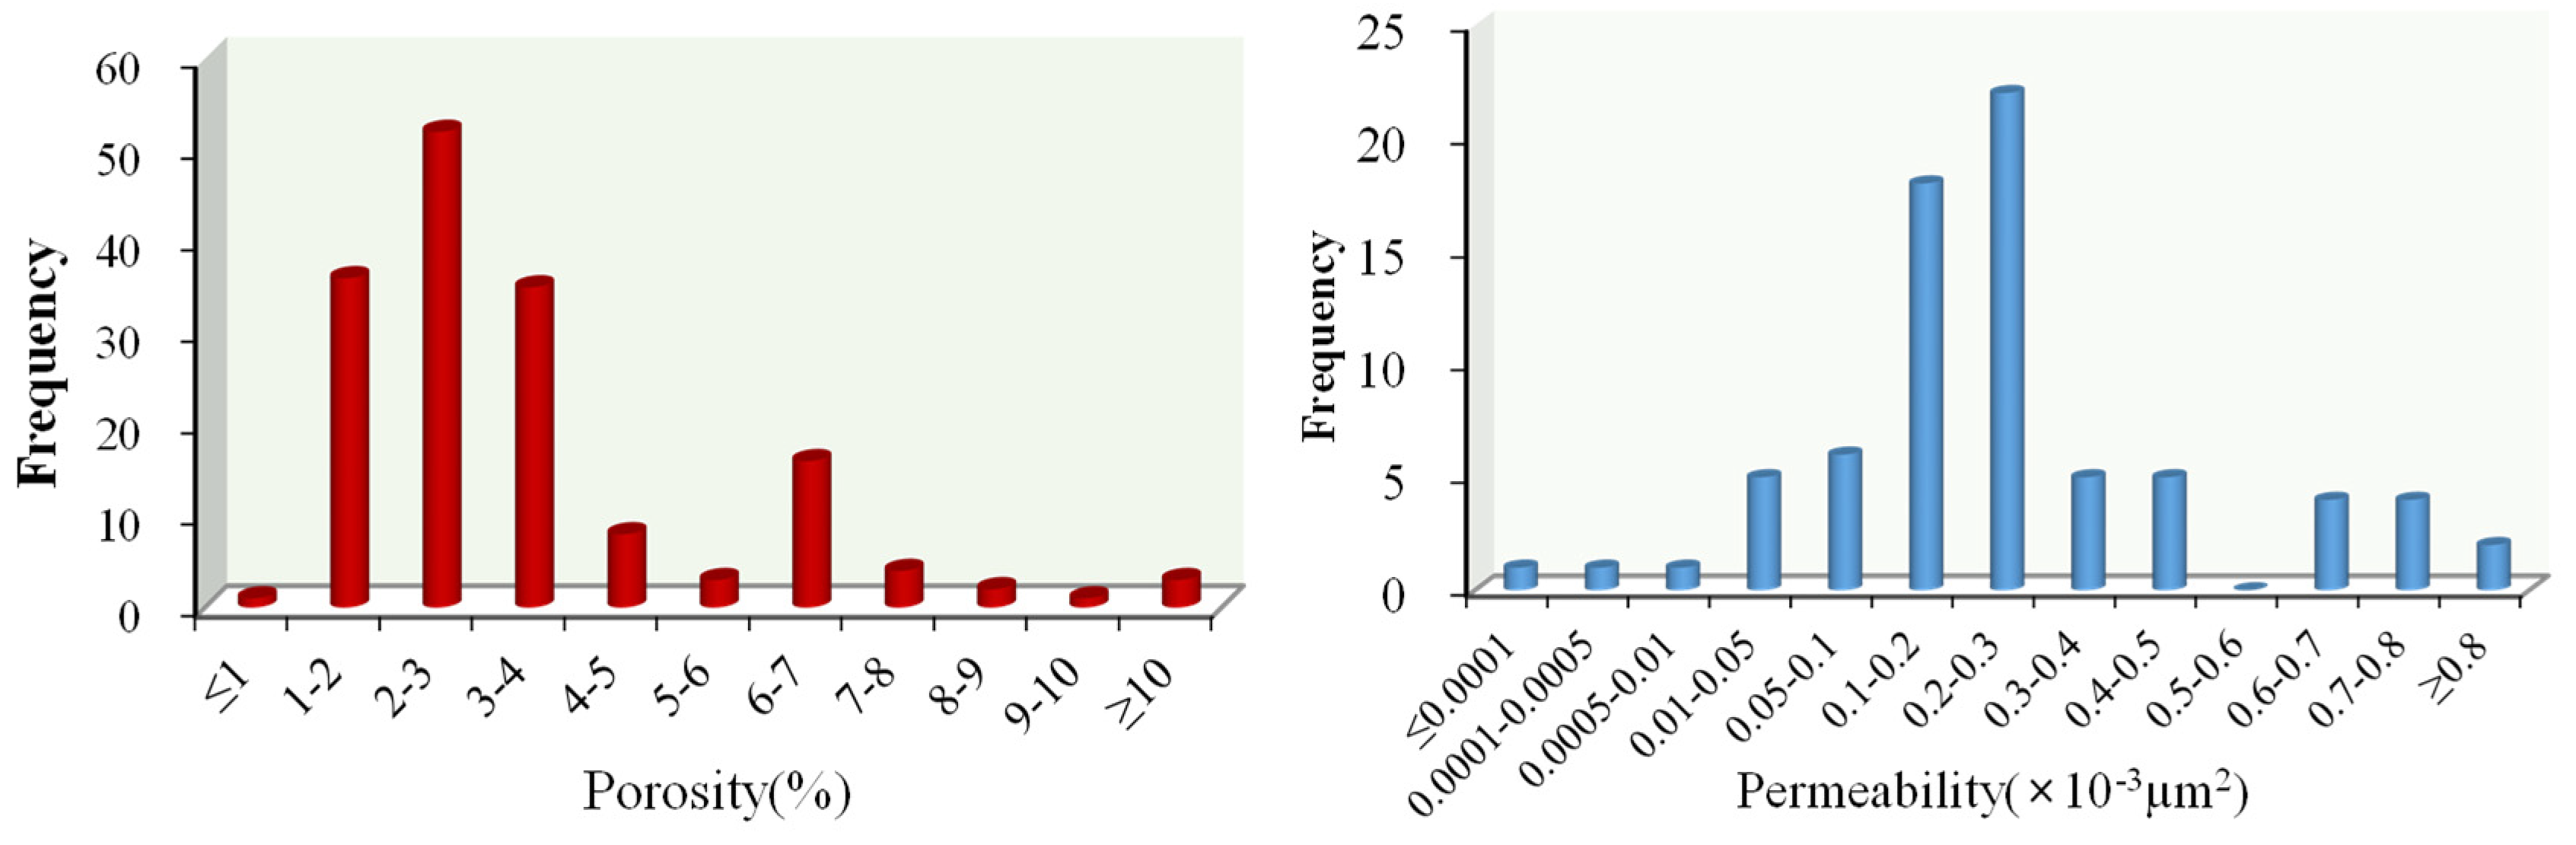
A nuclear magnetic resonance experiment was conducted on 40 cores from 7 wells, and the statistical results of core physical properties analysis are shown in
Figure 7. The statistical results of porosity of the shale in Chang 7 Member range from 0.5% to 13.8%, with an average of 2.8%. The porosity distribution is mainly bimodal, with a main peak distribution range of 2%–4% and a secondary main peak distribution range of 6%–7%, respectively. Among 113 shale test samples, only 3 samples have a porosity of more than 10%, and the porosity of most samples is less than 8%. The permeability value is (0.0001–0.9158) × 10
−3 μm
2, the average value is 0.1625 × 10
−3 μm
2, the permeability distribution is mainly bimodal, the main peak distribution range is (0.01–0.05) × 10
−3 μm
2, (0.1–0.2) × 10
−3 μm
2, and the permeability of 47.3% sample is less than 0.1 × 10
−3 μm
2.
4. Analysis of Influencing Factors of Shale Physical Properties
4.1. Influence of Shale Composition on Porosity
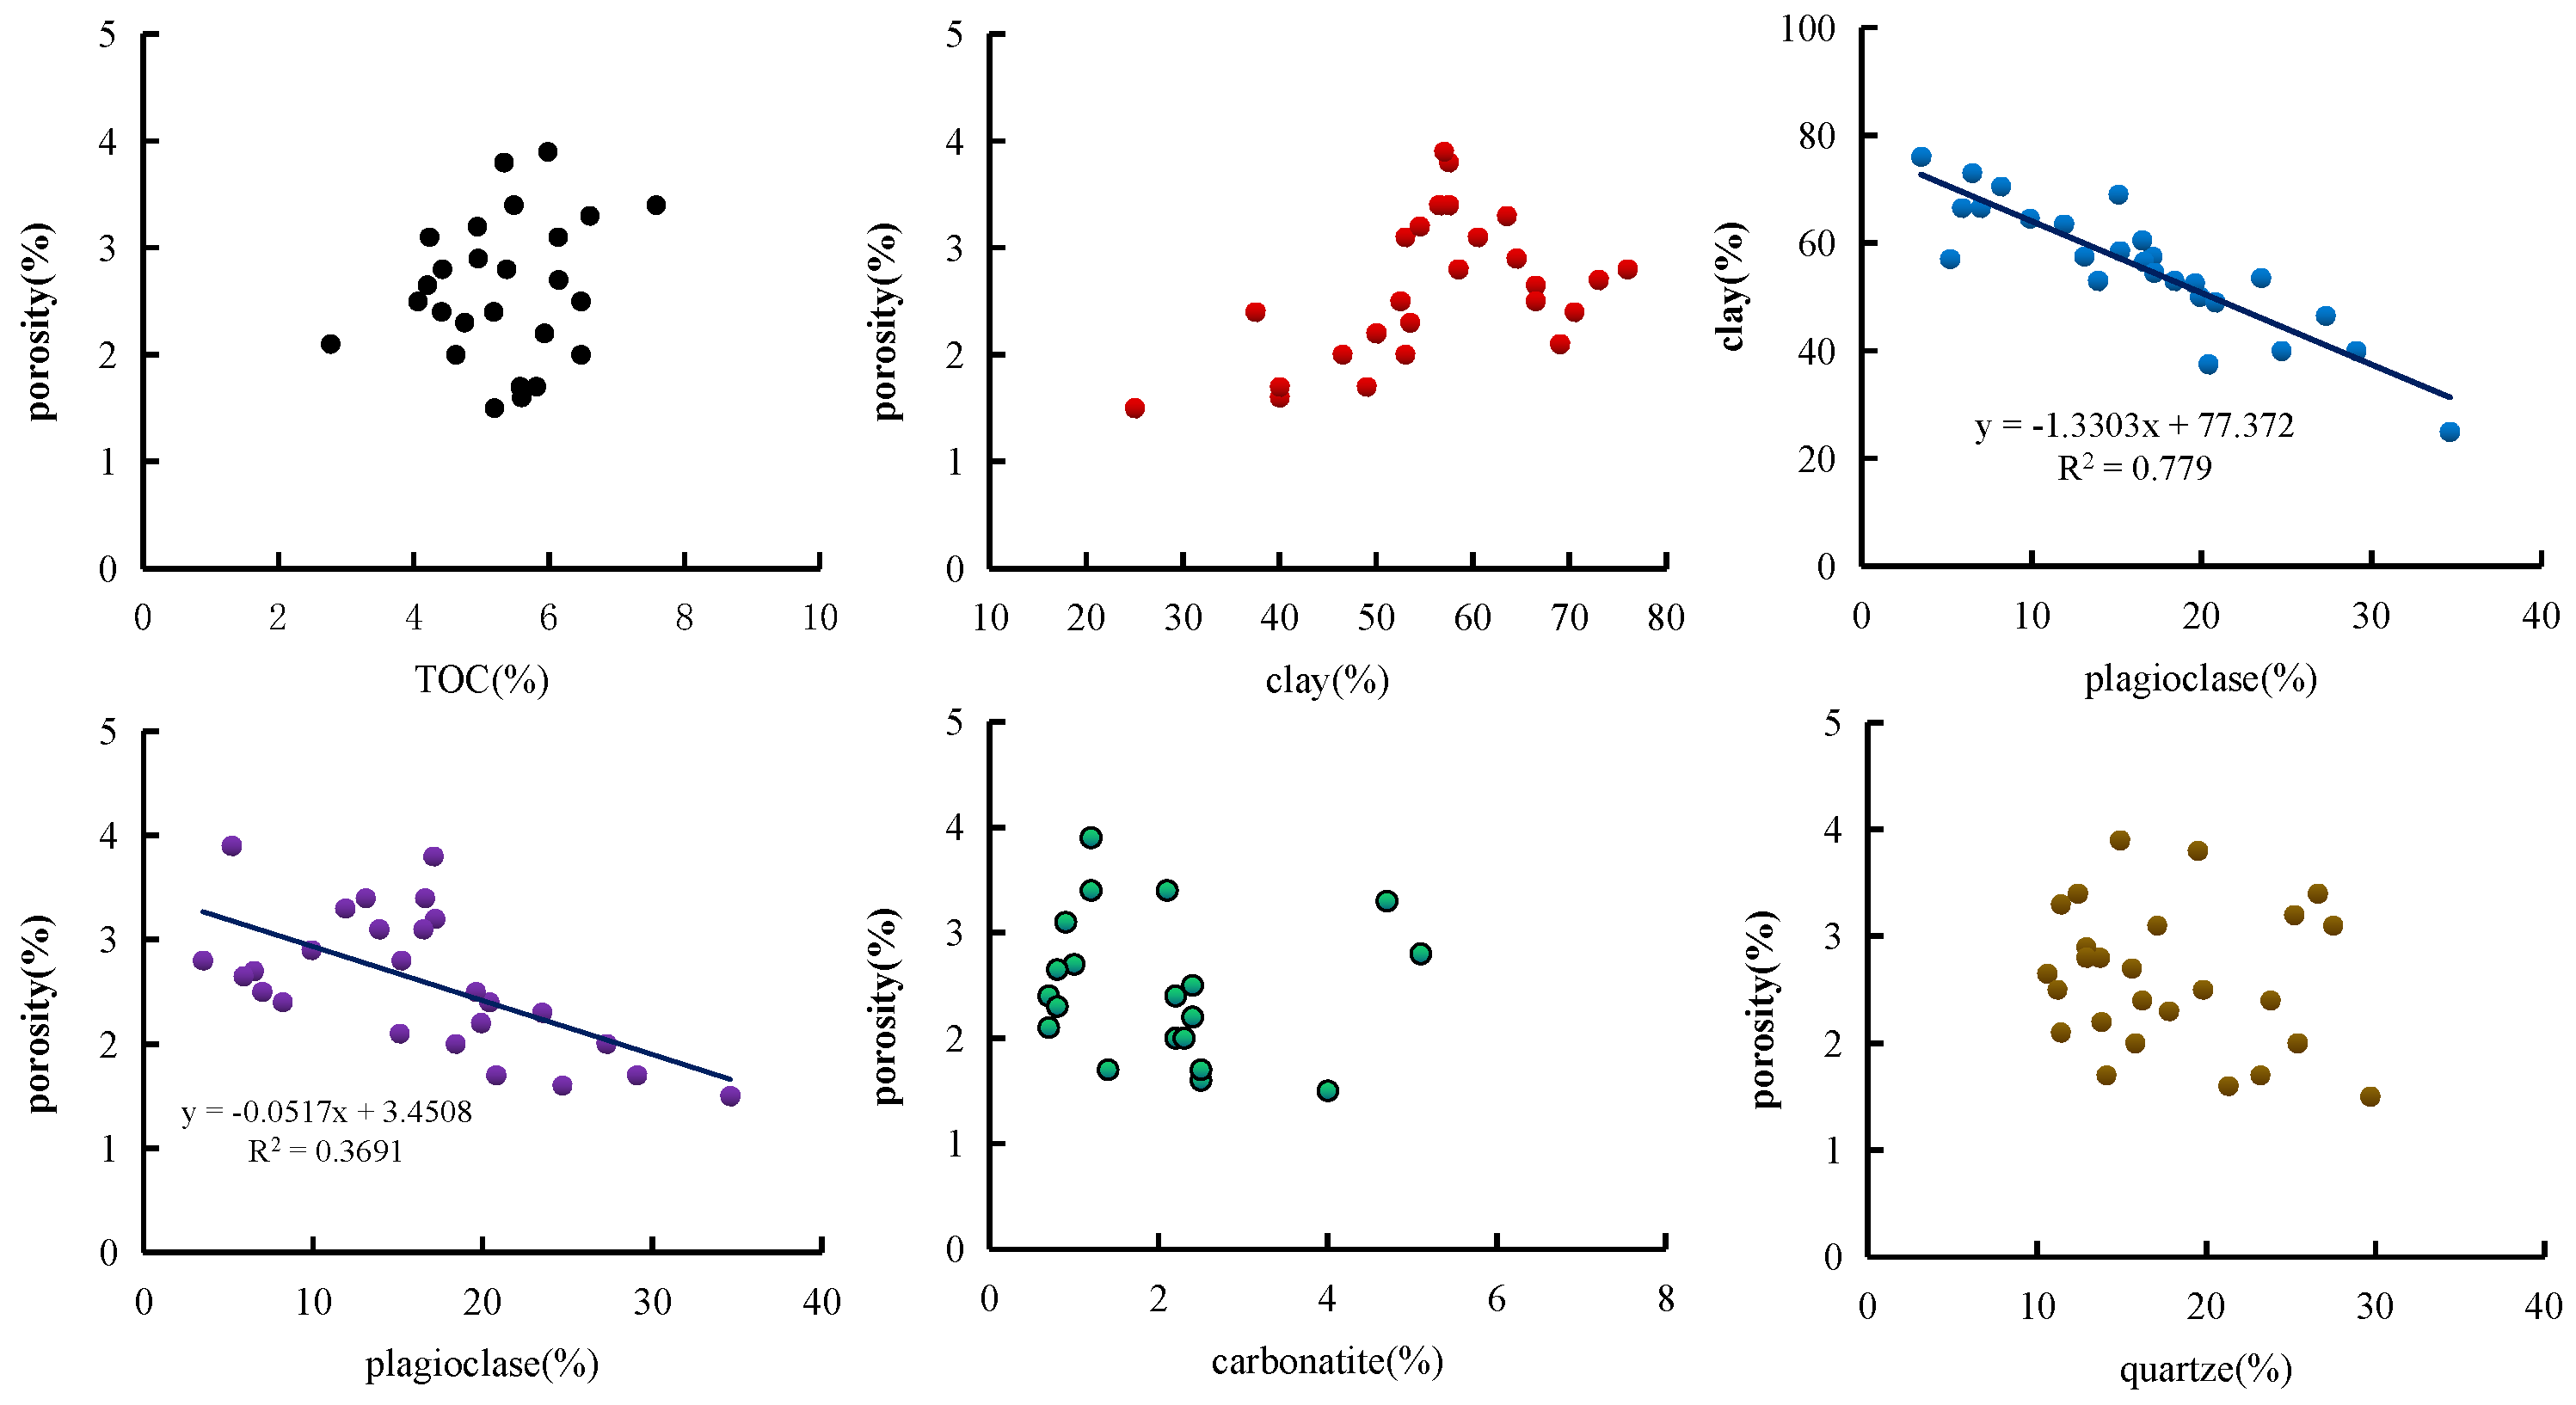
The shale mineral composition in the Xiasiwan area is mainly composed of quartz, plagioclase, illite, montmorillonite, chlorite, carbonate minerals, siderite, and pyrite. On the one hand, there are primary intergranular pores composed of quartz, feldspar, and carbonate, and the pores composed of carbonate and clay minerals are mainly nanopores. On the other hand, in the process of late diagenesis, the dissolution and re-precipitation of minerals form dissolution pores, and at the same time, the re-deposition of minerals affects the development of nanopores. Therefore, analyzing the relationship between shale composition (TOC, plagioclase, clay, carbonate, and quartz content) and porosity may help to better understand the controlling factors of shale reservoir porosity.
The content of plagioclase is negatively correlated with porosity, as shown in
Figure 8. The main reason is that such pores are mainly developed in feldspar particles, forming dissolution holes in the grains, which usually exist in isolation, with small pore radii and low abundance. It may also be because increasing the abundance of feldspar minerals acts as a diluent, reducing shale clay content and thereby reducing porosity (
Figure 8).
Single-variable correlation analysis revealed no statistically significant or consistent relationship between total shale porosity and the individual contents of clay minerals, mudstone, quartz, total organic carbon (TOC), or plagioclase. In contrast, multivariate regression analysis identified plagioclase content as the strongest predictor of porosity among all evaluated compositional parameters; no robust correlations were observed between porosity and the contents of illite, TOC, quartz, carbonate minerals, or bulk clay minerals. The fitted model yielded an R
2 of 0.426 and a Pearson correlation coefficient (R
2) of 0.653, indicating moderate explanatory power. Detailed regression coefficients and statistical diagnostics are provided in
Table 3.
In conclusion, the total porosity of the Yanchang Formation shale in the Xiasiwan area is mainly controlled by the content of clay minerals and plagioclase, because inorganic pores account for more than 95% of the total porosity, and the intergranular and intra-granular pores of clay lead to the increase in the total porosity of shale. The positive correlation between clay content and porosity indicates that there is a positive correlation between clay mineral content and porosity. The dissolution holes formed by plagioclase particles usually exist in isolation, and the pore radius is small and their abundance is low. In addition, increasing the abundance of feldspar minerals can act as a diluent, reducing the content of shale clay and thereby reducing the porosity. The increase in carbonate and quartz content makes carbonates and siliceous cementation of shale more developed, blocking pores and reducing porosity.
4.2. Influence of Shale Composition on Permeability
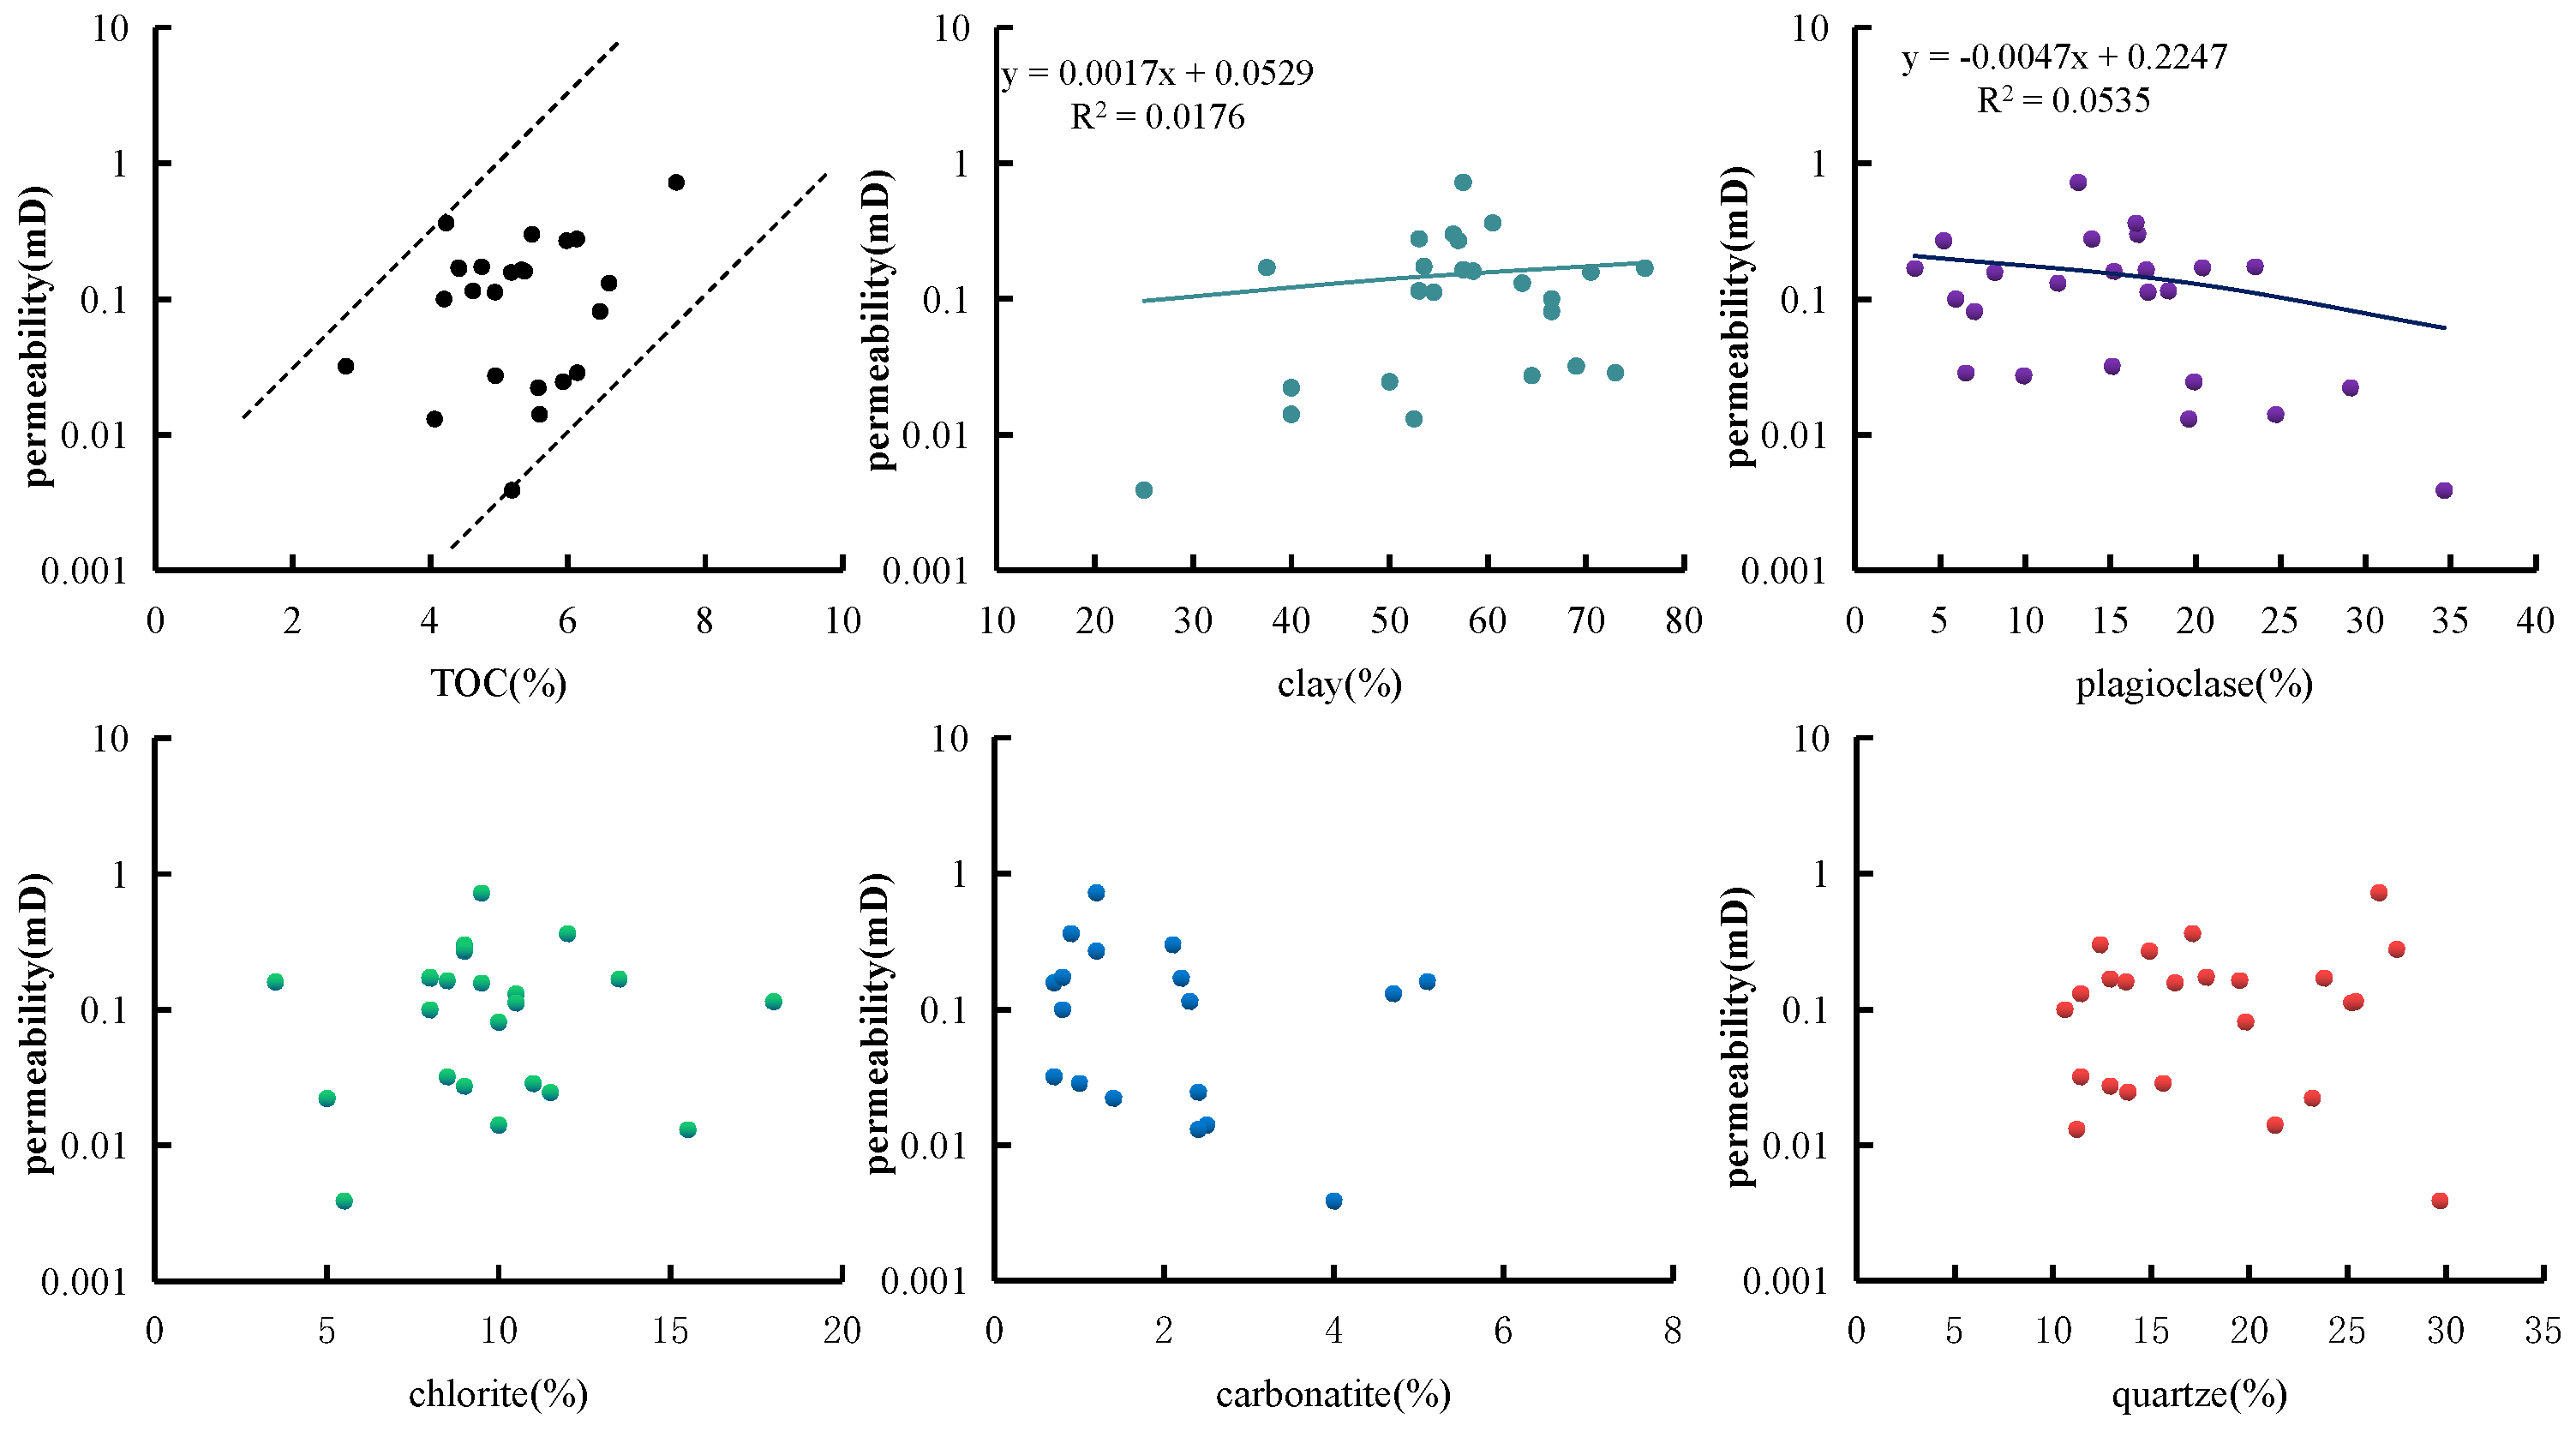
The content of TOC is weakly positively correlated with permeability, as shown in
Figure 9. The main reason is that the shale organic matter pores in the Xiasiwan area are rarely developed and are in an isolated distribution, which plays a very limited role in the transformation of pore connectivity. However, if the organic matter pores connect with micropores, the permeability of the reservoir will be greatly improved.
There is no simple positive correlation between permeability and shale clay content, as shown in
Figure 9. When clay minerals are less than 60%, on the one hand, the increase in clay minerals leads to the continuous increase in TOC content, promotes the development of organic matter pores, and is conducive to enhancing the connectivity between pores. On the other hand, with the increase in clay mineral content, inorganic micropores will develop greatly, and pore space and connectivity will be enhanced at the same time. When the clay mineral content is more than 60%, clay minerals mainly in the I/S layer will appear in the form of granular envelopment or pore lining, causing intergranular pores to develop into intercrystalline pores, thus reducing the permeability of the shale reservoir.
Plagioclase content is negatively related to permeability, as shown in
Figure 9. The main reason for this is that the dissolution holes of feldspar particles usually exist in isolation, and their pore radius is small and their abundance is very low. At the same time, increasing the abundance of feldspar minerals can act as a diluent, reducing the content of shale clay and thereby reducing the permeability.
No statistically robust correlation was observed between permeability and the contents of chlorite, quartz, or carbonate minerals.
5. Analysis of Influencing Factors of Adsorbed Gas Content
The typical characteristics of shale reservoirs in the study area are low porosity and permeability, complex mineral composition of reservoirs, and diverse types of pores. Therefore, it is necessary to analyze the influencing factors of shale gas content so as to accurately calculate the total gas content of shale and determine the “sweet spot” of shale gas.
5.1. Influence of Kerogen Type on Adsorbed Gas Content
Kerogen type is one of the important factors affecting gas composition and content. Different types of kerogen have different hydrocarbon generation potential and products due to their chemical composition and structure differences [
35]. Shale gas exploration practice has proved that kerogen can generate natural gas when it reaches a certain degree of thermal evolution, of which type I kerogen mainly generates oil, types II and III kerogen mainly generate gas, and the amount of gas in different evolutionary stages is also different [
36,
37]. Kerogen types also have certain effects on the adsorption of natural gas. Type II kerogen: During thermal evolution, it easily generates a large number of nano-micro pores, with a large specific surface area and high pore volume, providing a vast number of adsorption sites and having the strongest adsorption capacity. Type I kerogen: The pyrolysis of aliphatic chains generates pores, but its connectivity and specific surface area are weaker than those of type II, and its adsorption capacity is second. Type III kerogen: Mainly composed of vitrinite and inertinite, it has poor development of organic pores during thermal evolution, a small specific surface area, and the weakest adsorption capacity.
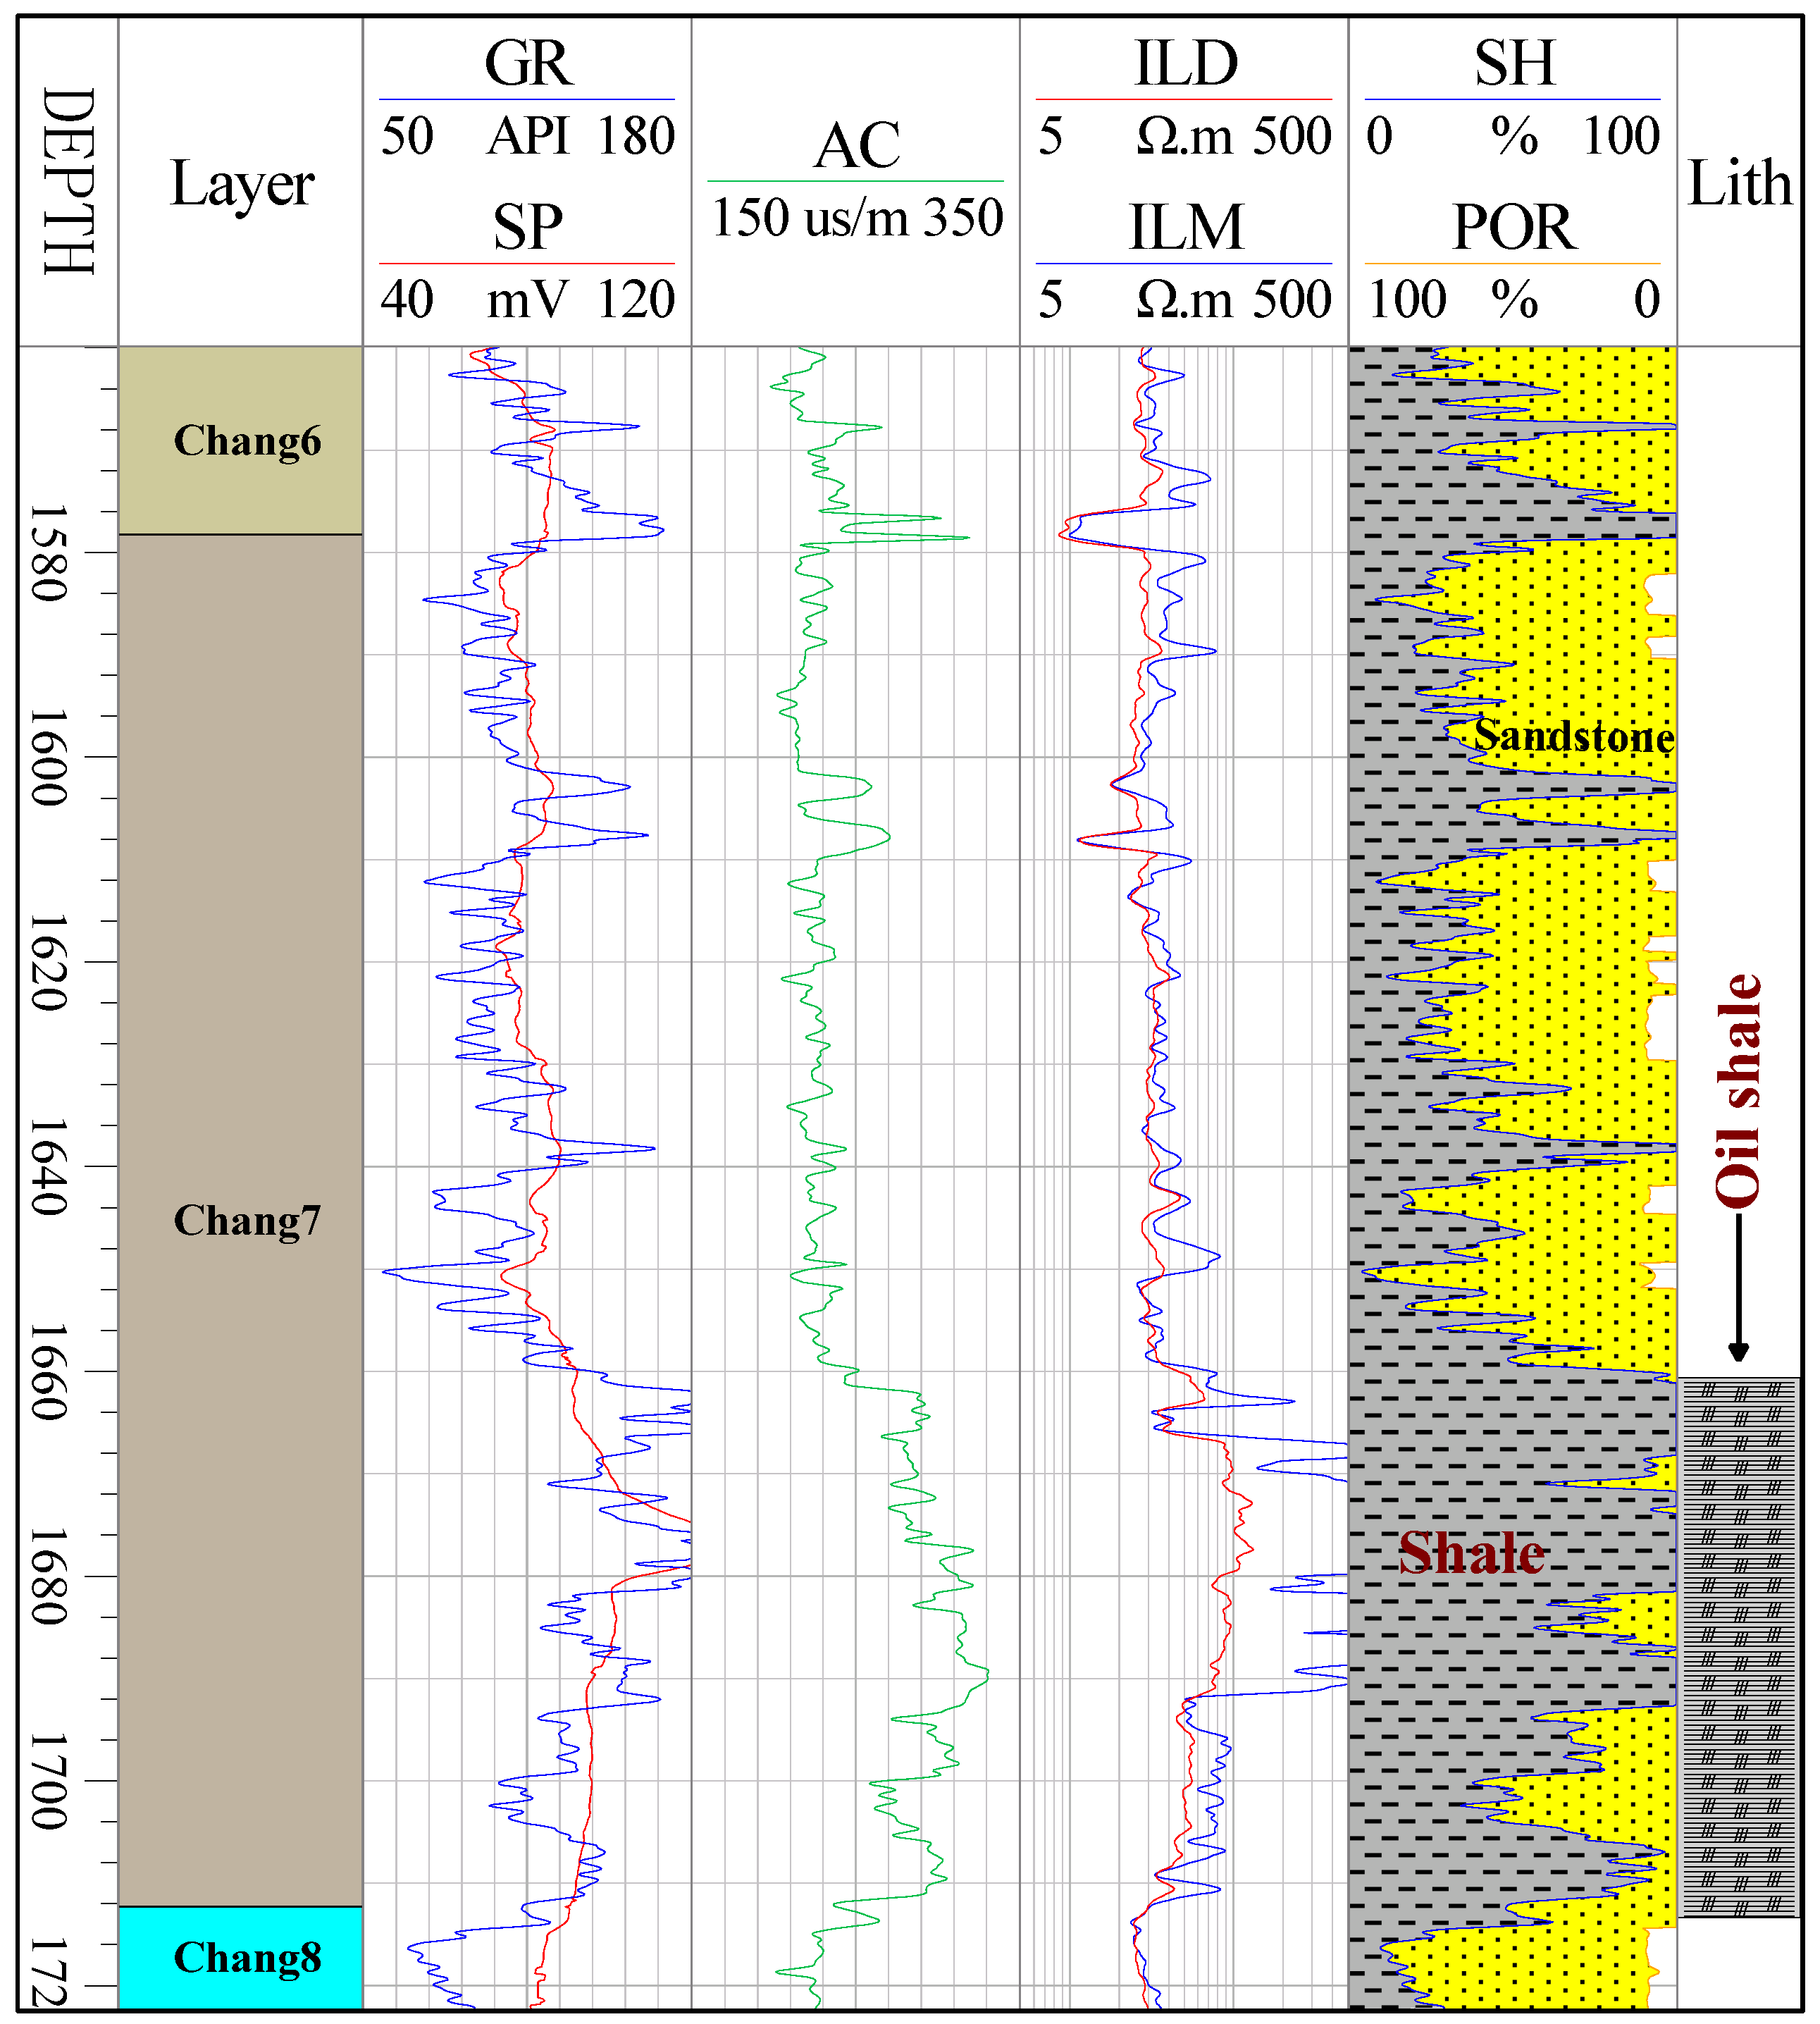
Considering the geological characteristics of the study area, both the Chang 7 and Chang 9 shale layers within the Yanchang Formation exhibit relatively robust development. The thickness of the Chang 7 source rock varies from 15 to 50 m. Taking Well LP168 as an illustrative case (
Figure 10), the shale thickness in the Chang 7 Member of the Yanchang Formation can attain a maximum of 43 m, thereby providing a substantial material foundation for shale gas formation.
5.2. Influence of TOC and Pressure on Adsorbed Gas Content
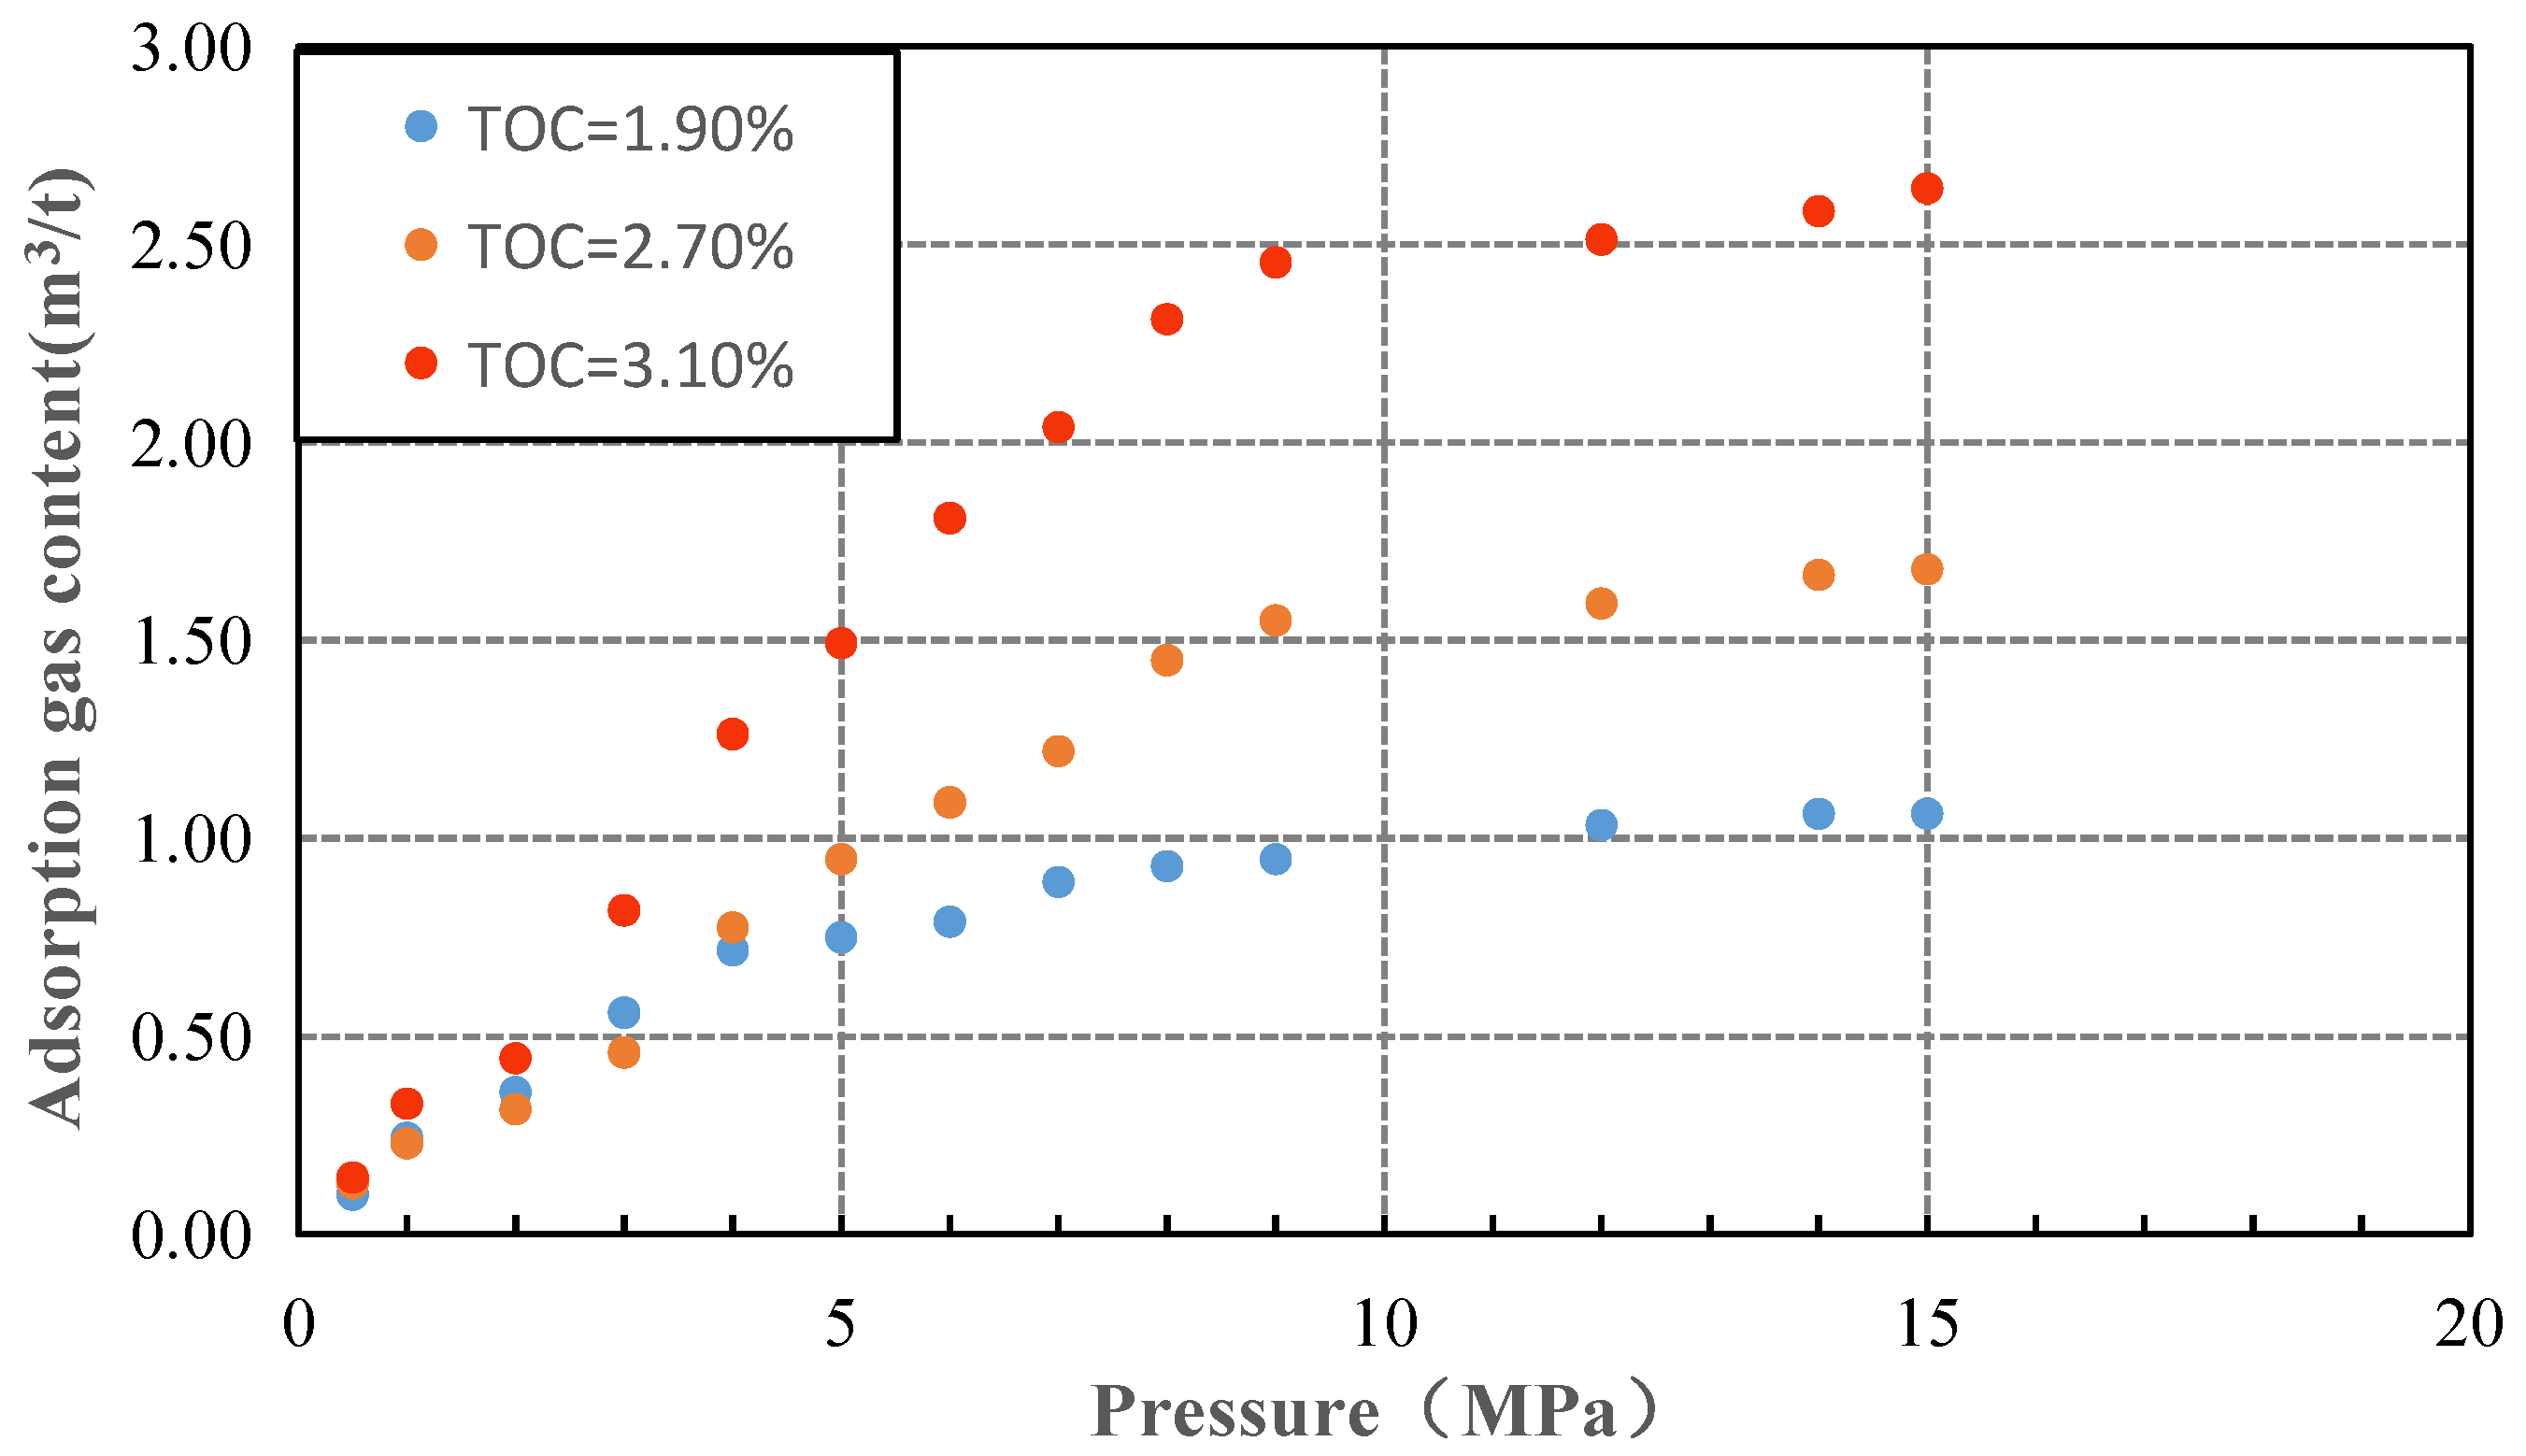
Organic carbon content plays an important role in shale pore space and gas adsorption capacity. Under the same temperature and pressure conditions, shale with high organic matter content has larger pore space and specific surface area, which can absorb more gas. The cross plot of total organic carbon (TOC) content and adsorbed gas content of shale in the Chang 7 section of the research area shows that there is a positive correlation between total organic carbon (TOC) content and adsorbed gas content (
Figure 11).
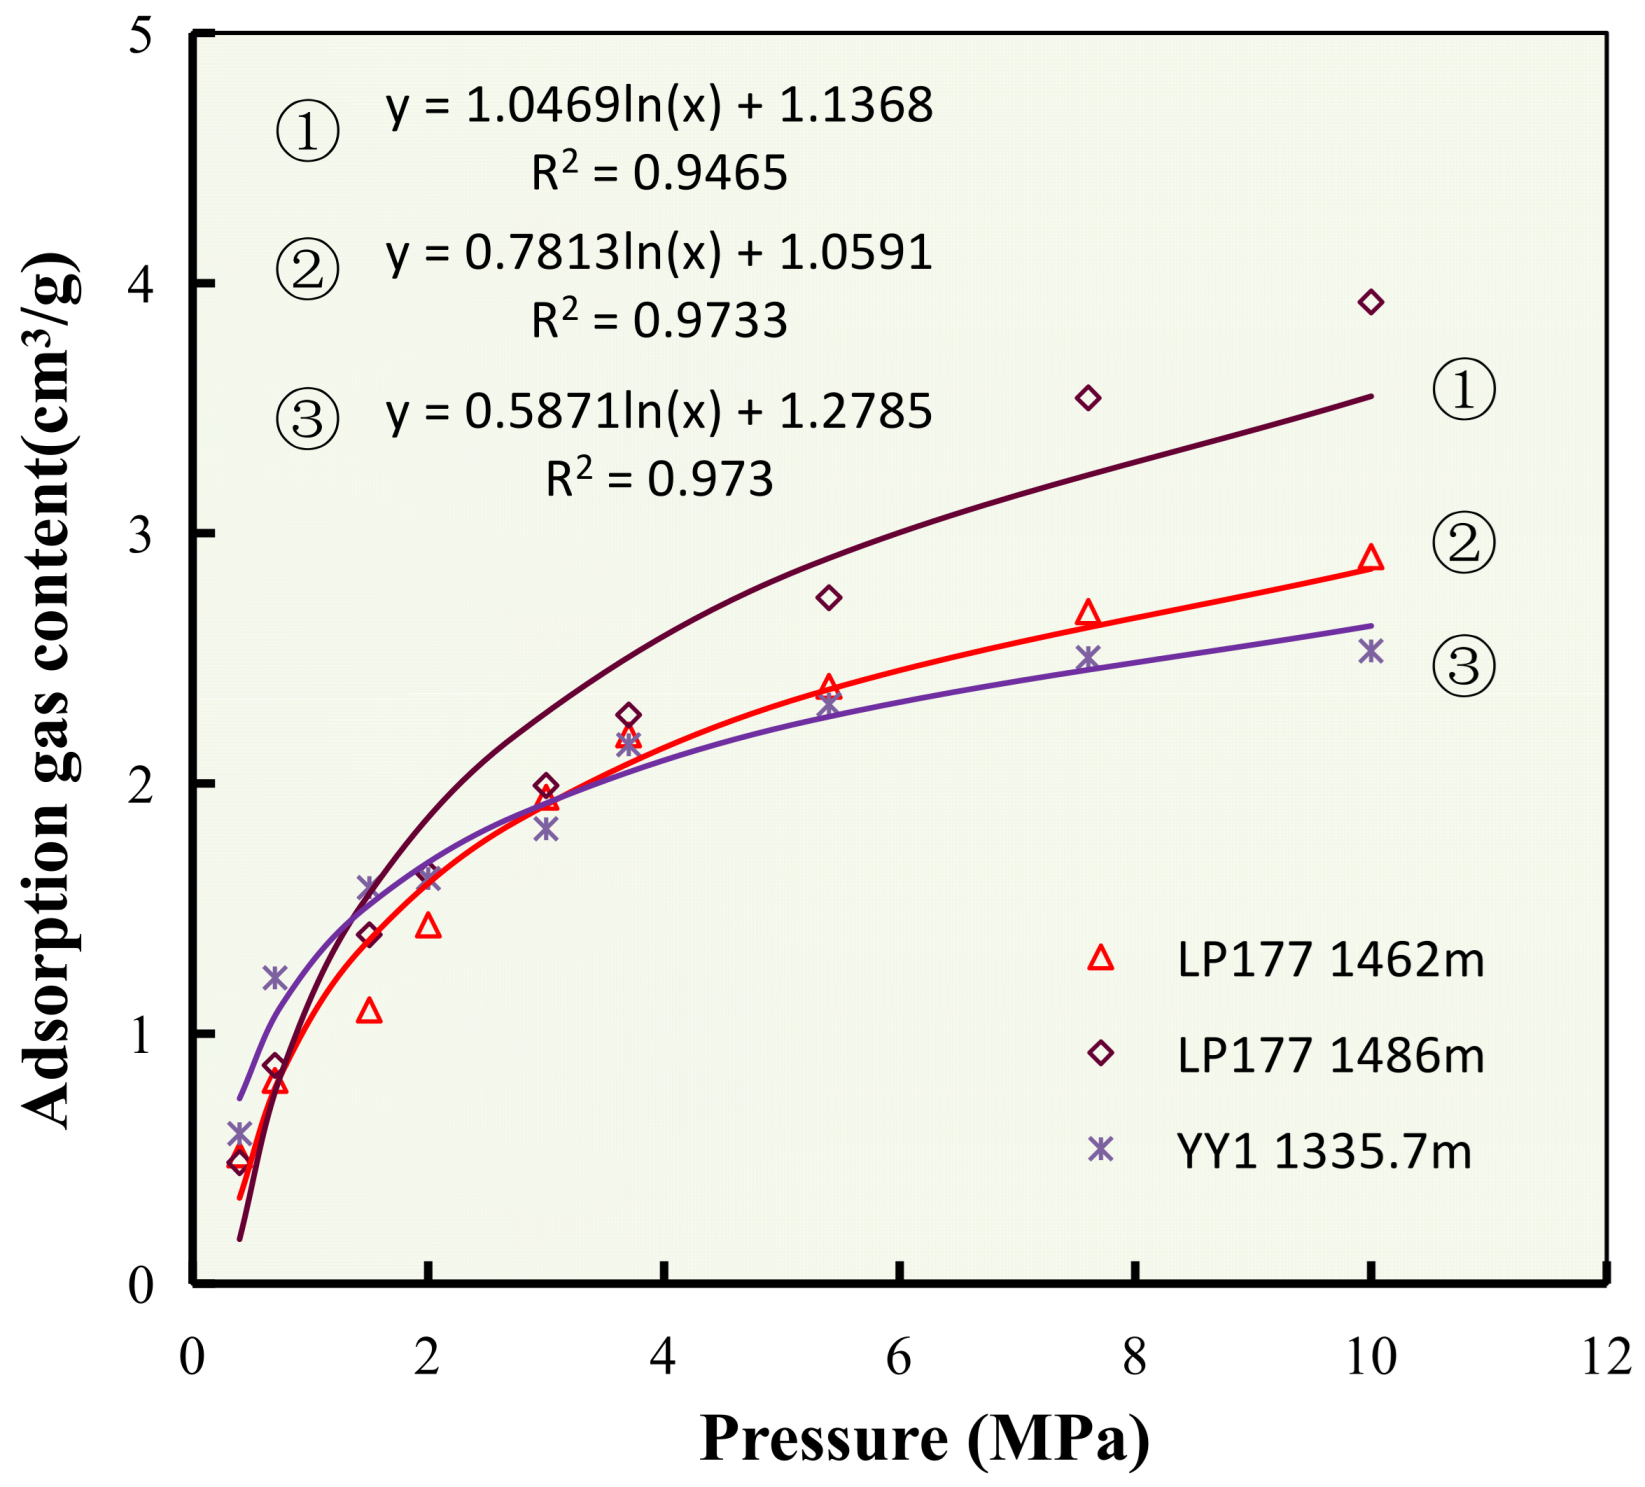
The experimental results of six samples in Wells LP177 and YY1 showed that the gas content of adsorbed gas in shale reservoirs was logarithmic with the expression y = a × ln(x) + b, where a and b were the coefficients, x was the formation pressure, y was the gas content of adsorbed gas, and the correlation coefficient (R
2) was more than 0.95 (
Figure 12).
5.3. Influence of Organic Matter Maturity on Adsorbed Gas Content
Shale must reach a certain maturity to generate shale gas, and the adsorption capacity of shale increases with the increase in maturity. According to the statistics of the vitrinite reflectance (R
o) value of shale in the study area, statistical analysis of vitrinite reflectance (R
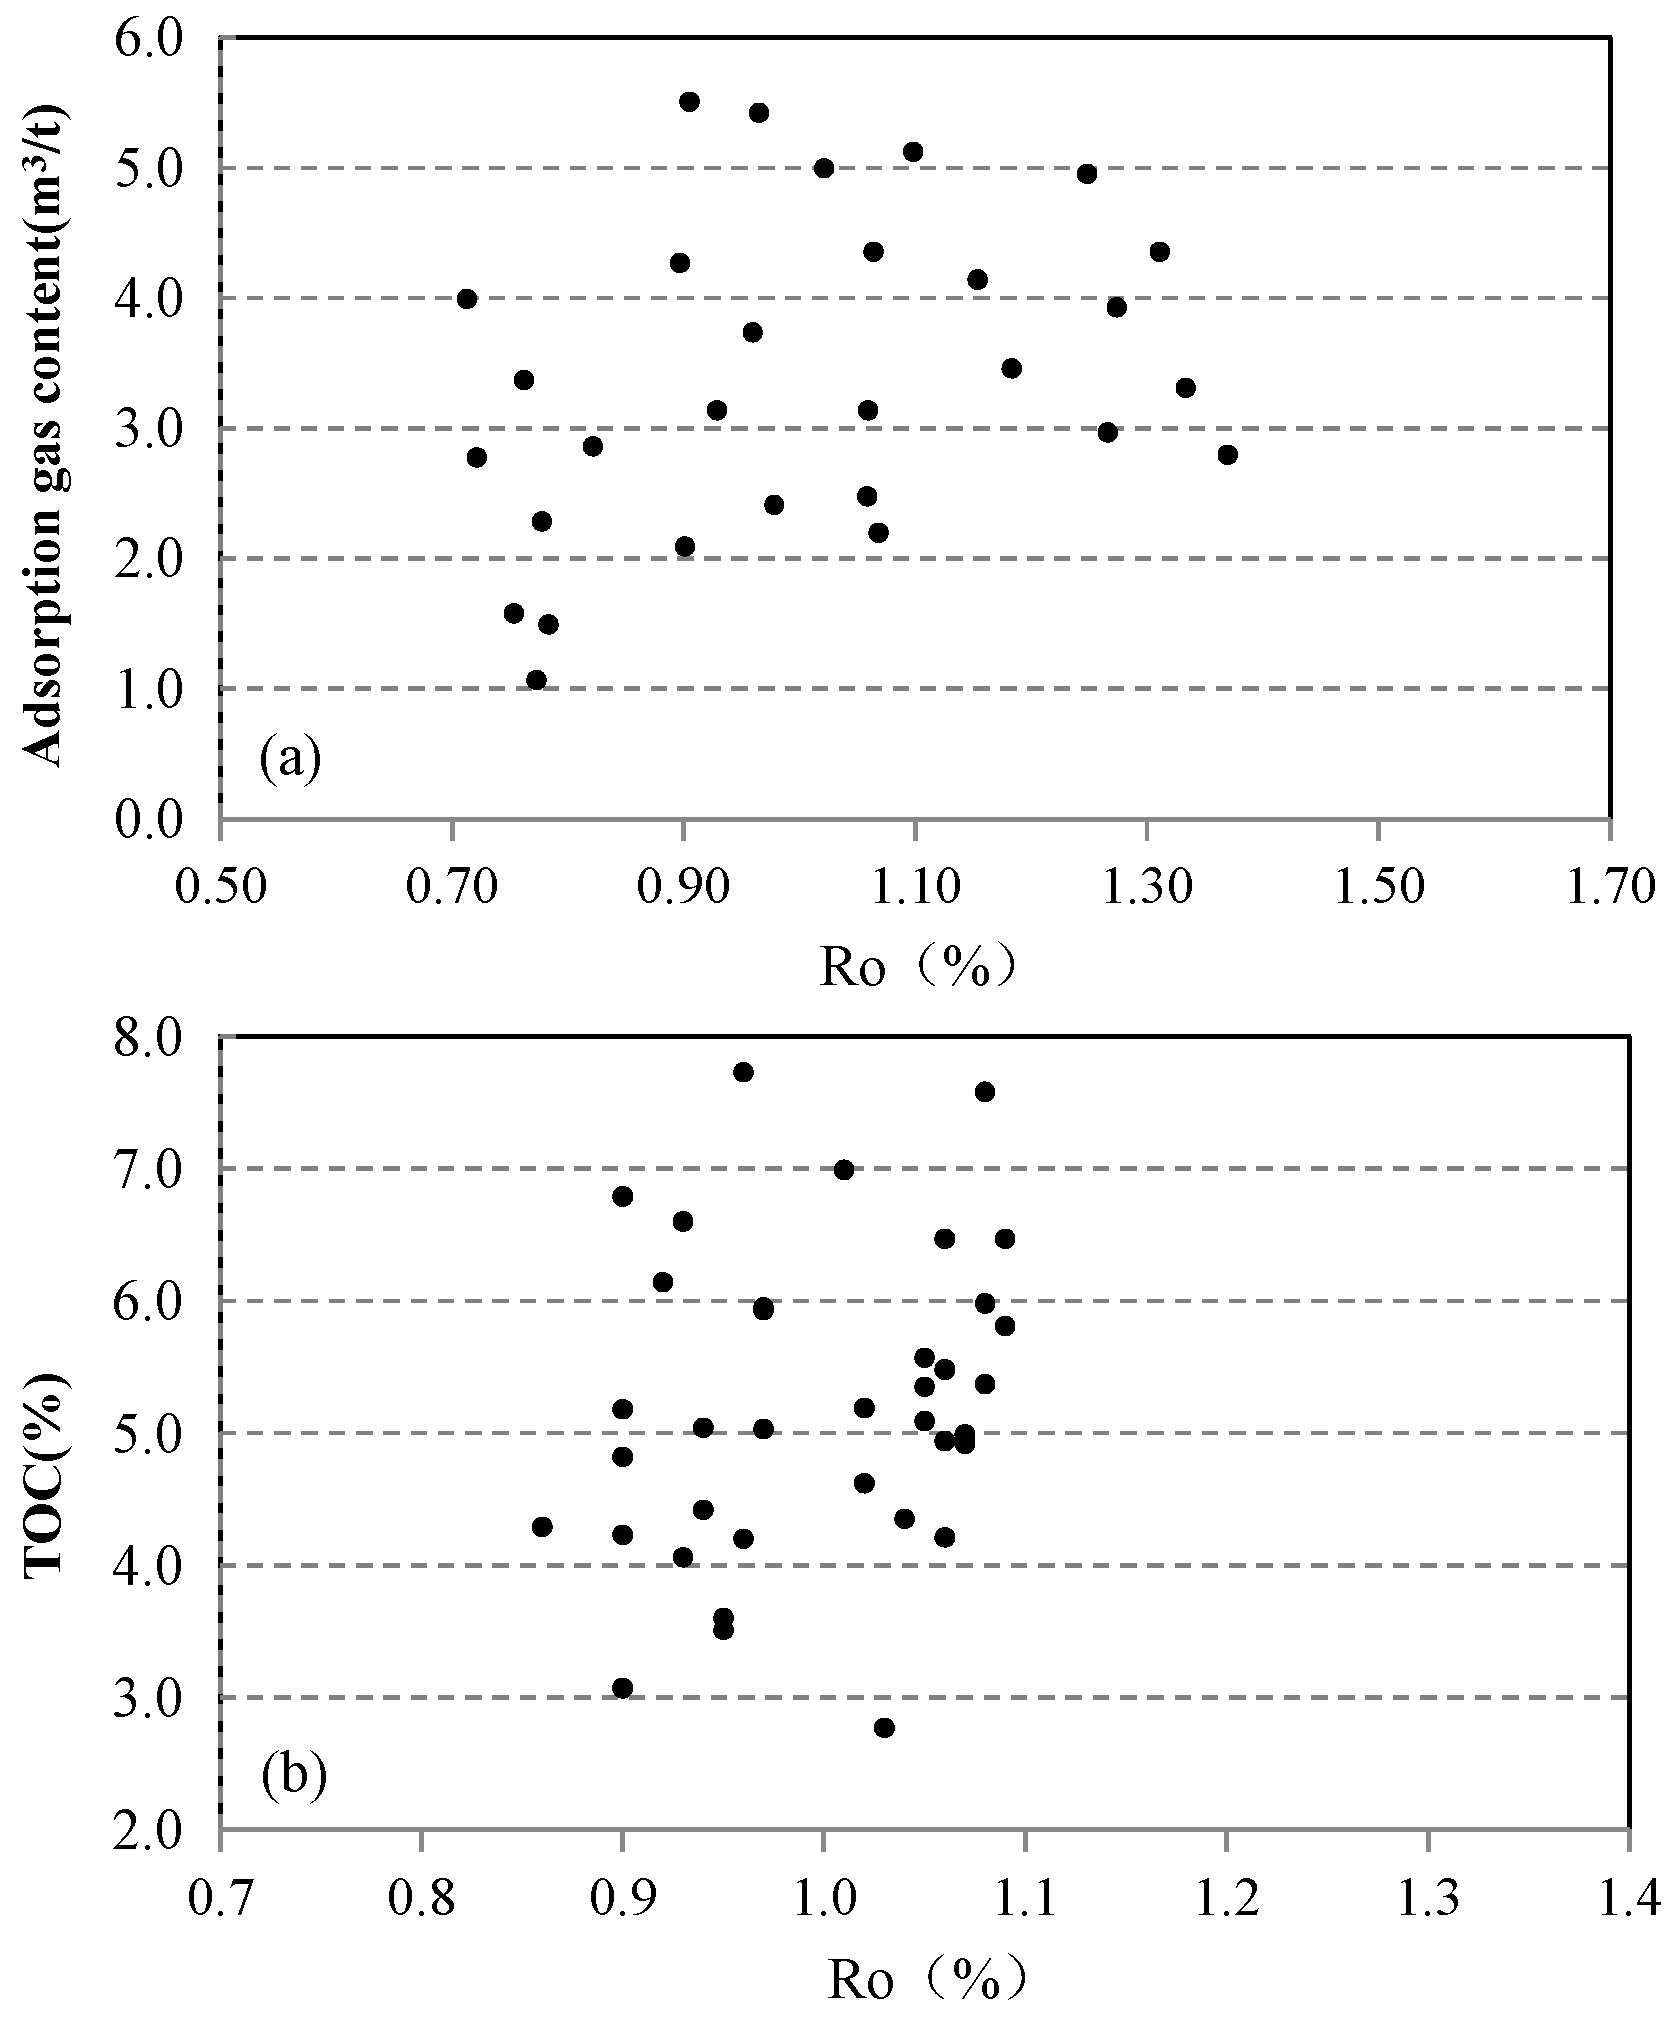
o) in shale samples indicates no significant correlation between Ro and adsorbed gas content, nor between R
o and total organic carbon (TOC) content (
Figure 13).
The reason for the lack of correlation between Ro and TOC is that Ro only reflects the thermal maturity of organic matter, while TOC and adsorbed gas content are jointly controlled by multiple factors such as the maturity of source rocks, original sedimentation, mineral composition, pore structure, temperature, and pressure conditions. Maturity is not the sole or dominant controlling variable. TOC is primarily controlled by paleoproductivity, redox conditions, and sedimentation rate during deposition, determining the input and preservation of original organic matter. Ro is controlled by burial history, geothermal gradient, and heat flow, reflecting the degree of thermal alteration of organic matter. During the hydrocarbon generation process, kerogen undergoes thermal degradation to produce oil and gas, and TOC decreases as maturity increases (carbon is expelled in the form of hydrocarbons). However, the extent of TOC decrease is influenced by the type of original organic matter, hydrocarbon generation efficiency, and hydrocarbon expulsion efficiency: type I/II kerogens (marine/lacustrine) have strong hydrocarbon generation capacity, resulting in a significant decrease in TOC; type III kerogens (continental coal measures) have weak hydrocarbon generation capacity, leading to a limited decrease in TOC. Therefore, when Ro increases, TOC may decrease linearly, slowly, or remain essentially unchanged, with no unified pattern.
The reason for the lack of correlation between Ro and adsorbed gas content is that Ro exerts a nonlinear influence indirectly through its effect on pore structure. However, the adsorbed gas content is more strongly influenced by factors such as TOC, minerals, temperature, pressure, and water content, often masking the Ro effect and resulting in no significant overall correlation.
5.4. Influence of Temperature and Pressure on Adsorbed Gas Content
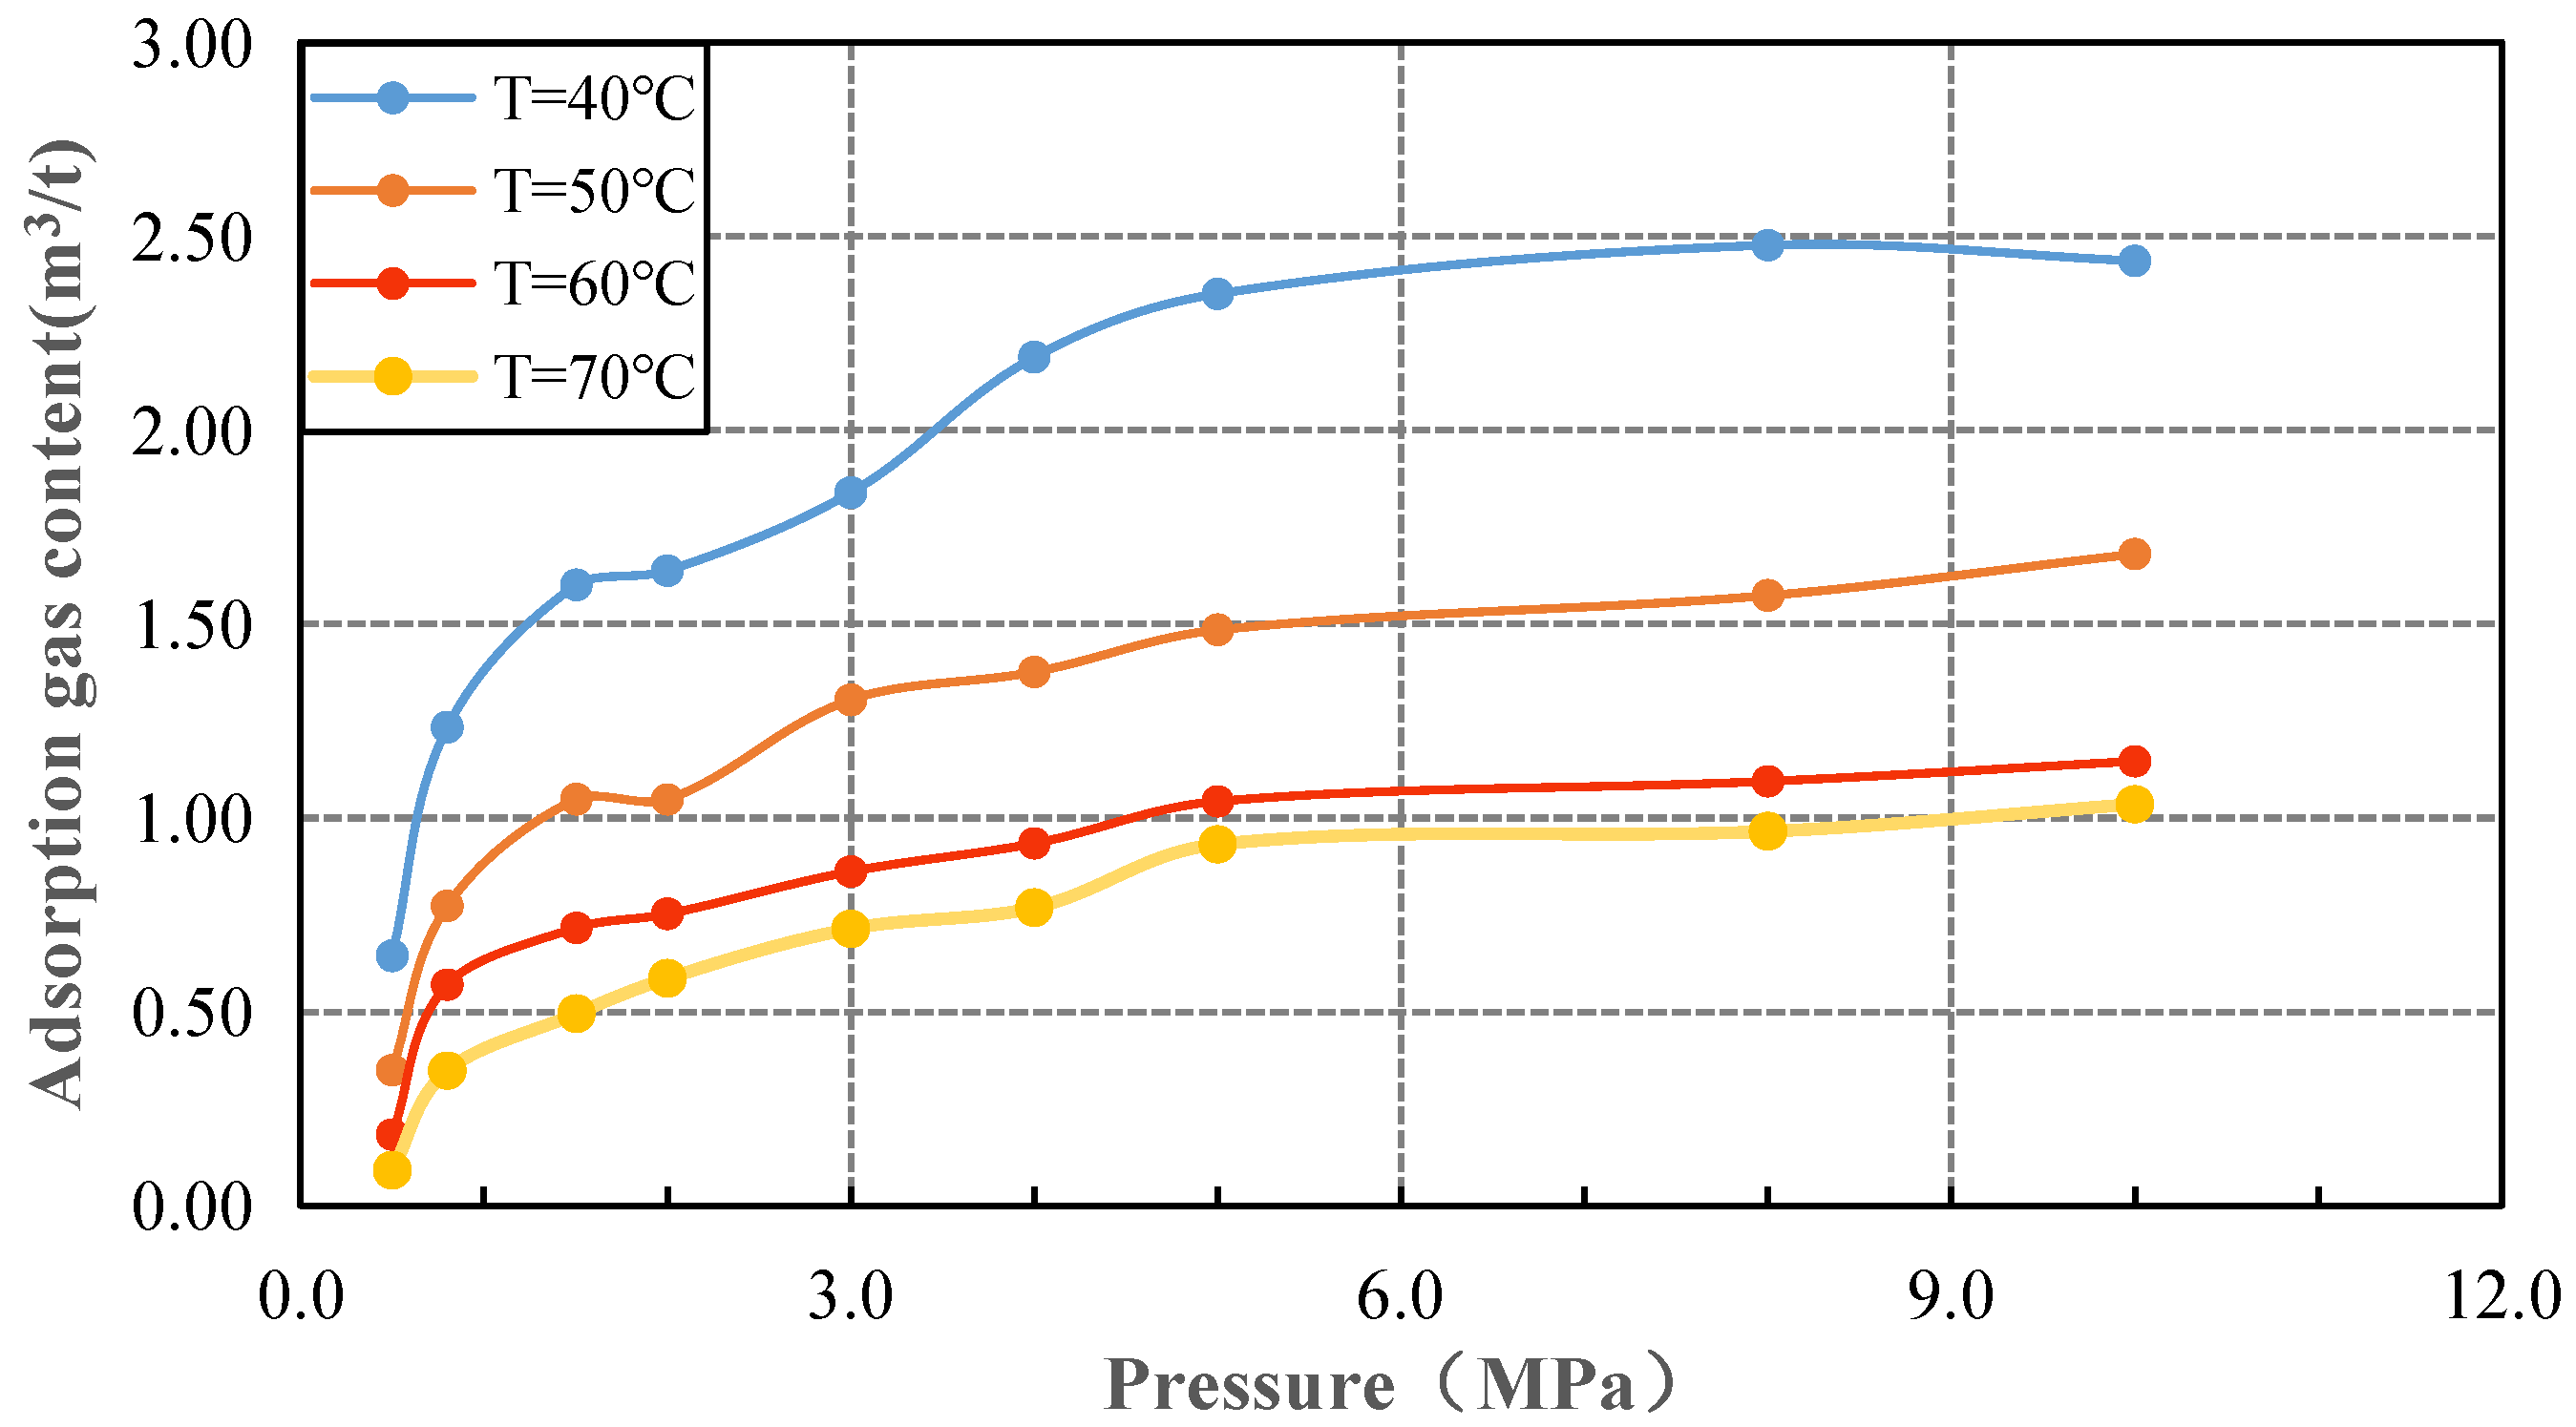
Gas adsorption is an exothermic process, and the increase in temperature will reduce the adsorption capacity of shale. In the case of similar organic carbon content, the adsorption capacity of shale decreases with the increase in temperature and a certain pressure (
Figure 14). When the temperature and TOC content are constant, the adsorption capacity gradually increases when the pressure gradually increases (
Figure 11). The overall results show that at a certain temperature, the greater the pressure in the shale formation, the greater the adsorption capacity of shale, but when the pressure increases to a certain extent, the adsorption capacity basically does not increase.
5.5. Influence of Clay Minerals on Adsorbed Gas Content
Clay minerals in shale also have a great influence on shale gas adsorption ability, and it is generally believed that the adsorption gas content is positively related to the clay minerals content; this shale gas adsorption ability is mainly seen with illite/smectite and illite, where the illite/smectite and illite usually have a larger pore volume, and relative to other clay minerals the illite/smectite and illite have a very large specific surface area, and as the content of clay minerals in shale increases the shale gas adsorption ability increases.
5.6. Influence of Porosity and Permeability on Adsorbed Gas Content
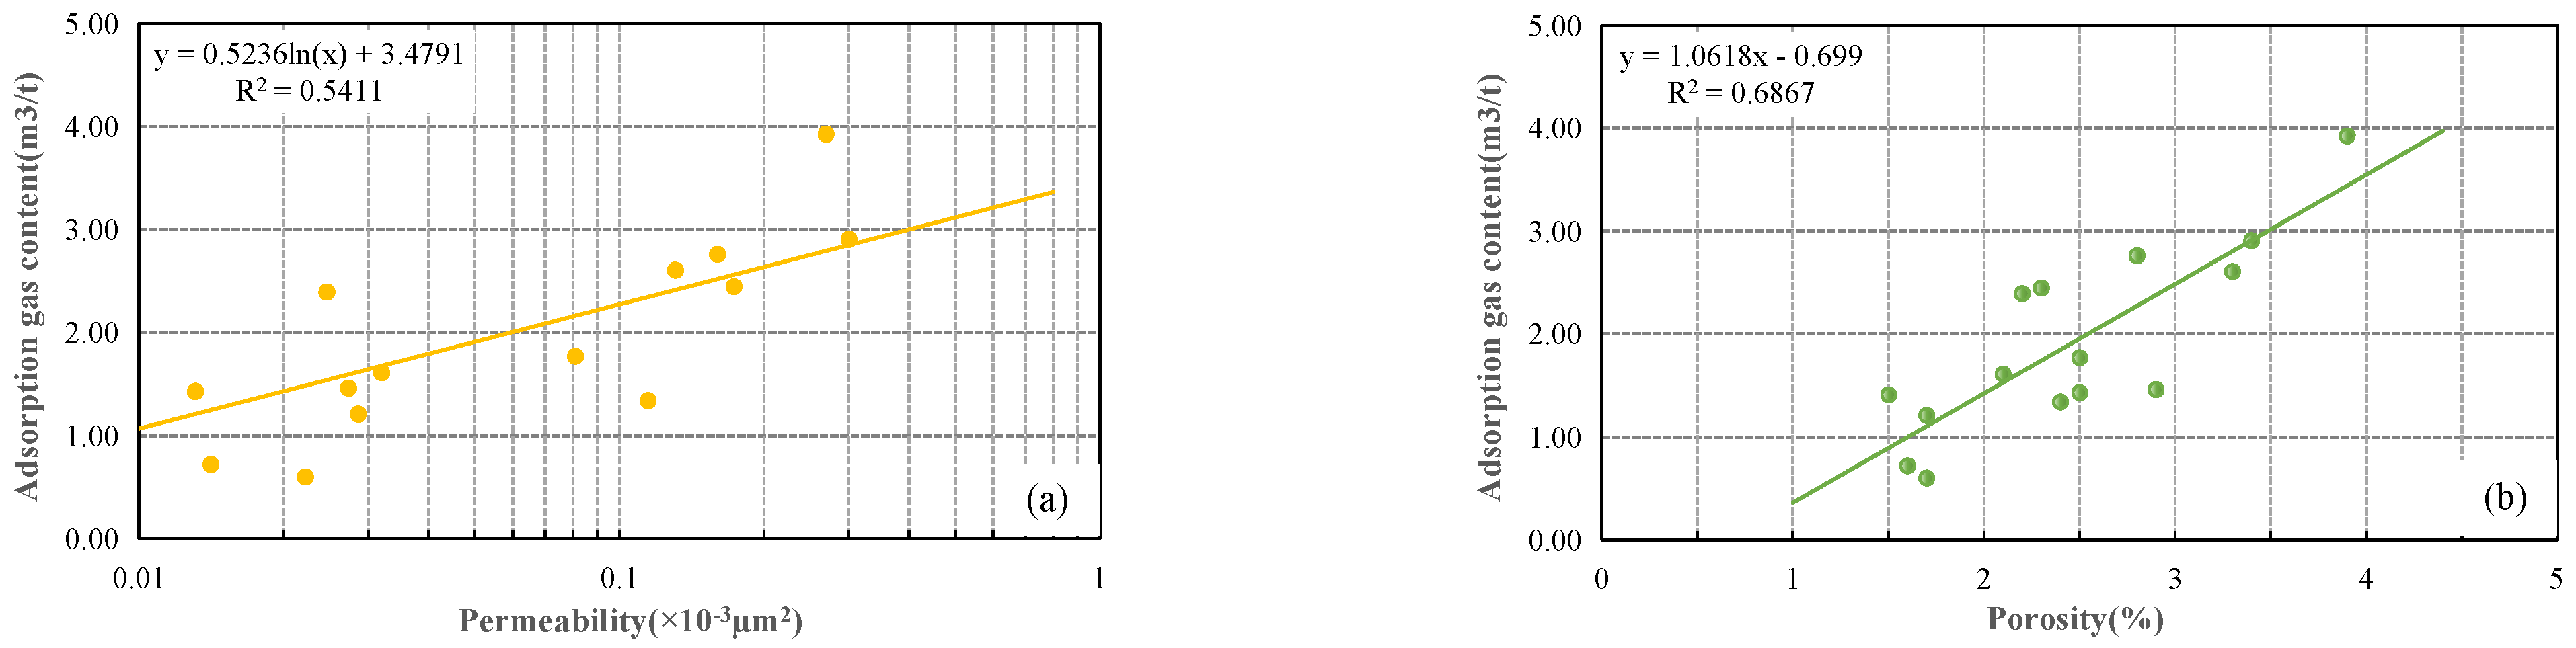
When the porosity is low and the permeability is high, the content of adsorbed gas is relatively high. When small pores predominate in the shale reservoir, the content of adsorbed gas is relatively high. Conversely, when macropores are more prevalent, the content of free gas is higher. When the porosity and permeability are low, the adsorbed gas content is low (
Figure 15).
6. Discussion
The direct desorption method and the indirect method were used to calculate the gas content of shale in the Chang 7 Mmember of Well LP171, and the relationship between shale composition, TOC, physical properties, pressure, temperature, and gas content were analyzed. The main controlling factors of gas content in the Chang 7 shale in the Yanchang Formation were determined. The research shows that the shale gas content in the Yanchang formation is mainly adsorption gas, and the gas content in the Chang 7 shale is 3.71–6.26 m3/t, the free gas percentage is 22.53%–35.29%, and the average is 29.22%. With the increase in organic carbon content, the adsorption ratio of natural gas increases and the adsorption capacity of shale also increases. Meanwhile, the improvement of organic matter maturity promotes the generation of nanoscale pores of organic components, thus increasing the storage space of shale gas. Therefore, organic carbon content is positively correlated with gas content. There is a negative correlation between quartz content and shale gas content. There is a weak positive correlation between clay mineral content and gas content, which is mainly manifested in the adsorption capacity of illite/smectite and illite for shale gas. There is no significant correlation between gas content and micropore volume, but there is a positive correlation between gas content and medium-to-large pores.
Total organic carbon (TOC) constitutes the fundamental material basis for governing the adsorbed gas content in shale, with the two demonstrating a notably positive correlation overall. From a sedimentary standpoint, shale with high TOC content predominantly forms in anoxic and reducing depositional settings, marked by an ample supply of primary organic matter and favorable preservation conditions, thereby laying the groundwork for hydrocarbon generation and adsorption. Upon microscopic analysis of the occurrence mechanisms, the kerogen types of organic matter in the study area are mainly type II and type III, which feature extensive specific surface areas and strong adsorption capacities, acting as the principal carriers for the preferential adsorption of methane molecules. Concurrently, during the thermal evolution and hydrocarbon generation processes, organic matter produces a significant quantity of nanoscale organic micropores, directly augmenting the storage capacity for adsorbed gas.
Clay minerals serve as significant auxiliary contributors to the adsorption of gas, exhibiting a weak positive correlation with the content of adsorbed gas. Common clay minerals, including illite and mixed-layer illite–smectite, are characterized by abundant interlayer pores, and their mechanisms for gas control are predicated on the microstructural properties of layered silicate minerals. Nevertheless, the adsorption capacity of clay minerals is considerably inferior to that of organic matter and is notably influenced by the water saturation within the formation. Formation water tends to occupy the interlayer and surface adsorption sites of clay minerals, substantially impeding methane adsorption efficiency and diminishing their gas control efficacy. Furthermore, shale with high clay content often undergoes enhanced compaction and a reduction in intergranular pores. While this can elevate the proportion of adsorbed gas, it concurrently diminishes the reservoir’s percolation capacity and the available space for free gas storage, thereby underscoring the dual impact of mineral composition on the shale gas reservoir system.
As a brittle mineral, quartz exhibits no direct capacity for gas adsorption and makes no contribution to adsorbed gas accumulation. No significant correlation has been observed between quartz content and adsorbed gas abundance. This is attributed to quartz’s inherently low surface energy, lack of interlayer pores, and absence of active adsorption sites (e.g., unsaturated bonds or lattice defects), which prevent it from retaining methane molecules and thus exclude it from the process of adsorbed gas occurrence.
Liu et al. (2025) [
38] conducted a study on the microscopic pore structure of the Longmaxi Formation shale in the Sichuan Basin, revealing that the pore volume of the shale is mainly contributed by micropores, followed by macropores, with mesopores making the least contribution. Macropores, as the primary channels for shale gas migration and the core contributors to permeability, are of significant importance for the exploration and development of deep shale gas. On the one hand, an increase in the proportion of macropores can significantly enhance the production efficiency of shale gas; on the other hand, macropores can serve as “natural extension points” for hydraulic fracturing fractures, reducing the difficulty of stimulation and increasing the complexity of the fracture network. These characteristics may be one of the key reasons why the productivity of deep shale gas is significantly higher than that of shallow gas, providing crucial microscopic pore-scale evidence for the efficient development of deep shale gas.
Yang et al. (2025) [
39] also found that the microscopic pore structure of the Chang 7 shale in the Yan’an area of the Ordos Basin is complex, with various pore types such as closed pores, semi-closed pores, “ink bottle” pores, and open pores. This is related to the porosity and maturity of the shale. This complexity is correlated with the shale’s porosity and thermal maturity: the Yan’an-area shale exhibits relatively high overall maturity, falling within the mature to highly mature stage. As maturity increases, pores gradually evolve toward a rounded morphology, and the complexity of the pore structure decreases progressively. Additionally, in the Chang 7 Member shale of the Yanchang Formation, smaller nanoscale pores serve as the primary storage space for adsorbed gas, whereas larger microscale fractures function mainly as storage reservoirs for free gas and seepage channels.
Zeng et al. (2024) [
40] employed a combination of N
2 adsorption and high-pressure mercury intrusion porosimetry (MIP) to characterize the pore size distribution of the Chang 7 Member shale in the Yijun area of the Ordos Basin. The results revealed that the pore system of the Chang 7 Member shale is dominated by mesopores (5–50 nm) and macropores (77–150 nm and 280–700 nm).
Pore structure serves as the direct geological medium governing the occurrence of adsorbed gas, with nanoscale micropores (<2 nm) functioning as the primary storage space for adsorbed gas. The extent of micropore development directly dictates the actual adsorbed gas content, while pore structure characteristics represent the integrated outcome of the synergistic effects of total organic carbon (TOC), mineral composition, and thermal evolution. With a molecular diameter of approximately 0.38 nm, methane molecules can only be accommodated within micropores due to their matching adsorption space. The volume and specific surface area of micropores directly correlate with the adsorbed gas capacity, whereas mesopores and macropores primarily host free gas and make negligible contributions to adsorbed gas storage.
Quartz content ranges from 10.6% to 29.7%, generally ranging from 13.0% to 25.0%, with an average of 17.6%, which is lower than that of the Barnett marine shale in North America and the Cambrian-Silurian marine shale in southern China (44% to 49%). Compared with marine shale in North America, the overall quartz content of the Chang 7 section is relatively low, while the content of feldspar and clay minerals is relatively high. The low quartz content results in a lower brittleness index of the Chang 7 shale, making the hydraulic fracturing development process more difficult.
The maximum porosity of typical marine gas-bearing shale in the United States is 14%. The total matrix porosity of the Woodford shale in the Arkoma Basin is 6.51%, and the effective porosity is 4.22%. The porosity of the Antrim shale in the Michigan Basin is 5%–6%, and in other basins, it is generally higher than 4%. The average porosity of the Chang 7 shale reservoir in the study area is 2.8%, and the average permeability is 0.1625 × 10⁻³ μm2, indicating that the physical properties of the Chang 7 continental shale in this area are poor, and the free gas storage conditions are relatively poor. The shale gas production is closely related to the adsorbed gas content. This study can provide a methodological basis for the subsequent evaluation of the gas-bearing properties of the Chang 7 Member of the Yanchang Formation in the Ordos Basin.
7. Conclusions
(1) The content of quartz in the Yanchang Formation in the Xiasiwan area is low, and the content of feldspar and clay minerals is high. Kerogen maceral is composed primarily of the sapropel group, with a content of 77.2%–94.9%, and the kerogen types are I and II1, mainly II1; vitellinite reflectance Ro is 0.80%–1.13%, the average value is 1.02%, and the maximum pyrolysis temperature is 449–460 °C. The shale organic matters are in the mature stage and have good conditions for shale gas.
(2) The shale pores in the Chang 7 Formation are mainly intergranular pores, granular dissolved pores, and organic matter pores, with an average porosity of 2.8% and an average value of 0.1625 × 10⁻³ μm2, which are typical reservoirs with low porosity and permeability.
(3) The gas content of shale reservoirs in the Chang 7 Formation is mainly controlled by temperature, pressure, TOC content, vitrinite reflectance (Ro), reservoir physical properties, and other factors. Among them, medium-to-large pores, TOC content, and pressure are all significantly positively correlated with the gas content, and are the main controlling factors of shale gas content. There is a weak positive correlation between clay mineral content and gas content, which is a secondary control factor of shale gas content. There is a negative correlation between quartz content and shale gas content. Vitrinite reflectance (Ro) in shale samples indicates no significant correlation between Ro and adsorbed gas content.