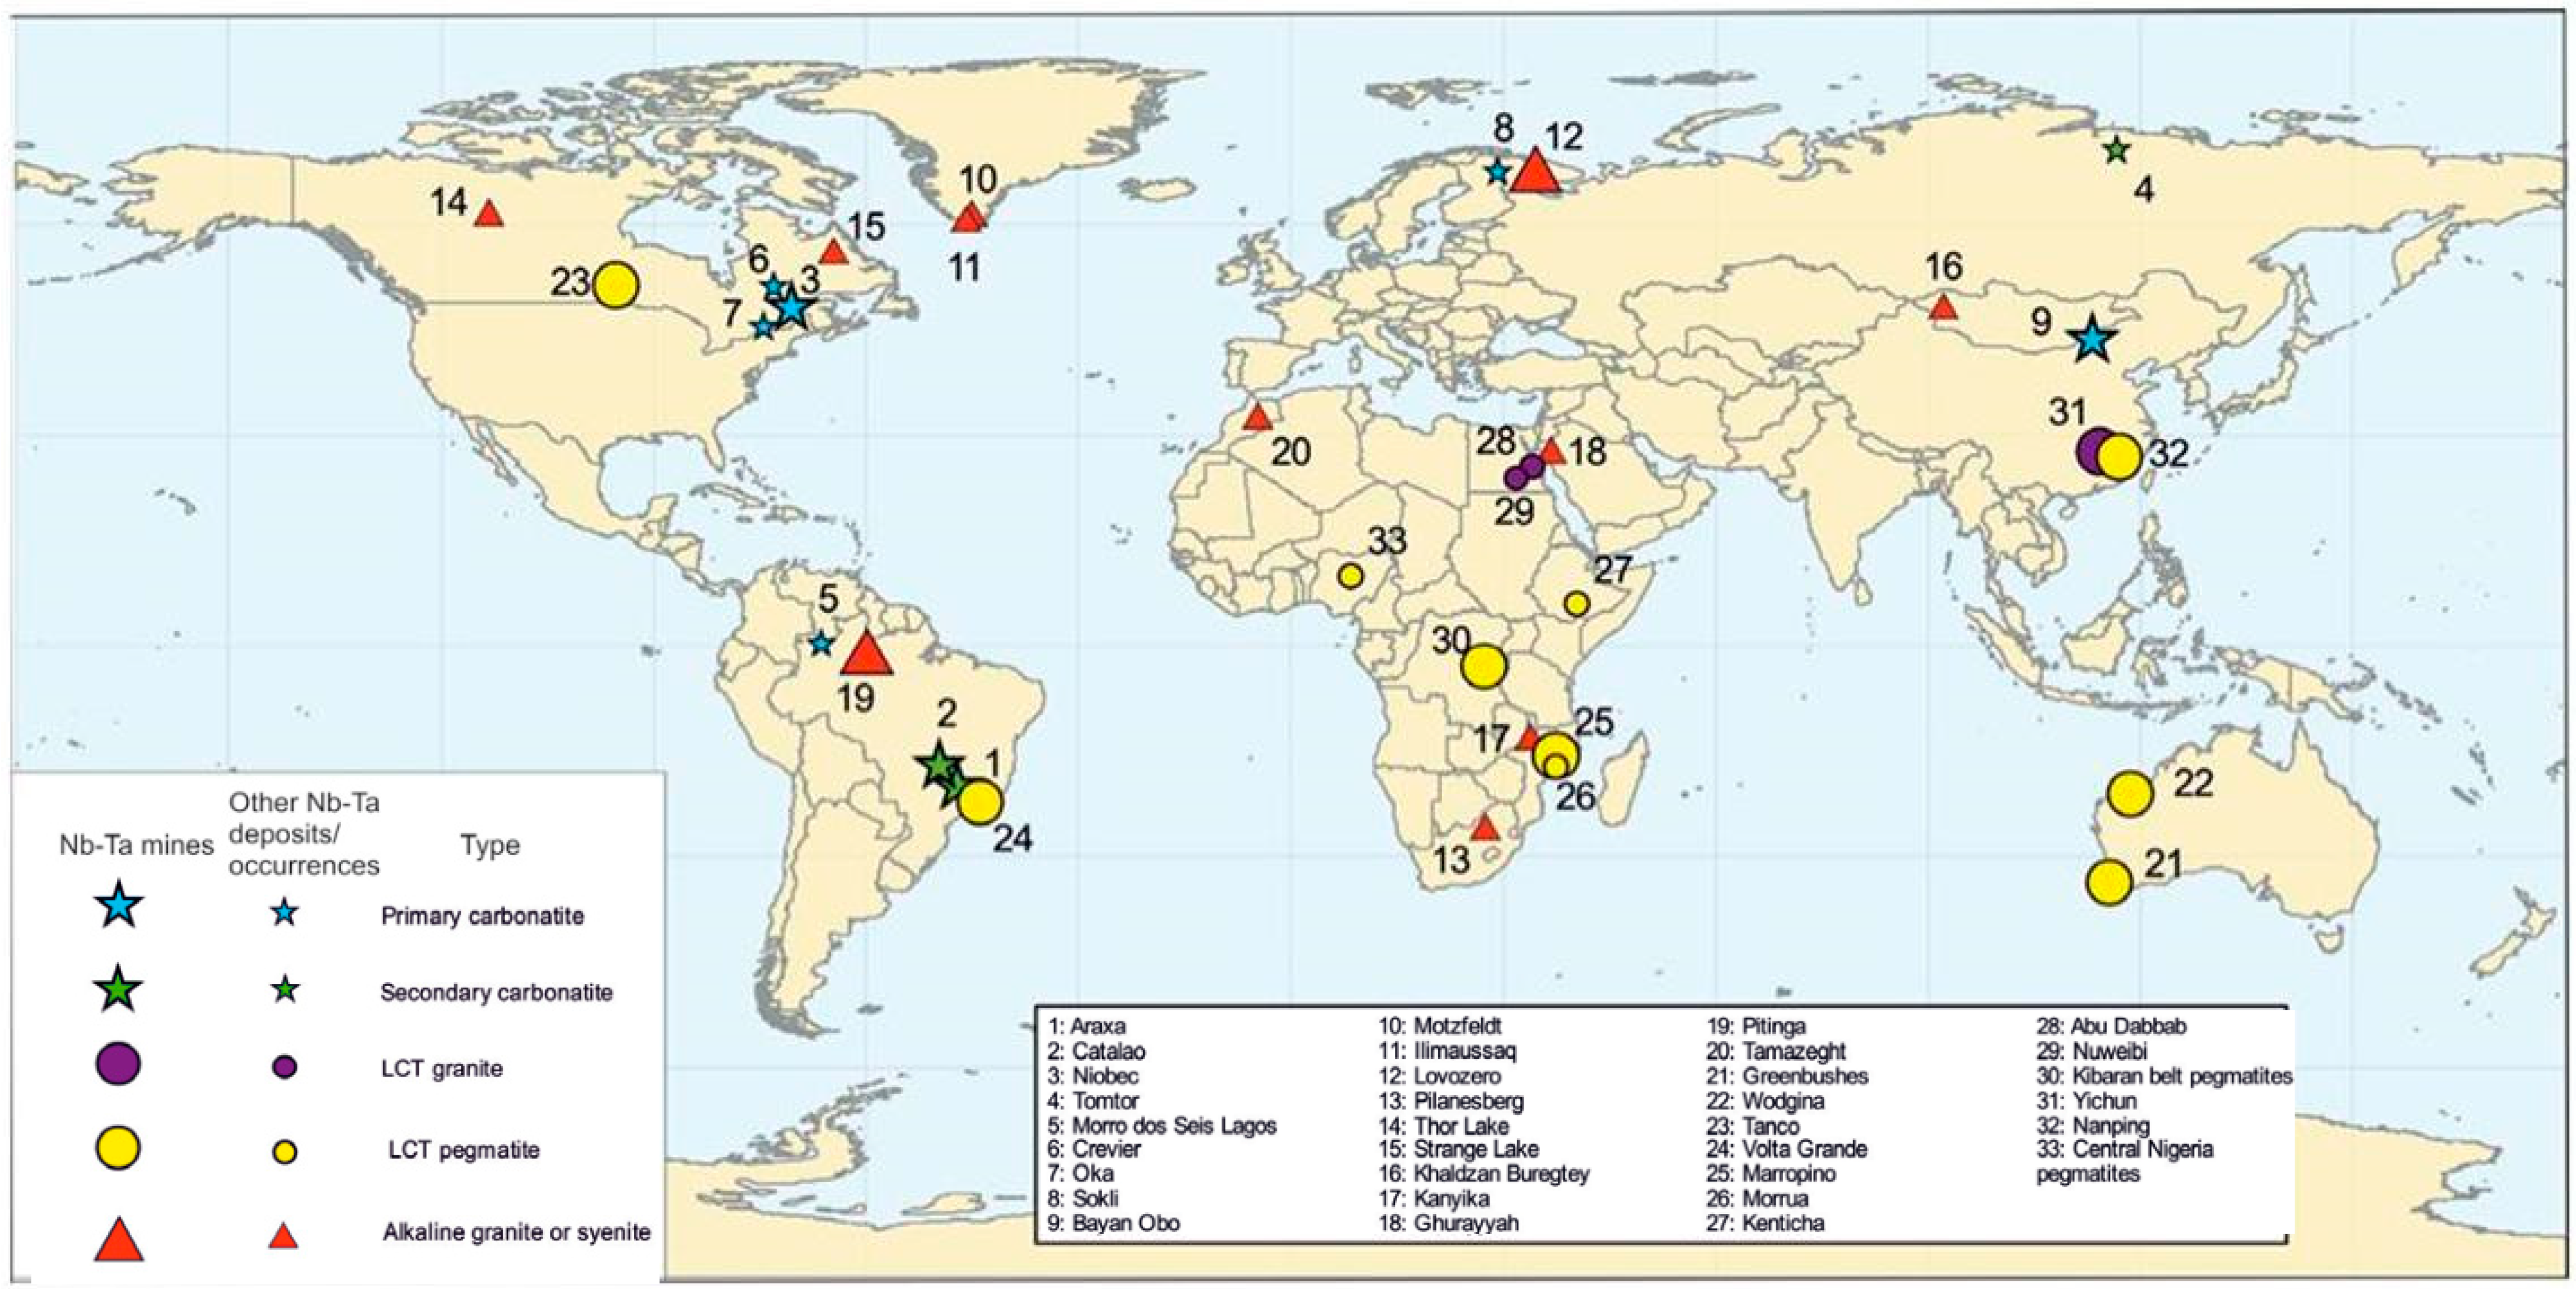
Figure 1.
Distribution of various types of Nb-Ta deposits worldwide [
13].
Figure 1.
Distribution of various types of Nb-Ta deposits worldwide [
13].
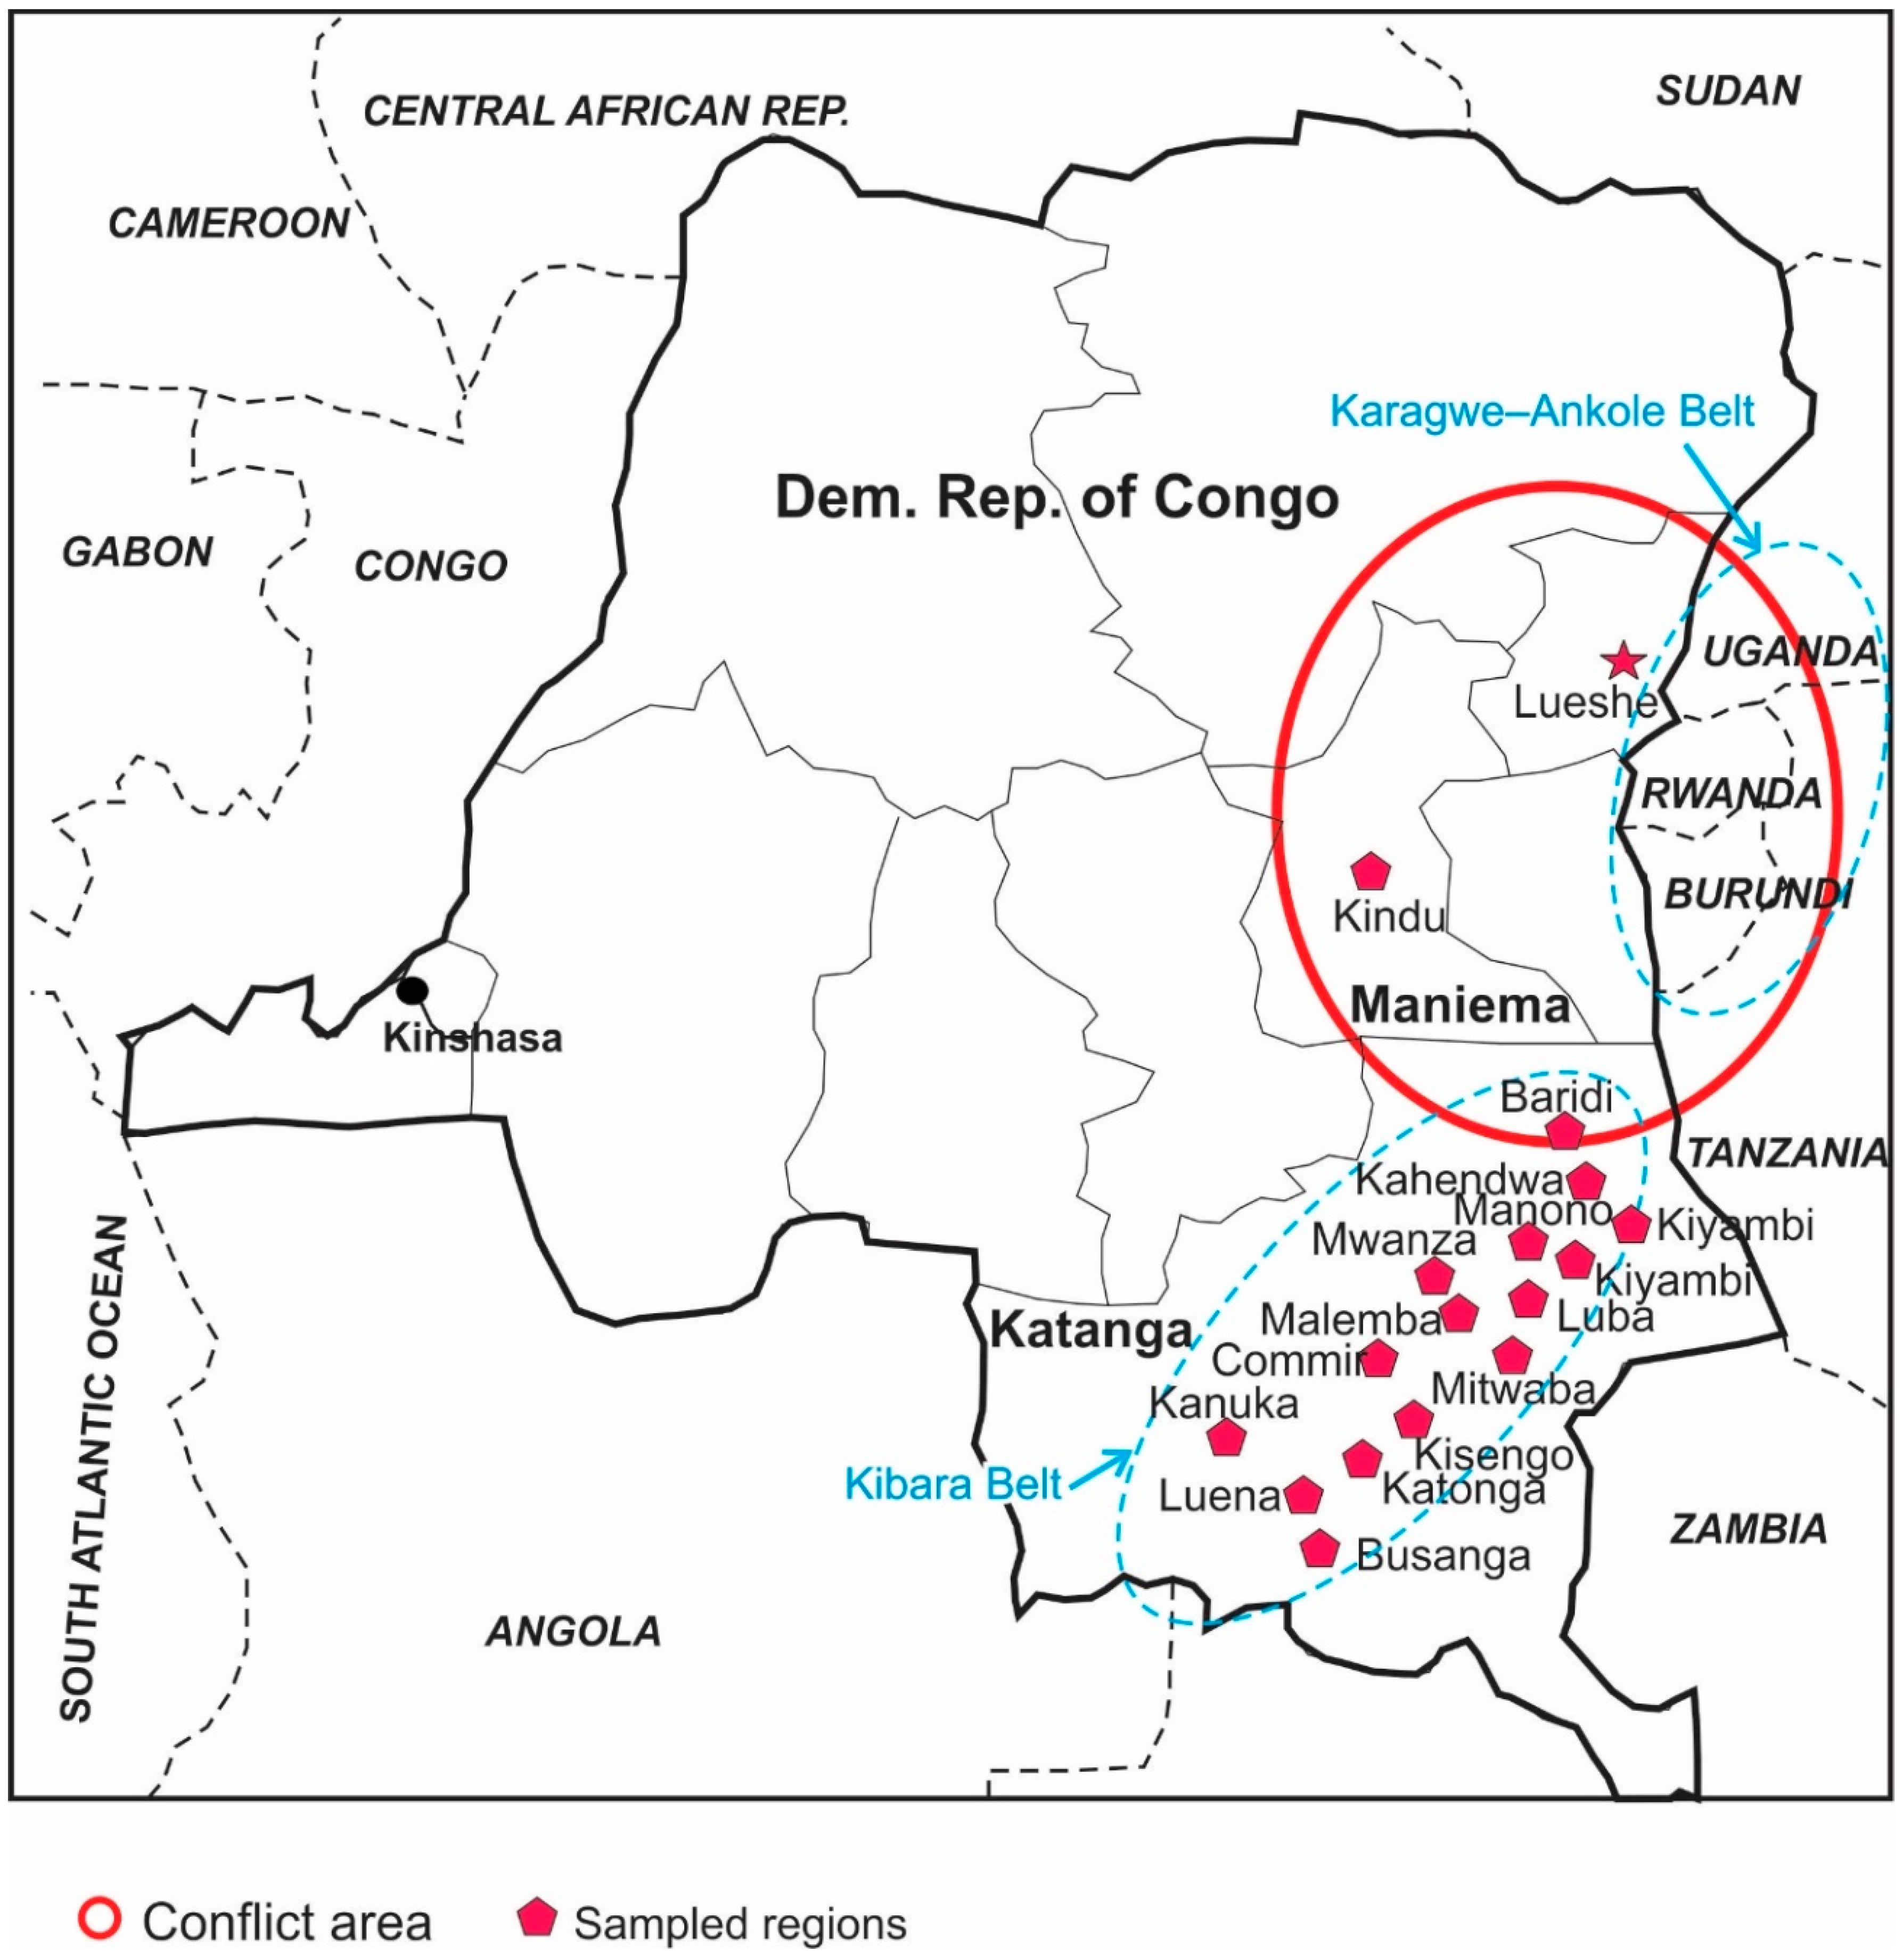
Figure 2.
Location of regions in two provinces (Maniema, Katanga) that were sampled for this study. Lueshe Nb deposit in NE side, as well as Kibara and Karagwe-Ankole metalogenic belts (oval dash lines), are also shown.
Figure 2.
Location of regions in two provinces (Maniema, Katanga) that were sampled for this study. Lueshe Nb deposit in NE side, as well as Kibara and Karagwe-Ankole metalogenic belts (oval dash lines), are also shown.
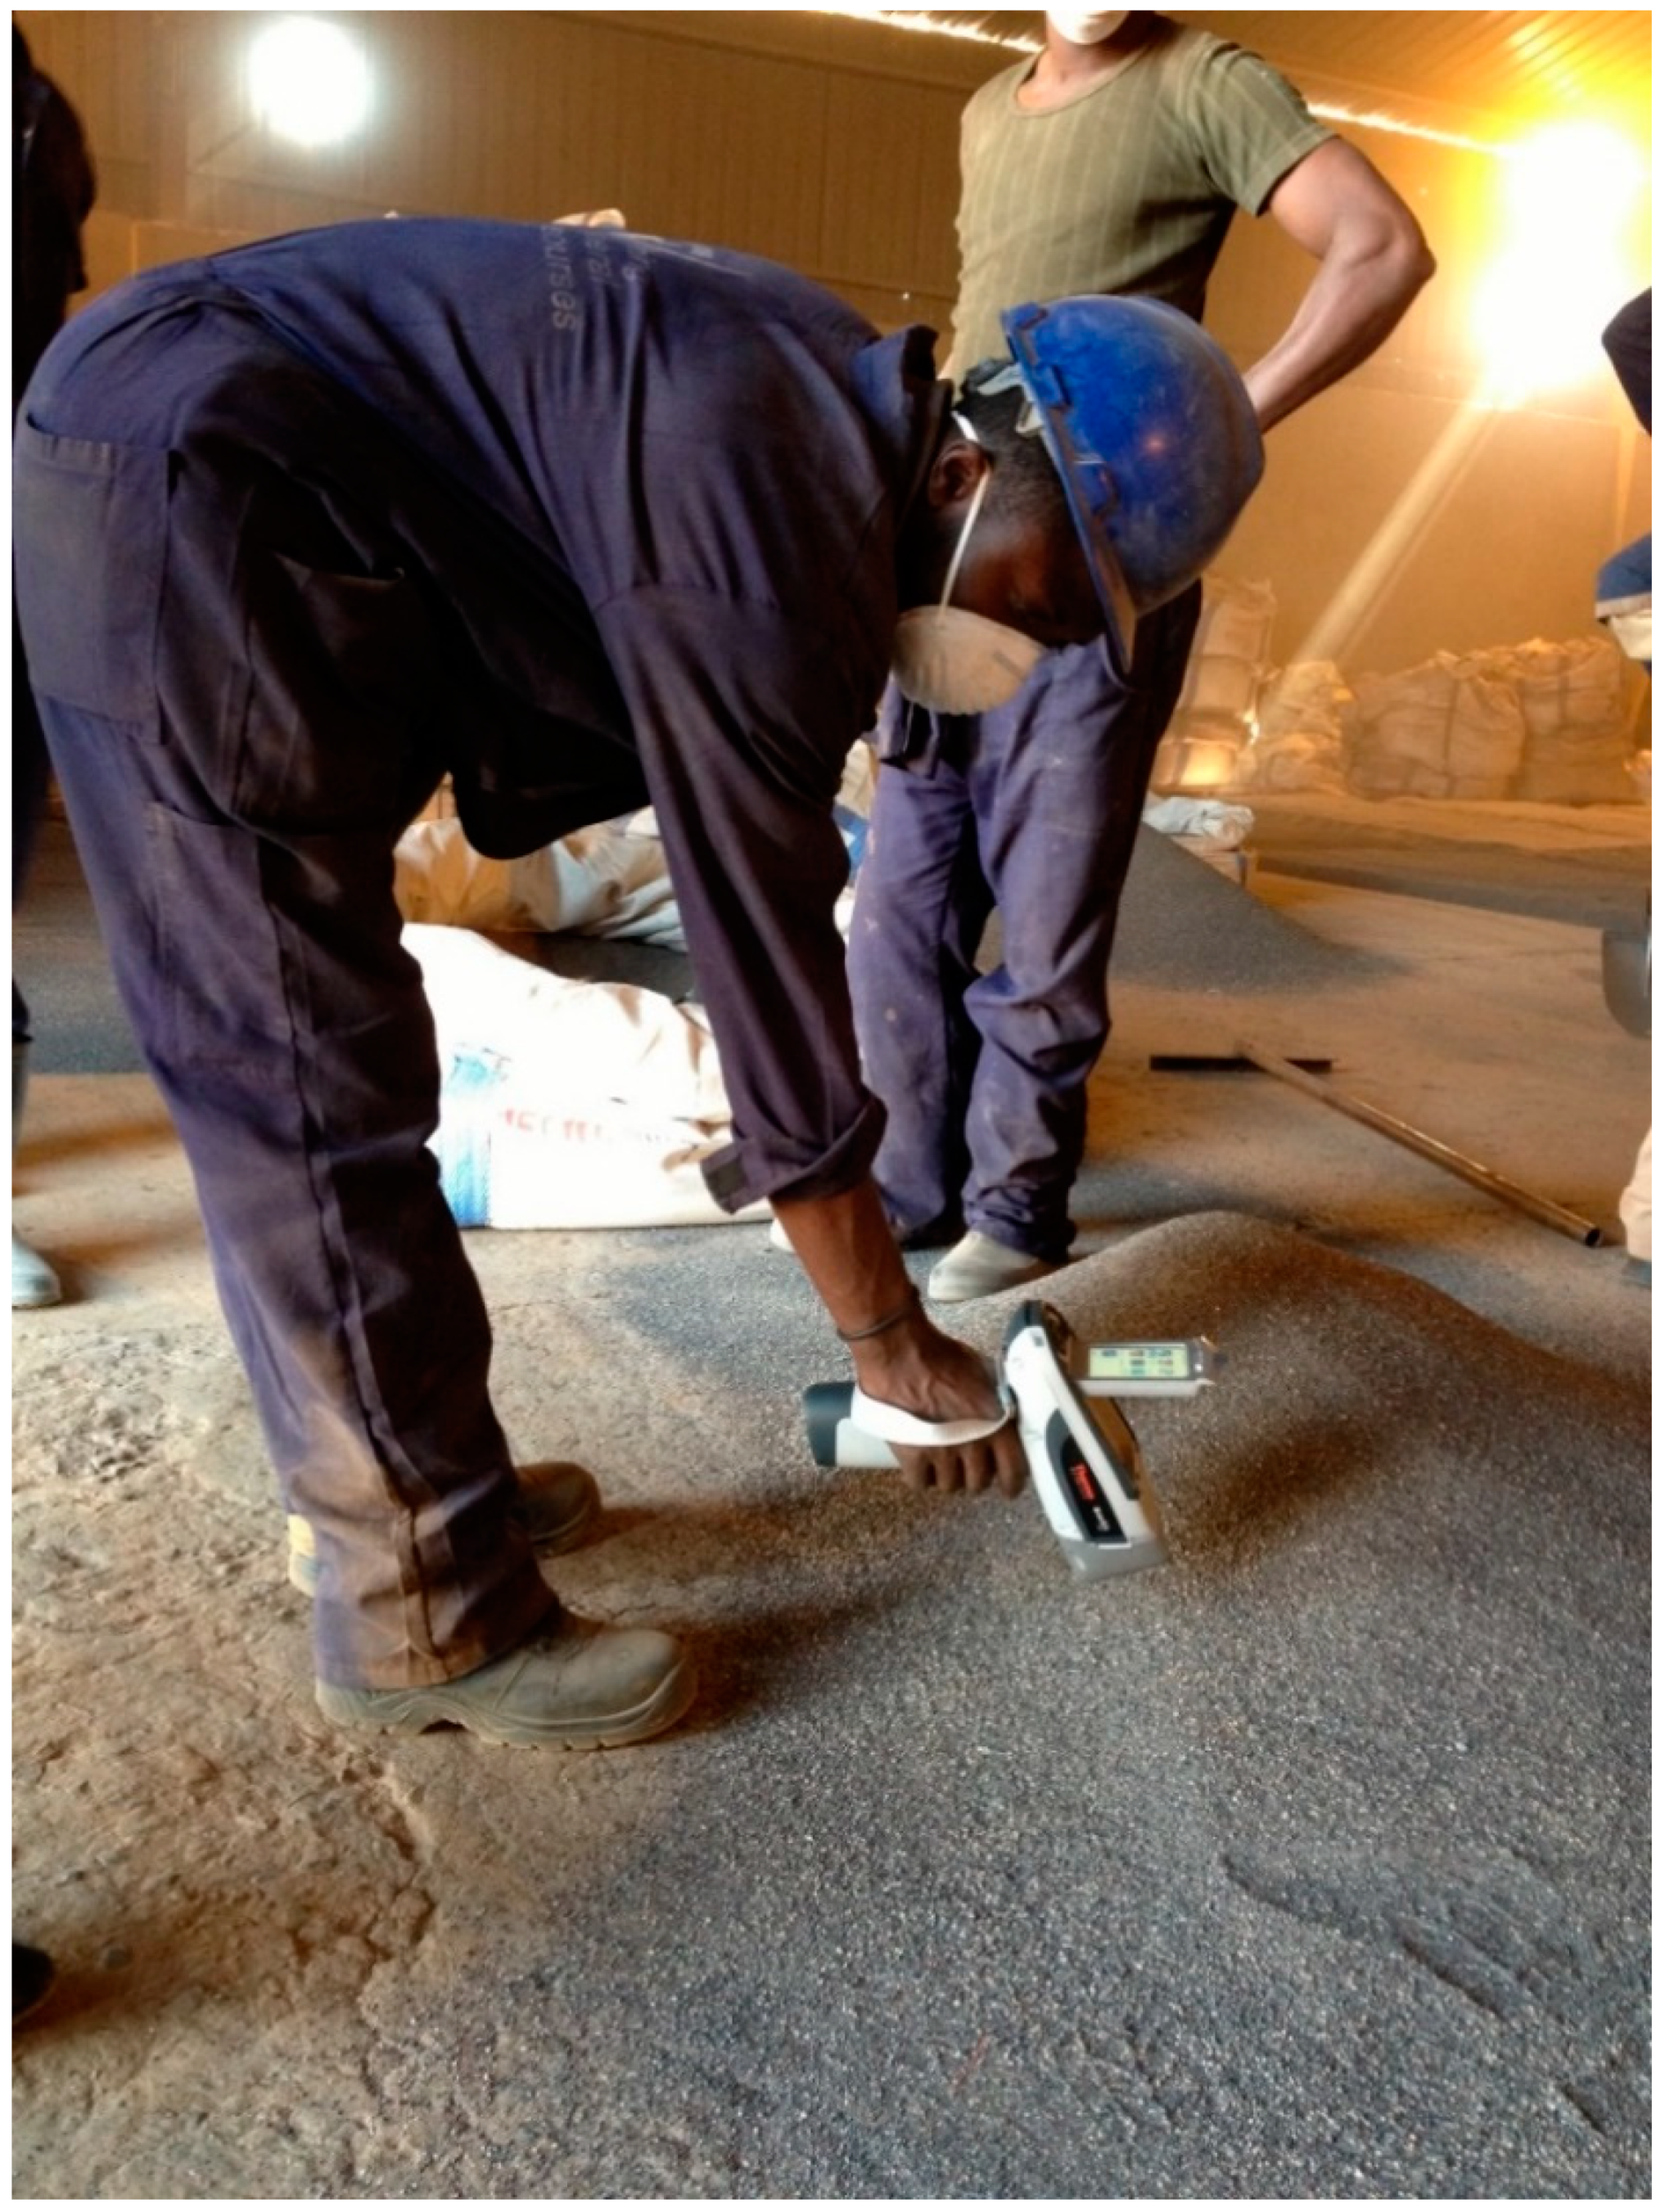
Figure 3.
Analysis of coltan ore samples by HHXRF showing a real time qualitative test by the user.
Figure 3.
Analysis of coltan ore samples by HHXRF showing a real time qualitative test by the user.
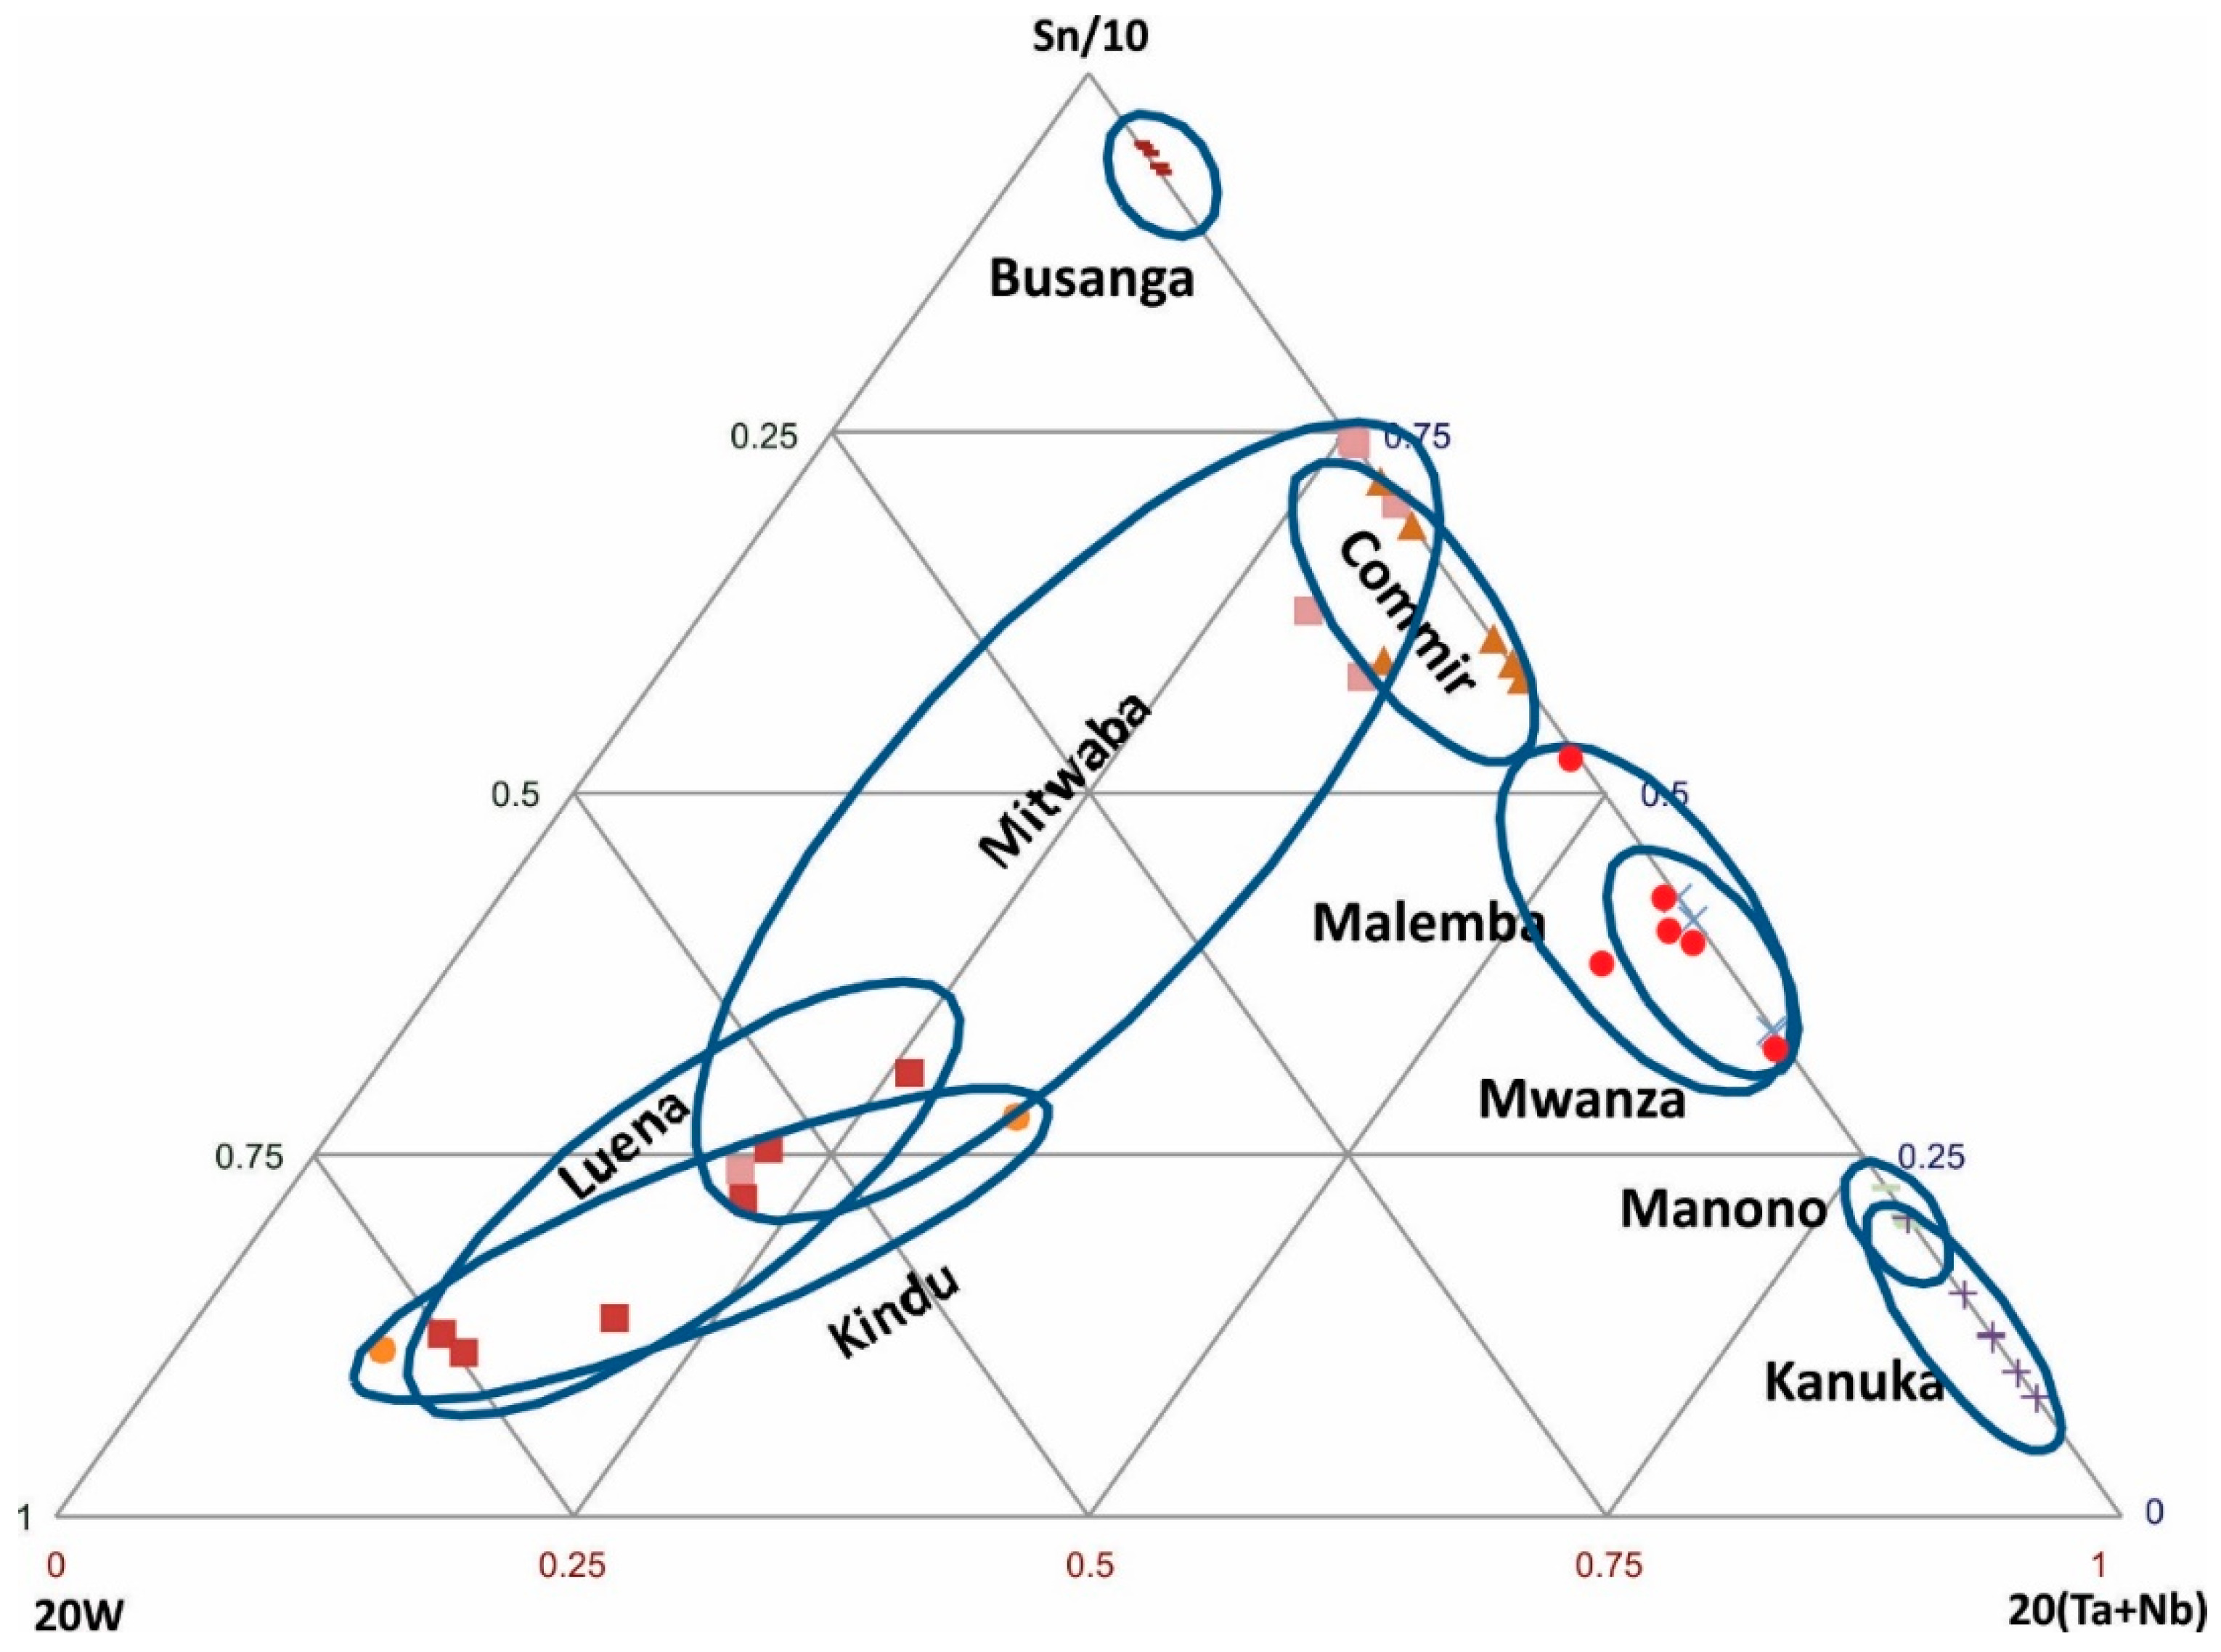
Figure 4.
Discrimination of cassiterite samples from various regions based on Sn-W-(Ta + Nb).
Figure 4.
Discrimination of cassiterite samples from various regions based on Sn-W-(Ta + Nb).
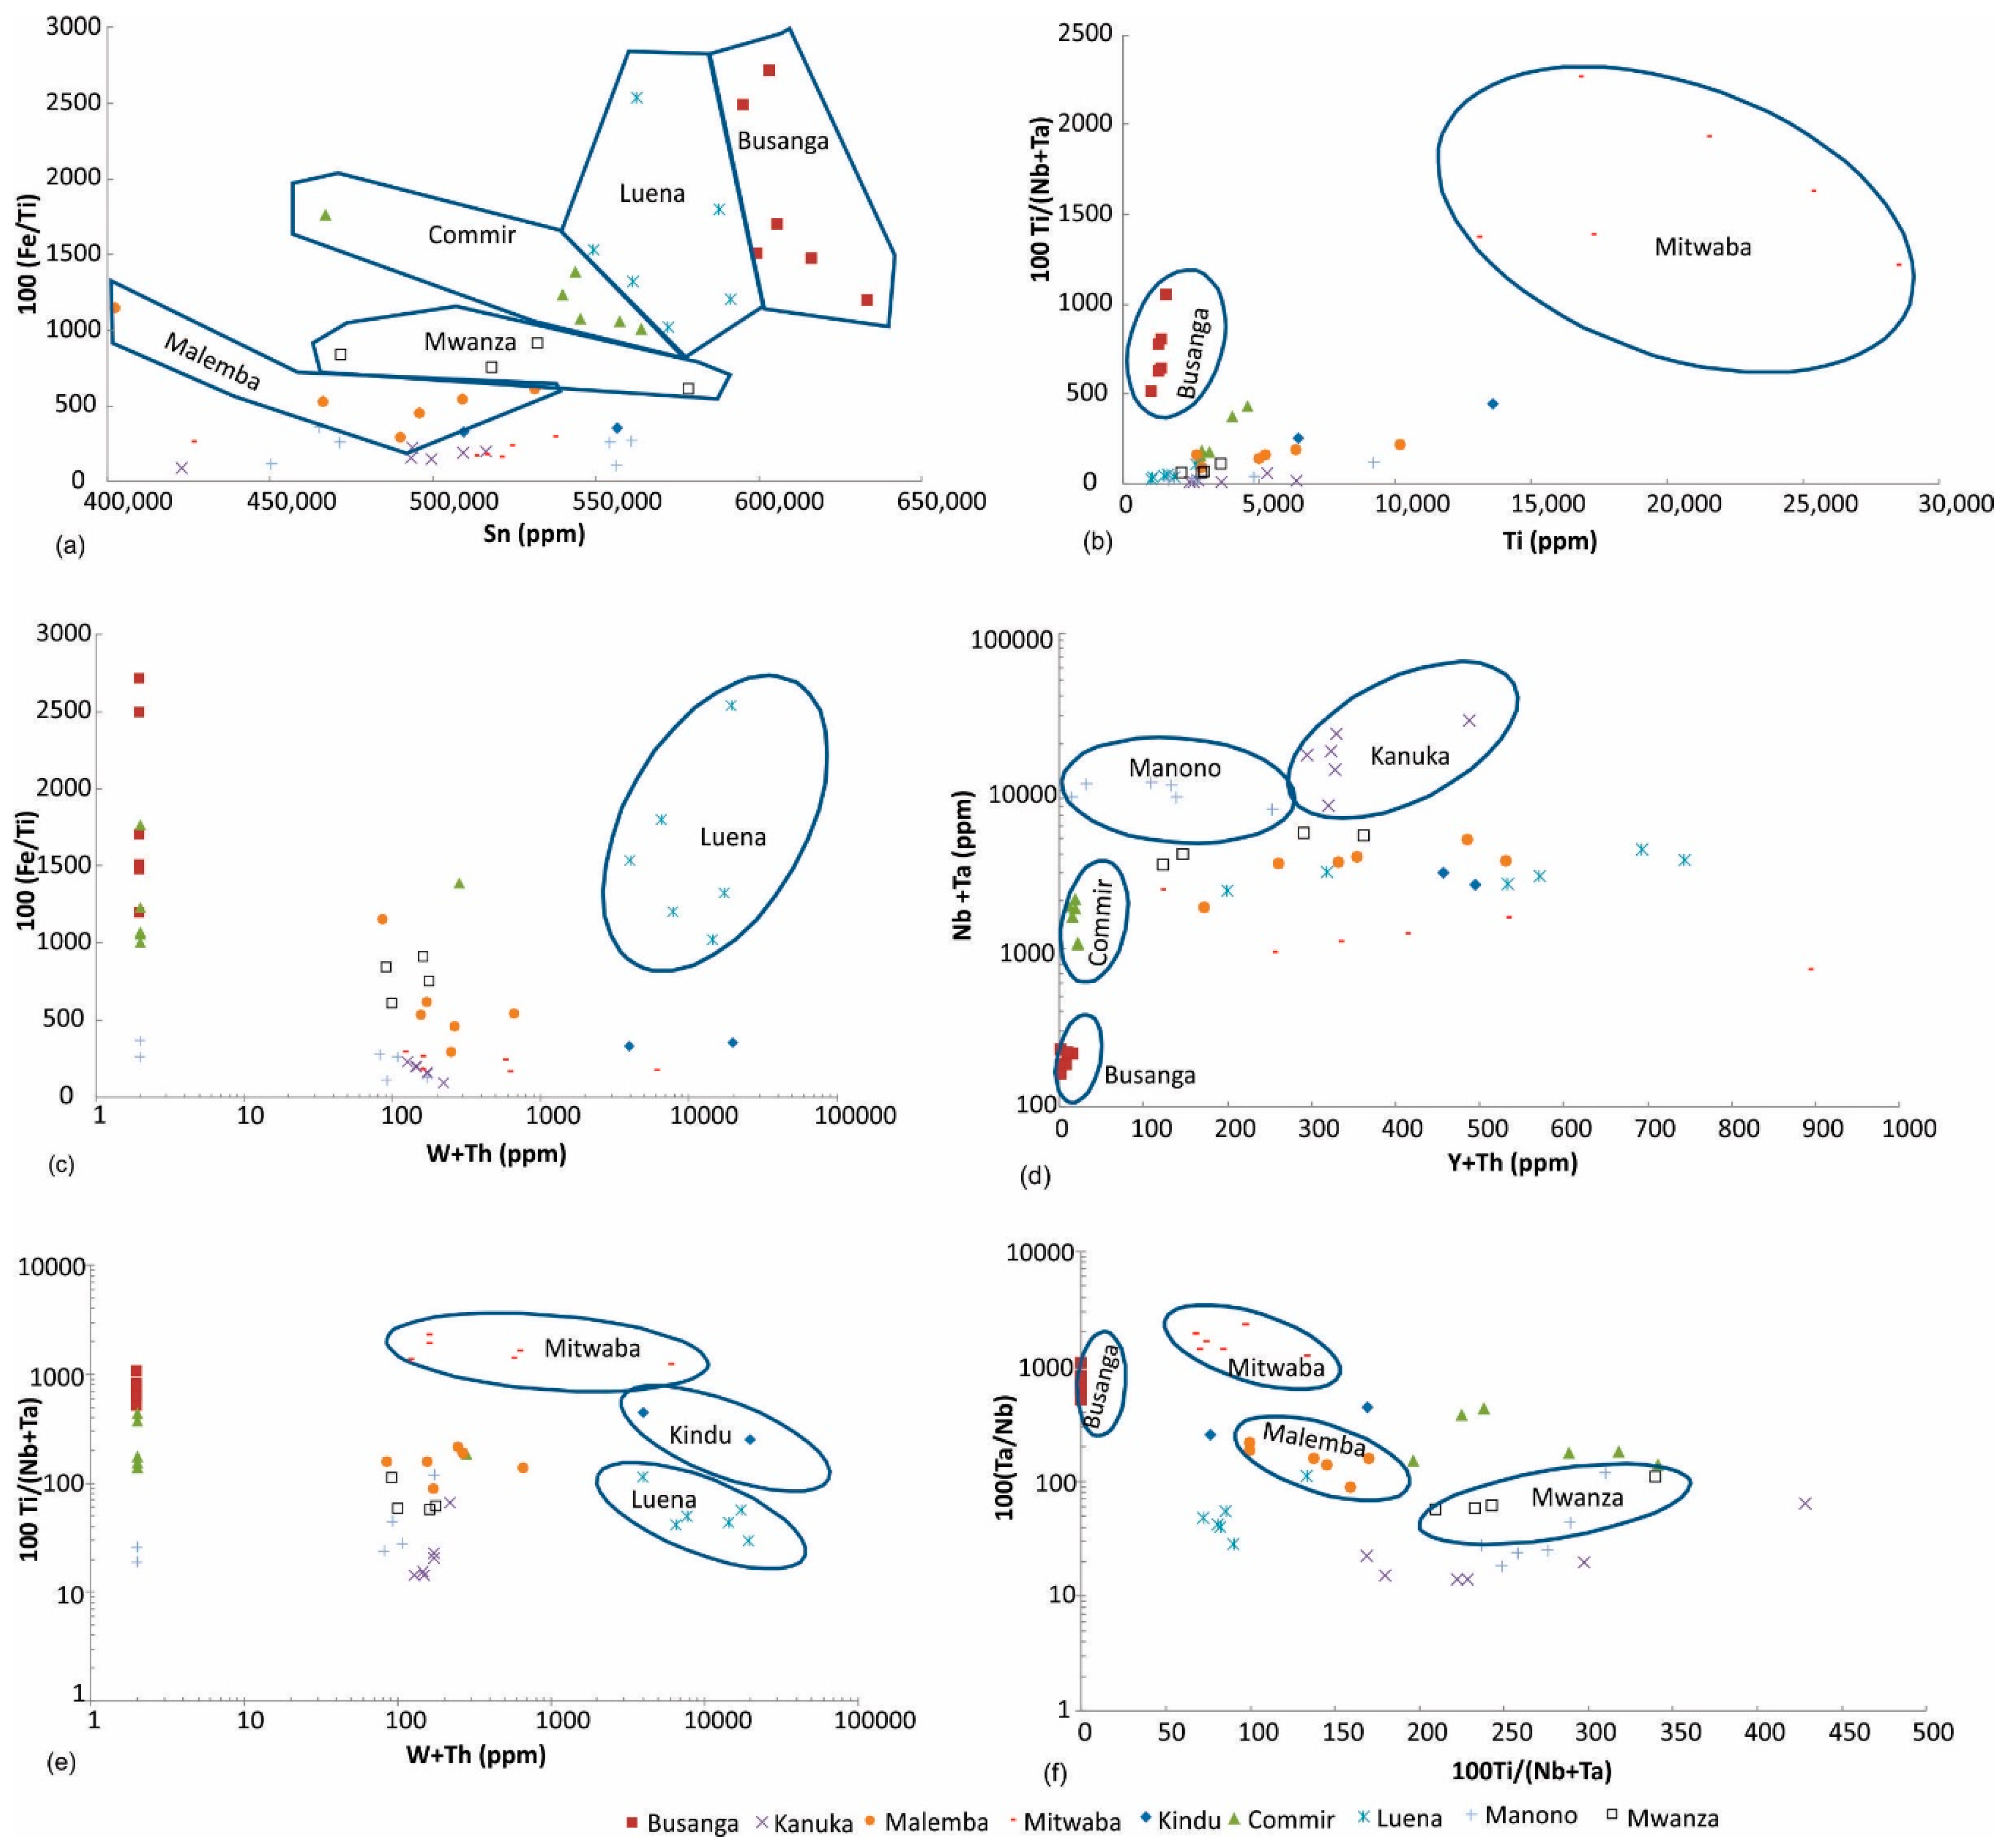
Figure 5.
Discrimination of (a) Malemba, Mwanza, Commir, Luena, and Busanga, (b) Mitwaba and Busanga, (c) Luena, (d) Busanga, Commir, Manono, and Kanuka, (e) Mitwaba, Kindu, and Luena, (f) Busanga, Mitwaba, Malemba, and Mwanza cassiterite ore samples.
Figure 5.
Discrimination of (a) Malemba, Mwanza, Commir, Luena, and Busanga, (b) Mitwaba and Busanga, (c) Luena, (d) Busanga, Commir, Manono, and Kanuka, (e) Mitwaba, Kindu, and Luena, (f) Busanga, Mitwaba, Malemba, and Mwanza cassiterite ore samples.
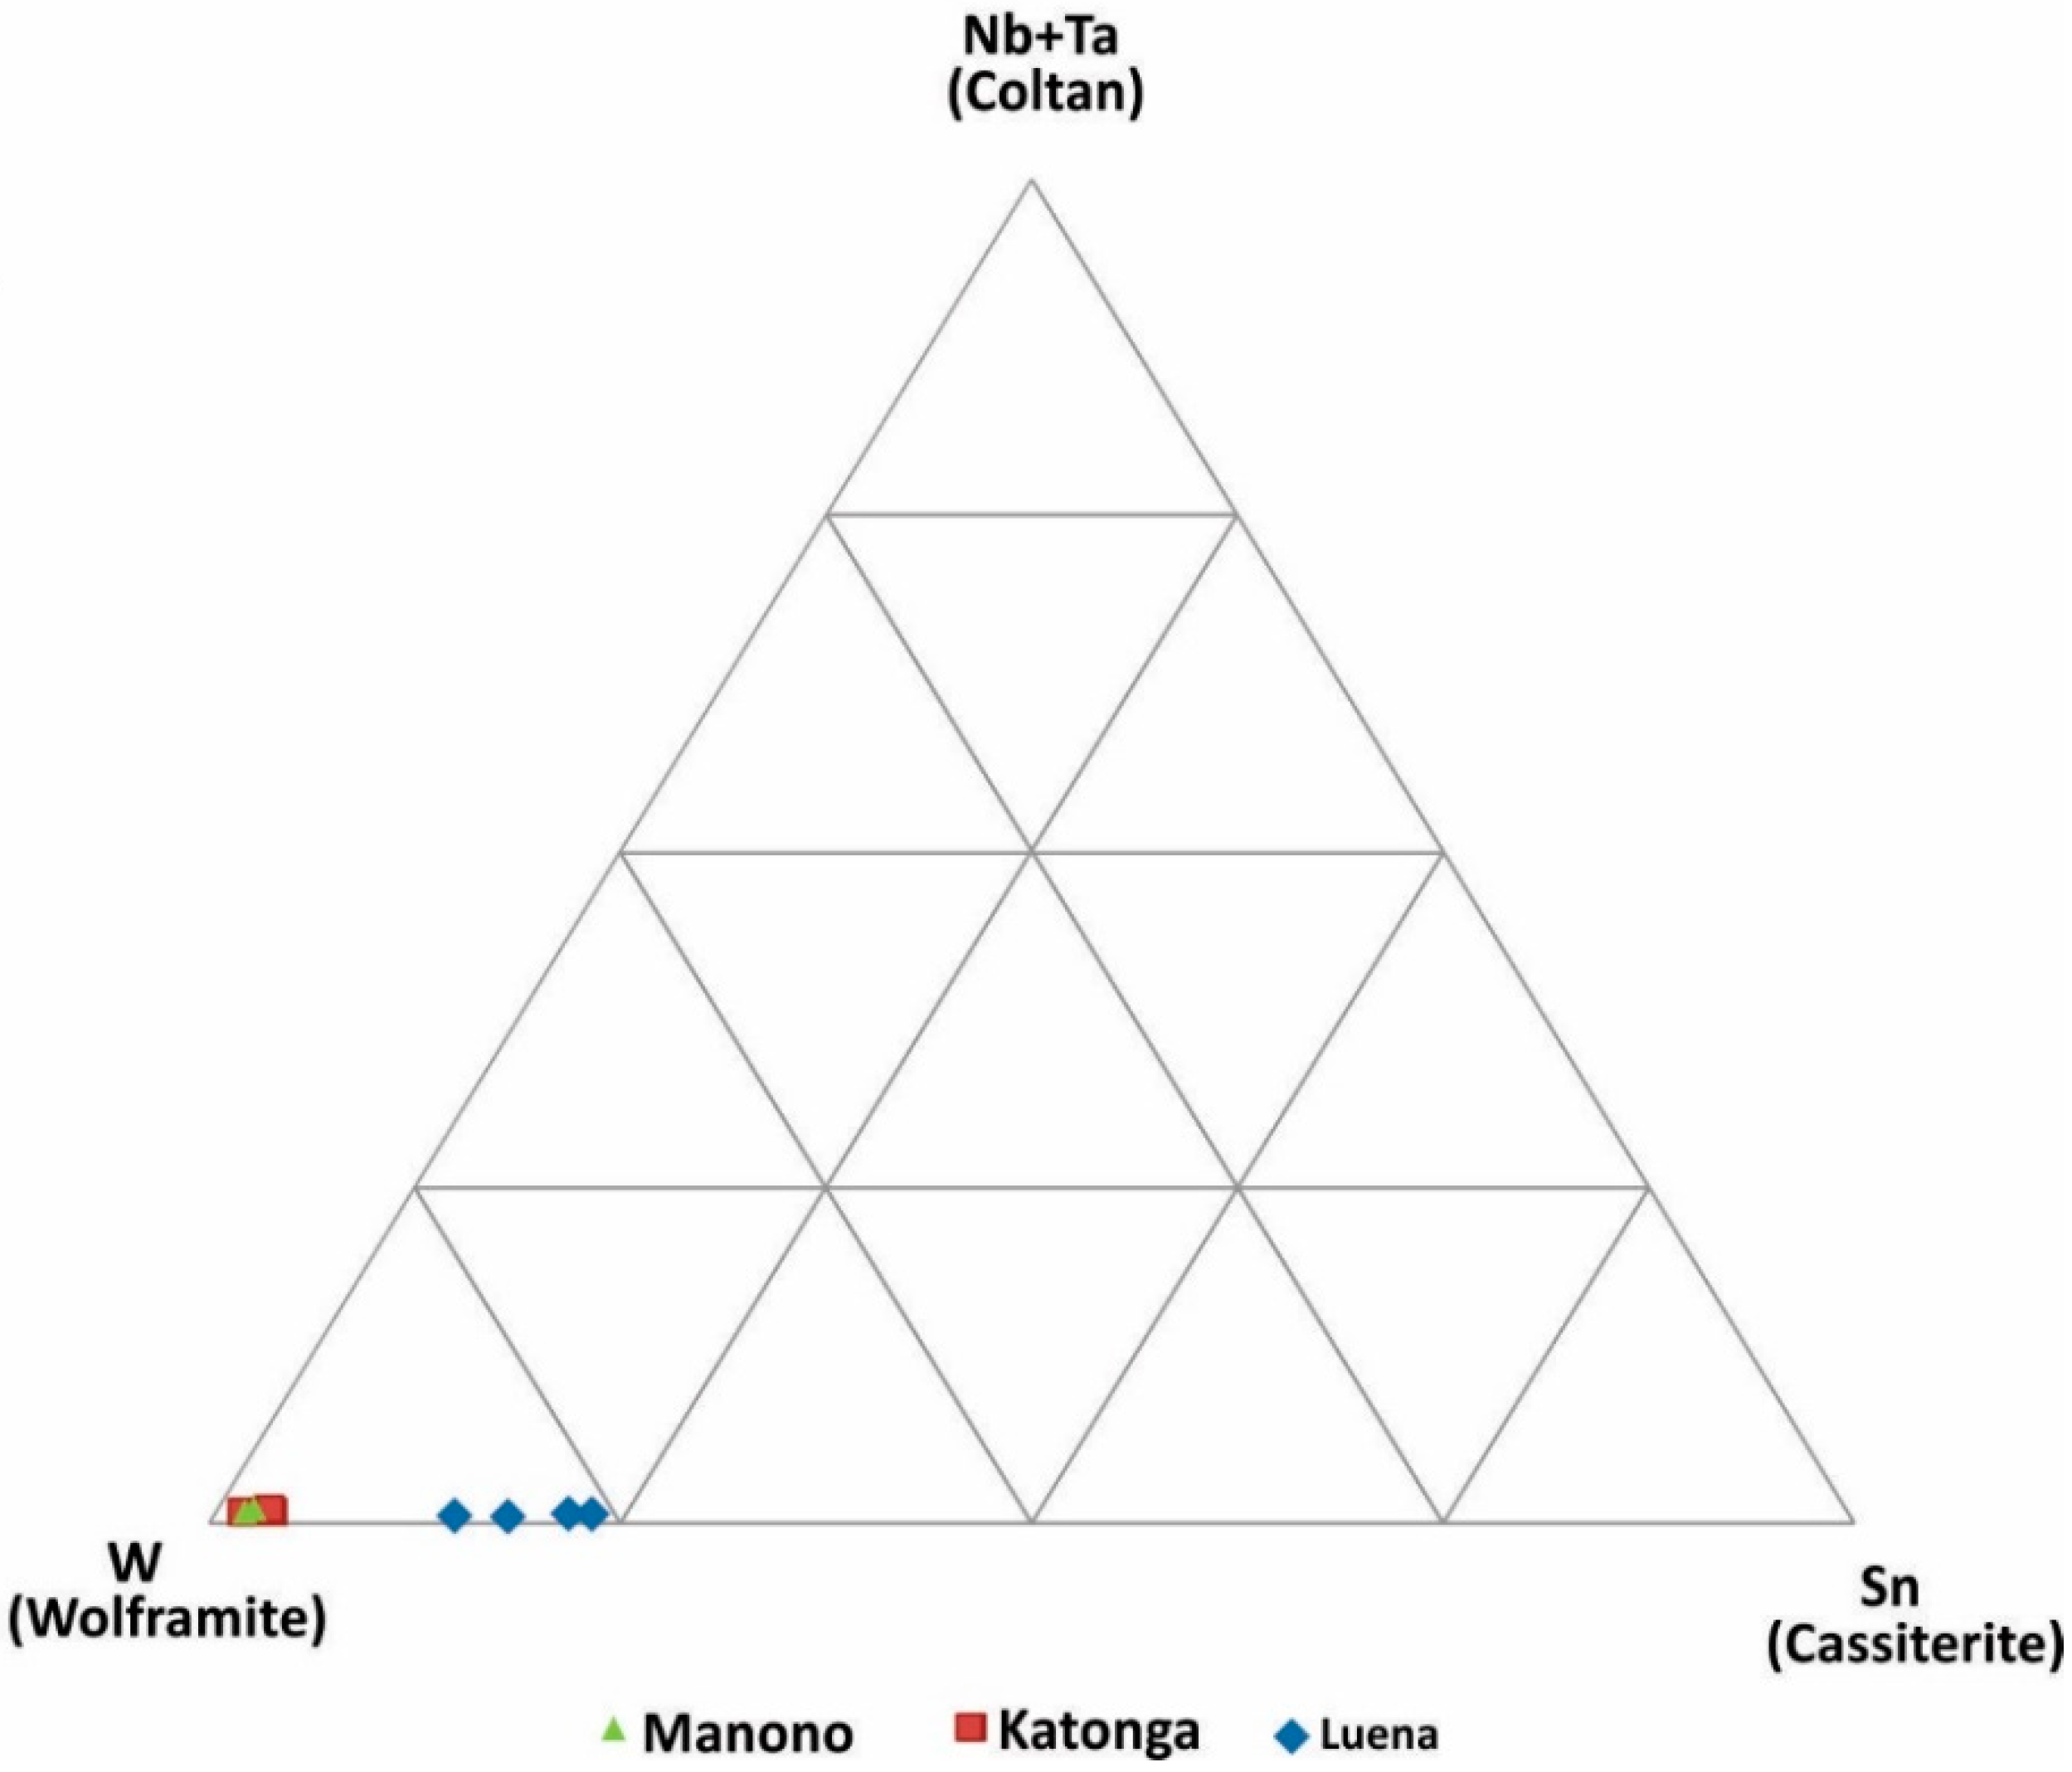
Figure 6.
Discrimination of wolframite ore samples based on W, Sn and Nb+Ta concentrations.
Figure 6.
Discrimination of wolframite ore samples based on W, Sn and Nb+Ta concentrations.
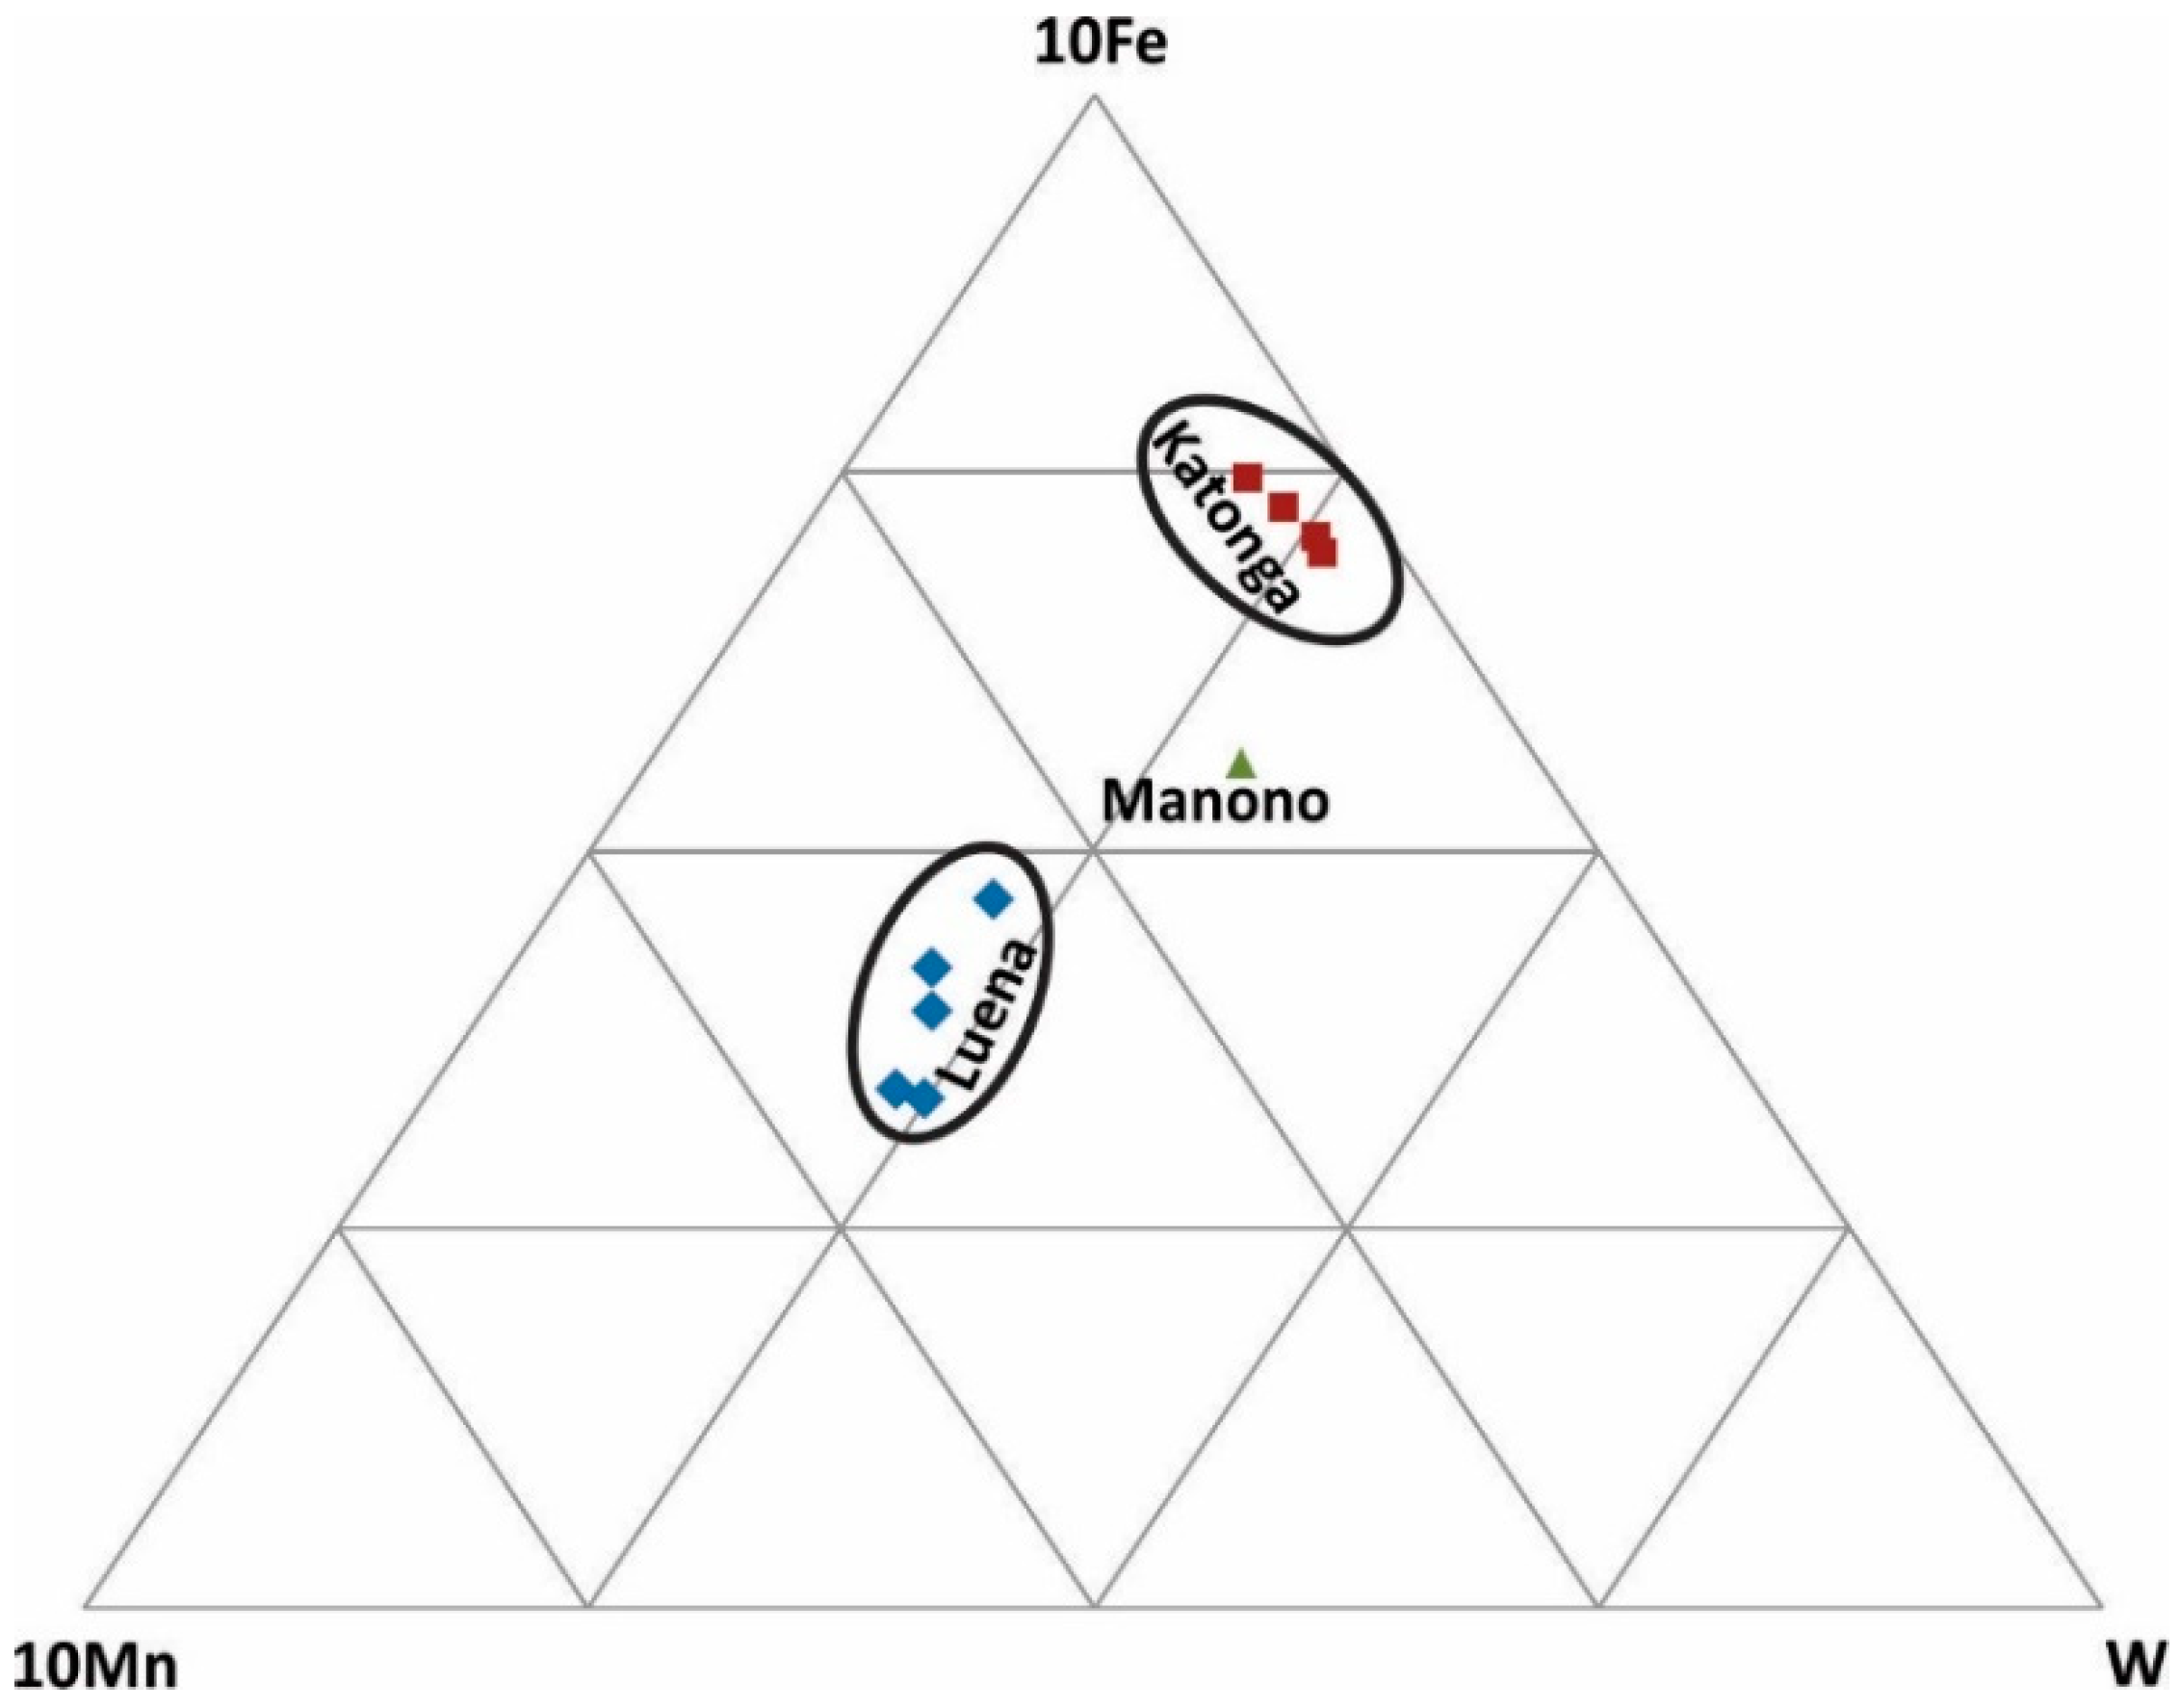
Figure 7.
Discrimination of wolframite ore samples based on Fe, Mn, and W concentrations.
Figure 7.
Discrimination of wolframite ore samples based on Fe, Mn, and W concentrations.
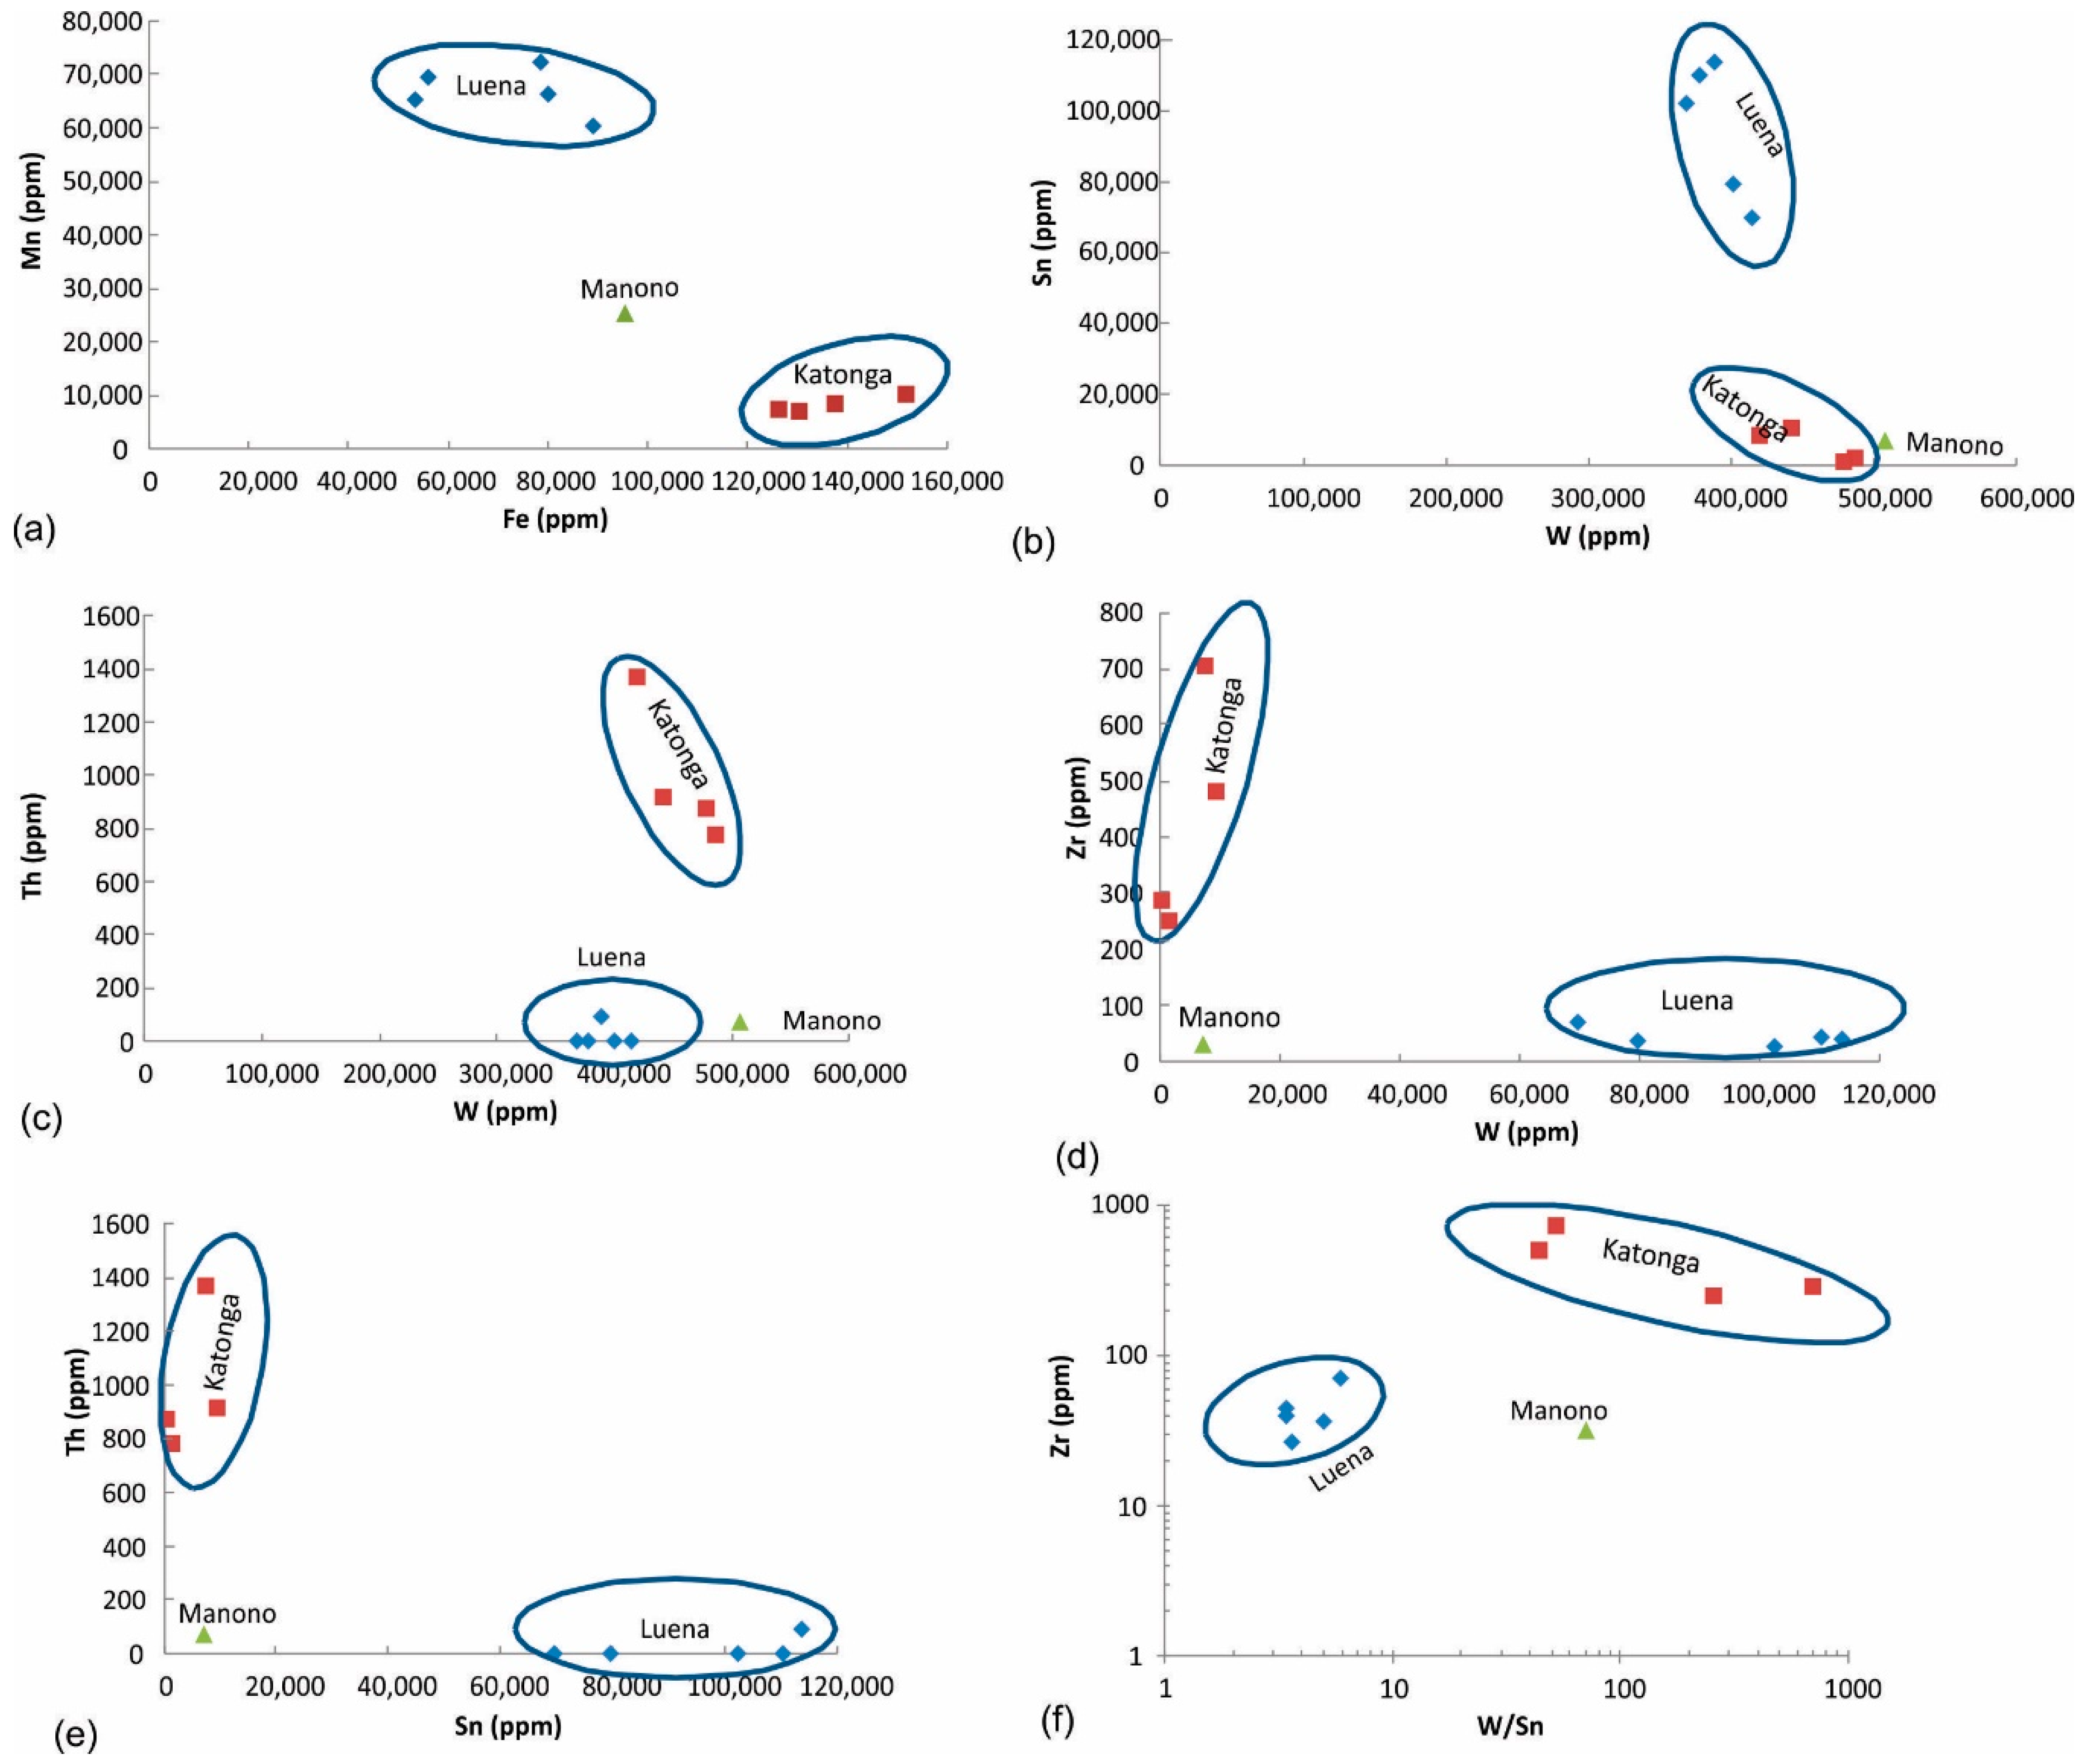
Figure 8.
Discrimination of wolframite ore samples based on (a) Fe and Mn, (b–f) combination of W, Sn, Th, and Zr concentrations.
Figure 8.
Discrimination of wolframite ore samples based on (a) Fe and Mn, (b–f) combination of W, Sn, Th, and Zr concentrations.
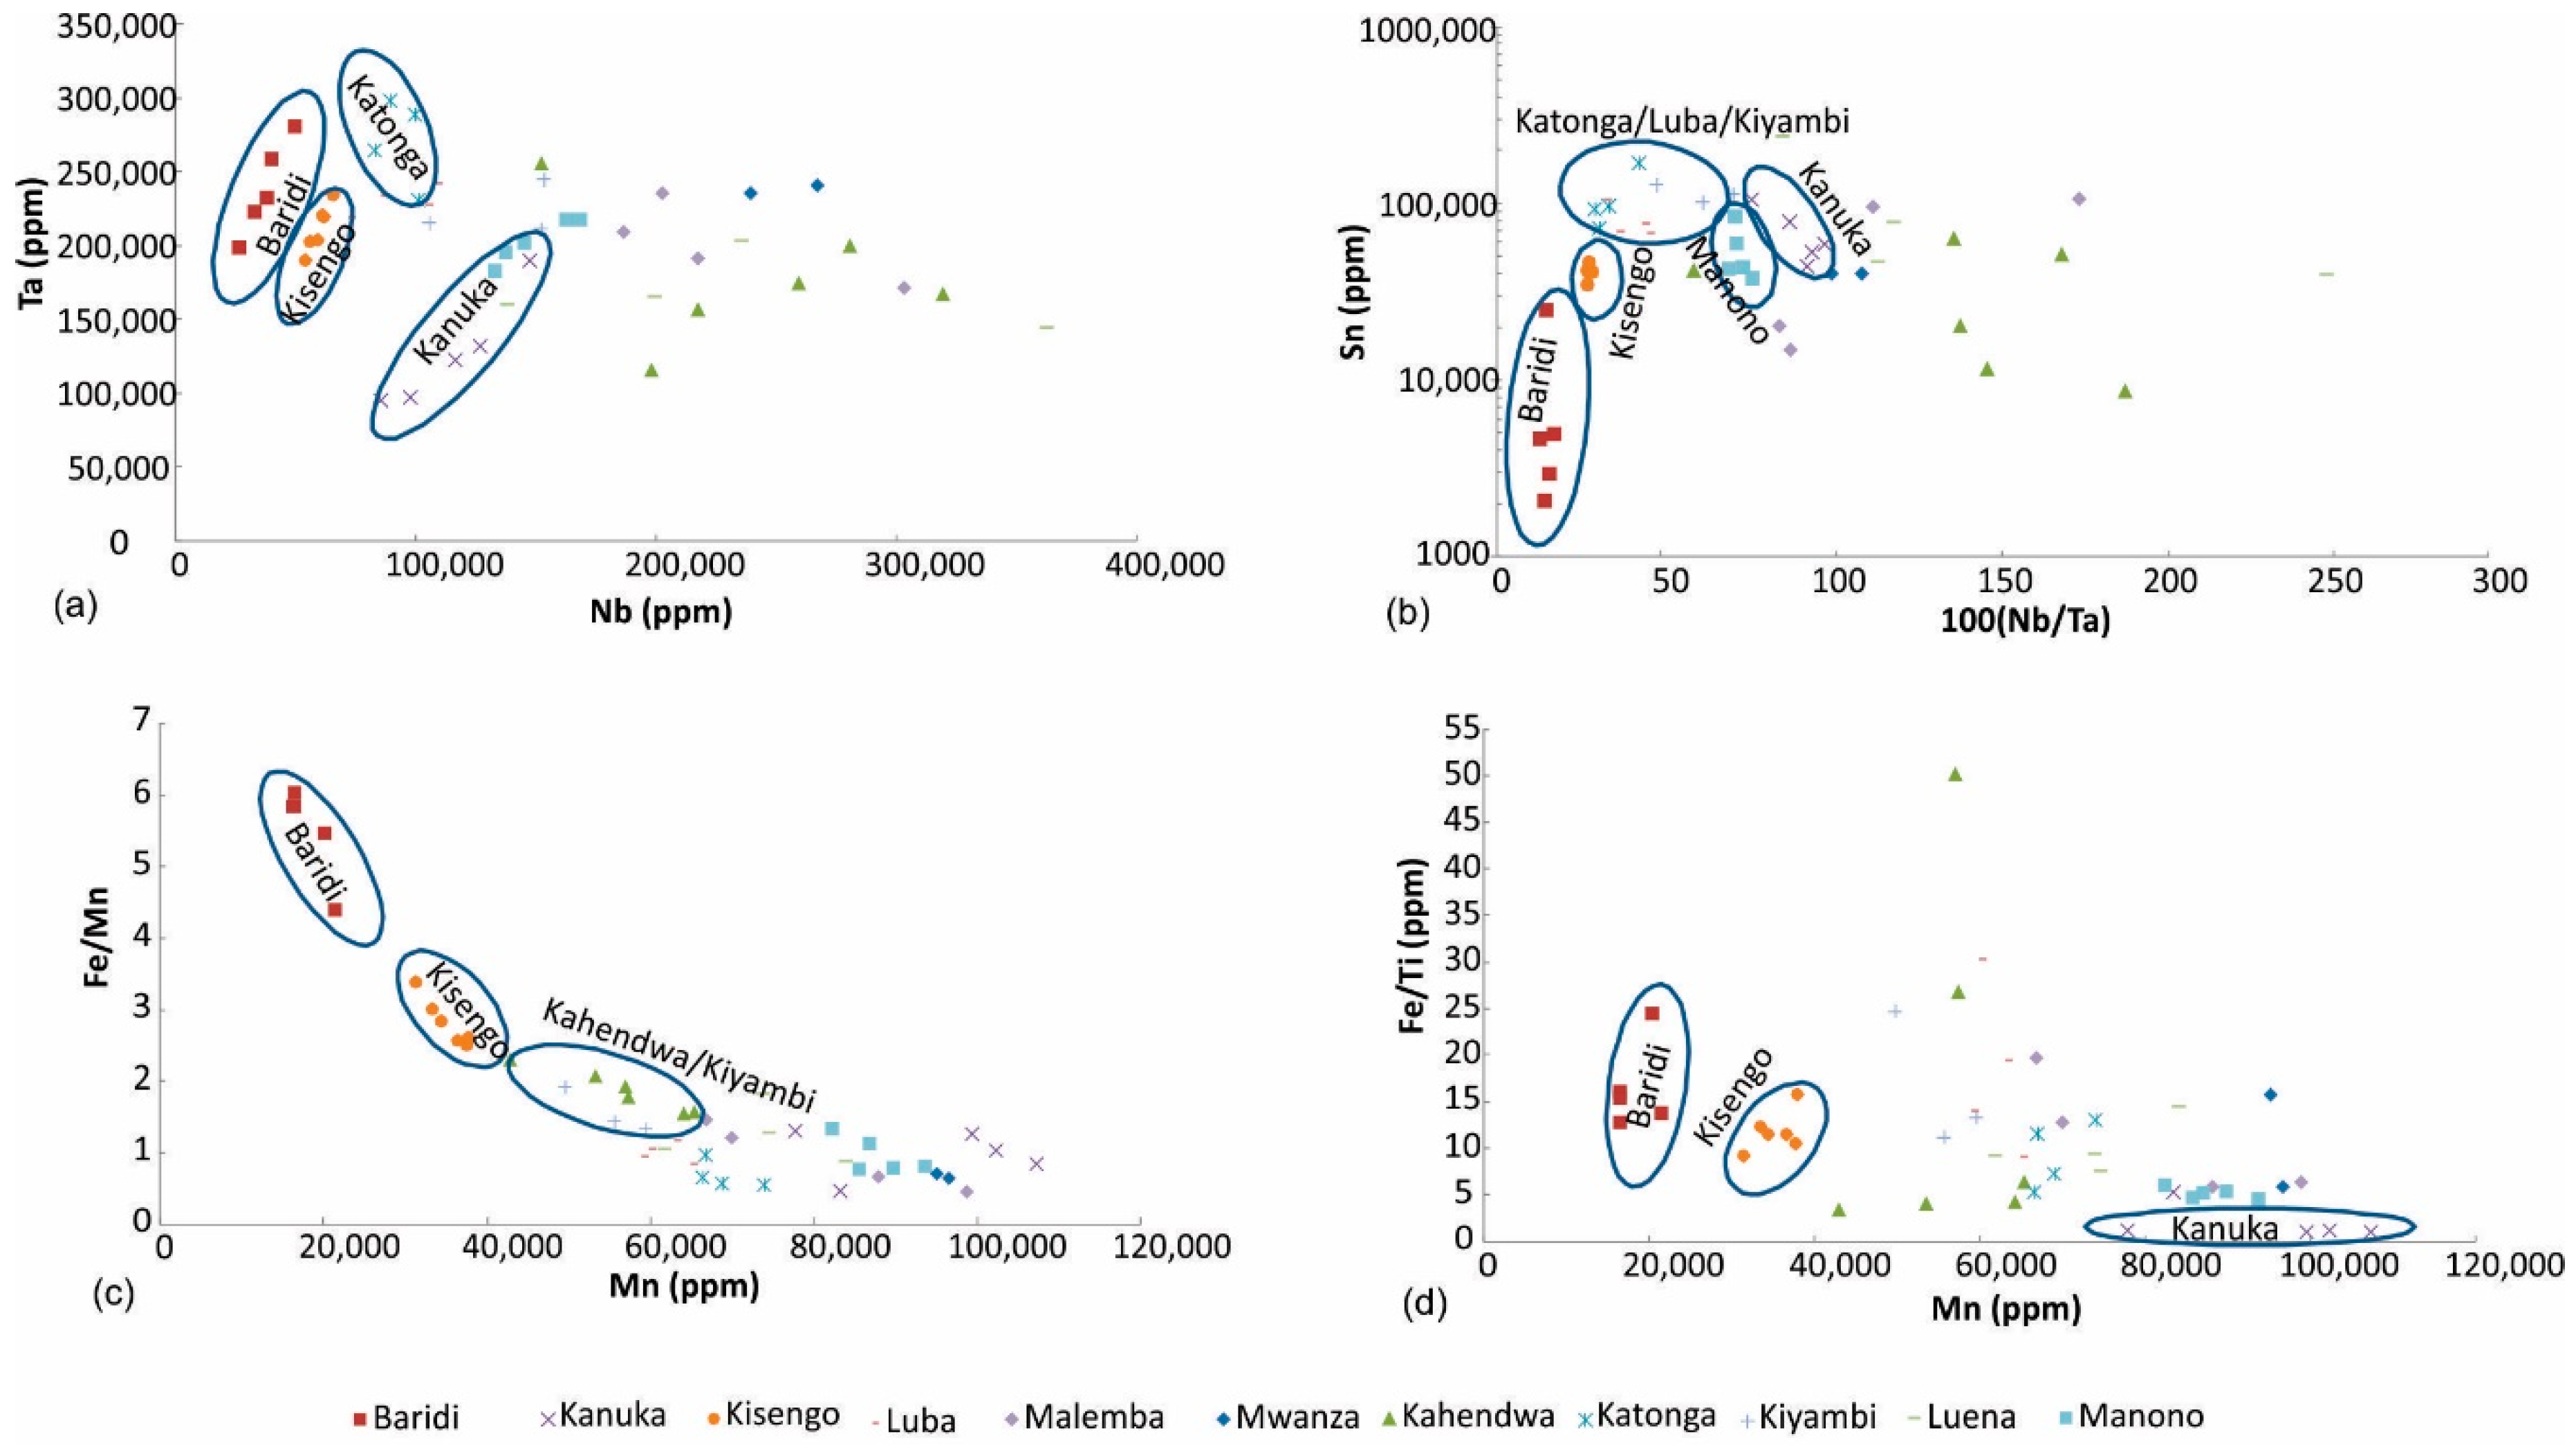
Figure 9.
Discrimination of coltan ore samples based on (a) Nb and Ta, (b) 100 (Nb/Ta) vs. Sn, (c) Mn vs. Fe/Mn, (d) Mn vs. Fe/Ti.
Figure 9.
Discrimination of coltan ore samples based on (a) Nb and Ta, (b) 100 (Nb/Ta) vs. Sn, (c) Mn vs. Fe/Mn, (d) Mn vs. Fe/Ti.
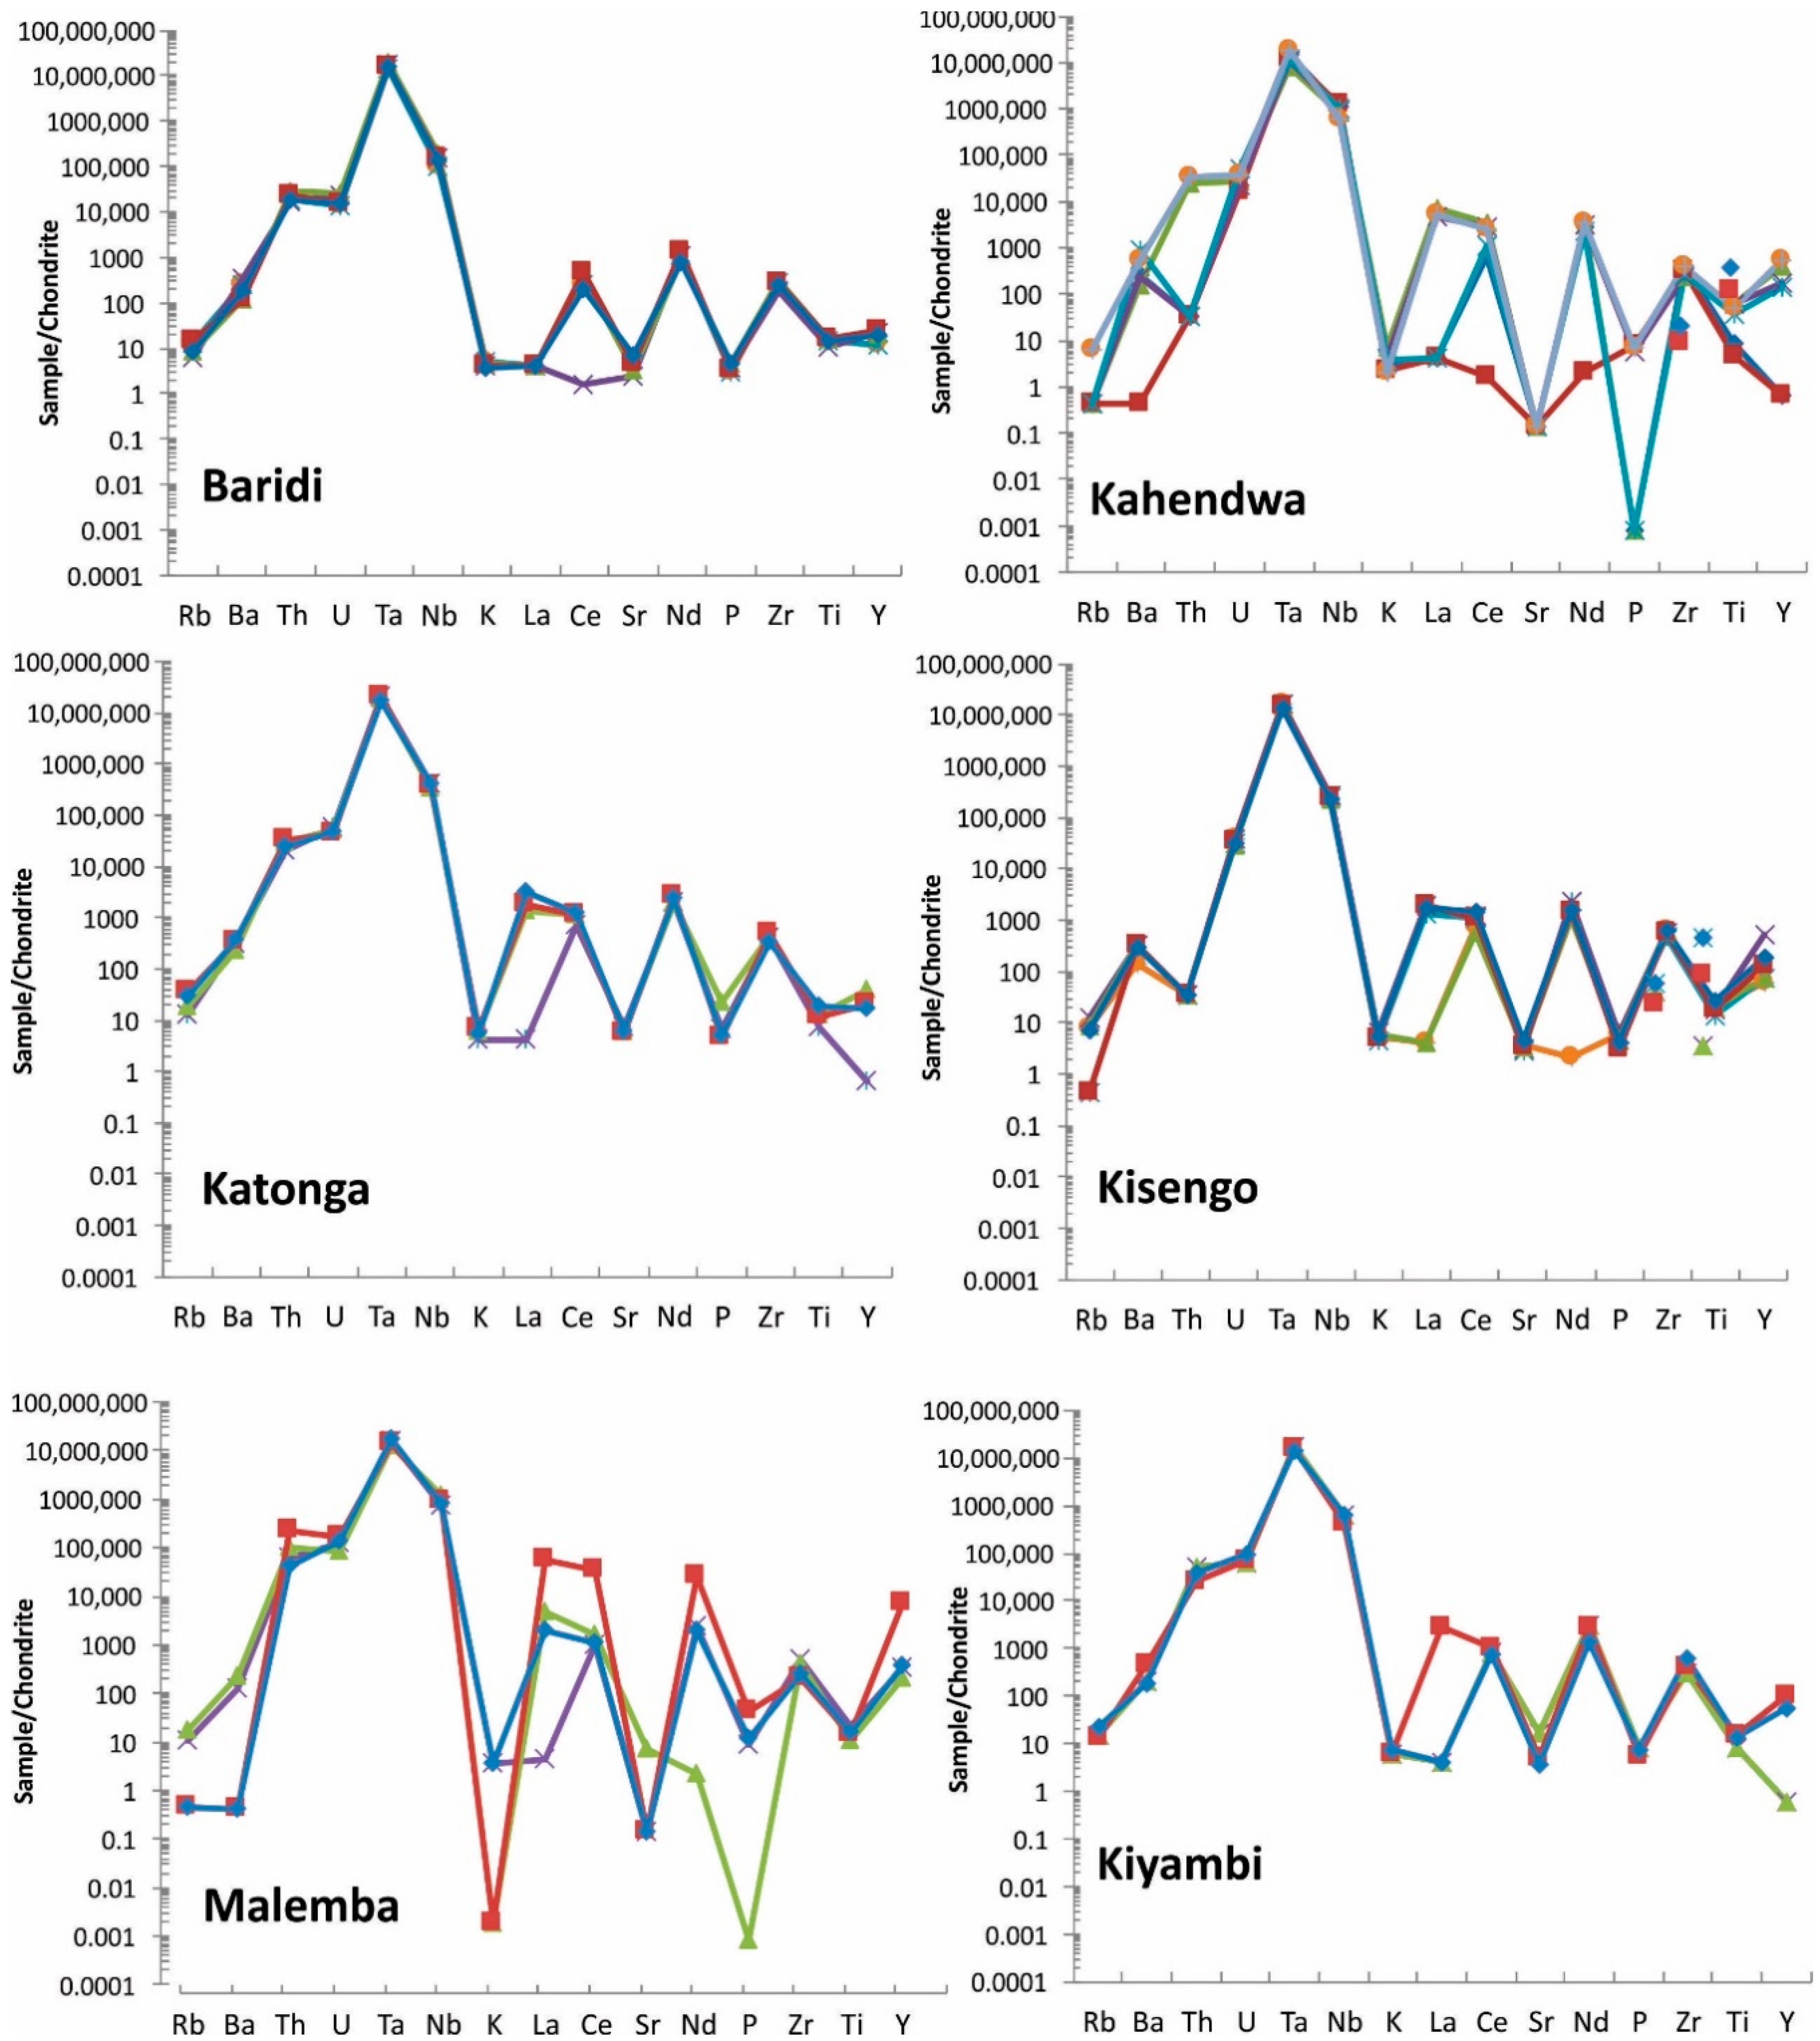
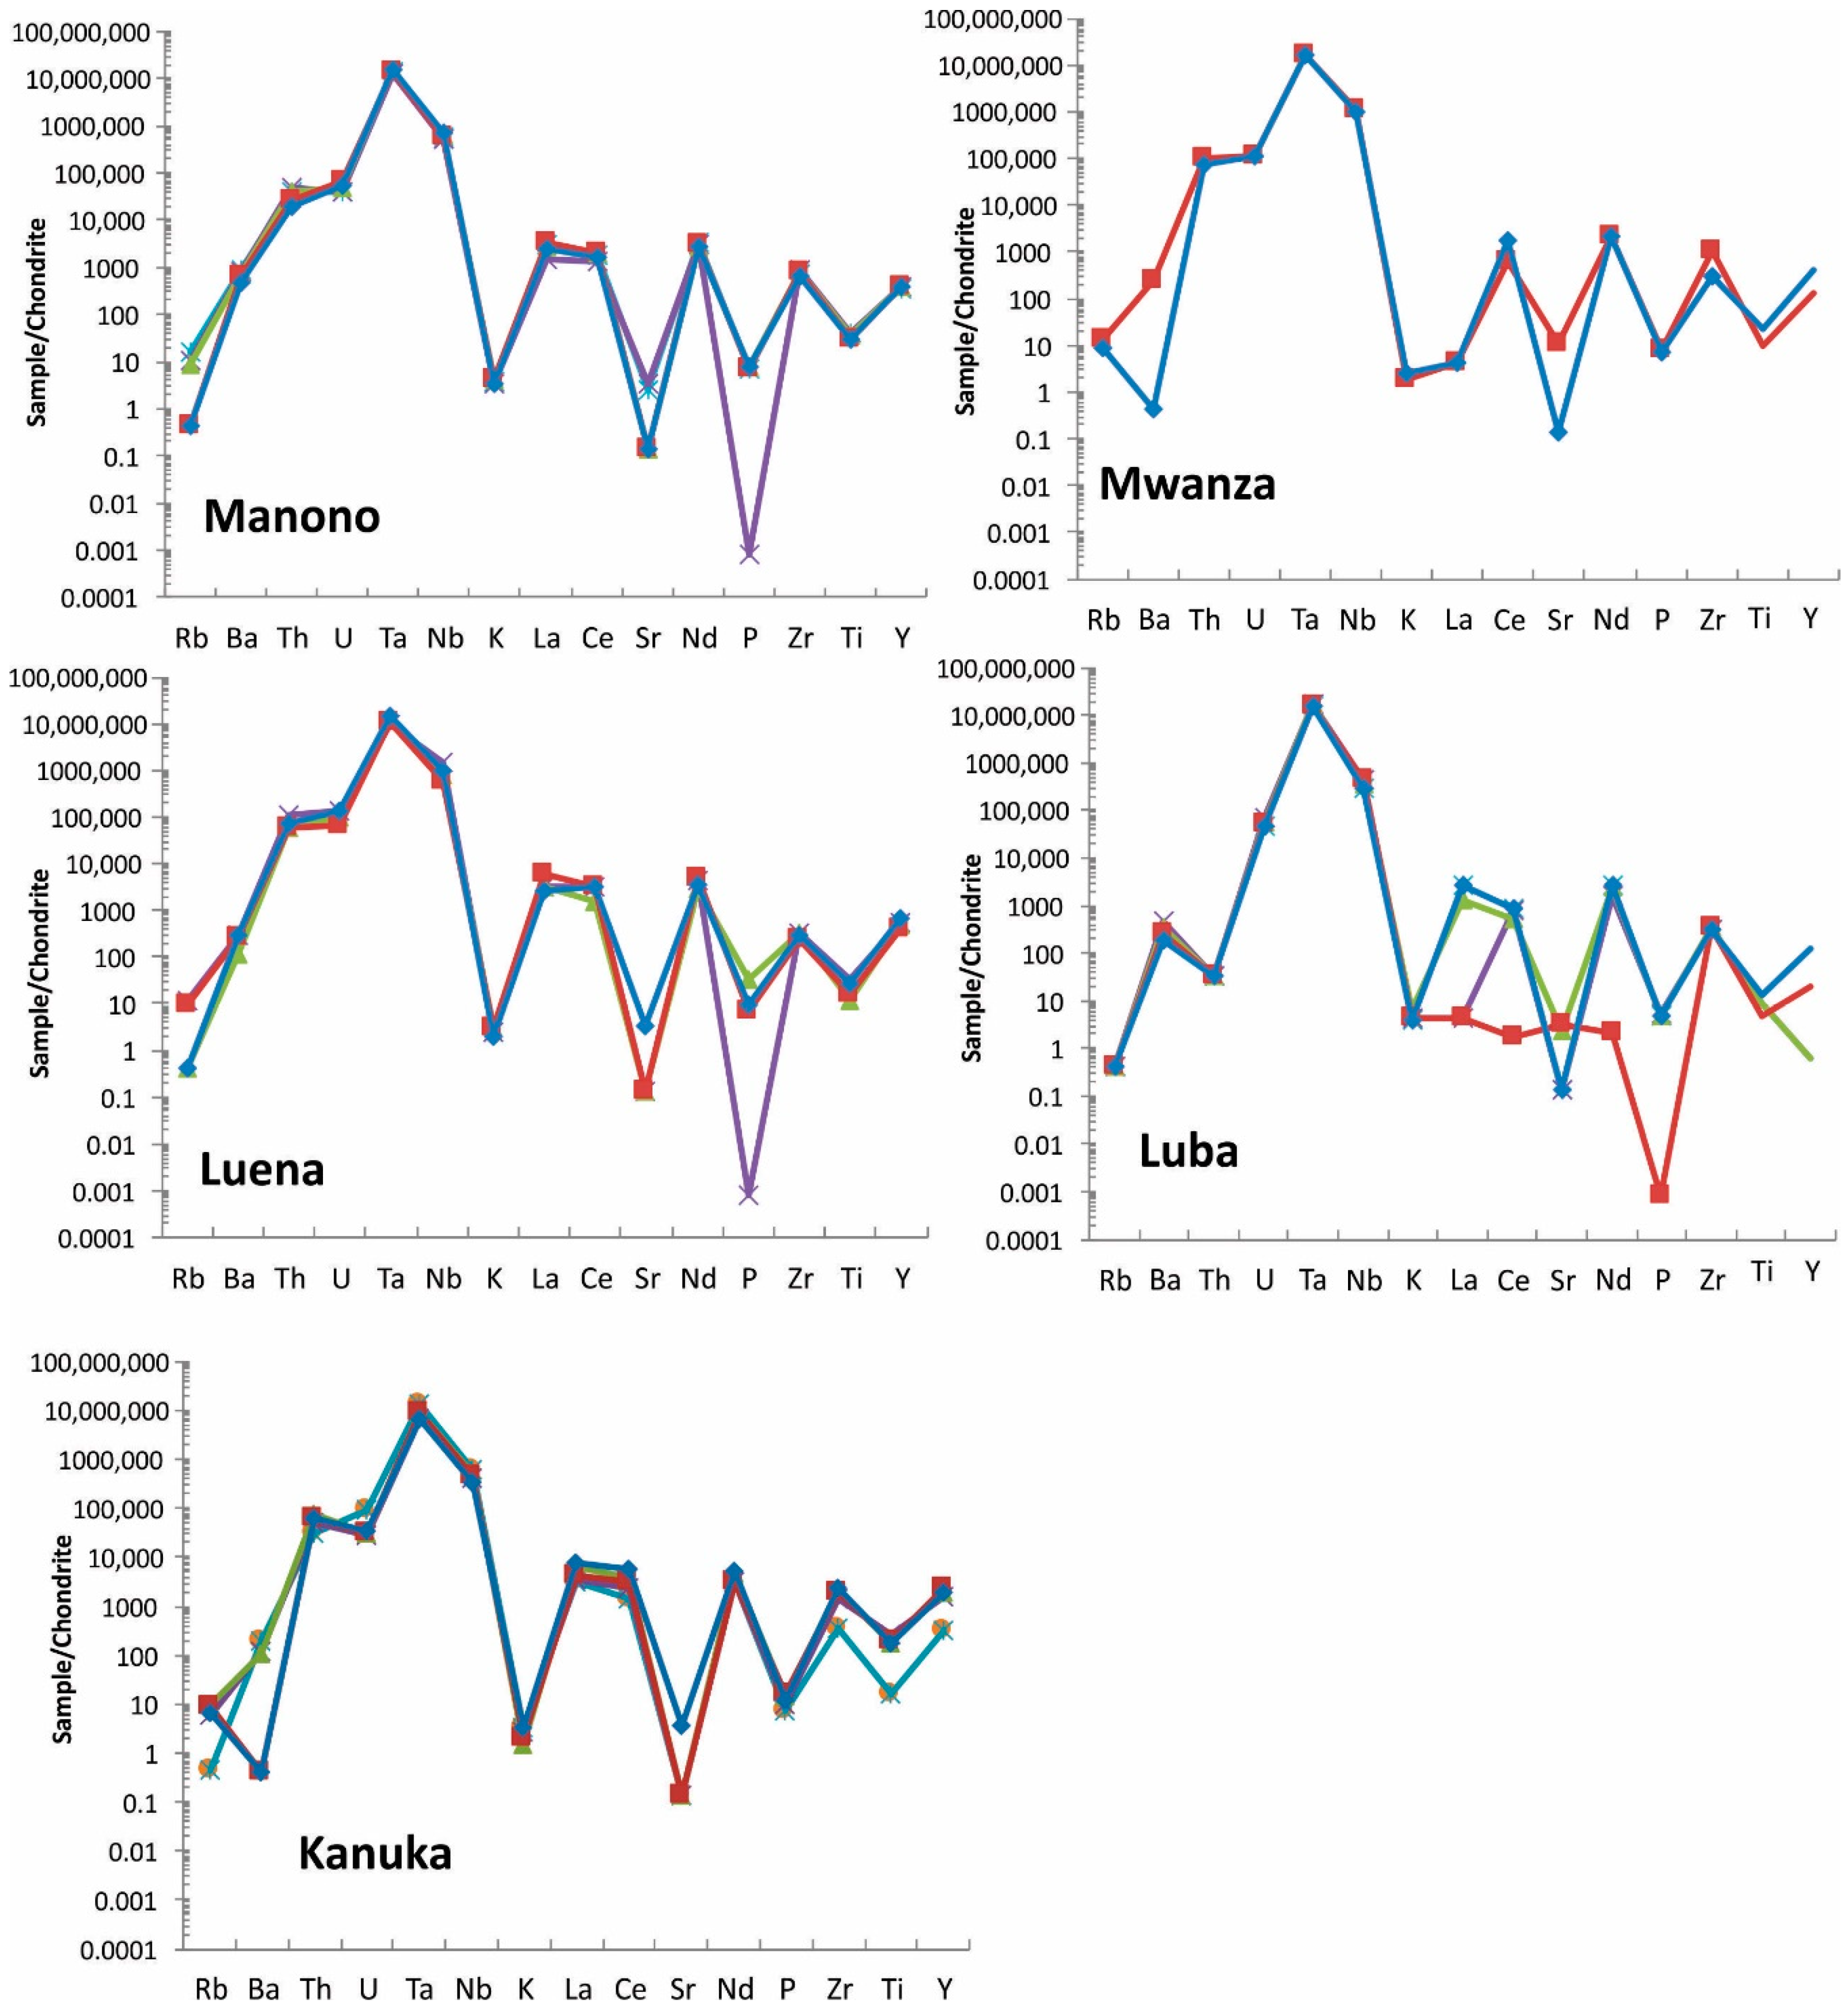
Figure 10.
Spider diagram of coltan ore samples from all studied regions. Note that Manono and Luena samples show very similar pattern. For elements <LOD, half of detection limit is used for graphing purpose. Each sample is shown with a different color.
Figure 10.
Spider diagram of coltan ore samples from all studied regions. Note that Manono and Luena samples show very similar pattern. For elements <LOD, half of detection limit is used for graphing purpose. Each sample is shown with a different color.
Table 1.
Common types of Ta-Nb deposits with a brief description, grade, tonnage, and examples [
13].
Table 1.
Common types of Ta-Nb deposits with a brief description, grade, tonnage, and examples [
13].
| Type | Brief Description | Typical Grades and Tonnage | Major Examples |
|---|
| Carbonatite-hosted primary deposits | Niobium deposits found within carbonatite in alkaline igneous provinces. | Niobec, proven & probable reserves: 23.5 million tonnes at 0.59% Nb2O5 | Niobec, Canada; Oka, Canada |
| Carbonatite-sourced secondary deposits | Zones of intense weathering or sedimentary successions above carbonatite intrusions in which Nb ore minerals are concentrated. | <1000 million tonnes at up to 3% Nb2O5 in lateritic deposits. Up to 12% Nb2O5 in placer deposit at Tomtor. Tonnage not known. | Araxa and Catalao, Brazil; Tomtor, Russia; Lueshe, Democratic Republic of Congo |
| Alkaline granite and syenite | Nb and lesser Ta deposits associated with silicic alkaline igneous rocks. Ore minerals may be concentrated by magmatic or hydrothermal processes. | Generally < 100 million tonnes at grades of 0.1 to 1% Nb2O5 and < 0.1% Ta2O5 | Motzfeldt and Ilimaussaq, Greenland; Lovozero, Russia; Thor Lake and Strange Lake, Canada; Pitinga, Brazil; Ghurayyah, Saudi Arabia; Kanyika, Malawi |
| LCT-type granite | Ta and lesser Nb deposits associated with peraluminous leucogranitic plutons, which are often hydrothermally altered. | Generally < 100 million tonnes, at grades of < 0.05% Ta2O5 | Abu Dabbab and Nuweibi, Egypt; Yichun, China |
| LCT-type pegmatite | Ta and lesser Nb deposits associated with pegmatites of LCT (Li-Cs-Ta-enriched) type | Generally < 100 million tonnes, at grades of < 0.05% Ta2O5 | Greenbushes and Wodgina, Australia; Tanco, Canada; Volta Grande, Brazil; Kenticha, Ethiopia; Morrua & Marropino, Mozambique |
Table 2.
Samples used in the study. Locations are shown in
Figure 2.
Table 2.
Samples used in the study. Locations are shown in
Figure 2.
| Ore Type | # of Samples | Location | Province |
|---|
| Wolframite | 4 | Katonga | Katanga |
| 1 | Manono | Katanga |
| 5 | Luena | Katanga |
| Cassiterite | 6 | Busanga | Katanga |
| 6 | Commir | Katanga |
| 6 | Kanuka | Katanga |
| 6 | Luena | Katanga |
| 6 | Malemba | Katanga |
| 6 | Manono | Katanga |
| 6 | Mitwaba | Katanga |
| 4 | Mwanza | Katanga |
| 2 | Kindu | Maniema |
| Coltan | 5 | Baridi | Katanga |
| 6 | Kahendwa | Katanga |
| 5 | Kanuka | Katanga |
| 4 | Katonga | Katanga |
| 6 | Kisengo | Katanga |
| 3 | Kiyambi | Katanga |
| 4 | Luba | Katanga |
| 4 | Luena | Katanga |
| 4 | Malemba | Katanga |
| 5 | Manono | Katanga |
| 3 | Mwanza | Katanga |
Table 3.
List of elements provided by the handheld analyzer. Limits of detection (LOD in ppm), as well as certified standards used for the calibration of the handheld analyzer, are included.
Table 3.
List of elements provided by the handheld analyzer. Limits of detection (LOD in ppm), as well as certified standards used for the calibration of the handheld analyzer, are included.
| Elem. | LOD | Elem. | LOD | Certified Standard | Certified Standard |
|---|
| U | 5 | Rb | 3 | SiO2 | Blank | OREAS 142 | Sn ore |
| Th | 4 | Se | 10 | BH-1 | W ore | BCS355 | Sn ore |
| Bi | 3 | As | 3 | CT-1 | W ore | FQZ X1808 | Nb ore |
| Pb | 5 | Zn | 8 | DH-1a | U-Th ore | NCSDC35008 | Sn ore |
| W | 35 | Cu | 12 | DL-1a | U-Th ore | NCSDC35009 | Sn ore |
| Ta | 5 | Ni | 25 | MP-1 | Zn-Sn-Cu-Pb ore | NCSDC35011 | Sn ore |
| Nd | 90 | Co | 20 | MP-1b | Zn-Sn-Cu-Pb ore | NCSDC35012 | Sn ore |
| Ce | 60 | Fe | 35 | OKA-1 | Nb mineral | NCSDC70006 | Mo ore |
| La | 50 | Mn | 55 | TAN-1 | Ta ore | NCSDC73309 | Stream sediment |
| Ba | 35 | Cr | 20 | DH SX18-01 | Nb ore | NCSDC86315 | Ta ore |
| Cs | 30 | V | 10 | DH SX18-04 | Nb ore | NCS DC86306 | Ta ore |
| Sb | 12 | Ti | 10 | AMIS0019 | Sn porphyry | HK3453A | Ta-Nb |
| Sn | 13 | Ca | 50 | AMIS0020 | Sn porphyry | HK3462 | Ta-Nb |
| Cd | 8 | K | 40 | AMIS0021 | Sn porphyry | HK3541 | Ta-Nb |
| Ag | 10 | S | 70 | IGS26 | Sn-W ore | HK3574 | Ta-Nb |
| Mo | 3 | P | 200 | IGS34 | Tantalite | | |
| Nb | 3 | Si | 500 | OREAS 98 | Cu ore | | |
| Zr | 3 | Al | 500 | OREAS 99b | Cu-Ag ore | | |
| Y | 5 | Mg | 3500 | OREAS 140 | Sn ore | | |
| Sr | 3 | | | OREAS 141 | Sn ore | | |
Table 4.
Chemical analysis of cassiterite ore samples (in ppm). Nd, La, Ba were not detected. _Not detected.
Table 4.
Chemical analysis of cassiterite ore samples (in ppm). Nd, La, Ba were not detected. _Not detected.
| Sample | Location | Sn | Nb | Ta | W | Ce | Th | Zr | Y | Sr | U | Rb | Mn | K | P | Fe | Ti |
|---|
| bsng-01 | Busanga | 603,579 | 212 | _ | _ | _ | _ | 87 | 17 | _ | 16 | _ | 1316 | 1195 | _ | 29,176 | 1077 |
| bsng-02 | 605,984 | 181 | _ | _ | _ | _ | 88 | 9 | _ | _ | 5 | 615 | 1032 | _ | 24,706 | 1458 |
| bsng-03 | 599,768 | 225 | _ | _ | _ | _ | 93 | _ | _ | _ | _ | 898 | 992 | _ | 21,725 | 1444 |
| bsng-04 | 633,612 | 177 | _ | _ | _ | _ | 85 | _ | _ | _ | 5 | 366 | 597 | _ | 16,425 | 1375 |
| bsng-05 | 616,379 | 214 | _ | _ | _ | _ | 110 | 9 | _ | _ | _ | 1852 | 692 | _ | 19,693 | 1338 |
| bsng sn07 | 595,287 | 157 | _ | _ | _ | _ | 106 | _ | _ | _ | 9 | 1116 | 1878 | _ | 40,880 | 1644 |
| cmr01 | Commir | 563,890 | 465 | 1585 | _ | _ | _ | 129 | 18 | _ | _ | 45 | _ | 4927 | _ | 28,271 | 2814 |
| cmr02 | 557,392 | 465 | 1341 | _ | _ | _ | 126 | 17 | _ | _ | 45 | 355 | 5057 | _ | 33,730 | 3191 |
| cmr03 | 545,369 | 332 | 748 | _ | _ | _ | 116 | 20 | _ | _ | 37 | 337 | 4125 | _ | 43,248 | 4028 |
| cmr04 | 543,514 | 382 | 1215 | 281 | _ | _ | 113 | 15 | 11 | _ | 40 | 436 | 5277 | _ | 40,398 | 2908 |
| cmr05 | 539,881 | 633 | 1242 | _ | _ | _ | 118 | 9 | 8 | _ | 42 | 389 | 5653 | _ | 35,108 | 2851 |
| cmr sn06 | 466,834 | 316 | 753 | _ | _ | _ | 118 | 21 | 7 | _ | 40 | 848 | 6186 | _ | 81,021 | 4596 |
| knk sn01 | Kanuka | 493,129 | 10,415 | 17,657 | _ | _ | 172 | 3318 | 314 | _ | 89 | 17 | 9185 | 4105 | _ | 10,522 | 6369 |
| knk sn02 | 515,889 | 8303 | 14,966 | _ | _ | 145 | 3895 | 184 | _ | 48 | 14 | 5829 | 2585 | _ | 7248 | 3581 |
| knk sn03 | 508,808 | 5604 | 12,468 | _ | _ | 148 | 3807 | 175 | _ | 82 | 18 | 3601 | 2645 | _ | 5122 | 2559 |
| knk sn04 | 493,366 | 5198 | 11,913 | _ | _ | 127 | 4098 | 166 | 9 | 77 | 12 | 2957 | 3087 | _ | 5618 | 2440 |
| knk sn05 | 499,326 | 3467 | 10,330 | _ | _ | 172 | 4620 | 155 | _ | 84 | 18 | 1517 | 3687 | _ | 4341 | 2772 |
| knk sn06 | 422,513 | 1536 | 6585 | _ | _ | 222 | 12,548 | 98 | _ | 51 | 28 | _ | 7427 | _ | 5122 | 5288 |
| ln sn01 | Luena | 561,085 | 1577 | 1354 | 17,201 | 985 | 359 | 600 | 212 | 11 | 16 | 21 | 5300 | 3078 | 3699 | 21,549 | 1628 |
| ln sn02 | 572,068 | 2391 | 1934 | 14,005 | _ | 420 | 580 | 273 | 9 | 28 | 12 | 5211 | 1447 | 4398 | 19,201 | 1869 |
| ln sn03 | 562,250 | 1915 | 1731 | 18,997 | _ | 436 | 386 | 306 | 12 | 30 | 13 | 5856 | 2093 | 1089 | 26,819 | 1055 |
| ln sn04 | 591,226 | 1792 | 1297 | 7592 | _ | 232 | 373 | 86 | 13 | _ | 14 | 4283 | 1360 | _ | 18,274 | 1512 |
| ln sn05 | 587,664 | 1422 | 1174 | 6177 | _ | 370 | 290 | 163 | _ | _ | 16 | 3433 | 2137 | _ | 19,116 | 1060 |
| ln sn07 | 549,024 | 1012 | 1356 | 3890 | _ | 141 | 3309 | 59 | 13 | _ | 26 | 3441 | 4516 | _ | 41,232 | 2677 |
| mlb sn01 | Malemba | 496,026 | 1754 | 1765 | _ | _ | 269 | 921 | 265 | 10 | 18 | 27 | 1054 | 3173 | _ | 28,844 | 6421 |
| mlb sn02 | 466,756 | 1447 | 2002 | _ | _ | 158 | 660 | 175 | _ | 23 | 21 | 1457 | 2679 | _ | 27,666 | 5278 |
| mlb sn03 | 490,270 | 2413 | 2416 | _ | _ | 252 | 1061 | 235 | 6 | _ | 25 | 1795 | 2303 | _ | 29,500 | 10,214 |
| mlb sn04 | 509,202 | 1519 | 2220 | 467 | _ | 205 | 990 | 151 | 9 | _ | 41 | 952 | 3286 | _ | 27,140 | 5049 |
| mlb sn05 | 531,744 | 1310 | 2093 | _ | _ | 174 | 780 | 89 | _ | 15 | 20 | 390 | 1991 | _ | 17,975 | 2947 |
| mlb sn07 | 402,722 | 664 | 1134 | _ | _ | 86 | 2550 | 88 | _ | 13 | 36 | 498 | 3189 | _ | 31,592 | 2763 |
| mnn sn01 | Manono | 471,080 | 2697 | 6378 | _ | _ | 107 | 3848 | 32 | _ | 38 | 11 | 1363 | 1301 | _ | 6602 | 2529 |
| mnn sn02 | 465,172 | 2619 | 6524 | _ | _ | _ | 3574 | 12 | _ | 30 | 10 | 880 | 1351 | _ | 6242 | 1697 |
| mnn sn03 | 560,713 | 3150 | 8131 | _ | _ | 81 | 3927 | 28 | _ | 26 | 18 | 1500 | 1422 | _ | 7433 | 2702 |
| mnn sn04 | 554,214 | 2940 | 8116 | _ | _ | _ | 3678 | 30 | _ | 44 | 11 | 1159 | 958 | _ | 7448 | 2807 |
| mnn sn05 | 556,193 | 2817 | 8157 | _ | _ | 92 | 7293 | 40 | _ | 39 | 16 | 944 | 550 | _ | 5418 | 4806 |
| mnn sn 05 | 450,275 | 1891 | 5860 | _ | _ | 173 | 9170 | 80 | _ | 72 | 29 | 1965 | 2048 | _ | 11,357 | 9185 |
| mtb 01 | Mitwaba | 512,959 | 1008 | 1335 | 5984 | _ | 54 | 374 | 68 | 6 | _ | 8 | 2084 | 1815 | _ | 49,215 | 28,435 |
| mtb 02 | 520,706 | 898 | 657 | 348 | 741 | 271 | 993 | 262 | _ | 16 | 10 | 850 | 1831 | _ | 41,743 | 25,323 |
| mtb 03 | 523,738 | 735 | 509 | 338 | 895 | 231 | 599 | 181 | _ | 24 | 9 | 858 | 2072 | _ | 41,576 | 17,218 |
| mtb 04 | 536,930 | 517 | 430 | _ | _ | 120 | 340 | 134 | _ | _ | 13 | 898 | 2631 | _ | 38,149 | 13,009 |
| mtb 05 | 515,917 | 666 | 448 | _ | _ | 158 | 423 | 176 | _ | _ | 11 | 693 | 2081 | _ | 39,316 | 21,480 |
| mtb sn07 | 425,956 | 377 | 363 | _ | 1784 | 158 | 355 | 735 | 9 | 17 | 33 | 541 | 4990 | _ | 43,921 | 16,771 |
| mnzw 01 | Mwanza | 518,377 | 1488 | 3627 | _ | _ | 179 | 607 | 184 | 6 | 27 | 41 | 1435 | 3282 | _ | 22,871 | 3060 |
| mnzw 02 | 532,493 | 1703 | 3580 | _ | _ | 164 | 381 | 128 | 7 | 17 | 35 | 1111 | 2975 | _ | 26,738 | 2944 |
| mnzw 06 | 578,705 | 1163 | 2713 | _ | _ | 101 | 255 | 48 | _ | _ | 26 | 572 | 2258 | _ | 13,453 | 2220 |
| mwnz sn06 | 471,932 | 762 | 2594 | _ | _ | 91 | 922 | 32 | 16 | _ | 79 | 522 | 5740 | _ | 30,282 | 3633 |
| sa2 | Kindu | 509,567 | 1136 | 1922 | 3674 | 714 | 324 | 1580 | 133 | _ | 19 | 12 | 1512 | 2044 | _ | 45,061 | 13,591 |
| klo | 556,390 | 1433 | 1092 | 19,320 | _ | 406 | 722 | 90 | 7 | 17 | 25 | 5671 | 2715 | 3976 | 22,764 | 6436 |
Table 5.
Chemical analysis of wolframite ore samples (in ppm). Ta was not detected. —Not detected.
Table 5.
Chemical analysis of wolframite ore samples (in ppm). Ta was not detected. —Not detected.
| Sample | Location | Sn | Nb | W | Nd | Ce | La | Ba | Th | Zr | Y | Sr | U | Rb | Mn | K | P | Fe | Ti |
|---|
| ktng w08 | Katonga | 1863 | 1249 | 487,618 | 1606 | 1647 | 1060 | 174 | 773 | 246 | 102 | _ | _ | _ | 6913 | 370 | 46,103 | 126,606 | 1163 |
| ktng w09 | 9833 | 1386 | 442,865 | 1599 | 1969 | 1314 | _ | 909 | 480 | 138 | _ | 43 | _ | 7930 | 549 | 39,936 | 138,035 | 6107 |
| ktng w10 | 674 | 1298 | 480,265 | 1698 | 1960 | 1167 | 251 | 868 | 284 | 109 | _ | 41 | 8 | 6762 | _ | 45,446 | 130,805 | 1291 |
| ktng w11 | 7930 | 2352 | 421,252 | 2354 | 2935 | 1947 | 402 | 1362 | 701 | 212 | 6 | 58 | _ | 9978 | 939 | 136,213 | 152,175 | 10,451 |
| mnn w02 | Manono | 7155 | 2819 | 507,004 | 735 | 174 | _ | 183 | 69 | 31 | 160 | 13 | 26 | _ | 25,357 | _ | 49,309 | 95,633 | _ |
| ln w01 | Luena | 110,375 | 1805 | 378,093 | 692 | 208 | 382 | _ | _ | 45 | 67 | 10 | _ | 9 | 65,090 | 1560 | 31,353 | 53,283 | 1308 |
| ln w02 | 113,783 | 2296 | 388,223 | 655 | _ | _ | _ | 95 | 39 | 30 | 22 | _ | 10 | 69,446 | 1194 | 33,666 | 56,043 | _ |
| ln w03 | 102,407 | 1911 | 368,425 | 536 | 371 | 329 | 295 | _ | 27 | 41 | 28 | _ | 11 | 66,489 | 2378 | 31,872 | 80,184 | 696 |
| ln w04 | 69,731 | 2324 | 414,509 | 849 | 383 | 463 | 329 | _ | 70 | 91 | 40 | _ | 11 | 60,201 | 1566 | 35,991 | 89,085 | 735 |
| ln w06 | 79,615 | 2424 | 400,803 | 674 | 177 | _ | 248 | _ | 36 | 49 | 40 | 18 | 12 | 72,188 | 1586 | 34,847 | 78,563 | 791 |
Table 6.
Chemical analysis of coltan ore samples (in ppm). _Not detected.
Table 6.
Chemical analysis of coltan ore samples (in ppm). _Not detected.
| Sample | Location | Sn | Nb | Ta | W | Nd | Ce | La | Ba | Th | Zr | Y | Sr | U | Rb | Mn | K | P | Fe | Ti |
|---|
| tmk13 | Baridi | 4569 | 26,256 | 197,175 | _ | 526 | 149 | _ | 604 | 572 | 1069 | 19 | 43 | 108 | 30 | 16,583 | 2801 | 3526 | 99,700 | 6183 |
| tmk14 | 24,135 | 39,842 | 257,858 | _ | 486 | _ | _ | 812 | 515 | 720 | 34 | 18 | 177 | 15 | 20,299 | 2280 | 4442 | 110,508 | 4503 |
| tmk15 | 4842 | 49,526 | 279,696 | _ | 417 | 227 | _ | 278 | 800 | 1209 | 32 | 25 | 197 | 20 | 21,510 | 2371 | 5752 | 93,954 | 6831 |
| tmk16 | 2874 | 37,981 | 230,759 | _ | 633 | 295 | _ | 303 | 669 | 1128 | 38 | 33 | 119 | 34 | 16,545 | 2316 | 3826 | 96,267 | 7500 |
| tmk17 | 2047 | 32,964 | 222,229 | _ | 378 | 122 | _ | 429 | 547 | 932 | 32 | 50 | 126 | 20 | 16,427 | 1950 | 5503 | 95,509 | 6152 |
| tmk 07 | Kahendwa | 41,971 | 151,734 | 255,140 | _ | 1593 | 1580 | 1196 | 1357 | 960 | 1559 | 857 | _ | 311 | 15 | 64,122 | 1076 | 8423 | 98,807 | 22,171 |
| tmk 08 | 11,667 | 259,013 | 174,237 | _ | 1118 | 707 | _ | 2084 | _ | 977 | 224 | _ | 426 | _ | 65,250 | 2154 | _ | 102,251 | 15,619 |
| tmk 09 | 63,223 | 216,909 | 156,625 | _ | 1407 | 1725 | 1128 | 548 | _ | 895 | 269 | _ | 171 | _ | 53,242 | 2217 | 6856 | 110,388 | 26,193 |
| tmk 10 | 50,897 | 197,724 | 115,541 | _ | 1518 | 2209 | 1723 | 359 | 689 | 940 | 653 | _ | 226 | _ | 42,865 | 3768 | _ | 98,725 | 27,025 |
| tmk 11 | 8694 | 318,647 | 167,390 | _ | _ | _ | _ | _ | _ | 1187 | _ | _ | 128 | _ | 56,895 | 1252 | 9319 | 109,618 | 2172 |
| tmk 12 | 20,307 | 279,824 | 199,619 | _ | 1254 | 428 | _ | 621 | _ | 1499 | _ | _ | 181 | _ | 57,221 | 1669 | _ | 102,090 | 3789 |
| knk cl01 | Kanuka | 106,596 | 147,119 | 190,025 | _ | 1511 | 884 | 718 | 460 | 894 | 1419 | 480 | _ | 777 | _ | 83,324 | 1806 | 8397 | 40,182 | 7522 |
| knk cl02 | 58,933 | 97,201 | 97,776 | _ | 1489 | 1464 | 802 | 279 | 1418 | 5603 | 2451 | _ | 226 | 15 | 99,357 | 1436 | 12,018 | 126,586 | 115,270 |
| knk cl03 | 53,425 | 126,487 | 131,947 | _ | 2160 | 2468 | 1490 | 247 | 2166 | 7834 | 3118 | _ | 242 | 24 | 107,247 | 776 | 18,163 | 90,768 | 76,631 |
| knk cl04 | 44,567 | 116,207 | 123,262 | _ | 1503 | 1916 | 968 | _ | 1872 | 7404 | 3784 | _ | 240 | 20 | 102,280 | 1070 | 18,957 | 106,265 | 87,947 |
| knk cl05 | 79,986 | 85,449 | 95,856 | _ | 2474 | 3396 | 1769 | _ | 1890 | 9505 | 3070 | 28 | 274 | 16 | 77,719 | 1831 | 14,808 | 102,376 | 75,782 |
| ktng cl06 | Katonga | 98,486 | 99,326 | 288,880 | _ | 896 | 453 | _ | 725 | 598 | 1507 | _ | 54 | 462 | 30 | 73,927 | 2167 | 8081 | 41,603 | 3178 |
| ktng cl07 | 73,567 | 82,731 | 265,064 | 47,250 | 968 | 696 | 326 | 546 | 858 | 1715 | 60 | 43 | 436 | 42 | 66,811 | 3207 | 26,358 | 64,889 | 5572 |
| ktng cl08 | 93,378 | 89,190 | 298,845 | _ | 1258 | 680 | 439 | 822 | 953 | 1856 | 31 | 40 | 357 | 85 | 68,831 | 3609 | 5548 | 39,839 | 5387 |
| ktng cl11 | 169,444 | 100,413 | 231,559 | _ | 1103 | 755 | 770 | 909 | 722 | 1337 | 26 | 44 | 389 | 66 | 66,492 | 3044 | 5790 | 44,405 | 8163 |
| tmk 01 | Kisengo | 41,366 | 61,871 | 219,011 | _ | _ | 480 | _ | 324 | _ | 2366 | 94 | 28 | 314 | 18 | 37,725 | 2856 | 6981 | 93,829 | 8917 |
| tmk 02 | 41,149 | 61,567 | 219,143 | _ | 1118 | 673 | 319 | 763 | _ | 1868 | 112 | 20 | 255 | _ | 37,885 | 2375 | 6778 | 98,495 | 6255 |
| tmk 03 | 40,159 | 65,982 | 233,385 | _ | 1044 | 745 | 455 | 796 | _ | 2129 | 788 | 21 | 289 | 28 | 36,614 | 3501 | 6867 | 93,668 | 8134 |
| tmk 04 | 34,146 | 56,162 | 201,436 | _ | 505 | 362 | _ | 765 | _ | 2317 | 116 | 23 | 232 | 20 | 34,510 | 3312 | 5549 | 97,645 | 8449 |
| tmk 05 | 40,265 | 59,723 | 202,301 | _ | 705 | 638 | 436 | 799 | _ | 2141 | 205 | 24 | 267 | _ | 33,502 | 2772 | 3664 | 100,116 | 8159 |
| tmk 06 | 45,547 | 54,120 | 189,079 | _ | 715 | 890 | 403 | 727 | _ | 2330 | 293 | 33 | 259 | 16 | 31,419 | 2849 | 5057 | 105,903 | 11,548 |
| kymb-cl-08 | Kiyambi | 101,583 | 152,887 | 244,793 | _ | 1435 | 502 | _ | 478 | 1579 | 1240 | _ | 122 | 506 | 36 | 49,592 | 3360 | 10,249 | 95,203 | 3841 |
| kymb-cl-09 | 128,958 | 104,915 | 214,978 | _ | 1354 | 642 | 669 | 1126 | 740 | 1694 | 157 | 37 | 546 | 32 | 55,585 | 3302 | 6721 | 80,224 | 7040 |
| kymb-cl-12 | 113,026 | 151,377 | 211,363 | _ | 667 | 457 | _ | 437 | 1172 | 2325 | 85 | 28 | 774 | 50 | 59,413 | 4107 | 9060 | 79,396 | 5905 |
| tmk 18 | Luba | 76,347 | 108,203 | 241,173 | _ | 742 | 485 | _ | 1156 | _ | 1250 | _ | _ | 575 | _ | 63,059 | 2294 | 6407 | 73,084 | 3717 |
| tmk 19 | 68,640 | 86,011 | 233,447 | _ | 1126 | 310 | 320 | 853 | _ | 1355 | _ | 17 | 473 | _ | 59,113 | 3399 | 5651 | 55,261 | 3894 |
| tmk 20 | 67,319 | 104,638 | 227,126 | _ | _ | _ | _ | 643 | _ | 1394 | 31 | 22 | 395 | _ | 60,061 | 2282 | _ | 62,500 | 2058 |
| tmk 21 | 103,902 | 72,604 | 218,669 | _ | 1279 | 551 | 622 | 474 | _ | 1200 | 188 | _ | 386 | _ | 65,079 | 2043 | 5768 | 54,663 | 5953 |
| ln cl01 | Luena | 39,075 | 362,518 | 144,023 | _ | 2171 | 1924 | 773 | 742 | 3225 | 1305 | 880 | _ | 1115 | 27 | 73,904 | 1282 | _ | 13,4599 | 14,056 |
| ln cl02 | 77,066 | 199,214 | 164,974 | 83,689 | 1423 | 915 | 752 | 286 | 1748 | 1202 | 747 | _ | 842 | _ | 84,021 | 1582 | 37,958 | 72,865 | 4979 |
| ln cl04 | 240,108 | 138,372 | 159,187 | _ | 2203 | 1975 | 1428 | 674 | 1774 | 920 | 604 | _ | 507 | 22 | 61,906 | 1717 | 8287 | 63,880 | 6825 |
| ln cl05 | 46,364 | 235,442 | 203,212 | _ | 1617 | 1895 | 628 | 719 | 2052 | 1193 | 1056 | 25 | 1112 | _ | 74,650 | 1064 | 10,817 | 94,241 | 12,178 |
| mlb cl07 | Malemba | 14,752 | 186,169 | 208,856 | _ | 1175 | 616 | _ | 302 | 1749 | 1989 | 525 | _ | 967 | 25 | 87,873 | 1875 | 10,093 | 58,981 | 9609 |
| mlb cl08 | 107,035 | 302,419 | 171,660 | 3029 | _ | 1015 | 1090 | 532 | 2956 | 1526 | 305 | 49 | 677 | 41 | 66,719 | _ | _ | 97,234 | 4888 |
| mlb cl12 | 96,334 | 217,000 | 190,939 | _ | 11,731 | 21,007 | 12,853 | _ | 6427 | 816 | 10,785 | _ | 1368 | _ | 69,842 | _ | 49,949 | 84,843 | 6562 |
| mlb cl01 | 20,121 | 201,768 | 235,466 | _ | 921 | 689 | 453 | _ | 1226 | 927 | 580 | _ | 1061 | _ | 98,587 | 1925 | 13,755 | 44,083 | 6717 |
| mnn cl01 | Manono | 41,302 | 137,238 | 193,925 | _ | 1521 | 1089 | 758 | 2162 | 1208 | 2814 | 539 | 17 | 323 | 38 | 87,006 | 2097 | 8688 | 96,478 | 18,144 |
| mnn cl02 | 57,856 | 133,020 | 181,996 | _ | 1393 | 811 | 355 | 1844 | 1407 | 3601 | 593 | 25 | 333 | 23 | 82,411 | 1866 | _ | 107,490 | 17,924 |
| mnn cl03 | 43,041 | 162,592 | 216,369 | _ | 1314 | 1194 | 662 | 1686 | 1127 | 2948 | 599 | _ | 412 | 21 | 93,726 | 2293 | 8865 | 73,721 | 15,981 |
| mnn cl04 | 83,504 | 145,254 | 200,455 | _ | 1351 | 1260 | 837 | 1515 | 739 | 3167 | 590 | _ | 538 | _ | 85,684 | 2344 | 8126 | 63,291 | 13,265 |
| mnn cl05 | 37,026 | 168,489 | 216,717 | _ | 1336 | 970 | 609 | 1197 | 586 | 2468 | 590 | _ | 443 | _ | 89,805 | 1779 | 9363 | 69,813 | 13,049 |
| mwnz cl08 | Mwanza | 40,005 | 266,340 | 241,071 | _ | 1008 | 375 | _ | 607 | 2806 | 4089 | 198 | 75 | 925 | 30 | 94,988 | 1059 | 9657 | 66,774 | 4186 |
| mwnz cl10 | 40,369 | 238,972 | 235,377 | _ | 995 | 1027 | _ | _ | 2257 | 1152 | 681 | _ | 934 | 21 | 96,481 | 1407 | 8733 | 61,949 | 10,150 |
| mwnz cl04 | 33,684 | 163,981 | 205,803 | _ | 1419 | 1116 | 333 | 242 | 956 | 2495 | 591 | _ | 860 | _ | 91,188 | 1282 | 11,269 | 50,629 | 8535 |
Table 7.
Elements in chondrite-normalized coltan ore samples in order of increasing from left to right. Average values were used in the calculations. Based on chondrite-normalized values, Ta and Nb are the first and second highest elements, respectively, followed by other elements in each deposit.
Table 7.
Elements in chondrite-normalized coltan ore samples in order of increasing from left to right. Average values were used in the calculations. Based on chondrite-normalized values, Ta and Nb are the first and second highest elements, respectively, followed by other elements in each deposit.
| Region | Elements |
|---|
| Baridi | P | La | K | Sr | Rb | Ti | Y | Ba | Ce | Zr | Nd | U | Th | Nb | Ta |
| Kahendwa | Sr | Rb | P | K | Ti | Y | Zr | Ba | Ce | Nd | La | Th | U | Nb | Ta |
| Kanuka | Sr | K | Rb | P | Ba | Ti | Zr | Y | Ce | Nd | La | U | Th | Nb | Ta |
| Katonga | K | Sr | P | Ti | Y | Rb | Ba | Zr | Ce | La | Nd | Th | U | Nb | Ta |
| Kisengo | Sr | P | K | Rb | Ti | Th | Y | Ba | Zr | Ce | La | Nd | U | Nb | Ta |
| Kiyambi | K | P | Sr | Ti | Rb | Y | Ba | Zr | Ce | La | Nd | Th | U | Nb | Ta |
| Luba | Rb | Sr | P | K | Ti | Th | Y | Ba | Zr | Ce | La | Nd | U | Nb | Ta |
| Luena | Sr | K | Rb | P | Ti | Ba | Zr | Y | Ce | La | Nd | Th | U | Nb | Ta |
| Malemba | K | Sr | Rb | P | Ti | Ba | Zr | Y | Nd | Ce | La | Th | U | Nb | Ta |
| Manono | Sr | K | P | Rb | Ti | Y | Ba | Zr | Ce | La | Nd | Th | U | Nb | Ta |
| Mwanza | K | La | Sr | P | Rb | Ti | Ba | Y | Zr | Ce | Nd | Th | U | Nb | Ta |
Table 8.
Discriminators that are used for fingerprinting conflict minerals.
Table 8.
Discriminators that are used for fingerprinting conflict minerals.
| Ore Type | Discriminator | Composite Factors | Discriminated Region |
|---|
| Cassiterite | Sn-W-(Ta + Nb) triangular | Sn/10, 20 W, 20(Ta + Nb) | Overall cassiterite composition of all regions |
| Sn vs. (Fe/Ti) | Sn vs. 100(Fe/Ti) | Malemba, Mwanza, Commir, Luena, Busanga |
| Ti vs (Ti/Nb + Ta) | Ti vs. 100(Ti/Nb + Ta) | Mitwaba, Busanga |
| W + Th vs. Fe/Ti | Log(W + Th) vs. 100(Fe/Ti) | Luena |
| Y + Th vs. Nb+Ta | Y + Th vs. Log(Nb + Ta) | Busanga, Commir, Manono, Kanuka |
| W + Th vs. Ti/(Ta + Nb) | Log(W + Th) vs. Log(100Ti/(Ta + Nb)) | Mitwaba, Kindu, Luena |
| Ta/Nb vs. Ti/(Ta + Nb) | 100Ta/Nb vs. Log(100Ti/(Ta + Nb)) | Busanga, Mitwaba, Malemba, Mwanza |
| Wolframite | Sn-W-(Ta + Nb) triangular | Sn, W, (Ta + Nb) | Overall wolframite composition of all regions |
| W-Fe-Mn | W, 10Fe, 10Mn | Katonga, Luena, Manono |
| Fe vs. Mn | Fe, Mn | Katonga, Luena, Manono |
| W vs. Sn | W, Sn | Katonga, Luena, Manono |
| W vs. Th | W, Th | Katonga, Luena, Manono |
| Sn vs. Th | Sn, Th | Katonga, Luena, Manono |
| W vs. Zr | W, Zr | Katonga, Luena, Manono |
| W/Sn vs. Zr | Log(W/Sn), Log(Zr) | Katonga, Luena, Manono |
| Coltan | Nb vs. Ta | Nb, Ta | Baridi, Kisengo, Katonga, Kanuka (?) |
| Nb/Ta vs. Sn | 100 Nb/Ta, LogSn | Baridi, Kisengo, Manono, Kanuka, Katonga/Luba/Kiyambi |
| Mn vs. Fe/Mn | Mn, Fe/Mn | Baridi, Kisengo, Kahendwa/Kiyambi |
| Mn vs. Fe/Ti | Mn, Fe/Mn | Baridi, Kisengo, Kanuka |
| Spider diagrams | Rb, Ba, Th, U, Ta, Nb, K, La, Ce, Sr, Nd, P, Zr, Ti, Y all divided by same elements in Chondrite Meteorite | Most regions have unique spider pattern. |


