Article

Full-Scale Pore Structure and Fractal Dimension of the Longmaxi Shale from the Southern Sichuan Basin: Investigations Using FE-SEM, Gas Adsorption and Mercury Intrusion Porosimetry

1
State Key Laboratory of Petroleum Resources and Prospecting, China University of Petroleum, Beijing 102249, China
2
Unconventional Oil & Gas Institute, China University of Petroleum, Beijing 102249, China
3
Key Laboratory of Tectonics and Petroleum Resources, Ministry of Education, China University of Geosciences, Wuhan 430074, China
4
School of Earth Resources, China University of Geosciences, Wuhan 430074, China
5
Energy & Geoscience Institute, University of Utah, Salt Lake City, UT 84108, USA
*
Authors to whom correspondence should be addressed.
Minerals 2019, 9(9), 543; https://doi.org/10.3390/min9090543
Submission received: 2 August 2019 / Revised: 3 September 2019 / Accepted: 4 September 2019 / Published: 9 September 2019
(This article belongs to the Special Issue Mineralogy of Shale Gas and Other Low Permeability Reservoirs)

Abstract

:
Pore structure determines the gas occurrence and storage properties of gas shale and is a vital element for reservoir evaluation and shale gas resources assessment. Field emission scanning electron microscopy (FE-SEM), high-pressure mercury intrusion porosimetry (HMIP), and low-pressure N2/CO2 adsorption were used to qualitatively and quantitatively characterize full-scale pore structure of Longmaxi (LM) shale from the southern Sichuan Basin. Fractal dimension and its controlling factors were also discussed in our study. Longmaxi shale mainly developed organic matter (OM) pores, interparticle pores, intraparticle pores, and microfracture, of which the OM pores dominated the pore system. The pore diameters are mainly distributed in the ranges of 0.4–0.7 nm, 2–20 nm and 40–200 μm. Micro-, meso- and macropores contribute 24%, 57% and 19% of the total pore volume (PV), respectively, and 64.5%, 34.6%, and 0.9% of the total specific surface area (SSA). Organic matter and clay minerals have a positive contribution to pore development. While high brittle mineral content can inhibit shale pore development. The fractal dimensions D1 and D2 which represents the roughness of the shale surface and irregularity of the space structure, respectively, are calculated based on N2 desorption data. The value of D1 is in the range of 2.6480–2.7334 (average of 2.6857), D2 is in the range of 2.8924–2.9439 (average of 2.9229), which indicates that Longmaxi shales have a rather irregular pore morphology as well as complex pore structure. Both PV and SSA positively correlated with fractal dimensions D1 and D2. The fractal dimension D1 decreases with increasing average pore diameter, while D2 is on the contrary. These results suggest that the small pores have a higher roughness surface, while the larger pores have a more complex spatial structure. The fractal dimensions of shale are jointly controlled by OM, clays and brittle minerals. The TOC content is the key factor which has a positive correlation with the fractal dimension. Clay minerals have a negative influence on fractal dimension D1, and positive influence D2, while brittle minerals show an opposite effect compared with clay minerals.

1. Introduction

Shale gas has become an important unconventional natural gas resource after its rapid development in North America [1,2], and it has also become the focus of exploration in China, Australia, and other countries [3,4]. With the rapid increase in energy demand as well as the serious air pollution in China, the Chinese government actively promotes the development of clean energy, especially natural gas. Thus, the industrial exploitation as well as theoretical research of shale gas in China has been greatly improved since 2010 [5,6,7]. According to the estimates issued by the U.S. DOE’s Energy Information Administration, the technically recoverable shale gas resource is about 36.1 × 10¹² m3 in China [8], which suggested a significant exploitation potential for shale gas resources in China.
Shale pore predominantly controls gas storage and seepage properties, so it is the key element influencing shale gas accumulation and enrichment, and is also critical for resource assessment and exploration [6,9,10]. Therefore, quantitative study of pore structure is important for understanding gas occurrence, storage, as well as fluid flow mechanisms [11]. Unlike conventional reservoirs, shales commonly exhibit a complex and heterogeneous pore system and a wide pore size distribution with low porosity and permeability [1,11,12], so it is difficult for pore structure characterization. At present, research works associated with pore system mainly focus on shale pore observation, the classification of pores, the characterization of pore size distribution, factors influencing pore development, and its effect on gas storage and enrichment [13,14,15,16]. Due to the variety and complexity of shale pores, several pore system classification schemes have been proposed by researchers to describe various pore types in shale [13,17,18,19]. These pore system classification schemes are mainly based on pore shape, size, and the relationship between pores and particles. According to the classification proposed by Loucks et al. [13], the pores can be categorized into three types: mineral matrix pores (interparticle pores and intraparticle pores), organic-matter pores and fracture pores, and this classification scheme is widely used. According to the International Union of Pure and Applied Chemistry (IUPAC) [20], shale pores are generally classified into micropores (<2 nm), mesopores (2–50 nm) and macropores (>50 nm), which is another widely used classification scheme.
In order to fully characterize the complex pore system of a shale reservoir, a combination of qualitative and quantitative methods have historically been used on shale samples. The qualitative methods are mainly direct imaging techniques, including scanning electron microscopy (SEM) [21], transmission electron microscopy (TEM) [2,14], field emission scanning electron microscopy (FE-SEM) [13], focused ion beam scanning electron microscopy (FIB-SEM) [22,23,24], atomic force microscopy (AFM) [25], X-ray micro- or nano-computed tomography (X-CT) [26], small-/ultrasmall-angle neutron scattering (SANS/USANS) [27,28,29]. The geometry, pore types, size, distributions and connectivity of the pore network can be observed with these direct imaging methods. FE-SEM method is the most widely used direct approach to qualitatively characterize the pore structure. However, these direct imaging experiments cannot quantitatively characterize the full-scale pore structure information because of the instrumental limitations. Therefore, the indirect methods are commonly combined to comprehensively investigate the shale pore structure characteristics, such as low-pressure N2/CO2 gas adsorption, high-pressure mercury intrusion porosimetry (HMIP) and nuclear magnetic resonance (NMR) experiments [11,30,31,32,33,34]. These methods can be used to quantitatively investigate the pore structure characteristics, including the total porosity, PV, SSA, pore shapes, and PSD [11,30,31,32,33,34]. Both advantages and disadvantages exist in direct and indirect methods, therefore, a combination of them is an effective approach for shale pore characterization.
Fractal geometry theory, which was firstly proposed by Mandelbrot [35], has also been widely used to analyze and quantify the complexity and heterogeneity of pore structure [36,37,38,39]. According to the fractal theory, the fractal dimension should be in the range of 2–3 [40,41]. In general, the fractal dimensions increase with increasing complexity and heterogeneity of shale pores. Fractal dimensions can be calculated using the appropriate model based on gas adsorption experiments, such as fractal BET model, Langmuir model, Frenkel-Halsey-Hill (FHH) model and thermodynamic method [38,42]. Fractal characteristics research based on FHH model and N2 adsorption experiment data are commonly applied to quantitatively characterize the shale pore structure [12,39,43].
In this work, we examined shale samples from commercial development interval of Longmaxi (LM) Formation (Fm) that represent over-mature shales [7]. With a combination of FE-SEM, low-pressure N2/CO2 gas adsorption, HMIP, and fractal theory, the main objectives in our study are to: (1) characterize the pore morphology, pore volume, specific surface area and pore size distribution; (2) quantitatively investigate the fractal characteristic; (3) determine the correlations between fractal dimensions and pore structure parameters; (4) identify the main controlling factors on pore development and fractal dimensions. We expect our work can provide an important experimental data for characterization of the pore structure in LM shales, and contribute valuable information to reservoir evaluation and gas resource assessment, as well as shale gas exploration in the Southern Sichuan Basin.

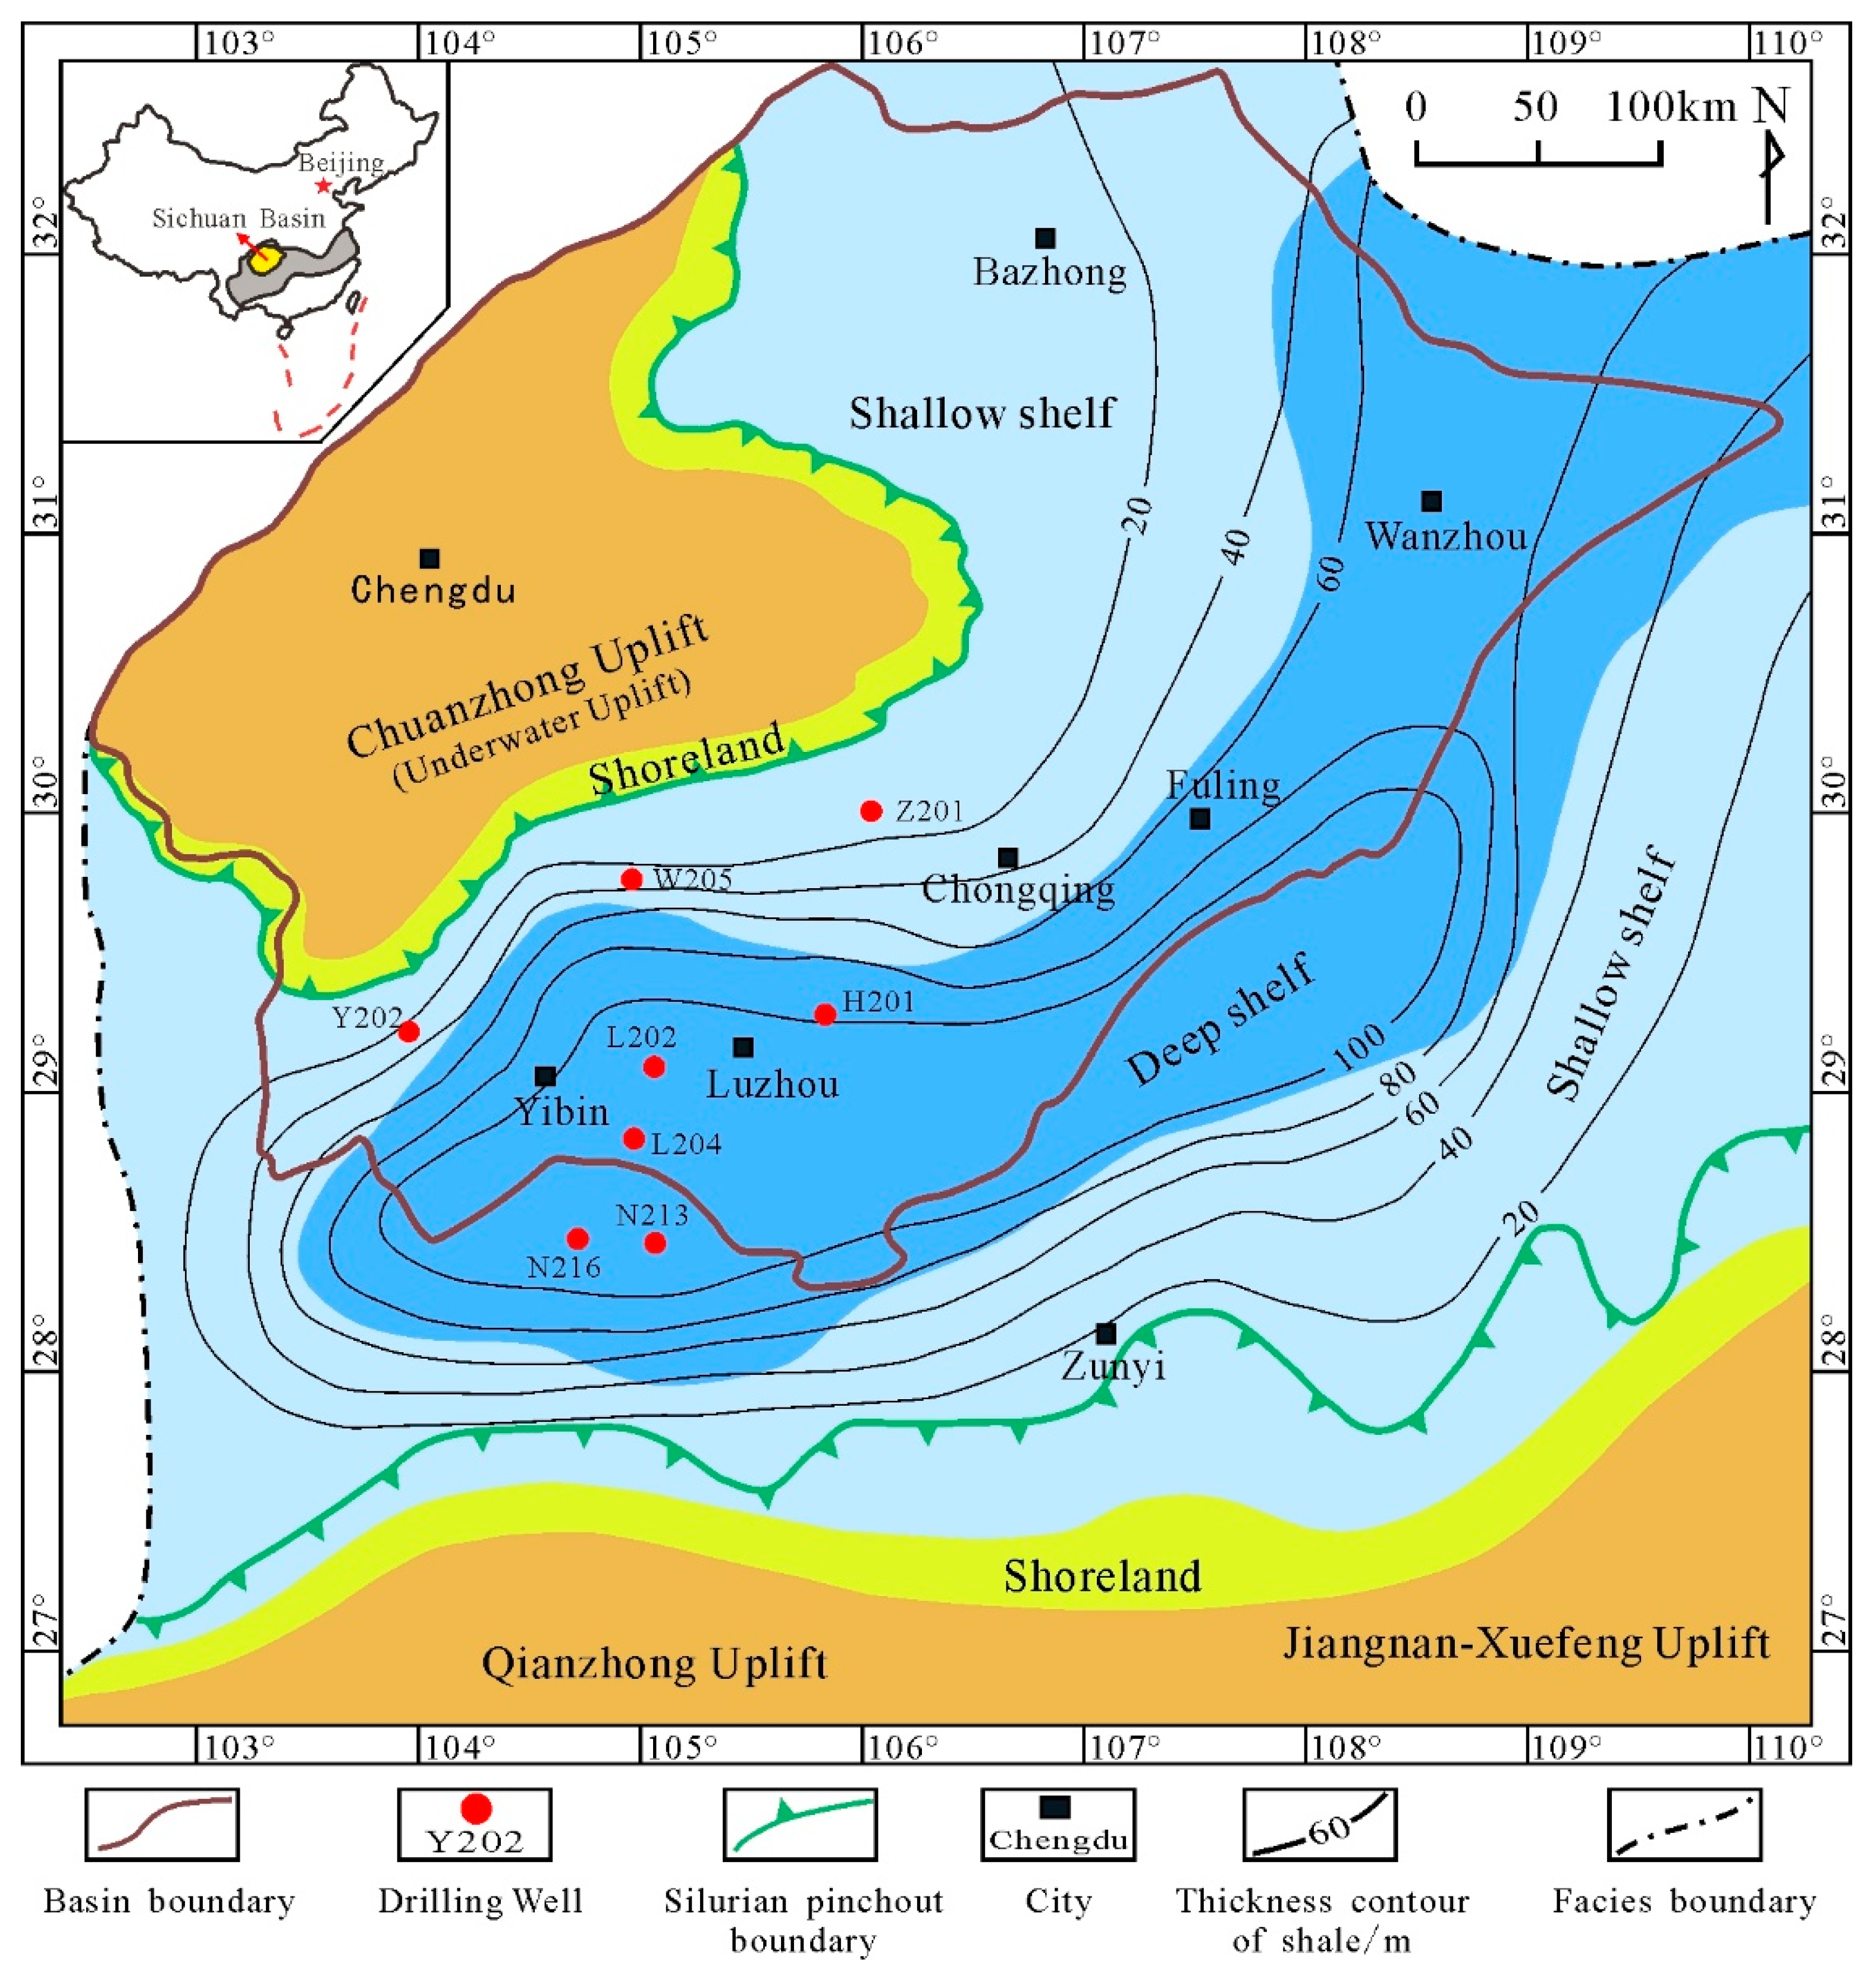
2. Geological Setting

The Sichuan Basin located in South China is a tectonically stable sedimentary basin bordered by Qiyue and Dalou Mountains to the east, Daliang Mountains and Yunnan-Guizhou Plateau to the south, the Longmen Mountains to the west, and Micang and Daba Mountains to the north [5,44]. The Sichuan Basin, which covers more than 1.8 × 10⁵ km2, has abundant shale gas resources with 5441.29 × 108 m3 in place [45], and is the major shale gas exploration target area. Two main intervals of marine shales were deposited in the Sichuan Basin: The Lower Cambrian Qiongzhusi Formation and the Upper Ordovician Wufeng-Lower Silurian Longmaxi Formation, which are the attractive target for shale gas exploration and exploitation [5,7,44]. The Lower Silurian Longmaxi (LM) Formation (Fm) with high TOC content, is the most advantageous interval for shale gas enrichment [46]. At present, four shale gas commercial development zones have been built in the eastern and southern Sichuan Basin, namely, Jiaoshiba, Weiyuan, Changning, and Zhaotong shale gas field. The Sichuan Basin has developed a total thickness of 6–12 km stratigraphic sequence from Presinian to Quaternary [47]. The study area is located in the south of Sichuan Basin, with well-developed folds and faults structures, which mainly developed on the edge of the Basin, including the flat fold belt in the southwest, lower and gentle fold belt in the south, and high-steep fault fold belt in the east of Sichuan Basin. The southern Sichuan Basin has experienced several tectonic movements since Yangtze platform developed, including Caledonian (late Sinian-Silurian), Hercynian (Devonian-Permian), Indosinian (Triassic), Yanshanian (Jurassic-late Cretaceous) and Himalayan (Paleogene-Quaternary) [48]. The study interval of Longmaxi Fm is widely distributed in the southern Sichuan Basin (Figure 1). In the early Silurian, global transgression occurred, and the Sichuan Basin was subjected to the violent collision, and the strata were uplifted by compression, resulting in a limited sea area and a low-energy, anoxic sedimentary environment. In this environment, a set of fine clastic rocks, which are widely distributed and thick, deposited within the Basin, forming a high-quality hydrocarbon source rock.
Longmaxi shale in the study area is rich in graptolites and has abundant organic matters (mainly 2.2%–4.4%). The distribution of the shale was mainly controlled by deep water shelf and shallow water shelf sedimentary environment (Figure 1). This set of graptolite-rich and organic-rich shales from the bottom of Longmaxi Fm were mainly deposited in the transgressive systems tract (TST), and upward, gradually changed to early highstand systems tract (EHST) and late highstand systems tract (LHST) [49]. The thickness of the organic-rich shale is generally dominated by the sedimentary environment with the present-day maximum thickness of >200m, and the thickness of high-quality shale (TOC > 2%) is about 15–70 m. The Longmaxi Formation is well preserved with a historical maximum burial depth of nearly 7000 m and a maximum temperature of >200°C, resulting in a high maturity degree (with Ro mainly 2.2–3.0%). The burial depth of present-day is about 1500–4000 m, which is suitable for shale gas economic development.
Previous researches on marine shales in Sichuan Basin and its surrounding areas have been carried out. However, the pore development characteristics of Longmaxi shale in the study area is poorly researched, which will limit the further exploration and effective development of shale gas. Specifically, the controlling factors of shale pores of different scales are still not clearly illustrated.

3. Samples and Methods

3.1. Shale Samples

In this work, a total of 10 representative shale samples of Lower Silurian Longmaxi Formation were selected from eight shale gas wells in the southern Sichuan Basin. The locations of these wells are illustrated in Figure 1. All the samples chosen from cores with the depth ranging from 2312.8 m to 4355.4 m are mainly dark gray and black shales, some of which are graptolite-rich black shales. These samples were chosen with the variability of TOC, vitrinite reflectance, and mineral composition taking into consideration.

3.2. Organic Petrography and Mineralogy

Total organic carbon (TOC) contents were determined using the LECO CS230 carbon and sulfur analyzer which was made by LECO company located in Chicago, America, according to the Chinese National Standard GB/T 19145-2003 [51]. TOC content was calculated by subtracting total inorganic carbon from total carbon. All shale samples were crushed into powder, and approximate 200 mg of powder samples were carefully weighed for TOC measurement. Prior to the heating and burning analyses, all the tested samples were acidified using HCl to remove the inorganic carbon. The samples were washed using distilled water for about 24 h in order to clean the residual HCl, and then dried them for 12 h at 110 °C in a vacuum oven. For the high maturity of Silurian Longmaxi Formation shale, there was no vitrinite in the shales, and the conventional geochemistry indicator of vitrinite reflectance to evaluate maturity become useless. Consequently, the solid bitumen reflectance (Rb) was measured using a MPV-III microphotometer 806 apparatus made by Leitz company in Germany on the basis of the Chinese Oil and Gas Industry Standard SY/T 5124-1995 [52]. The experiment was carried out under room temperature of about 23 °C (±3 °C) and relative humidity less than 70%. The reflectance of bitumen (Rb) is converted to equivalent vitrinite reflectance (Ro) according to the equation Ro = (Rb + 0.2443)/1.0495 [53], which is effective for high-over mature shales. X-ray diffraction (XRD) was conducted for analyses of mineral compositions quantitatively. The powder samples with grain size less than 200 mesh were performed using the BRUKER X-ray diffractometer made by Bruker AXS in Germany following the Chinese Oil and Gas Industry Standard SY/T 5163-2010 [54]. The working voltage, current and measuring angle range were 40 kV, 40 mA, and 5°–90°, respectively, and the specimen measurements were carried out at the relative humidity of 40% and temperature of 24 °C.

3.3. FE-SEM Observation

Field emission-scanning electron microscopy (FE-SEM) observation was conducted at the Micro-nanostructure Imaging Laboratory in the Institute of Geology and Geophysics, Chinese Academy of Sciences. Shale samples with the size of approximately 10 mm (length) × 10 mm (width) × 5 mm (height) were prepared. In prior of observation, one surface vertical to the bedding plane of each block sample was selected to be polished by argon ion beam to create a flat and smooth surface using a Hitachi Ion Milling System IM 4000 with an acceleration voltage of 3 kV for about 3 h. To avoid obscuring the shale pores, the surface of each sample was usually not coated with gold or carbon unless the polished surface had very poor electrical conductivity. The samples were imaged using a Zeiss SUPRA 55 Sapphire FE-SEM made by Zeiss Company in Germany, which is equipped with a secondary electron (SE), backscattered electron detectors and an energy-dispersive spectrometer. All the experiments were performed at a temperature and humidity of 25 °C and 35%, respectively.

3.4. Low-Pressure N2/CO2 Adsorption

Low-pressure N2 and CO2 adsorption experiments were both conducted using the QuadraSorb Station 3 instrument at the Beijing Center for Physical and Chemical Analysis, following the Chinese National Standard GB/T 21650.3-2011 [55] and GB/T 19587-2017 [56]. Prior to the test, the powder (60–80 mesh) samples were dewatered and desorbed gases under vacuum at 80 °C for 24 h to remove volatile substances and adsorbed moisture. N2 and CO2 adsorption-desorption isotherms were performed at 77.3 K and 273 K, respectively. The relative pressure (P/Po) ranges from 0.001 to 0.995 for nitrogen adsorption, whereas from 0.0005 to 0.029 for carbon dioxide adsorption. The N2 adsorption data (with P/Po of 0.06–0.2) were interpreted using the Brunauer-Emmette-Teller (BET) method to obtain specific surface area (SSA), and Barrette-Joynere-Halenda (BJH) method to obtain pore volume (PV) [9,32,33]. Pore size distributions (PSDs) were obtained using the density functional theory (DFT) method [9]. Based on the CO2 adsorption data, the PV and SSA of micropores were calculated using the density functional theory (DFT) method [26,57,58].

3.5. HMIP Measurements

The high-pressure mercury intrusion porosimetry (HMIP) experiment was carried out using a Micromeritics AutoPore IV 9500 apparatus made by Micromeritics Company in America. All the samples were crushed into particles with sizes ranging from 2 mm to 2.5 mm. Before HMIP testing, the cutting samples were dried in a vacuum oven for about 24 h at 110 °C to remove moisture and then cooled down to room temperature (~23 °C) in a desiccator with a relatively low humidity of less than 10%. The experiment was conducted at the pressure in the range of 0.007–200 MPa, with the corresponding measured pore diameter in the range of 210–0.008 μm. With increasing applied pressure, the intruded mercury volume will be recorded as an intrusion curve; conversely, when the applied pressure reduces, mercury will extrude and leave the shale pores. Due to the minimum test size of 3 nm, micropores could hardly be detected via this technique [48]. The PSDs were obtained using the Washburn equation [59], in which the mercury’s contact angle of 140° and surface tension of 485 dyne/cm were adopted [60,61].

3.6. Fractal Method

Fractal dimension is an effective method to quantitatively characterize properties of complex structures [37]. Fractal dimension can be obtained using different methods, such as HMIP, SEM, small-angle X-ray diffraction analysis and gas adsorption isotherms [34,62,63]. Several models have been established to calculate the fractal dimension of porous media based on gas adsorption-desorption isotherm, such as fractal BET model, Langmuir model, FHH model and thermodynamic method [38,41,42]. The FHH model is widely used to calculate the fractal dimension, and it can be described as follows:
ln(V/V0) = A(ln(ln(P0/P))) + constant
where V is the volume of N2 adsorbed gas at the equilibrium pressure, cm3/g; V0 is the adsorption volume, cm3/g; A is the slope of ln(V) vs ln[ln(P0/P)]; P is the equilibrium pressure, MPa; and P0 is the saturation pressure, MPa. The fractal dimension D can be calculated from the following equations:
D = A + 3
D = 3 A + 3
3A + 3 and A + 3 models assume that the film thickness and the minimum curvature radius of the fluid meniscus are the appropriate length scale for measuring the liquid film volume, respectively [41,62]. Equation (2) is commonly used for the adsorption mechanism of capillary condensation, and equation (3) is suitable for the adsorption mechanism of van der Waals’ force (VDW) interaction [38,41,62]. In this work, Equations (1) and (2) were used to calculate the fractal dimensions of Longmaxi shale. Different fractal dimension values represent different pore structure characteristics. According to Pfeifer [36], the fractal dimension value is defined as 2 with the absolutely smooth surface, whereas it is defined as 3 with the extremely rough surface. When the fractal dimension gradually increases from 2 to 3, the medium always develops with more complex pore structure and much stronger heterogeneity [40,41,62,63,64].

4. Results

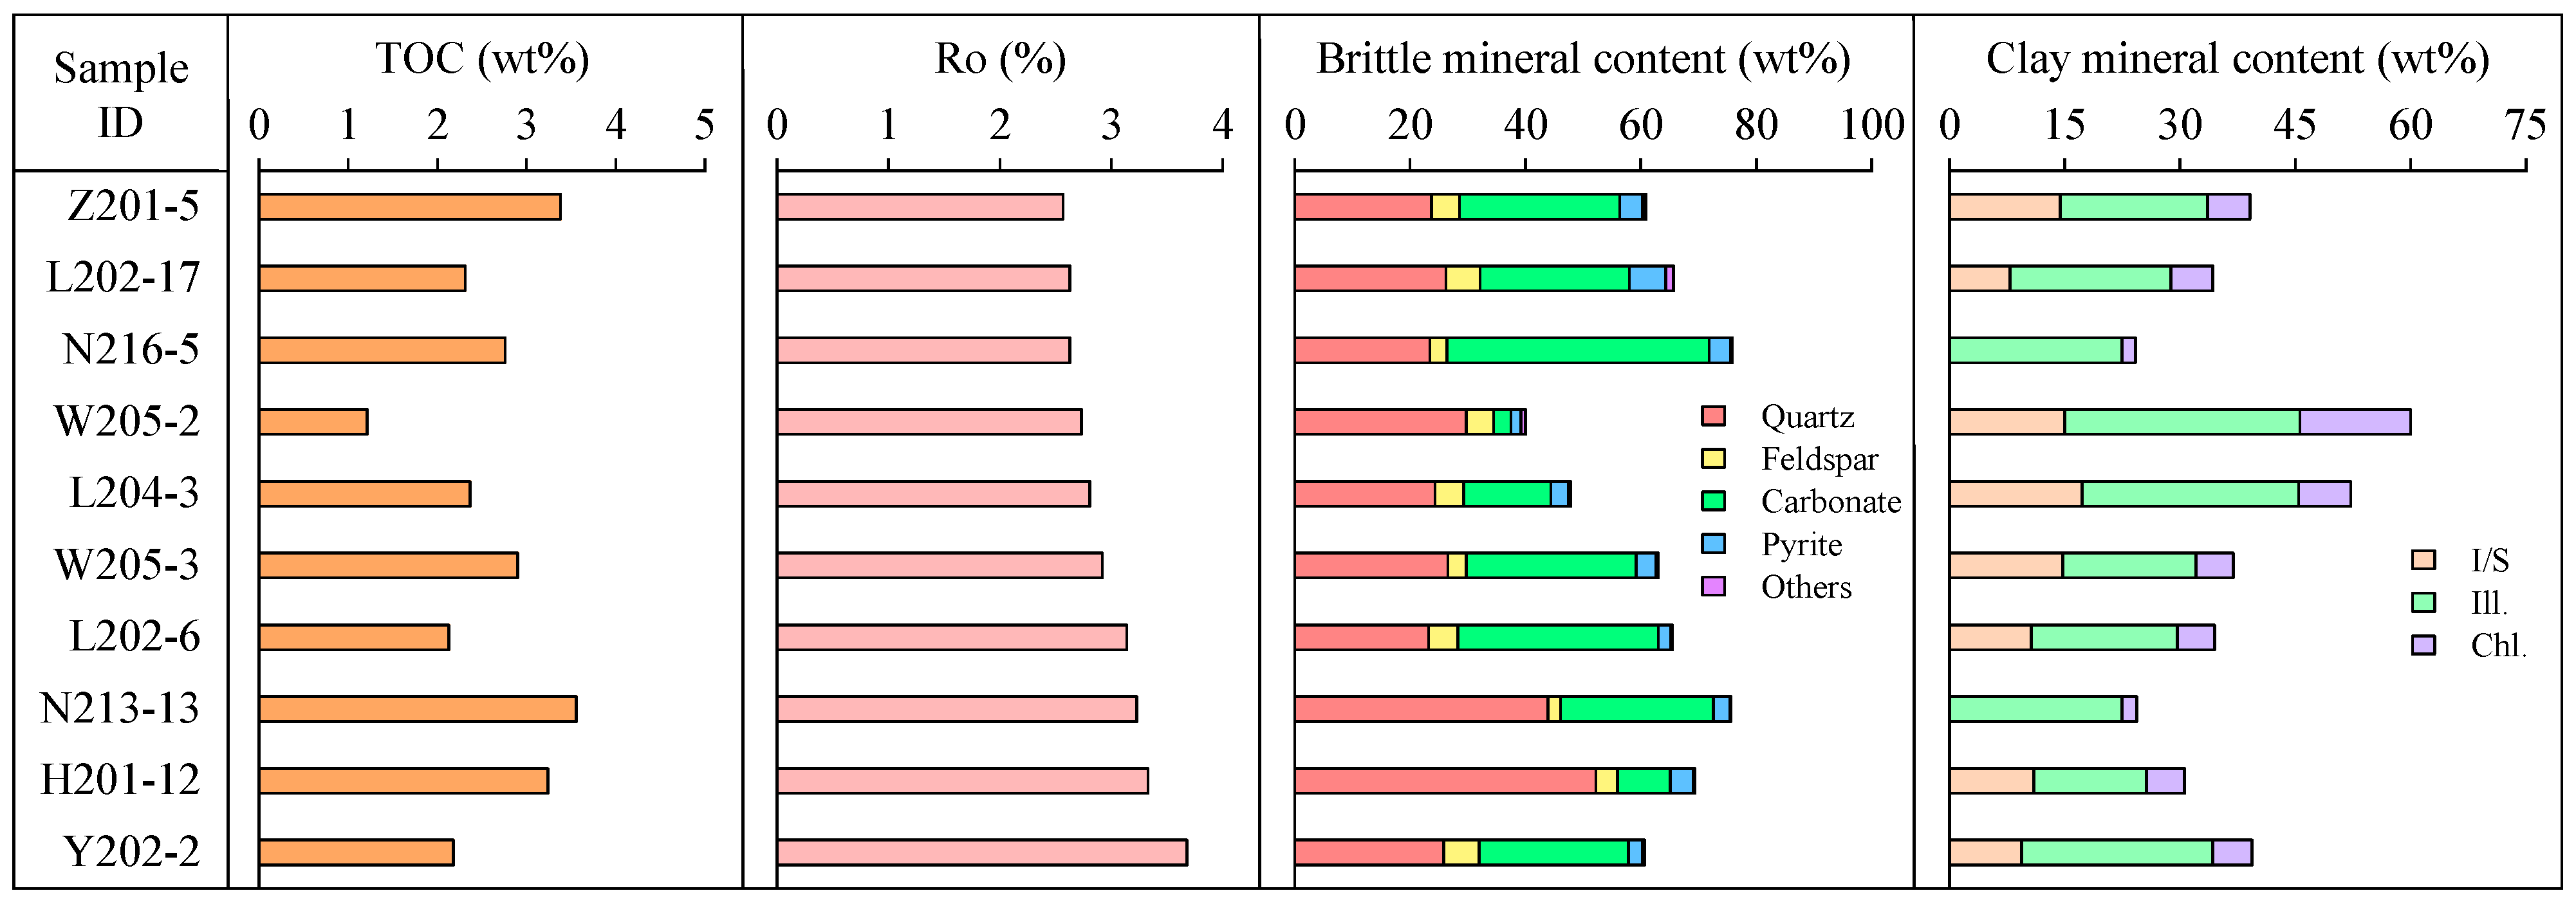
4.1. Organic Geochemistry and Mineral Composition

The organic matter abundance, thermal maturity degree and mineral composition of shale have an important influence on shale pore structure [13,32,63,64]. The analysis of shale geochemical characteristics and mineral composition is the basis for pore structure investigation. The geochemical test analysis shows that the TOC contents of the LM shale in the study area range from 1.21% to 3.56%, with an average of 2.6% (Table 1 and Figure 2), indicating a high hydrocarbon generation potential. The equivalent vitrinite reflectance (Ro) ranges from 2.57% to 3.68% (average of 2.97%), which suggests that the LM shales are over-mature. Shale in Lower Paleozoic of south China is characterized by deep burial, so it has a higher degree of thermal maturity compared with the shale in North America [25,65,66].
Mineral composition of shales in the study area is dominated by quartz and clay minerals according to XRD analysis. The quartz content is in the range of 23.2%–52.2% (average of 29.9%) and the clay content is between 24.2% and 60% (average of 37.6%). Carbonate minerals content ranges from 3% to 45.5%, with an average of 24.3%. Pyrite is also widely developed, with content of 1.7%–6.3% and an average of 3.32%. Other minerals such as siderite are less, with a maximum of 0.8%. Only a few samples contain Gypsum, with content of only 0.7% (Table 1 and Figure 2).

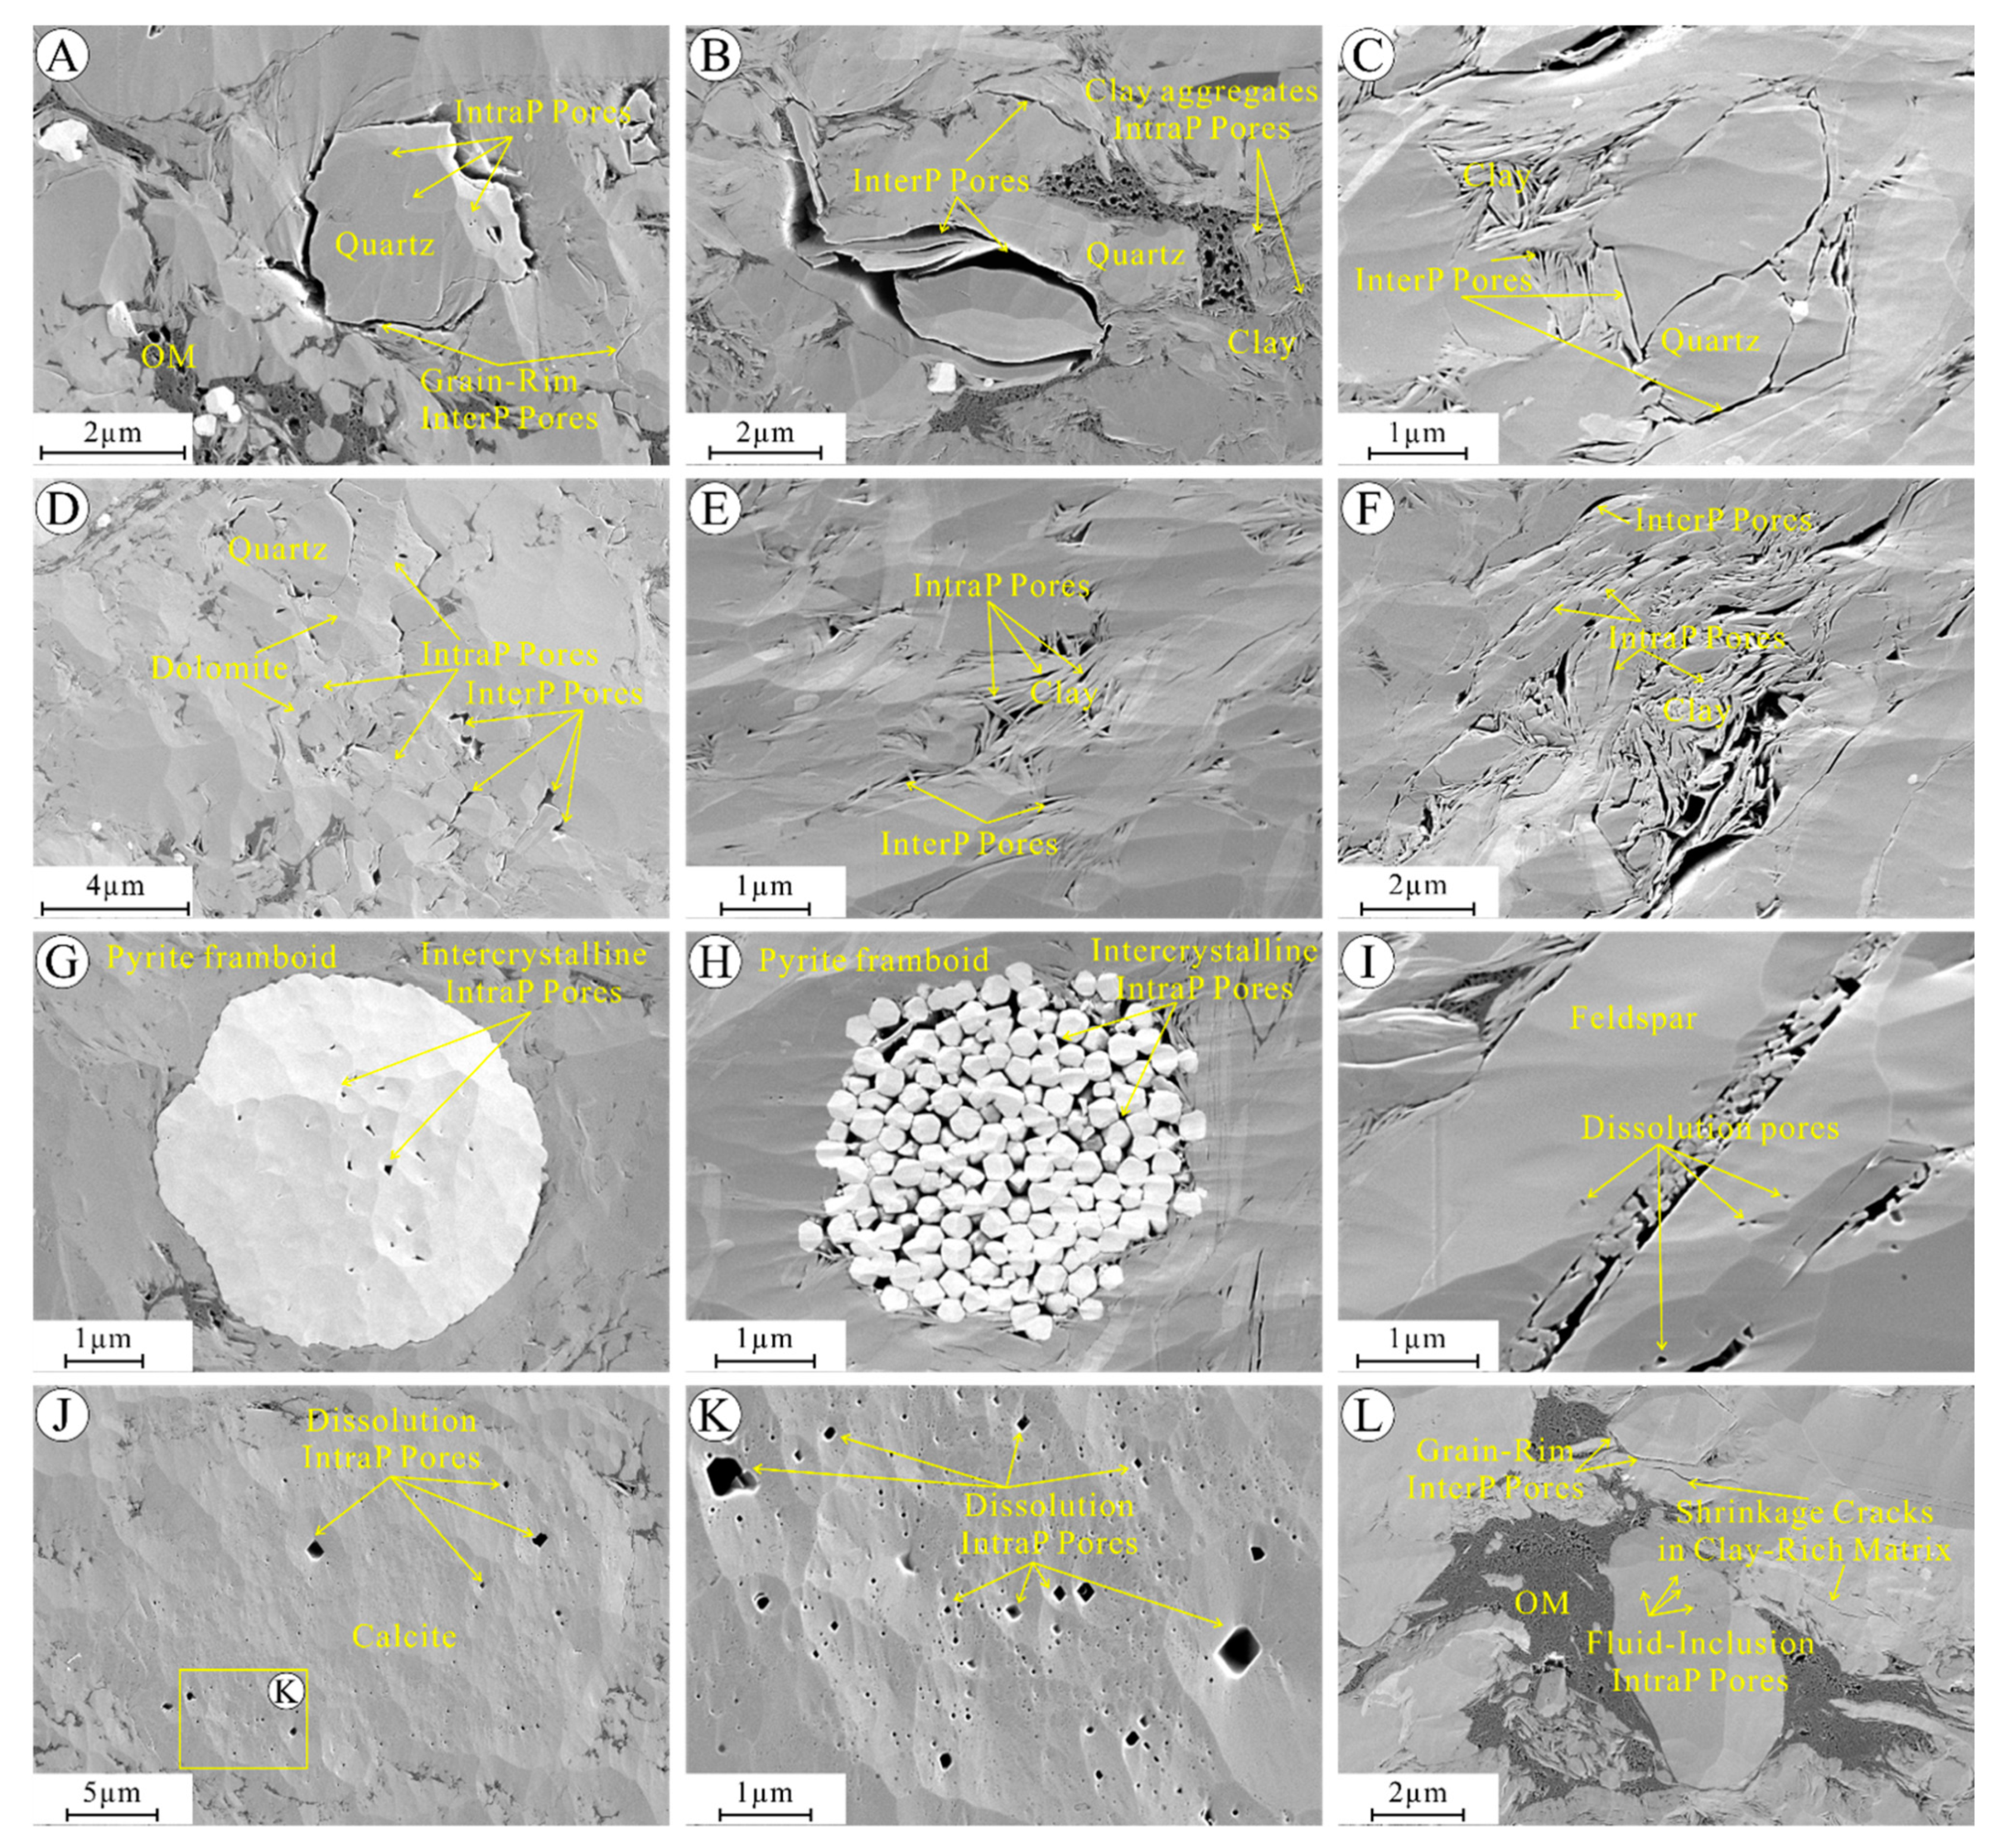
4.2. Pore Types and Morphologies

According to the classification of pore types reported by Loucks et al. [13], four types of pores in LM shale samples were observed by FE-SEM imaging, namely, OM pores, interP pores, intraP pores, and microfracture.

4.2.1. Interparticle Pores

The interparticle (interP) pores of LM shales mainly consist of the pores between brittle minerals and the pores between clay minerals (Figure 3A–F,L), including the pores between quartz, feldspar and carbonate minerals and the pores between clay minerals and brittle minerals after the extrusion. The diameters of pores between brittle minerals are generally larger than that of OM pores, with tens to hundreds of nanometers. InterP pores associated with brittle minerals include grain-edge or grain-rim pores with slit-like or strip-like shapes (Figure 3A–C,F,L), which exist along the edge of grains and are possibly related to matrix shrinking during compaction [13], as well as pores between the rigid grains with an irregular multilateral shape (Figure 3D,E). InterP pores are commonly found between clay aggregates, which are commonly elongate or triangular in cross section (Figure 3E,F). InterP pores also occur between clay mineral and brittle mineral particles (Figure 3C,E,F). Due to the old age, deep burial and strong compaction of the LM shales compared with North America, inorganic mineral pores are not well developed compared with the continental shale in north China, such as the shale of Yanchang Formation in Ordos Basin and the shale of Shahejie Formation in Bohai Bay Basin [67,68]. In addition, due to the filling of asphalt, the pores between inorganic mineral particles are greatly reduced.

4.2.2. Intraparticle Pores

Three types of intraparticle (intraP) pores are commonly observed in LM shale samples: intraP pores within brittle minerals, cleavage-sheet or cleavage-plane pores within clay minerals, and intercrystalline pores within pyrite framboids (Figure 3). Intraparticle pores within brittle mineral particles are mainly dissolution pores within calcite and dolomite (Figure 3D,J,K), and fluid-inclusion intraP pores within large quartz grains (Figure 3A,L). In addition, dissolution pores also occur in feldspar grains (Figure 3I). The dissolution pores are generally quadrilateral or circular with relatively small diameters (mainly less than 500 nm). The connectivity of these pores is poor due to the isolated existence. The fluid-inclusion pores within quartz particles are mostly round-shaped (Figure 3A,L), which is associated with fluid inclusion escape. IntraP pores within clay sheets or clay flocculates are commonly found, which are generally linear and are parallel to one another (Figure 3B,C,E). Intraparticle pores also occur along distorted cleavage planes within clay flocculates (Figure 3F). The shape of these cleavage-sheet pores is generally bending linear or irregular polygons due to the compaction of brittle minerals. Intercrystalline pores between pyrite crystals are commonly found in pyrite framboids (Figure 3G,H), with the pore diameter generally less than 1 μm. Pyrite intercrystalline pores can be subdivided into two types. One type is not filled with organic matter (Figure 3G), and the pores are relatively small. The other type pores are occluded with OM or with authigenic clay platelets (Figure 3H). The primary pore diameter of the latter type was relatively large before it was filled with OM. While the OM within pyrite framboids can produce OM pores during the hydrocarbon generation process, which will increase the facial porosity factor of pyrite intercrystalline pores.

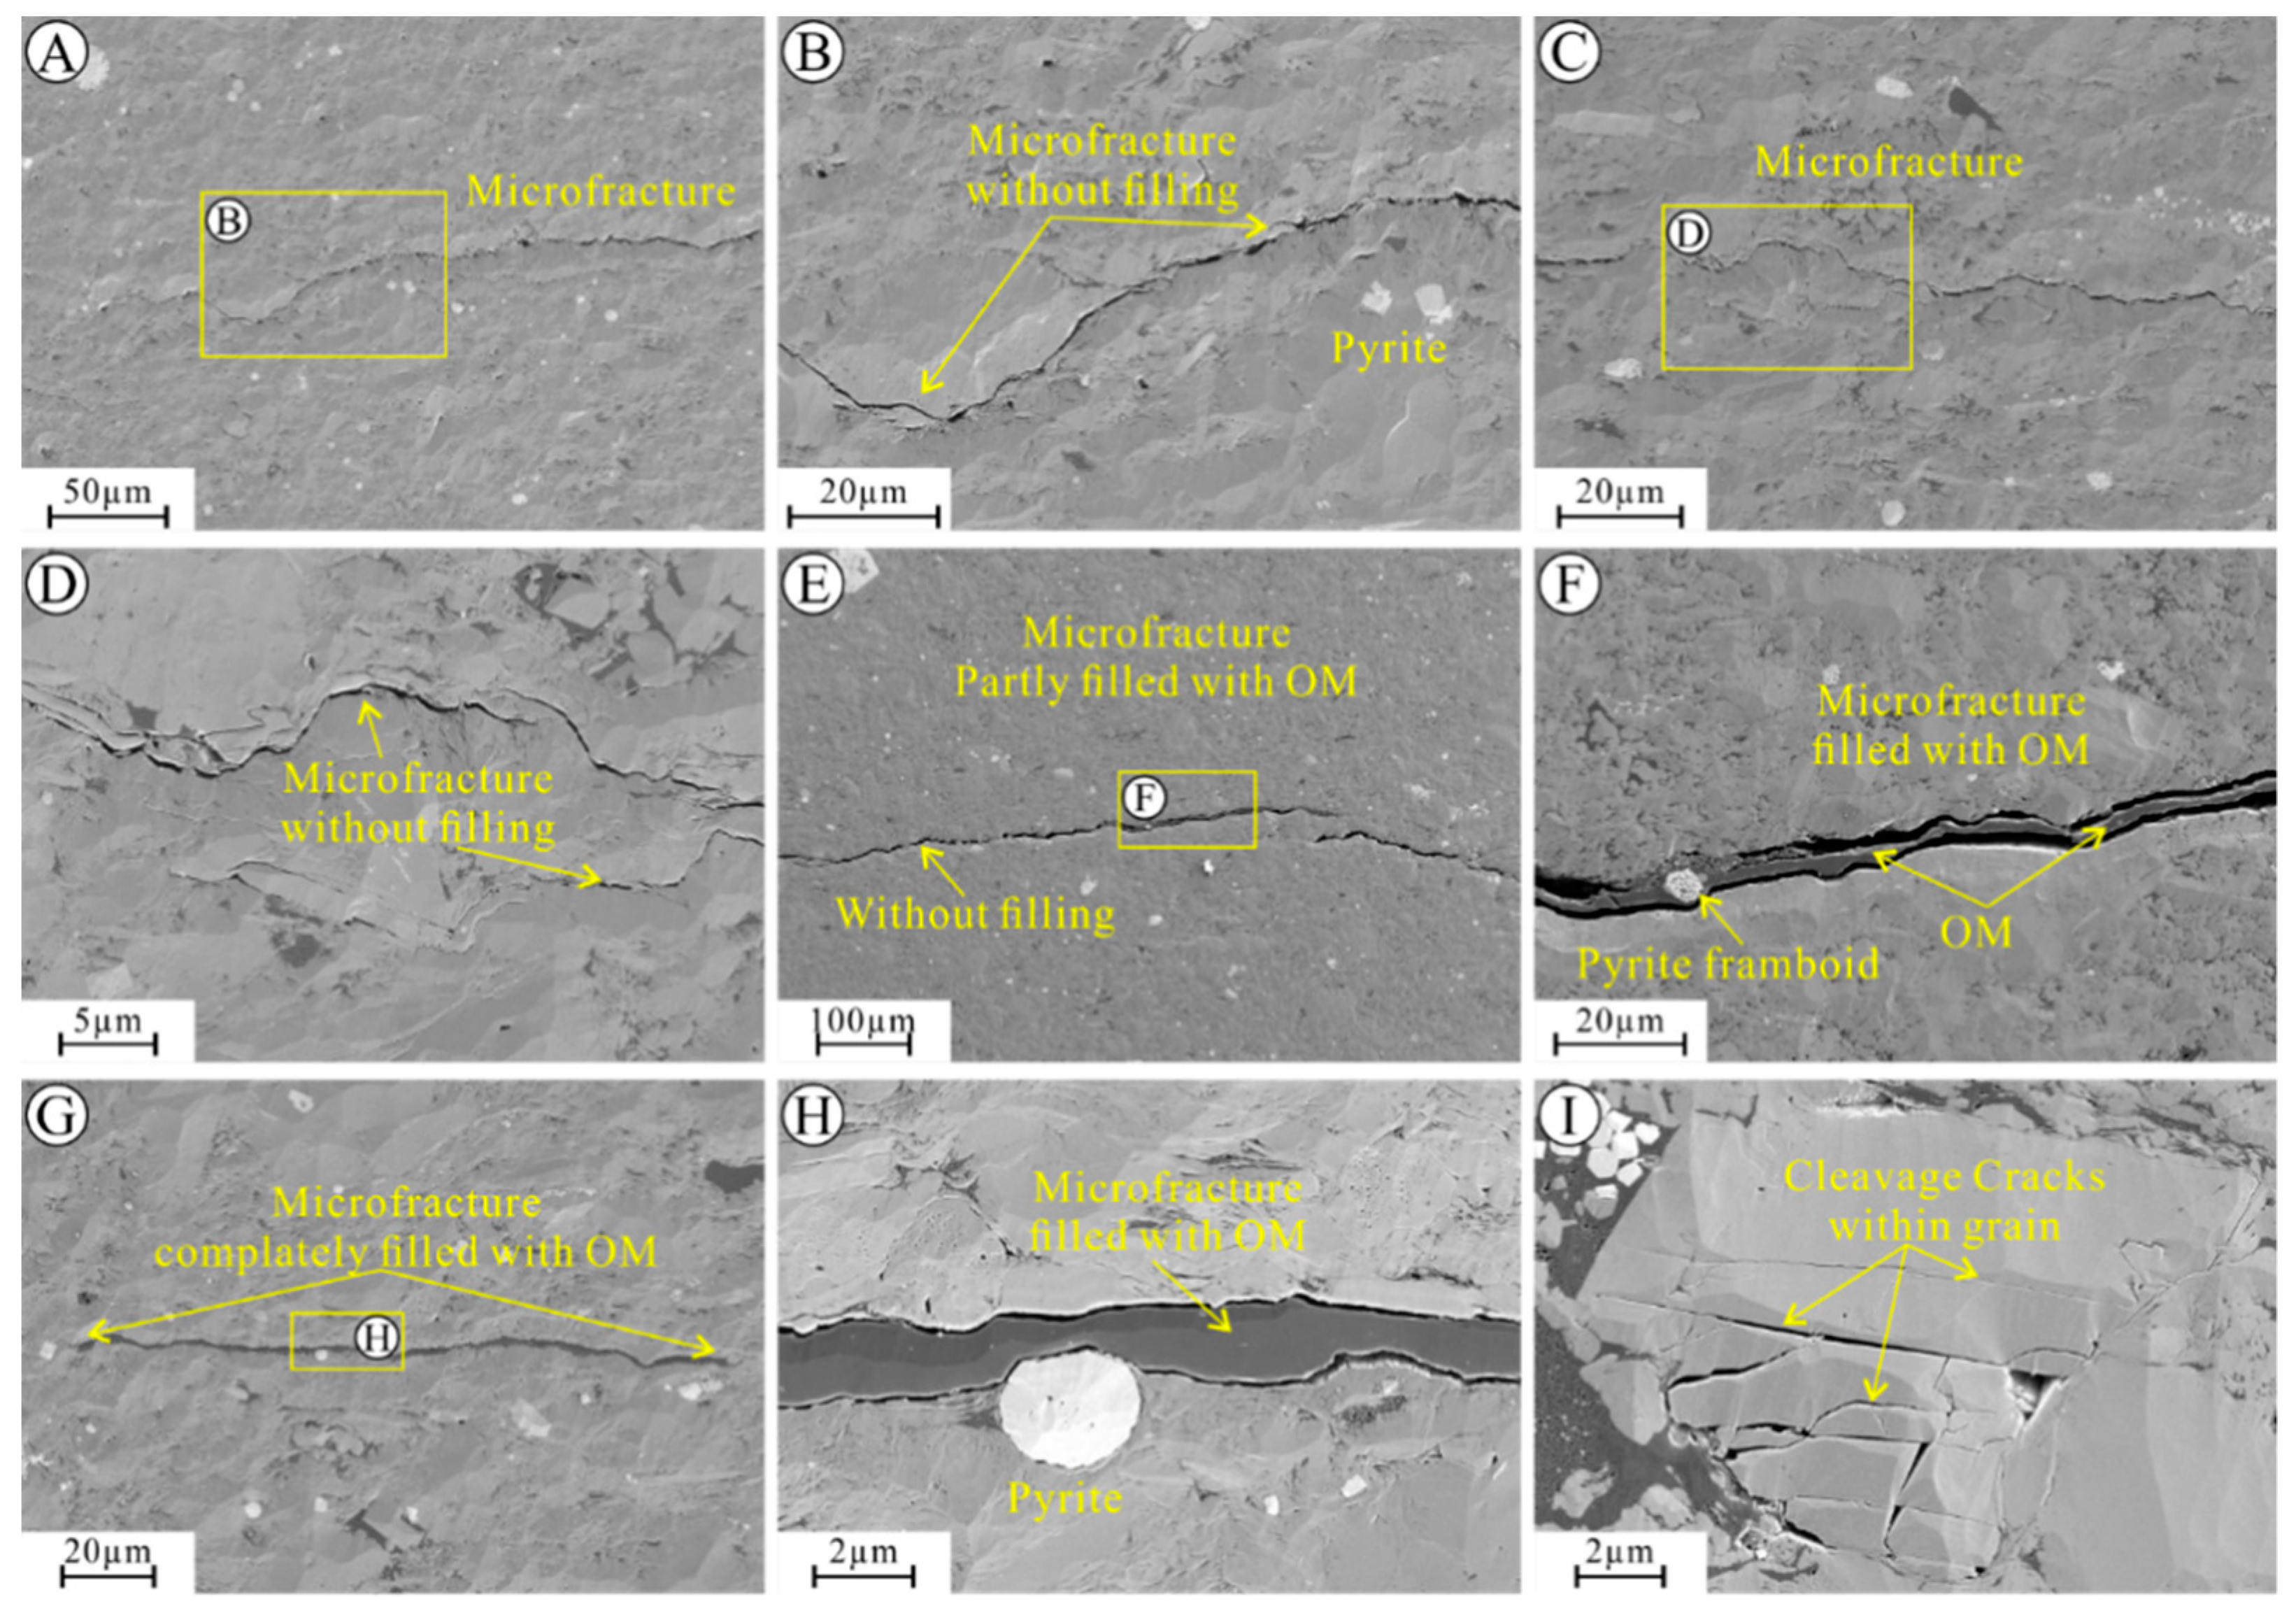
4.2.3. Fracture Pores

Figure 4 shows that the LM shale in the study area develops microfractures, which are usually parallel to bedding, ranging from several microns to several hundred microns in length. The apertures of most microfractures in the shale samples are generally less than 2 μm. Two types of microfractures are commonly found. One type of fracture is not filled with organic matter, and the other is filled with organic matter. The unfilled microfractures are mainly lamellation fractures (Figure 4A–D). Lamellation fracture results from strong and weak hydrodynamic interaction, which lead to vertical heterogeneity of the shale, and Formation in the process of differential compaction during diagenesis. Figure 4 E–H show significant microfractures which are filled with organic matter completely or partly. This type of fractures is caused by hydrocarbon-generation pressurization and may be formed in the same period as hydrocarbon-generation. In addition, cleavage cracks as a special microfracture also occur within rigid grains (Figure 4I), which formed along the cleavage plane after the particles were compressed. Microfractures, especially open microfractures that are not cemented, as a storage and transport pathway for hydrocarbons, can positively influence hydrocarbon enrichment and production [69,70,71].

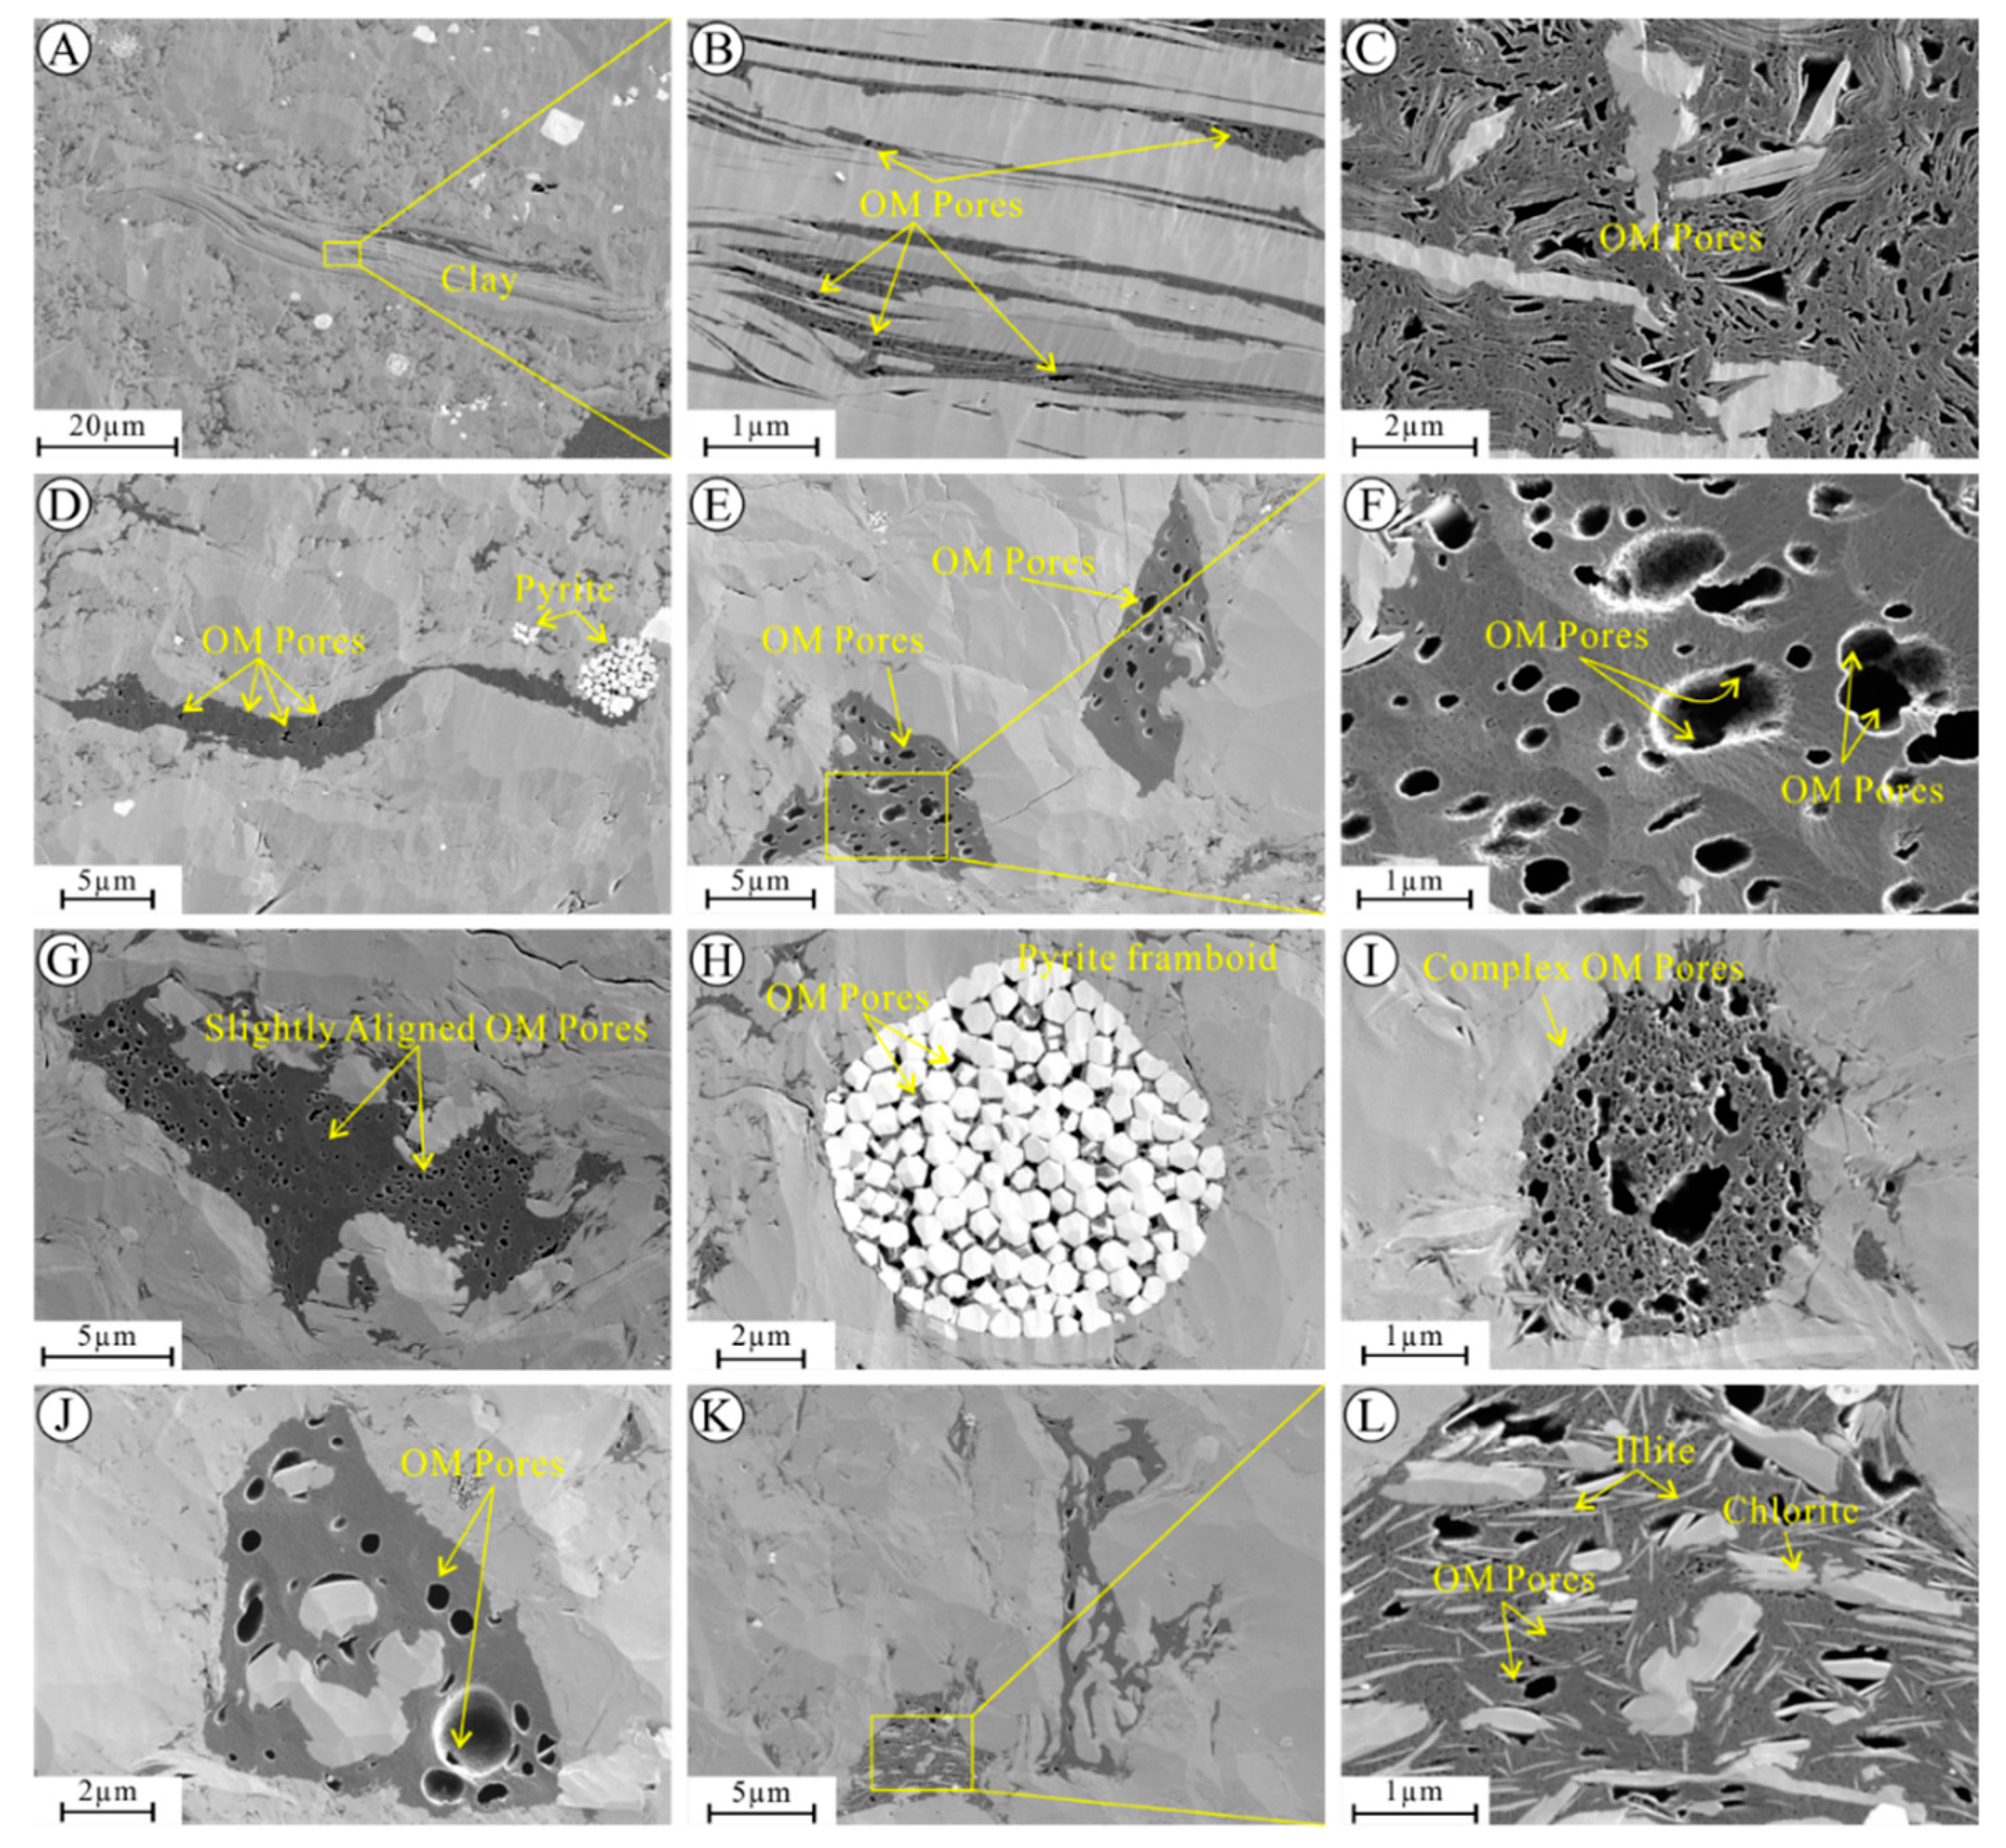
4.2.4. Organic Matter Pores

OM pores are intraP pores that are found within OM, which are the most important storage space for shale gas, especially in over maturation marine shales in South China [10,32,62,72]. Organic matter pores in the LM shales can be commonly found on FE-SEM images (Figure 5). The characteristics of the OM pores are commonly controlled by the location of OM. Organic matter, which occurs between clay platelets, is generally distributed in long strips and nearly parallel to the clay sheets. OM pores within these OM are commonly irregular or elliptical (Figure 5A,B) with a relatively small pore size (mostly less than 100 nm). Some OM is mixed with clay minerals forming organic-clay complex (Figure 5C). Organic-clay complex is strongly deformed due to compaction. Pores within organic-clay complex are extremely irregular with the pore sizes ranging from a few nanometers to several hundred nanometers (Figure 5C). Honeycomb pores or sponge-like pores can be found within isolated massive organic matter or banded organic matter. Honeycomb pores have bubble-like or elliptical cross sections. The pores within isolated OM are highly heterogeneous and vary greatly in pore size. In addition to the larger elliptic or bubble-shaped pores, there are also smaller densely distributed needle-like pores (Figure 5D–G,I). Some OM pores are nested with small cavernous pores (Figure 5E–J), forming a pore network, which greatly increases pore connectivity and has good storage capacity. A few OM pores are extended to each other forming a larger pore and displaying complex shape in large OM particles (Figure 5I). In some isolated OM, there are a large number of slightly aligned bubble-shaped pores, with the pore size ranging between 100 nm and 300 nm (Figure 5G). The partially isolated massive OM is cemented with authigenic minerals (Figure 5J–L), which can inhibit the compaction of OM and facilitate the preservation of OM pores. In addition, OM pores also occur within OM which are developed in pyrite framboids (Figure 5H).

4.3. Quantitative Analysis of Pore Structure

4.3.1. Pore Structure from CO2 Adsorption

Low-pressure CO2 adsorption is an effective method to quantitatively characterize the micropores of gas shale [15,33,73]. According to the classification of the International Union of Pure and Applied Chemistry (IUPAC) [20], low-pressure CO2 adsorption isotherms of LM shales in the study area belong to type I (Figure 6). At the relative pressure P/P0 of 0.028, the adsorption volumes of all the samples range between 0.72cm3/g and 2.21 cm3/g, with an average of 1.61 cm3/g (Figure 6). The SSA of the Longmaxi shale samples determined from CO2 adsorption data based on the DFT model, ranges from 7.45 m2/g to 23.46 m2/g (average of 17.14 m2/g). While the PV calculated from CO2 gas adsorption ranges between 0.2 and 0.7 cm3/100 g (average of 0.5 cm3/100 g) (Figure 7). The average pore size of micropores ranges from 0.83nm to 0.86nm, with an average of 0.85nm (Figure 7). The CO2 adsorption pore size distribution displays three major peaks with the pore diameter approximately in the ranges of 0.34–0.38nm, 0.44–0.7 nm and 0.74–0.9 nm, as shown in Figure 8. Due to the heterogeneity of shales, different shale samples also presented individual variation of PSD curves.

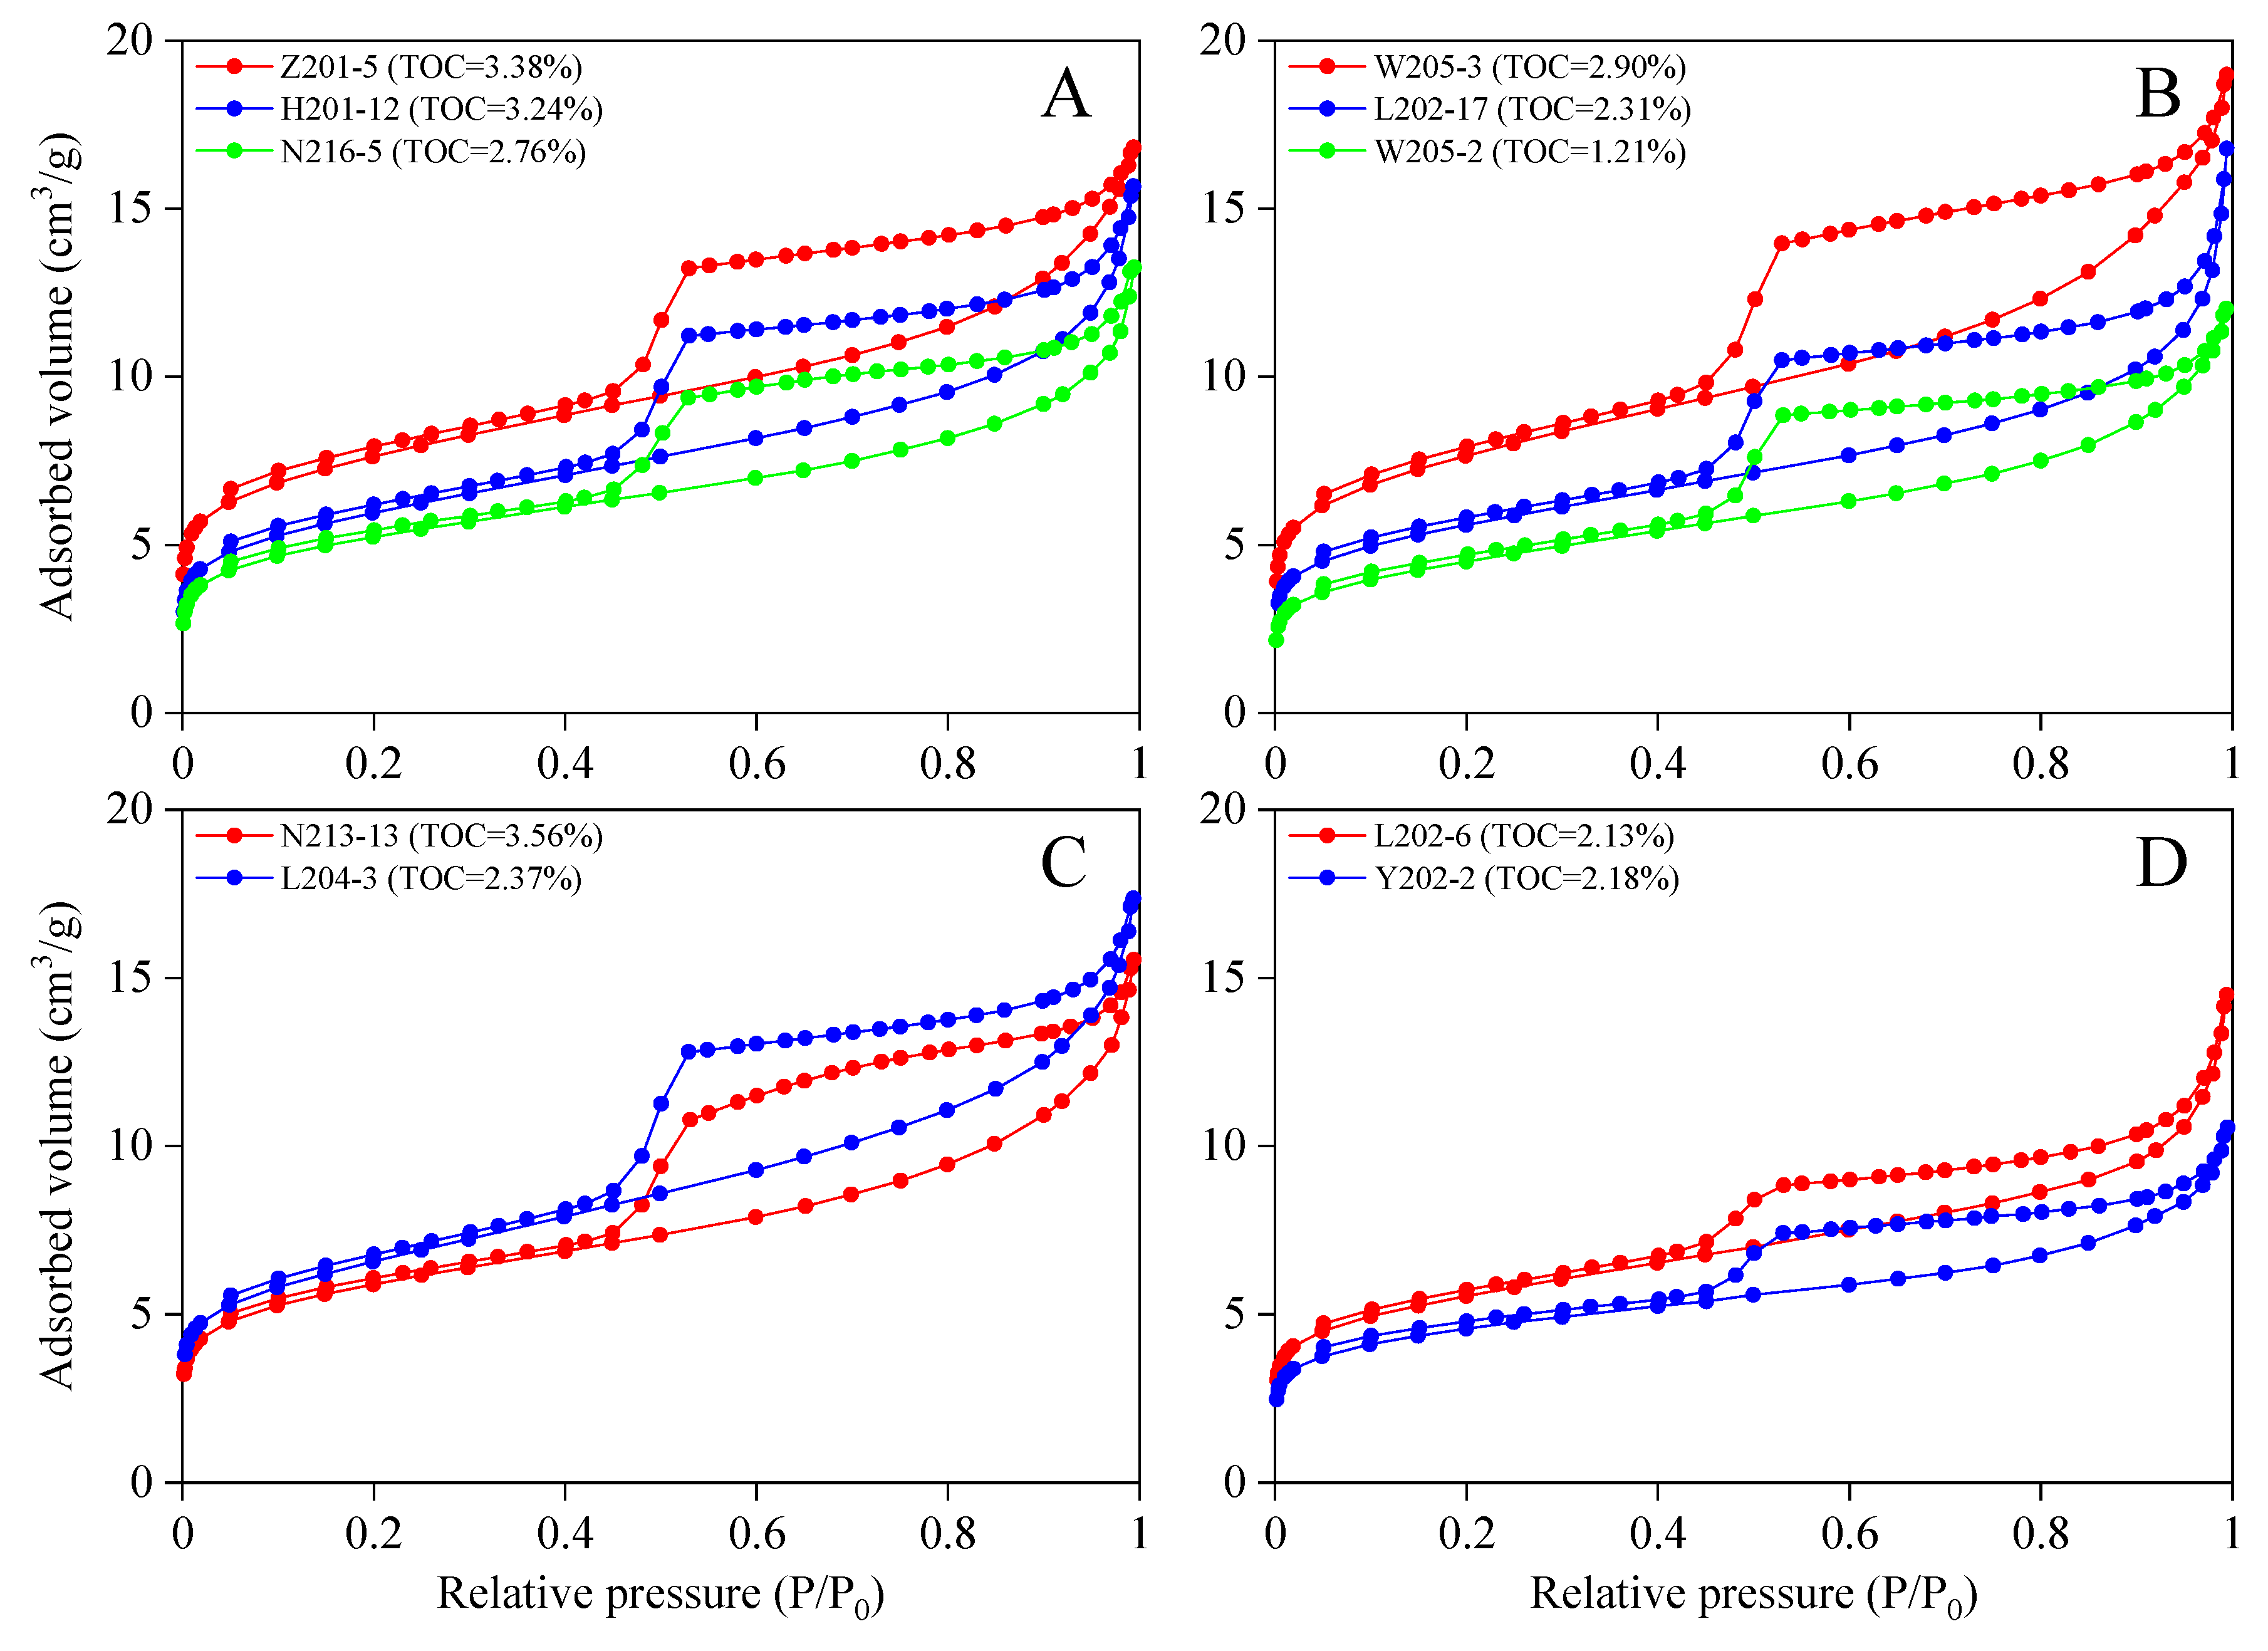
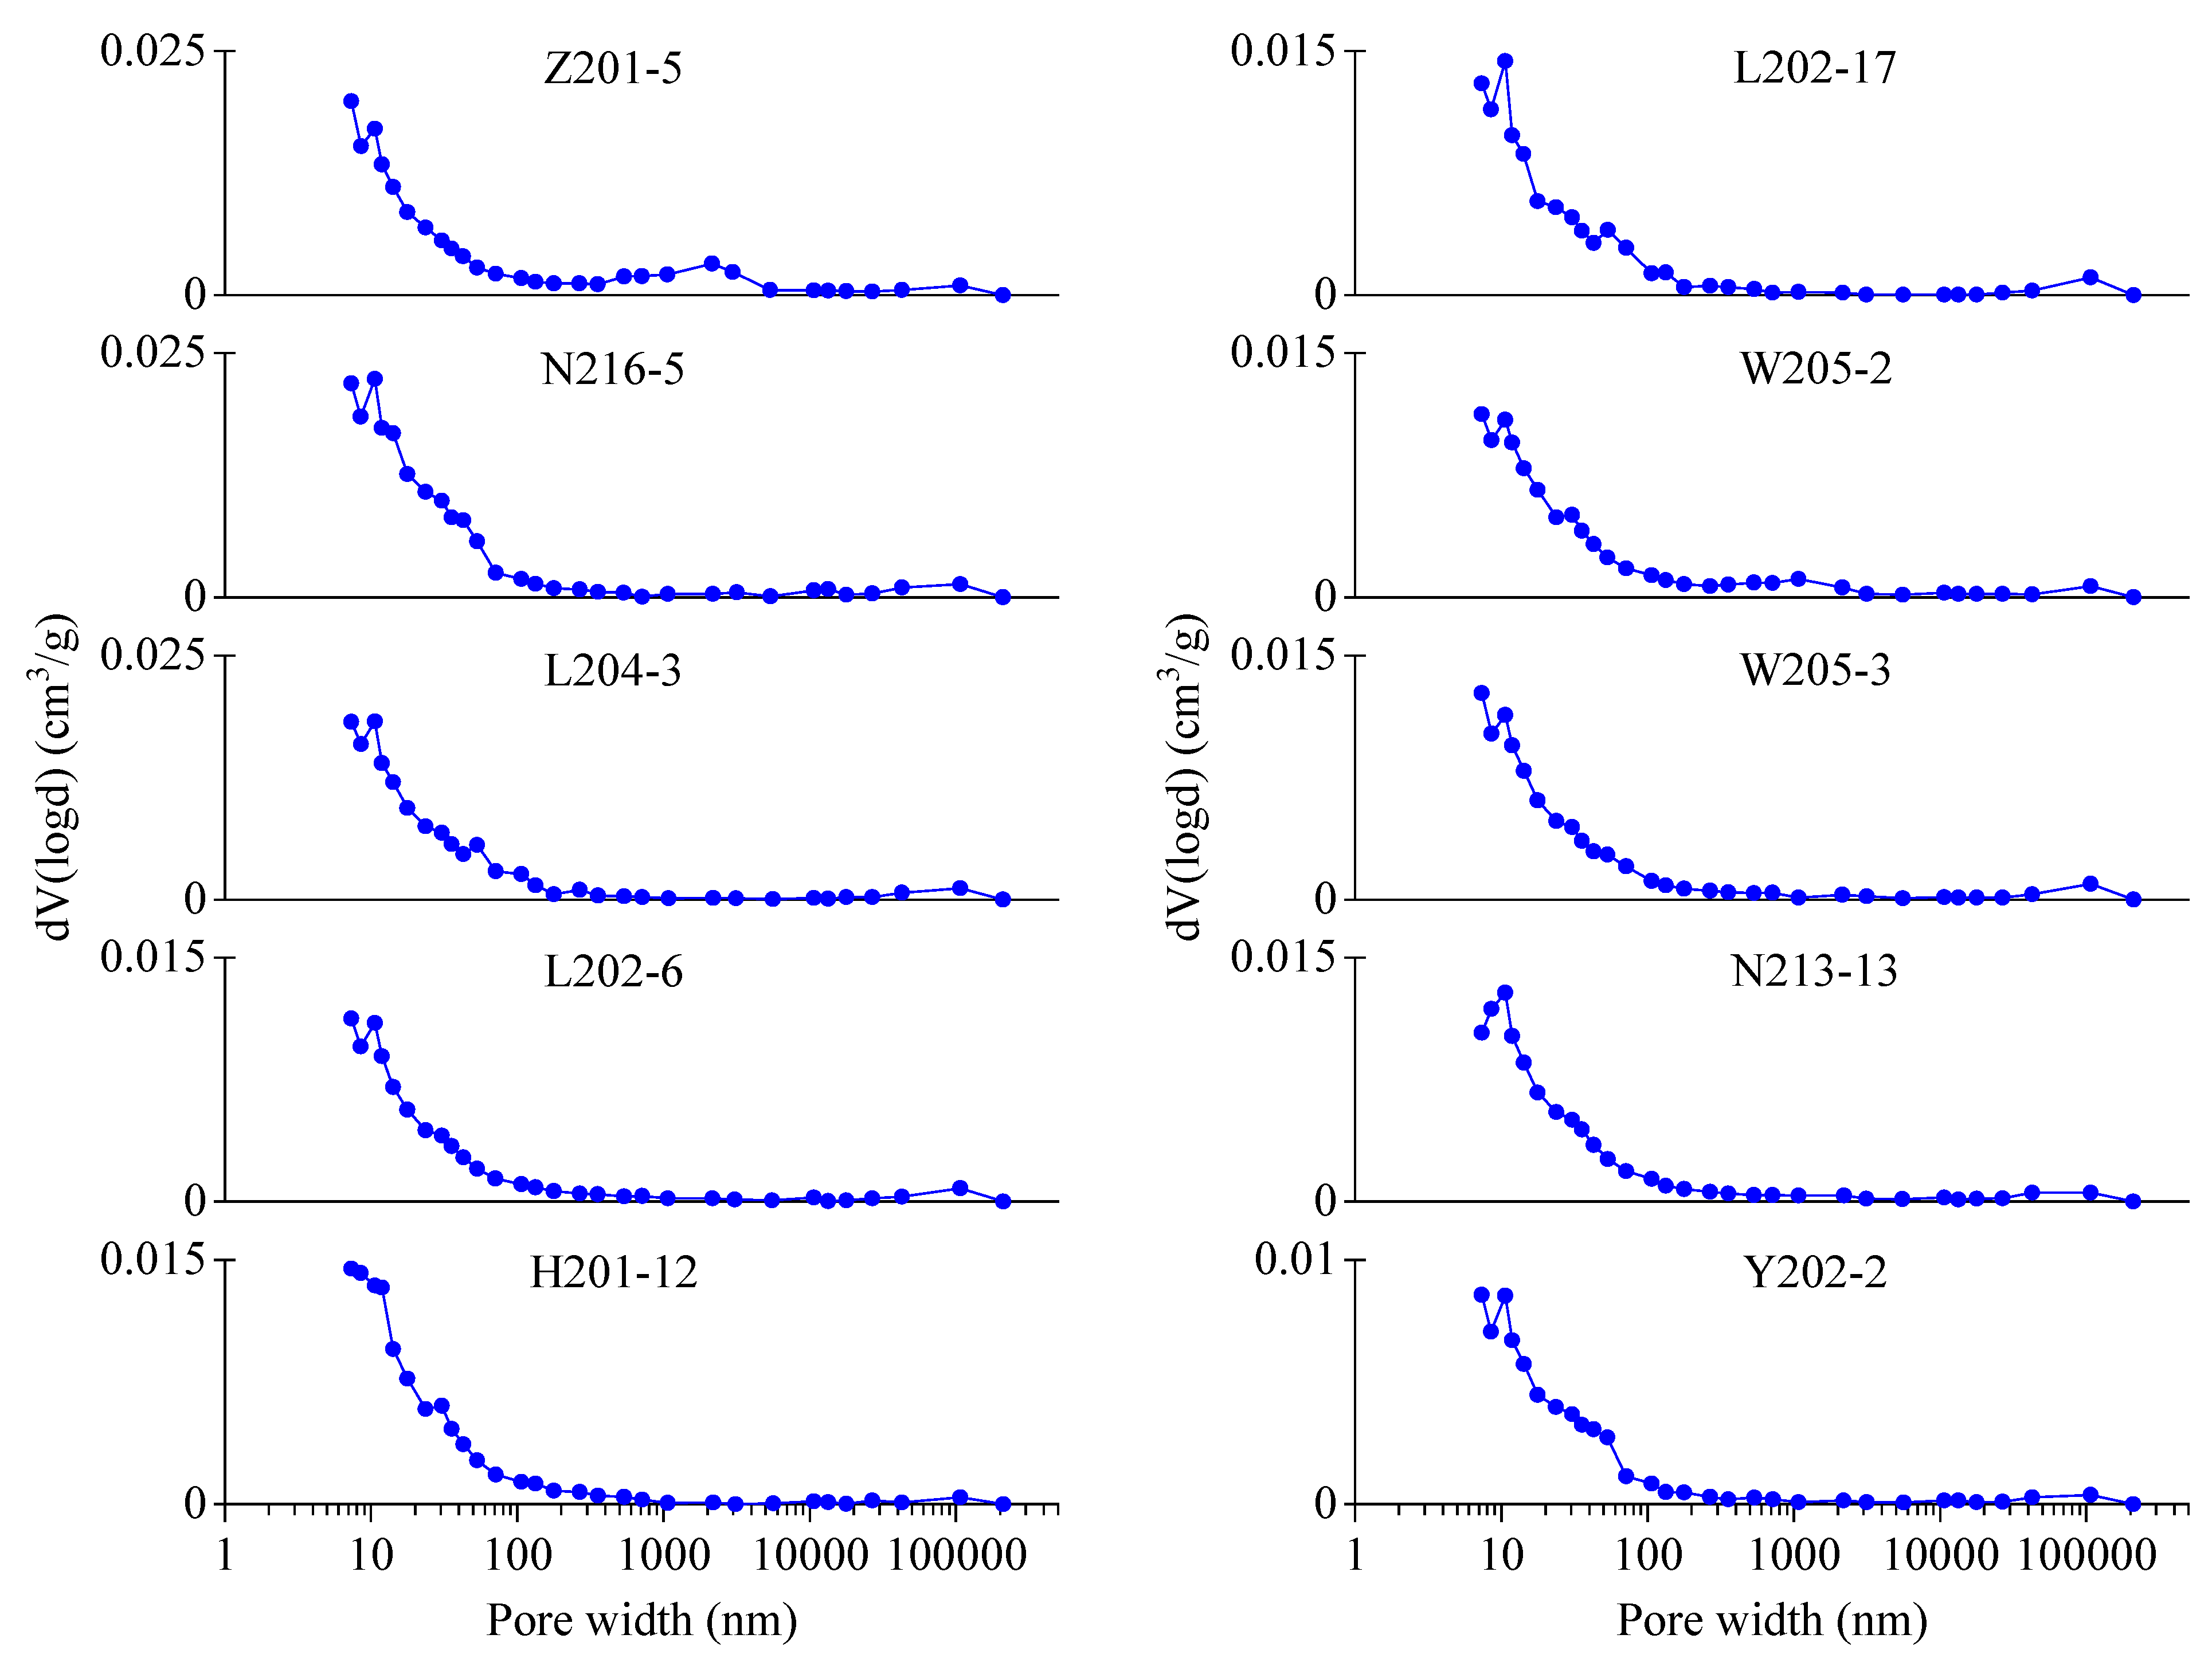
4.3.2. Pore Structure from N2 Adsorption

Low-pressure N2 gas adsorption analysis is usually used to quantitatively characterize the mesopore structure of gas shales [10,15,43]. Figure 9A–D illustrate the N2 adsorption-desorption for the LM shale samples. According to IUPAC, the adsorption isotherm (Figure 9), belong to Type IV, and the hysteresis loops of N2 adsorption-desorption isotherms are between Type H3 and H4. The occurrence of hysteresis loops suggests the presence of meso- and macropores of the studied shales [47,74]. Figure 9 shows that the N2 adsorption volumes increase with increasing relative pressure, and generally the higher the TOC content, the higher the maximum adsorption volume. Due to the capillary condensation, when the P/P0 value is greater than 0.42, the adsorption and desorption curves separate forming a hysteresis loop. The shapes of the hysteresis loops indicate that the shale in the study area has both parallel plate or wedge-shaped, slit-shaped pores, as well as ink bottle pores. The PSDs calculated using the DFT model are plotted in Figure 10, showing a single peak characteristic. Pore volumes vary significantly with the diameter in the range of 2–10nm and the PV decrease with the increase of pore diameter. The PV, SSA and average pore diameter were calculated based on the N2 adsorption isotherm. The PV of mesopores were in the range of 0.99–1.89 cm3/100g (average of 1.53 cm3/100g) (Figure 7). The SSA estimated from N2 adsorption were between 15.94 m2/g and 27.22 m2/g, with an average of 21.44 m2/g. While the average pore diameters of the shale samples measured by N2 adsorption data ranges from 3.75 nm to 5.23 nm (average of 4.46 nm), which is corresponding to mesopores (Figure 7).

4.3.3. Pore Structure from HMIP

The HMIP method is generally used to quantitatively characterize macropores, especially for micron-sized pores [9,11,75]. As shown in Figure 11, the change rate of PV decrease with increasing of pore width, and the curves with diameter less than 100 nm changed significantly, which indicates that the pores with diameters in the range of 7–10 nm contribute most of the total pore volume. The inconsistency of pore size distribution curves in different shale samples suggests a strong heterogeneity of pores. Based on the HMIP data, the pore structure parameters are also shown in Figure 7. The average pore diameters were in the range of 61–160 nm (mean of 126.1 nm). The pore volume and specific surface area of the pores range from 0.58 cm3/100g to 1.54 cm3/100g (average 0.97 cm3/100g) and from 1.31 m2/g to 3.46 m2/g (average of 2.16 m2/g), respectively (Figure 7). Due to the limitation of HMIP experiment, the pores with diameter less than 3 nm are not accessible by mercury [30]. Hence, the micropores were not detected and measured by HMIP in this study.

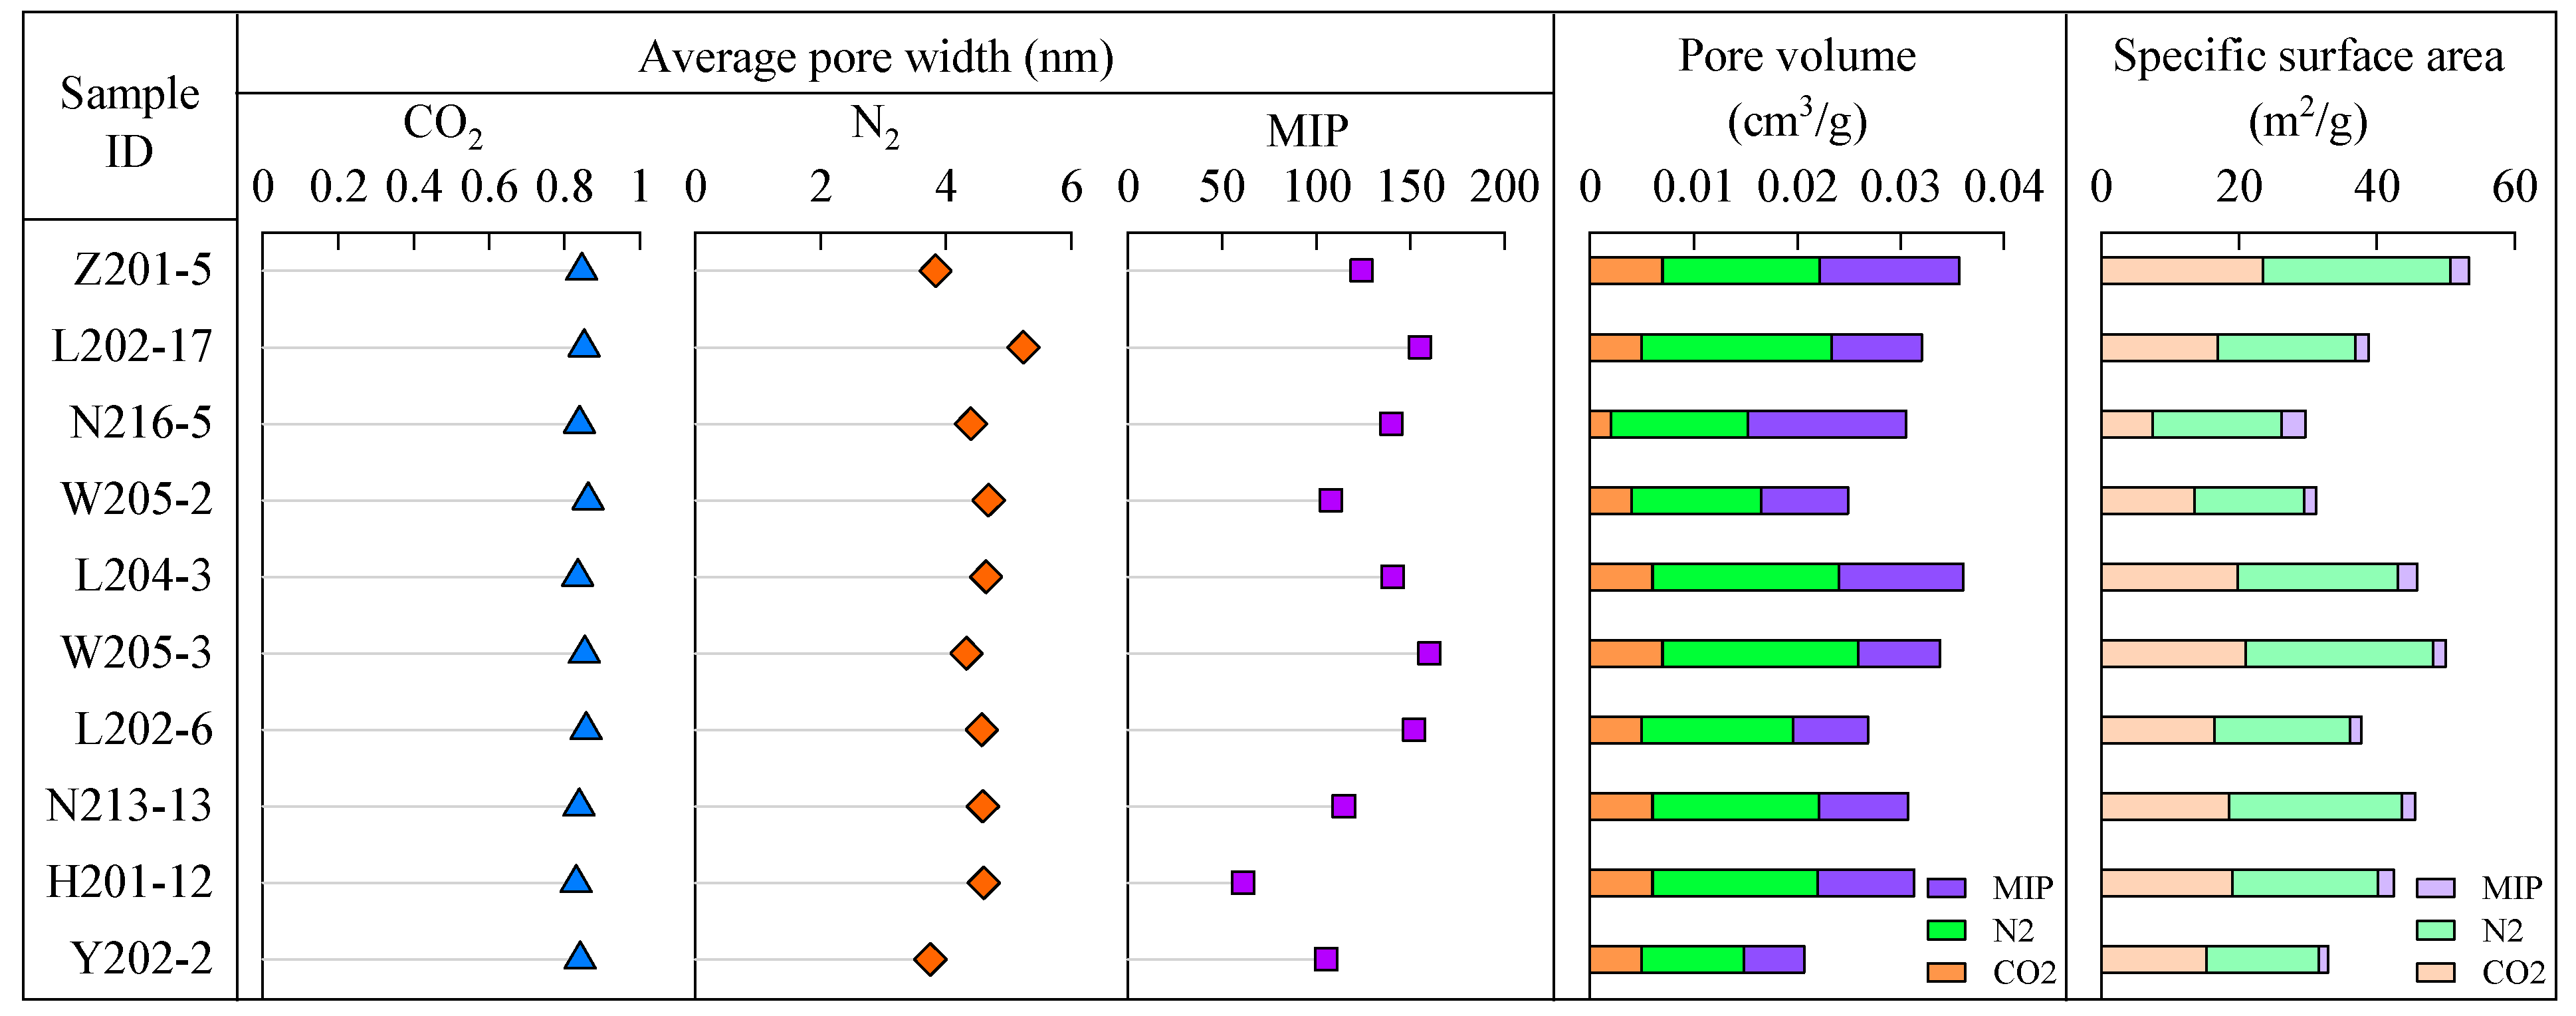
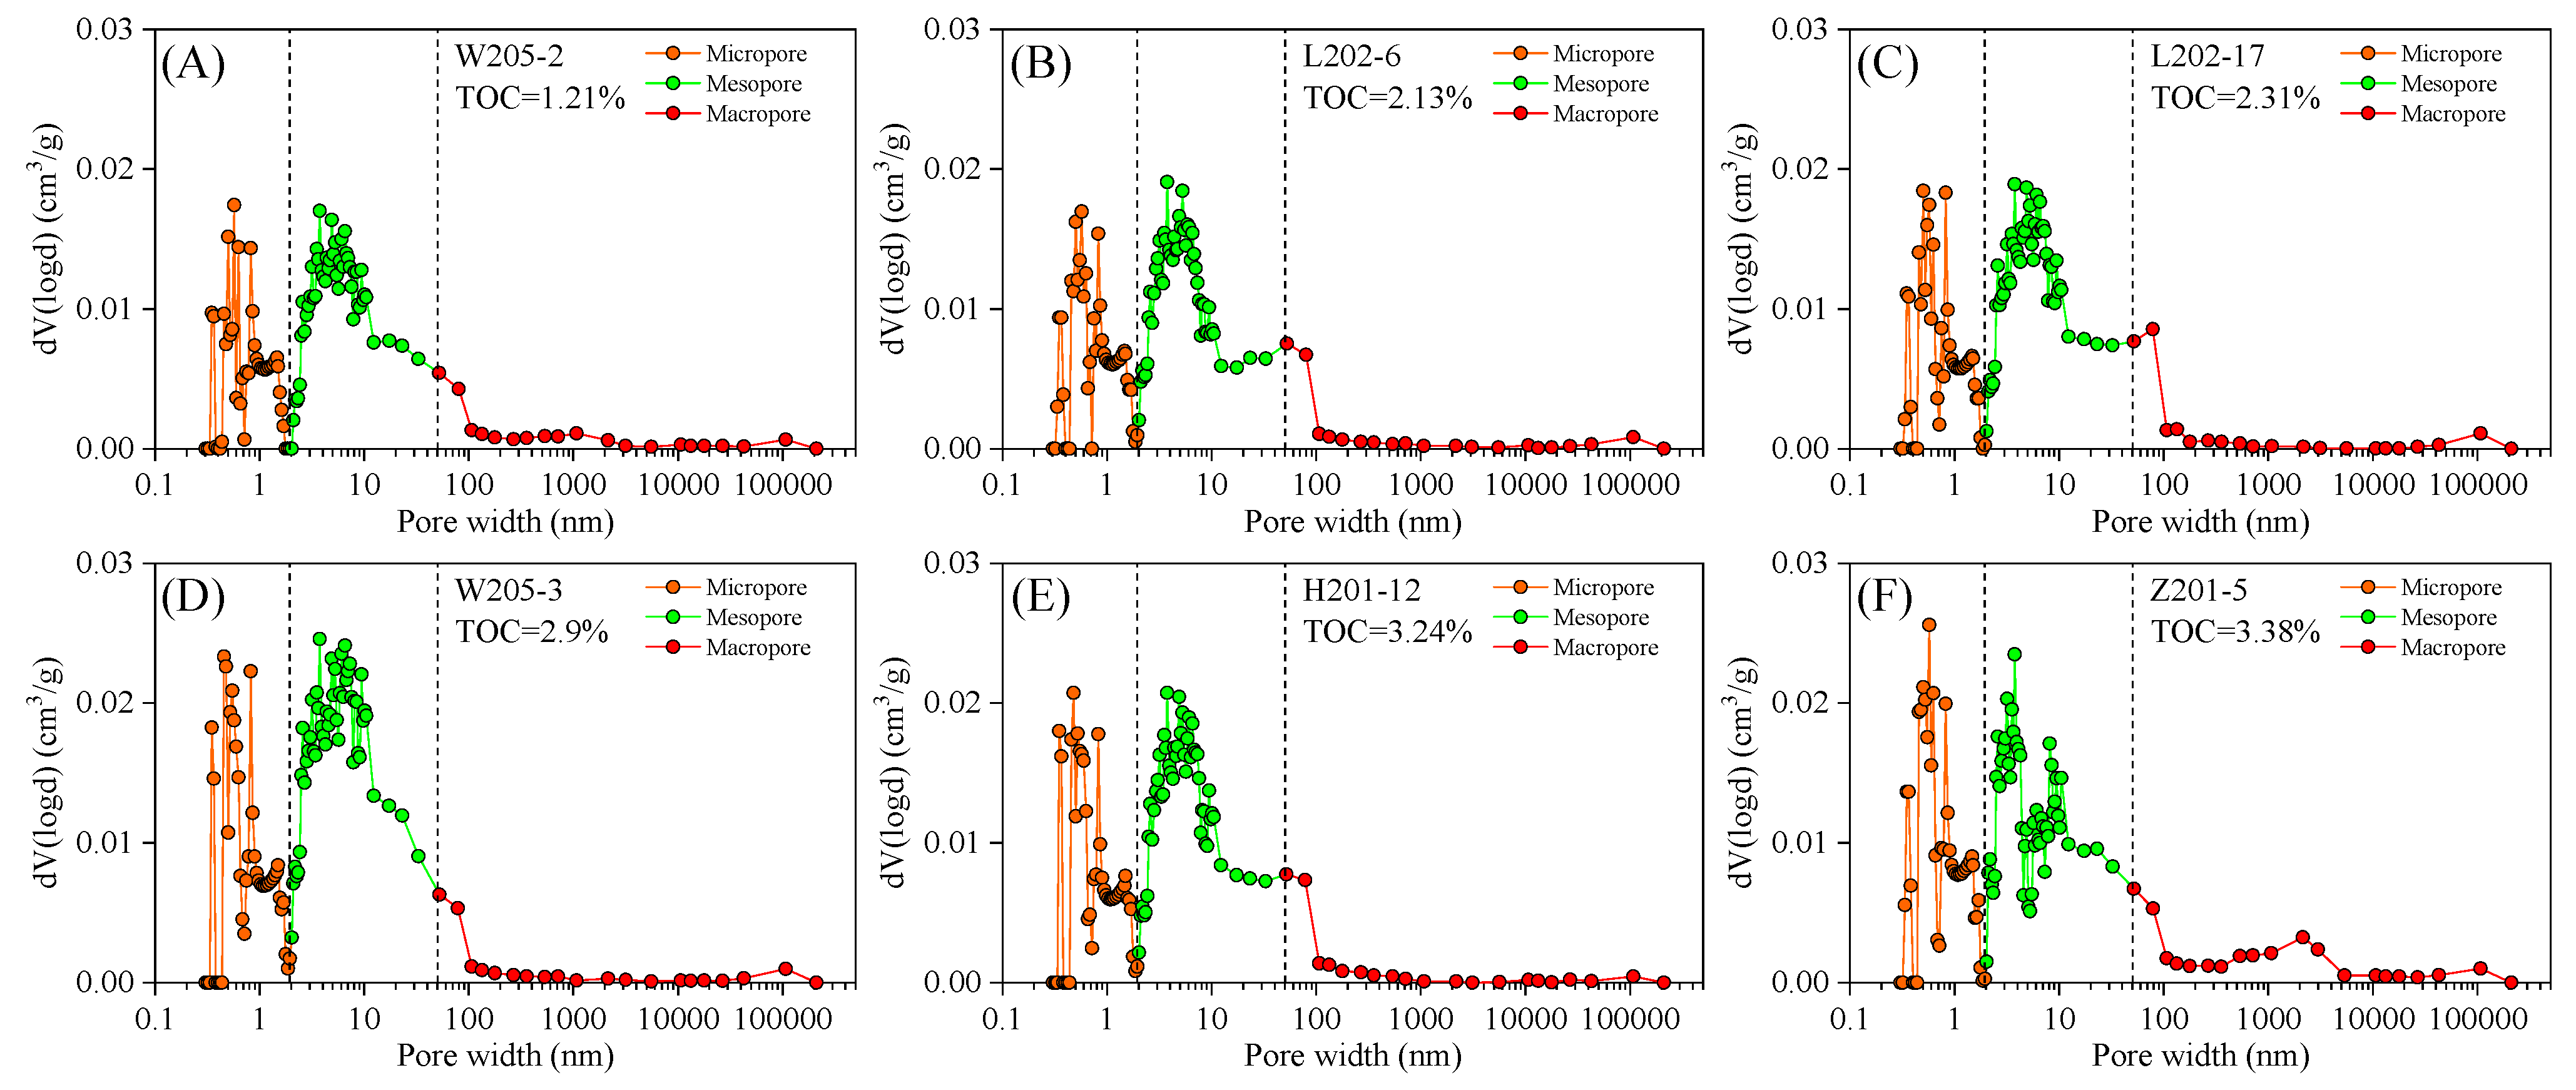
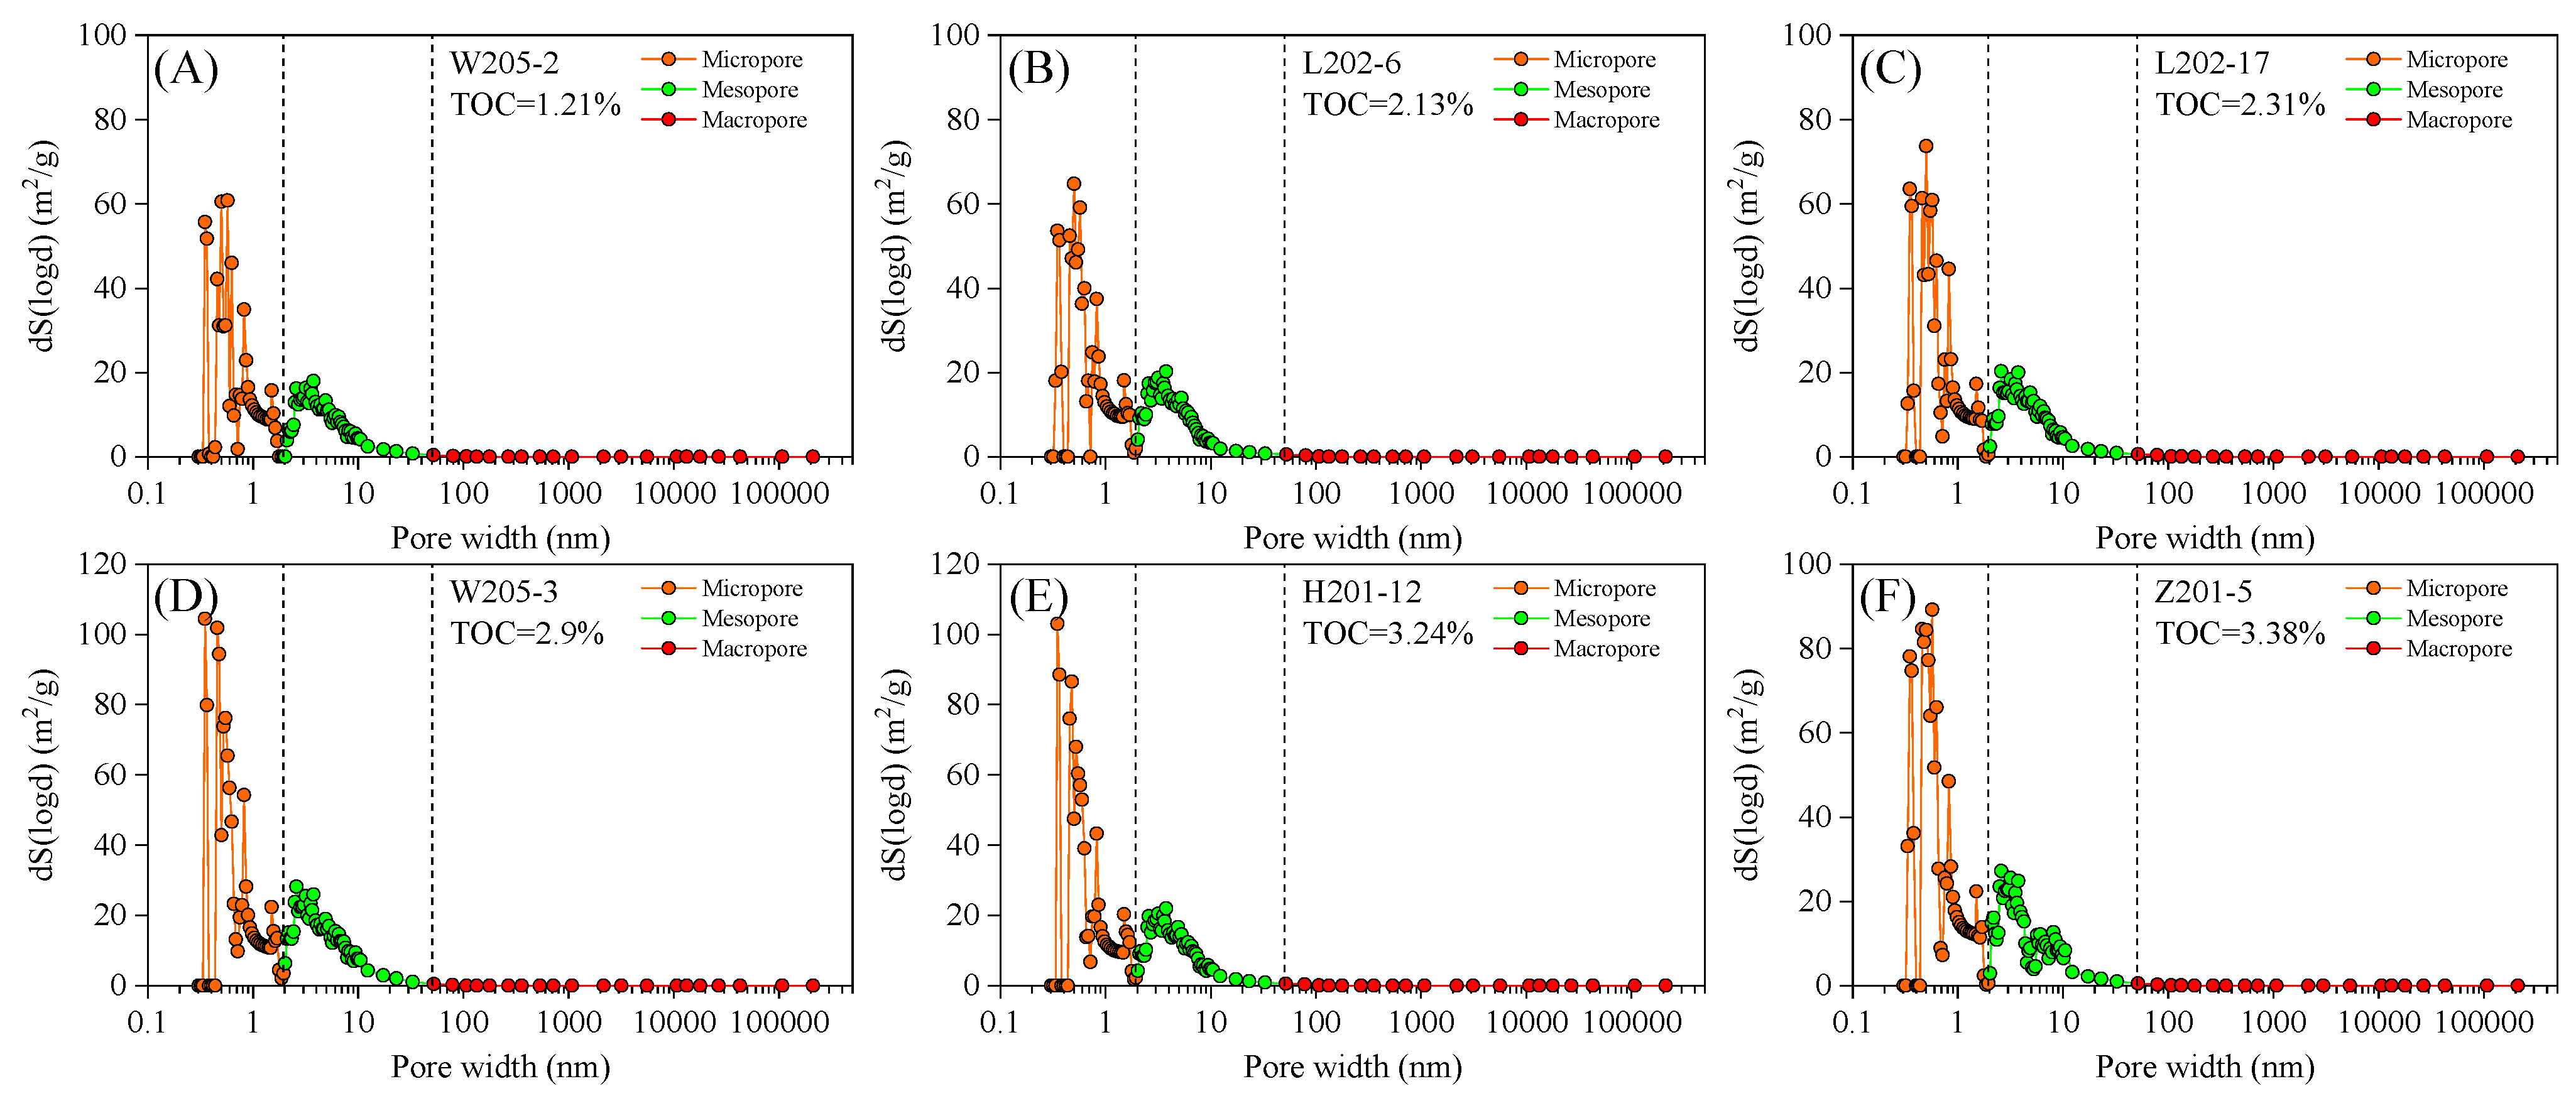
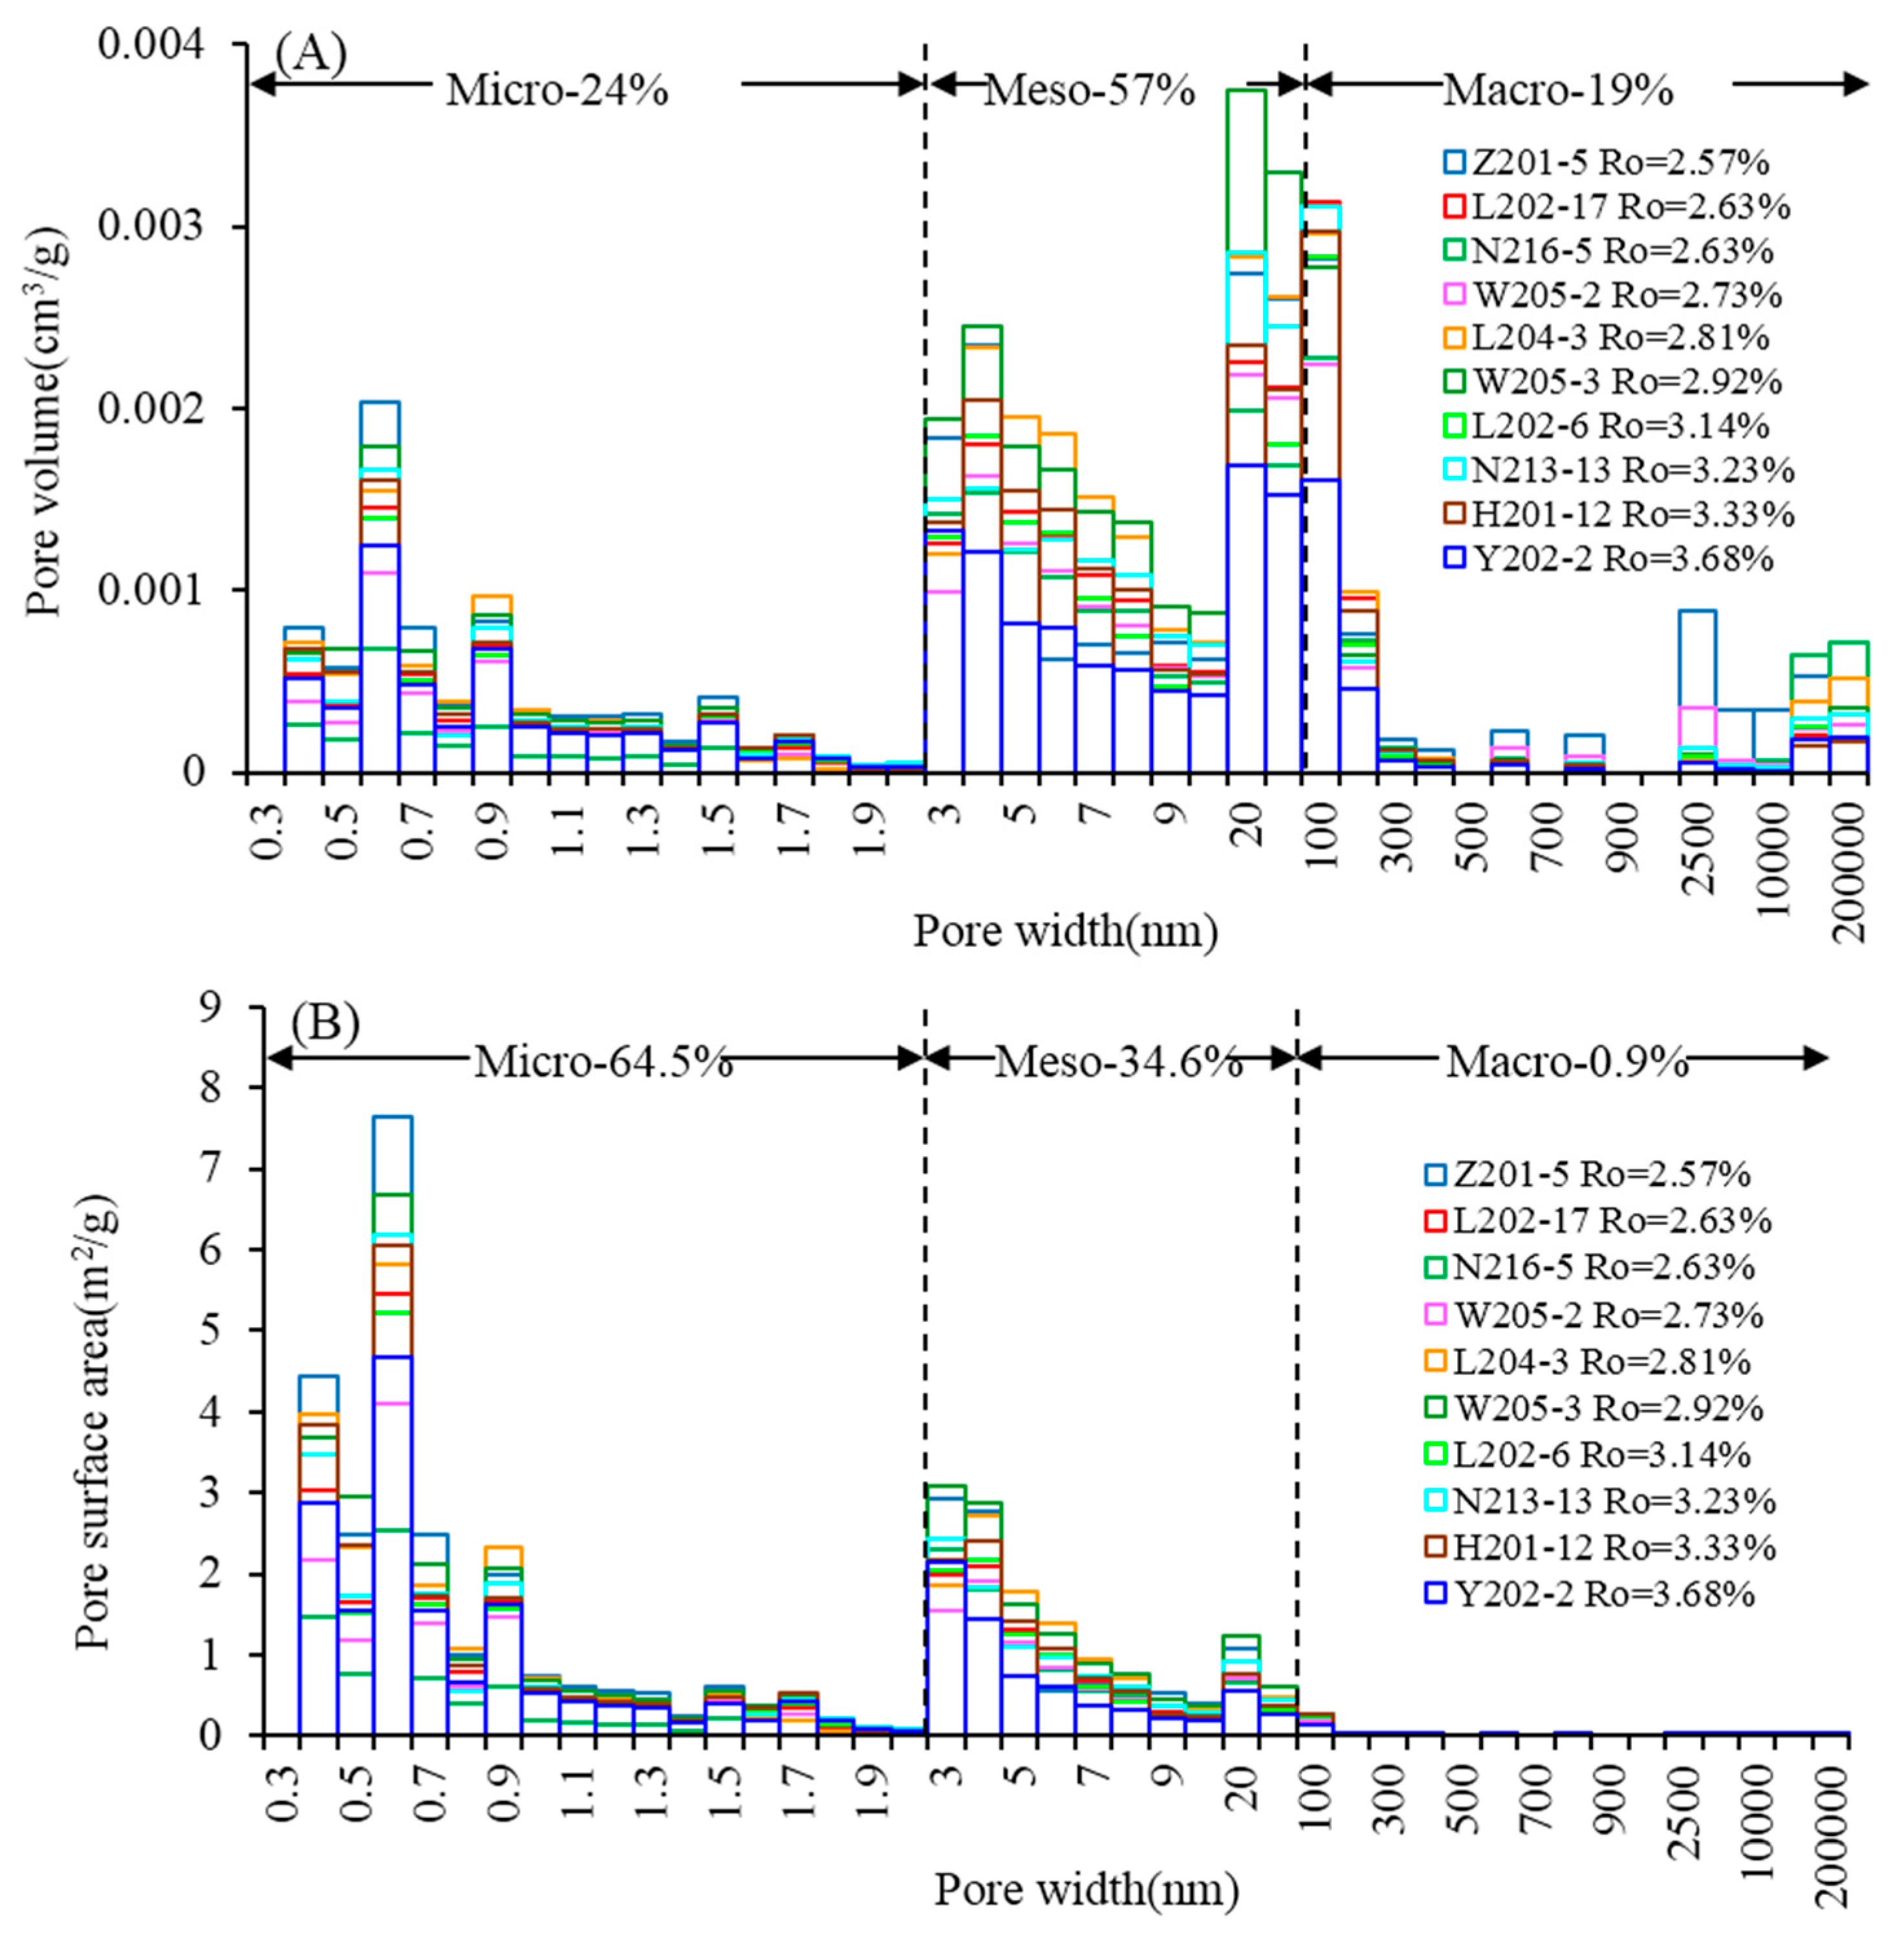
4.3.4. Full-Scale Pore Structure Characterization

Shale pore structure can be characterized by many methods, but each method has its limitation and cannot be used to characterize the full-scale pore structure by a single method. In this work, with the combination of the low-pressure CO2/N2 adsorption, and HMIP experiments, the full-scale pore structure were quantitatively characterized. Micropores, mesopores, and macropores were characterized using CO2 adsorption, N2 adsorption, and HMIP, respectively. As plotted in Figure 12, the log differential pore volume versus pore diameter displayed a multimodal distribution, with two high peaks and a relatively lower peak in the pore diameter intervals of 0.4–0.7 nm, 2–20 nm and 40–200 μm, respectively. The PV of micropores and mesopores firstly increased and then decreased with increasing pore size diameter. While the PV of macropores decreased with increasing pore size (Figure 12). As shown in Figure 13, the log differential SSA vs pore size diameter consistently showed two peaks with the pore size diameter in the range of 0.3–1.0 nm and 2–10 nm, respectively. As the pore diameter less than 100 nm, the PSD curves of SSA steadily declined. While after the critical point of 100nm, these PSD curves displayed platykurtic distribution, which decreased slightly and finally flattened. As shown in Figure 14, mesopores contribute most to the total PV, followed by the micropores. Mesopores and micropores account for 57% and 24% of the total PV, respectively. Macropores provide the lowest contribution (19%) to the total PV. Micropores contribute most to the total SSA, accounting for 64.5%. Mesopores are the second largest contributor (34.6%) to the total SSA. While macropores provide the lowest contribution to the total SSA, which only account for 0.9%, and can be ignored.

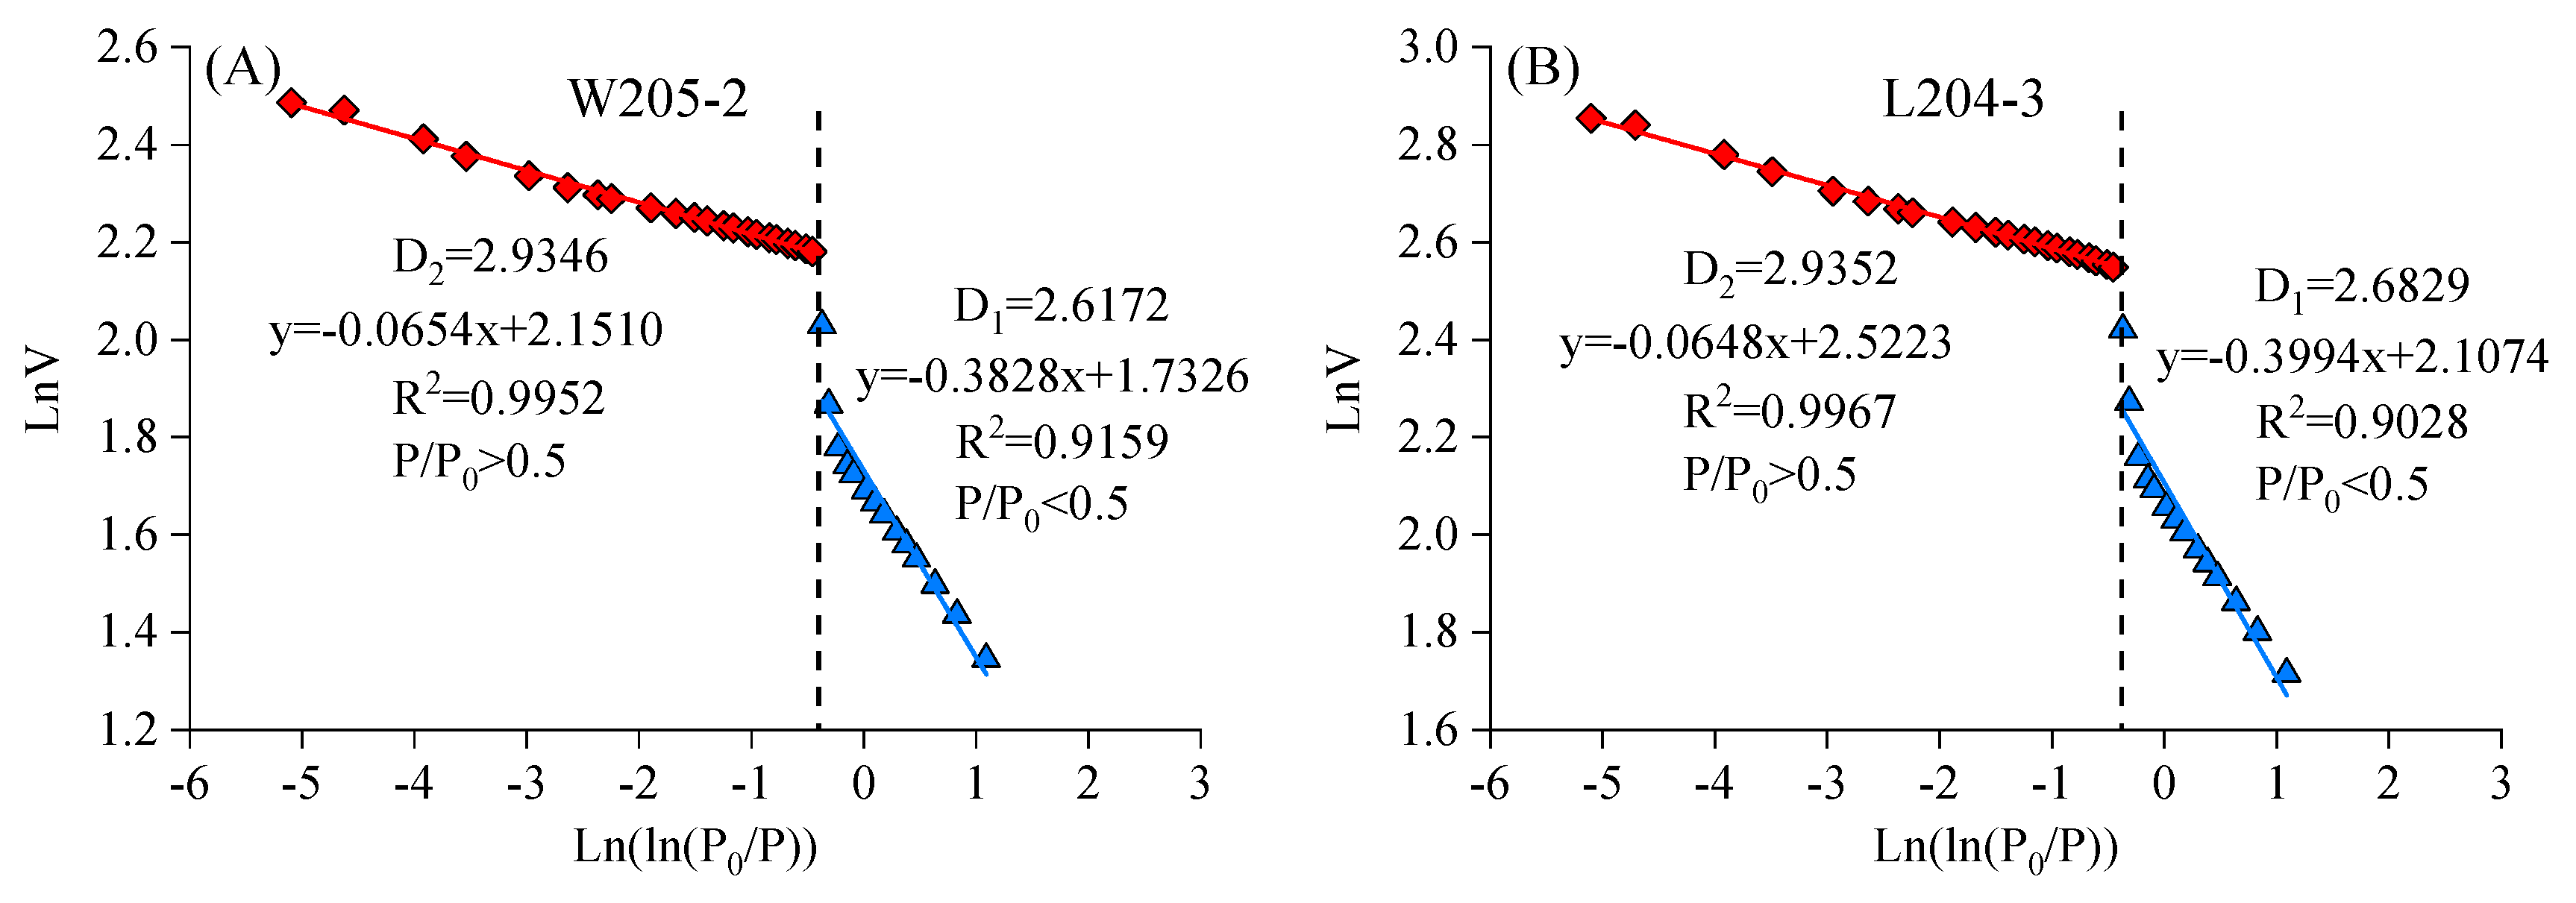
4.4. Fractal Dimensions from N2 Adsorption Experiment

Fractal dimensions were calculated on the basis of N2 desorption isotherm data and fractal FHH model. The plots of ln(V) vs. ln(ln(P0/P)) of two selected shale samples are shown in Figure 15. Fractal dimension D1 was calculated from linear segments at the P/P0 in the range of 0–0.5, while D2 was calculated from linear segments at the P/P0 in the range of 0.5–1.0. Fractal dimension values of all the Longmaxi shale samples are listed in Table 2. The D1 and D2 values are in the range of 2.6480–2.7334 (average, 2.6857) and 2.8924–2.9439 (average, 2.9229), respectively. The correlation coefficients, R2, of most samples are higher than 0.9, suggesting that the Longmaxi shales of the study area have obvious fractal characteristics. The meaning of D1 and D2 were reported in previous studies, in which D1 represents the roughness of the shale surface, while D2 is used for the quantitative characterization of irregularity and heterogeneity of the space structure [31,63,64,66,76]. Therefore, Longmaxi shales developed complex pore internal structure and irregular pore surface, which may be related to the complex and combinations of different types and scales of micro-nano pores. In addition, the fractal dimension also increased with increasing P/P0, suggesting that compared with the larger pores, the pores with smaller diameter are more heterogeneous and complex.

5. Discussion

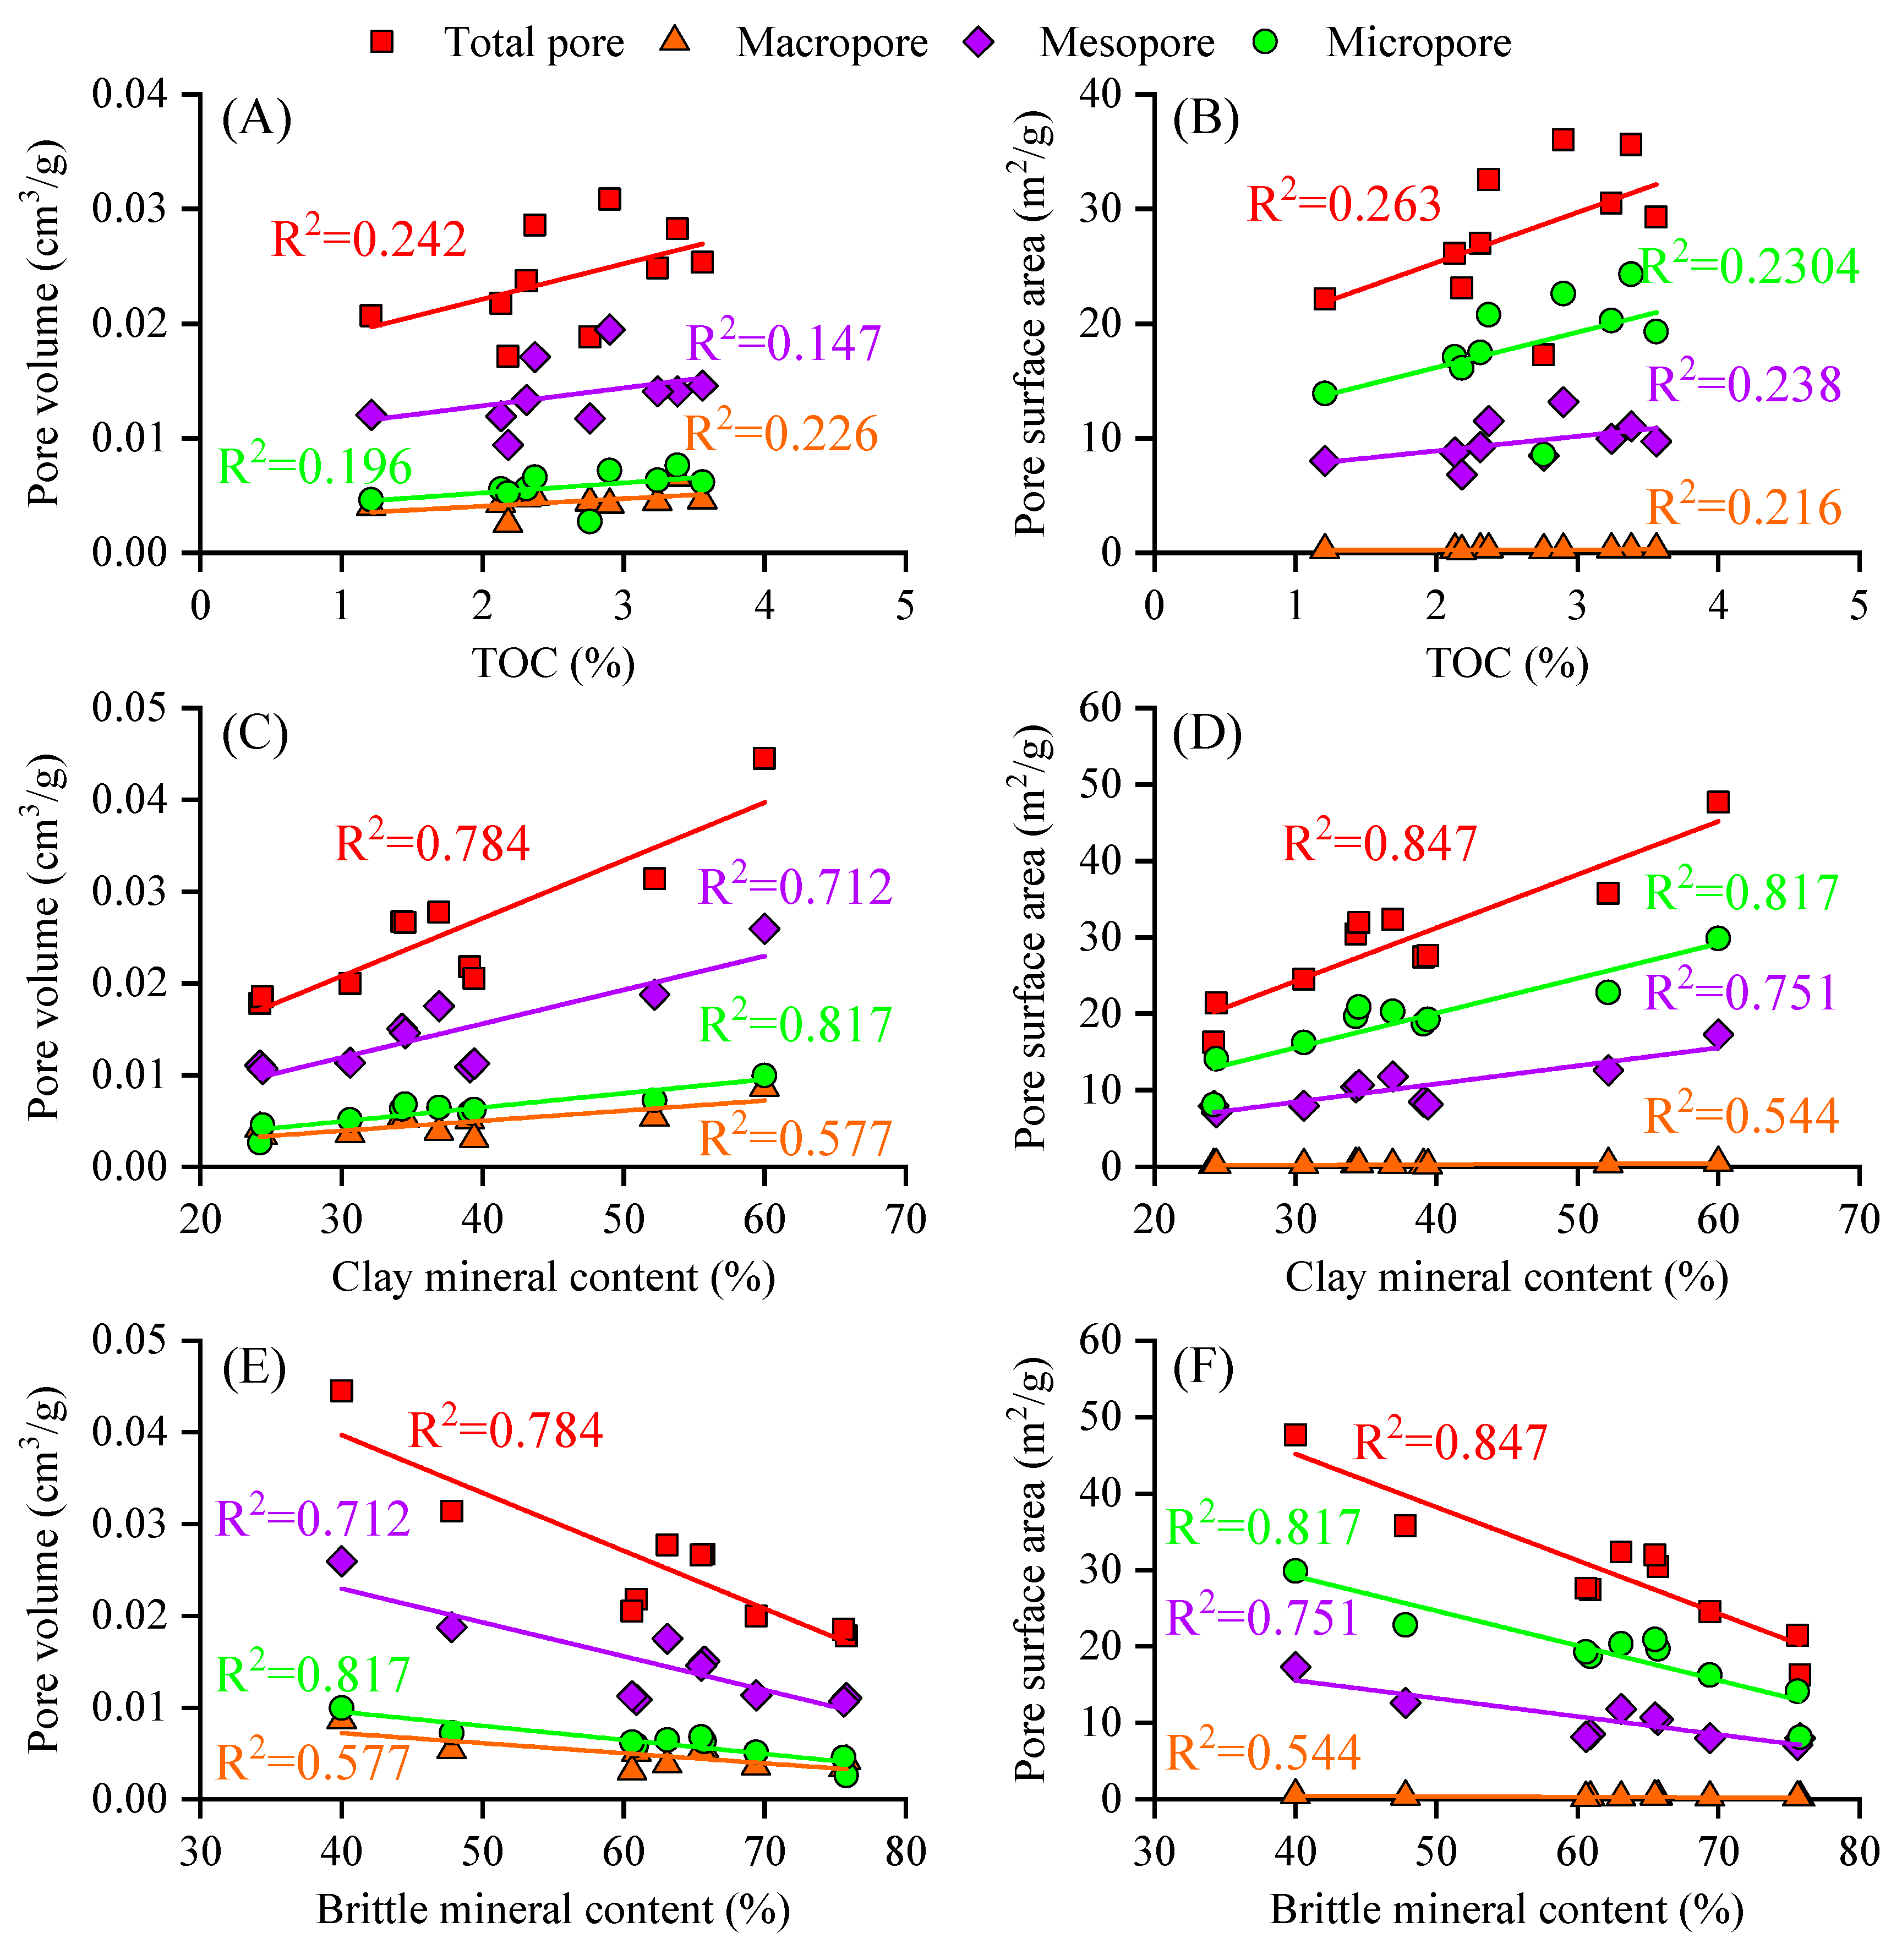
5.1. Compositional Controls on Shale Pore Structure

Previous studies have been conducted on the influencing factors of shale pore structure, most of which suggest that TOC and mineral composition are the main controlling factors of PV and SSA [10,11,77]. But the PV and SSA of different pore scales in the study area have not been paid enough attention. Therefore, the relationships between organic matter content, mineral composition, and pore structure parameters of different pore scales of Longmaxi shale were analyzed.
As shown in Figure 16, the total PV and total SSA of the shale samples show positive correlations with TOC content. The result is consistent with previous studies [75,78,79]. This relationship suggests that organic matter plays an active role in the development of pore system of Longmaxi shales. The PV and SSA of micropores, mesopores, and macropores also possess positive correlations with TOC content. While, the correlation coefficient between the pore volume and surface area of different pore scales and TOC content are of no significant difference (Figure 16A,B), which indicated that the OM can develop micropores, mesopores, as well as macropores. Figure 16A,B show that the TOC content vs PV and vs SSA is mostly flat for macropores, which may indicate that macropore development is largely unaffected by OM. This conclusion may be different from many other previous studies [71,76,79,80] demonstrating that OM mainly developed micropores, which may be due to the strong heterogeneity in shales. So TOC can certainly influence pore development, especially for high maturity shales.
The clay mineral effects on pore structure are plotted in Figure 16 (C and D). The regression analysis suggests that both the PV and SSA possess good positive linear correlations with clay minerals in Longmaxi shales (R2 = 0.784 and 0.847, respectively). The PV and SSA of micropores have the best positive relationship with clay mineral content (R2 values are both 0.817), followed by mesopores (R2 = 0.712 and 0.751, respectively), while the PVmacro and SSAmacro have the weakest correlation with clay mineral content (R2 = 0.577 and 0.544, respectively). This result indicates that clay minerals can influence the development of shale pore structure, especially for micropores and mesopores, which is mainly the contribution of illite and illite/smectite mixed layer to the pore development [65,81].
The correlations between PV, SSA and brittle minerals are illustrated in Figure 16E,F. The PV and SSA of different pore scales decrease with increasing of brittle mineral content. And the PV and SSA exhibit negative linear correlations with brittle minerals (with R2 in the ranges of 0.577–0.817, and 0.544–0.847, respectively). This is mainly because the increase of brittle minerals will lead to a decrease of clay minerals and OM, resulting in poor pore development. Therefore, OM and clay minerals can promote shale pore development, while the high content of brittle minerals is not conducive to the pore development. OM, clay minerals and brittle mineral contents jointly control the development characteristics of shale pore structure, including micropores, mesopores and macropores.

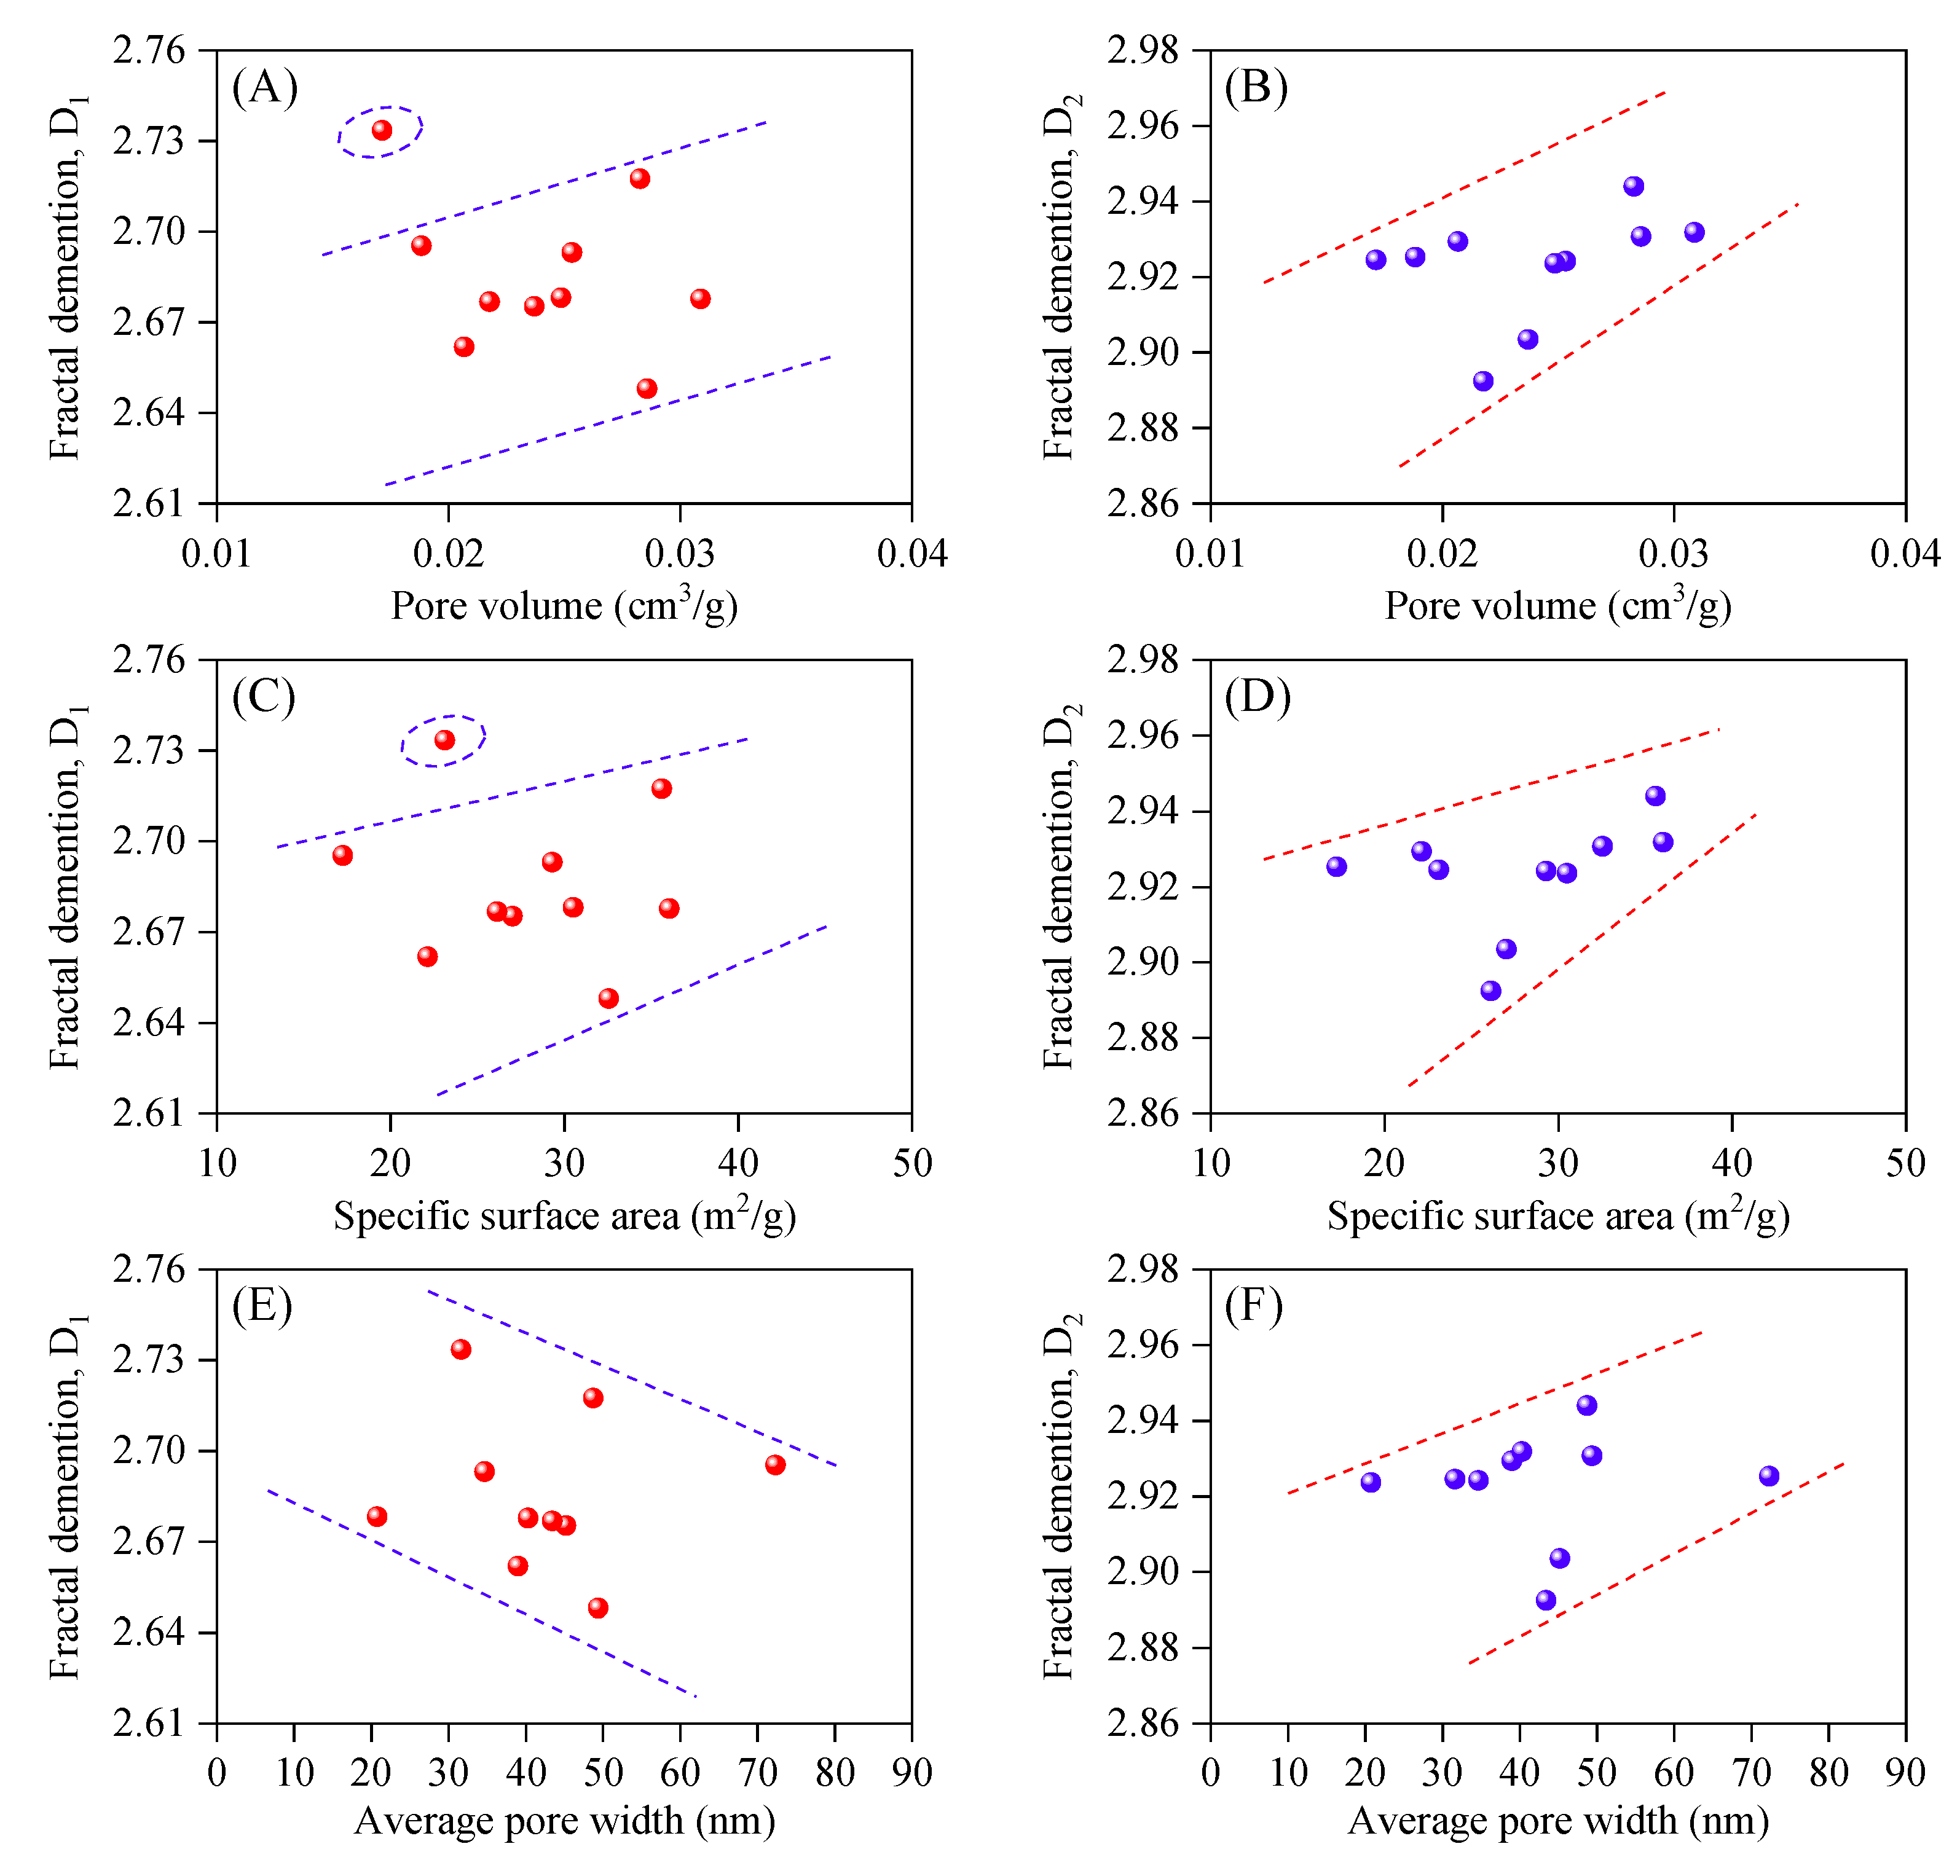
5.2. Correlations Between Pore Structure Parameters and Fractal Dimensions

As illustrated in Figure 17, the relationships between pore structure parameters and fractal dimensions (both D1 and D2) were investigated. The fractal dimensions (both D1 and D2) have positive relationships with the total PV and SSA (Figure 17A–D), except for the singular point (Sample W205-2, Figure 17A,C) with high clay mineral content (60%), which increased the irregularity of the pore surface, and result in an abnormally high fractal dimension D1. The relationships are general trends visible, but not much more as shown in Figure 17, suggesting that gas shales with higher specific surface area have a greater fractal dimension. The fractal dimension D1 has a negative relationship with the average pore width (Figure 17E), indicating that the fractal dimension D1 decreases with increasing average pore width. The result is consistent with previous studies on coals [42], marine shales [12,75], and continental shales [77]. However, the fractal dimension D2 has a positive relationship with the average pore width (Figure 17F), indicating that the fractal dimension D2 increases with increasing average pore size. The result is contrary to previous studies [43,75], showing that the D2 value decreased with increasing average pore size, which may be related to the strong heterogeneity of shale pore structures.
The fractal dimension can be divided into the pore surface fractal dimension and pore space structure fractal dimension as previously discussed by Pyun et al. [38]. The fractal dimension D1 was calculated from N2 desorption isotherm in the lower relative pressure section (P/P0 = 0–0.5), which represents monolayer adsorption and is mainly controlled by active Van der Waals forces. While D2 was calculated from N2 desorption isotherm in the higher relative pressure section (P/P0 = 0.5–1.0), which represents multilayer adsorption and is controlled by capillary condensation. Therefore, D1 and D2 can be defined as the pore surface fractal dimension and pore space structural fractal dimension, respectively. The Longmaxi shales with smaller average pore diameter usually have a higher micropore surface area, resulting in a higher roughness of the pore surface, which lead to a higher value of D1. While shales with larger average pore diameter have a more complex pore structure, resulting in a higher fractal dimension D2.

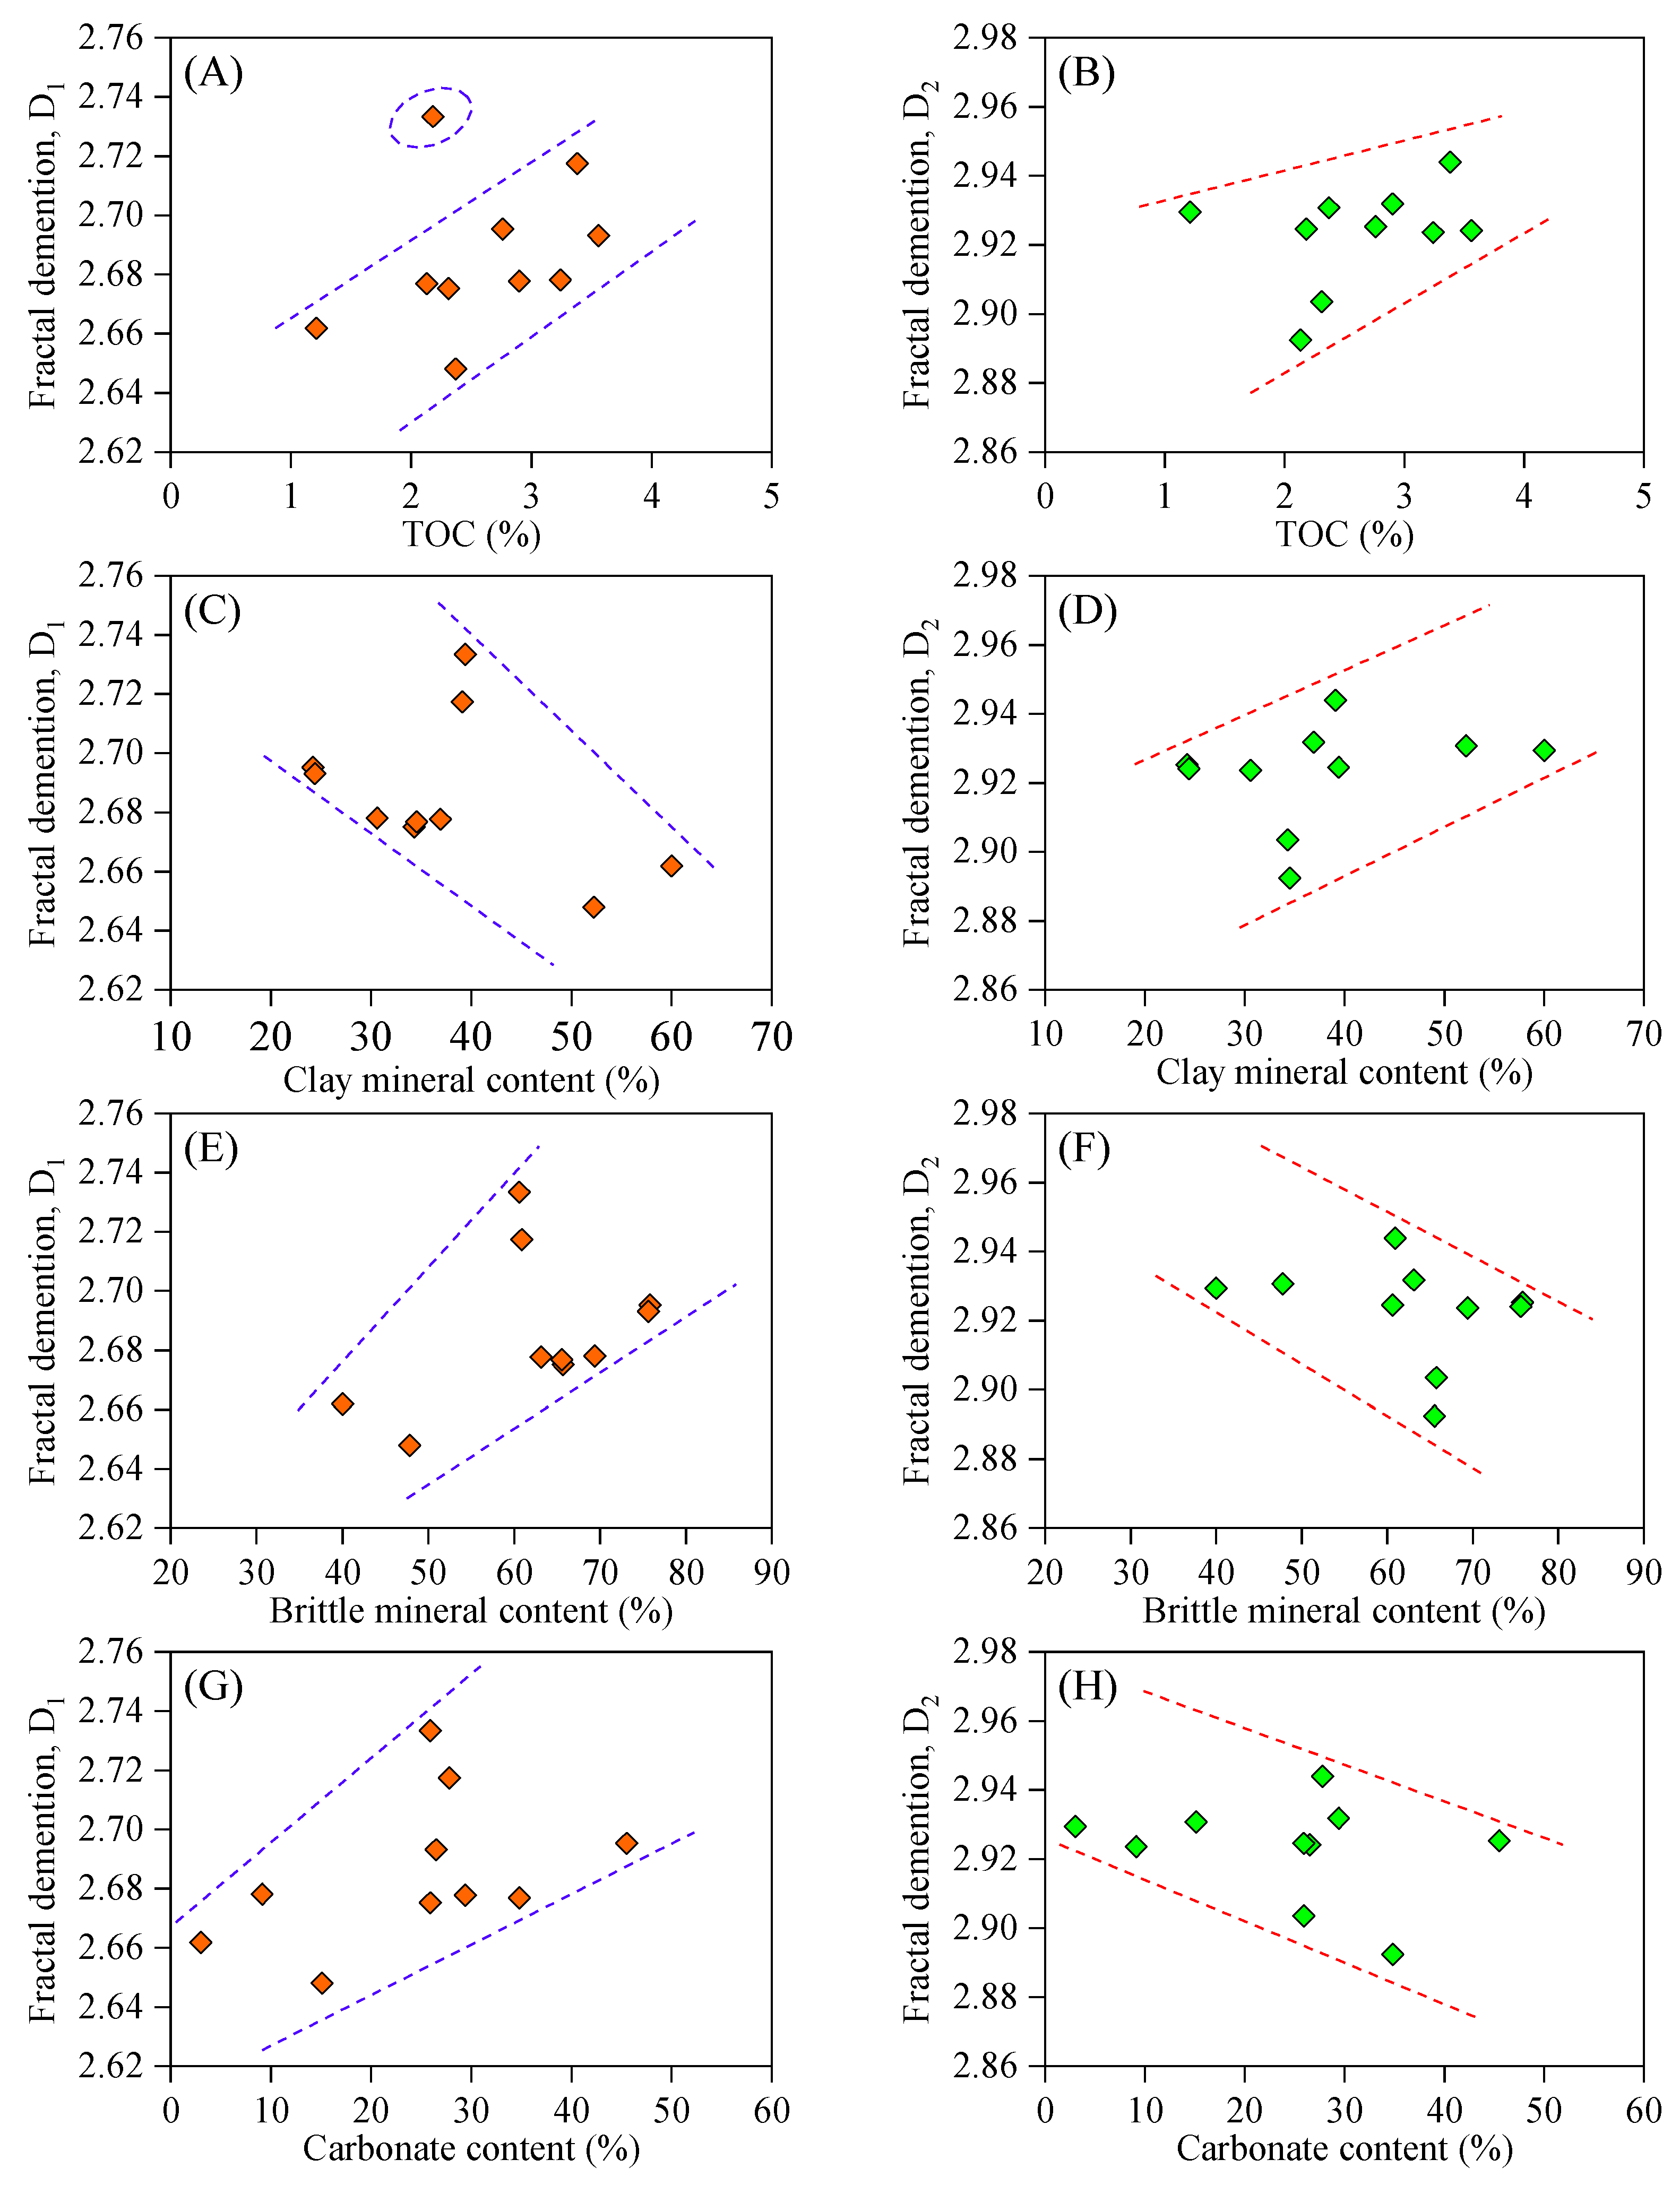
5.3. Factors Influencing Fractal Dimensions

To illustrate the influence of the mineral composition and organic matter content on the fractal characteristics, the relationships between the fractal dimensions (D1 and D2) and the mineral compositions, TOC content are plotted in Figure 18. The fractal dimensions (both D1 and D2) display a positive relationship with TOC contents, which is in agreement with the previous findings [31,75,82,83]. The result indicates that the abundance of OM has positive effects on fractal dimensions, which is mainly because TOC content dominated the development of OM pores [13,14,66,67]. The OM mainly developed micropores and mesopores, therefore higher TOC contents leading to a larger SSA and a higher total PV (Figure 16A,B), which will result in a more complex pore structure, and consequently, result in a larger fractal dimension.
Figure 18C,D also show the relationship between the fractal dimensions and clay mineral contents. The fractal dimension D2 has a positive relationship with clay minerals (Figure 18D), because the layer and flocculent structures of clays increased the heterogeneity and complexity of shale pore space structures, thereby the fractal dimension D2 increased with increasing clay minerals. While the fractal dimension D1 decreased with the increase of clay minerals. This phenomenon may be related to the internal physical property of clay minerals [13,19]. Although clay minerals can increase the complexity of pore space, the surface roughness decreased, which resulted in a smaller surface fractal dimension D1 [84]. Figure 18F shows a negative relationship between the fractal dimension D2 and brittle mineral contents. This is mainly because the pores associated with brittle minerals are mainly carbonate (calcite and dolomite) dissolution pores, and some interparticle pores between brittle minerals, which have poor connectivity and relatively simple pore space structure. Therefore, with increasing brittle mineral contents, the fractal dimension D2 decreased. Moreover, carbonate content has a significant influence on fractal dimension D2 (Figure 18H). As the carbonate content increases, the complexity of pore space structure decreases, resulting in a smaller fractal dimension D2. While the fractal dimension D1 has positive relationship with brittle mineral content and carbonate content (Figure 18E,G), which is mainly related to the dissolution pores associated with calcite and dolomite, resulting in a relatively higher surface fractal dimension D1 due to the increasing roughness of the dissolution pore surface [85].
Therefore, our overall findings suggest that the TOC content positively influence the fractal dimension, whereas the clay minerals and brittle minerals play different influences on the fractal dimension D1 and D2. Thus, organic matters and mineral compositions jointly affect the fractal dimensions of shale pores. The higher the fractal dimensions, the more complex the pore structures, and leading to a larger SSA. Shales with a higher value of D1 have a higher roughness pore surface, which can provide more adsorption spaces for shale gas and have a greater potential storage capacity for adsorption gas. Shales with a higher value of D2 have a more complex pore space structure, and better pore connectivity, which is beneficial to the free gas storage capacity. Therefore, the fractal dimensions cannot only be an important parameter for the characterization of pore structure, but also an effective parameter reflecting the gas storage capacity of shale. Therefore, the fractal dimension would perform a vital role in quantitatively and comprehensively characterizing the shale reservoirs in the future.

6. Conclusions

In this study, multi-techniques including FE-SEM, low-pressure N2/CO2 adsorption and HMIP were used to quantitatively characterize the pore structure of the Longmaxi shales in the south of Sichuan Basin. In addition, the fractal characteristics of shale pore structure were analyzed using the FHH model based on N2 adsorption experiment. The effects of TOC content and mineral compositions upon pore structures and fractal dimension were discussed. And the relationships between the fractal dimensions and pore structure parameters were also analyzed. Significant conclusions are as follows:
(1) Longmaxi shales are rich in OM, clay minerals and quartz, with average contents of 2.6%, 37.6% and 29.9%, respectively. And also have a high vitrinite reflectance ranging from 2.57% to 3.68% (average of 2.97%). The pore network consists of OM pores, interP pores, intraP pores, and microfracture, with the diameters ranging from several nanometers to micrometers. The OM pores dominated the pore system, which has complex architecture and network as well as good connectivity.
(2) The PV is mainly contributed by mesopores, followed by micropores, accounting for 57% and 24% of the total PV, respectively. Macropores provide the lowest contribution (19%) to the total PV. Micropores contribute most to the total SSA, followed by mesopores, accounting for 64.5% and 34.6% of the total SSA, respectively. While macropores provide the lowest contribution to the total SSA, only accounting for 0.9%.
(3) OM and clay minerals are the main factors influencing shale pore structures and have a positive contribution to pore development. Both the PV and SSA have positive correlations with TOC content and clay minerals. Whereas the brittle minerals inhibit shale pore development. The PV and SSA decrease with increasing of brittle minerals.
(4) The Longmaxi shale has a rather irregular pore geometry and complex pore structure. Shale pores with larger PV and SSA generally have more complex pore geometry structure and higher roughness pore surface, resulting in larger fractal dimensions D1 and D2. The small pores usually have a higher roughness surface, while the larger pores have more complex pore geometry structure. The fractal dimensions of shale are jointly controlled by OM, clay minerals and brittle minerals. The influence of different components on the fractal dimension is complicated. The TOC content is the key factor that positively influences the fractal dimensions. Clay minerals have a negative influence on fractal dimension D1, and positive influence D2, whereas the brittle minerals show an opposite influence.

Author Contributions

Conceptualization, Z.J., S.J. and X.W.; methodology, J.C. and L.Z.; investigation, X.W. and X.L.; drawing, X.W. and J.L.; writing-original draft preparation, X.W.; writing-review and editing, Z.J. and S.J. supervision, Z.J.

Funding

This research was financially supported by the National Science and Technology Major Project of China (No. 2017ZX05035-002), the National Natural Science Foundation of China (No. 41472112 and No.41728004).

Conflicts of Interest

The authors declare no conflict of interest.

References

  1. Curtis, J.B. Fractured shale-gas systems. AAPG Bull. 2002, 86, 1921–1938. [Google Scholar]
  2. Bernard, S.; Horsfield, B.; Schulz, H.-M.; Wirth, R.; Schreiber, A.; Sherwood, N. Geochemical evolution of organic-rich shales with increasing maturity: A STXM and TEM study of the Posidonia Shale (Lower Toarcian, northern Germany). Mar. Petrol. Geol. 2012, 31, 70–89. [Google Scholar] [CrossRef]
  3. Johnson, C.; Boersma, T. Energy (in)security in Poland the case of shale gas. Energy Policy 2013, 53, 389–399. [Google Scholar] [CrossRef] [Green Version]
  4. Zou, C.N.; Du, J.H.; Xu, C.C.; Wang, Z.C.; Zhang, B.M.; Wei, G.Q.; Wang, T.S.; Yao, G.S.; Deng, S.H.; Liu, J.L.; et al. Formation, distribution, resource potential, and discovery of Sinian-Cambrian giant gas field, Sichuan Basin, SW China. Petrol. Explor. Dev. 2014, 41, 306–325. [Google Scholar] [CrossRef]
  5. Zou, C.; Yang, Z.; Dai, J.; Dong, D.; Zhang, B.; Wang, Y.; Deng, S.; Huang, J.; Liu, K.; Yang, C.; et al. The characteristics and significance of conventional and unconventional Sinian–Silurian gas systems in the Sichuan Basin, central China. Mar. Petrol. Geol. 2015, 64, 386–402. [Google Scholar] [CrossRef]
  6. Hao, F.; Zou, H.Y.; Lu, Y.C. Mechanisms of shale gas storage: Implications for shale gas exploration in China. AAPG Bull. 2013, 97, 1325–1346. [Google Scholar] [CrossRef]
  7. Guo, X.; Li, Y.; Liu, R.; Wang, Q. Characteristics and controlling factors of micropore structures of the Longmaxi Shale in the Jiaoshiba area, Sichuan Basin. Nat. Gas Ind. B 2014, 1, 165–171. [Google Scholar] [CrossRef] [Green Version]
  8. Technically Recoverable Shale Oil. Shale Gas Resources: An Assessment of 137 Shale Formations in 41 Countries Outside the United States; Independent Statistics & Analysis and US Department of Energy: Washington, DC, USA, 2013.
  9. Ross, D.J.K.; Bustin, R.M. The importance of shale composition and pore structure upon gas storage potential of shale gas reservoirs. Mar. Petrol. Geol. 2009, 26, 916–927. [Google Scholar] [CrossRef]
  10. Zheng, X.; Zhang, B.; Sanei, H.; Bao, H.; Meng, Z.; Wang, C.; Li, K. Pore structure characteristics and its effect on shale gas adsorption and desorption behavior. Mar. Petrol. Geol. 2019, 100, 165–178. [Google Scholar] [CrossRef]
  11. Clarkson, C.R.; Solano, N.; Bustin, R.M.; Bustin, A.M.M.; Chalmers, G.R.L.; He, L.; Melnichenko, Y.B.; Radlinski, A.P.; Blach, T.P. Pore structure characterization of North American shale gas reservoirs using USANS/SANS, gas adsorption, and mercury intrusion. Fuel 2013, 103, 606–616. [Google Scholar] [CrossRef]
  12. Yang, F.; Ning, Z.F.; Liu, H.Q. Fractal characteristics of shales from a shale gas reservoir in the Sichuan Basin, China. Fuel 2014, 115, 378–384. [Google Scholar] [CrossRef]
  13. Loucks, R.G.; Reed, R.M.; Ruppel, S.C.; Hammes, U. Spectrum of pore types and networks in mudrocks and a descriptive classification for matrix-related mudrock pores. AAPG Bull. 2012, 96, 1071–1098. [Google Scholar] [CrossRef] [Green Version]
  14. Chalmers, G.R.; Bustin, R.M.; Power, I.M. Characterization of gas shale pore systems by porosimetry, pycnometry, surface area, and field emission scanning electron microscopy/transmission electron microscopy image analyses: Examples from the Barnett, Woodford, Haynesville, Marcellus, and Doig units. AAPG Bull. 2012, 96, 1099–1119. [Google Scholar]
  15. Yang, F.; Ning, Z.F.; Wang, Q.; Zhang, R.; Krooss, B.M. Pore structure characteristics of lower Silurian shales in the southern Sichuan Basin, China: Insights to pore development and gas storage mechanism. Int. J. Coal Geol. 2016, 156, 12–24. [Google Scholar] [CrossRef]
  16. Xiong, F.; Jiang, Z.; Li, P.; Wang, X.; Bi, H.; Li, Y.; Wang, Z.; Amooie, M.A.; Soltanian, M.R.; Moortgat, J. Pore structure of transitional shales in the Ordos Basin, NW China: Effects of composition on gas storage capacity. Fuel 2017, 206, 504–515. [Google Scholar] [CrossRef]
  17. Slatt, R.M.; O’Brien, N.R. Pore types in the Barnett and Woodford gas shales: Contribution to understanding gas storage and migration pathways in fine-grained rocks. AAPG Bull. 2011, 95, 2017–2030. [Google Scholar] [CrossRef]
  18. Loucks, R.G.; Reed, R.M.; Ruppel, S.C.; Jarvie, D.M. Morphology, Genesis, and Distribution of Nanometer-Scale Pores in Siliceous Mudstones of the Mississippian Barnett Shale. J. Sediment. Res. 2009, 79, 848–861. [Google Scholar] [CrossRef] [Green Version]
  19. Kuila, U.; McCarty, D.K.; Derkowski, A.; Fischer, T.B.; Topor, T.; Prasad, M. Nano-scale texture and porosity of organic matter and clay minerals in organic-rich mudrocks. Fuel 2014, 135, 359–373. [Google Scholar] [CrossRef] [Green Version]
  20. Sing, K.S.W.; Everett, D.H.; Haul, R.A.W.; Moscou, L.; Pierotti, R.A.; Rouquerol, J.; Siemieniewska, T. Reporting Physisorption Data for Gas/Solid Systems with Special Reference to the Determination of Surface Area and Porosity. Pure Appl. Chem. 1985, 57, 603–619. [Google Scholar] [CrossRef]
  21. Chalmers, G.R.L.; Bustin, R.M. The organic matter distribution and methane capacity of the lower Cretaceous strata of northeastern British Columbia, Canada. Int. J. Coal Geol. 2007, 70, 223–239. [Google Scholar] [CrossRef]
  22. Klaver, J.; Desbois, G.; Urai, J.L.; Littke, R. BIB-SEM study of the pore space morphology in early mature Posidonia Shale from the Hils area, Germany. Int. J. Coal Geol. 2012, 103, 12–25. [Google Scholar] [CrossRef]
  23. Klaver, J.; Desbois, G.; Littke, R.; Urai, J.L. BIB-SEM characterization of pore space morphology and distribution in postmature to overmature samples from the Haynesville and Bossier Shales. Mar. Petrol. Geol. 2015, 59, 451–466. [Google Scholar] [CrossRef]
  24. Tomutsa, L.; Silin, D.; Radmilovic, V. Analysis of chalk petrophysical properties by means of submicron-scale pore imaging and modeling. SPE Reserv. Eval. Eng. 2007, 10, 285–293. [Google Scholar] [CrossRef]
  25. Javadpour, F. Nanopores and Apparent Permeability of Gas Flow in Mudrocks (Shales and Siltstone). J. Can. Petrol. Technol. 2009, 48, 16–21. [Google Scholar] [CrossRef]
  26. Tiwari, P.; Deo, M.; Lin, C.L.; Miller, J.D. Characterization of oil shale pore structure before and after pyrolysis by using X-ray micro CT. Fuel 2013, 107, 547–554. [Google Scholar] [CrossRef]
  27. Clarkson, C.R.; Jensen, J.L.; Pedersen, P.K.; Freeman, M. Innovative methods for flow-unit and pore-structure analyses in a tight siltstone and shale gas reservoir. AAPG Bull. 2012, 96, 355–374. [Google Scholar] [CrossRef]
  28. Mastalerz, M.; He, L.L.; Melnichenko, Y.B.; Rupp, J.A. Porosity of Coal and Shale: Insights from Gas Adsorption and SANS/USANS Techniques. Energy Fuels 2012, 26, 5109–5120. [Google Scholar] [CrossRef]
  29. Bahadur, J.; Radlinski, A.P.; Melnichenko, Y.B.; Mastalerz, M.; Schimmelrnannv, A. Small-Angle and Ultrasmall-Angle Neutron Scattering (SANS/USANS) Study of New Albany Shale: A Treatise on Microporosity. Energy Fuels 2015, 29, 567–576. [Google Scholar] [CrossRef] [Green Version]
  30. Kuila, U.; Prasad, M. Specific surface area and pore-size distribution in clays and shales. Geophys. Prospect. 2013, 61, 341–362. [Google Scholar] [CrossRef]
  31. Hu, J.G.; Tang, S.H.; Zhang, S.H. Investigation of pore structure and fractal characteristics of the Lower Silurian Longmaxi shales in western Hunan and Hubei Provinces in China. J. Nat. Gas Sci. Eng. 2016, 28, 522–535. [Google Scholar] [CrossRef]
  32. Xu, H.; Zhou, W.; Zhang, R.; Liu, S.; Zhou, Q. Characterizations of pore, mineral and petrographic properties of marine shale using multiple techniques and their implications on gas storage capability for Sichuan Longmaxi gas shale field in China. Fuel 2019, 241, 360–371. [Google Scholar] [CrossRef]
  33. Sun, W.; Zuo, Y.; Wu, Z.; Liu, H.; Xi, S.; Shui, Y.; Wang, J.; Liu, R.; Lin, J. Fractal analysis of pores and the pore structure of the Lower Cambrian Niutitang shale in northern Guizhou province: Investigations using NMR, SEM and image analyses. Mar. Petrol. Geol. 2019, 99, 416–428. [Google Scholar] [CrossRef]
  34. Yang, R.; He, S.; Yi, J.Z.; Hu, Q.H. Nano-scale pore structure and fractal dimension of organic-rich Wufeng-Longmaxi shale from Jiaoshiba area, Sichuan Basin: Investigations using FE-SEM, gas adsorption and helium pycnometry. Mar. Petrol. Geol. 2016, 70, 27–45. [Google Scholar] [CrossRef]
  35. Mandelbrot, B.B. The Fractal Geometry of Nature; WH freeman: New York, NY, USA, 1983; Volume 173. [Google Scholar]
  36. Pfeiferper, P.; Avnir, D. Chemistry nonintegral dimensions between two and three. J. Chem. Phys. 1983, 79, 3369–3558. [Google Scholar]
  37. Dathe, A.; Eins, S.; Niemeyer, J.; Gerold, G. The surface fractal dimension of the soil–pore interface as measured by image analysis. Geoderma 2001, 103, 203–229. [Google Scholar] [CrossRef]
  38. Pyun, S.-I.; Rhee, C.-K. An investigation of fractal characteristics of mesoporous carbon electrodes with various pore structures. Electrochim. Acta 2004, 49, 4171–4180. [Google Scholar] [CrossRef]
  39. Sakhaee-Pour, A.; Li, W.F. Fractal dimensions of shale. J. Nat. Gas Sci. Eng. 2016, 30, 578–582. [Google Scholar] [CrossRef]
  40. Pfeifer, P.; Wu, Y.J.; Cole, M.W.; Krim, J. Multilayer adsorption on a fractally rough surface. Phys. Rev. Lett. 1989, 62, 1997–2000. [Google Scholar] [CrossRef]
  41. Qi, H.; Ma, J.; Wong, P.-Z. Adsorption isotherms of fractal surfaces. Colloids Surf. A Physicochem. Eng. Asp. 2002, 206, 401–407. [Google Scholar] [CrossRef]
  42. Yao, Y.; Liu, D.; Tang, D.; Tang, S.; Huang, W. Fractal characterization of adsorption-pores of coals from North China: An investigation on CH4 adsorption capacity of coals. Int. J. Coal. Geol. 2008, 73, 27–42. [Google Scholar] [CrossRef]
  43. Li, Y.; Wang, Z.; Pan, Z.; Niu, X.; Yu, Y.; Meng, S. Pore structure and its fractal dimensions of transitional shale: A cross-section from east margin of the Ordos Basin, China. Fuel 2019, 241, 417–431. [Google Scholar] [CrossRef]
  44. Dong, D.; Wang, Y.; Li, X.; Zou, C.; Guan, Q.; Zhang, C.; Huang, J.; Wang, S.; Wang, H.; Liu, H.; et al. Breakthrough and prospect of shale gas exploration and development in China. Nat. Gas Ind. B 2016, 3, 12–26. [Google Scholar] [CrossRef] [Green Version]
  45. Zhao, W.; Li, J.; Yang, T.; Wang, S.; Huang, J. Geological difference and its significance of marine shale gases in South China. Petrol. Explor. Dev. 2016, 43, 547–559. [Google Scholar] [CrossRef]
  46. Tian, H.; Pan, L.; Xiao, X.M.; Wilkins, R.W.T.; Meng, Z.P.; Huang, B.J. A preliminary study on the pore characterization of Lower Silurian black shales in the Chuandong Thrust Fold Belt, southwestern China using low pressure N-2 adsorption and FE-SEM methods. Mar. Petrol. Geol. 2013, 48, 8–19. [Google Scholar] [CrossRef]
  47. Wang, X.P.; Mou, C.L.; Wang, Q.Y.; Ge, X.Y.; Chen, X.W.; Zhou, K.K.; Liang, W. Diagenesis of black shale in Longmaxi Formation, southern Sichuan Basin and its periphery. Acta Pet. Sin. 2015, 36, 1035–1047, (In Chinese with English abstract). [Google Scholar]
  48. Yang, R.; He, S.; Hu, Q.; Hu, D.; Zhang, S.; Yi, J. Pore characterization and methane sorption capacity of over-mature organic-rich Wufeng and Longmaxi shales in the southeast Sichuan Basin, China. Mar. Petrol. Geol. 2016, 77, 247–261. [Google Scholar] [CrossRef]
  49. Chen, L.; Lu, Y.; Jiang, S.; Li, J.; Guo, T.; Luo, C. Heterogeneity of the Lower Silurian Longmaxi marine shale in the southeast Sichuan Basin of China. Mar. Petrol. Geol. 2015, 65, 232–246. [Google Scholar] [CrossRef]
  50. Yang, R.; Hao, F.; He, S.; He, C.C.; Guo, X.S.; Yi, J.Z.; Hu, H.Y.; Zhang, S.W.; Hu, Q.H. Experimental investigations on the geometry and connectivity of pore space in organic-rich Wufeng and Longmaxi shales. Mar. Petrol. Geol. 2017, 84, 225–242. [Google Scholar] [CrossRef]
  51. General Administration of Quality Supervision, Inspection and Quarantine of the People’s Republic of China. Determination of Total Organic Carbon in Sedimentary Rock; GB/T 19145-2003; GAQSIQ: Beijing, China, 2003.
  52. China National Petroleum Corporation. Method for Determination of Vitrinite Reflectance in Sedimentary Rocks; SY/T 5124-1995; China National Petroleum Corporation: Daqing, China, 1995. [Google Scholar]
  53. Schoenherr, J.; Littke, R.; Urai, J.L.; Kukla, P.A.; Rawahi, Z. Polyphase thermal evolution in the Infra-Cambrian Ara Group (South Oman Salt Basin) as deduced by maturity of solid reservoir bitumen. Org. Geochem. 2007, 38, 1293–1318. [Google Scholar] [CrossRef]
  54. China National Energy Administration. Analysis Method for Clay Minerals and Ordinary Non-Clay Minerals in Sedimentary Rocks by the X-ray Diffraction; SY/T 5163-2010; China National Energy Administration: Beijing, China, 2010.
  55. General Administration of Quality Supervision, Inspection and Quarantine of the People’s Republic of China. Pore Size Distribution and Porosity of Solid Materials by Mercury Porosimetry and Gas Adsorption-Part 3: Analysis of Micropores by Gas Adsorption; GB/T 21650.3-2011; GAQSIQ: Beijing, China, 2011.
  56. General Administration of Quality Supervision, Inspection and Quarantine of the People’s Republic of China. Determination of the Specific Surface Area of Solids by Gas Adsorption Using the BET Method; GB/T 19587-2017; GAQSIQ: Beijing, China, 2017.
  57. Han, Y.; Kwak, D.; Choi, S.; Shin, C.; Lee, Y.; Kim, H. Pore Structure Characterization of Shale Using Gas Physisorption: Effect of Chemical Compositions. Minerals 2017, 7, 66. [Google Scholar] [CrossRef]
  58. Yan, G.Y.; Wei, C.T.; Song, Y.; Zhang, J.J. Pore characteristics of organic-rich shale in the Carboniferous-Permian coal-bearing strata in Qinshui Basin. Energy Explor. Exploit. 2017, 35, 645–662. [Google Scholar] [CrossRef] [Green Version]
  59. Washburn, E.W. The Dynamics of Capillary Flow. Phys. Rev. 1921, 17, 273–283. [Google Scholar] [CrossRef]
  60. Gan, H.; Nandi, S.; Walker, P., Jr. Nature of the porosity in American coals. Fuel 1972, 51, 272–277. [Google Scholar] [CrossRef]
  61. Gregg, S.J.; Sing, K.S.W.; Salzberg, H. Adsorption surface area and porosity. J. Electrochem. Soc. 1967, 114, 279C. [Google Scholar] [CrossRef]
  62. Li, A.; Ding, W.L.; He, J.H.; Dai, P.; Yin, S.; Xie, F. Investigation of pore structure and fractal characteristics of organic-rich shale reservoirs: A case study of Lower Cambrian Qiongzhusi formation in Malong block of eastern Yunnan Province, South China. Mar. Petrol. Geol. 2016, 70, 46–57. [Google Scholar] [CrossRef]
  63. Wang, M.; Xue, H.T.; Tian, S.S.; Wilkins, R.W.T.; Wang, Z.W. Fractal characteristics of Upper Cretaceous lacustrine shale from the Songliao Basin, NE China. Mar. Petrol. Geol. 2015, 67, 144–153. [Google Scholar] [CrossRef]
  64. Li, Z.; Shen, X.; Qi, Z.; Hu, R. Study on the pore structure and fractal characteristics of marine and continental shale based on mercury porosimetry, N2 adsorption and NMR methods. J. Nat. Gas Sci. Eng. 2018, 53, 12–21. [Google Scholar] [CrossRef]
  65. Wilson, M.J.; Wilson, L.; Shaldybin, M.V. Clay mineralogy and unconventional hydrocarbon shale reservoirs in the USA. II. Implications of predominantly illitic clays on the physico-chemical properties of shales. Earth-Sci. Rev. 2016, 158, 1–8. [Google Scholar] [CrossRef]
  66. Mishra, S.; Mendhe, V.A.; Varma, A.K.; Kamble, A.D.; Sharma, S.; Bannerjee, M.; Kalpana, M.S. Influence of organic and inorganic content on fractal dimensions of Barakar and Barren Measures shale gas reservoirs of Raniganj basin, India. J. Nat. Gas Sci. Eng. 2018, 49, 393–409. [Google Scholar] [CrossRef]
  67. Shao, X.; Pang, X.; Li, H.; Hu, T.; Xu, T.; Xu, Y.; Li, B. Pore network characteristics of lacustrine shales in the Dongpu Depression, Bohai Bay Basin, China, with implications for oil retention. Mar. Petrol. Geol. 2018, 96, 457–473. [Google Scholar] [CrossRef]
  68. Tang, X.; Zhang, J.; Wang, X.; Yu, B.; Ding, W.; Xiong, J.; Yang, Y.; Wang, L.; Yang, C. Shale characteristics in the southeastern Ordos Basin, China: Implications for hydrocarbon accumulation conditions and the potential of continental shales. Int. J. Coal. Geol. 2014, 128–129, 32–46. [Google Scholar] [CrossRef]
  69. Gale, J.F.W.; Holder, J. Natural fractures in some US shales and their importance for gas production. In Geological Society, London, Petroleum Geology Conference Series; Geological Society of London: London, UK, 2010; Volume 7, pp. 1131–1140. [Google Scholar]
  70. Clarke, R. Basin focus: Maverick basin. Oil Gas Invest. 2007, 27, 87–90. [Google Scholar]
  71. Zeng, L.; Lyu, W.; Li, J.; Zhu, L.; Weng, J.; Yue, F.; Zu, K. Natural fractures and their influence on shale gas enrichment in Sichuan Basin, China. J. Nat. Gas Sci. Eng. 2016, 30, 1–9. [Google Scholar] [CrossRef]
  72. Han, H.; Zhong, N.; Ma, Y.; Huang, C.; Wang, Q.; Chen, S.; Lu, J. Gas storage and controlling factors in an over-mature marine shale: A case study of the Lower Cambrian Lujiaping shale in the Dabashan arc-like thrust–fold belt, southwestern China. J. Nat. Gas Sci. Eng. 2016, 33, 839–853. [Google Scholar] [CrossRef]
  73. Zhang, J.; Li, X.; Wei, Q.; Gao, W.; Liang, W.; Wang, Z.; Wang, F. Quantitative characterization of pore-fracture system of organic-rich marine-continental shale reservoirs: A case study of the Upper Permian Longtan Formation, Southern Sichuan Basin, China. Fuel 2017, 200, 272–281. [Google Scholar] [CrossRef]
  74. Yang, F.; Ning, Z.F.; Wang, Q.; Liu, H.Q. Pore structure of Cambrian shales from the Sichuan Basin in China and implications to gas storage. Mar. Petrol. Geol. 2016, 70, 14–26. [Google Scholar] [CrossRef]
  75. Zhang, J.Z.; Li, X.Q.; Xie, Z.Y.; Li, J.; Zhang, X.Q.; Sun, K.X.; Wang, F.Y. Characterization of microscopic pore types and structures in marine shale_ Examples from the Upper Permian Dalong formation, Northern Sichuan Basin, South China. J. Nat. Gas Sci. Eng. 2018, 59, 326–342. [Google Scholar] [CrossRef]
  76. Wang, Y.; Zhu, Y.M.; Wang, H.Y.; Feng, G.J. Nanoscale pore morphology and distribution of lacustrine shale reservoirs: Examples from the Upper Triassic Yanchang Formation, Ordos Basin. J. Energy Chem. 2015, 24, 512–519. [Google Scholar] [CrossRef]
  77. Liu, X.J.; Xiong, J.; Liang, L.X. Investigation of pore structure and fractal characteristics of organic-rich Yanchang formation shale in central China by nitrogen adsorption/desorption analysis. J. Nat. Gas Sci. Eng. 2015, 22, 62–72. [Google Scholar] [CrossRef]
  78. Chen, L.; Jiang, Z.; Liu, K.; Gao, F.; Wang, P. A Combination of N-2 and CO2 Adsorption to Characterize Nanopore Structure of Organic-Rich Lower Silurian Shale in the Upper Yangtze Platform, South China: Implications for Shale Gas Sorption Capacity. Acta Geol. Sin. Engl. 2017, 91, 1380–1394. [Google Scholar] [CrossRef]
  79. Ji, W.; Song, Y.; Jiang, Z.; Meng, M.; Liu, Q.; Chen, L.; Wang, P.; Gao, F.; Huang, H. Fractal characteristics of nano-pores in the Lower Silurian Longmaxi shales from the Upper Yangtze Platform, south China. Mar. Petrol. Geol. 2016, 78, 88–98. [Google Scholar] [CrossRef]
  80. Ji, W.; Song, Y.; Jiang, Z.; Wang, X.; Bai, Y.; Xing, J. Geological controls and estimation algorithms of lacustrine shale gas adsorption capacity: A case study of the Triassic strata in the southeastern Ordos Basin, China. Int. J. Coal. Geol. 2014, 134, 61–73. [Google Scholar] [CrossRef]
  81. Li, J.; Li, X.; Wu, K.; Wang, X.; Shi, J.; Yang, L.; Zhang, H.; Sun, Z.; Wang, R.; Feng, D. Water Sorption and Distribution Characteristics in Clay and Shale: Effect of Surface Force. Energy Fuels 2016, 30, 8863–8874. [Google Scholar] [CrossRef]
  82. Liang, L.X.; Xiong, J.; Liu, X.J. An investigation of the fractal characteristics of the Upper Ordovician Wufeng Formation shale using nitrogen adsorption analysis. J. Nat. Gas Sci. Eng. 2015, 27, 402–409. [Google Scholar] [CrossRef]
  83. Zhang, M.; Fu, X. Influence of reservoir properties on the adsorption capacity and fractal features of shales from Qinshui coalfield. J. Petrol. Sci. Eng. 2019, 177, 650–662. [Google Scholar] [CrossRef]
  84. Quirk, J.; Aylmore, L. Domains and Quasi-Crystalline Regions in Clay Systems 1. Soil Sci. Soc. Am. J. 1971, 35, 652–654. [Google Scholar] [CrossRef]
  85. Zhang, Y.F.; Yu, B.S.; Sun, M.D. Diagenesis and its effect on pores of the Niutitang Formation shale in southeast Chongqing, China. J. Chengdu Univ. Technol. (Sci. Technol. Ed.) 2017, 44, 48–56. [Google Scholar]
Figure 1. Location, sedimentary environment and isopach map of Silurian Longmaxi shales in the southern Sichuan (modified from Guo et al. [7] and Yang et al. [50]).
Minerals 09 00543 g001
Figure 2. TOC content, thermal maturity and mineral composition of Longmaxi shale.
Minerals 09 00543 g002
Figure 3. Field emission scanning electron microscopy (FE-SEM) images of interP and intraP pores in Longmaxi shale samples. (A) InterP and intraP pores, Sample N213-13; (B) InterP and intraP pores, Sample W205-3; (C) InterP pores, Sample W205-2; (D) IntraP and interP pores, Sample L202-17; (E) IntraP and interP pores associated with clay minerals, Sample W205-2; (F) IntraP and interP pores, Sample W205-2; (G) Intercrystalline pores within pyrite framboid, Sample H201-12; (H) Intercrystalline pores within pyrite framboid, Sample W205-2; (I) Dissolution pores within feldspar, Sample W205-2; (J,K) Dissolution pores within calcite, Sample N213-13; (L) InterP and intraP pores, Sample W205-3.
Minerals 09 00543 g003
Figure 4. FE-SEM images of microfracture in Longmaxi shale samples. (A,B) Microfracture without filling, Sample W205-3; (C,D) Microfracture without filling, Sample W205-3; (E) Microfracture partly filled with organic matter, Sample N213-13; (F) Microfracture filled with organic matter, Sample N213-13; (G,H) Microfracture filled with organic matter, Sample W205-3; (I) Cleavage cracks within grain, Sample N213-13.
Minerals 09 00543 g004
Figure 5. FE-SEM images of organic matter pores in Longmaxi shale samples. (A,B) Organic matter pores associated with clay mineral, Sample N213-13; (C) Organic matter pores within clay aggregates, Sample N213-13; (D) Pores in strip shaped organic matter, Sample N213-13; (E) Pores in isolated organic matters, Sample L202-17; (F) Strongly connected organic matter pores, Sample L202-17; (G) Slightly aligned organic matter pores, Sample L204-3; (H) Organic matter pores within pyrite framboid, Sample N213-13; (I) Complex organic matter pores, Sample H201-12; (J) Pores in isolated organic matter, Sample L202-17; (K,L) Organic matter pores associated with clay minerals, Sample Y202-2.
Minerals 09 00543 g005
Figure 6. CO2 adsorption isotherms of Longmaxi shale samples.
Minerals 09 00543 g006
Figure 7. Quantitative analysis of pore structure of Longmaxi shales by high-pressure mercury intrusion porosimetry (HMIP), N2 and CO2 adsorption-desorption experiments.
Minerals 09 00543 g007
Figure 8. Pore size distribution curves from low-pressure CO2 adsorption experiment.
Minerals 09 00543 g008
Figure 9. The N2 adsorption and desorption isotherms of Longmaxi shales. (A) wide mouth hysteresis loops, 2.5% < TOC < 3.5%, (B) wide mouth hysteresis loops, 1% < TOC <3%, (C) wide mouth hysteresis loops, 2% < TOC < 4%, (D) flat hysteresis loop, 2% < TOC <2.5%.
Minerals 09 00543 g009
Figure 10. Pore size distribution curves from low-pressure N2 adsorption-desorption experiment.
Minerals 09 00543 g010
Figure 11. Pore size distribution curves from HMIP analysis.
Minerals 09 00543 g011
Figure 12. Combined pore size distributions (PSDs) curves of the pore volume (PV) with the date from HMIP, N2 and CO2 adsorption experiments. (A) sample W205-2; (B) sample L202-6; (C) sample L202-17; (D) sample W205-3; (E) sample H201-12; (F) sample Z201-5.
Minerals 09 00543 g012
Figure 13. Combined PSDs curves of the specific surface area (SSA) based on the data from HMIP, N2 and CO2 adsorption experiments. (A) sample W205-2; (B) sample L202-6; (C) sample L202-17; (D) sample W205-3; (E) sample H201-12; (F) sample Z201-5.
Minerals 09 00543 g013
Figure 14. The PV (A) and SSA (B) distribution of different pore size scales according to the data from HMIP, N2 and CO2 adsorption experiments.
Minerals 09 00543 g014
Figure 15. Fractal analyses of two representative shale samples W205-2 (A) and L204-3 (B) based on nitrogen gas desorption isotherms.
Minerals 09 00543 g015
Figure 16. The interrelationship between the pore structure parameters of multi-scales pores and TOC, clay mineral content, and brittle mineral content. (A) PV of different scales versus TOC content; (B) SSA of different scales versus TOC content; (C) PV of different scales versus clay mineral content; (D) SSA of different scales versus clay mineral content; (E) PV of different scales versus brittle mineral content; (F) SSA of different scales versus brittle mineral content.
Minerals 09 00543 g016
Figure 17. Relationships between fractal dimensions and PV (A,B), SSA (C,D), and average pore width (E,F).
Minerals 09 00543 g017
Figure 18. Relationships between fractal dimensions and TOC content (A,B), clay minerals (C,D), brittle minerals (E,F), and carbonate content (G,H).
Minerals 09 00543 g018
Table 1. Total organic carbon (TOC) content, thermal maturity and mineral composition of Longmaxi shale (Qtz.: Quartz; Kfs.: K-feldspar; Pl.: Plagioclase; Cal.: Calcite; Dol.: Dolomite; Sd.: Siderite; Py.: Pyrite; Gp.: Gypsum; I/S, illite/smectite mixed layer; Ill., Illite; Chl., Chlorite).
Sample IDDepth (m)TOC (wt %)Vitrinite ReflectanceMineral Composition (wt %)Clays Relative Content (wt %)
Rb (%)Ro (%)Qtz.Kfs.Pl.Cal.Dol.Sd.Py.Gp.ClaysI/SIll.Chl.
Z201-54355.43.382.452.5723.70.34.66.421.40.63.9 39.1374914
L202-174298.32.312.512.6326.20.45.59.816.10.76.30.734.3236116
N216-52312.82.762.522.6323.50.82.124.820.70.23.7 24.2 937
W205-23681.61.212.622.7329.80.34.41.81.20.81.7 60255124
L204-33795.02.372.712.8124.31.63.46.68.50.43 52.2335413
W205-33697.92.902.822.9226.50.331910.40.53.4 36.9404713
L202-64248.42.133.053.1423.20.74.416.318.50.32.1 34.5315514
N213-132567.53.563.153.2343.90.2211.215.30.22.8 24.4 928
H201-124113.83.243.253.3352.20.43.43.35.80.34 30.6364816
Y202-23484.82.183.623.6825.80.45.810.315.60.42.3 39.4246313
Table 2. Fractal dimensions calculated by the FHH model based on N2 desorption isotherms.
Sample IDP/P0: 0–0.5P/P0: 0.5–1.0
K1D1 = 3 + K1R2K2D2 = 3 + K2R2
Z201-5−0.28262.71740.9835−0.05612.94390.8881
L202-17−0.32482.67520.9739−0.09652.90350.9559
N216-5−0.30472.69530.9695−0.07472.92530.9290
W205-2−0.33822.66180.9855−0.07062.92940.9113
L204-3−0.35202.64800.9688−0.06932.93070.9310
W205-3−0.32232.67770.9791−0.06822.93180.9081
L202-6−0.32322.67680.9780−0.10762.89240.9920
N213-13−0.30692.69310.9699−0.07592.92410.8111
H201-12−0.32192.67810.9823−0.07642.92360.9329
Y202-2−0.26662.73340.9793−0.07552.92450.9742

