1. Introduction
Asbestos is a generic term encompassing a group of natural hydrated silicate minerals that grow in a fibrous form and that exhibit characteristics such as flexibility, high tensile strength, and resistance to heat and chemical degradation [
1]. The Italian normative standard declares that asbestos fibers should have a length of >5 μm, a width of <3 μm, and a length:diameter ratio of ≥3:1. The six minerals regarded as asbestos are chrysotile (serpentine asbestiform) and five varieties of asbestiform amphiboles: crocidolite (asbestiform riebeckite), amosite (asbestiform cummingtonite–grunerite), asbestiform anthophyllite, tremolite, and actinolite.
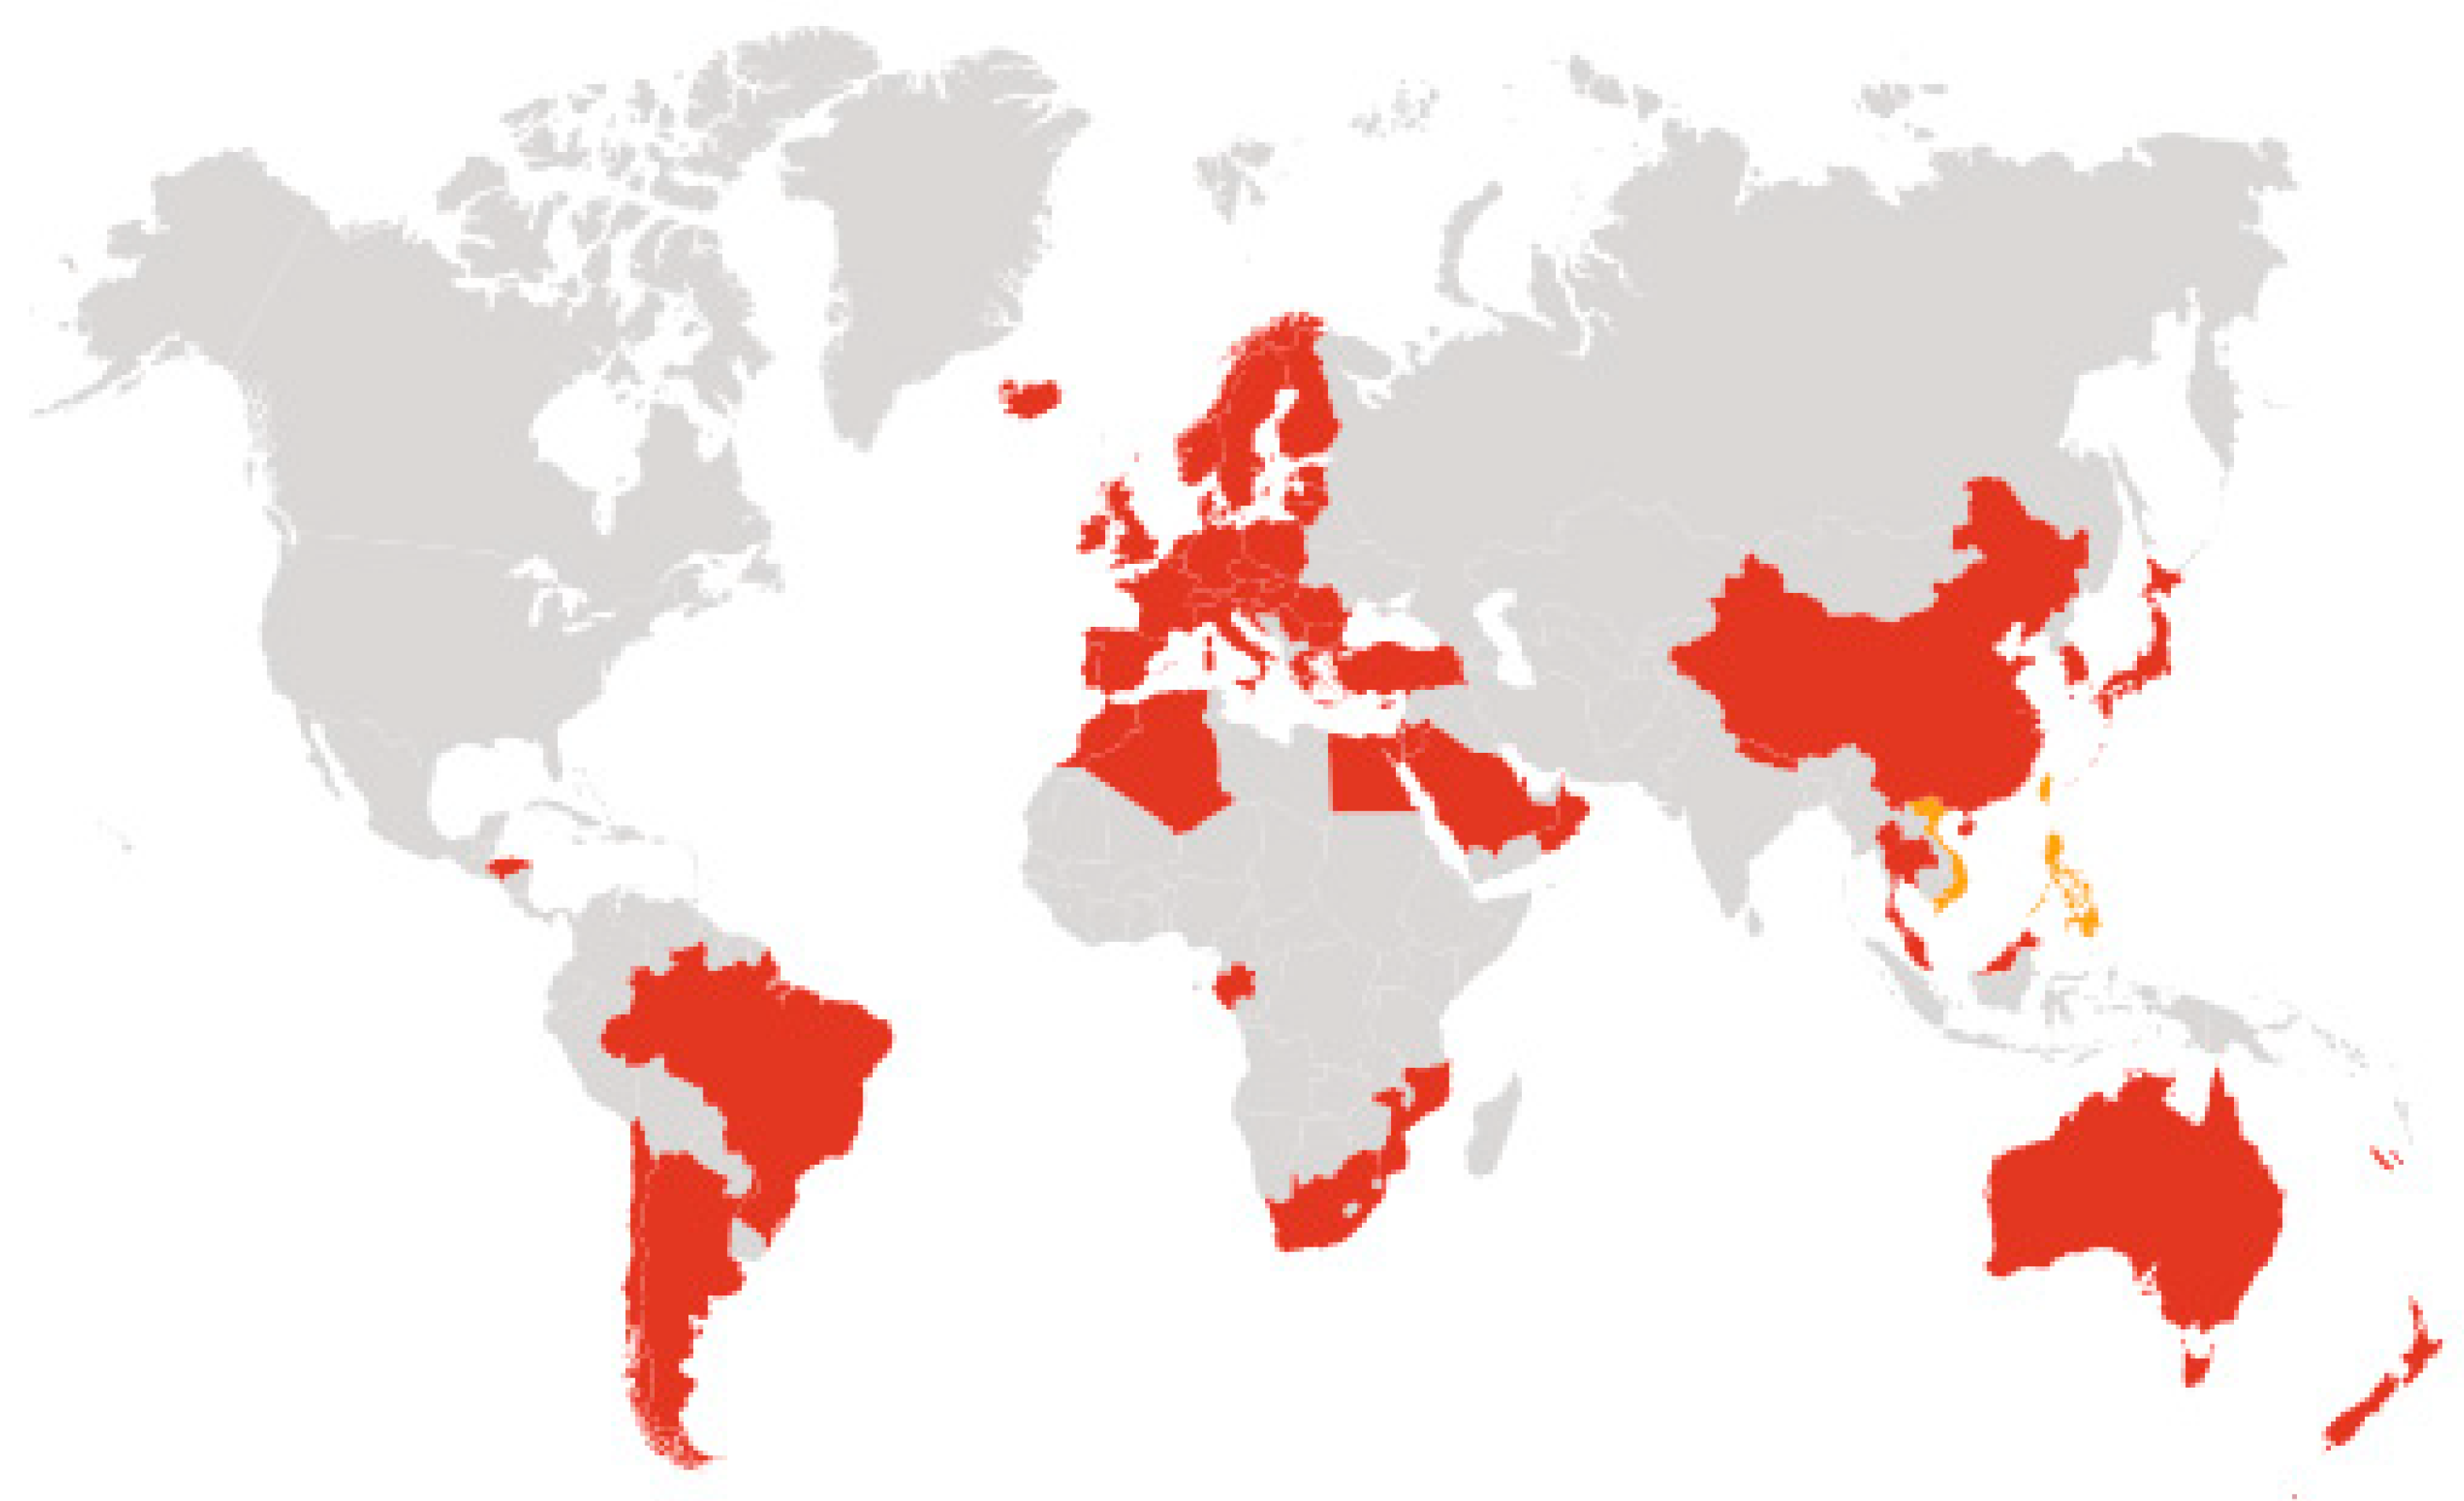
Asbestos has been declared harmful to health, and its use restricted or banned in more than 52 countries (
Figure 1) [
2,
3].
During the twentieth century, asbestos was widely used in buildings and industrial installations, but the evidence of the health risks that it can cause due to the inhalation of fibers has pushed health authorities to issue stringent norms to avoid industrial and domestic applications. However, important and big countries such as China, India, Russia, Kazakhstan, Brazil, but also Canada, Zimbabwe, and Colombia are still producers and consumers of asbestos. The mere presence of asbestos does not always represent a risk, but it can become dangerous if it disperses its fibers in the surrounding environment, for example due to mechanical or thermal stress.
Moreover, even now, anthropogenic and natural processes are contributing to the continuing presence of asbestos and elongate mineral particles (EMP) of non-asbestos amphibole and serpentine in the air and water of urban, rural, and remote environments [
4].
The approach to quantification and analysis of asbestos containing bulk materials is not univocal [
6,
7]. For instance, in the United States, two conceptually opposite approaches are applied in the qualitative and quantitative analysis of soils and rocks:
(i) The National Institute for Occupational Safety and Health (NIOSH) and the Environmental Protection Agency (EPA) of the USA propose a very cautious approach in favor of exposed workers, therefore the methods of quantification (Method 7400 ‘A’ and ‘B’) of asbestos are much more stringent and stricter [
8,
9].
(ii) The ASTM (American Society for Testing and Materials) restricts the counting field only to asbestos whose appearance meets characteristics such as curvature, flaking, presence of fibrils at the apex of the beam, a length >10μm, or width <1μm.
The most important tests are the following:
D7200-06: Standard Practice for Sampling and Counting Airborne Fibers, Including Asbestos Fibers, in Mines and Quarries, by Phase Contrast Microscopy and Transmission Electron Microscopy [
10].
D6281-15: Standard Test Method for Airborne Asbestos Concentration in Ambient and Indoor Atmospheres as Determined by Transmission Electron Microscopy Direct Transfer (TEM) [
11].
ASTM D7521-16 Standard Test Method for Determination of Asbestos in Soil [
12].
Additionally, the European normative standards are not straightforward about correct reading and counting of fibers in asbestos containing bulk materials.
Below are the most significant regulations:
Commission Directive 1999/77/EC adapting to technical progress for the sixth time Annex I to Council Directive 76/769/EEC on the approximation of the laws, regulations, and administrative provisions of the member states relating to restrictions on the marketing and use of certain dangerous substances and preparations (asbestos) [
13].
Directive 2003/18/EC of the European Parliament and of the Council of 27 March 2003 amending Council Directive 83/477/EEC on the protection of workers from the risks related to exposure to asbestos at work [
14].
World Health Organization. WHO air quality guidelines, second ed. Asbestos. Report on a work group meeting, Copenhagen, Denmark [
15].
Directive 2009/148/EC of the European Parliament and of the Council of 30 November 2009 on the protection of workers against the risks associated with exposure to asbestos [
16].
In Italy, the law no. 257 of 1992 [
17] started the disposal of asbestos use due to its dangerousness and its carcinogenic potential. Asbestos containing materials (ACM) are unfortunately still widespread and, where their presence is verified, it is necessary to carry out a control activity, obligatorily notifying their occurrence to the prevention departments of the local health units. The aim is to quantify the asbestos abundance in civil and working environments in order to proceed with a gradual but progressive disposal of this waste. Although the extraction and importation of ACM is forbidden, the use of asbestos and the materials and/or products that contain it if already in possession of the user at the time of the prohibition is allowed.
In the case of construction projects, which can involve the production and handling of excavated soils and rocks containing asbestos, difficulties regarding the analysis and interpretation of possible asbestos contamination can arise, owing to the lack of widely adopted standard protocols. Therefore, the assessment of requirements for environmental quality and appropriate destination for excavated soils and rocks impose proper characterization of asbestos concentration. In particular, the quantification of asbestos in bulk samples is a complex analytical problem that still lacks a satisfactory and unequivocal solution. Qualitative or quantitative estimates of asbestos content require the consideration of different variables depending on the material under examination, on the context from which the sample is issued, and a vision on the evaluation of the investigation objective [
7]. In addition, several sources of error can affect the calculation of asbestos concentration in a sample.
In Italy, problems in the interpretation, classification, and evaluation of asbestos content arose related to the production and processing of excavated soils and rocks [
2]. In particular, the normative on quantitative analysis of asbestos defines the assessment occurrence [
18,
19,
20]. However, the guidelines issued from the ministerial decrees do not guarantee the compatibility and reproducibility of results among different laboratories, as they lack a precise description for sample preparation and analysis, thereby generating the possibility of variability in the results and therefore in assessments. With respect to the problem of reproducibility, we carried out an investigation aimed at analyzing and quantifying the distribution of asbestos fibers across different grain size fractions (<0.106 mm, 0.106 to 2 mm, and 2 to 20 mm) for a series of rock and debris/soil samples. We used scanning electron microscopy (SEM) coupled with energy dispersive spectroscopy (EDS) as this is one of highly recommended analytical techniques in the decrees, being capable of detecting asbestos concentrations between 100 (0.01%) and 10,000 ppm (1%).
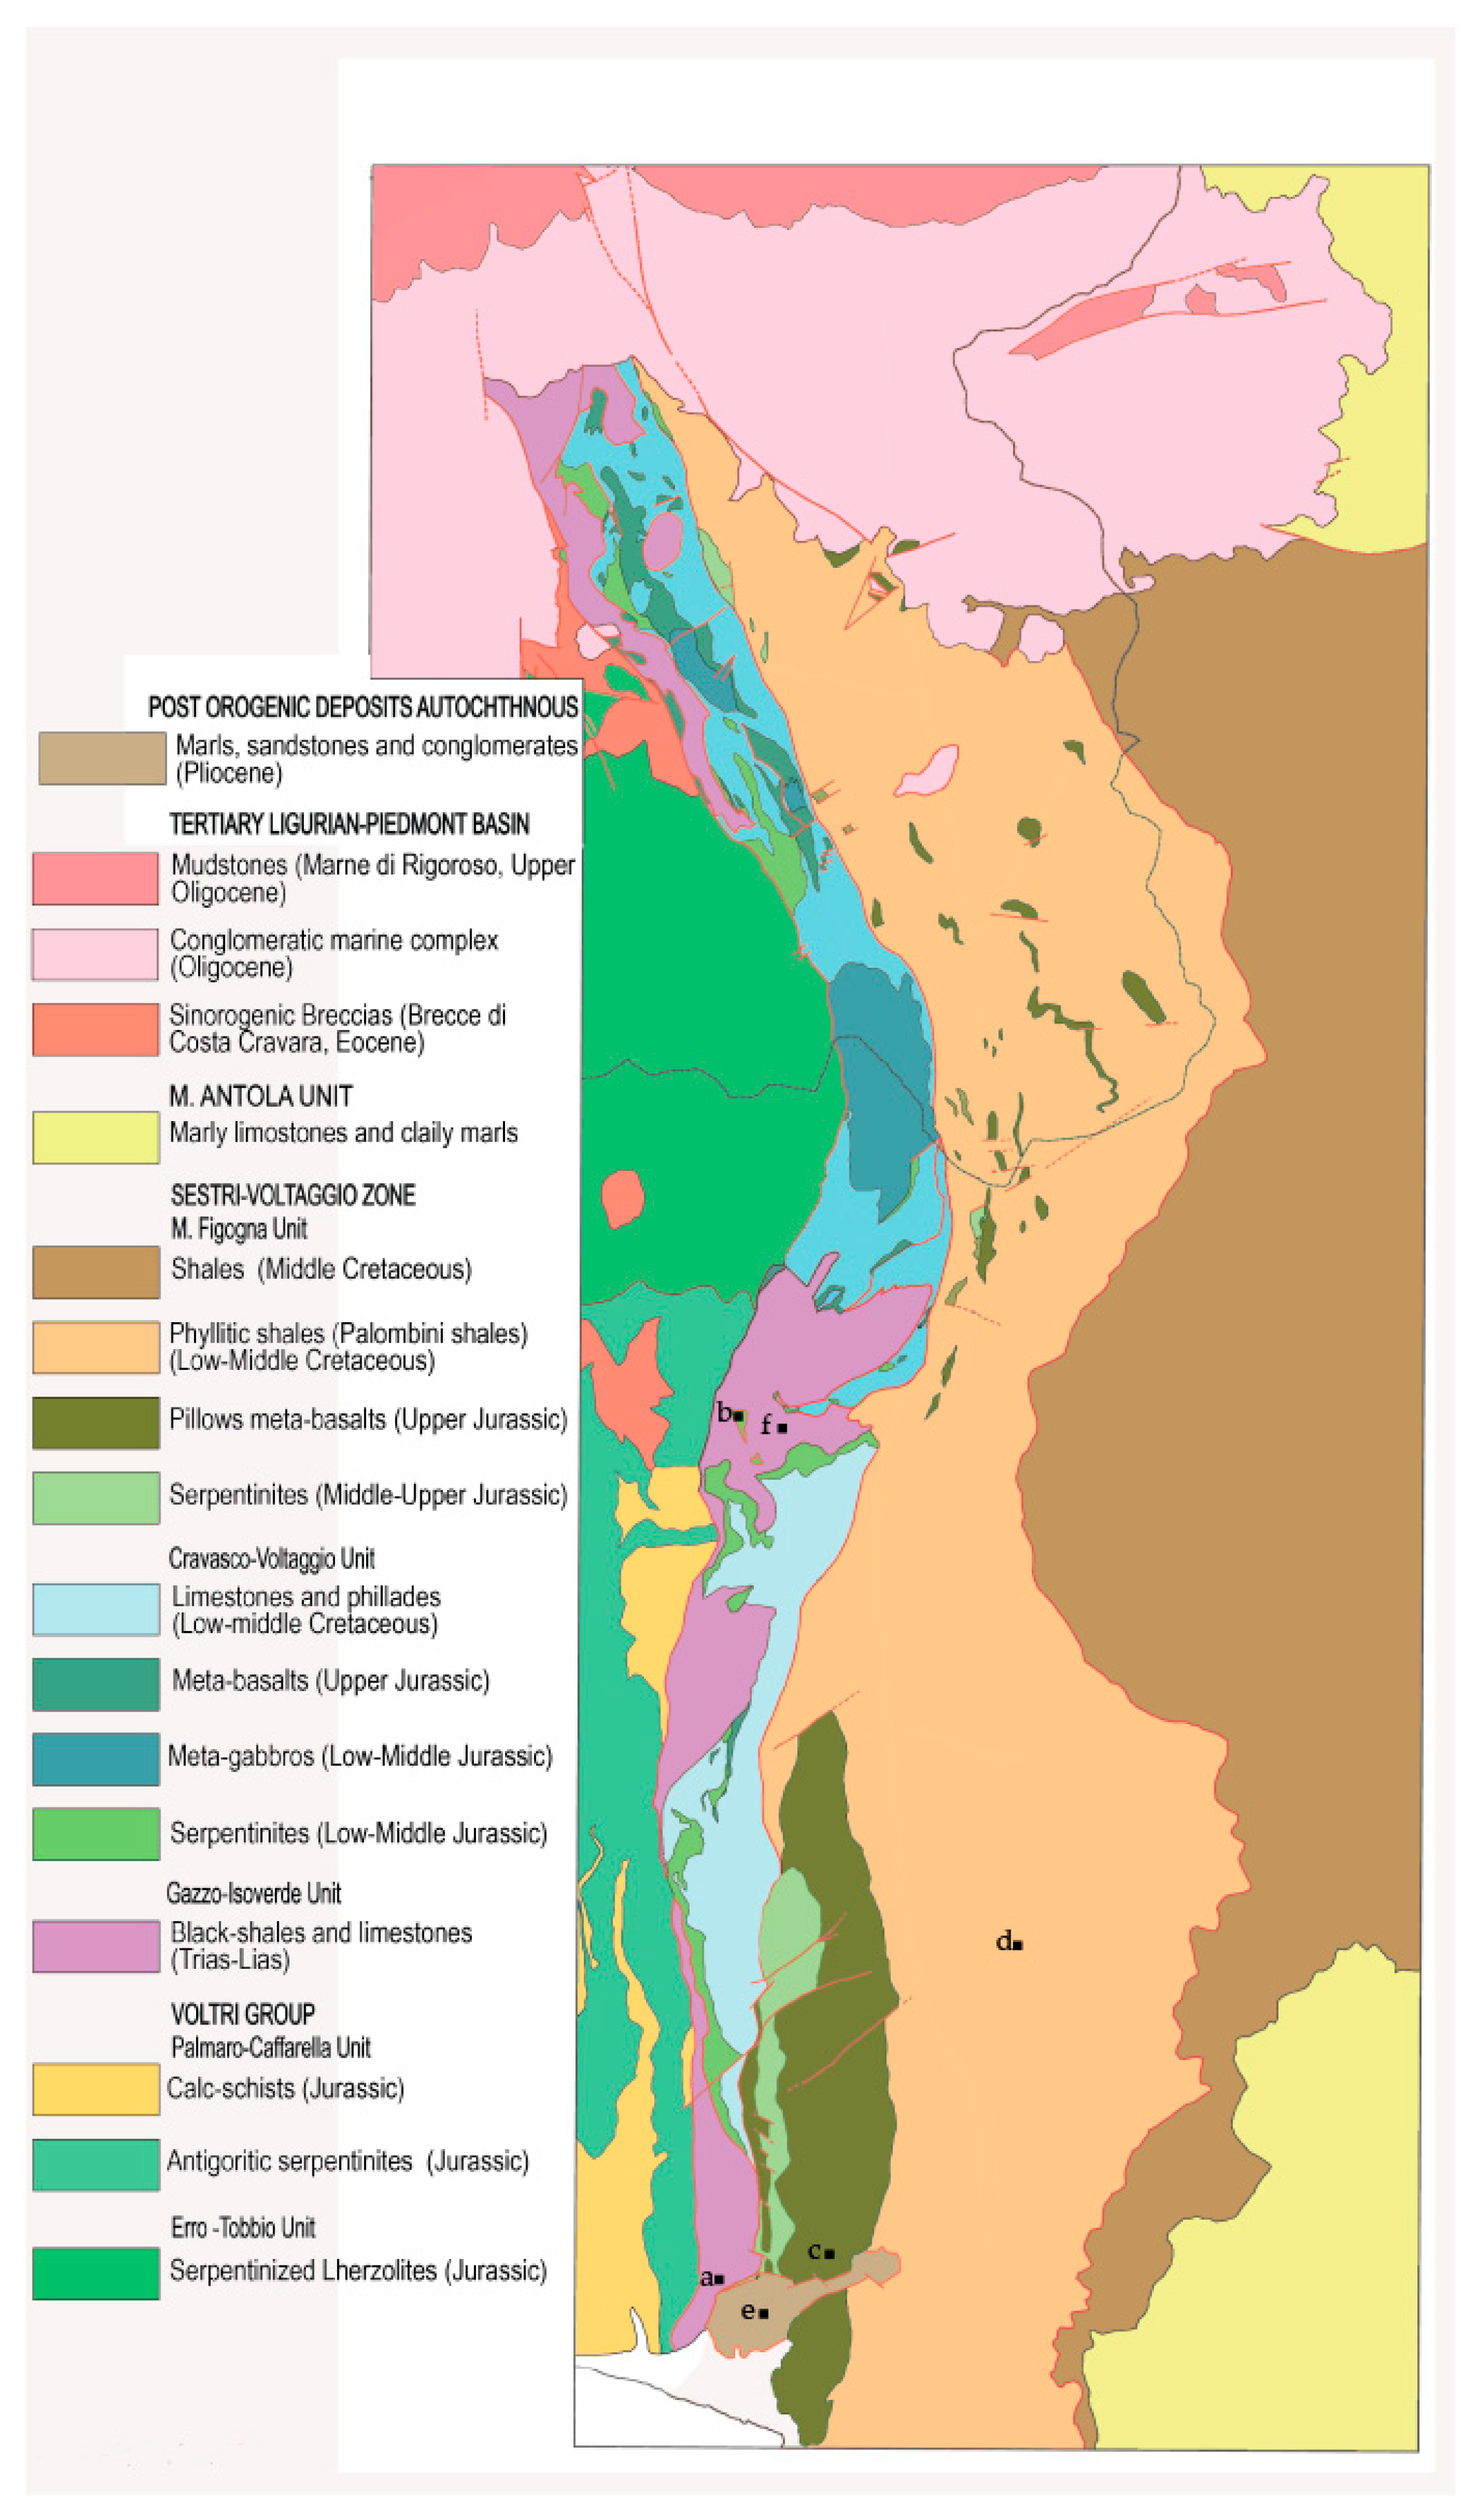
The working hypotheses to verify were: (i) at what extent fibers are originated by comminution during sample preparation, (ii) their preferential occurrence in selected grain size classes, (iii) the bearing of these fibers to the asbestos quantification; and iv) the significance of the fibers with outliers size compared with other fibers. We addressed for the investigation samples from metamorphic rocks (serpentinite, metabasalt, and calc-schist/metargillite) and sedimentary rocks/materials (argillite, debris material, and soil) representative of an ophiolite succession and its covers, outcropping in the Sestri–Voltaggio area (Central Liguria, Northern Italy) (
Figure 2) likely to contain asbestos. In particular, we investigated how the sample preparation, analysis, and calculation of asbestos concentration can influence the results obtained, pointing out critical aspects. The reliability and comparability of data are essential to avoid misunderstandings and to provide adequate and effective environmental control and prevention systems. Finally, the production of data that lead to social and environmental alerts about the disposal of excavated soils and rocks is of considerable importance, given the consequences that may arise.
2. Materials and Methods
2.1. Naturally Occurring Asbestos in Italy
The occurrence of asbestos minerals in nature is mainly related with ophiolites, which are slices of oceanic crust and of the underlying mantle (oceanic lithosphere) unroofed and exposed during orogenic events and subsequent erosion. Serpentine (formed during oceanic metamorphism) and amphibole (formed during low to medium grade orogenic metamorphism) asbestos are typical minerals of ultramafic and mafic rocks in ophiolitic complexes and occur mainly as vein-filling deposits along brittle–ductile structures, such as shear zones, fault planes, and fractures [
21]. Furthermore, high concentrations are found at the reaction zones between ultramafic and mafic rocks (actinolite–tremolite-rich schist). Therefore, several lithotypes can potentially contain asbestos, depending on metamorphic conditions and on the origin and structure of the host rock [
2,
22].
About 10% of the territory of Italy consists of meta-ophiolitic units (cropping out in Lombardy, Valle d’Aosta, Piedmont, Liguria, Calabria, and Basilicata) or flysch containing ophiolitic allochthons (Emilia Romagna and Tuscany). Additionally, an ophiolitic detrital component is found in sediments of the Piedmont Tertiary Basin. The ophiolite units in the Alps and the Apennines show a marked spatial heterogeneity, with the structural setting being characterized by the juxtaposition of nappes generated during polyphase tectonic events [
23,
24].
The Alpine ophiolites outcrop in central-western Liguria and belong to the Voltri Group and the Sestri–Voltaggio Zone (
Figure 2). In western Liguria, Palaeozoic amphibolites are regarded as rocks with low asbestos content. The Apennine ophiolites outcrop in eastern Liguria in the Bracco–Graveglia Unit (Internal Liguride units) and within a sedimentary unit. The units belonging to the External Ligurides also crop out in Emilia and Tuscany and are commonly included in marls and sandstones. Asbestos minerals are also found in the southern segment of the Apennines in the ophiolitic sequence along the Calabrian–Lucania border and in northern Calabria, in the Sila Piccola area [
25,
26]. Asbestiform amphiboles occur in the benmoreitic lavas of Monte Calvario and belong to the Etna volcanic complex [
27].
The samples selected for the present study crop out along the Sestri–Voltaggio Zone (central Liguria, northern Italy) and have been affected by various geological processes from the Jurassic to the Quaternary. The samples include rocks potentially containing asbestos, asbestos-bearing rocks of different metamorphic grades, and sediments and soil that include asbestos of detrital origin. Samples were taken from the following units (from oldest to youngest): (1) meta-argillites (Late Triassic–Early Jurassic) belonging to the Monte Gazzo–Isoverde tectono–metamorphic unit, including carbonatic lithotypes (dolomites and recrystallized dolomitic limestones) intercalated with metapelites and marly limestones; (2) serpentinite and serpentine schist (Middle Jurassic) of the Cravasco–Voltaggio Unit, comprising variably metamorphosed, cataclastic chrysotile- and antigorite-bearing serpentinite; (3) metabasalts (Late Jurassic) of the Monte Figogna Unit, consisting of massive or more commonly brecciated pillow lavas that were subsequently recrystallized under pumpellyite–actinolite facies conditions during the Alpine event; (4) calc-schists (Cretaceous) of the Busalla Flysch Unit, consisting of gray/black shales with alternating crystalline limestone and/or schistose metapelites affected by low-grade metamorphism; (5) debris covers, Pliocene breccia, and conglomerates associated with marly clays, marls, siltstones, and fine sandstones; and (6) Quaternary soil-detritus composed of sand–silt matrix, clasts, and breccias with ophiolitic elements.
2.2. Analytical Methods
Among the risk assessment protocols specified by regulations governing a reclamation work in Italy, the step of verifying the presence and content of asbestos in bulk materials is a mandatory action that affects the subsequent choice of the type of intervention [
28]. The analysis of asbestos content is required as a basis for classifying geomaterials and for providing information regarding their disposal. To evaluate the qualitative (presence/absence of asbestos) and quantitative (the concentration of asbestos by weight) aspects of asbestos content, the International Organization for Standardization (ISO 22262-2:2014 (En)) [
29] has prescribed the use of several techniques (optical and electron microscopy and gravimetry) either singly or in combination. In contrast, optical microscopy (OM) has been recommended as the primary technique for identification in the regulations of several countries [
30]. Several analytical techniques within OM have traditionally been used by the technical–scientific community and include visual evaluation, stereomicroscopy (STM), phase-contrast OM (PCOM) with the use of polarized light (Pol), chromatic dispersion, and point counting [
7].
The Italian Ministerial Decree M.D. 06/09/1994 [
18] proposes the use of the following techniques for the determination of asbestos in bulk samples: (1) PCOM, X-ray diffractometry (XRD) and Fourier Transform infrared spectroscopy (FTIR) techniques for the quantitative determination of asbestos when the content exceeds 1% by weight; and (2) electron microscopy techniques, such as SEM coupled with EDS and transmission electron microscopy (TEM), for quantitative information on asbestos when the content lies between 0.01% and 1% by weight. In particular, the SEM–EDS technique is able to detect asbestos concentrations between 100 ppm (0.01%) and 10,000 ppm (1%) or higher, providing quantitative results for asbestos contents between 1000 and 10,000 ppm and semi-quantitative results for contents of <1000 ppm (0.1%) and >10,000 ppm.
Therefore, we used SEM–EDS considering its better resolution and ability to detect asbestos fibers even in low concentration ranges.
2.3. Constraints and Limitations on Sample Preparation
If the procedures for the detection and quantification of asbestos fibers are replicable, however, precise specifications regarding sample preparation are lacking. These regulations disregard the heterogeneity of rocks/deposits, do not consider the sampling method, the mode and duration of comminution of sample preparation, and the possible formation of new fibers by comminution.
Once the representative sample is obtained from the rock or deposit in the field, the analysis is carried out on a small subsample, which must be representative of the material of the sample (i.e., ensuring that the subsample reflects all grain size classes and fabric types of the macroscopic sample). The type and duration of milling depend on the hardness of the material. Milling can transform the material [
31,
32] by modifying the size and therefore the number of asbestos fibers that are subsequently counted using microscopy techniques, or by altering the integrity of the crystalline structure that is detected using XRD [
4,
29]. Such constraints involve close attention during the milling phase regarding to its duration and the properties of the milled material.
A further limitation is that the analysis is performed on a limited portion of the subsample in which dimensions, grain size distribution, number, and types (e.g., bundles, clusters, and fibrils) of asbestos fibers are observed [
7]. This requires that the analyzed parts of the subsample are representative of the subsample itself.
2.4. Sample Preparation
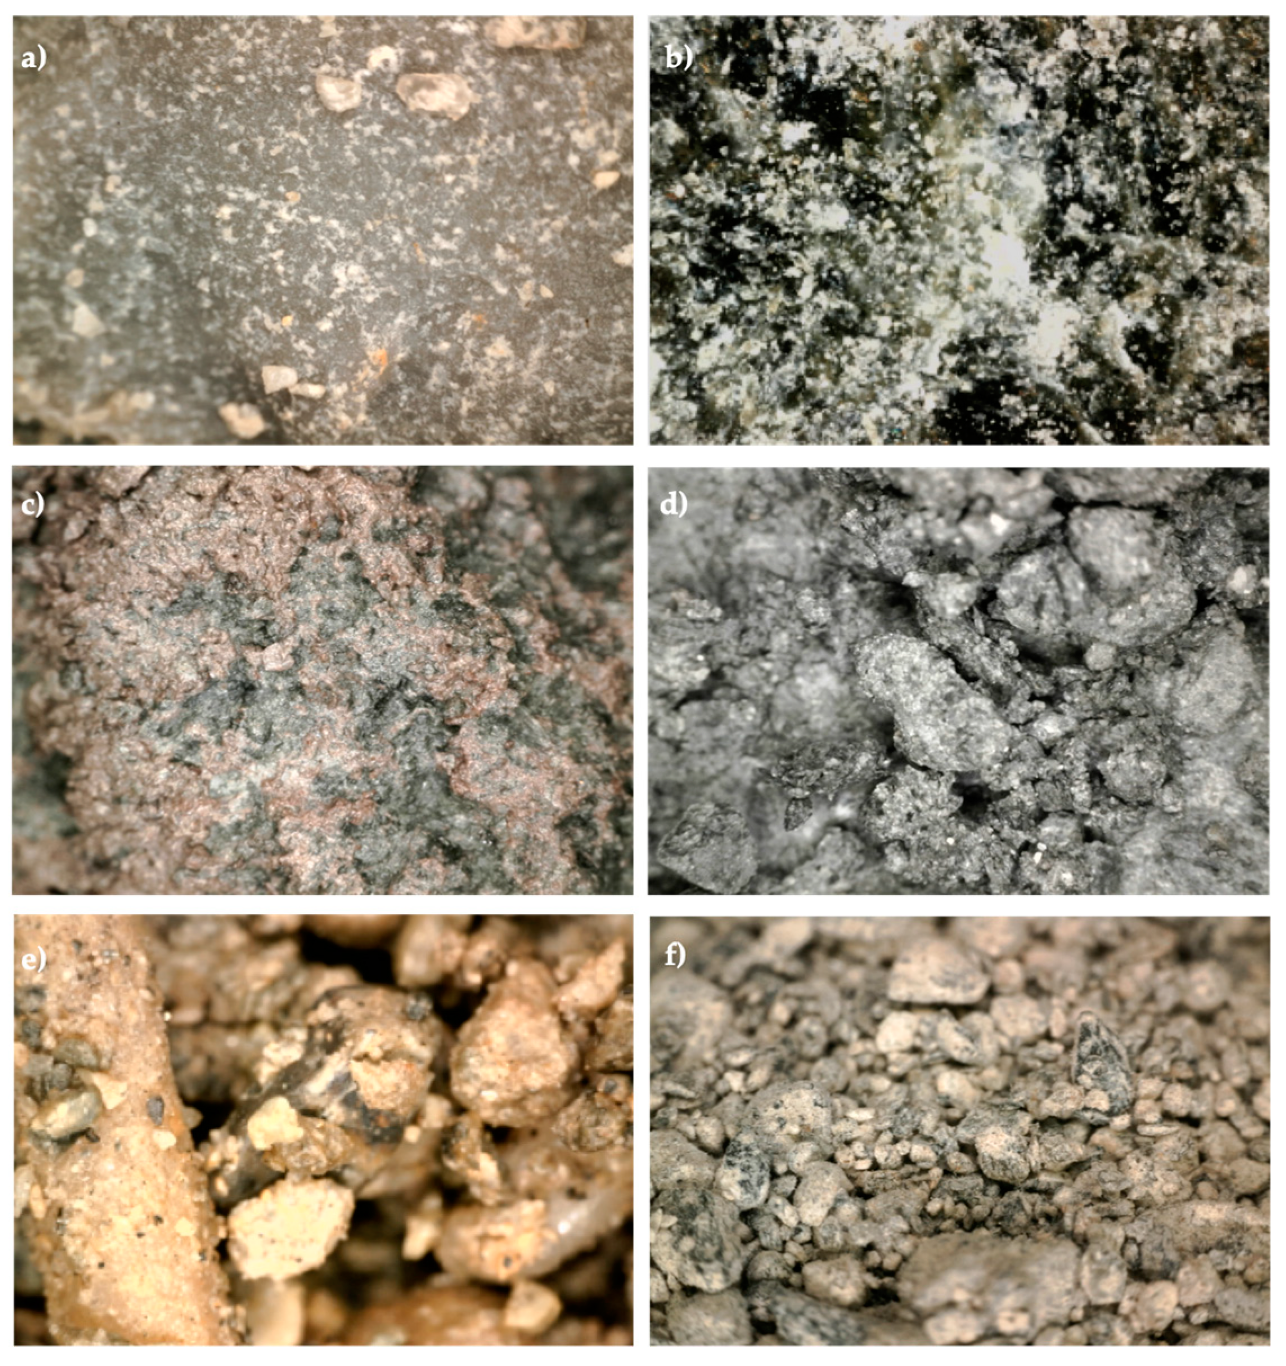
The six analyzed materials were sampled in different areas along the Sestri–Voltaggio Zone, as illustrated in
Figure 2. In particular, as already reported in
Section 2.1, the following lithotypes were considered: meta–argillites, serpentinite, metabasalts, calc-schists, debris, and soil (
Figure 3).
Each sample was prepared as described below.
First, the sample was observed at the stereoscope for a preliminary petrographic and mineralogic characterization on a macroscopic scale, then each 500 g bulk sample was divided into four subsamples each weighing 125 g still representative of the bulk sample, (i.e., more heterogeneous and including all the components). The subsamples were sieved (with square mesh steel sieve) at 20 mm, 2 mm, and 0.106 mm. The grain sizes from 2 to 20 mm and 0.106 to 2 mm were mechanically milled to obtain powders with a grain size of <0.106 mm. Milling was carried out by a Retsch BB50 jaw crusher, installed at the FIBERS Clean Laboratory of the University of Genoa. This is a room working under depression and equipped with 4 levels of safety devices for the operator. Accurate cleaning of the jaw crusher by compressed air and milling of a neutral sample (quartz sand) between samples was carried out to avoid contamination. In order to standardize the preparation method, as much as possible, the six samples, despite having different geo-mechanical characteristics, were ground to an equal speed of 750 rpm and a spacing between the jaws of 0.2 mm (±0.1). The time intervals used to reach the powder were different in relation to the hardness of the lithotype.
The third fraction of <0.106 mm was not milled. After milling, all grain size classes were weighed.
For each sample, 10 mg of powder were sampled, weighed by analytical balance (RadwagAs 220.R2), and suspended in 100 mL of deionized water. To improve the dispersion of the solution, the sample was left in an ultrasonic bath for 10 min. Using a vacuum filtration system, a known aliquot of the prepared dispersion containing ~1 mg of powder was deposited on a 47-mm-diameter polycarbonate membrane filter with a porosity of 0.8 μm. Subsequently, a quarter of the filter was cut out and fixed on an aluminum stub using a conductive glue (carbon tape). The filter was metalized with a 25–50 nm layer of Au by cathodic sputtering (Quorum Q150T ES).
3. Data Analysis
3.1. Quantitative Analysis by Scanning Electron Microscopy
Sample preparation and SEM analyses were carried out at the Department of Earth, Environment, and Life Sciences (DISTAV), University of Genoa, Italy. The three powder fractions were prepared according to the protocols prescribed in M.D. 06/09/1994 and analyzed using SEM (TESCAN Vega3 XML, Brno, Czech Republic) coupled with EDS (Oxford Instruments, AZtec 2.4, Brno, Czech Republic) at 2000× magnification and 20 kV acceleration voltage.
An area of 2 mm
2 in each subsample was measured, avoiding the overlap of read-fields. Only particles belonging to asbestos by composition and a length of >8 μm and a length:diameter ratio of ≥3:1 [
33] were counted. We considered fibers with these dimensions due to the presence of a very high number of short fibers in the background of some filters, which, if counted, would have been time-consuming without providing useful information in terms of assessing asbestos abundance and therefore asbestos concentration. Furthermore, for fibers that did not lie completely in the read-fields, only those parts included within the fields were measured.
Several studies have confirmed that asbestiform morphology plays a fundamental role in inducing deleterious biological effects [
34,
35,
36]. However, morphology is often liable to be interpreted subjectively, and therefore we did not attempt to measure morphological variation in this study to avoid generating a further source of error in fiber counts.
The calculation of the volume of each fiber or bundle of fibers was based on approximating the morphology of the fibers to cylinders with measured length and diameter and using the standard formula for cylinder volume. Although some fibers had an aspect ratio (length:width) that would make them countable, those with excessively large diameters unduly influence the measured asbestos volume and hence the final concentration. To understand how the presence and proportion of large fibers affect the concentration and to ensure that a representative population of asbestos fibers was captured, fibers presenting high individual volumes (in particular, those with large diameters) were defined as outliers. In the context of fiber counting, samples were also observed at lower magnification (500–1000 ×) modes in order to verify whether fibers identified as outliers were single or representative cases. Therefore, we considered outliers those fibers whose number was around 6% on average of total counted fibers. Furthermore, such fibers were considered outliers because their individual volumes deviated excessively from the average volume of the fibers found in a given particle size fraction (
Figure 4).
Specifically, a fiber was considered to be an outlier if it had a volume
V as follows:
where
V is the volume of an individual fiber,
Q3 is the 3rd quartile, and
IQR is the interquartile range (from 1st to 3rd quartile) in the distribution of individual fibers volumes.
According to M.D. 06/09/1994, the calculation of fiber weight was performed using densities of 2.6 g/cm
3 for chrysotile and 3.0 g/cm
3 for amphibole. Asbestos concentration C (mg/kg) in the sample was calculated as follows:
where
A is the effective filter area (mm
2),
a is the field area (mm
2),
n is the number of fields examined,
P is the total sample weight deposited on the filter (mg),
pc is the total weight of chrysotile fibers (mg), and
pa is the total weight of amphibole fibers (mg).
For each asbestos concentration value, there is an analytical error associated with the method that depends on the number and size of counted fibers. The error on the concentration was estimated as follows:
where
C is the concentration of asbestos in the sample,
N is the number of fibers identified (the equation is significant only if
N is sufficient to be within the limit of large numbers (≥30)),
f is the mean weight of asbestos fibers identified (mg), and
fi is the weight of each single fiber of asbestos.
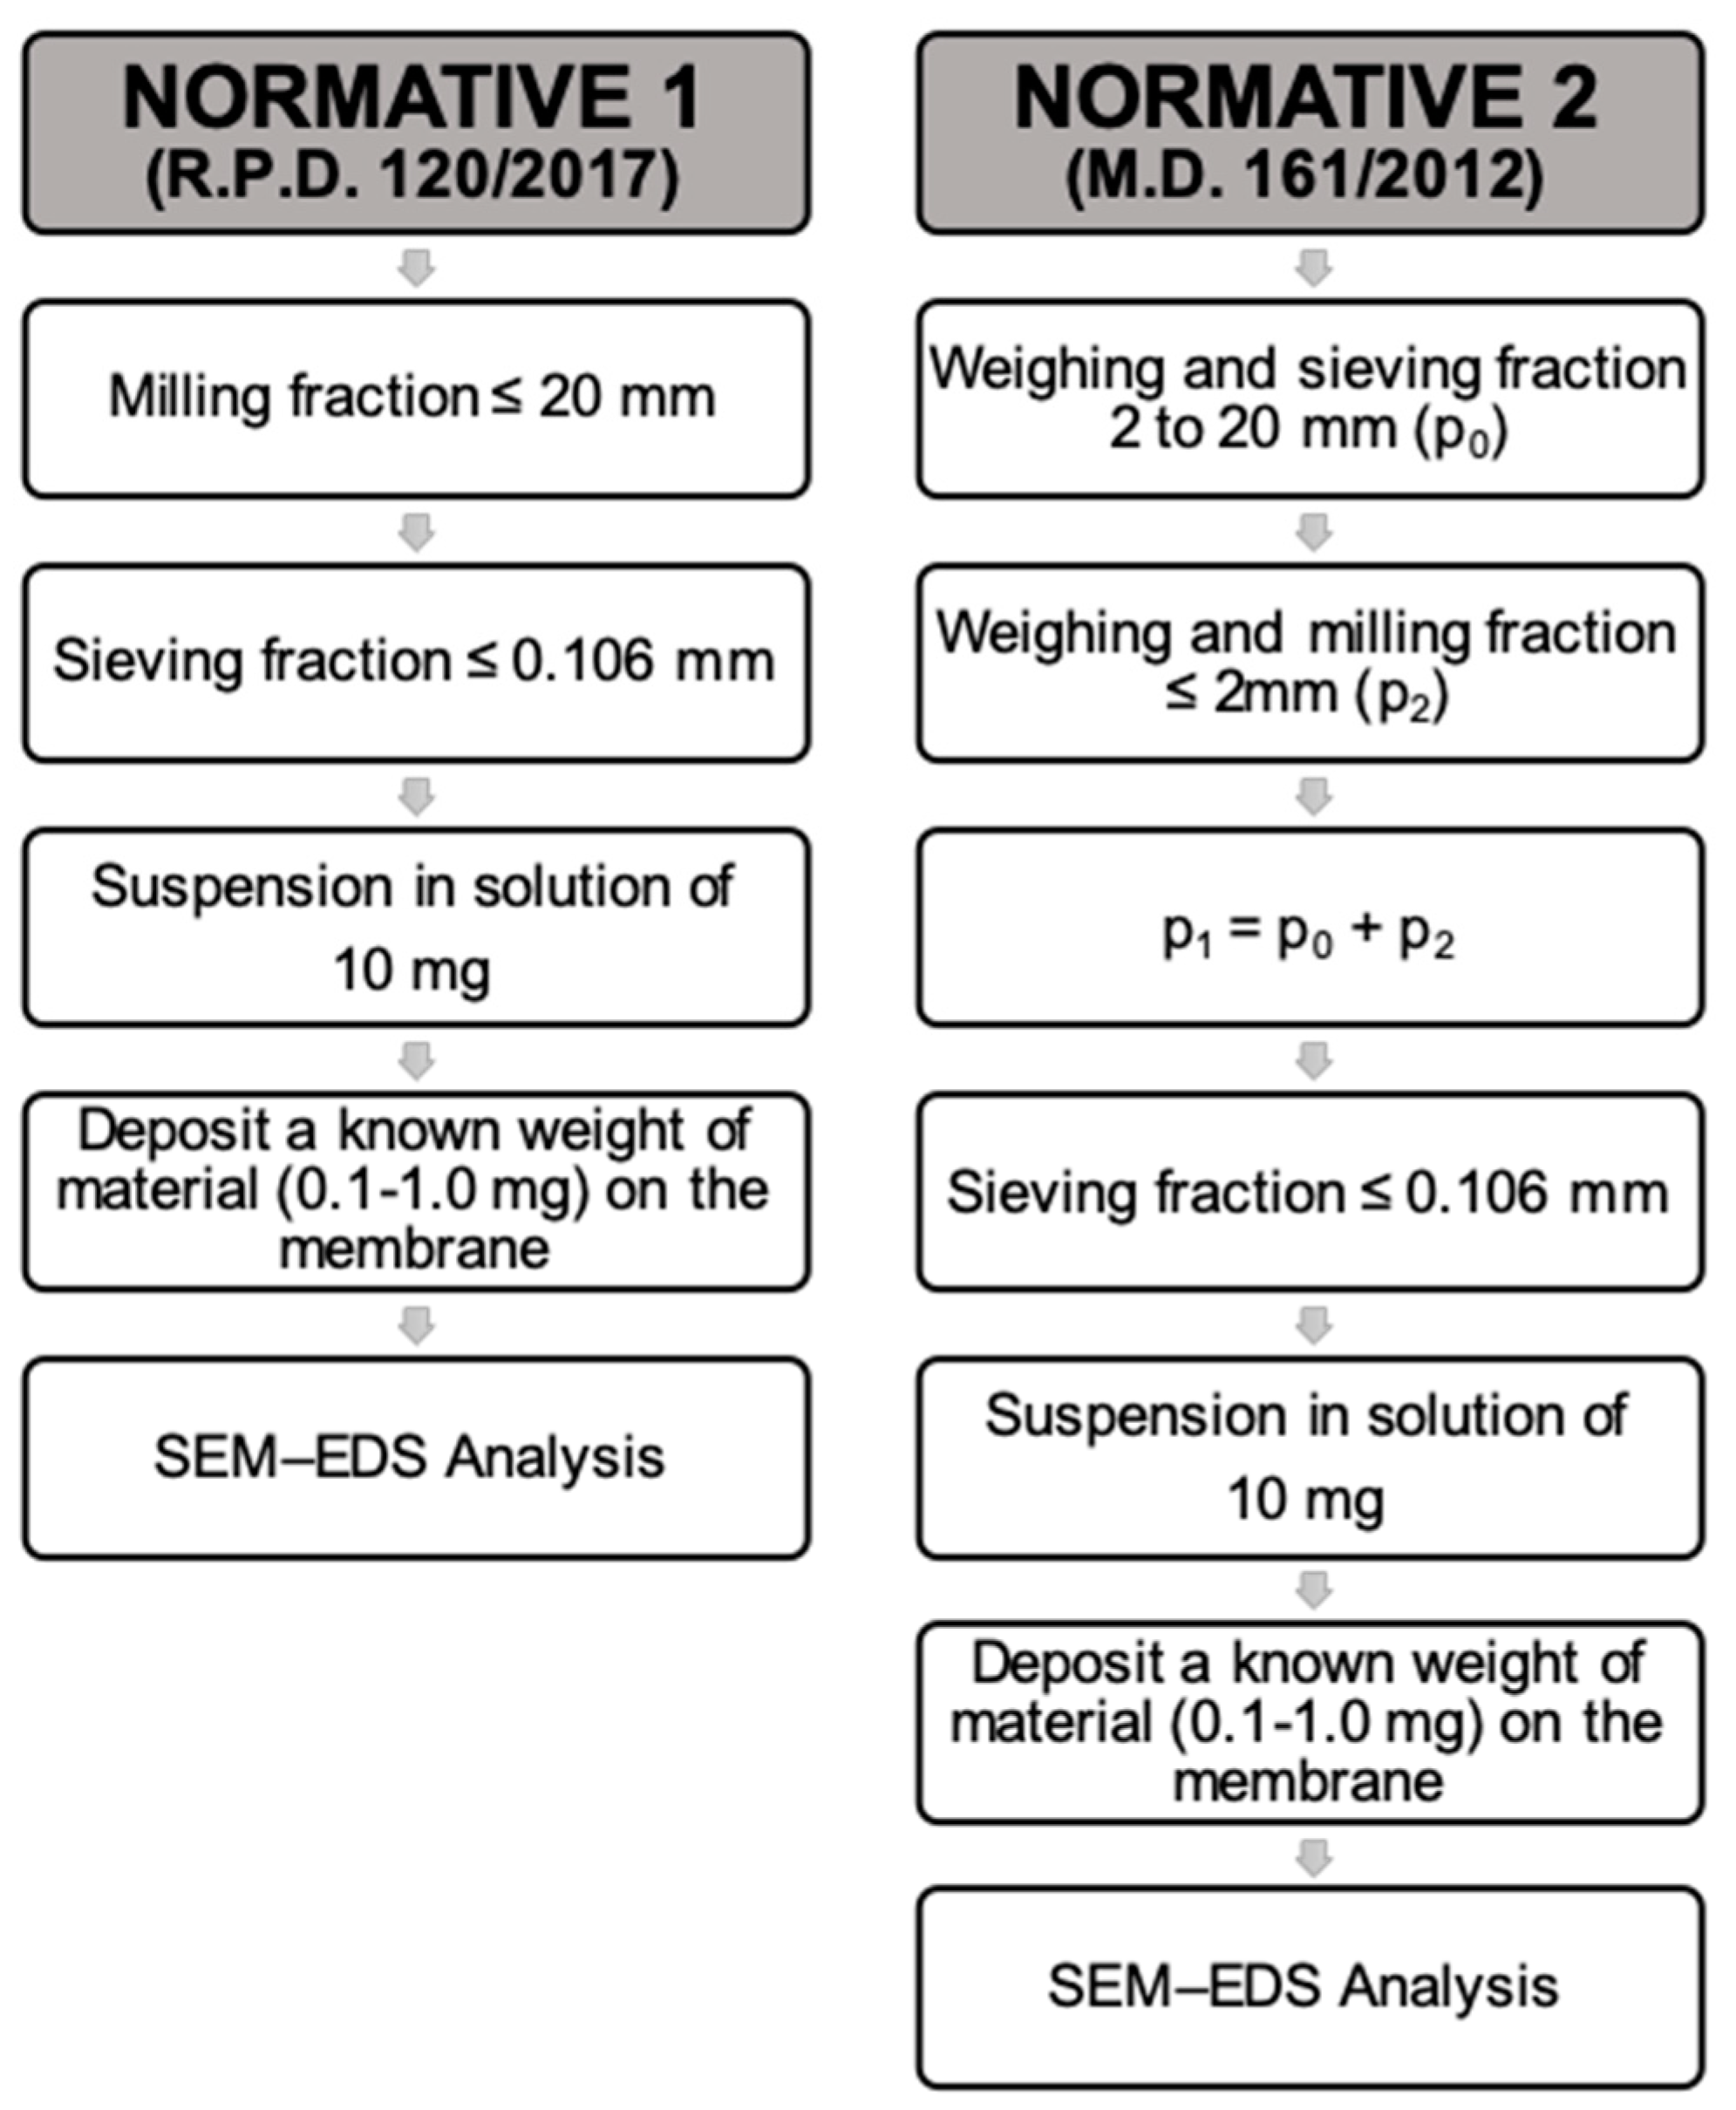
3.2. Determining Concentration According to Normative 1 (R.P.D. 120/2017) [20] and Normative 2 (M.D. 161/2012) [18]
R.P.D. 120/2017 and M.D. 161/2012 are the Italian legislation currently in force regarding asbestos concentration in inconsistent materials in order to verify their classification as waste or their possible reuse. The latter decree is used only for projects approved before the new law. According to the Normative 1 procedure, analytical determinations are carried out on the powder with a grain size spectrum of <0.100 mm obtained by milling of a representative subsample with a grain size of ≤20 mm. Instead, Normative 2 requires performing the analytical determinations on the 0.106–2 mm grain size fraction. However, the asbestos concentration must be determined with reference to the weight of whole dry sample with a grain size of ≤20 mm, including the so-called skeleton material (the lithic fraction between 2 and 20 mm).
As in Normative 1, the subsample under Normative 2 is obtained by milling to obtain a powder with a grain size spectrum of <0.100 mm. The concentration of asbestos (
C) is then determined by dividing the fraction of asbestos in the 0.106–2 mm fraction (
p2) from the mass of the sample ≤20 mm (
p1), that is, the lithic skeleton material.
A flow diagram showing the main steps of the two decrees and the differences between them is presented in
Figure 5.
3.3. Statistical Analysis
Investigation of descriptive statistics, such as frequency distribution (arithmetic mean) and an estimation of the population variability (standard deviation) of data, were calculated for asbestos concentration of each replica (R1, R2, and R3) for all of the samples (serpentinites, debris materials, and soils).
To evaluate the statistical reliability of the data, one-way analysis of variance (ANOVA) was performed. This permitted us to compare the internal variability in each group with the variability between the groups. Statistical significance was determined by a P value <0.05. Where necessary, for the variation of significant differences Tukey’s post-hoc test was done.
4. Results and Discussion
4.1. Dataset
Six lithotypes were analyzed for asbestos fiber size distribution and content across the grain size fractions of interest. The analysis of calc-schist showed no asbestos fibers in any of the three grain size fractions, as expected from petrographic and chemical data. In the metabasalt, some actinolite–tremolite fibers were found in the three grain size fractions, especially in the non-milled fraction <0.106 mm. However, the concentration in all fractions was much lower than 100 mg/kg. The meta-argillite, characterized by the occurrence of amphiboles of the actinolite–tremolite series, yielded values exceeding 100 mg/kg. However, as this sample presented only the <0.106 mm particle size fraction, it was not considered for further investigation because of the lack of comparative data with the other two size fractions.
Therefore, 13 samples obtained from preparation of the six sampled rocks and meta-sediments were analyzed by SEM–EDS. Only serpentinite, debris, and soil provided data for the distribution of asbestos fibers and content across the different grain size classes.
To ensure statistical significance of results, three replications were carried out for the three grain size fractions (<0.106 mm, 0.106 to 2 mm, and 2 to 20 mm) of serpentinite, debris, and soil, yielding a dataset of 27 samples.
In order to evaluate how different sampling preparation and calculation procedures can affect the asbestos concentration value, differences in number, size of fibers and following asbestos concentration were analyzed in the 2 to 20 mm and 0.106 to 2 mm grain size fractions after milling. Furthermore, differences were examined between the prepared (milled) sample <0.106 mm and the natural (non-milled) powder <0.106 mm derived from the sample.
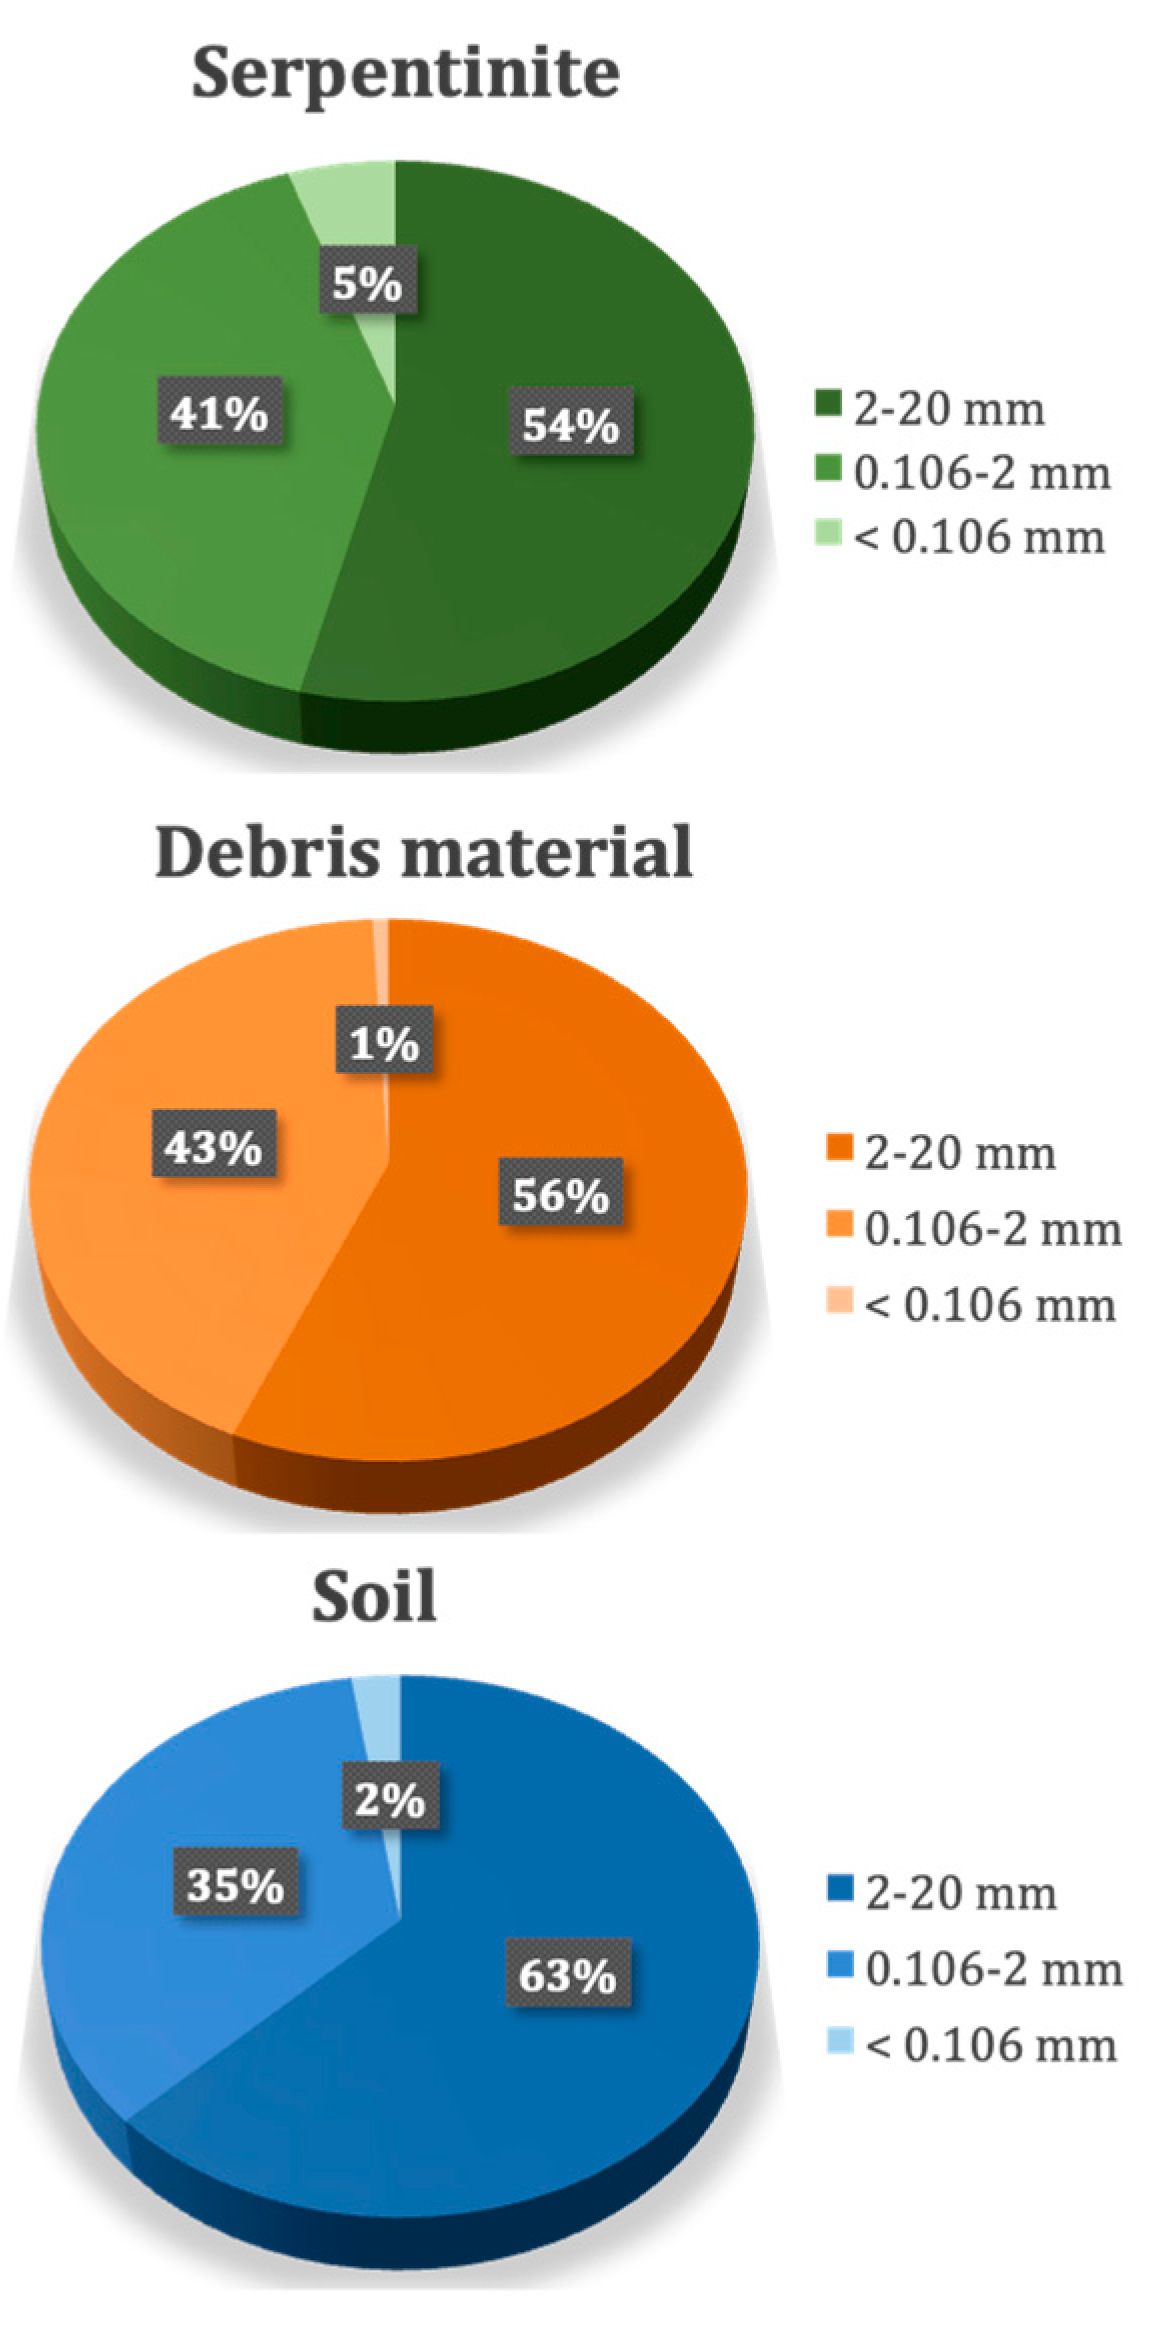
The pie charts in
Figure 6 show the size fraction data for the sieved (but not yet milled) grain size fractions and therefore the sorting of the original sample.
There were no substantial variations in the distribution of grain sizes across the granulometric fractions between the different samples, despite the three types of material being genetically very different from each other. Fraction 2 to 20 mm exceeded half of the material in all three samples (63% of the soil, 56% of the debris material, and 54% of the serpentinite). Fraction 0.106 mm to 2 mm constituted 35% of the soil, 43% of the debris material, and 41% of the serpentinite. The non-milled <0.106 mm fraction made up <5% of all materials.
4.2. Serpentinite
In the serpentinite, only chrysotile was found in all three grain size fractions (
Table 1).
The highest number of fibers (206) was detected in the 2 to 20 mm size fraction, 161 fibers in the 0.106 to 2 mm fraction, and 84 fibers in the non-milled fraction. The corresponding average volume of asbestos fibers in each grain size fraction was lowest in the 2 to 20 mm size fraction and highest in the <0.106 mm fraction (
Table 2). This is consistent with the fact that the <0.106 mm fraction was not milled, meaning that a large amount of fibers was naturally produced by handling the sample. Excluding the outlier fibers from the average volume calculations from the three lithotypes, the values tended to be homogenized in the three granulometric fractions (
Table 2).
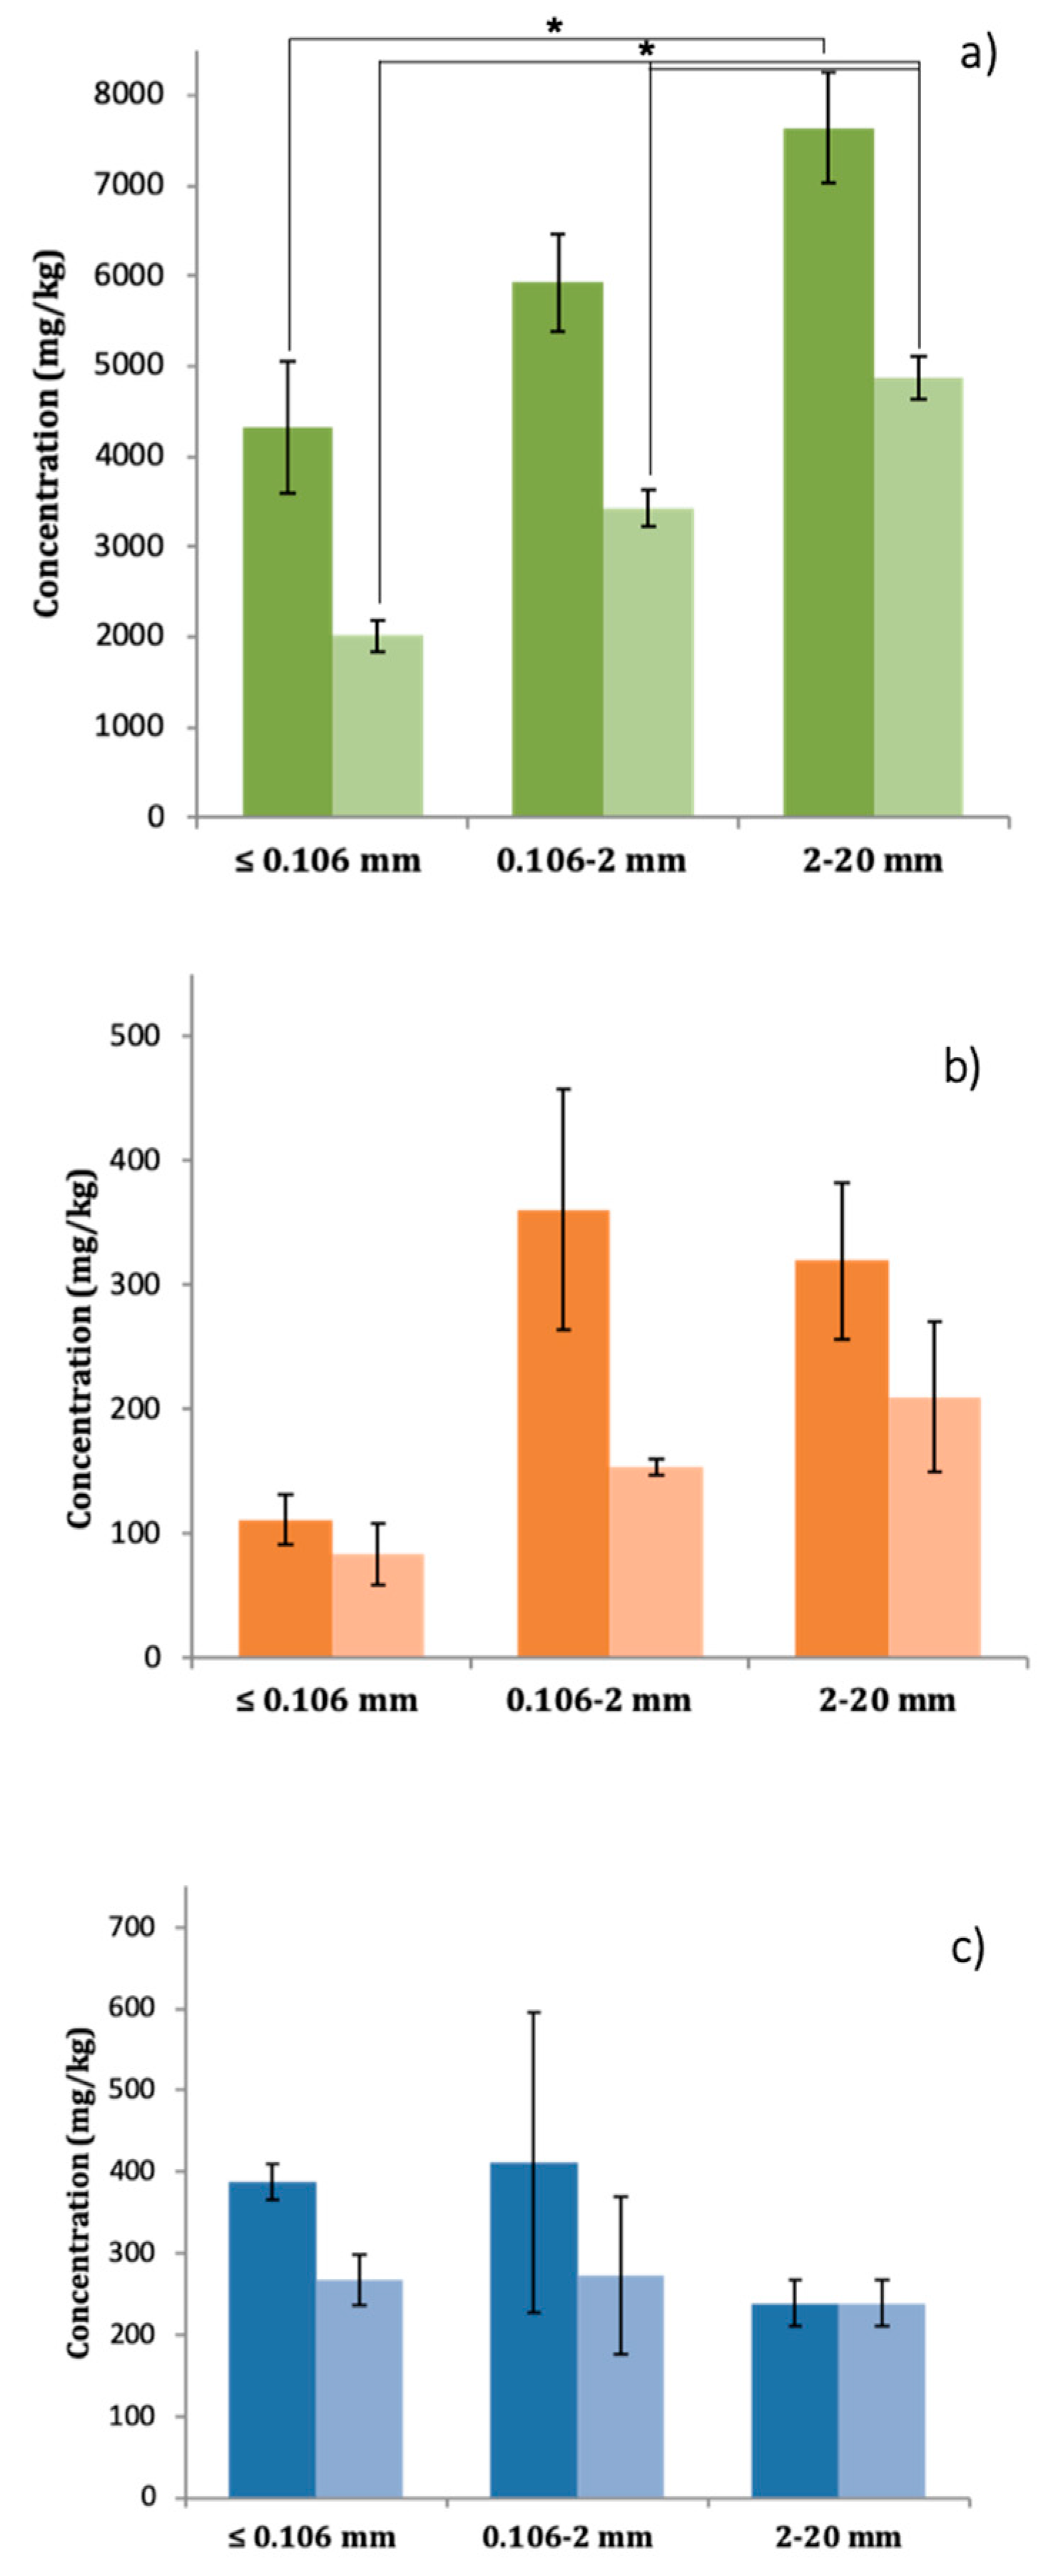
The asbestos concentration decreased monotonically with decreasing grain size class, both when outlier fibers were counted and when they are not counted (
Figure 7a). Asterisks shown in figures indicate significant differences between groups (* = p < 0.05).
In the 2 to 20 mm fraction, the mean concentration of the three replications (R1, R2, and R3;
Table 3) was 7640 mg/kg and was 4875 mg/kg excluding outliers from the calculation (R1, R2, and R3 without outliers;
Table 3), representing a reduction of 36%. In the 0.106 to 2 mm fraction, the mean concentration of the replications was 5924 mg/kg and was 3428 mg/kg excluding the outlier fibers, a reduction of 42%. In the <0.106 mm fraction, the mean concentration of the replications was 4319 mg/kg and was 2013 mg/kg excluding the outlier fibers, a reduction of 53%.
The p-value corresponding to the F-statistic of one-way ANOVA was higher than 0.05 for soil and debris material, considering both the concentration values with and without outliers (
Figure 7b,c); therefore, asbestos concentration in these grain size classes was not significantly different. In the case of serpentinite, ANOVA p-value was <0.05. Tukey test results showed significant differences of asbestos concentration between <0.106 and 2–20 mm grain sizes (p < 0.05). Furthermore, in the case of asbestos concentration calculated without outlier fibers, the Tukey test result pointed out significant differences (p < 0.05) between the three grain size classes (
Figure 7a).
Serpentinite provided quantitative (according to M.D. 06/09/1994) results, as the asbestos concentration fell within the range of 1000–10,000 ppm. Indeed, the error calculated (Equation (3)) on the asbestos concentration values was quite low. The low error was principally due to the high number of fibers found in the serpentinite samples, obtaining an AC/C factor of R1 0.23–R2 0.28–R3 0.25. These values were much lower than the experimental factor 0.48 (1000 ppm)–0.35 (10,000 ppm), which was considered as a limit for obtaining quantitative results in the M.D. 06/09/1994 (
Figure S1). Moreover, the high number of fibers found allowed a significant estimate of the mean and standard deviation. The results were in a small range, so the standard deviation calculated from the mean asbestos concentration of the three replications for each particle size fraction was low (
Figure 7a).
4.3. Debris Material
The debris material contained greater amounts of amphiboles of the tremolite–actinolite series (93.23%) compared with chrysotile (6.77%) only in the 2 to 20 mm fraction, and the percentages converged as the particle size fraction decreased (
Table 1). The total number of fibers was highest in the 2 to 20 mm fraction (44 fibers) and lowest in the unmilled natural fraction (20 fibers). The highest mean volume (13.12 μm
3) was in the 0.106 to 2 mm fraction both with and without outlier fibers (
Table 2) (for this sample, outlier fibers were those with a mean diameter of ≥1.67 μm). The smallest mean volume was in the unmilled fraction (4.54 μm
3).
In the grain size range from 2 to 20 mm, the mean concentration of the replications (R1, R2, and R3;
Table 3) was 319 mg/kg and was 210 mg/kg excluding outliers from the calculation (R1, R2, R3 without outliers;
Table 3), a reduction of 34%. In the 0.106 to 2 mm grain size fraction, the mean concentration of the replications was 361 mg/kg and was 153 mg/kg excluding the outlier fibers from the calculation, a reduction of 58%. Finally, in the <0.106 mm fraction, the mean concentration of the replications was 111 mg/kg and was 84 mg/kg excluding the outlier fibers from the calculation, a reduction of 24% (
Table 3).
Debris material provided semi-quantitative results (<1000 ppm) according to the method used in
Figure S1 of the decree, and the errors were reasonable with respect to the concentration values (
Table 3). The standard deviation was slightly larger compared with the serpentinite results owing to the greater variability of the data (
Figure 7b).
4.4. Soil
In the soil, about 95% of the asbestos fibers were amphiboles of the tremolite–actinolite series. Chrysotile had a maximum abundance (7.57%) in the 0.106 to 2 mm fraction (
Table 1). The number of fibers increased with decreasing particle size fraction (
Table 2). A total of 15 fibers were detected in the 2 to 20 mm fraction and 25 fibers in the unmilled <0.106 mm fraction. However, the mean total asbestos fiber volume was similar between the three grain size fractions, whereas the mean volume excluding outlier fibers was highest in the 2 to 2 mm fraction and lower in the not milled fraction (
Table 2). This is explained by the fact that in the coarser size fractions, the fibers were lower in number but had larger volumes, and the volumetric effect outweighed the numeric effect.
In the 2 to 20 mm grain size fraction, the mean asbestos concentration of the replications was 239 mg/kg, and no outlier fibers were found. In the 0.106 to 2 mm fraction, the mean asbestos concentration was 411 mg/kg and that calculated without outlier fibers was 273 mg/kg, a reduction of 34%. The non-milled powder <0.106 mm had a mean concentration of 388 mg/kg and of 267 mg/kg excluding the outlier fibers, a reduction of 31% (
Table 3). For the soil sample, outlier fibers were those with a diameter of >1.6 μm.
Soil provided semi-quantitative results (<1000 ppm) according to the method used and described in
Figure S1 as already said above. The errors associated with the concentrations (
Table 3) reflect the large dimensional variability of the fibers observed in the read-fields.
Figure 7c shows a wide standard deviation as a result of the greater variability of the data population compared with debris material and mostly with serpentinite.
5. Discussion
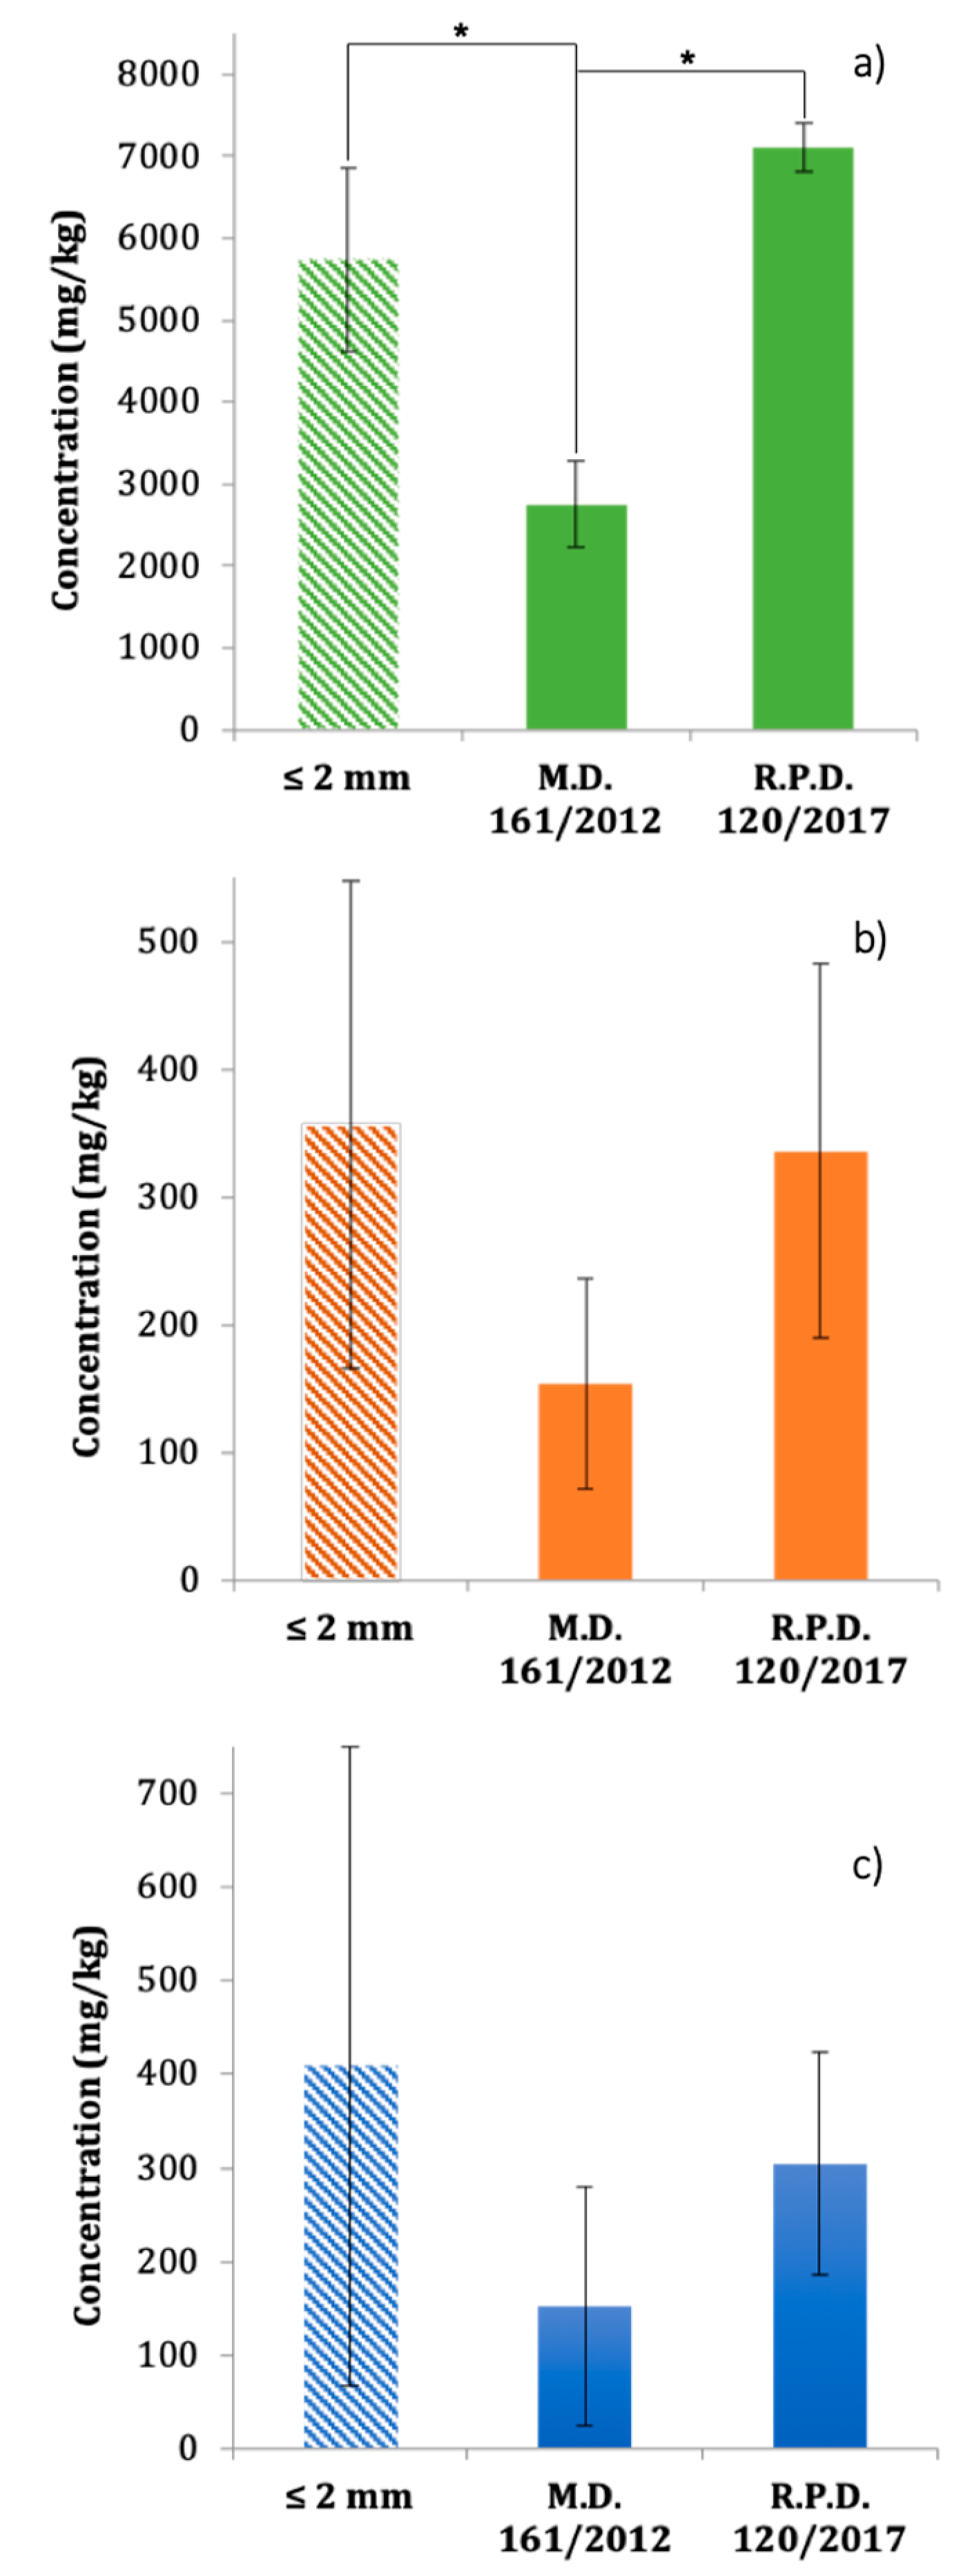
After determining how the asbestos fibers were distributed across the three different grain size fractions and calculating the concentrations of asbestos in each fraction, we recalculated the concentrations according to both decrees, Normative 1 and 2. The concentrations were obtained by recalculating the asbestos weight values of each particle size fraction. We also recalculated the asbestos concentrations of the 0.160–2 mm fraction that was unrelated to the lithic skeleton. In this case, the values shown are calculated without outlier fibers.
The results (
Figure 8) demonstrate that the recalculation according to Normative 2 involves a dilution effect, reducing the concentration of asbestos fibers compared with samples prepared according to Normative 1. In fact, asbestos concentration was reduced by 61%, 54%, and 50% for serpentinite, debris material, and soil, respectively.
Statistical analysis of data reported in
Figure 8 was carried out. The p-value corresponding to the F-statistic of one-way ANOVA is higher than 0.05 for soil and debris material, suggesting that there are no significant differences between asbestos concentration calculated for grain size class ≤2 mm and according to M.D. 161/2012 and R.P.D. 120/2017. However, p-value for serpentinite is much lower than 0.05 (around 0.01). This suggested to proceed with the Tukey test and it emerged that there are significant differences of asbestos concentration calculated according to M.D. 161/2012 with both concentrations in ≤2 mm grain size fraction and according R.P.D. 120/2017 (
Figure 8a).
This data could be explained observing asbestos concentration and SD values. In the case of asbestos concentration >1000 ppm, as for serpentinite, results are quantitative, and errors associated with the method are low because the number of fibers is high (N > 30).
Moreover, the left-hand column of the debris (
Figure 8b) shows that the concentration for the ≤2 mm fraction (i.e., without the skeleton) is similar to the concentration calculated according to R.P.D. 120/2017. Conversely, the left-hand column of the soil (
Figure 8c) and this could be related to the fact that being sediments, these have undergone erosion and transport processes, therefore asbestos is concentrated in the finest fraction.
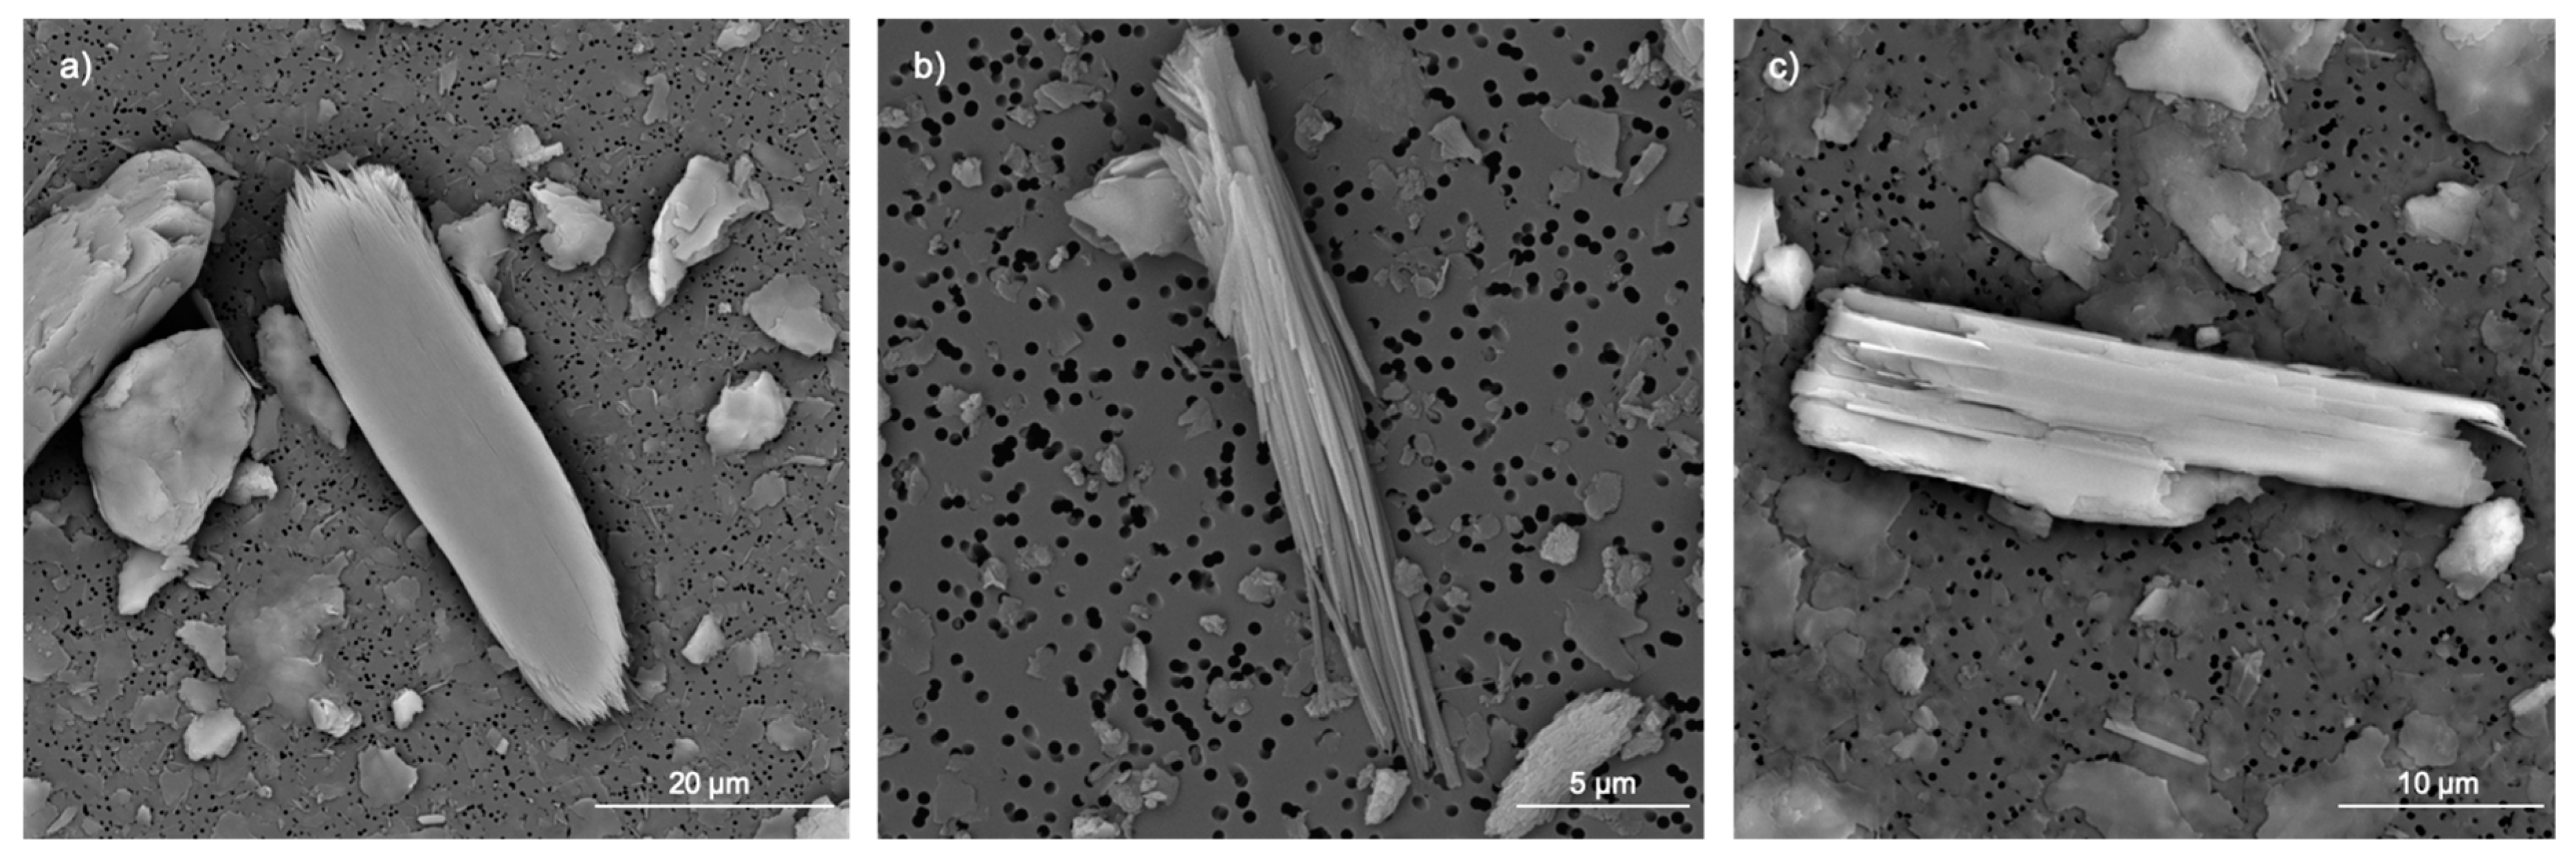
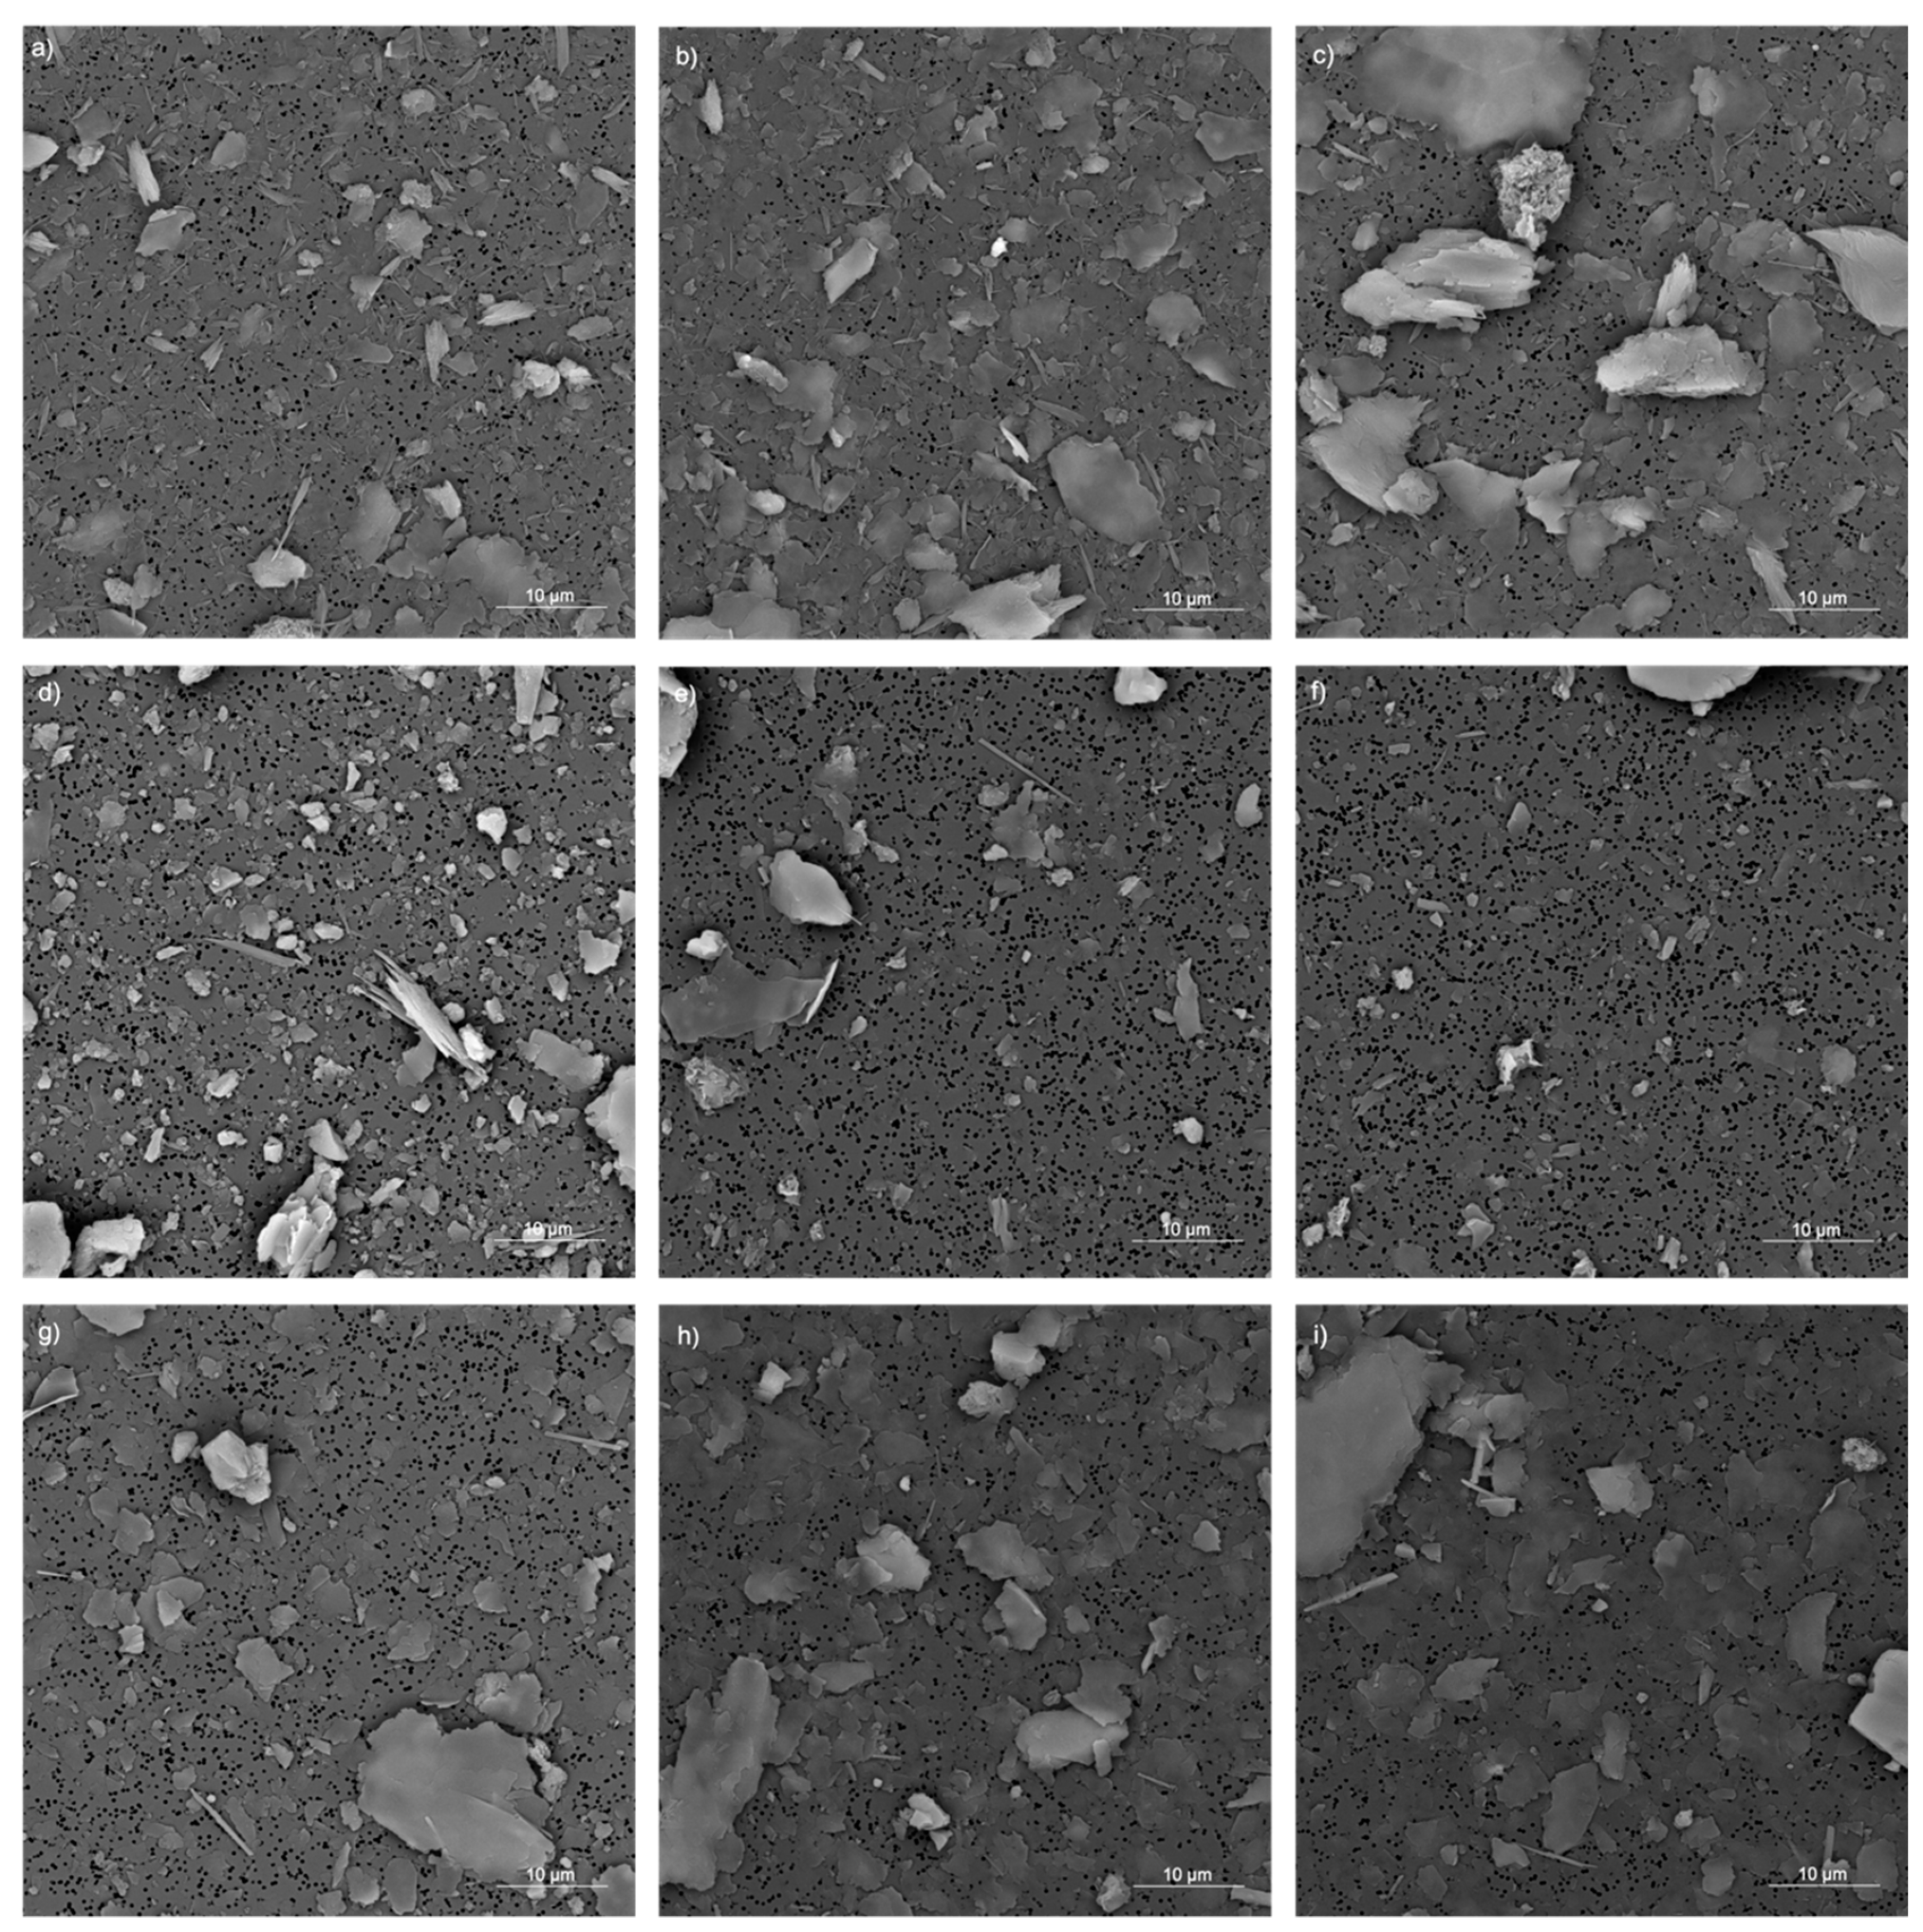
Depending on the type of rock and especially on the asbestos mineral subjected to comminution, substantial differences can be seen for the three grain size classes. The asbestos fibers in serpentinite occur as large bundles in natural powders (<0.106 mm) and to some degree in the 2 to 20 mm fraction. In the ≤2 mm fraction, the bundles tend to separate along the fiber length, causing a greater dispersion of the fibrils below the dimensions of fibers (width < 0.2 µm) able to be counted (
Figure 9a–c). Although such an explanation cannot be applied to either the debris or the soil, the asbestos amphibole reacts to the comminution differently from the chrysotile in those samples. In fact, amphiboles are mechanically more resistant and are homogeneously distributed in the three fractions considered (
Figure 9d–i). Moreover, the lengths and diameters of the countable fibers are not significantly different between the natural and the milled powders for the debris and soil (
Figure 9d–i).
6. Conclusions
Our analytical observations demonstrate that asbestos concentration results are strongly dependent on the grain size prepared for analysis and on the criteria used to count fibers. Our major conclusions are as follows:
(1) In comparison with chrysotile, amphiboles are more evenly distributed in the three granulometric fractions notwithstanding the same percentage in abundance for each sample (
Table 1).
(2) Asbestos fibers that lie outside the geometric ratio of fibers suggested in the decrees and by the World Health Organization are excluded under the definitions of “fiber” because they are too large. However, these large fibers might become broken or milled and, in such cases, would contribute to the fiber count. Such a process might influence the measured asbestos concentration, and therefore the exclusion or inclusion of these outliers from the asbestos particle count remains an unresolved issue.
(3) In the case of substances occurring naturally in rocks (such as asbestos and other potentially toxic elements), the use of R.P.D. 120/2017 is considered more suitable for assessments and technical–scientific investigations. In such cases, the definition of a particle as part of the skeleton (the 2 to 20 mm fraction) is pointless if it is generated artificially according to the mode of disintegration of the rock. Therefore, it is considered more appropriate to express the concentration of the substance in terms of total content, without referring to the skeleton. This is the most precautionary result because it provides an assessment of the total fibers released by a rock.


