Environmental Impact of Mine Exploitation: An Early Predictive Methodology Based on Ore Mineralogy and Contaminant Speciation

 and
and 
Abstract
:1. Introduction
2. Materials and Methods
2.1. Materials
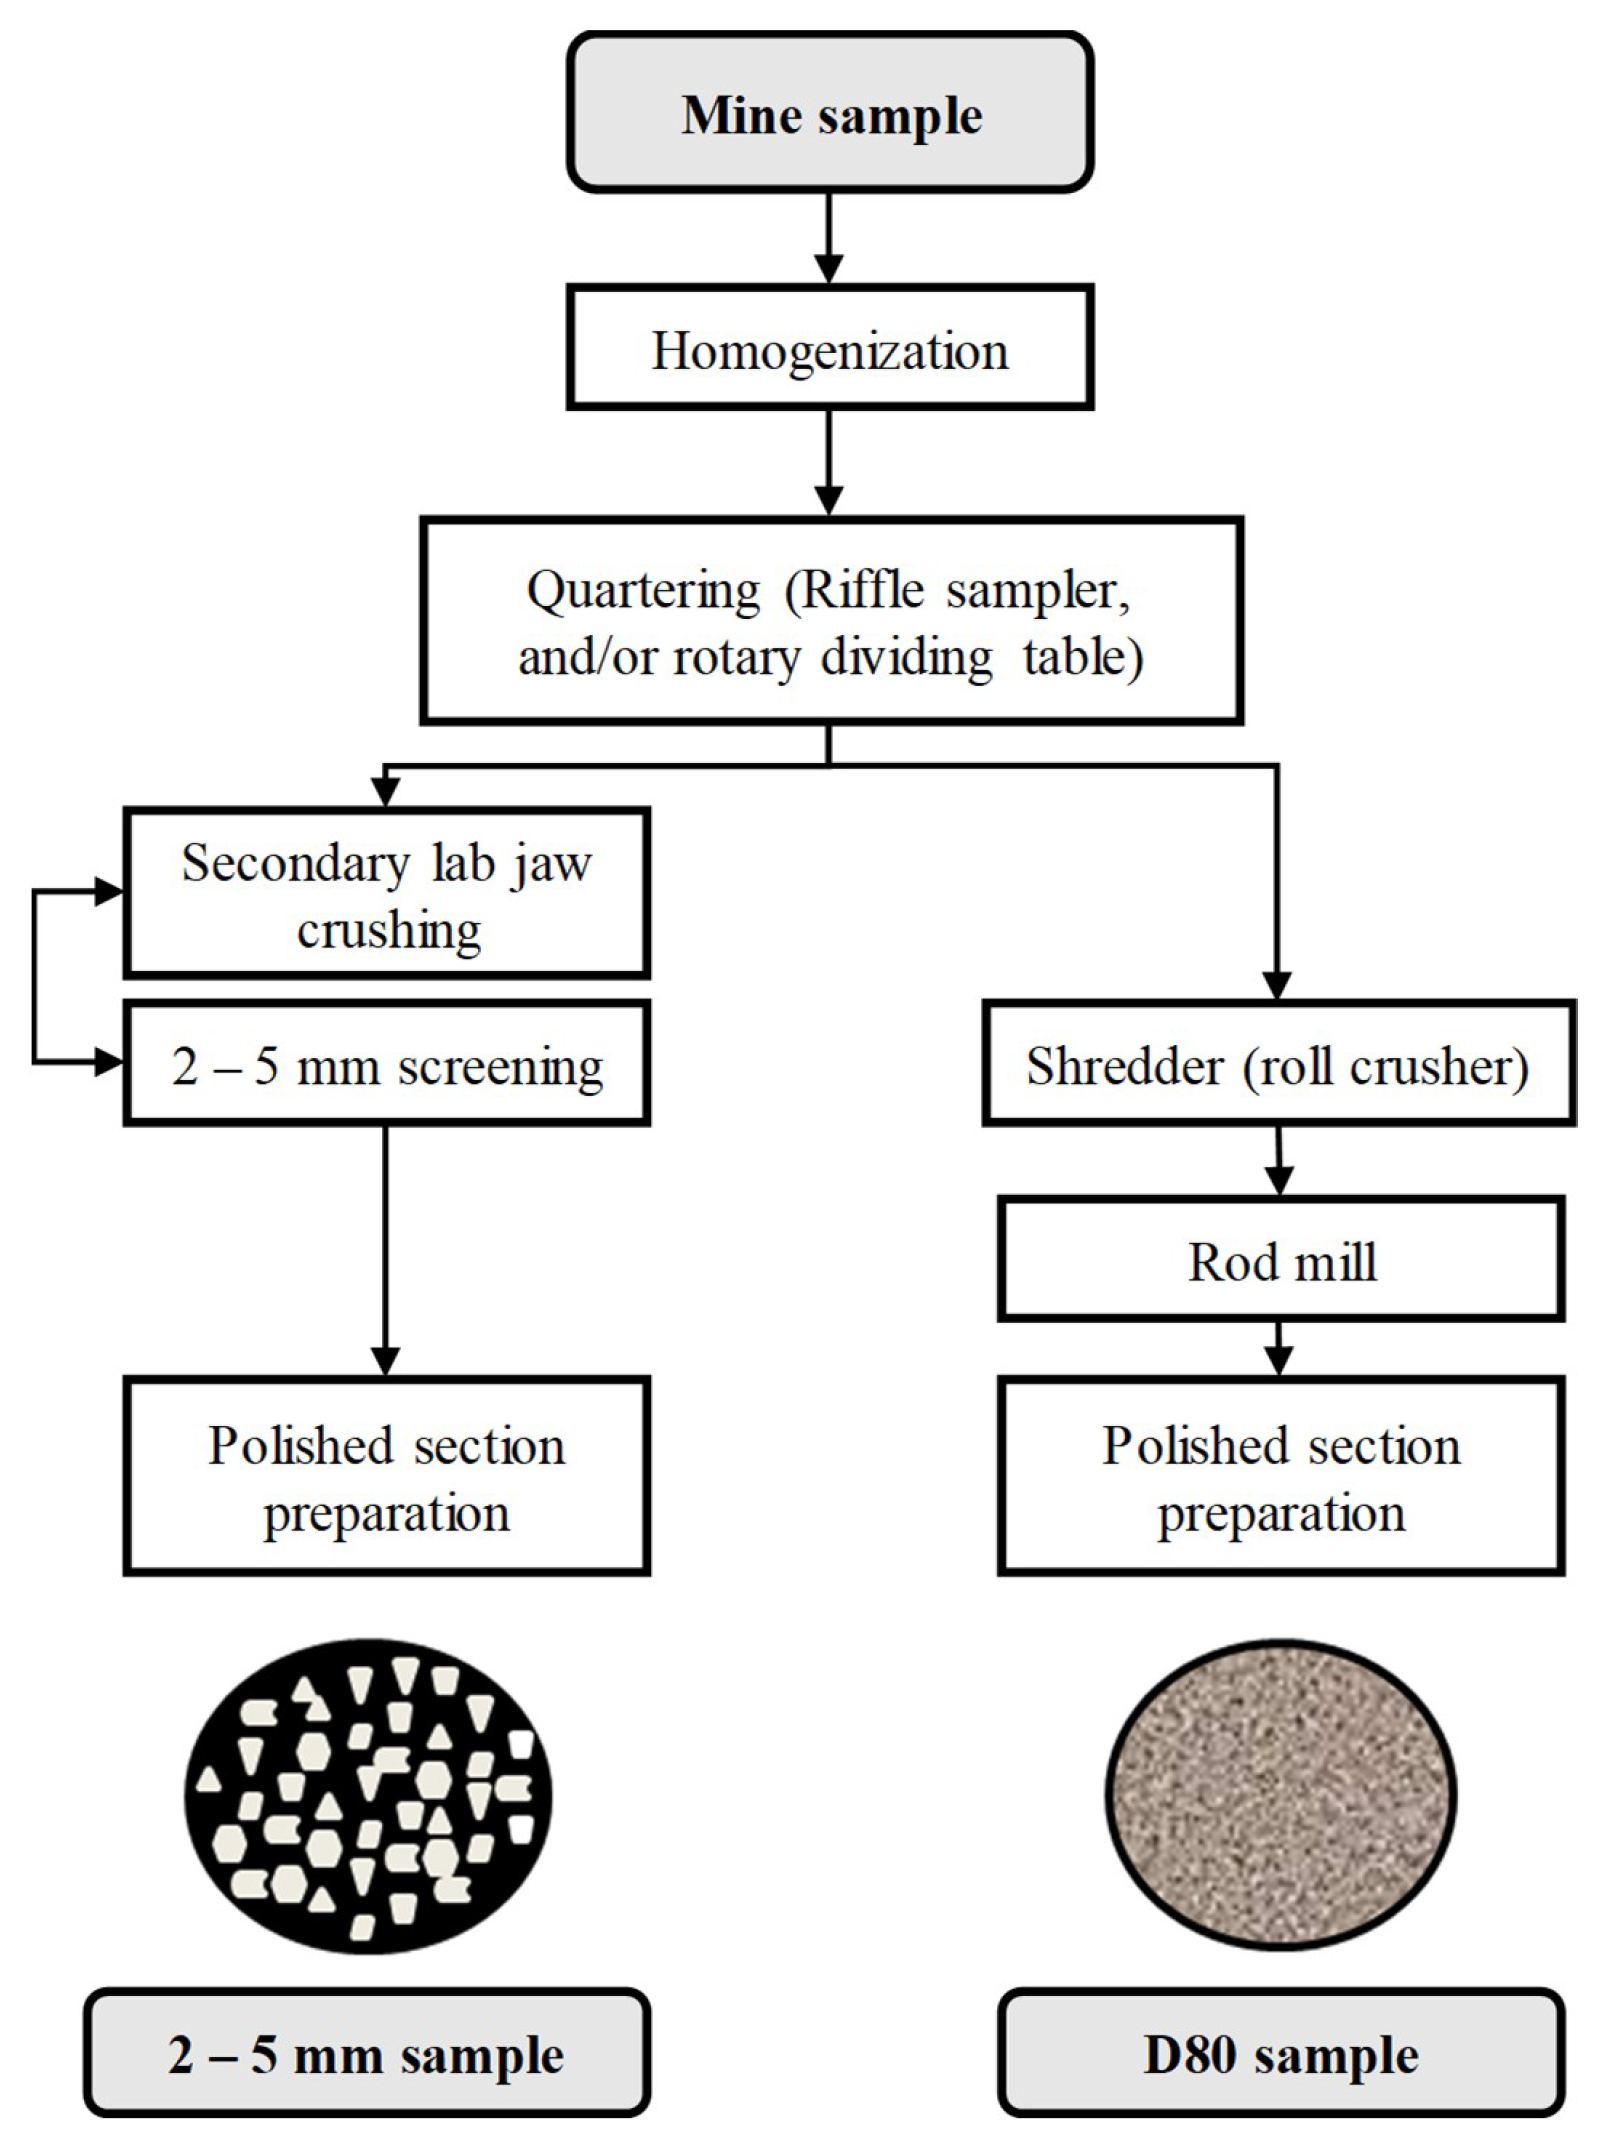
2.2. Methods
2.2.1. Particle Size Distribution
2.2.2. Chemical Characterization
2.2.3. Mineralogical Characterization
2.2.4. Geochemical Testing
2.3. General Methodology
3. Results and Discussion
3.1. Chemical Characterization
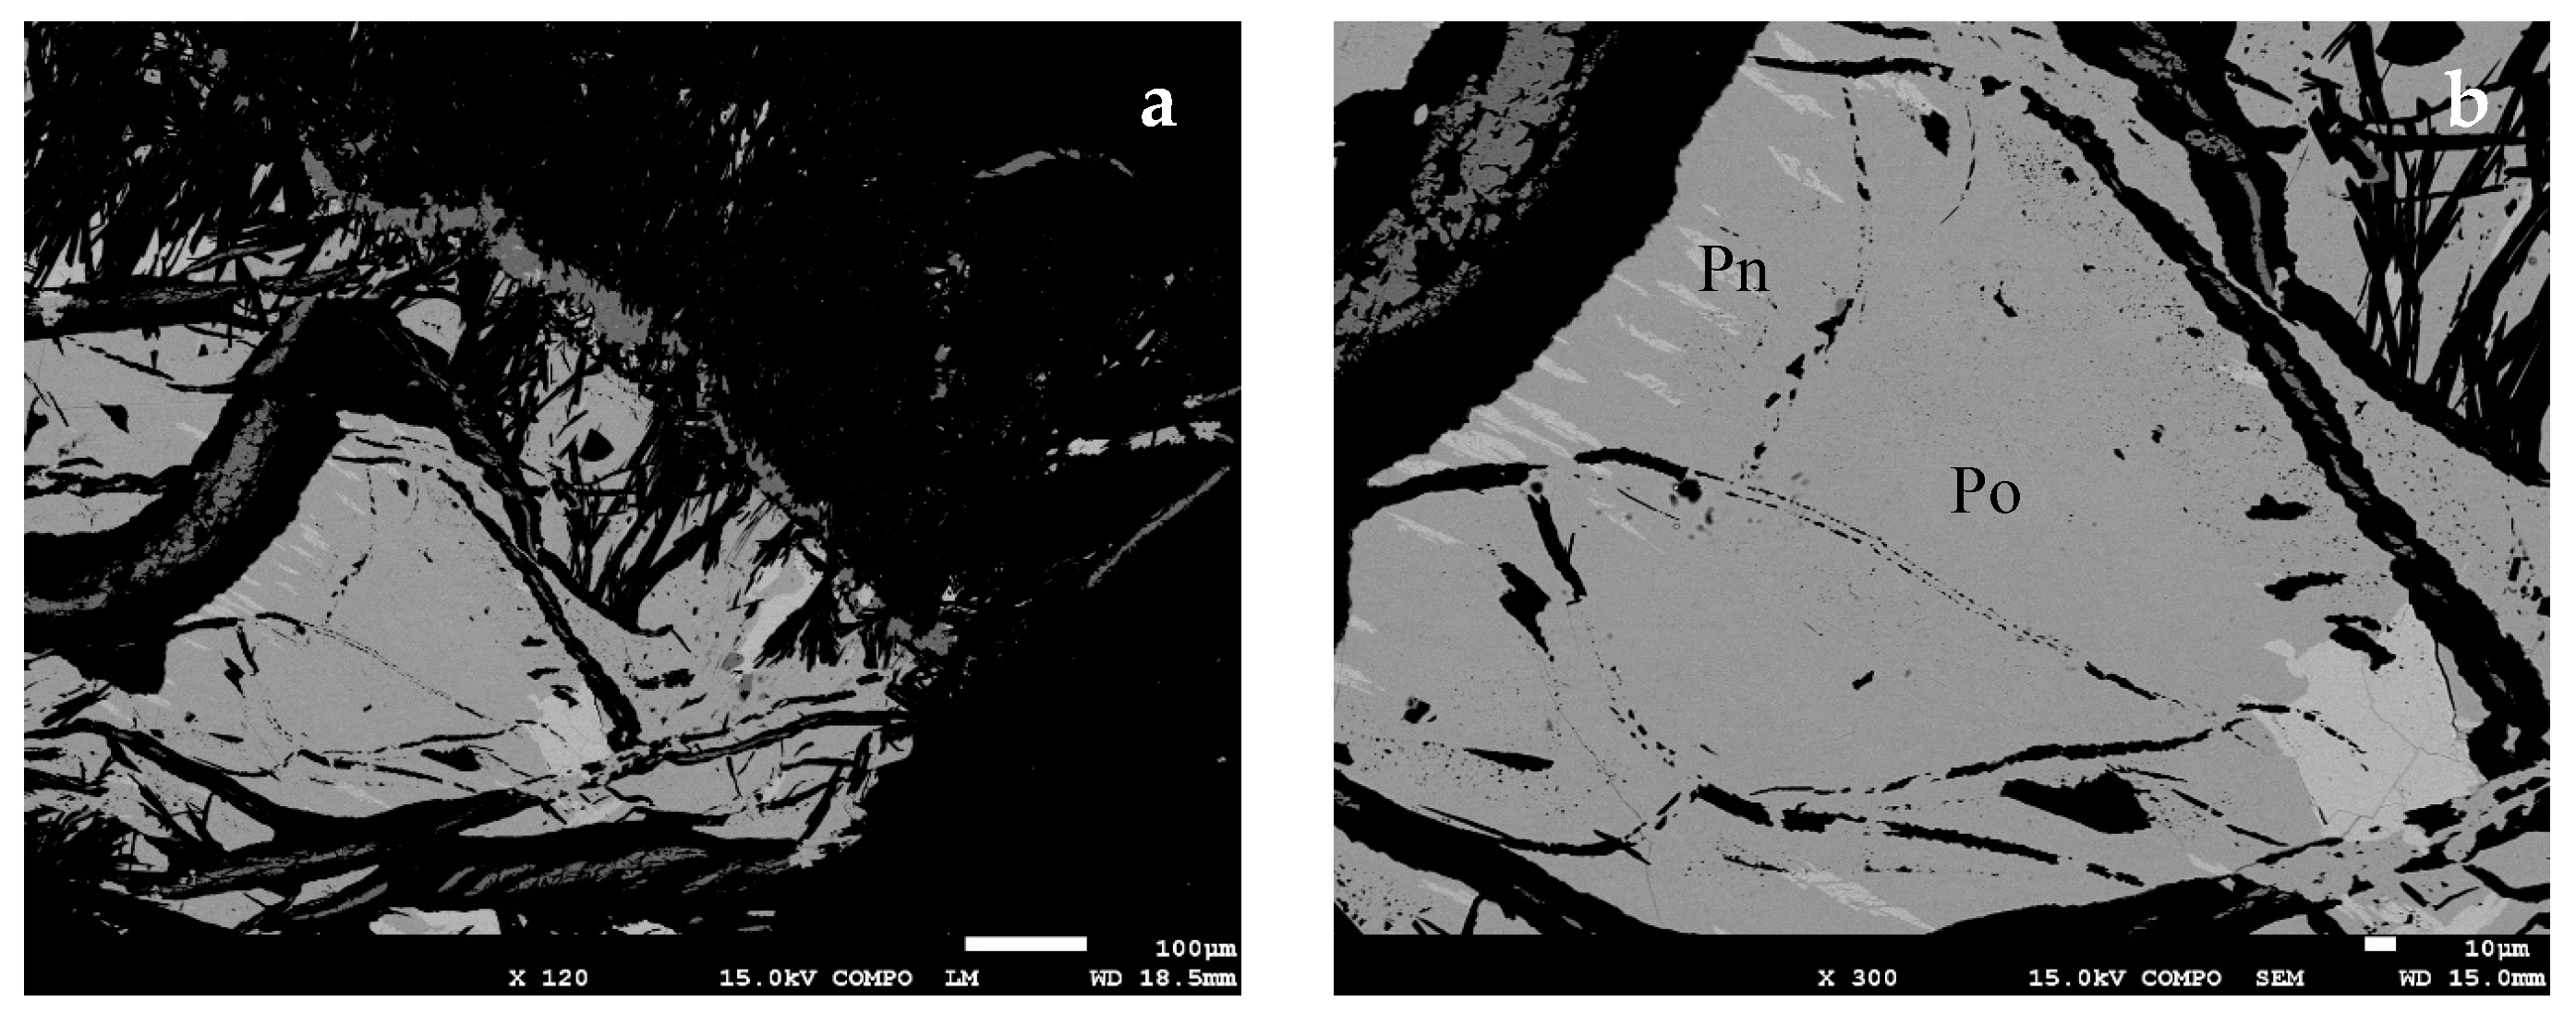
3.2. Mineralogical Characterization and Identification of the Bearing Minerals
EPMA Results
3.3. Chemical and Mineralogical Data Reconciliation
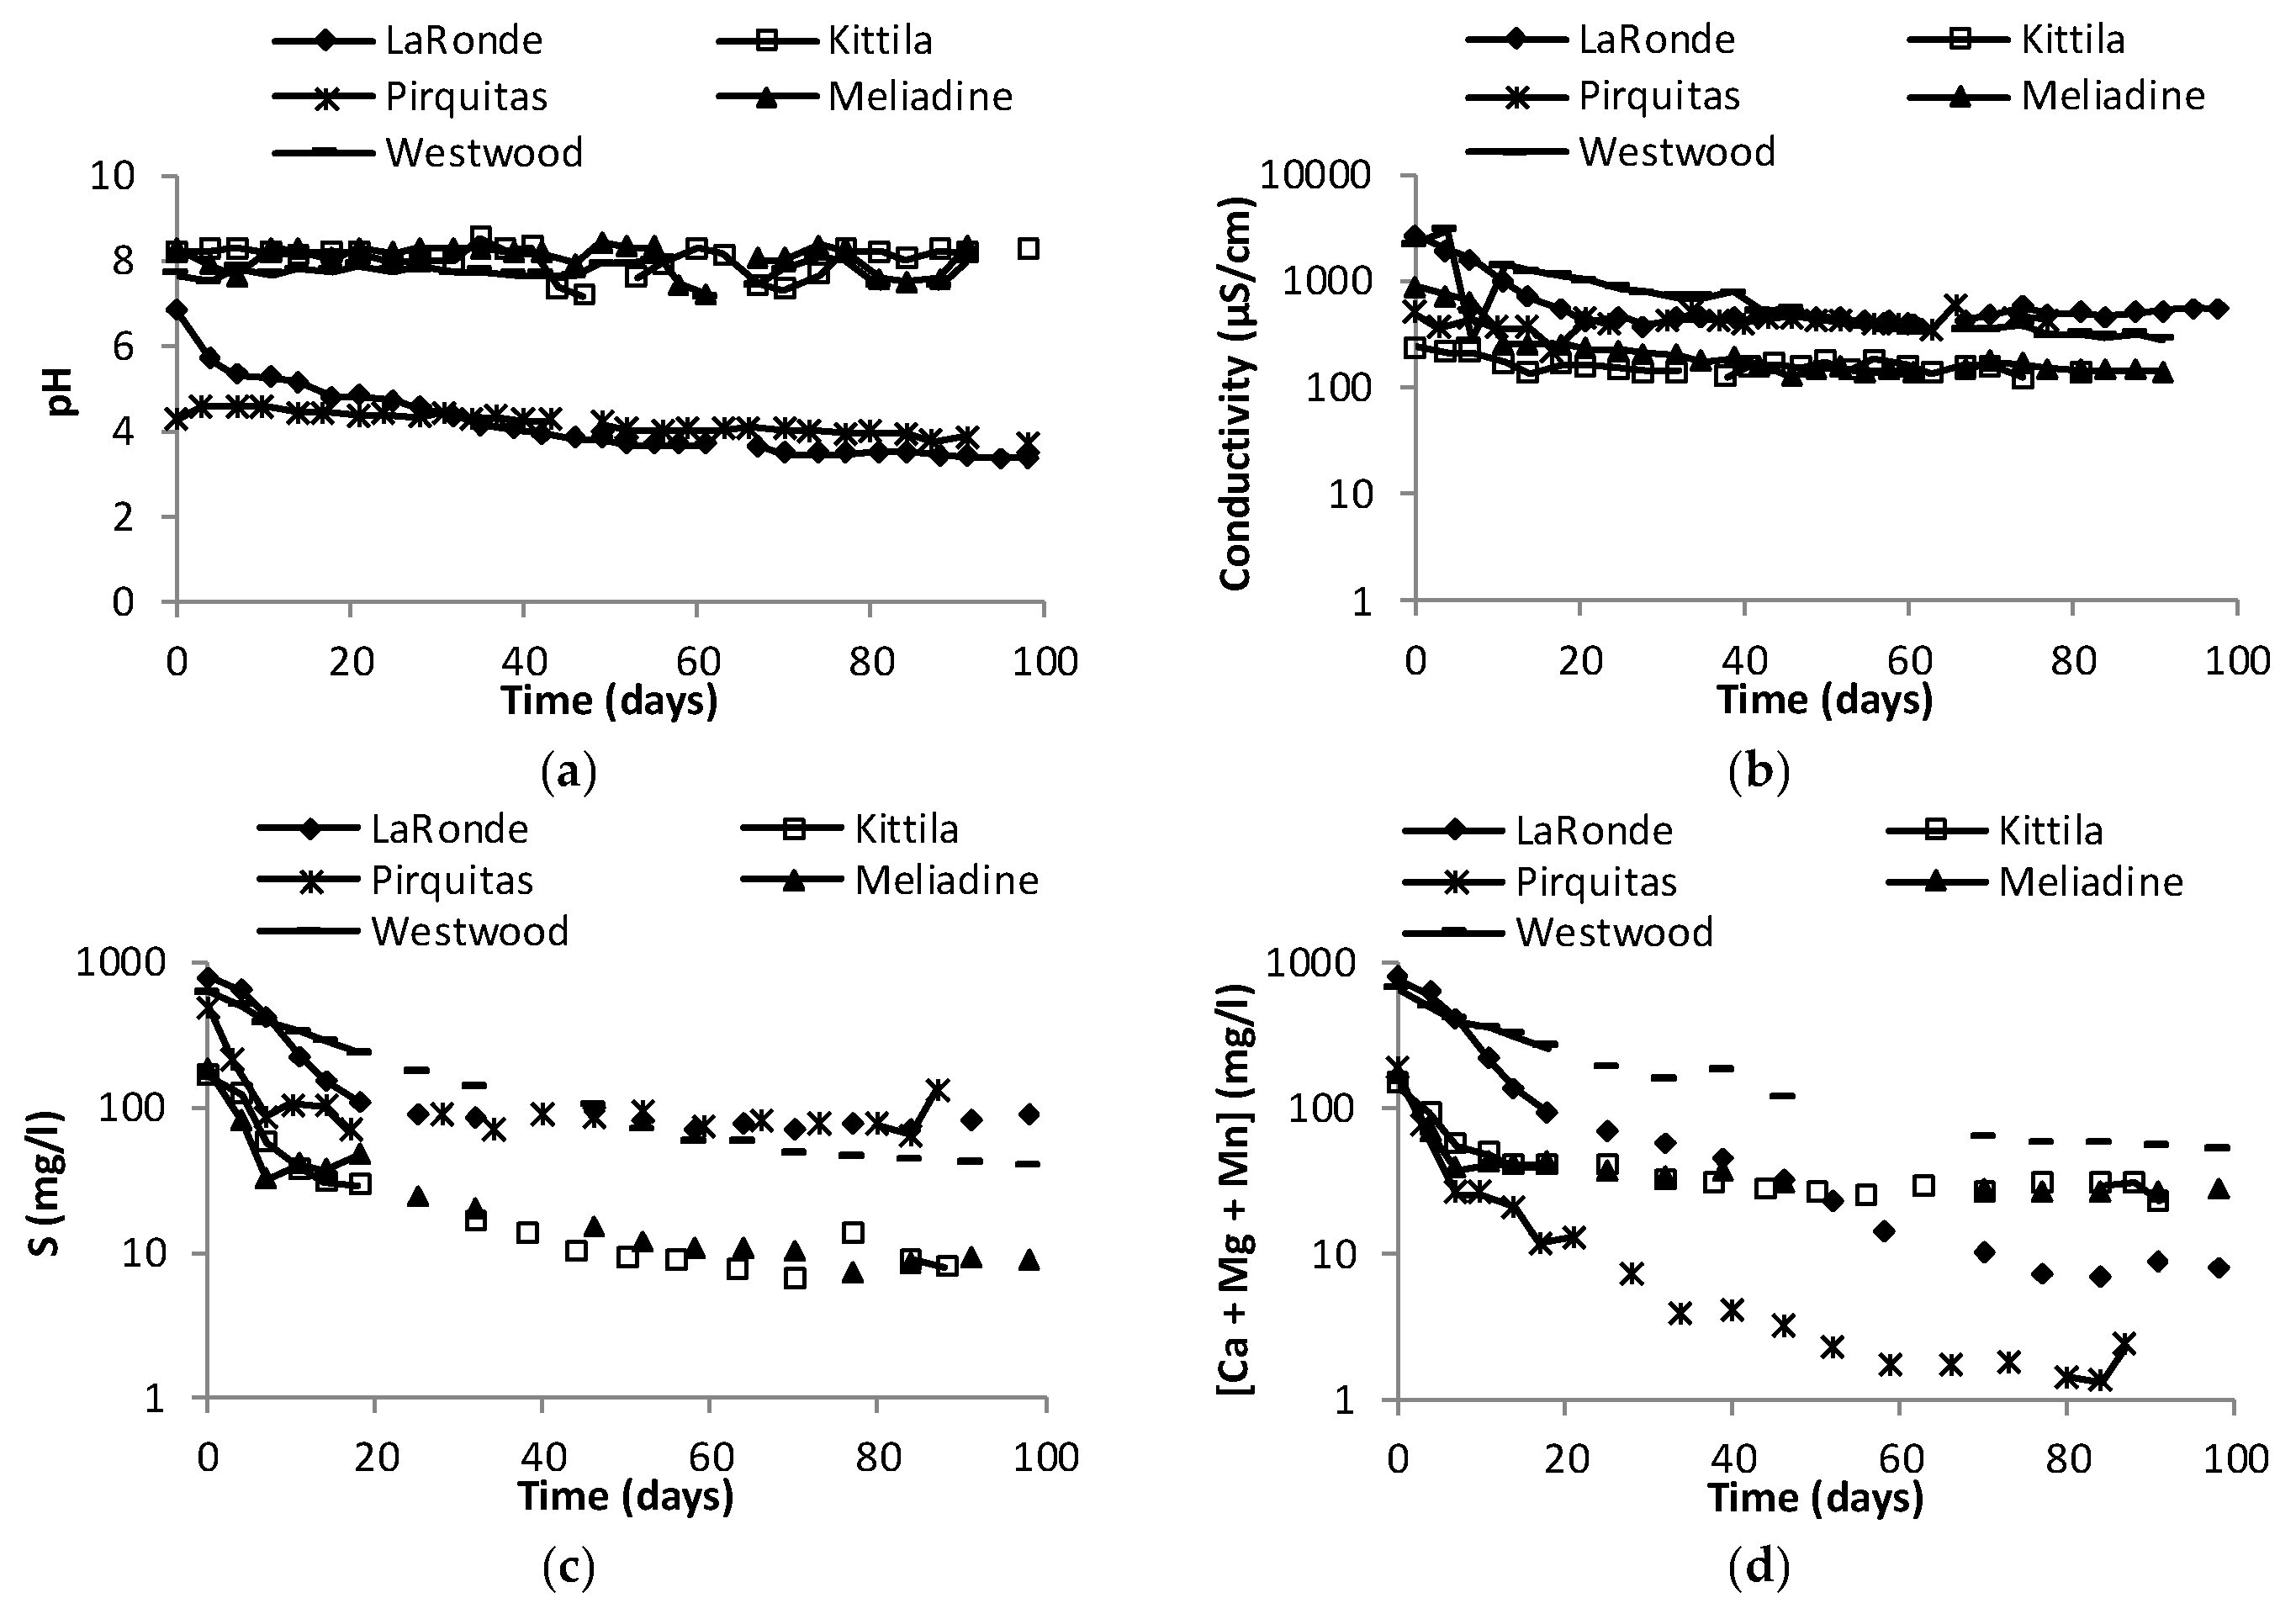
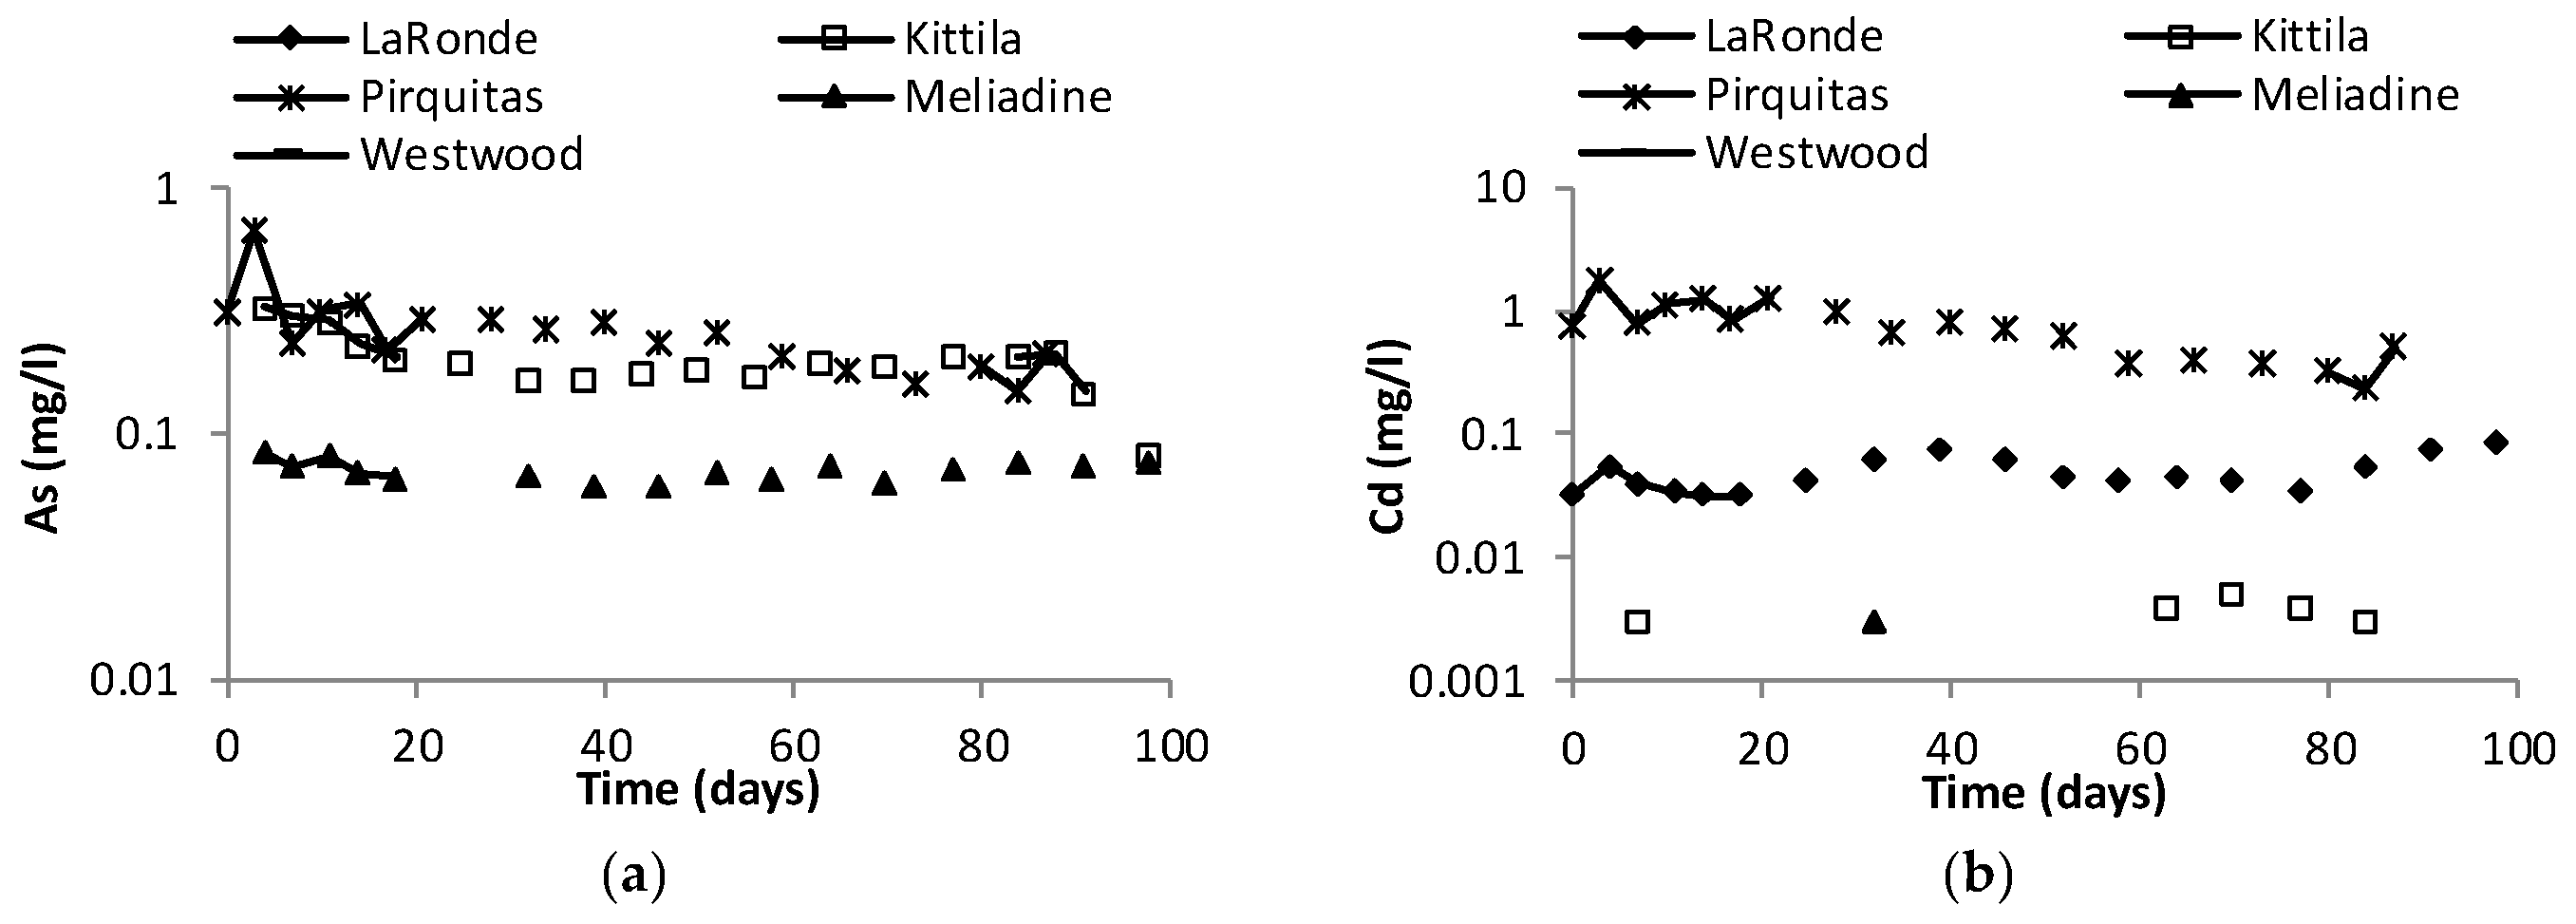
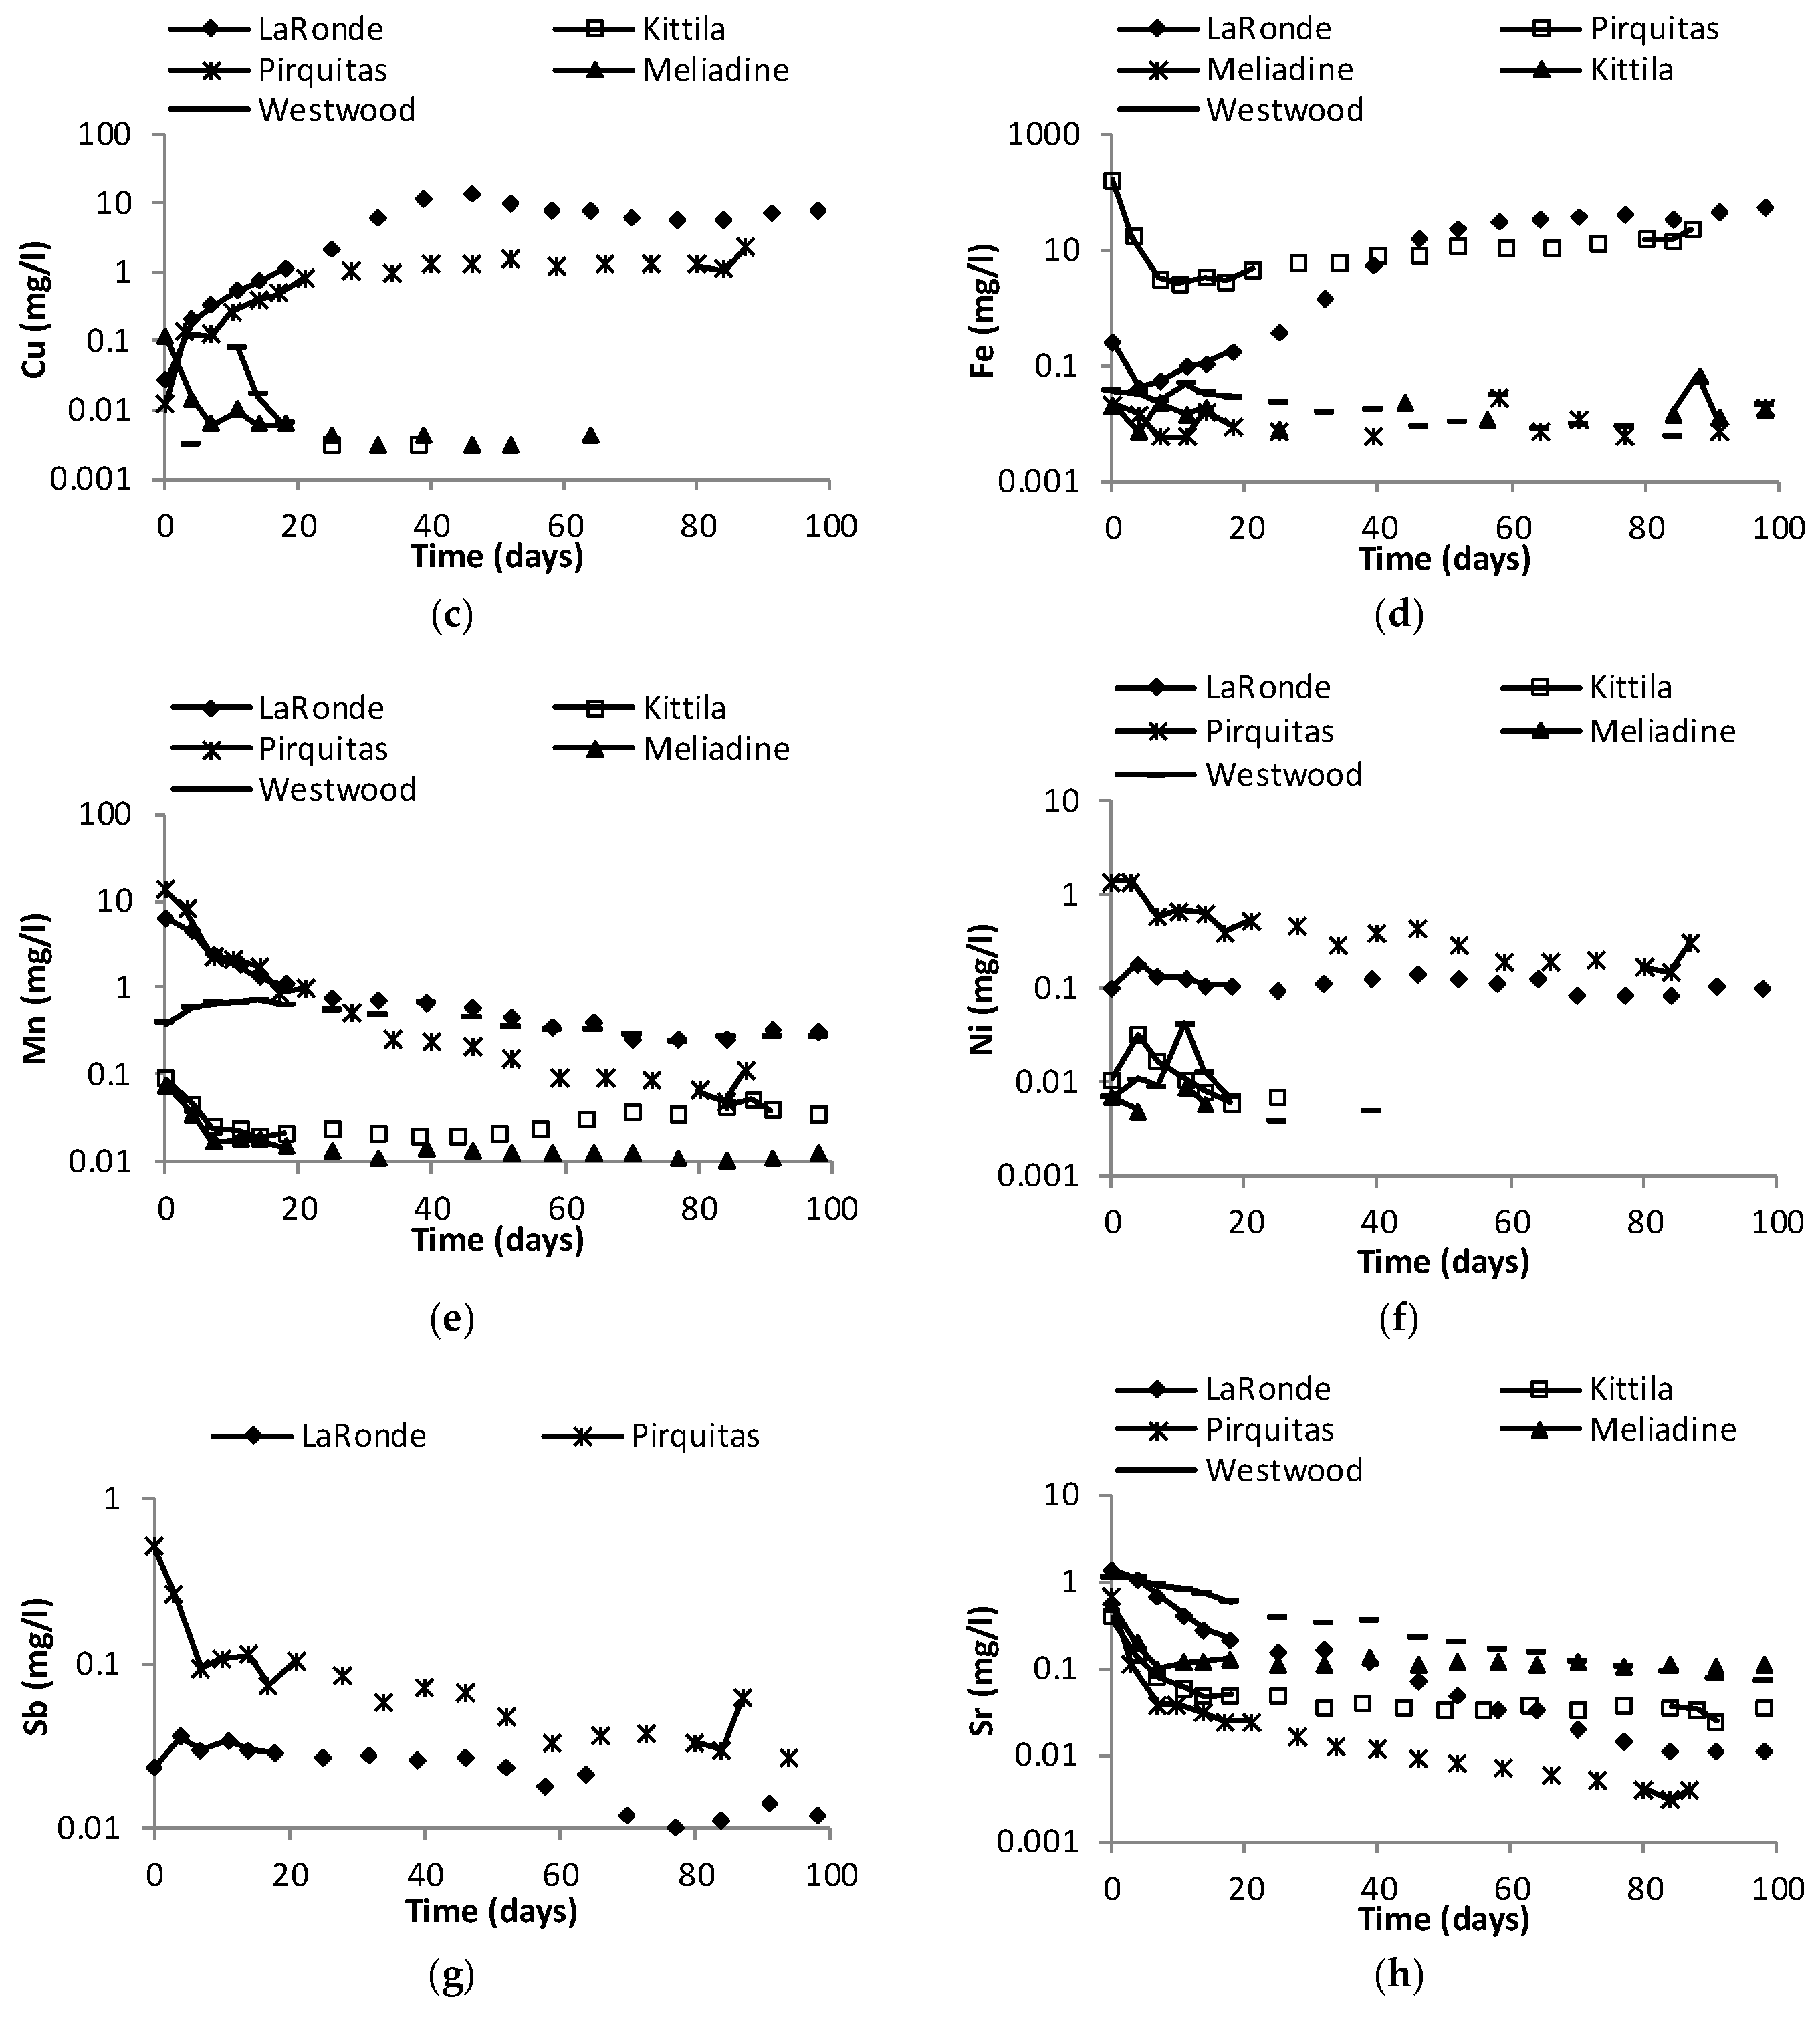
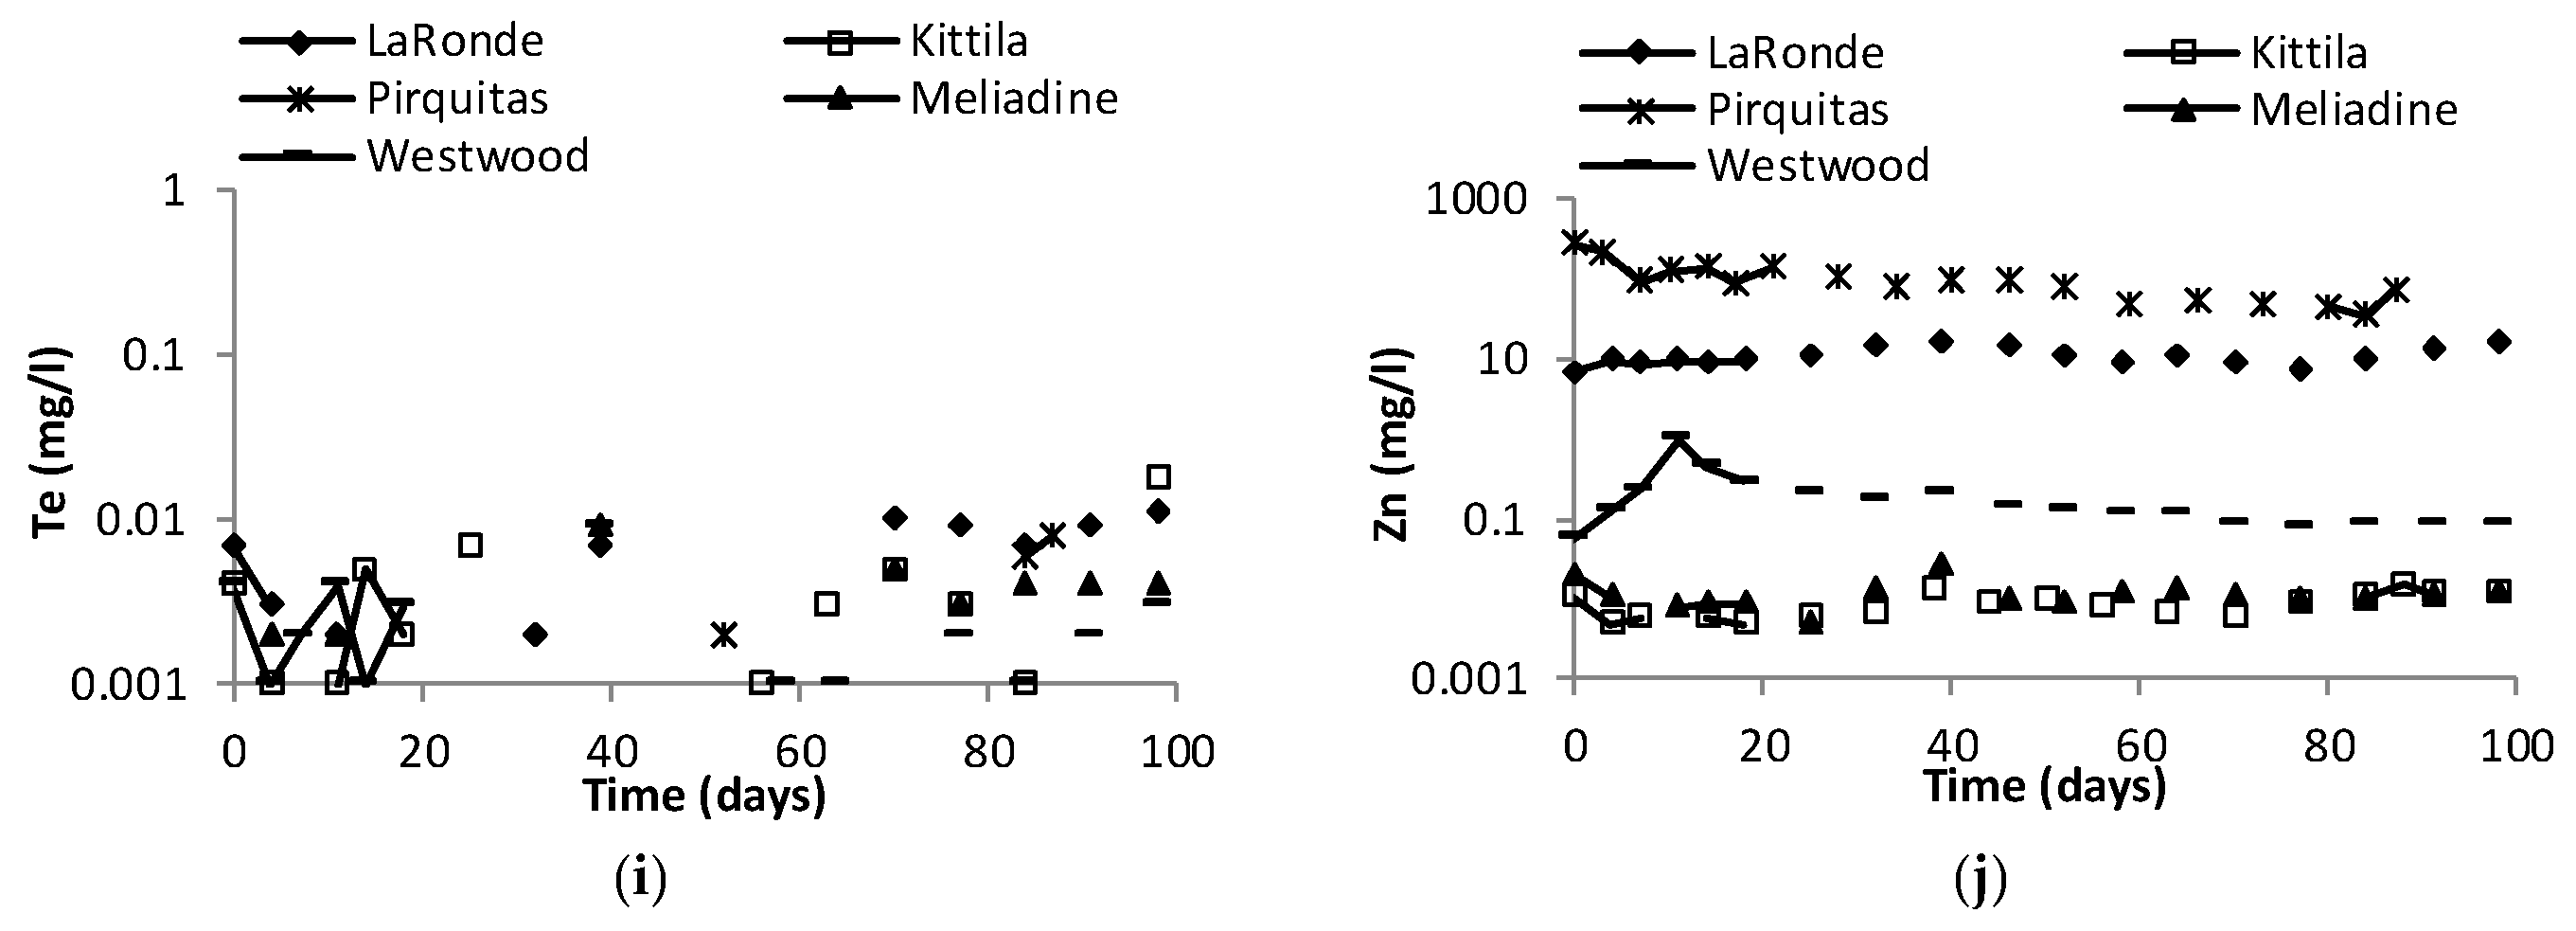
3.4. Geochemical Results
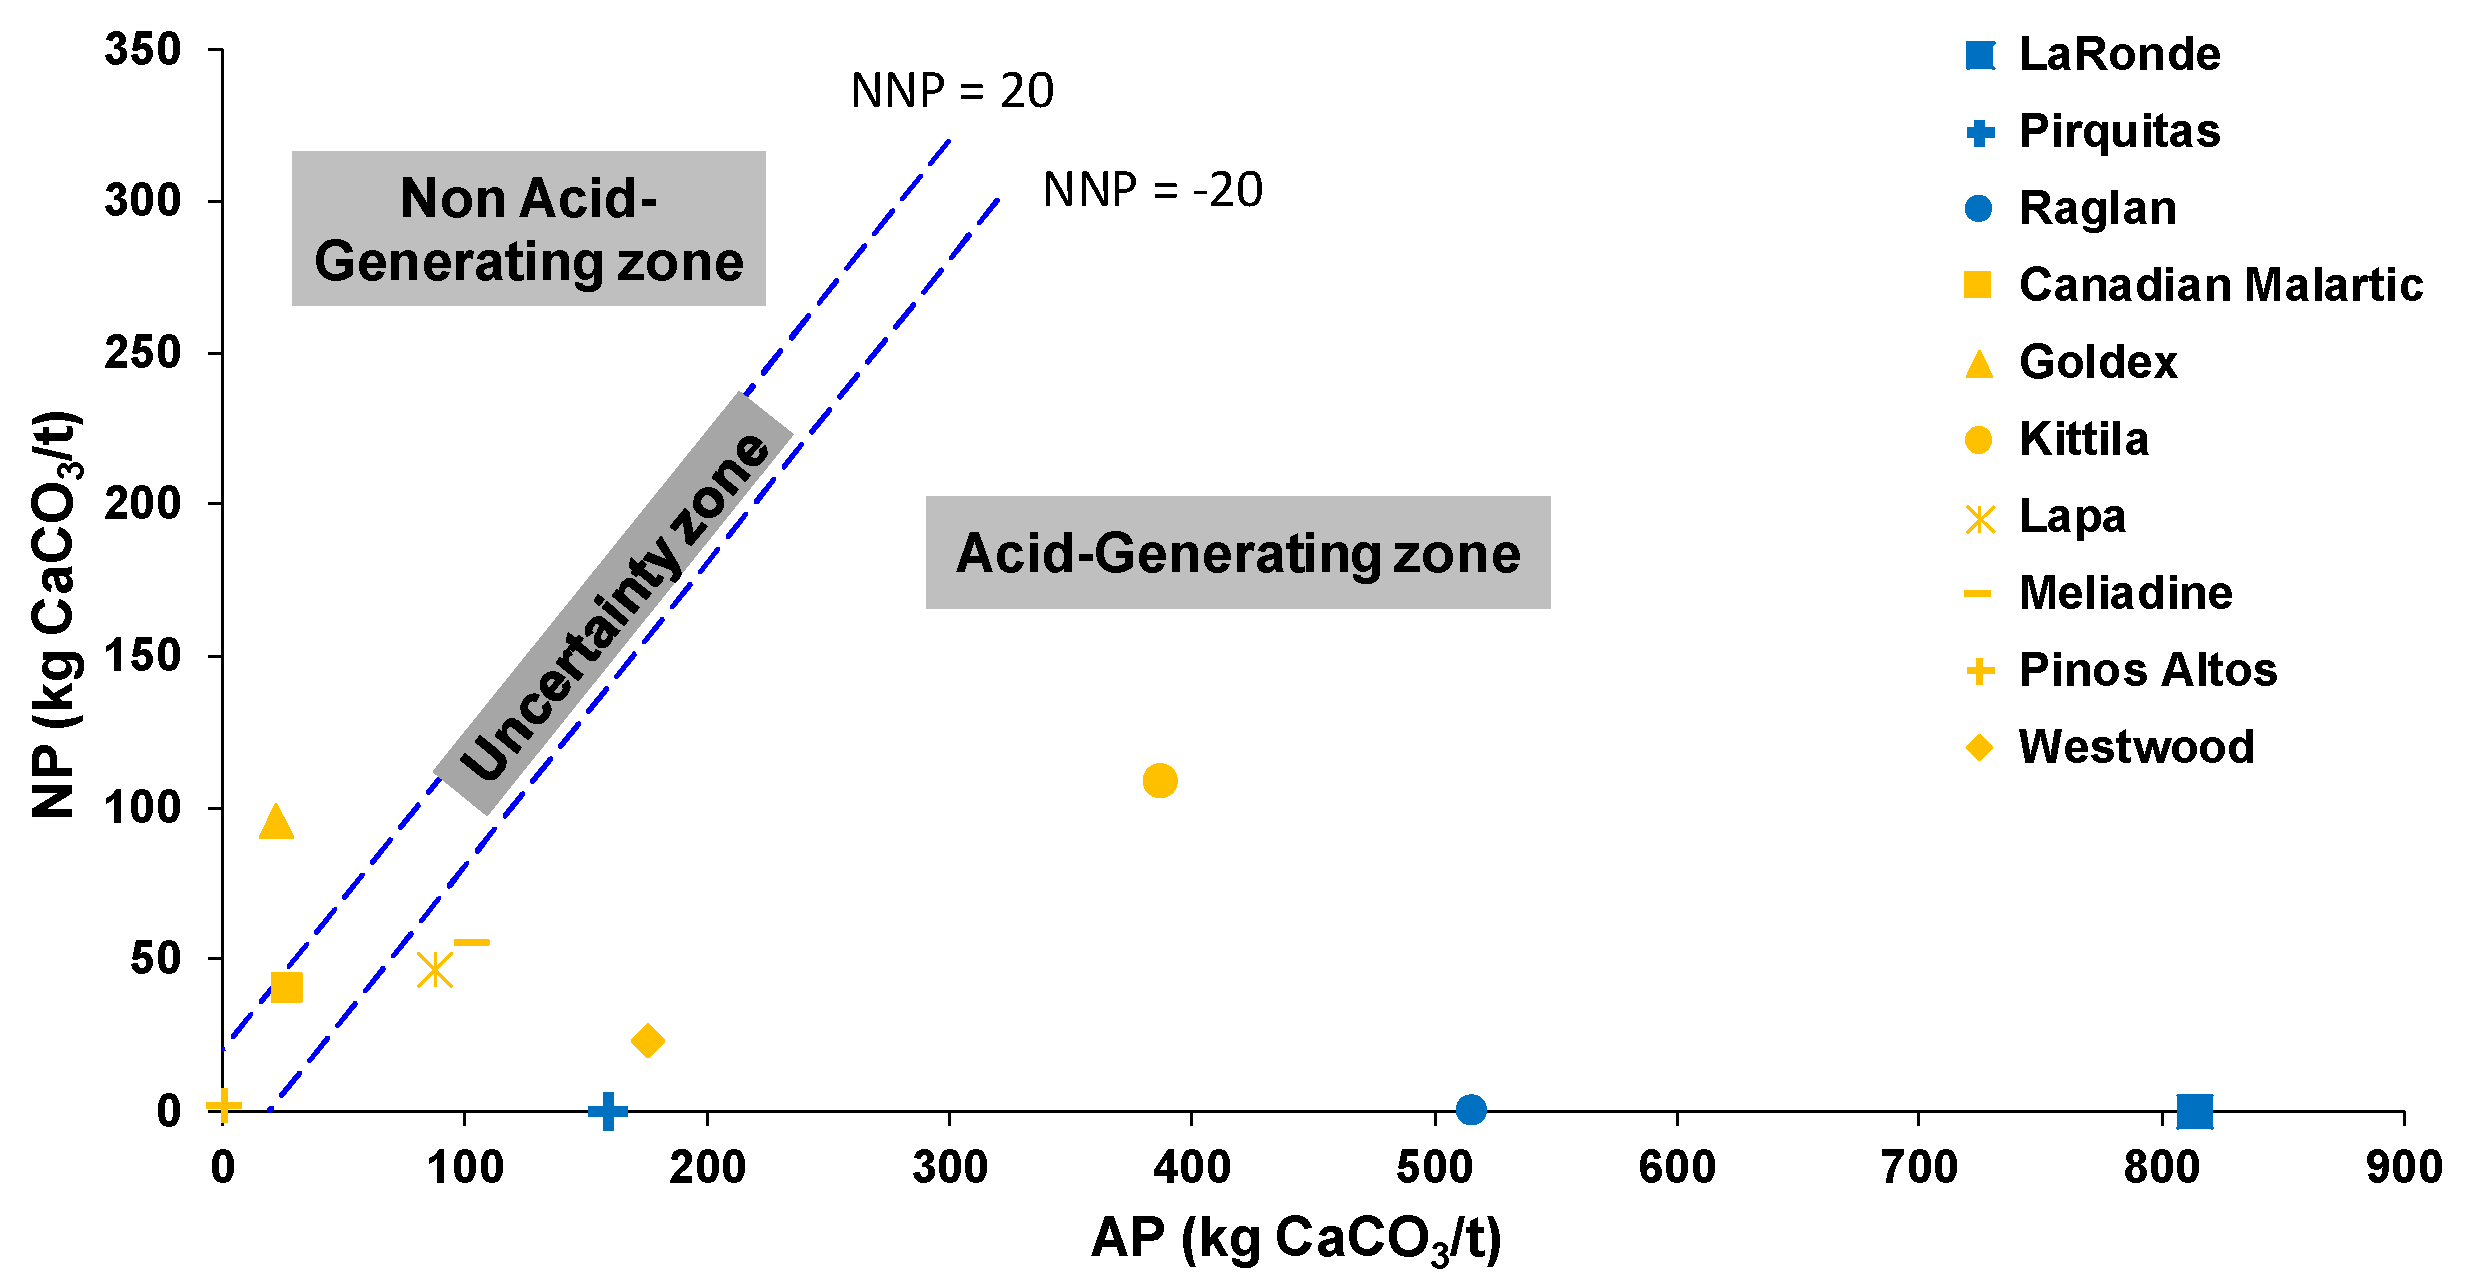
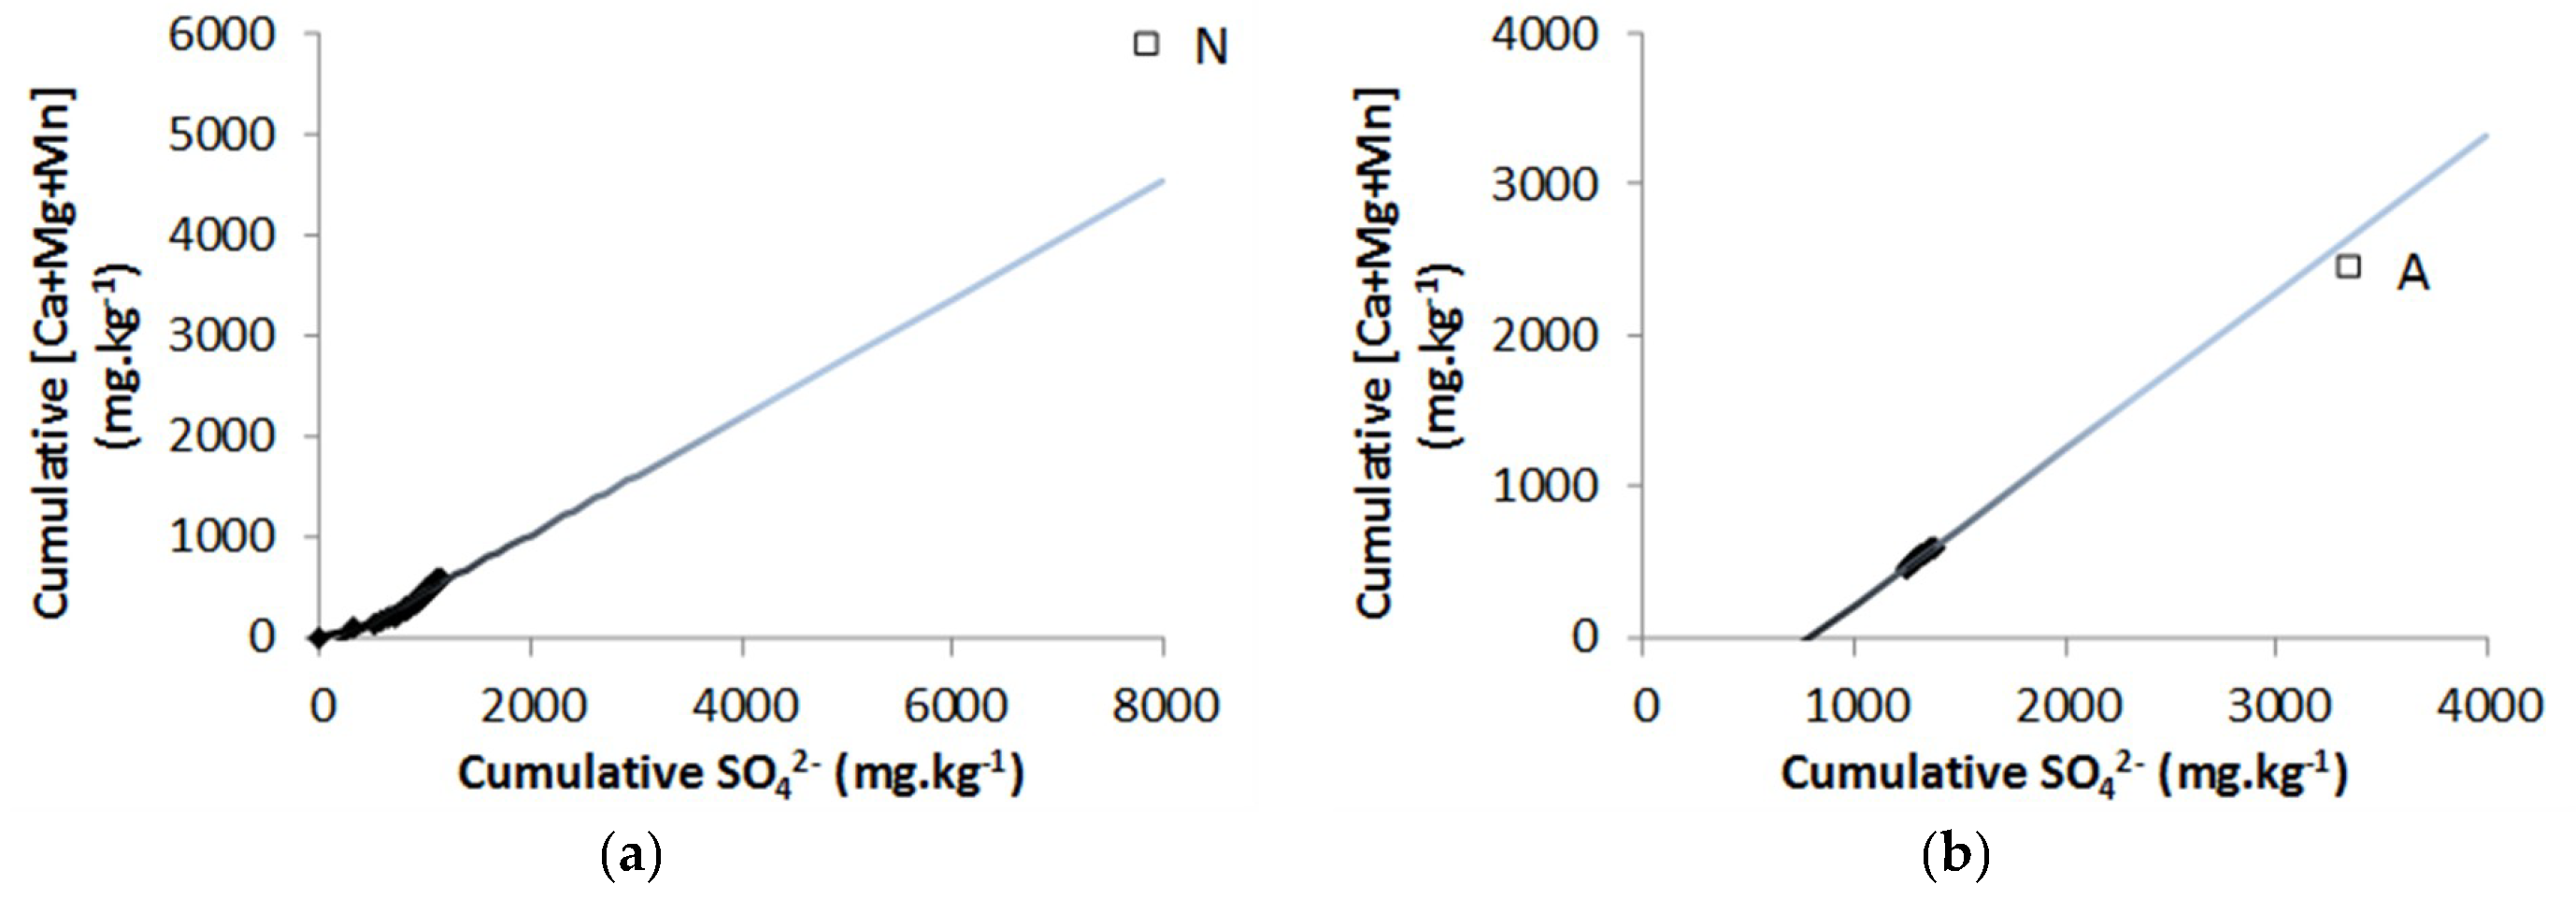
3.5. Acid Mine Drainage Estimation
4. Conclusions and Perspectives
Author Contributions
Funding
Acknowledgments
Conflicts of Interest
Appendix A

| Mine’s Name | Sample | Mine’s Lab Preparation | Initial Mass (g) | Initial Particle Size | Final Target D80 (µm) |
|---|---|---|---|---|---|
| LaRonde | Blasted ore | No | 2150 | D80 ≈ 80 mm | 68 |
| Pirquitas | JIG feed ore | Unknown | 900 | <10 mm | 48 |
| Raglan | Blasted ore | No | 39,000 | D80 ≈ 80 mm | 79 |
| C. Malartic | Stockpile | No | 12,000 | D80 ≈ 100 mm | 64 |
| Goldex | Jaw crusher sample | Crushed, split | 1630 | D80 ≈ 7.1 mm | 66 |
| Kittilä | GTK composite | Crushed, split | 2650 | <1 mm | 85 |
| Lapa | Composite | Crushed, split | 1000 | <2 mm | 80 |
| Meliadine | Tiriganiaq open pit Composite | Crushed, split | 1000 | <2 mm | 63 |
| Pinos Altos | Santo Niño Composite | Crushed, split | 4300 | <2 mm | 74 |
| Westwood | Stockpile | No | 35,000 | D80 ≈ 100 mm | 64 |
| Precious Metals (ppb) | ||||||
|---|---|---|---|---|---|---|
| Ag | Au | In | Li | Pd | Pt | |
| Clarke value | 70 | 1.1 | 50 | 60,000 | 15 | 1 |
| LaRonde | 14,000 | 2534 | 1000 | 20,000 | ||
| Pirquitas | 141,000 | 42 | 30,200 | 60,000 | ||
| Raglan | 2000 | 60 | 1627 | 694 | ||
| C. Malartic | 560 | 20,000 | ||||
| Goldex | 2097 | |||||
| Kittilä | 6628 | 20,000 | ||||
| Lapa | ||||||
| Meliadine | 1000 | 4018 | 20,000 | 22 | ||
| Pinos Altos | 88,000 | 3207 | 90,000 | 30 | ||
| Westwood | 3000 | 3582 | 500 | 20,000 | ||
| Minor and Trace Elements (ppm) | ||||||||||||||||||
| As | Ba | Bi | Cd | Co | Cu | Hg | Mo | Ni | Pb | Sb | Se | Sn | Sr | Te | Tl | Zn | ||
| Clarke value | 5 | 250 | 0.2 | 0.15 | 25 | 70 | 0.007 | 1.5 | 80 | 16 | 0.2 | 0.05 | 2.2 | 375 | 0.005 | 0.45 | 75 | |
| Directive 019 | 5 | 200 | ND | 0.9 | 20 | 50 | 0.1 | 6 | 50 | 40 | ND | 3 | 5 | ND | ND | ND | 120 | |
| LaRonde | 143 | 150 | 168.8 | 3.47 | 11 | 3039 | 0.04 | 0.7 | 39 | 219 | 5.0 | <0.0004 | ND | 110 | 14 | 2.4 | 946 | |
| Pirquitas | 1160 | 360 | 122.5 | 40.0 | 10 | 307 | 0.07 | 1.1 | <0.0007 | 134 | 54.8 | 1.88 | 2280 | 460 | 2.0 | 11 | 8380 | |
| Raglan | 16 | 20 | 4.9 | 1.55 | 548 | 6033 | 0.09 | 0.6 | 24460 | 13 | 7.8 | 14.2 | ND | 20 | 4 | <0.5 | 88 | |
| C. Malartic | 17 | 700 | 5.1 | 0.09 | 16 | 122 | <0.01 | 5.3 | 20 | 25 | 22.7 | 1.56 | ND | 570 | <2 | <0.5 | 65 | |
| Goldex | 36 | 250 | 10.4 | 0.08 | 14 | 79 | 0.51 | 2.6 | 126 | 7 | 445.9 | 0.05 | ND | 460 | <2 | <0.5 | 54 | |
| Kittilä | 12,200 | 220 | 1.9 | 0.75 | 25 | 104 | 0.40 | 1.5 | 32 | 15 | 76.9 | 1.25 | ND | 120 | <2 | 1 | 153 | |
| Lapa | 1865 | 250 | <0.1 | 0.48 | 52 | 65 | <0.01 | 1.2 | 623 | 13 | 141 | <0.0004 | 1.3 | <10 | <2 | <0.5 | 114 | |
| Meliadine | 13,600 | 450 | 5.0 | 0.77 | 15 | 92 | <0.01 | 8.0 | <0.0007 | 101 | 16.8 | 0.33 | ND | 260 | <2 | <0.5 | 213 | |
| Pinos Altos | 44 | 730 | 2.8 | 1.00 | 6 | 67 | 0.82 | 1.7 | <0.0007 | 89 | 65.9 | 0.43 | ND | 100 | <2 | 1.4 | 197 | |
| Westwood | 42 | 810 | 10.1 | 7.62 | 18 | 245 | 0.02 | 1.7 | <0.0007 | 186 | 57.4 | 3.55 | ND | 110 | <2 | <0.5 | 3244 | |
| Major Elements (wt. %) | ||||||||||||||||||
| Al | Ca | Cr | Fe | K | Mg | Mn | Na | Si | Ti | S | ||||||||
| Clarke value | 0.08 | 3.6–4.1 | 0.01–0.02 | 4.1–5 | 2.1–2.5 | 2.1–2.3 | 0.04–0.16 | 2.4–2.8 | 0.45 | 0.03–0.05 | ||||||||
| Directive 019 | ND | ND | 0.0085 | ND | ND | ND | 0.1 | ND | ND | ND | ND | |||||||
| LaRonde | 5.79 | 0.30 | 0.0069 | 15.5 | 0.78 | 0.12 | 0.04 | 0.53 | 26.17 | 0.31 | 16.2 | |||||||
| Pirquitas | 7.46 | 0.16 | 0.0079 | 4.74 | 2.00 | 0.14 | 0.00 | 0.26 | 32.81 | 0.35 | 5.50 | |||||||
| Raglan | 1.20 | 0.25 | 0.2294 | 21.7 | 0.39 | 17.49 | 0.07 | 0.01 | 13.15 | 0.05 | 10.1 | |||||||
| C. Malartic | 7.79 | 1.91 | 0.0169 | 3.67 | 2.49 | 1.62 | 0.04 | 3.51 | 26.31 | 0.29 | 0.94 | |||||||
| Goldex | 8.22 | 3.55 | 0.0099 | 2.91 | 0.44 | 1.72 | 0.03 | 3.67 | 26.22 | 0.19 | 0.75 | |||||||
| Kittilä | 5.88 | 5.19 | 0.0155 | 9.67 | 1.69 | 3.39 | 0.24 | 1.22 | 21.24 | 0.98 | 3.91 | |||||||
| Lapa | 4.80 | 3.97 | 0.1008 | 6.35 | 0.96 | 9.33 | 0.10 | 0.90 | 24.01 | 0.31 | 0.45 | |||||||
| Meliadine | 5.66 | 2.42 | 0.0079 | 9.78 | 1.47 | 1.21 | 0.03 | 1.36 | 26.69 | 0.19 | 1.66 | |||||||
| Pinos Altos | 3.80 | 0.25 | 0.0074 | 2.07 | 2.46 | 0.36 | 0.07 | 0.36 | 38.51 | 0.15 | 0.11 | |||||||
| Westwood | 7.40 | 1.96 | 0.0066 | 7.06 | 2.02 | 1.39 | 0.07 | 1.06 | 28.16 | 0.40 | 5.66 | |||||||
| Polymetallic Ores | Gold Ores | |||||||||
|---|---|---|---|---|---|---|---|---|---|---|
| Mineral | Elt (%) | DDL (ppm) | LaRonde | Pirquitas | Raglan | Canadian Malartic | Goldex | Kittilä | Meliadine | Westwood |
| Pyrite | S | 53.53 ± 0.31 | 51.8 ± 3.71 | 53.2 ± 3.07 | 53.3 ± 3.07 | 50.4 ± 3.92 | 53.2 ± 3.08 | 54.1 ± 0.31 | ||
| Fe | 46.47 ± 0.44 | 46.9 ±1.79 | 46.8 ± 2.15 | 46.7 ± 2.14 | 46.3 ± 2.37 | 46.8 ± 2.15 | 45.9 ±0.44 | |||
| As | 650 | <2000 ppm | 0.83 ± 0.26 | <650 ppm | <650 ppm | 3.26 ± 0.49 | <650 ppm | <2000 ppm | ||
| Au | 1100 | NA | NA | NA | NA | <1100 ppm | NA | NA | ||
| Ag | 1400 | NA | 0.40 ± 0.25 | NA | NA | NA | NA | NA | ||
| Tl | 1500 | NA | 0.45 ± 0.27 | NA | NA | NA | NA | NA | ||
| Se | 650 | <650 ppm | NA | NA | <650 ppm | <650 ppm | NA | <650 ppm | ||
| Pyrrhotite | S | 40.0 ± 1.82 | 39.8 ± 1.81 | 39.3 ± 1.76 | ||||||
| Fe | 59.7 ± 1.94 | 60.2 ± 1.95 | 60.6 ± 1.92 | |||||||
| Co | 330 | <330 ppm | <330 ppm | <330 ppm | ||||||
| Ni | 550 | 0.37 ± 0.22 | <550 ppm | 0.10 ± 0.10 | ||||||
| Arsenopyrite | S | 21.1 ± 1.88 | 21.1 ± 1.89 | |||||||
| As | 43.9 ± 3.08 | 43.6 ± 3.08 | ||||||||
| Fe | 35.0 ± 1.90 | 35.2 ± 1.92 | ||||||||
| Au | 1300 | <1300 ppm | <1300 ppm | |||||||
| Chalcopyrite | S | 35.5 ± 1.74 | 34.7 ± 1.64 | NA | ||||||
| Cu | 34.2 ± 1.85 | 34.5 ± 1.22 | NA | |||||||
| Fe | 30.2 ± 1.39 | 30.5 ± 1.21 | NA | |||||||
| Ag | 430 | NA | <430 ppm | <430 ppm | ||||||
| As | 1700 | <1700 ppm | NA | NA | ||||||
| Sn | 700 | <700 ppm | NA | NA | ||||||
| Tl | 2000 | <2000 ppm | NA | NA | ||||||
| Te | 1600 | <1600 ppm | NA | NA | ||||||
| Cd | 500 | <500 ppm | 0.37 ± 0.10 | NA | ||||||
| Sphalerite | S | 33.1 ± 1.57 | 33.6 ± 2.53 | 33.4 ± 1.62 | ||||||
| Zn | 60.7 ± 2.33 | 63.8 ± 2.13 | 61.2 ± 2.64 | |||||||
| Fe | 950 | 4.39 ± 0.43 | 2.06 ± 0.30 | 4.31 ± 0.42 | ||||||
| Ag | 680 | NA | 0.84 ± 0.27 | NA | ||||||
| In | 475 | 0.45 ± 0.10 | 0.25 ± 0.18 | NA | ||||||
| Cd | 550 | 1.16 ± 0.09 | 0.37 ± 0.21 | 1.00 ± 0.12 | ||||||
| Mn | 400 | 0.25 ± 0.09 | NA | 0.16 ± 0.09 | ||||||
| Pb | 2600 | NA | 0.71 ± 0.65 | NA | ||||||
| Tl | 1500 | 0.1 ± 0.09 | 0.33 ± 0.22 | NA | ||||||
| Galena | S | 13.2 ± 0.32 | ||||||||
| Pb | 85.4 ± 1.06 | |||||||||
| Fe | 1.37 ± 0.20 | |||||||||
| Ag | 430 | 0.09 ± 0.04 | ||||||||
| Pentlandite | S | 33.8 ± 1.67 | ||||||||
| Fe | 30.0 ± 1.22 | |||||||||
| Ni | 35.5 ± 1.34 | |||||||||
| Co | 330 | 0.75 ± 0.08 | ||||||||
| LaRonde | Pirquitas | Raglan | ||||||
| NP (kg CaCO3/t) | Lawrence & Scheske [50] | 2 | 2 | 88 | ||||
| CNP | 0 | 6 | 8 | |||||
| CCNP | 0 | 6 | 8 | |||||
| Paktunc [51] | 0 | 0 | 0 | |||||
| Plante [52] | 0 | 0 | 0 | |||||
| AP (kg CaCO3/t) | Sobek et al. [49] | 496 | 160 | 225 | ||||
| Paktunc [51] | 483 | 158 | 205 | |||||
| Bouzahzah et al. [44] | 483 | 159 | 205 | |||||
| Chopard et al. [54] | 814 | 159 | 516 | |||||
| NNP | Paktunc [51] | −483 | −158 | −205 | ||||
| Chopard et al. [54] & Plante [52] | −814 | −159 | −516 | |||||
| NP/AP | Paktunc [51] | 0 | 0 | 0 | ||||
| Chopard et al. [54] & Plante [52] | 0 | 0 | 0 | |||||
| Canadian Malartic | Goldex | Kittilä | Lapa | Meliadine | Pinos Altos | Westwood | ||
| NP (kg CaCO3/t) | Lawrence & Scheske [50] | 55 | 105 | 134 | 101 | 127 | 5 | 31 |
| CNP | 47 | 103 | 302 | 101 | 126 | 0 | 23 | |
| CCNP | 47 | 103 | 302 | 101 | 63 | 0 | 23 | |
| Paktunc [51] | 40 | 95 | 103 | 38 | 55 | 2 | 23 | |
| Plante [52] | 40 | 96 | 109 | 47 | 55 | 2 | 23 | |
| AP (kg CaCO3/t) | Sobek et al. [49] | 29 | 23 | 122 | 14 | 52 | 3 | 177 |
| Paktunc [51] | 28 | 23 | 120 | 13 | 44 | 1 | 171 | |
| Bouzahzah et al. [44] | 28 | 23 | 142 | 15 | 73 | 0 | 166 | |
| Chopard et al. [54] | 28 | 23 | 387 | 88 | 103 | 1 | 176 | |
| NNP | Paktunc [51] | 11 | 72 | −17 | 25 | 10 | 2 | −148 |
| Chopard et al. [54] & Plante [52] | 12 | 73 | −278 | −41 | −48 | 1 | −153 | |
| NP/AP | Paktunc [51] | 1.40 | 4.12 | 0.86 | 2.89 | 1.23 | 3.66 | 0.13 |
| Chopard et al. [54] & Plante [52] | 1.41 | 4.16 | 0.28 | 0.53 | 0.54 | 2.48 | 0.13 | |
References
- EPA. Acid Mine Drainage Prediction; U.S. Environmental Protection Agency Office of Solid Waste Special Waste Branch: Washington, DC, USA, 1994.
- Natural Resources Canada NR. Evaluation Report: Green Mining Initiative; Canada NR: Ottawa, ON, Canada, 2015.
- Plante, B.; Benzaazoua, M.; Bussière, B. Predicting Geochemical Behaviour of Waste Rock with Low Acid Generating Potential Using Laboratory Kinetic Tests. Mine Water Environ. 2010, 30, 2–21. [Google Scholar] [CrossRef]
- El Adnani, M.; Plante, B.; Benzaazoua, M.; Hakkou, R.; Bouzahzah, H. Tailings Weathering and Arsenic Mobility at the Abandoned Zgounder Silver Mine, Morocco. Mine Water Environ. 2015, 35, 508–524. [Google Scholar] [CrossRef]
- Steger, H.; Desjardins, L. Oxidation of sulfide minerals, 4. Pyrite, chalcopyrite and pyrrhotite. Chem. Geol. 1978, 23, 225–237. [Google Scholar] [CrossRef]
- Steger, H.; Desjardins, L. Oxidation of sulfide minerals; V, Galena, sphalerite and chalcocite. Can. Mineral. 1980, 18, 365–372. [Google Scholar]
- Rimstidt, J.D.; Chermak, J.A.; Gagen, P.M. Rates of Reaction of Galena, Sphalerite, Chalcopyrite, and Arsenopyrite with Fe (III). in Acidic Solutions; ACS symposium series; American Chemical Society: Washington, DC, USA, 1994; pp. 2–13. [Google Scholar]
- Nicholson, R. Iron-sulfide oxidation mechanisms: Laboratory studies. Environ. Geochem. Sulphide Mine Wastes 1994, 22, 163–183. [Google Scholar]
- Morin, K.; Hutt, N.; Ferguson, K. Measured rates of sulfide oxidation and acid neutralization in humidity cells: Statistical lessons from the database. In Proceedings of the Sudbury ‘95: Mining and the Environment, Sudbury, ON, Canada, 28 May–1 June 1995. [Google Scholar]
- Thomas, J.E.; Smart, R.S.C.; Skinner, W.M. Kinetic factors for oxidative and non-oxidative dissolution of iron sulfides. Miner. Eng. 2000, 13, 1149–1159. [Google Scholar] [CrossRef]
- Frostad, S.; Klein, B.; Lawrence, R.W. Evaluation of Laboratory Kinetic Test Methods for Measuring Rates of Weathering. Mine Water Environ. 2002, 21, 183–192. [Google Scholar] [CrossRef]
- Chopard, A.; Benzaazoua, M.; Plante, B.; Bouzahzah, H.; Marion, P. Kinetic tests to evaluate the relative oxidation rates of various sulfides and sulfosalts. In Proceedings of the 10th ICARD Conference on Acid Rock Drainage, and IMWA, Santiago, Chile, 21–24 April 2015. [Google Scholar]
- Diehl, S.; Hageman, P.L.; Smith, K.S. What’s weathering? Mineralogy and field leach studies in mine waste, Leadville and Montezuma mining districts, Colorado. In Proceedings of the 7th International Conference on Acid Rock Drainage (ICARD 7), St. Louis, MO, USA, 26–30 March 2006; pp. 507–527. [Google Scholar]
- Petruk, W. Applied Mineralogy in the Mining Industry; Elsevier: Amsterdam, The Netherlands, 2000. [Google Scholar]
- Kwong, Y.J.; Swerhone, G.W.; Lawrence, J.R. Galvanic sulphide oxidation as a metal-leaching mechanism and its environmental implications. Geochem. Explor. Environ. Anal. 2003, 3, 337–343. [Google Scholar] [CrossRef]
- Cruz, R.; Luna-Sánchez, R.M.; Lapidus, G.T.; González, I.; Monroy, M. An experimental strategy to determine galvanic interactions affecting the reactivity of sulfide mineral concentrates. Hydrometallurgy 2005, 78, 198–208. [Google Scholar] [CrossRef]
- Liu, Q.; Li, H.; Zhou, L. Galvanic interactions between metal sulfide minerals in a flowing system: Implications for mines environmental restoration. Appl. Geochem. 2008, 23, 2316–2323. [Google Scholar] [CrossRef]
- Lottermoser, B. Mine Wastes: Characterization, Treatment and Environmental Impacts; Springer: Berlin, Germany, 2010. [Google Scholar]
- Parbhakar-Fox, A.K.; Edraki, M.; Walters, S.; Bradshaw, D. Development of a textural index for the prediction of acid rock drainage. Miner. Eng. 2011, 24, 1277–1287. [Google Scholar] [CrossRef]
- Brough, C.P.; Warrender, R.; Bowell, R.J.; Barnes, A.; Parbhakar-Fox, A. The process mineralogy of mine wastes. Miner. Eng. 2013, 52, 125–135. [Google Scholar] [CrossRef]
- Dold, B. Pre-mining Characterization of Ore Deposits: What Information Do We Need to Increase Sustainability of the Mining Process? In Proceedings of the 10th International Conference on Acid Rock Drainage (ICARD) & IMWA Annual Conference, Santiago, Chile, 21–24 April 2015. [Google Scholar]
- Parbhakar-Fox, A.; Lottermoser, B.; Bradshaw, D. Evaluating waste rock mineralogy and microtexture during kinetic testing for improved acid rock drainage prediction. Miner. Eng. 2013, 52, 111–124. [Google Scholar] [CrossRef]
- Bouzahzah, H.; Benzaazoua, M.; Bussière, B.; Plante, B. Revue de Littérature Détaillée sur les Tests Statiques et les Essais Cinétiques Comme Outils de Prédiction du Drainage Minier Acide. Déchets Sciences et Techniques Techniques. 2014, pp. 14–31. Available online: http://lodel.irevues.inist.fr/dechets-sciences-technique/docannexe/file/340/2_bouzahzah.pdf (accessed on 27 June 2019).
- Goodall, W.R.; Cropp, A. Integrating Mineralogy into Everyday Solutions; MinAssist: Carlton, Australia, 2013. [Google Scholar]
- Paktunc, A.D. Characterization of Mine Wastes for Prediction of Acid Mine Drainage Environmental Impacts of Mining Activities; Springer: Berlin, Germany, 1999; pp. 19–40. [Google Scholar]
- Bouzahzah, H.; Benzaazoua, M.; Mermillod-Blondin, R.; Pirard, E. A novel procedure for polished section preparation for automated mineralogy avoiding internal particle settlement. In Proceedings of the 12th International Congress for Applied Mineralogy (ICAM), Istanbul, Turkey, 10–12 August 2015. [Google Scholar]
- Merkus, H.G. Particle Size Measurements: Fundamentals, Practice, Quality; Springer Science & Business Media: Berlin, Germany, 2009. [Google Scholar]
- Couture, R.A. An improved fusion technique for major-element rock analysis by XRF. Adv. X-ray Anal. 1989, 32, 233–238. [Google Scholar]
- Alvarez, M. Glass disk fusion method for the X-ray fluorescence analysis of rocks and silicates. X-ray Spectrom. 1990, 19, 203–206. [Google Scholar] [CrossRef]
- Spangenberg, J.; Fontbote, L.; Pernicka, E. X-Ray fluorescence analysis of base metal sulphide and iron-manganese oxide ore samples in fused glass disc. X-ray Spectrom. 1994, 23, 83–90. [Google Scholar] [CrossRef]
- Claisse, F. Glass Disks and Solutions by Fusion in Borates for Users of Claisse Fluxers; Corporation Scientific Claisse Inc.: Sainte-Foy, QC, Canada, 1995. [Google Scholar]
- Young, D.S.; Sachais, B.S.; Jefferies, L.C. The Rietveld Method; International union of crystallography: Chester, UK, 1993. [Google Scholar]
- Raudsepp, M.; Pani, E. Application of Rietveld analysis to environmental mineralogy. Environ. Asp. Mine Wastes 2003, 31, 165–180. [Google Scholar]
- Bouzahzah, H.; Califice, A.; Benzaazoua, M.; Mermillod-Blondin, R.; Pirard, E. Modal analysis of mineral blends using optical image analysis versus X ray diffraction. In Proceedings of the International Congress for Applied Mineralogy ICAM08, Brisbane, Australia, 8–10 September 2008; AusIMM: Carlton, Australia, 2008. [Google Scholar]
- Cruz, R.; Bertrand, V.; Monroy, M.; González, I. Effect of sulfide impurities on the reactivity of pyrite and pyritic concentrates: A multi-tool approach. Appl. Geochem. 2001, 16, 803–819. [Google Scholar] [CrossRef]
- Villeneuve, M.; Bussière, B.; Benzaazoua, M.; Aubertin, M. Assessment of interpretation methods for kinetic tests performed on tailings having a low acid generating potential. In Proceedings of the 8th International Conference on Acid Rock Drainage was held in Conjunction with Securing the Future, Skelleftea, Sweden, 23–26 June 2009. [Google Scholar]
- Plante, B.; Benzaazoua, M.; Bussière, B. Kinetic Testing and Sorption Studies by Modified Weathering Cells to Characterize the Potential to Generate Contaminated Neutral Drainage. Mine Water Environ. 2011, 30, 22–37. [Google Scholar] [CrossRef]
- Bouzahzah, H.; Benzaazoua, M.; Bussiere, B.; Plante, B. Prediction of acid mine drainage: Importance of mineralogy and the test protocols for static and kinetic tests. Mine Water Environ. 2014, 33, 54–65. [Google Scholar] [CrossRef]
- Clarke, F.W. The Data of Geochemistry; US Government Printing Office: Washington, DC, USA, 1920.
- Taylor, S. Abundance of chemical elements in the continental crust: A new table. Geochimica et Cosmochimica Acta 1964, 28, 1273–1285. [Google Scholar] [CrossRef]
- Benzaazoua, M.; Marion, P.; Robaut, F.; Pinto, A. Gold-bearing arsenopyrite and pyrite in refractory ores: Analytical refinements and new understanding of gold mineralogy. Mineral. Mag. 2007, 71, 123–142. [Google Scholar] [CrossRef]
- Blackburn, W.H.; Schwendeman, J.F. Trace-element substitution in galena. Can. Mineral. 1977, 15, 365. [Google Scholar]
- George, L.; Cook, N.J.; Cristiana, L.; Wade, B.P. Trace and minor elements in galena: A reconnaissance LA-ICP-MS study. Am. Mineral. 2015, 100, 548–569. [Google Scholar] [CrossRef]
- Bouzahzah, H.; Benzaazoua, M.; Bussière, B. Acid-generating potential calculation using mineralogical static test: Modification of the Paktunc equation. In Proceedings of the 23rd World Mining Congress (WMC 2013), Montréal, QC, Canada, 11–15 August 2013. [Google Scholar]
- Mermillod-Blondin, R.; Benzaazoua, M.H.B.; Leroux, D. Development and calibration of a reconciliated mineralogy method based on multitechnique analyses: Application to acid mine drainage prediction. In Proceedings of the 28th International Mineral Processing Congress (IMPC), Québec, QC, Canada, 11–15 September 2016. [Google Scholar]
- Chopard, A.; Marion, P.; Royer, J.J.; Taza, R.; Bouzahzah, H.; Benzaazoua, M. Automated sulfides quantification by multispectral optical microscopy. Miner. Eng. 2019, 131, 38–50. [Google Scholar] [CrossRef]
- Chopard, A.; Plante, B.; Benzaazoua, M.; Bouzahzah, H.; Marion, P. Geochemical investigation of the galvanic effects during oxidation of pyrite and base-metals sulfides. Chemosphere 2017, 166, 281–291. [Google Scholar] [CrossRef] [PubMed]
- Kwong, Y.-T.J. Prediction and Prevention of Acid Rock Drainage from a Geological and Mineralogical Perspective. MEND, 1993. Available online: http://mend-nedem.org/wp-content/uploads/1.32.1.pdf (accessed on 27 June 2019).
- Sobek, A.A.; Schuller, W.; Freeman, J.; Smith, R. Field and Laboratory Methods Applicable to Overburdens and Minesoils; US Environmental Protection Agency: Cincinnati, OH, USA, 1978; Volume 45268, pp. 47–50.
- Lawrence, R.W.; Scheske, M.A. Method to calculate the neutralization potential of mining wastes. Environ. Geol. 1997, 32, 100–106. [Google Scholar] [CrossRef]
- Paktunc, A.D. Mineralogical constraints on the determination of neutralization potential and prediction of acid mine drainage. Environ. Geol. 1999, 39, 103–112. [Google Scholar] [CrossRef]
- Plante, B.; Bussière, B.; Benzaazoua, M. Static tests response on 5 Canadian hard rock mine tailings with low net acid-generating potentials. J. Geochem. Explor. 2012, 114, 57–69. [Google Scholar] [CrossRef]
- Frostad, S.R.; Price, W.A.; Bent, H. Operational NP determination—Accounting for iron manganese carbonates and developing a site-specific fizz rating. In Proceedings of the Sudbury ’95: Mining and the Environment III, Sudbury, ON, Canada, 28 May–1 June 1995. [Google Scholar]
- Chopard, A.; Benzaazoua, M.; Bouzahzah, H.; Plante, B.; Marion, P. A contribution to improve the calculation of the acid generating potential of mining wastes. Chemosphere 2017, 175, 97–107. [Google Scholar] [CrossRef]
- Ferguson, K.D.; Morin, K.A. The prediction of acid rock drainage—Lessons from the database. In Proceedings of the Second International Conference on the Abatement of Acidic Drainage, Montreal, QC, Canada, 16–18 September 1991; Quebec Mining Association: Quebec City, QC, Canada. [Google Scholar]
- Price, W.A.; Morin, K.; Hutt, N. Guidelines for the prediction of acid rock drainage and metal leaching for mines in British Columbia: Part II. Recommended procedures for static and kinetic testing. In Proceedings of the 4th International Conference on Acid Rock Drainage, Vancouver, BC, Canada, 31 May–6 June 1997; pp. 15–30. [Google Scholar]
- Sherlock, E.J.; Lawence, R.W.; Poulin, R. On the neutralization of acid rock drainage by carbonate and silicate minerals. Int. J. Rock Mech. Min. Sci. Geomech. Abstr. 1995, 32, 43–54. [Google Scholar] [CrossRef]
- GARD G 2.4. The Acid Generation Process; INAP: Atlanta, GA, USA, 2016. [Google Scholar]
- Benzaazoua, M.; Bussière, B.; Dagenais, A. Comparison of kinetic tests for sulfide mine tailings. In Proceedings of the English International Conference on Tailings and Mine waste 01, Fort Collins, CO, USA, 16–19 January 2001; Balkema: Danvers, MA, USA, 2001; pp. 263–272. [Google Scholar]
- Benzaazoua, M.; Bussière, B.; Dagenais, A.-M.; Archambault, M. Kinetic tests comparison and interpretation for prediction of the Joutel tailings acid generation potential. Environ. Geol. 2004, 46, 1086–1101. [Google Scholar] [CrossRef]


| Mine’s Name | Country | Ore Type | Host Rock | Mineralization | Main Product | By-product(s) |
|---|---|---|---|---|---|---|
| LaRonde | Canada | Volcanogenic massive sulfide (VMS) | Metamorphic volcanic rocks | Massive and disseminated sulfide lenses | Au | Ag, Cu, Pb, Zn |
| Pirquitas | Argentina | Epithermal Ag-Sn | Low-grade metamorphosed marine sandstone, siltstone and minor shale beds | Sulfide and quartz sulfide vein systems | Ag | Sn, Zn |
| Raglan | Canada | Komatiite Ni-Cu-Platinum-group element | Mafic and ultramafic volcanic rocks (peridotite) | Magmatic immiscibility sulfides lenses associated with ultramafic flows | Ni | Co, Cu, Pd, Pt, Rh |
| C. Malartic | Canada | Archean porphyry gold system | Potassic-altered, silicified greywackes, altered porphyry and gabbro dykes and ultramafic rocks | Widespread shell of disseminated gold-bearing pyrite | Au | |
| Goldex | Canada | Shear zone gold | Granodiorite | Stockwork veins; microscopic gold within pyrite and coarse native gold | Au | |
| Kittilä | Finland | Shear zone gold | Mafic volcanic and sedimentary rocks | Structural gold in arsenopyrite and pyrite | Au | |
| Lapa | Canada | Shear zone gold | Volcanic rocks | Quartz veins, tabular zones, biotite-altered zones | Au | Ag |
| Meliadine | Canada | Shear zone gold | Sedimentary and volcanic sequences | Sulfide quartz veins, quartz lodes and sulfide replacement | Au | |
| Pinos Altos | Mexico | Epithermal Au-Ag | Volcanic and intrusive rocks (Andesite and ignimbrite) | Low sulfidation epithermal type hydrothermal quartz veins, stockworks and breccias | Au | Ag |
| Westwood | Canada | Volcanogenic massive sulfide (VMS) | Metamorphic volcanic rocks | Sulfide quartz veins, disseminated and semi-massive to massive sulfide lenses | Au |
| LaRonde | |||
| Elements | Grade (ppm) | Observed Bearing Minerals | Formula |
| Cu ** | 3039 | Chalcopyrite | CuFeS2 |
| Stannite | Cu2FeSnS4 | ||
| Ferrokesterite | Cu2(Fe,Zn)SnS4 | ||
| Freibergite | (Ag,Cu,Fe)12 (Sb,As)4S13 | ||
| Tetrahedrite | (Cu,Fe)12Sb4S13 | ||
| Zn ** | 946 | Sphalerite | (Zn,Fe)S |
| Ferrokesterite | Cu2(Fe,Zn)SnS4 | ||
| Pb | 219 | Galena | PbS |
| Bi | 169 | Bismuth | Bi |
| Kawazulite | Bi2(Te,Se,S)3 | ||
| As | 143 | Arsenopyrite | FeAsS |
| Freibergite | (Ag,Cu,Fe)12 (Sb,As)4S13 | ||
| Sn | 22 | Stannite | Cu2FeSnS4 |
| Ferrokesterite | Cu2(Fe,Zn)SnS4 | ||
| Ag * | 14 | Electrum | (Ag,Au) |
| Freibergite | (Ag,Cu,Fe)12 (Sb,As)4S13 | ||
| Chalcopyrite | CuFeS2 | ||
| Te | 14 | Benleonardite | Ag8(Sb,As)Te2S3 |
| Kawazulite | Bi2(Te,Se,S)3 | ||
| Sb | 5 | Freibergite | (Ag,Cu,Fe)12 (Sb,As)4S13 |
| Tetrahedrite | (Cu,Fe)12Sb4S13 | ||
| Benleonardite | Ag8(Sb,As)Te2S3 | ||
| Cd | 3.5 | Sphalerite | (Zn,Fe)S |
| Au * | 2.5 | Electrum | (Ag,Au) |
| Tl | 2.4 | ||
| In | 1 | Sphalerite | (Zn,Fe)S |
| Pirquitas | |||
| Elements | Grade (ppm) | Observed Bearing Minerals | Formula |
| Zn | 8380 | Sphalerite | (Zn,Fe)S |
| Freibergite | (Ag,Cu,Fe)12(Sb,As)4S13 | ||
| Sn | 2280 | Cassiterite | SnO2 |
| Kesterite | Cu2(Zn,Fe)SnS4 | ||
| Solid solution hocartite-pirquitasite | Ag2(Fe,Zn)SnS4 | ||
| As | 1160 | Arsenopyrite | FeAsS |
| Pyrite | (Fe,As)S | ||
| Freibergite | (Ag,Cu,Fe)12(Sb,As)4S13 | ||
| Sr | 460 | ||
| Ba | 360 | ||
| Cu | 307 | Freibergite | (Ag,Cu,Fe)12(Sb,As)4S13 |
| Ag * | 141 | Galena | (Pb,Ag)S |
| Aramayoite | Ag3Sb2(Sb,Bi)S6 | ||
| Acanthite | Ag2S | ||
| Matildite | AgBiS2 | ||
| Pyrargyrite | Ag3SbS3 | ||
| Freibergite | (Ag,Cu,Fe)12(Sb,As)4S13 | ||
| Owyheeite | Pb7Ag2(Sb,Bi)8S20 | ||
| Pb | 134 | Owyheeite | Pb7Ag2(Sb,Bi)8S20 |
| Galena | (Pb,Ag)S | ||
| Bi | 123 | Galena | (Pb,Ag)S |
| Aramayoite | Ag3Sb2(Sb,Bi)S6 | ||
| Owyheeite | Pb7Ag2(Sb,Bi)8S20 | ||
| Matildite | AgBiS2 | ||
| Sb | 54.8 | Freibergite | (Ag,Cu,Fe)12(Sb,As)4S13 |
| Aramayoite | Ag3Sb2(Sb,Bi)S6 | ||
| Pyrargyrite | Ag3SbS3 | ||
| Owyheeite | Pb7Ag2(Sb,Bi)8S20 | ||
| Cd | 40 | Sphalerite | (Zn,Fe)S |
| Kesterite | Cu2(Zn,Fe)SnS4 | ||
| In ** | 30.2 | Sphalerite | (Zn,Fe)S |
| Cassiterite | SnO2 | ||
| Se | 25.4 | ||
| Tl | 11 | ||
| Te | 1.88 | ||
| Hg | 0.07 | ||
| Au | 0.04 | ||
| Raglan | |||
| Elements | Grade (ppm) | Observed Bearing Minerals | Formula |
| Ni * | 24,460 | Pentlandite | (Fe,Ni)9S8 |
| Pyrrhotite | Fe0.86S | ||
| Cu ** | 6033 | Chalcopyrite | CuFeS2 |
| Cr | 2300 | Chromite | Fe2+Cr2O4 |
| Co | 548 | Pentlandite | (Fe,Ni)9S8 |
| Zn | 88 | ||
| As | 16 | ||
| Se | 14.2 | ||
| Sb | 7.8 | ||
| Bi | 4.9 | ||
| Te | 4 | ||
| Ag | 2 | ||
| Cd | 1.55 | ||
| Pt ** | 0.69 | Sperrylite | PtAs2 |
| Hg | 0.09 | ||
| Au | 0.06 | ||
| Canadian Malartic | |||
| Elements | Grade (ppm) | Observed Bearing Minerals | Formula |
| Ba | 700 | Barite | BaSO4 |
| Sr | 570 | Barite | BaSO4 |
| Cu | 122 | Chalcopyrite | CuFeS2 |
| Pb | 25 | Galena | PbS |
| Sb | 23 | ||
| As | 17 | ||
| Mo | 5.3 | ||
| Bi | 5.1 | ||
| Se | 1.6 | ||
| Au | 0.56 | Free grains | Au |
| Goldex | |||
| Elements | Grade (ppm) | Observed Bearing Minerals | Formula |
| Sr | 460 | ||
| Sb | 446 | ||
| Ni | 126 | Crusher pieces | |
| Cu | 79 | Chalcopyrite | CuFeS2 |
| As | 36 | Arsenopyrite | FeAsS |
| Bi | 10.4 | ||
| Mo | 2.6 | ||
| Au | 2.1 | ||
| Hg | 0.51 | ||
| Lapa | |||
| Elements | Grade (ppm) | Observed Bearing Minerals | Formula |
| As | 1865 | Arsenopyrite | FeAsS |
| Ullmannite | Ni(Sb,As)S | ||
| Gersdorffite-Fe | (Ni,Fe,Co)AsS | ||
| Ni | 623.1 | Pentlandite | (Fe,Ni)9S8 |
| Pyrrhotite | Fe0.93S | ||
| Sb | 140.7 | Ullmannite | Ni(Sb,As)S |
| Berthierite | FeSb2S4 | ||
| Se | 139 | ||
| Zn | 115 | Sphalerite | (Zn,Fe)S |
| Co | 52 | Gersdorffite | (Ni,Fe,Co)AsS |
| Pinos Altos | |||
| Elements | Grade (ppm) | Observed Bearing Minerals | Formula |
| Ba | 730 | Barite | BaSO4 |
| Coronadite | Pb(Mn4+,Mn2+)8O16 | ||
| Zn | 197 | Sphalerite | (Zn,Fe)S |
| Li | 90 | ||
| Ni | 89 | Argentopentlandite | Ag(Fe,Ni)8S8 |
| Ag | 88 | Lenaite | AgFeS2 |
| Argentopyrite | AgFe2S3 | ||
| Argentojarosite | AgFe3+(SO4)2(OH)6 | ||
| Free grains | Ag | ||
| Pb | 66 | Coronadite | Pb(Mn4+,Mn2+)8O16 |
| As | 44 | Pyrite | (Fe,As)S2 |
| Au | 3.2 | Free grains | Au |
| Bi | 2.8 | ||
| Mo | 1.7 | ||
| Tl | 1.4 | ||
| Cd | 1 | ||
| Hg | 0.82 | ||
| Se | 0.43 | Lenaite | AgFeS2 |
| Pt | 0.03 | ||
| Kittilä | |||
| Elements | Grade (ppm) | Observed Bearing Minerals | Formula |
| As | 12,200 | Arsenopyrite | FeAsS |
| Pyrite | (Fe,As)S2 | ||
| Gersdorffite | (Ni,Co)AsS | ||
| Mn | 2400 | Clinochlore | |
| Zn | 197 | Sphalerite | (Zn,Fe)S |
| Cu | 104 | Chalcopyrite | CuFeS2 |
| Tetrahedrite | (Cu,Fe)12Sb4S13 | ||
| Sb | 77 | Ullmannite | NiSbS |
| Tetrahedrite | (Cu,Fe)12Sb4S13 | ||
| Au | 6.63 | Free grains | Au |
| Arsenopyrite | FeAsS | ||
| Se | 1.3 | ||
| Tl | 1 | ||
| Hg | 0.4 | ||
| Cd | 0.75 | ||
| Meliadine | |||
| Elements | Grade (ppm) | Observed Bearing Minerals | Formula |
| As | 13,600 | Arsenopyrite | FeAsS |
| Pyrite | (Fe,As)S2 | ||
| Ba | 450 | Barite | BaSO4 |
| Zn | 213 | Sphalerite | (Zn,Fe)S |
| Pb | 101 | Galena | PbS |
| Cu | 92 | Chalcopyrite | CuFeS2 |
| Sb | 17 | ||
| Mo | 8 | ||
| Bi | 5 | ||
| Au | 4.0 | Arsenopyrite | FeAsS |
| Free grains | Au | ||
| Electrum | (Ag,Au) | ||
| Ag | 1 | Galena | PbS |
| Electrum | (Ag,Au) | ||
| Cd | 0.77 | Chalcopyrite | CuFeS2 |
| Se | 0.33 | ||
| Pt | 0.02 | ||
| Westwood | |||
| Elements | Grade (ppm) | Observed Bearing Minerals | Formula |
| Zn | 3244 | Sphalerite | (Zn,Fe)S |
| Ba | 810 | Barite | BaSO4 |
| Cu | 245 | Chalcopyrite | CuFeS2 |
| Cubanite | CuFe2S3 | ||
| Pb | 186 | Altaite | PbTe |
| Plumbotellurite | PbTe4+O3 | ||
| Kochkarite | PbBi4Te7 | ||
| Sb | 57 | ||
| As | 42 | Arsenopyrite | FeAsS |
| Bi | 10 | Kochkarite | PbBi4Te7 |
| Cd | 7.6 | Sphalerite | (Zn,Fe)S |
| Se | 3.6 | ||
| Au | 3.6 | Free grains | Au |
| Lenaite | AgFeS2 | ||
| Ag | 3 | Argentopyrite | AgFe2S3 |
| Lenaite | AgFeS2 | ||
| Mo | 1.7 | ||
| In | 0.5 | ||
| Hg | 0.02 | ||
| Polymetallic Ores | ||||||||
| Dana Class | LaRonde | Pirquitas | Raglan | |||||
| Group | Minerals | (wt. %) | (wt. %) | (wt. %) | ||||
| Sulfides | Arsenopyrite | 0.03 | 0.08 | |||||
| Chalcopyrite | 0.89 | 1.72 | ||||||
| Galena | 0.03 | |||||||
| Pentlandite | 6.86 | |||||||
| Pyrite | 26.82 | 9.66 | ||||||
| Pyrrhotite | 3.99 | 18.34 | ||||||
| Sphalerite | 0.16 | 1.08 | ||||||
| Stannite | 0.10 | |||||||
| Plagioclases | Albite | |||||||
| Labradorite | 2.19 | |||||||
| Chlorites | Chamosite | 0.93 | ||||||
| Clinochlore | 0.90 | 10.40 | ||||||
| Sulfates | Anhydrite | 0.32 | ||||||
| Barite | 0.06 | |||||||
| Micas | Biotite | 0.48 | ||||||
| Muscovite | 7.55 | 18.22 | ||||||
| Paragonite | 7.5 | |||||||
| Oxides | Cassiterite | 0.25 | ||||||
| Hematite | ||||||||
| Magnetite | 5.29 | |||||||
| Quartz | 46.27 | 49.75 | ||||||
| Rutile | 0.52 | 0.58 | ||||||
| Ilmenite | ||||||||
| Serpentine | Antigorite | 16.77 | ||||||
| Lizardite | 40.62 | |||||||
| Kaolinite | Dickite | 15.51 | ||||||
| Kaolinite | 2.4 | |||||||
| Phosphates | Apatite | 0.25 | ||||||
| Zeolite | Gobbinsite | 3.51 | ||||||
| TOTAL | 100.01 | 100.02 | 100.00 | |||||
| Gold Ores | ||||||||
| Dana class | Canadian Malartic | Goldex | Kittilä | Lapa | Meliadine | Pinos Altos | Westwood | |
| Group | Minerals | (wt. %) | (wt. %) | (wt. %) | (wt. %) | (wt. %) | (wt. %) | (wt. %) |
| Sulfides | Arsenopyrite | 2.45 | 0.25 | 3.12 | ||||
| Chalcopyrite | 0.04 | 0.03 | 0.03 | 0.07 | ||||
| Galena | 0.01 | 0.02 | ||||||
| Pentlandite | 0.06 | |||||||
| Pyrite | 1.71 | 1.41 | 4.46 | 0.10 | 0.84 | 0.02 | 10.03 | |
| Pyrrhotite | 2.83 | 0.86 | 1.00 | |||||
| Sphalerite | 0.03 | 0.02 | 0.04 | 0.03 | 0.57 | |||
| Ullmannite | 0.01 | 0.02 | ||||||
| Sulfosalt | Gersdorffite | 0.10 | ||||||
| Plagioclases | Albite | 42.25 | 39.34 | 14.65 | 16.38 | 1.66 | 12.82 | |
| Labradorite | 0.00 | |||||||
| Chlorites | Chamosite | 7.85 | 6.73 | 6.19 | 10.47 | 3.97 | ||
| Clinochlore | 0.00 | 7.64 | 2.34 | |||||
| Carbonates | Ankerite | 1.08 | 9.14 | 13.83 | 1.20 | |||
| Calcite | 3.24 | 9.22 | 0.00 | 5.14 | 0.23 | 2.30 | ||
| Dolomite | 1.34 | 14.35 | ||||||
| Siderite | 0.10 | 7.31 | ||||||
| Gold Ores | ||||||||
| Dana class | Canadian Malartic | Goldex | Kittilä | Lapa | Meliadine | Pinos Altos | Westwood | |
| Group | Minerals | (wt. %) | (wt. %) | (wt. %) | (wt. %) | (wt. %) | (wt. %) | (wt. %) |
| Sulfates | Barite | 0.12 | 0.12 | 0.14 | ||||
| Epidote | Epidote | 4.93 | ||||||
| Pyrophyllite | Talc | 26.46 | ||||||
| Micas | Biotite | 7.08 | 0.23 | 5.84 | 10.64 | |||
| Muscovite | 4.25 | 11.91 | 15.02 | 7.15 | 20.56 | |||
| Siderophyllite | ||||||||
| Oxides | Hematite | 2.85 | 2.57 | |||||
| Magnetite | 1.65 | |||||||
| Quartz | 22.24 | 20.74 | 26.05 | 16.93 | 36.94 | 66.36 | 43.47 | |
| Rutile | 0.48 | 0.32 | 1.63 | 0.52 | 0.25 | 0.67 | ||
| Tourmaline | Dravite | 16.68 | ||||||
| Smectite | Montmorillonite | 5.51 | ||||||
| Feldspaths | Microcline | |||||||
| Orthoclase | 13.19 | 12.53 | ||||||
| Phosphates | Apatite | 0.48 | 0.45 | |||||
| Cordierite | Cordierite | 20.02 | ||||||
| Sodalite | Lazurite | 1.22 | ||||||
| TOTAL | 99.54 | 100.00 | 100.15 | 100.00 | 99.17 | 99.99 | 100.00 | |
| Kittilä | Average pH = 8.0 | Meliadine | Average pH = 8.1 | Westwood | Average pH = 7.7 | |||||
| Element | Solid content (in ppm) | Leachates Average Content (in mg/L) | Leachates Median Content (in mg/L) | Resurgence Criterion (mg/L) | Solid Content (in ppm) | Leachates Average Content (in mg/L) | Leachates Median Content (in mg/L) | Solid Content (in ppm) | Leachates Average Content (in mg/L) | Leachates Median Content (in mg/L) |
| S | 39,600 | 31.2 | 12.1 | 16,600 | 32.8 | 15.3 | 56,600 | 186 | 104 | |
| As | 12,200 | 0.2 | 0.2 | 0.34 | 13,600 | 0.07 | 0.07 | 42 | 0 | 0 |
| Cd | 0.75 | 0 | 0 | 0.0021 | 0.77 | 0 | 0 | 7.6 | 0 | 0 |
| Cu | 104 | 0.003 | 0.003 | 0.0073 | 92 | 0.01 | 0.01 | 245 | 0.03 | 0.01 |
| Fe | 96,700 | 0.02 | 0.02 | 97,800 | 0.01 | 0.01 | 70,600 | 0.02 | 0.02 | |
| Mn | 2430 | 0.03 | 0.03 | 320 | 0.02 | 0.01 | 660 | 0.45 | 0.42 | |
| Ni | 32 | 0.01 | 0.01 | 0.26 | 0 | 0 | 0 | 0 | 0 | 0 |
| Sb | 77 | 0 | 0 | 0.088 | 17 | 0 | 0 | 57 | 0 | 0 |
| Sr | 120 | 0.06 | 0.04 | 260 | 0.14 | 0.12 | 110 | 0.42 | 0.28 | |
| Te | NA | 0.003 | 0.001 | NA | 0.002 | 0 | NA | 0.002 | 0.001 | |
| Zn | 153 | 0.01 | 0.01 | 0.067 | 213 | 0.012 | 0.011 | 3244 | 0.21 | 0.13 |
| LaRonde | Average pH = 4.2 | Pirquitas | Average pH = 4.2 | |||||||
| Element | Solid Content (in ppm) | Leachates Average Content (in mg/L) | Leachates Median Content (in mg/L) | Resurgence Criterion (in mg/L) | Solid Content (in ppm) | Leachates Average Content (in mg/L) | Leachates Median Content (in mg/L) | |||
| S | 162,000 | 189 | 88 | 55,000 | 114 | 85.5 | ||||
| As | 143 | 0 | 0 | 0.34 | 1160 | 0.26 | 0.24 | |||
| Cd | 3.5 | 0.05 | 0.04 | 0.0021 | 40 | 0.73 | 0.73 | |||
| Cu | 3039 | 5.09 | 5.67 | 0.0073 | 307 | 0.92 | 1.07 | |||
| Fe | 155,000 | 18.35 | 11.07 | 47,400 | 18.04 | 10.6 | ||||
| Mn | 401 | 1.25 | 0.62 | 32 | 1.62 | 0.24 | ||||
| Ni | 40 | 0.12 | 0.11 | 0.26 | 0 | 0.47 | 0.4 | |||
| Sb | 5 | 0.02 | 0.02 | 0.088 | 55 | 0.1 | 0.07 | |||
| Sr | 110 | 0.26 | 0.1 | 460 | 0.05 | 0.01 | ||||
| Te | 14 | 0.004 | 0.002 | 1.9 | 0.002 | 0 | ||||
| Zn | 946 | 10.85 | 9.88 | 0.067 | 8380 | 97.3 | 86.7 | |||
| Yields after 100 Days of Testing | |||||||
| Ore | LaRonde | Kittilä | Pirquitas | Meliadine | Westwood | ||
| Elements | Pure mineral | pH100 | 3.4 | 8.2 | 3.7 | 8.3 | 8 |
| SO42− | - | η pure mineral | 1.5% | 1.0% | 2.4% | 2.8% | 5.8% |
| Zn | Sphalerite | 1.0% | 20.6% | 0.08% | 14.1% | 0.09% | 0.12% |
| Cd | Sphalerite | 0.17% | 25.4% | 2.4% | 22% | - | - |
| Cu | Chalcopyrite | 3.5% | 3.4% | - | 3.7% | 0.1% | 0.03% |
| Pb | Galena | 0.27% | 5% | - | - | - | - |
| Co | - | - | 3.3% | - | - | - | - |
| As | Arsenopyrite | 7.4% | - | 0.02% | 0.28% | 0.01% | - |
| Sb | - | - | 7.5% | - | 2.1% | - | - |
| Reactivity Rates, from 40 to 100 Days | |||||||
| Ore | LaRonde | Kittilä | Pirquitas | Meliadine | Westwood | ||
| Elements | Pure mineral | r pure mineral | |||||
| SO42− | - | 8.30 × 10⁻⁵ | 3.54 × 10⁻⁵ | 2.09 × 10⁻⁴ | 9.49 × 10⁻⁵ | 1.85 × 10⁻⁴ | |
| Zn | Sphalerite | 8.73 × 10⁻⁵ | 1.87 × 10⁻³ | 8.71 × 10⁻⁶ | 9.20 × 10⁻⁴ | 7.57 × 10⁻⁶ | 5.80 × 10⁻⁶ |
| Cd | Sphalerite | 2.16 × 10⁻⁵ | 2.48 × 10⁻³ | 5.22 × 10⁻⁴ | 1.46 × 10⁻³ | - | - |
| Cu | Chalcopyrite | 4.21 × 10⁻⁵ | 4.00 × 10⁻⁴ | - | 6.01 × 10⁻⁴ | 2.23 × 10⁻⁶ | - |
| Pb | Galena | 3.28 × 10⁻⁵ | 4.82 × 10⁻⁴ | - | - | - | |
| Co | - | - | 2.23 × 10⁻⁴ | - | 5.65 × 10⁻⁴ | - | 1.78 × 10⁻⁵ |
| As | Arsenopyrite | 5.77 × 10⁻⁴ | - | 2.37 × 10⁻⁴ | 2.35 × 10⁻⁵ | 8.44 × 10⁻⁷ | - |
| Sb | - | - | 5.32 × 10⁻⁴ | - | 1.02 × 10⁻⁴ | - | - |
© 2019 by the authors. Licensee MDPI, Basel, Switzerland. This article is an open access article distributed under the terms and conditions of the Creative Commons Attribution (CC BY) license (http://creativecommons.org/licenses/by/4.0/).
Share and Cite
Chopard, A.; Marion, P.; Mermillod-Blondin, R.; Plante, B.; Benzaazoua, M. Environmental Impact of Mine Exploitation: An Early Predictive Methodology Based on Ore Mineralogy and Contaminant Speciation. Minerals 2019, 9, 397. https://doi.org/10.3390/min9070397
Chopard A, Marion P, Mermillod-Blondin R, Plante B, Benzaazoua M. Environmental Impact of Mine Exploitation: An Early Predictive Methodology Based on Ore Mineralogy and Contaminant Speciation. Minerals. 2019; 9(7):397. https://doi.org/10.3390/min9070397
Chicago/Turabian StyleChopard, Aurélie, Philippe Marion, Raphaël Mermillod-Blondin, Benoît Plante, and Mostafa Benzaazoua. 2019. "Environmental Impact of Mine Exploitation: An Early Predictive Methodology Based on Ore Mineralogy and Contaminant Speciation" Minerals 9, no. 7: 397. https://doi.org/10.3390/min9070397
APA StyleChopard, A., Marion, P., Mermillod-Blondin, R., Plante, B., & Benzaazoua, M. (2019). Environmental Impact of Mine Exploitation: An Early Predictive Methodology Based on Ore Mineralogy and Contaminant Speciation. Minerals, 9(7), 397. https://doi.org/10.3390/min9070397