Article

Trace Element Geochemistry in Quartz in the Jinqingding Gold Deposit, Jiaodong Peninsula, China: Implications for the Gold Precipitation Mechanism

1
MNR Key Laboratory of Metallogeny and Mineral Assessment, Institute of Mineral Resources, CAGS, Beijing 100037, China
2
State Key Laboratory of Geological Processes and Mineral Resources, China University of Geosciences, Beijing 100083, China
*
Author to whom correspondence should be addressed.
Minerals 2019, 9(5), 326; https://doi.org/10.3390/min9050326
Submission received: 16 March 2019 / Revised: 4 May 2019 / Accepted: 7 May 2019 / Published: 27 May 2019
(This article belongs to the Special Issue Polymetallic Metallogenic System)

Abstract

:
Lots of studies on gold precipitation mechanisms have focused on fluid inclusions within quartz. However, the trace elements in quartz reflect the properties of the ore fluid, and a comparison of the trace element content in different types of quartz can reveal the precipitation mechanism. The Jinqingding gold deposit is the largest gold deposit in the Muping–Rushan gold belt and contains the largest single sulfide–quartz vein type orebody in the gold belt. This study distinguished four types of quartz in this orebody through field work and investigations of the mineralogy and cathodoluminescence (CL) of the quartz and crosscutting relationships as seen under a microscope. In situ studies via electron probe micro-analyzer (EPMA) and laser ablation-inductively coupled plasma-mass spectrometry (LA-ICP-MS) were used to determine the trace element content of the different quartz types. Type Qa displayed a comb structure in the field and zoning under the microscope and in CL. Milky white and smoke grey Qb was the most common quartz type and hosted the most sulfide and gold. Qc was Qa and Qb quartz that recrystallized around pyrite or overgrew and appeared different from Qa and Qb in CL images. Qd occurred within fractures in pyrite. Qa formed prior to the mineralization of gold, and Qd formed post-mineralization. Qb and Qc provided information regarding the ore fluid during mineralization. Sericites occurred with pyrite in fractures in the quartz, and some, along with free gold, filled in fractures in pyrite. Free gold occurred within Qa, Qb, Qc, and in brittle fractures in pyrite. Qc had the lowest Al content of all of the quartz types. As Al content is related to the acidity of the ore fluid in previous study, this indicated an acidity decrease during mineralization, which could be attributed to the sericitization. Sericitization could indicate a potential gold occurrence. The Ti content decreased from Qb to Qc, indicating a decrease in temperature during quartz overgrowth formation. Change in acidity and cooling can therefore be identified as possible causes of gold precipitation in the sulfide–quartz vein type in the Jinqingding gold deposit.

1. Introduction

The Jiaodong Peninsula is the largest gold province in China [1,2,3,4,5]. Its gold deposits can be divided into fractured–altered rock type [6], mainly in the western Jiaodong, and sulfide–quartz vein type, mainly in the eastern Jiaodong [7,8,9,10,11] (Figure 1a). Quartz and pyrite are the main gold-bearing minerals [7]. Previous studies on the gold precipitation mechanism have focused on fluid inclusions and consideration of gold precipitation mechanisms such as phase separation, unmixing, and water–rock reactions [12,13,14,15,16]. However, hydrothermal activity can be multi-pulse, and evidence from fluid inclusions only represents a certain phase of activity. Gold-bearing quartz has the potential to record a more comprehensive history of the hydrothermal activity, but when dividing the mineralization stage, each stage is usually regarded as a whole and the relative timing of quartz and sulfide crystallization is ignored within each stage.
Quartz is the predominant mineral in the gold deposit and occurs in every stage of the mineralization [7]. As well as the fluid inclusion assemblage in the quartz, the trace elements in each stage of quartz can reflect the growth environment in the mineralization system. Furthermore, geochemical study of the patterns in trace elements such as Li, Sn, Sb, and Rb can be used to establish genetic relationships within magmatic and hydrothermally derived quartz groups [17]. The trace elements such as Al and Ti in quartz that formed during different stages can reflect changes in the properties of the ore fluid, such as acidity and formation temperature of quartz [18]. Research into trace element variations of this kind has previously been carried out for porphyry and skarn deposits through the use of in situ studies with laser ablation-inductively coupled plasma-mass spectrometry (LA-ICP-MS) and electron probe micro-analyzer (EPMA) on quartz [17,18].
The Muping–Rushan gold belt is one of the three largest gold belts in the Jiaodong Peninsula and lies in its eastern part. The ores are mainly sulfide–quartz vein type. Jinqingding is the largest gold deposit and has the largest single sulfide–quartz vein type orebody in the gold belt (No. II, >32 t). The quartz within it has the potential to preserve multi-pulse hydrothermal activity, which can be best studied in orebody No. II [19].
In this paper, we defined the different types of quartz present based on fieldwork, and petrographic and CL observations, and conducted in situ measurements to determine the trace element content. We then used the trace element contents of Al and Ti in different generations of quartz to infer the acidity changes in ore fluid and formation temperature of quartz, and talked about the possible gold precipitation mechanisms in the Jinqingding gold deposit. The results of this study have wider implications for gold exploration.

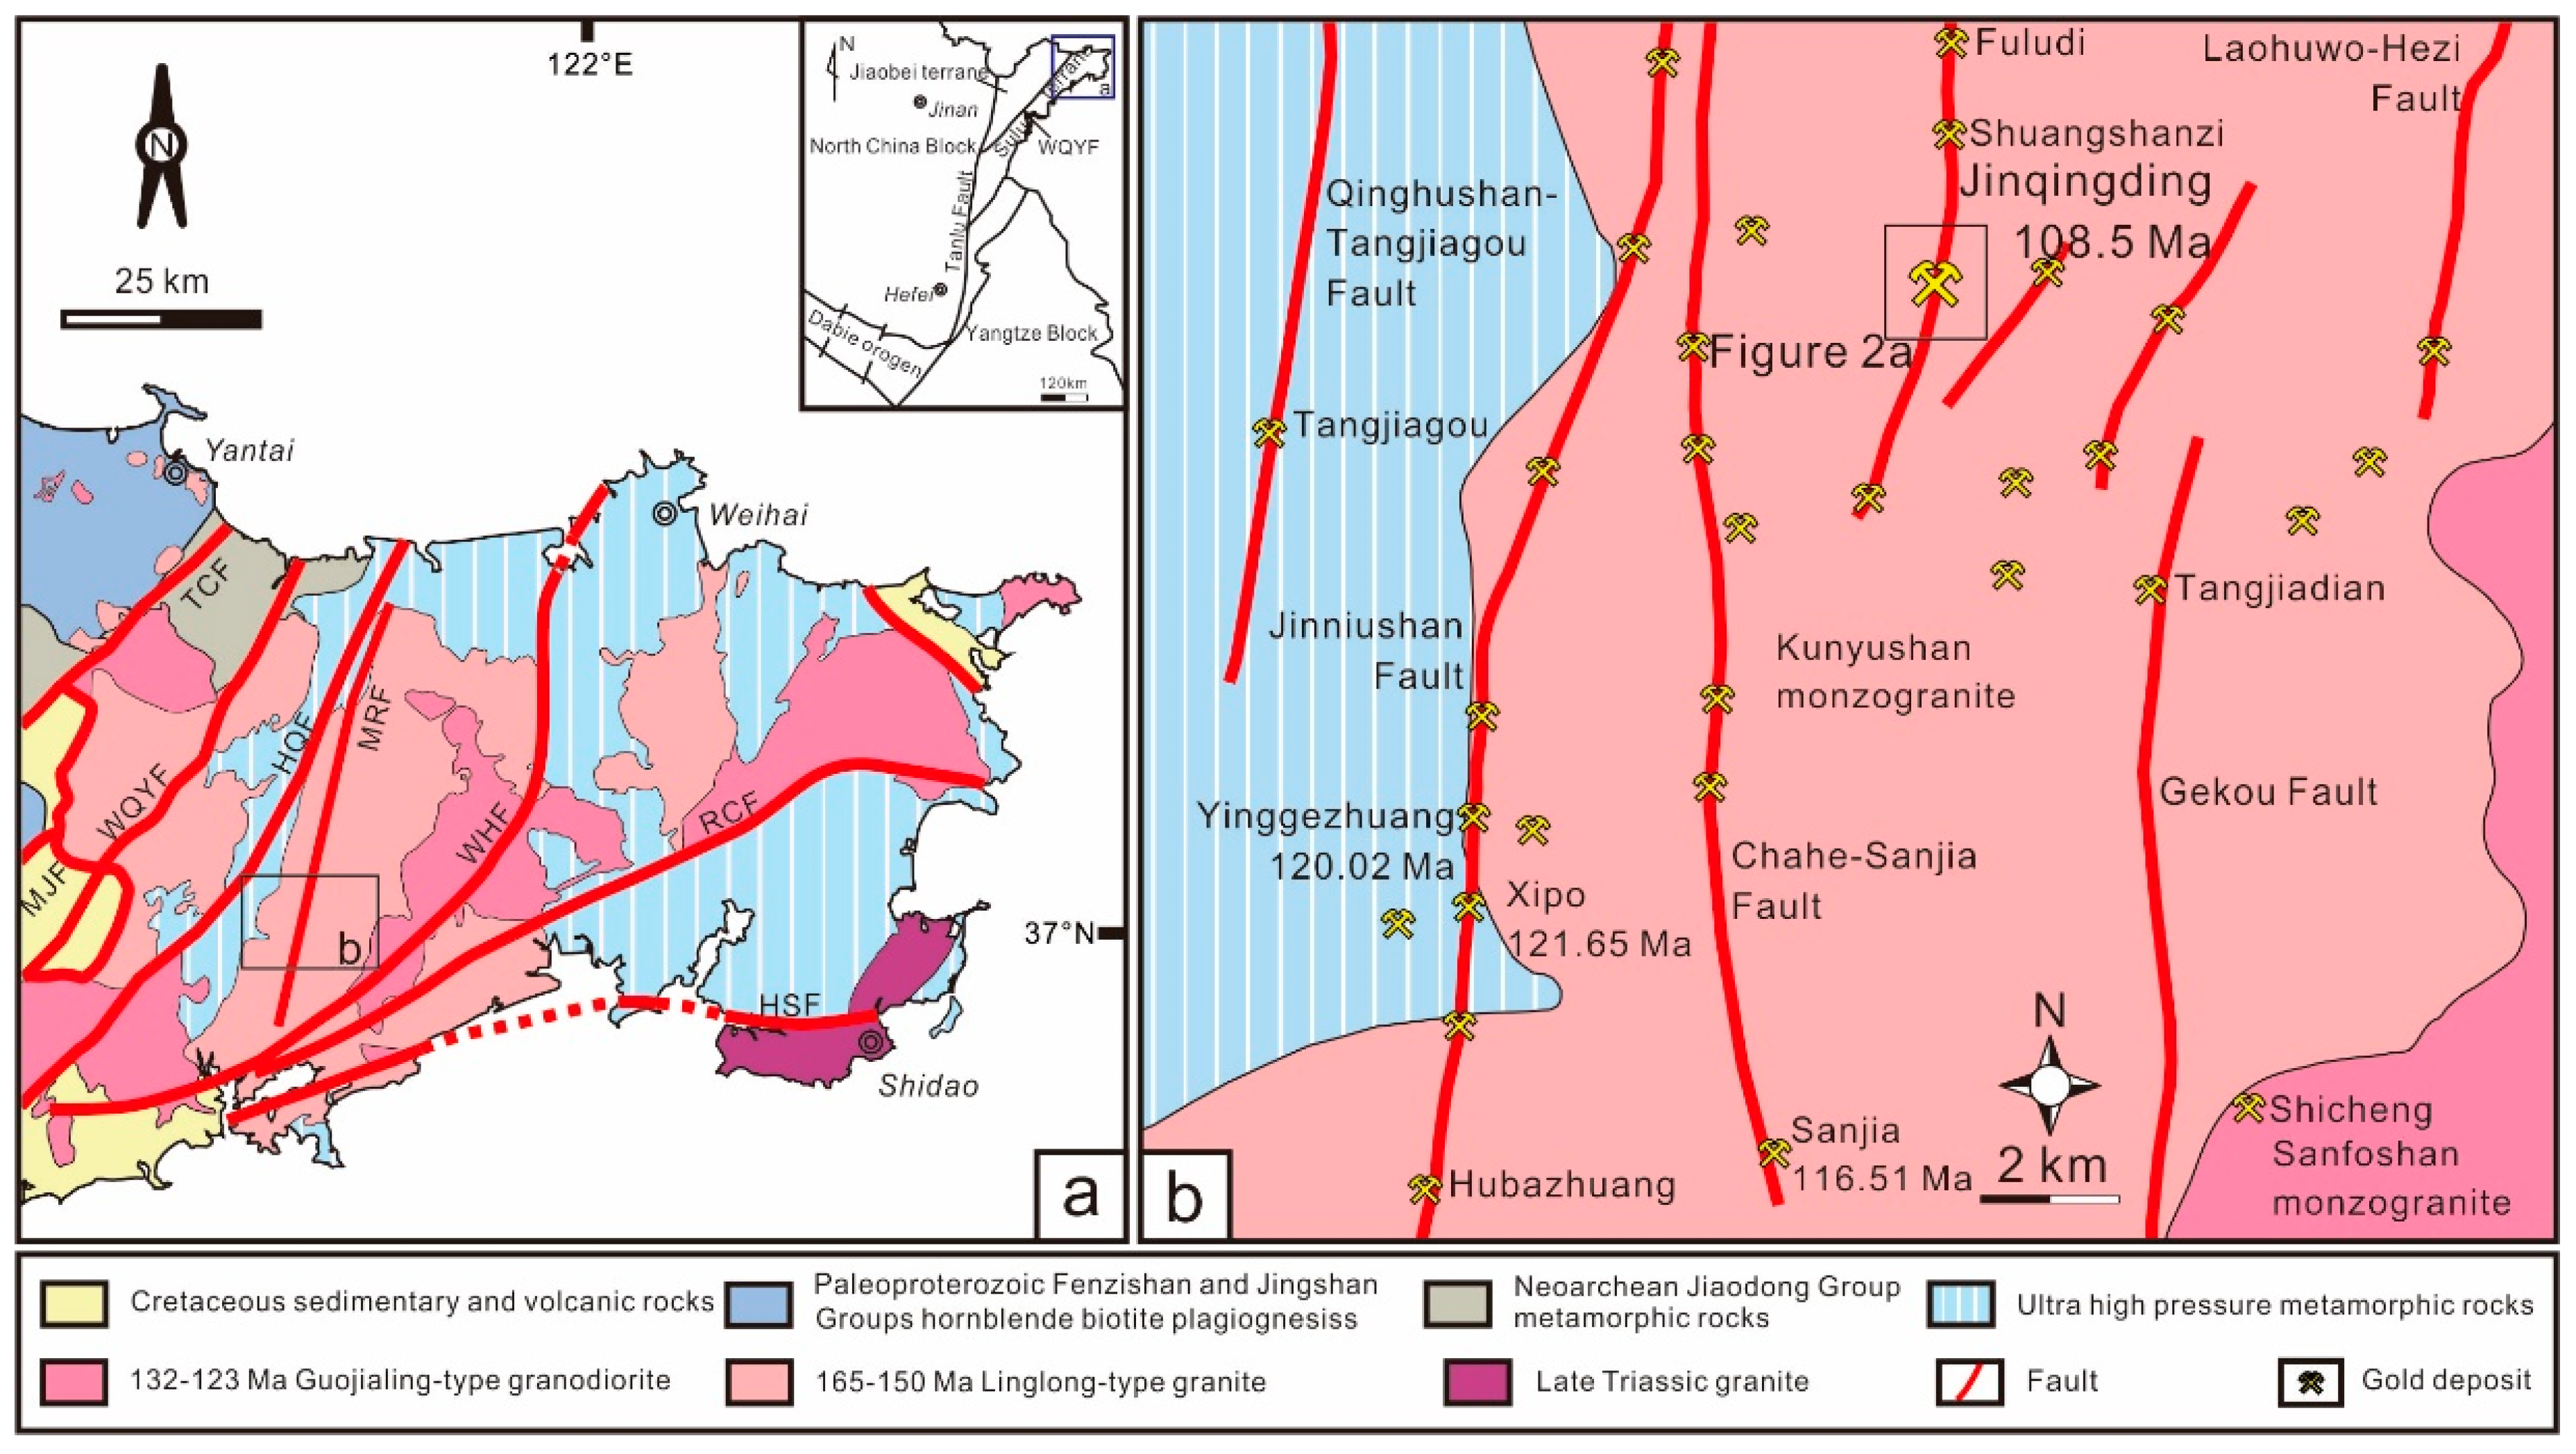
2. Regional Geological Setting

The Jiaodong Peninsula is located on the southeast margin of the North China Craton; the Wulian–Qingdao–Yantai fault divides the peninsula into the Jiaobei and Sulu Terranes [22] (Figure 1a). Jiaodong has experienced both continental collision and subduction of oceanic lithosphere, with the Yangtze Craton subducting below the North China Craton during the Triassic and the Pacific plate subducting beneath the North China Craton in the Jurassic [21,23,24,25]. More than 150 gold deposits have been found, with more than 4000 tons of proven reserves [7,15]. Most of the gold deposits are located in the Mesozoic granites, and a minority are in Archaen metamorphic rocks [7,14]. Most of the gold deposits formed from 120 Ma onwards and are controlled by NNE-trending faults and secondary faults; a smaller number of gold deposits are controlled by the detachment fault in the Jiaolai Basin [7,14].
The regional basement is tonalite–trondhjemite–granodiorite (TTG) gneisses (2.9–2.5 Ga) [26]. The Neoarchean Jiaodong Group and Proterozoic Fenzishan, Jingshan and Penglai Groups overlie the basement. The Jiaodong Group is made up of metasedimentary and meta-igneous rocks [27,28], the Fenzishan and Jingshan Groups are composed of schist, calc-silicates, marble, and amphibolite [29,30,31], and the Neoproterozoic Penglai Group comprises marble, slate and quartzite [32]. Rocks of the Jiaodong, Fenzishan, Jingshan, and Penglai Groups occur as xenoliths in the wallrock of most of the gold deposits in Muping–Rushan gold belt.
Tectonic and magmatic events were frequent in the Mesozoic. The magmatic activity can be divided into four periods, namely late Triassic, Late Jurassic (165–150 Ma), Early Cretaceous (110–120 Ma), and Late Early Cretaceous [7]. In the Late Triassic event, mantle-derived syenite–granitic–miscellaneous rock intruded into Shidao after the North China Craton–Yangtze Craton collision [23].
In the Middle to Late Jurassic (165–150 Ma), biotite monzogranite, monzogranodiorite, quartz diorite and granodiorite intrusions derived from partially melted Neoarchaen lower crust intruded to form the Linglong, Kunyushan and Queshan granitoids [33,34]. The late Jurassic Kunyushan granite is the main wallrock in the gold belt (Figure 1b). This can be sub-divided into the Duogushan granite, Washan granite, and Wuzhuashan granite, which have sensitive high resolution ion microprobe (SHRIMP) zircon ages of 161 ± 1 Ma, 138–146 Ma and 160 ± 3 Ma [35] and 40Ar/39Ar biotite cooling ages of 135–147 Ma, 126–131 Ma and 120–123 Ma, respectively [36].
In the Early Cretaceous, granite–granodiorite–alkaline granite derived from partially melted lower crust, and Precambrian metamorphic basement intruded into Sanshandao, Shangzhuang, Sanfoshan and Guojialing and have been dated via SHRIMP U–Pb to 132–123 Ma [37,38]. Several gold deposits within the Muping–Rushan gold belt, such as the Shicheng and Tongling deposits, are hosted within the Sanfoshan monzogranite.
In the late Early Cretaceous, monzogranite intrusions with mixed crust–mantle and partly depleted mantle sources intruded Aishan [35] (Figure 1b).
Most of the gold mineralization is controlled by NE–NNE trending faults [7,39]. There are four main ore-controlling faults in the Muping–Rushan gold belt, namely the Qinghushan–Tangjiagou fault, Jinniushan fault, Jiangjunshi–Quhezhuang fault and Hezi–Gekou fault (Figure 1b). More than 20 gold deposits are located in the Muping–Rushan gold belt. The ores are dominantly of sulfide–quartz vein type.

3. Ore Deposit Geology

The Jinqingding gold deposit (37°06′40″–37°07′30″N, 121°38′06″–121°38′52″E) is the largest gold deposit in the Muping–Rushan gold belt (Figure 1b and Figure 2a) with a proven reserve of >32 t and an average grade of 6.44 g/t [19,20]. It is located 25 km to the NE of Rushan city and was discovered by the Jinzhou Mining Company in the 1970s. 40Ar/39Ar dating of sericite in the quartz–sulfide veins has yielded an age of 107.7 ± 0.5–109.3 ± 0.3 Ma [21].
Sixteen orebodies have been discovered in the Jinqingding deposit; orebody No. II is the largest and contains 96% of the proven reserve [19,20]. Recent engineering activity has revealed that orebody No. II occurs at depths between +120 m and −1220 m, strikes NE, is 120–600 m long along strike, averaging 300 m, and is 100–610 m long along dip (Figure 2b). Auriferous quartz pyrite veins occur within secondary fractures (Figure 2b). The orebodies are located in fault bends where the dip angle changes from moderate to steep. The thickness of orebody No. II is 0.2–6.73 m, averaging 1.65 m, the grade is usually 1.50–30 g/t, averaging 10.40 g/t [19].
The ore-controlling fault (F3) is part of the Jiangjunshi–Quhezhuang fault. Its general trend is 20° and it dips to the SE (Figure 2a,b). Based on the field work, F3 is a dextral normal fault with horizontal movement, the orebodies occur in extensional zones, while the other zones are dominated by transpression. F1 is the post-ore fault and no gold mineralization is found in it. Kunyushan monzogranite is the main wallrock (Figure 2a,b and Figure 3a), dikes are mainly lamprophyre, and Paleo–Proterozoic Jingshan Group amphibolite occurs as xenoliths in the deposit (Figure 2a,b). Sulfide–quartz veins have filled fractures in the monzogranites. There is usually a clear boundary between the vein and the wallrock (Figure 3a). Alteration can be seen in the wallrocks of the orebody, and the degree and scale of the alteration are controlled by the fault. The alteration types include K-feldspar alteration (Figure 3b), sericitization (Figure 3c), and silicification. There are gradual boundaries between the different types of alteration. Potassic alteration is the most common type; it can range in width up to 3–4 m and is most intense near the orebody. Pyrite–sericitization forms a narrow belt and usually coexists with a belt of sericitization; these occur in the deeper level of the gold deposit. Only a small amount of silicification is seen near quartz–sulfide veins in the field. The orebody contains some potassic altered wallrock breccias.
The structure of the ore rock varies between massive (Figure 3d), disseminated (Figure 3d), veinlet (Figure 3e), and brecciated, and it features textures such as fissure-intersertal texture and replacement texture. Pyrite and quartz are the main gold-bearing minerals. Gold mainly occurs in fractures in the pyrite and quartz and more rarely as inclusions within those minerals. Smaller amounts of galena, sphalerite, chalcopyrite, and pyrrhotite are also present. Sericites are common in the wallrock and ore. The early milky quartz has a comb structure (Figure 3f).
Pyrite is the most important metal mineral, and both massive pyrite and vein-type pyrite are seen in the field and in hand sample (Figure 3e,f). Pyrite occurrence can be found from the orebody to the wallrock, with massive and disseminated pyrites occurring in the middle part of quartz veins and pyrite veins occurring near the wallrock.
In the sulfide–quartz veins, quartz appears milky and smoke grey (Figure 3d–f) and is medium- to coarse-grained (5 mm–1 cm). It can be divided into four main types, namely Qa, Qb, Qc and Qd (Figure 4). In the field and in hand sample, Qa is milky white (Figure 3f). It characteristically has a comb structure (Figure 3f and Figure 4a,b), is euhedral, and has a grain size of several millimeters to several centimeters. No sulfide is found in Qa. Qb is very common and contains gold, many types of pyrites, and base metals (Figure 3d,e and Figure 4c–e). In hand sample, Qb looks milky white when there is no pyrite and smoke grey when pyrites are present (Figure 3d,e). Its grain size may vary under different conditions. Some recrystallized quartz and quartz overgrowths occur around the sulfide (Qc). Some quartz also occurs in fractures in the pyrites (Qd). These last two types are best identified under a microscope. Similar quartz types have been found in other gold deposits of Muping–Rushan gold belt.

4. Sampling and Analytical Techniques

Representative quartz–sulfide vein samples were collected from depths of −825 m and −865 m within orebody No. II (Figure 2b). Samples JQD15D4B3, JQD15D6B3 and JQD15D25B1 were chosen for further detailed research (Figure 2b). Quartz of each generation was selected with the understanding that multiple hydrothermal activities may be preserved within any one grain. In addition to observations on hand samples and under the microscope, several methods were applied to differentiate the quartz types present and detect their trace element content. Spot locations (red circle) are shown in Figure 4. Samples of each type of quartz and overgrowth quartz were selected for analysis.
Cathodoluminescence (CL) is an effective way to study growth zonation and interior structure in quartz [40], as the color and intensity are affected by structurally bound trace elements [40]. Quartz formation conditions and generations can be reflected in variations in CL [40,41,42,43,44]. Different types of quartz from the different samples were studied with CL and then subjected to further study. CL imaging was carried out with a HC5-LM hot-cathode CL microscope at the Colorado School of Mines, Golden, Colorado, USA. Its operating conditions were a voltage of 14 keV and a current density of approximately 10 µA/mm2. A modified Olympus BXFM-S optical microscope was used to locate the quartz. To capture short-lived and long-lived CL signals, a high sensitivity, double-stage Peltier cooled Kappa DX40C CCD camera was used to capture images every seven seconds automatically following initial exposure. The CL images usually show colors changing from dark blue to light red during exposure.
The composition of the selected samples was analyzed by automated scanning electron microscopy (QEMSCAN) at the Colorado School of Mines, Golden, CO, USA. The samples were first loaded into the QEMSCAN instrument, and the analysis was initiated using the control program (iDiscover, FEI). Under the working conditions of a beam step interval of 5 μm or 10 μm, accelerating voltage of 25 keV and beam current of 5 nA, spectra were acquired from each particle by four energy dispersive X-ray (EDX) spectrometers. Monte Carlo simulation was used to model the interactions between the beam and the sample. The EDX spectra at each acquisition point were compared with spectra held in a look-up table based on an assignment that had been made as to composition. The QEMSCAN software calculates the area percentage of each composition in the look-up table and outputs the results as a spreadsheet.
Laser ablation-inductively coupled plasma-mass spectrometry (LA-ICP-MS) carried out at the United States Geological Survey (USGS), Denver, CO, USA was used to determine the trace element concentrations in the quartz. The LA-ICP-MS system is composed of a Horiba Xplora Raman Spectrometer (532 nm) and a Photon Machines Analyte G2 LA system (193 nm, 4 ns excimer). He gas (0.85 L/min) carries the ablated material to a modified glass mixing bulb, and the sample is mixed coaxially with Ar (0.6 L/min) at the ICP torch [45]. The thin section should be prepared carefully as the quartz from gold deposits is usually fragile and brittle and may break without the assistance of the glass. It is also likely to contain small fluid inclusions, which may cause it to explode when heated by the laser. The spots were chosen on the basis of the CL results and microscopic observation. Only two selected quartz grains (JQD15D25B1) were studied (Table S2). The detection limit for Ti and Al is 1 ppm and 2 ppm, respectively.
During electron probe micro-analyzer (EPMA) work on the quartz, mineral inclusions in the quartz were excluded so that the Al content would reflect the concentration of structurally bound Al (Table S1). The trace element contents of the quartz were studied quantitatively with a JEOL JXA 8800 electron microprobe analyzer at the USGS, Denver, CO, USA. The operating conditions were 20 kV, 100 nA, and a focused beam 2 μm in diameter. The detection limit of Al is 0.001 wt %, and the standard sample used was USGS-Menlo #5-168.

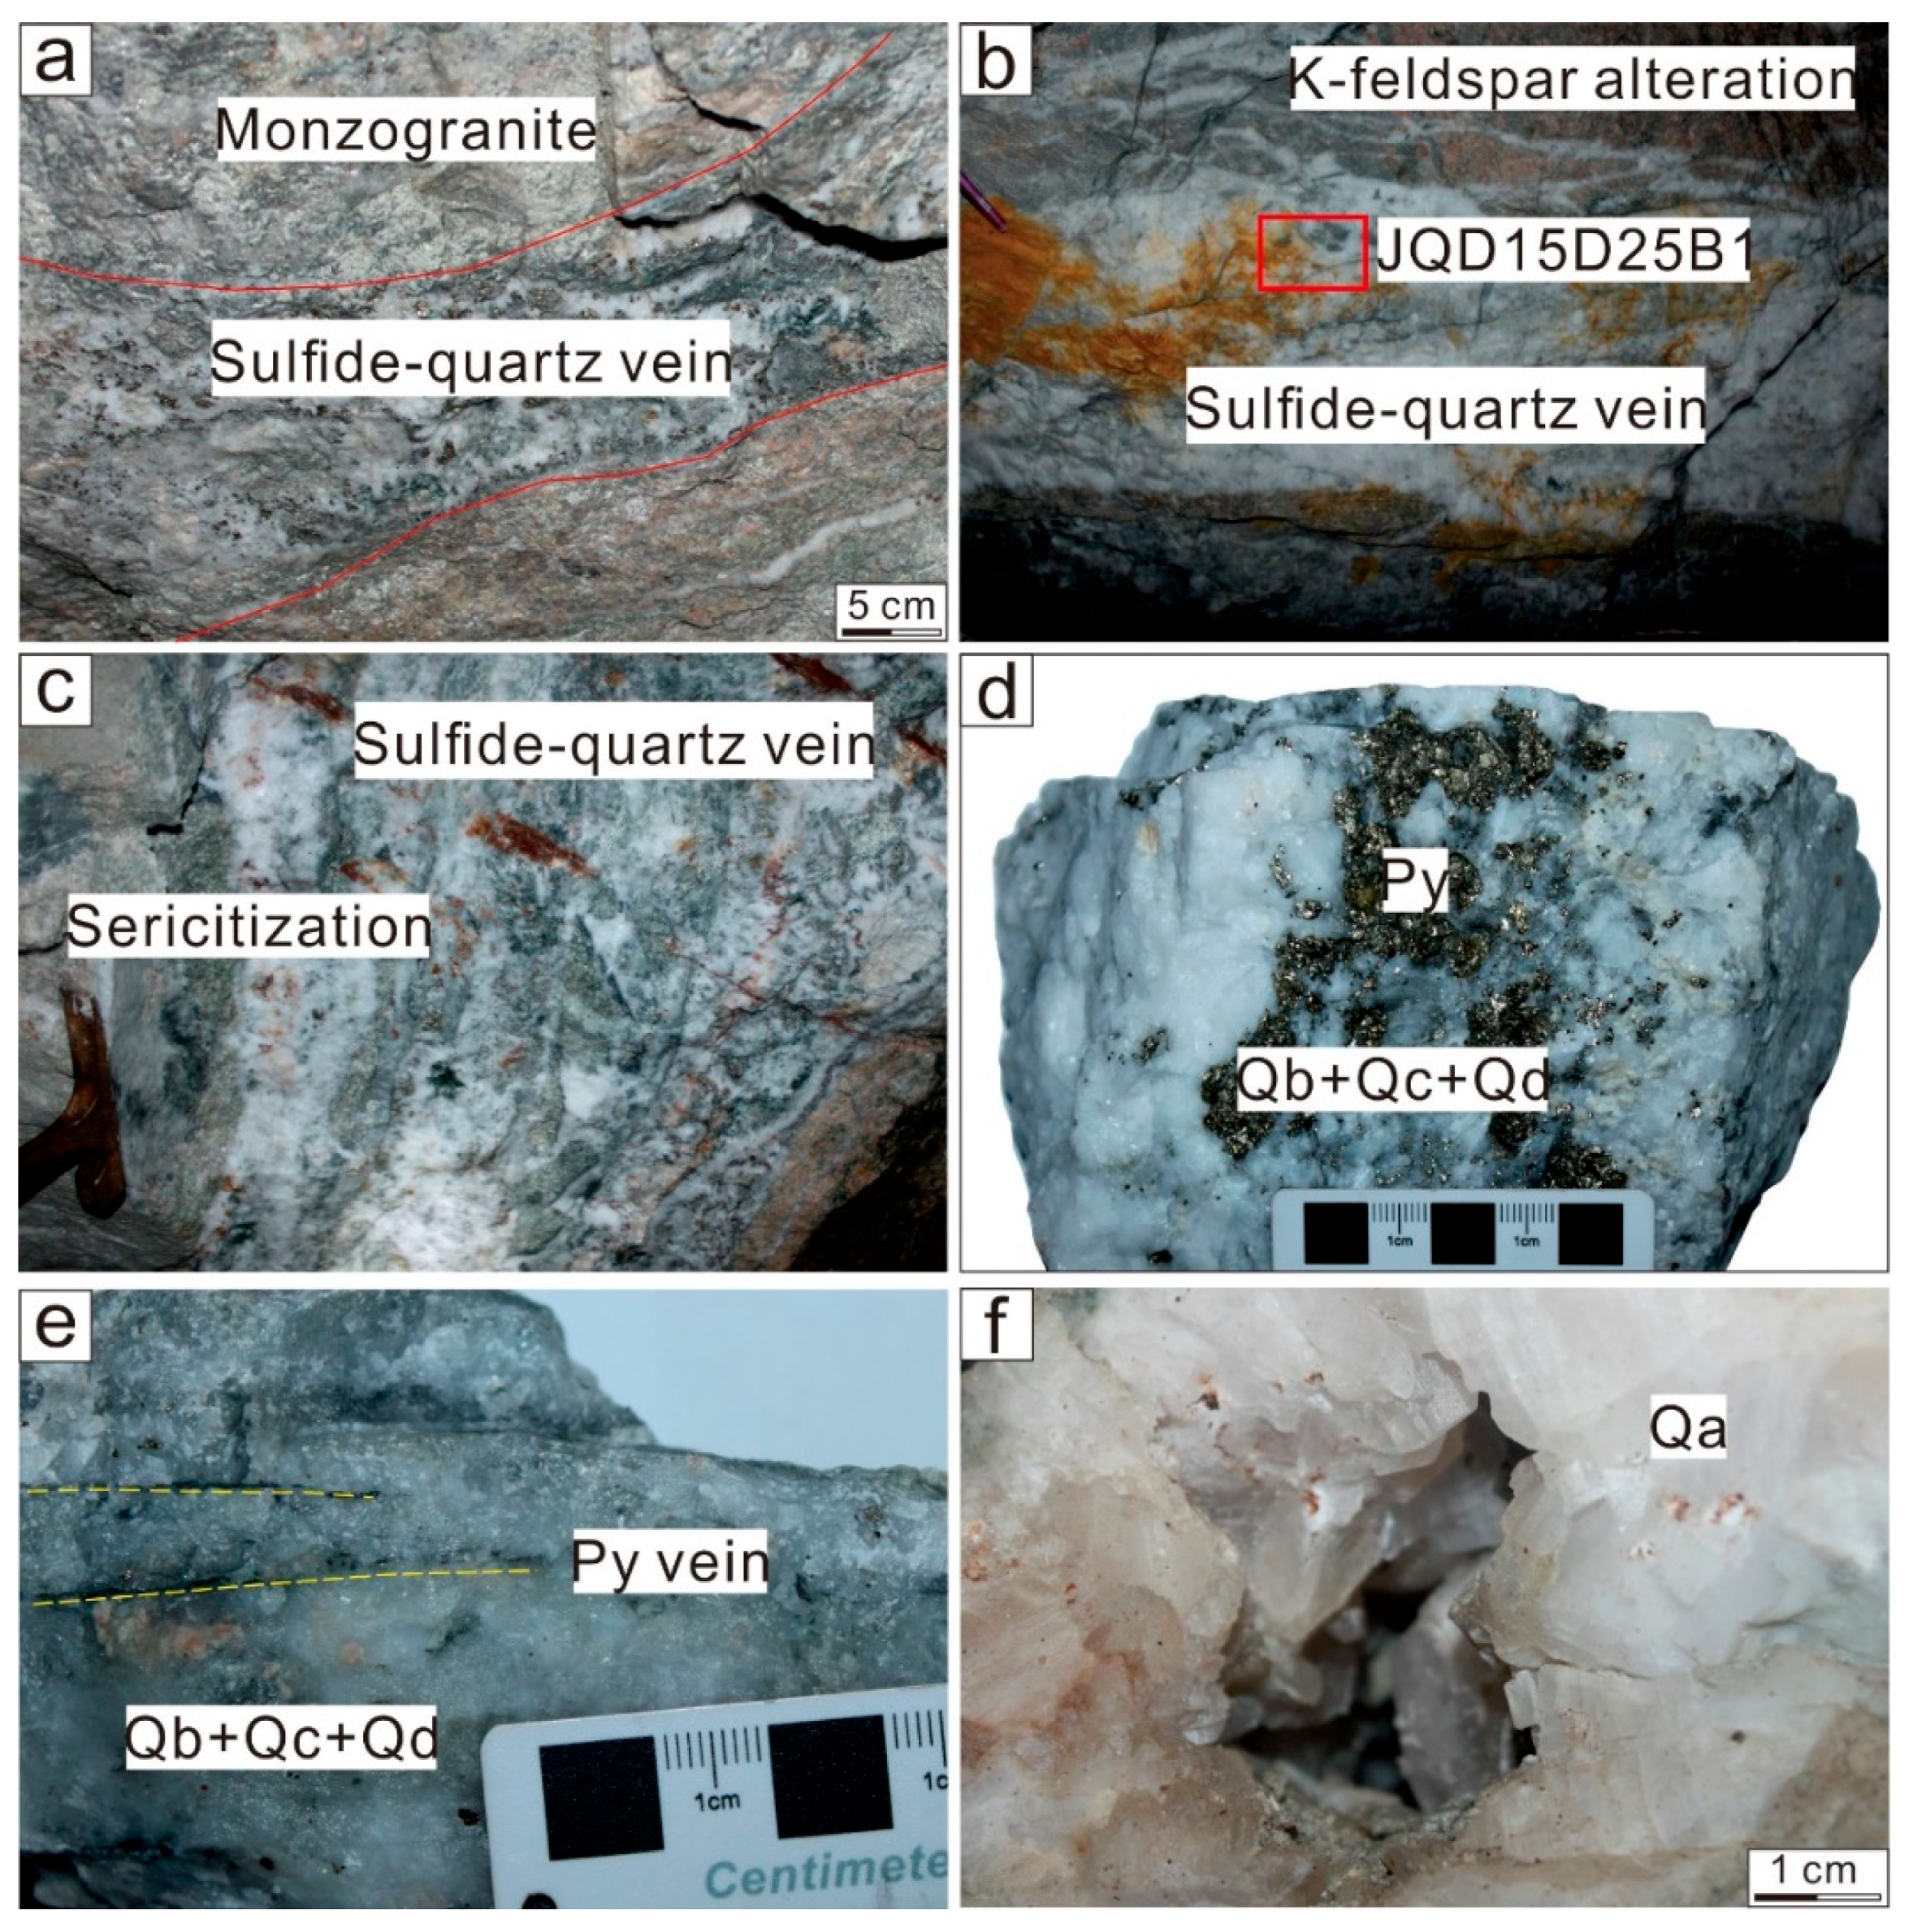
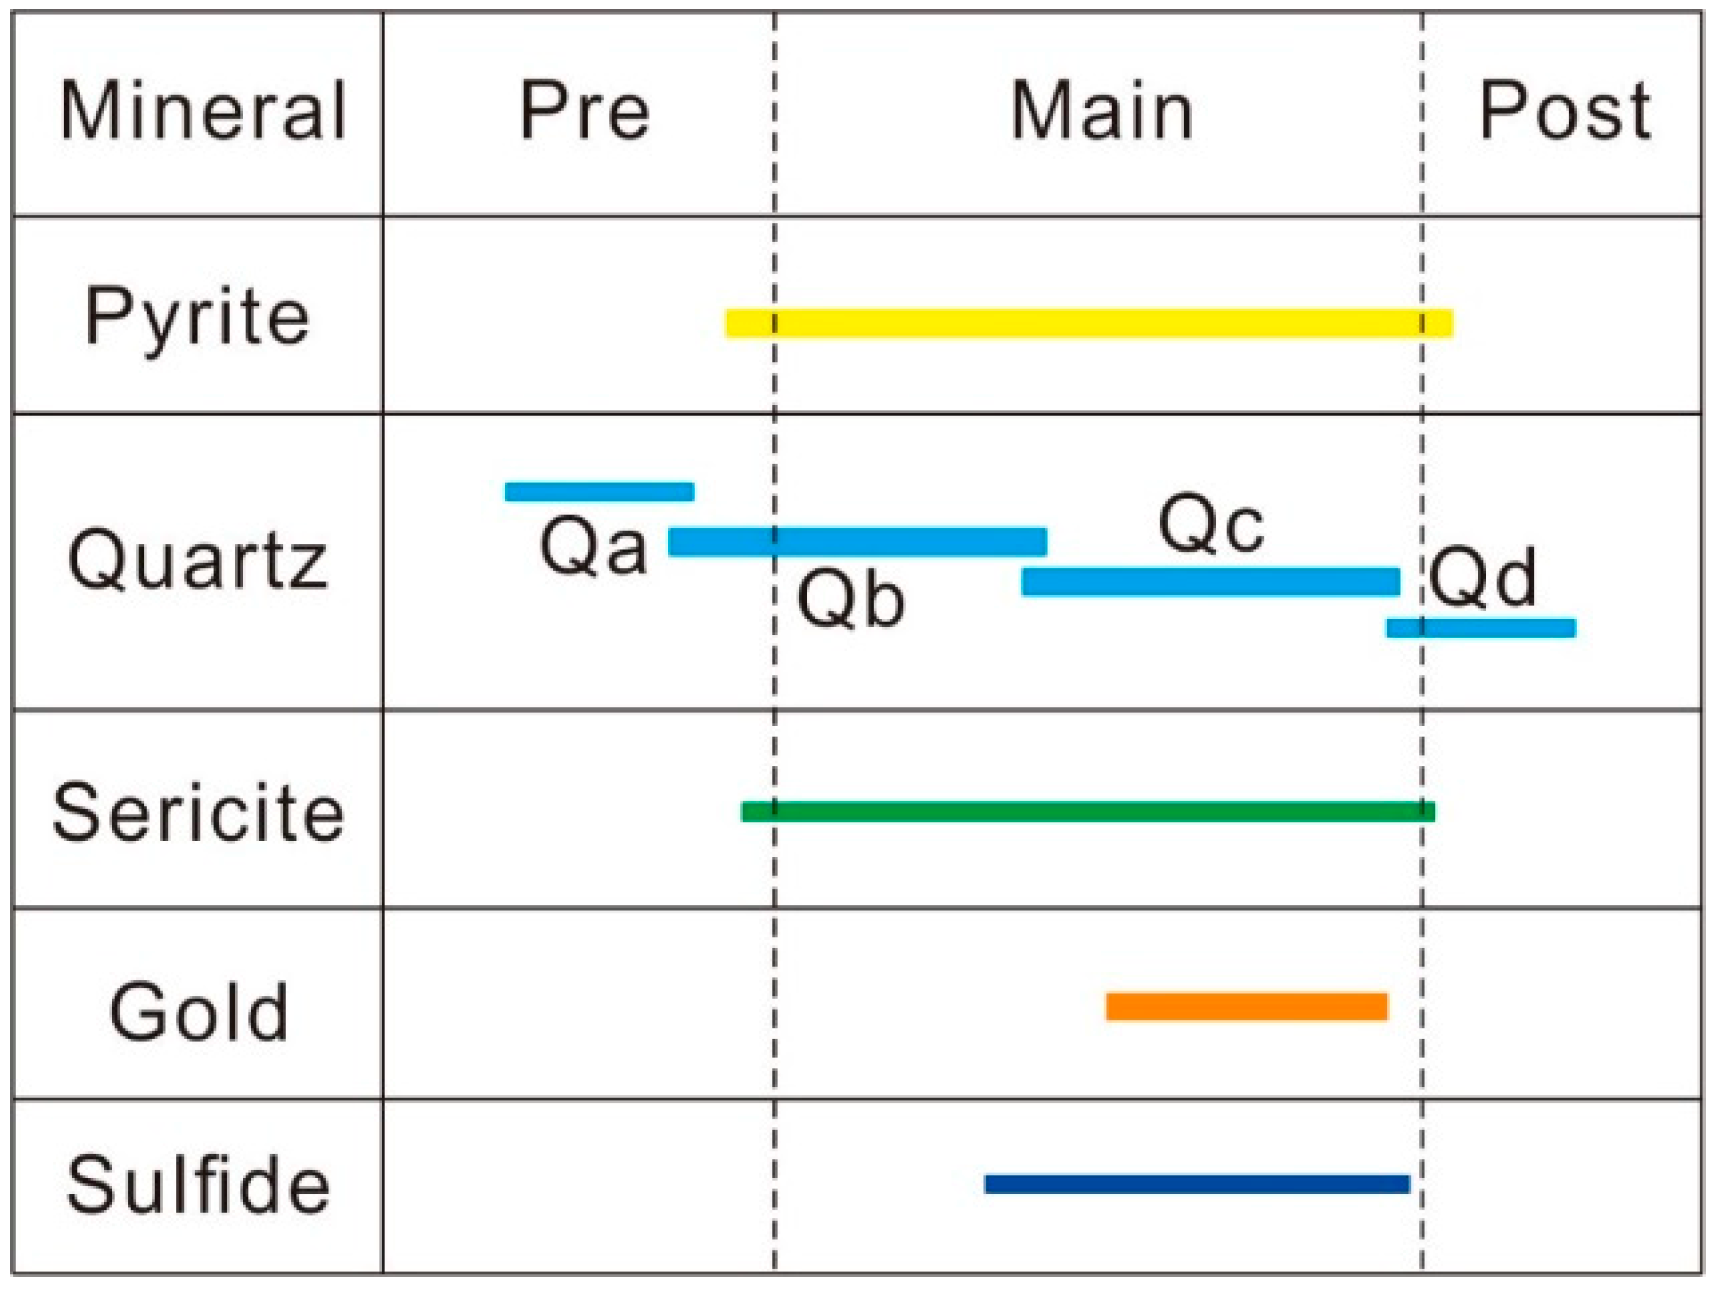
5. Mineralogy and Paragenesis

Previous studies have divided the mineralization process in the Jiaodong peninsula into four main stages, namely the gold–pyrite–quartz stage (I), gold–quartz–pyrite stage (II), gold–pyrite–base sulfide–quartz stage (III), and quartz–pyrite–calcite stage (IV). The second and third stages are regarded as the main stages of mineralization [6,12,15]. There has been little study of the sequence of mineral formation within each stage; the mineral assemblages are generally discussed as one. This paper presents a new paragenesis based on field work and the petrographic investigation.
The field, hand sample, and microscopic observations and short-lived CL results from this study indicated that there were differences between quartz grains including their crosscutting relationships, CL features, timing relative to pyrite, relationships with mineralization, and fluid inclusions. The detailed features of each type of quartz were therefore studied in more detail (Figure 4).
Under the microscope, Qa cores were turbid, and the grains had clear zoning. The zoned part was crosscut by pyrite; cross-cutting relationships indicated that Qa formed prior to all of the sulfides and mineralization (Figure 4a,b). CL revealed zonation in Qa grains and that the Au occurred in fractures perpendicular to the zoning (Figure 4b).
Au occurred in fractures in Qb (Figure 4c). Pyrites were present in broken quartz grains or at contacts between coarse and fine quartz. On some occasions, euhedral or subhedral quartz occurred inside or partly included in the sulfide (Figure 4d,e). Quartz outside and inside the pyrite goes extinct at the same angle (Figure 4d), which means that the quartz grains were structurally the same and crystallized simultaneously. Similar CL features were seen even where extinction did not occur at the same angle, indicating that the quartz was of the same origin (Figure 4e). Quartz overgrowths may have occurred during the period of Qb and Qc formation.
Qc forms by recrystallization and overgrowth of Qb. Recrystallized quartz occurred beside massive pyrite and pyrite veins; this quartz may have resulted from hydrothermal activities of sulphide formation (Figure 3e,f and Figure 4f,g) [20]. Recrystallization of quartz may have resulted from many causes, such as fault movement and hydrothermal activity. Qc was different from the recrystallization derived from fault movement. Qc was best distinguished under a microscope and via CL. Au was found in Qc, which made Qc mineralization-relevant gold-bearing quartz (Figure 4f). The CL color of Qc was darker than that of Qa and Qb (Figure 4f). Some quartz around pyrite veins was recrystallized (Figure 4g). Qb and Qc had the potential to preserve information regarding the ore fluid during mineralization. Overgrowths were rare in the sample, but two grains were selected for LA-ICP-MS study.
Qd occurred in fractures in the sulfide (Figure 4h) and obviously formed after gold mineralization. The grain size depended on the sizes of the pyrite fractures. No gold was found in Qd. It showed different CL features from the other types of quartz.
Sericitization is a common alteration type in the gold deposit, and sericite has several types of occurrence. Field and microscopic observations indicated that sericite may have derived from feldspar alteration (Figure 3c and Figure 5a), which means the sericitization may have occurred during mineralization. According to mineral mapping by QEMSCAN, sericite and gold filled in fractures in pyrite (Figure 5b), indicating that the gold precipitation may be related to sericite formation. A high proportion of sericite was also seen in a pyrite vein filling in the fractures of quartz (Figure 5c), indicating that sericite was a major syn-mineralization mineral.
Visible gold occured in brittle fractures in the quartz and pyrite (Figure 4b,c,f and Figure 5b), meaning that this gold formed after or at the same time as these quartz and pyrite grains. Other sulfides such as galena and chalcopyrite sometimes filled in these fractures or were located around pyrites, indicating that they may have formed at the same time or after the pyrite. A new paragenesis has been concluded on the combined basis of all of the mineralogical investigations (Figure 6).

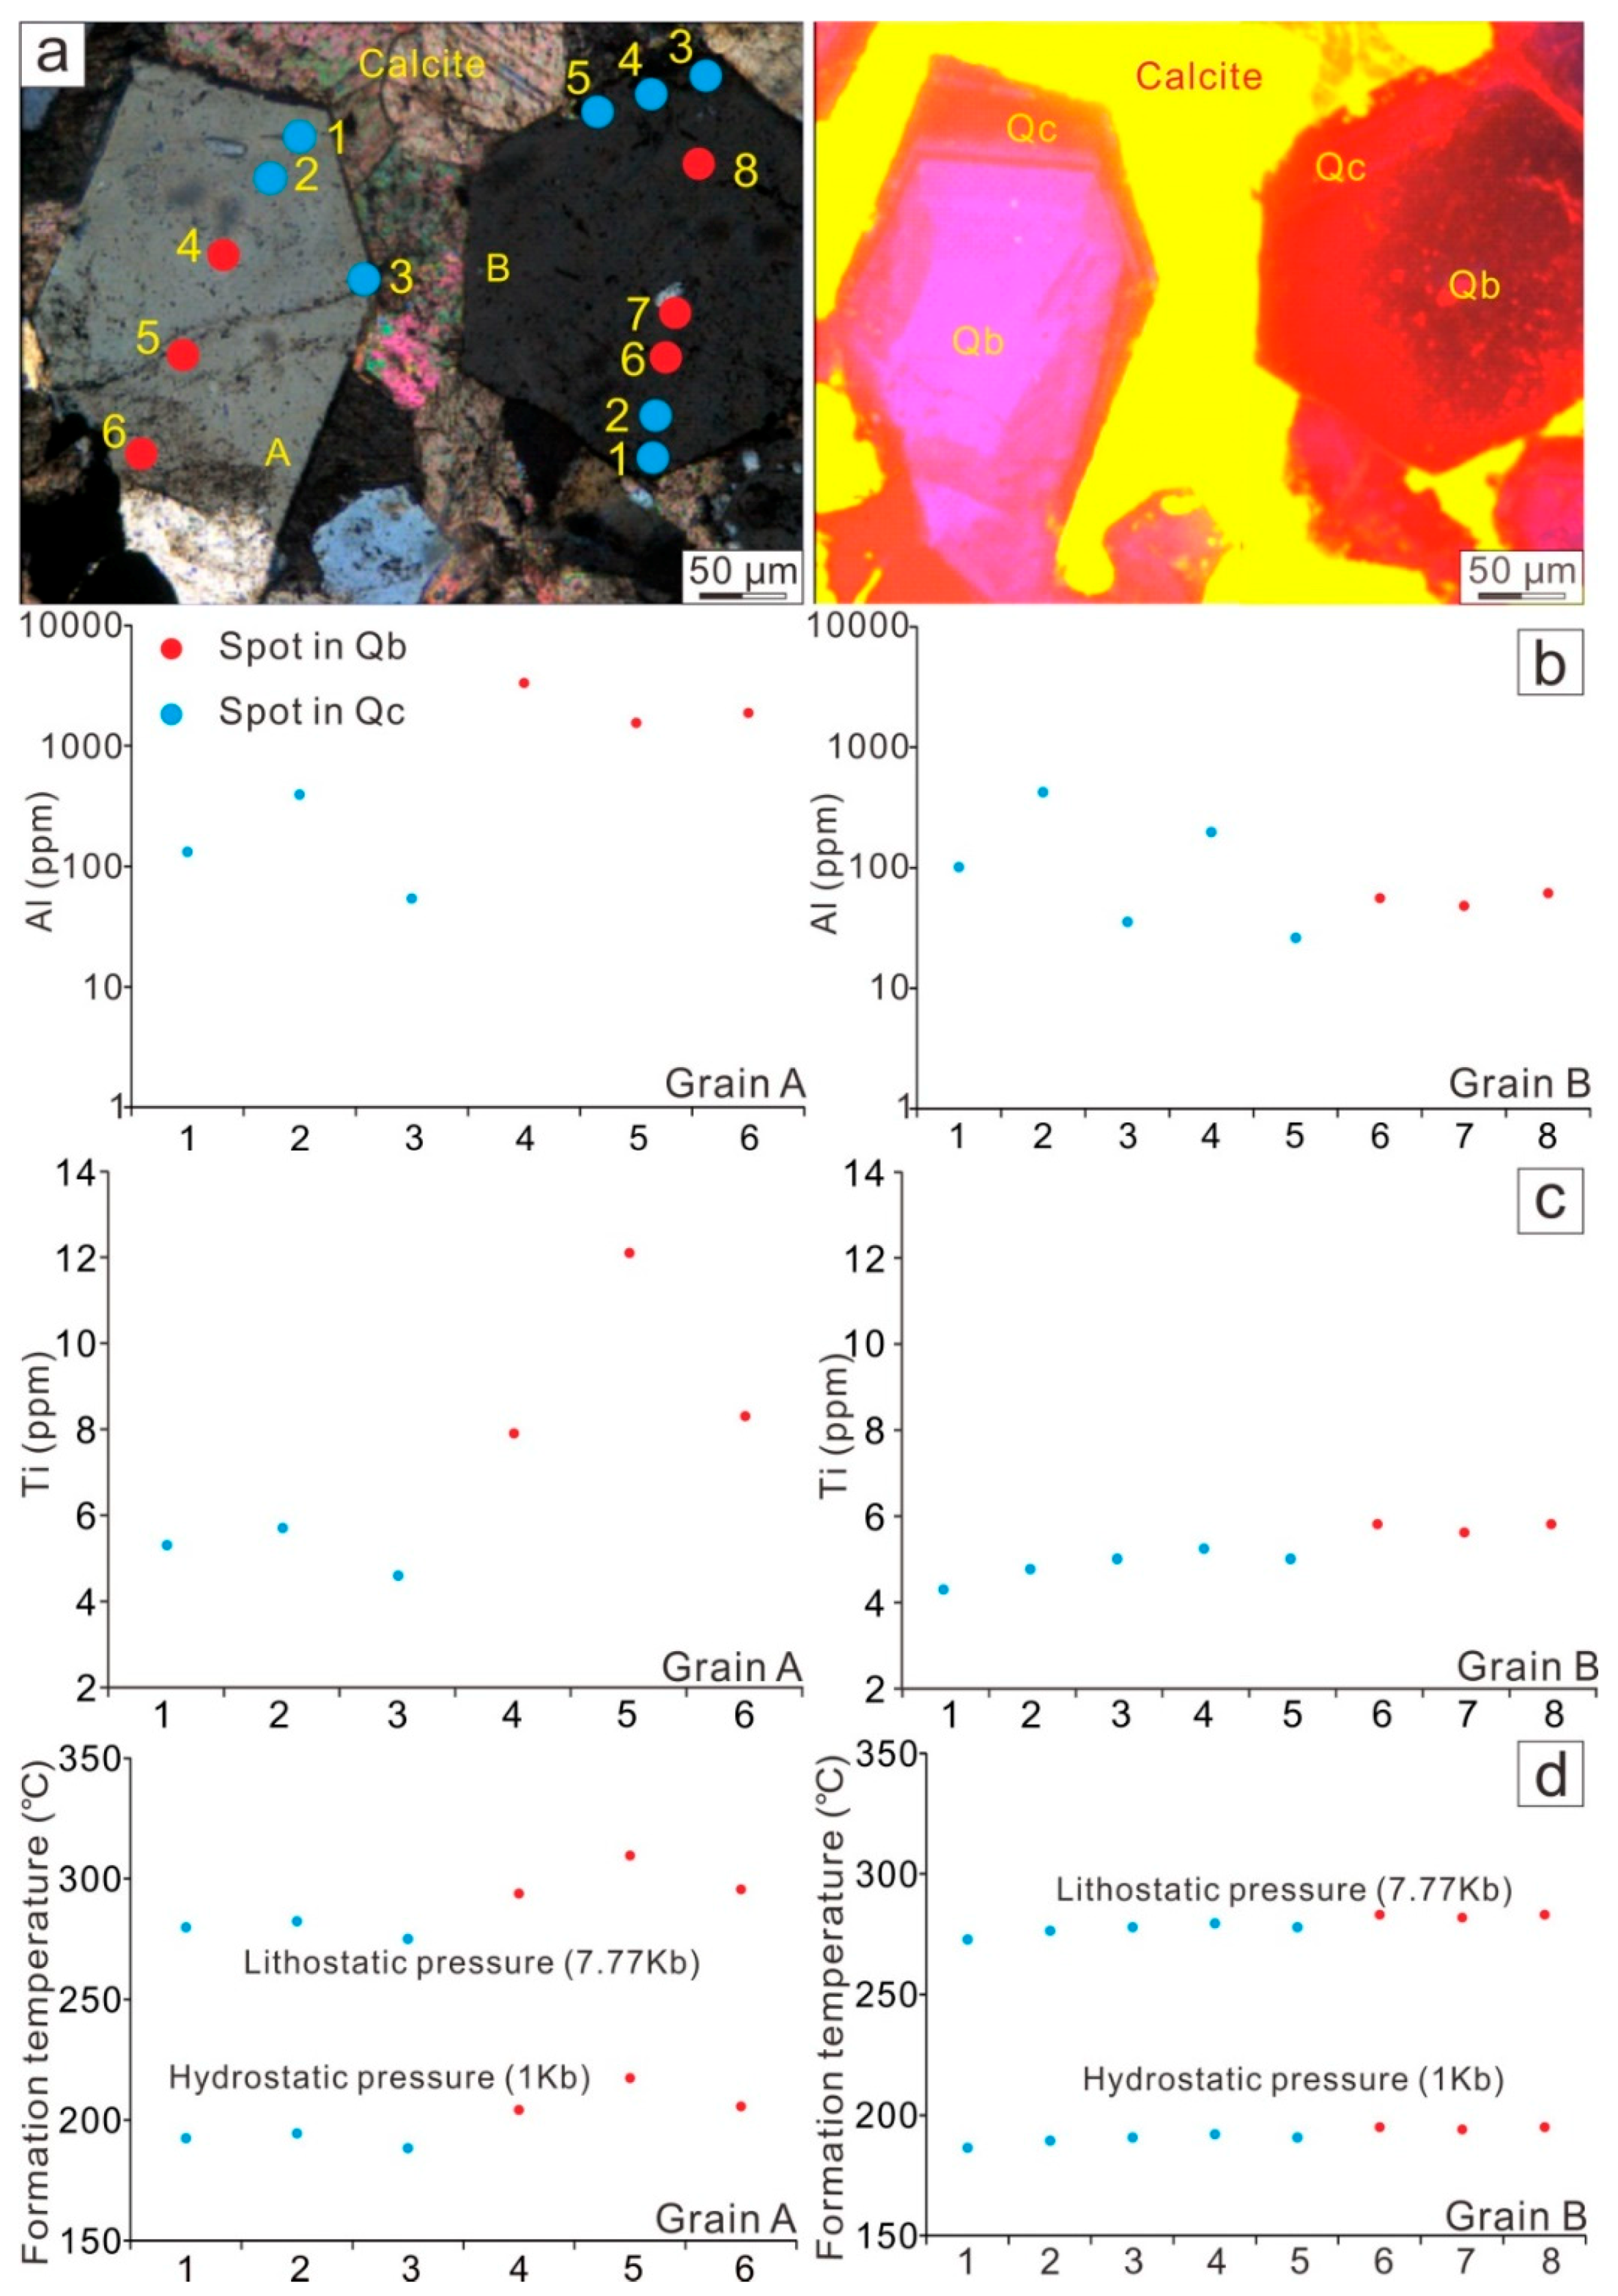
6. In Situ Study Results

The Al and Ti contents of the different types of quartz were analyzed by EPMA and LA-ICP-MS. The EPMA results are shown in Table 1 and Figure 7. The LA-ICP-MS results are shown in Table 2 and Figure 8.
The EPMA results have a higher detection limit, so only Al could be detected. The Al content varied in the different types of quartz. The Al content varied between the five spots within Qa, ranging from 0.008 wt % to 0.086 wt % and averaging 0.043 wt % (Figure 7; Table 1). The Al content in Qb ranged between 0.284 wt % and 0.004 wt % among 15 spots, with an average of 0.073 wt % (Figure 7; Table 1). Qc was studied at seven spots that yield Al contents from 0.001 wt % to 0.689 wt %, averaging 0.023 wt % (Figure 7; Table 1). The two spots in Qd had Al contents of 0.036 wt % and 0.167 wt %, giving a mean value of 0.101 wt % (Figure 7; Table 1).
LA-ICP-MS has a lower detection limit and so could also detect Ti. CL showed clear cores and rims in the quartz grains analyzed (Figure 8a). Qb and Qc were distinct within each quartz grain, with Qb forming the core and Qc the rim; cavities within grains were filled with calcite. The results for spots on the rims and cores are shown in Figure 8 and listed in Table 2. In grain A, Qb had both higher Al and Ti content than Qc, with the Al content ranging as high as 3310 ppm and the Ti content reaching 12.1 ppm (Figure 8b,c; Table 2). In grain B, the range in Al content in Qb overlapped the range in Qc (Figure 8b). The Ti content in Qb was slightly higher than that in Qc (Figure 8c).
Previous ore fluid studies have indicated that the fluid system was an H2O–CO2–NaCl system with a homogenization temperatures varying between 170 °C and 350 °C, a freezing temperature from −0.1 °C to −9.8 °C, a calculated salinity of from 0.2 wt % to 13.73 wt % NaCl eq., no salt daughter minerals, and a calculated hydrostatic pressure of 0.619 Kb to 1.532 Kb, averaging 1 Kb [46]. Combining the fully homogenization temperatures (268 °C), partly homogenization temperatures of CO2 fluid inclusions (23.6 °C), fluid inclusion explosion temperature (345 °C) and CO2-saturated vapor pressure (8.5 Kb), Li [46] calculated the lithostatic pressure as 7.77 Kb.
Ti content is controlled by temperature and pressure [47,48]. According to the equation (RT lnXTiO2quartz = −60,952 + 1.520T(K) − 1741P(kbar) + RT lnaTiO2) [47], if one is established, the other is directly proportional to the Ti content. When the system becomes saturated in Ti, the formation temperature of quartz can be estimated on the basis of the hydrostatic and lithostatic pressure [47,48]. Rutile was found in cavities within the pyrite and quartz, indicating Ti-saturation. Combining the hydrostatic pressure and lithostatic pressure, the formation temperature was calculated and is shown in Figure 8d and Table 2.

7. Discussion and Summary

Four main types of quartz are distinguished in the Jinqingding gold deposit. Quartz formation spans the pre-ore to post-ore periods. Qa has apparent zoning microscopically and in CL images, and formed prior to the mineralization. Qb is the most common quartz type and hosts the most sulfide and gold. Qc is recrystallized Qa and Qb around pyrites, which may form during mineralization. Qd occurs in fractures in pyrite and formed after the mineralization.
Two of the most efficient triggers of gold precipitation are acidity changes and cooling [49]. Alteration, which may result from water–rock reaction, is common in the gold deposit, and the acidity of ore fluid can change during alteration. Fluid inclusion studies, meanwhile, are not able to detect acidity changes whereas trace elements such as Al and Ti can. Additionally, changes in trace element content can reveal a decrease in the homogenization temperatures and can thus be used to infer the action of the cooling–related gold precipitation mechanism.

7.1. Acidity Changes

Precipitation mechanisms have been proposed for each gold deposit within the Muping–Rushan gold belt, including water–rock reactions and fluid immiscibility [50,51,52], fluid boiling [51,53,54], mixing and immiscibility [55], unmixing [56], and changes in oxygen fugacity [57]. These mechanisms were inferred based on the fluid inclusion assemblage in quartz belonging to different mineralization stages. Thus fluid mixing, phase separation and other hydrothermal activities may indeed have occurred, and the quartz has preserved evidence of this activity. If gold did precipitate due to phase separation, no gold is found in the fluid inclusions.
Quartz and pyrite are the main gold-bearing minerals. According to the mineralogical analysis, gold occurs in fractures in pyrite and in several kinds of quartz. Sericitization is a common alteration type in the gold deposit (Figure 2b and Figure 3c), and the sericite coexists with pyrite and gold (Figure 5b,c). Some feldspar and albite will have been altered to sericite (Figure 5a), and sericite formation will have consumed H+, reducing acidity.
The Al concentration in hydrothermal quartz does not reflect its formation temperature, however, previous study indicates the aqueous Al concentration shows a negative correlation with pH [2]. Of the four main kinds of quartz in the Jinqingding gold deposit, Qb and Qc may form during mineralization, while the other types apparently formed prior to or after the mineralization. A comparison of the Al contents of the different types of quartz shows an anomalously low Al concentration in Qc (Figure 7), which indicates a decrease in acidity. In Figure 8b, Qc overgrowing Qb grains is shown to have a lower Al content than that of Qb in grain A and a narrower range in Al content than Qb in grain B. The total Al content in quartz is very limited, so the Al content of Qc decreases or narrows within a small range.
Free gold precipitation may occur due to several factors such as a change in acidity, cooling, unmixing, or other mechanisms [49]. A change in pH is reflected by variation in the Al content of the quartz and sericites in fractures. Changes in acidity do not affect the solubility of gold in the ore fluid [58] but instead lead to the precipitation of sulfide. The reducing sulfur in the ore fluid is consumed when the wallrock reacts with the ore fluid, and chalcopyrite and other sulfides may precipitate [12]. Gold hydrosulfide then becomes unstable, and gold precipitates.

7.2. Cooling

In grain A (Figure 8), under lithostatic pressure (7.77 Kb), the estimated formation temperature of Qb is about 294–310 °C and that of Qc is about 275–282 °C; under hydrostatic pressure (1 Kb), these ranges change to 204–217 °C and 188–194 °C, respectively (Figure 8d). In grain B, under lithostatic pressure (7.77 Kb), the estimated formation temperature of Qb is about 282–283 °C and that of Qc is about 273–279 °C; under hydrostatic pressure (1 Kb), the ranges become about 194–195 °C and 186–192 °C (Figure 8d). Under hydrostatic pressure and lithostatic pressure, the estimated formation temperatures correspond to homogenization temperatures (268 °C) and fluid inclusion explosion temperature (345 °C) [46].
The temperature gap between the Qb and Qc indicates cooling during quartz overgrowth. These two grains formed after Qa but during the Qb and Qc stages, and this cooling was likely an important means of gold precipitation. The addition of rainwater or extension of ore-controlling faults could lead to cooling. When the temperature decreases, the solubility of gold in the ore fluid reduces [49], so gold will precipitate.

7.3. Water–Rock Reaction in Sulfide–Quartz Vein Type Jinqingding Gold Deposit

Variations in the trace element contents in four main types of quartz indicate that gold precipitated due to changes in acidity and cooling of the ore fluid. An Al content decrease corresponds to sericitization in the wallrock and orebody, which is consistent with an acidity change. A difference in the Ti values of Qb and Qc shows a reduction in the formation temperature of the quartz.
In the Jiaodong peninsula, water–rock reaction and phase separation are considered to be the main gold precipitation mechanism in the altered rock type and sulfide–quartz vein type gold deposit, respectively [13,16,59,60]. In the Jinqingding gold deposit, sericitization may have occurred during mineralization (Figure 3c and Figure 5a), sericites appear with pyrite in fractures in the quartz, and some, along with free gold, fill in fractures in pyrite (Figure 5b,c). The Al content decrease corresponds to sericitization in the wallrock and orebody, which is consistent with the acidity change. Acidity changes and cooling may be two results of water–rock reaction. This research provides evidence of water–rock reaction in the sulfide–quartz vein type Jinqingding gold deposit, combining the sericitization, acidity changes and cooling, water–rock reaction is likely an efficient means of gold precipitation. Sericitization could be used as indicator of gold occurrence or mineralization in the Jinqingding gold deposit.

Supplementary Materials

The following are available online at https://www.mdpi.com/2075-163X/9/5/326/s1, Table S1: EPMA-derived Al content in different types of quartz in the Jinqingding gold deposit, Table S2: LA-ICP-MS-derived trace element content in quartz and estimated formation temperatures of quartz in the Jinqingding gold deposit.

Author Contributions

B.C. and J.D. conceived and designed the ideas; B.C. performed the experiments; B.C., H.W. and X.J. analyzed the data; B.C. prepared the original draft; H.W. and X.J. reviewed and edited the draft.

Funding

This research was funded by the National Key Research Program of China (Grant No. 2017YFC0601501, Grant No. 2016YFC0600107-4), the National Mineral Resources Assessment Project (41372007, DD20190193), the National Natural Science Foundation of China (Grant No. 41572069), funds from the State Key Laboratory of Geological Processes and Mineral Resources, the China University of Geosciences (Grant No. MSFGPMR201804), and Project 111 under the Ministry of Education and the State Administration of Foreign Experts Affairs, China (Grant No. B07011) and the China Scholarship Council (No. 201506400013).

Acknowledgments

Many thanks to Zhongliang Wang, Yue Liu, Shengxun Sai and Sirui Wang from the China University of Geosciences (Beijing) for help during fieldwork. Many thanks to the geologists at the Jinzhou Mining Company for their assistance in fieldwork at the Jinqingding gold deposit. Many thanks to Erin Marsh and David Adams from USGS in Denver, and Thomas Monecke from the Colorado School of Mines for the help during the in situ study. Many thanks to the reviewers.

Conflicts of Interest

The authors declare no conflict of interest.

References

  1. Goldfarb, R.J.; Santosh, M.; Deng, J.; Yang, L.-Q. The giant Jiaodong gold deposits, China: Orogenic gold in a unique tectonic setting or a unique gold deposit type? In Proceedings of the 2013 GSA Annual Meeting in Denver: 125th Anniversary of GSA, Denver, CO, USA, 27–30 October 2013; The Geological Society of America: Boulder, CO, USA, 2013; p. 298. [Google Scholar]
  2. Goldfarb, R.J.; Groves, D.I. Orogenic gold: Common or evolving fluid and metal sources through time. Lithos 2015, 233, 2–26. [Google Scholar] [CrossRef]
  3. Deng, J.; Wang, C.; Bagas, L.; Santosh, M.; Yao, E. Crustal architecture and metallogenesis in the south–eastern north china craton. Earth Sci. Rev. 2018, 182, 251–272. [Google Scholar] [CrossRef]
  4. Yang, L.-Q.; Deng, J.; Goldfarb, R.J.; Zhang, J.; Gao, B.-F.; Wang, Z.-L. 40Ar/39Ar geochronological constraints on the formation of the Dayingezhuang gold deposit: New implications for timing and duration of hydrothermal activity in the Jiaodong gold province, China. Gondwana Res. 2014, 25, 1469–1483. [Google Scholar] [CrossRef]
  5. Yang, L.-Q.; Deng, J.; Wang, Z.-L.; Zhang, L.; Goldfarb, R.J.; Yuan, W.-M.; Weinberg, R.F.; Zhang, R.-Z. Thermochronologic constraints on evolution of the Linglong Metamorphic Core Complex and implications for gold mineralization: A case study from the Xiadian gold deposit, Jiaodong Peninsula, eastern China. Ore Geol. Rev. 2016, 72, 165–178. [Google Scholar] [CrossRef]
  6. Chen, B.H.; Wang, Z.L.; Li, H.L.; Li, J.K.; Li, J.L.; Wang, G.Q. Evolution of ore fluid of the Taishang gold deposit, Jiaodong: Constraints on REE and trace element component of auriferous pyrite. Acta Petrol. Sin. 2014, 30, 2518–2532, (In Chinese with English abstract). [Google Scholar]
  7. Yang, L.Q.; Deng, J.; Wang, Z.L.; Zhang, L.; Guo, L.N.; Song, M.C; Zheng, X.L. Mesozoic gold metallogenic system of the Jiaodong gold province, eastern China. Acta Petrol. Sin. 2014, 30, 2447–2467, (In Chinese with English abstract). [Google Scholar]
  8. Mills, S.E.; Tomkins, A.G.; Weinberg, R.F.; Fan, H.-R. Implications of pyrite geochemistry for gold mineralisation and remobilisation in the Jiaodong gold district, northeast China. Ore Geol. Rev. 2015, 71, 150–168. [Google Scholar] [CrossRef]
  9. Zhang, L.; Yang, L.-Q.; Wang, Y.; Weinberg, R.F.; An, P.; Chen, B.-Y. Thermochronologic constrains on the processes of formation and exhumation of the Xinli orogenic gold deposit, Jiaodong Peninsula, eastern China. Ore Geol. Rev. 2017, 81, 140–153. [Google Scholar] [CrossRef]
  10. Zhang, L.; Yang, L.-Q.; Deng, J.; Weinberg, R.F.; Groves, D.I.; Wang, Z.-L.; Li, G.-W.; Liu, Y.; Zhang, C.; Wang, Z.-K. Anatomy of a world-class epizonal orogenic-gold system: A holistic thermochronological analysis of the Xincheng gold deposit, Jiaodong Peninsula, eastern China. Gondwana Res. 2019, 70, 50–70. [Google Scholar] [CrossRef]
  11. Zhang, L.; Li, G.W.; Zheng, X.L.; An, P.; Chen, B.Y. 40Ar/39Ar and fission-track dating constraints on the tectonothermal history of the world-class Sanshandao gold deposit, Jiaodong Peninsula, eastern China. Acta Petrol. Sin. 2016, 32, 2465–2476, (In Chinese with English abstract). [Google Scholar]
  12. Wang, Z.-L.; Yang, L.-Q.; Guo, L.-N.; Marsh, E.; Wang, J.-P.; Liu, Y.; Zhang, C.; Li, R.-H.; Zhang, L.; Zheng, X.-L.; et al. Fluid immiscibility and gold deposition in the Xincheng deposit, Jiaodong Peninsula, China: A fluid inclusion study. Ore Geol. Rev. 2015, 65, 701–717. [Google Scholar] [CrossRef]
  13. Wen, B.-J.; Fan, H.-R.; Santosh, M.; Hu, F.-F.; Pirajno, F.; Yang, K.-F. Genesis of two different types of gold mineralization in the linglong gold field, china: Constrains from geology, fluid inclusions and stable isotope. Ore Geol. Rev. 2015, 65, 643–658. [Google Scholar] [CrossRef]
  14. Deng, J.; Wang, Q.F. Gold mineralization in China: Metallogenic provinces, deposit types and tectonic framework. Gondwana Res. 2016, 36, 219–274. [Google Scholar] [CrossRef]
  15. Yang, L.-Q.; Deng, J.; Wang, Z.-L.; Guo, L.-N.; Li, R.-H.; Groves, D.I.; Danyushevsky, L.V.; Zhang, C.; Zheng, X.-L.; Zhao, H. Relationships Between Gold and Pyrite at the Xincheng Gold Deposit, Jiaodong Peninsula, China: Implications for Gold Source and Deposition in a Brittle Epizonal Environment. Econ. Geol. 2016, 111, 105–126. [Google Scholar] [CrossRef] [Green Version]
  16. Guo, L.-N.; Goldfarb, R.J.; Wang, Z.-L.; Li, R.-H.; Chen, B.-H.; Li, J.-L. A comparison of Jiaojia–and Linglong–type gold deposit ore–forming fluids: Do they differ? Ore Geol. Rev. 2017, 88, 511–533. [Google Scholar] [CrossRef]
  17. Monnier, L.; Lach, P.; Salvia, S.; Melleton, J.; Bailly, L.; Béziata, D.; Monnier, Y.; Gouy, S. Quartz trace-element composition by LA-ICP-MS as proxy for granite differentiation, hydrothermal episodes, and related mineralization: The Beauvoir Granite (Echassières district), France. Lithos 2018, 320, 355–377. [Google Scholar] [CrossRef]
  18. Rusk, B.G.; Lowers, H.A.; Reed, M.H. Trace elements in hydrothermal quartz: Relationships to cathodoluminescent textures and insights into vein formation. Geology 2008, 36, 547–550. [Google Scholar] [CrossRef]
  19. Chen, H.Y. Genetic Mineralogy and Deep Prospects of Jinqingding Gold Deposit in Rushan, East Shandong Province. Master’s Thesis, China University of Geosciences, Beijing, China, 2012. (In Chinese with English abstract). [Google Scholar]
  20. Chen, B.H. Gold Mineralization Geochemistry in Muping–Rushan Gold Belt, Jiaodong Peninsula, China. Ph.D. Thesis, China University of Geosciences, Beijing, China, 2017. (In Chinese with English abstract). [Google Scholar]
  21. Li, J.-W.; Vasconcelos, P.; Zhou, M.-F.; Zhao, X.-F.; Ma, C.-Q. Geochronology of the Pengjiakuang and Rushan gold deposits, eastern Jiaodong gold province, northeastern China: Implications for regional mineralization and geodynamic setting. Econ. Geol. 2006, 101, 1023–1038. [Google Scholar] [CrossRef]
  22. Deng, J.; Yang, L.-Q.; Li, R.-H.; Groves, D.I.; Santosh, M.; Wang, Z.-L.; Sai, S.-X.; Wang, S.-R. Regional structural control on the distribution of world–class gold deposits: An overview from the giant Jiaodong Gold Province, China. Geol. J. 2018, 54, 378–391. [Google Scholar] [CrossRef]
  23. Wang, Z.L. Metallogenic system of Jiaojia gold ore field, Shandong Province, China. Ph.D. Thesis, China University of Geosciences, Beijing, China, 2012. (In Chinese with English abstract). [Google Scholar]
  24. Tan, J.; Wei, J.; Li, Y.; Tan, W.; Guo, D.; Yang, C. Geochemical characteristics of late Mesozoic dikes, Jiaodong Peninsula, North China Craton: Petrogenesis and geodynamic setting. Int. Geo. Rev. 2007, 49, 931–946. [Google Scholar] [CrossRef]
  25. Qiu, Y.; Groves, D.I.; McNaughton, N.J.; Wang, L.-G.; Zhou, T. Nature, age, and tectonic setting of granitoid–hosted, orogenic gold deposits of the Jiaodong Peninsula, eastern North China craton, China. Miner. Deposita 2002, 37, 283–305. [Google Scholar] [CrossRef]
  26. Jahn, B.-M.; Liu, D.; Wan, Y.; Song, B.; Wu, J. Archean crustal evolution of the Jiaodong Peninsula, China, as revealed by zircon shrimp Geochronology elemental and Nd–isotope Geochemistry. Am. J. Sci. 2008, 308, 232–269. [Google Scholar] [CrossRef]
  27. Deng, J.; Wang, Q.; Wan, L.; Liu, H.; Yang, L.; Zhang, J. A multifractal analysis of mineralization characteristics of the Dayingezhuang disseminated–veinlet gold deposit in the Jiaodong gold province of China. Ore Geol. Rev. 2011, 40, 54–64. [Google Scholar] [CrossRef]
  28. Wan, Y.S.; Dong, C.Y.; Xie, H.Q.; Wang, S.J.; Song, M.C.; Xu, Z.Y.; Wang, S.Y.; Zhou, H.Y.; Ma, M.Z.; Liu, D.Y. Formation Ages of Early Precambrian BIFs in the North China Craton: SHRIMP Zircon U–Pb Dating. Acta Geol. Sin. 2012, 86, 1447–1478. (In Chinese) [Google Scholar]
  29. Dong, C.Y.; Wang, S.J.; Liu, D.Y.; Wang, J.G.; Xie, H.Q.; Wang, W.; Song, Z.Y.; Wan, Y.S. Late Paleoproterozoic crustal evolution of the North China Craton and formation time of the Jingshan Group: Constraints from SHRIMP U–Pb zircon dating of meta–intermediate–basic intrusive rocks in eastern Shandong Province. Acta Petrol. Sin. 2010, 27, 1699–1706, (In Chinese with English abstract). [Google Scholar]
  30. Li, X.P.; Liu, Y.J.; Guo, J.H.; Li, H.K.; Zhao, G. Petrogeochemical characteristics of the Paleoproterozoic high–pressure mafic granulite and calc–silicate from the Nanshankou of the Jiaobei terrane. Acta Petrol. Sin. 2013, 29, 2340–2352, (In Chinese with English abstract). [Google Scholar]
  31. Liu, P.H.; Liu, F.L.; Wang, F.; Liu, J.H.; Cai, J. Petrological and geochronological preliminary study of the Xiliu ~2.1Ga meta–gabbro from the Jiaobei terrane, the southern segment of the Jiao–Liao–Ji Belt in the North China Craton. Acta Petrol. Sin. 2013, 29, 2371–2390, (In Chinese with English abstract). [Google Scholar]
  32. Faure, M.; Lin, W.; Monie, P.; Bruguier, O. Paleoproterozoic arc magmatism and collision in Liaodong Peninsula (north–east China). Terra Nova 2004, 16, 75–80. [Google Scholar] [CrossRef]
  33. Jiang, N.; Chen, J.; Guo, J.; Chang, G. In situ zircon U–Pb, oxygen and hafnium isotopic compositions of Jurassic granites from the North China craton: Evidence for Triassic subduction of continental crust and subsequent metamorphism–related 18O depletion. Lithos 2012, 142, 84–94. [Google Scholar] [CrossRef]
  34. Yang, K.-F.; Fan, H.-R.; Santosh, M.; Hu, F.-F.; Wilde, S.A.; Lan, T.-G.; Lu, L.-N.; Liu, Y.S. Reactivation of the Archean lower crust: Implications for zircon geochronology, elemental and Sr–Nd–Hf isotopic geochemistry of late Mesozoic granitoids from northwestern Jiaodong Terrane, the North China Craton. Lithos 2012, 146, 112–127. [Google Scholar] [CrossRef]
  35. Guo, J.H.; Chen, F.K.; Zhang, X.M.; Siebel, W.; Zhai, M.G. Evolution of syn–to post–collisional magmatism from north Sulu UHP belt, eastern China: Zircon U–Pb geochronology. Acta Petrol. Sin. 2005, 21, 1281–1301, (In Chinese with English abstract). [Google Scholar]
  36. Zhang, D.; Xu, H.; Sun, G. Emplacement ages of the Denggezhuang gold deposit and the Kunyushan granite and their geological implications. Geol. Rev. 1995, 41, 415–425. (In Chinese) [Google Scholar]
  37. Hu, S.; Wang, S.; Sang, H.; Qiu, J.; Zhang, R. Isotopic ages of Linglong and Guojialing batholiths in Shandong Province and their geological implication. Acta Petrol. Sin. 1987, 3, 83–89, (In Chinese with English abstract). [Google Scholar]
  38. Guan, K.; Luo, Z.K.; Miao, L.C.; Huang, J.Z. SHRIMP in zircon chronology for Guojialing suite granite in Jiaodong Zhaoye district. Sci. Geol. Sin. 1998, 33, 318–328, (In Chinese with English abstract). [Google Scholar]
  39. Deng, J.; Liu, X.; Wang, Q.; Pan, R. Origin of the Jiaodong–type Xinli gold deposit, Jiaodong Peninsula, China: Constraints from fluid inclusion and C–D–O–S–Sr isotope compositions. Ore Geol. Rev. 2015, 65, 674–686. [Google Scholar] [CrossRef]
  40. Götze, J.; Plötze, M.; Habermann, D. Origin, spectral characteristics and practical applications of the cathodoluminescence (CL) of quartz—A review. Mineral. Petrol. 2001, 71, 225–250. [Google Scholar] [CrossRef]
  41. Penniston-Dorland, S.C. Illumination of vein quartz textures in a porphyry copper ore deposit using scanned cathodoluminescence: Grasberg Igneous Complex, Irian Jaya, Indonesia. Am. Mineral. 2001, 86, 652–666. [Google Scholar] [CrossRef]
  42. Müller, A.; René, M.; Behr, H.-J.; Kronz, A. Trace elements and cathodoluminescence of igneous quartz in topaz granites from the Hub Stock (Slavkovský Les Mts., Czech Republic). Mineral. Petrol. 2003, 79, 167–191. [Google Scholar] [CrossRef]
  43. Landtwing, M.R.; Pettke, T. Relationships between SEM–cathodoluminescence response and trace–element composition of hydrothermal vein quartz. Am. Mineral. 2005, 90, 122–131. [Google Scholar] [CrossRef]
  44. Müller, A.; Herrington, R.; Armstrong, R.; Seltmann, R.; Kirwin, D.J.; Stenina, N.G.; Kronz, A. Trace elements and cathodoluminescence of quartz in stockwork veins of Mongolian porphyry–style deposits. Miner. Depos. 2010, 45, 707–727. [Google Scholar] [CrossRef]
  45. Longerich, H.P.; Jackson, S.E.; Günther, D. Laser Ablation Inductively Coupled Plasma Mass Spectrometric Transient Signal Data Acqusition and Analyte Concentration Calculation. J. Anal. Atom. Spectrom. 1996, 11, 899–904. [Google Scholar] [CrossRef]
  46. Li, Y.P. The genesis of the Rushan gold deposits in east Shandong. Miner. Depos. 1992, 11, 165–172. (In Chinese) [Google Scholar]
  47. Thomas, J.B.; Watson, E.B.; Spear, F.S.; Shemella, P.T.; Nayak, S.K.; Lanzirotti, A. TitaniQ under pressure: The effect of pressure and temperature on the solubility of Ti in quartz. Contrib. Mineral. Petrol. 2010, 160, 743–759. [Google Scholar] [CrossRef]
  48. Thomas, J.B.; Watson, E.B. Application of the Ti–in–quartz thermobarometer to rutile–free systems. Reply to: A comment on: “TitaniQ under pressure: the effect of pressure and temperature on the solubility of Ti in quartz” by Thomas et al. Contrib. Mineral. Petrol. 2012, 164, 369–374. [Google Scholar] [CrossRef]
  49. Pokrovski, G.S.; Akinfiev, N.N.; Borisova, A.Y.; Zotov, A.V; Kouzmanov, K. Gold speciation and transport in geological fluids: Insights from experiments and physical–chemical modelling. Geol. Soc. Spec. Publ. 2014, 402, 9–70. [Google Scholar] [CrossRef]
  50. Hu, F.-F.; Fan, H.-R.; Zhai, M.-G.; Jin, C.-W. Fluid evolution in the Rushan lode gold deposit of Jiaodong Peninsula, eastern China. J. Geochem. Explor. 2006, 89, 161–164. [Google Scholar] [CrossRef]
  51. Hu, F.F.; Fan, H.R.; Yang, K.F.; Shen, K.; Zhai, M.G.; Jin, C.W. Fluid inclusions in the Denggezhuang lode gold deposit at Muping, Jiaodong Peninsula. Acta Petrol. Sin. 2007, 23, 2155–2164, (In Chinese with English abstract). [Google Scholar]
  52. Zhou, Q.F. Genetic Mineralogy and Deep Prospects of the Yinggezhuang Gold Deposit in Rushan County, Jiaodong. Master Thesis, China University of Geosciences, Beijing, China, 2010. (In Chinese with English abstract). [Google Scholar]
  53. Zeng, Q.; Liu, J.; Liu, H.; Shen, P.; Zhang, L. The Ore–forming Fluid of the Gold Deposits of Muru Gold Belt in Eastern Shandong, China—A Case Study of Denggezhuang Gold Deposit. Resour. Geol. 2006, 56, 375–384. [Google Scholar] [CrossRef]
  54. Hu, F.F.; Fan, H.R.; Yu, H.; Liu, Z.H.; Song, L.F.; Jin, C.W. Fluid inclusions in the Sanjia lode gold deposit, Jiaodong Peninsula of eastern China. Acta Petrol. Sin. 2008, 24, 2037–2044, (In Chinese with English abstract). [Google Scholar]
  55. Shen, P.; Shen, Y.; Li, G.; Liu, T.; Zeng, Q.; Li, H. A study on structure–fluid–mineralization system in the Jinniushan Gold deposit, East Shandong. Chin. J. Geol. 2004, 39, 272–283, (In Chinese with English abstract). [Google Scholar]
  56. Cai, Y.C.; Fan, H.R.; Yang, K.F.; Hu, F.F.; Yu, H.; Liu, Y.M.; Lan, T.G. Ore–forming fluids, stable isotope and mineralizing age of the Hubazhuang gold deposit, Jiaodong Peninsula of eastern China. Acta Petrol. Sin. 2011, 27, 1341–1351, (In Chinese with English abstract). [Google Scholar]
  57. Lan, T.G.; Fan, H.R.; Hu, F.F.; Yang, K.F.; Liu, X.; Liu, Z.H.; Song, Y.B.; Yu, H. Characteristics of ore–forming fluids and ore genesis in the Shicheng gold deposit, Jiaodong Peninsula of eastern China. Acta Petrol. Sin. 2010, 26, 1512–1522, (In Chinese with English abstract). [Google Scholar]
  58. Gibert, F.; Pascal, M.L.; Pichavant, M. Gold solubility and speciation in hydrothermal solutions: Experimental study of the stability of hydrosulphide complex of gold (AuHS) at 350 to 450 °C and 500 bars. Geochem. Cosmochim. Acta 1998, 62, 2931–2947. [Google Scholar] [CrossRef]
  59. Fan, H.R.; Zhai, M.G.; Xie, Y.H.; Yang, J.H. Ore–forming fluids associated with granite–hosted gold mineralization at the Sanshandao deposit, Jiaodong gold province, China. Miner. Depos. 2003, 38, 739–750. [Google Scholar] [CrossRef]
  60. Yang, L.-Q.; Deng, J.; Guo, L.-N.; Wang, Z.-L.; Li, X.-Z.; Li, J.-L. Origin and evolution of ore fluid, and gold–deposition processes at the giant Taishang gold deposit, Jiaodong Peninsula, eastern China. Ore Geol. Rev. 2016, 72, 585–602. [Google Scholar] [CrossRef]
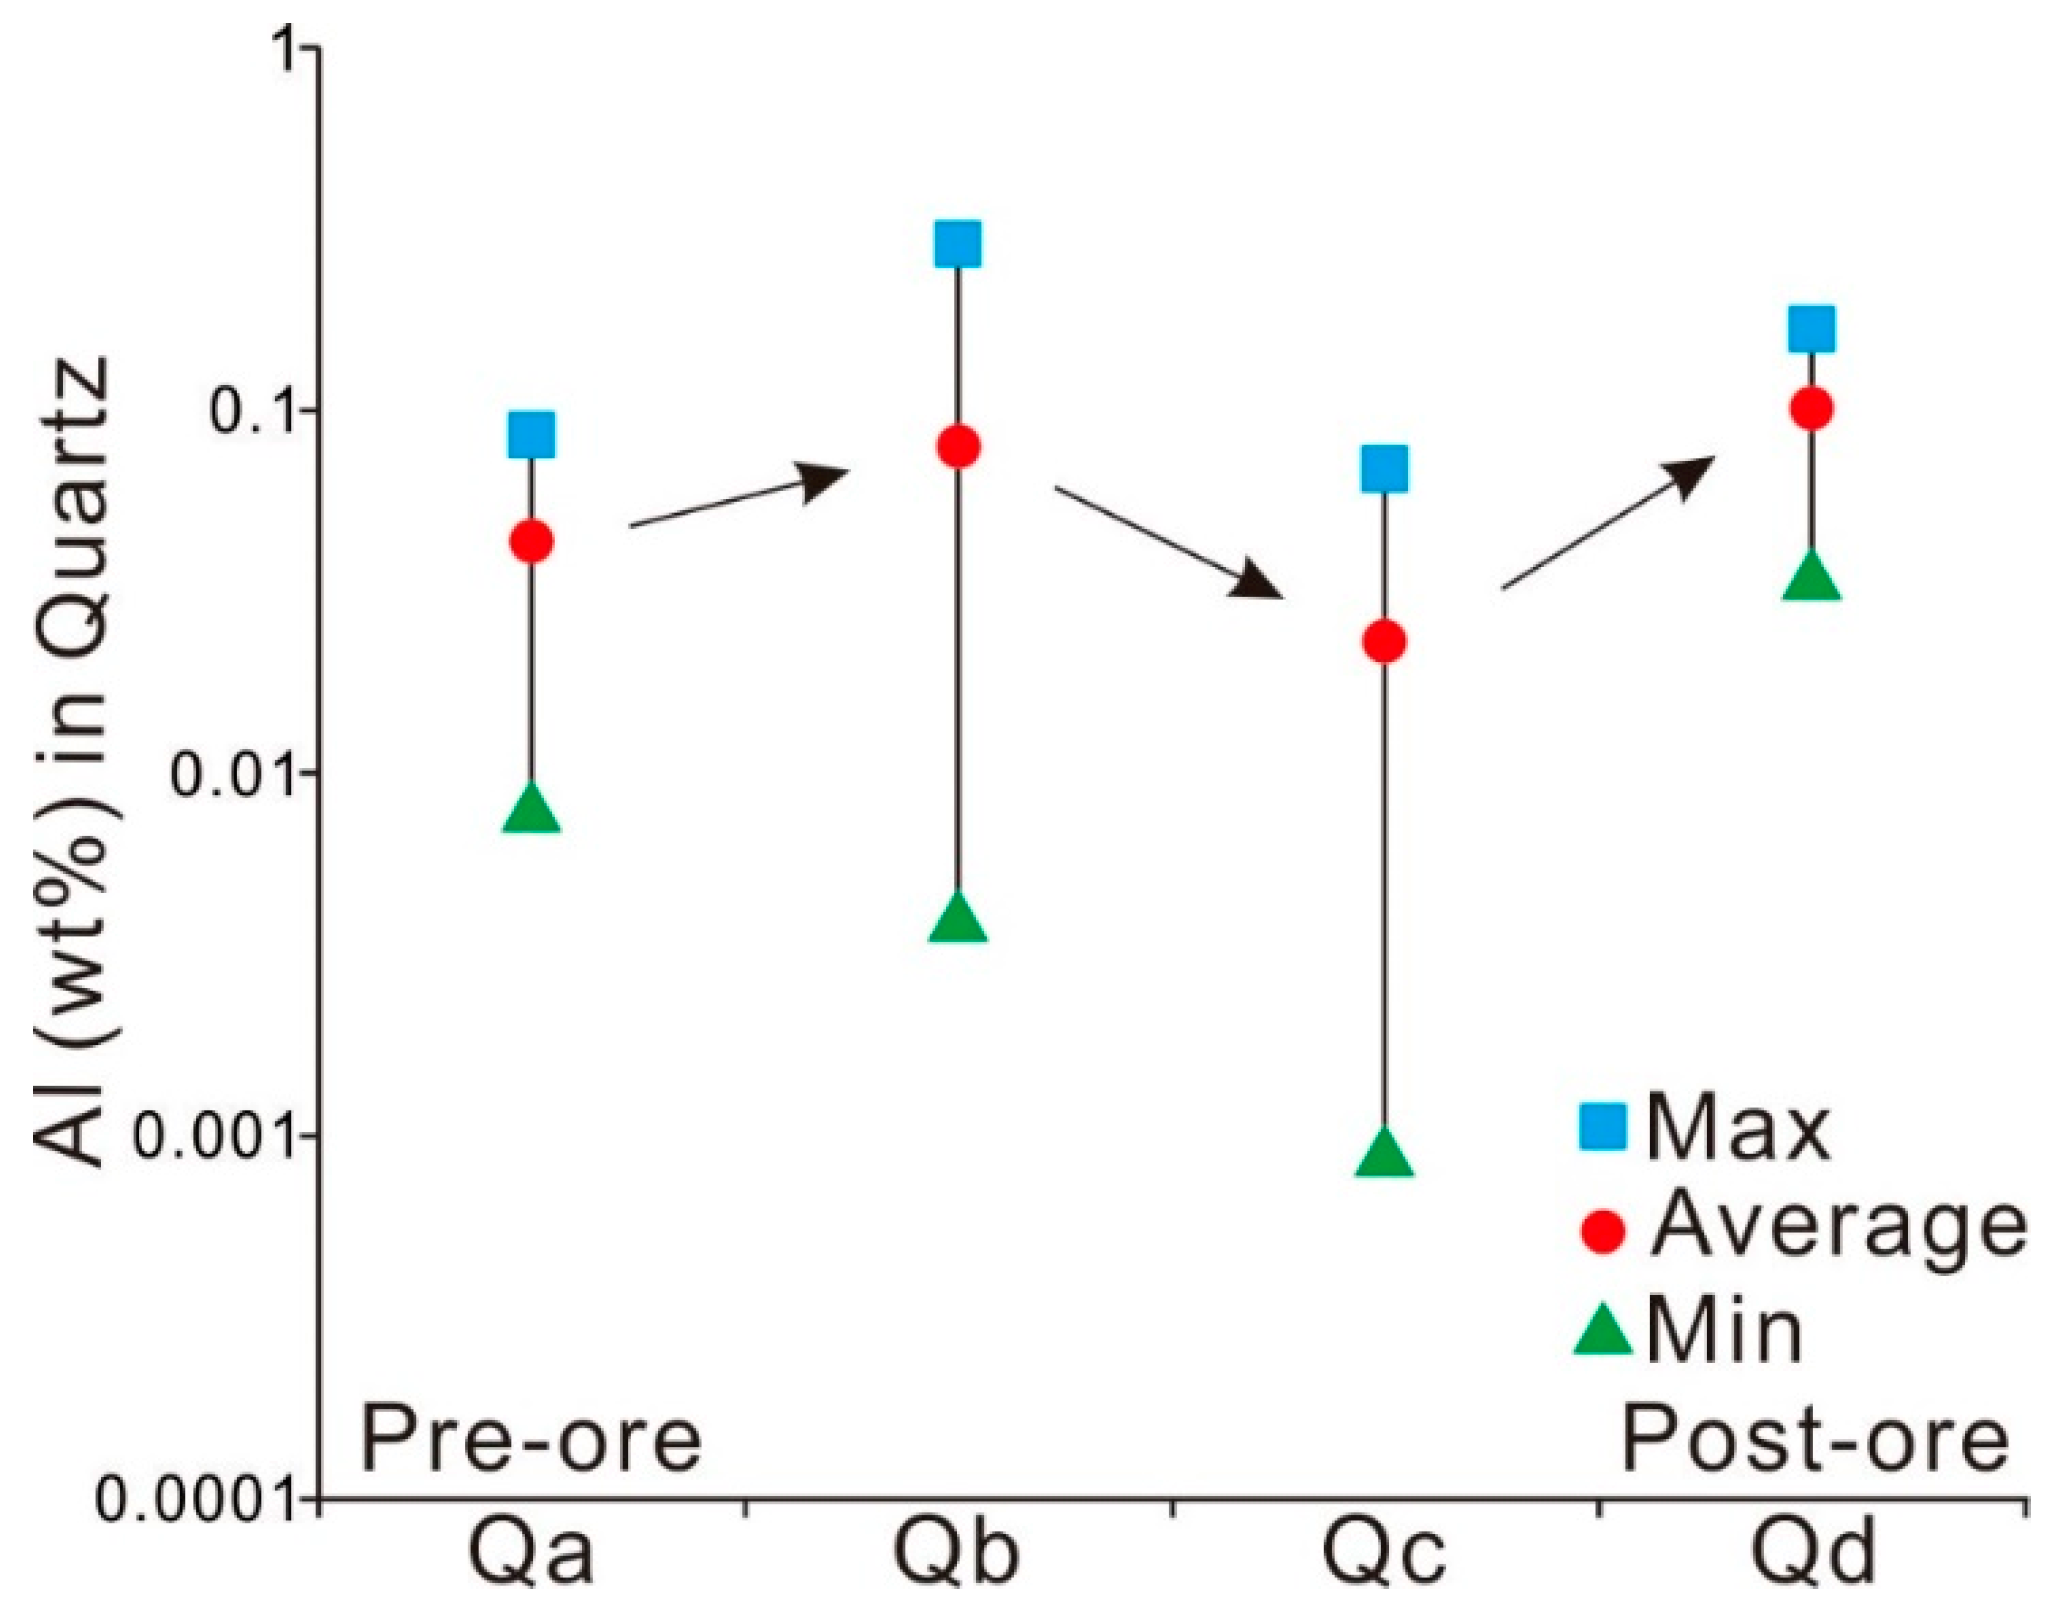
Figure 1. Regional geological map: (a) Geological map of the Eastern Jiaodong Peninsula; (b) geological map of the Muping–Rushan gold belt (modified from [15]; ages are from [20,21]). HQF—Haiyang–Qingdao fault; HSF—Haiyang–Shidao fault; MRF—Muping–Rushan fault; TCF—Taocun fault; WQYF—Wulian–Qingdao–Yantai fault; WHF—Weihai fault; RCF—Rongcheng fault.
Minerals 09 00326 g001
Figure 2. Geological maps of the Jinqingding gold deposit: (a) plan view; (b) section (modified from [20]).
Minerals 09 00326 g002
Figure 3. Alteration and mineralization types in the Jinqingding gold deposit: (a) A quartz–sulfide vein with unaltered wallrock; (b) K-feldspar alteration in the wallrock; (c) sericitization in the wallrock of a quartz–sulfide vein; (d) milky and smoke grey quartz (Qb + Qc + Qd) plus massive, disseminated pyrites in a hand sample of quartz–sulfide vein; (e) smoke grey quartz (Qb + Qc + Qd) in a hand sample of quartz–sulfide vein in which pyrites occur as veins (Py); (f) The earliest quartz (Qa) has a comb structure. Py—pyrite; Q—quartz.
Minerals 09 00326 g003
Figure 4. Features of different types of quartz: (a) Qa is zoned and is crosscut by pyrite; (b) cathodoluminescence (CL) shows zoning in Qa and gold grains within it; (c) gold occurs in Qb; (d) quartz outside and inside the pyrite goes extinct at the same angle; (e) quartz inside and outside pyrite has similar CL features; (f) recrystallized (Qc) quartz contains free gold and has darker CL features than other quartz types; (g) recrystallized quartz around a crosscutting pyrite vein; (h) quartz (Qd) in fractures in pyrite shows different CL features from Qb. Py—Pyrite; Q—Quartz; Au—Gold; Gn—Galena. See Section 4 for description of red circles.
Minerals 09 00326 g004
Figure 5. Sericite occurrence in the Jinqingding gold deposit: (a) Feldspar altered to sericite; (b) a QEMSCAN mineral map showing sericite coexisting with gold in pyrite fractures; (c) a QEMSCAN map showing the coexistence of sericite and pyrite in Qb. White color part is the glue on the thin section.
Minerals 09 00326 g005
Figure 6. Paragenesis of quartz and other minerals. The thickness of the line indicates scale and intensity of mineral occurrence.
Minerals 09 00326 g006
Figure 7. EPMA-derived Al content in different types of quartz.
Minerals 09 00326 g007
Figure 8. Trace element content in quartz as obtained via LA-ICP-MS. (a) CL shows differences between quartz cores and rims; (b) Al content in the quartz; (c) Ti content in the quartz; (d) estimated formation temperature of quartz under lithostatic and hydrostatic pressure.
Minerals 09 00326 g008
Table 1. Electron probe micro-analyzer (EPMA)-derived Al content in different types of quartz in the Jinqingding gold deposit.
Al (wt %)Qa (n = 5)Qb (n = 20)Qc (n = 7)Qd (n = 2)
Max0.0860.2840.0690.167
Average0.0430.0790.0230.101
Min0.0080.0040.0010.036
The number in brackets is the number of spots on quartz.
Table 2. Laser ablation-inductively coupled plasma-mass spectrometry (LA-ICP-MS)-derived trace element content in quartz and estimated formation temperatures of quartz in the Jinqingding gold deposit.
PositionElement and Formation Temperature Under Different PressuresQbQc
MaxAverageMinMaxAverageMin
Grain AAl (ppm)33102242.6671548393192.66754
Ti (ppm)12.19.4337.95.75.24.6
T (°C, 1 Kb)217209204194192188
T (°C, 7.77 Kb)310300294282279275
Grain BAl (ppm)615548423156.426
Ti (ppm)5.85.7375.615.244.8644.3
T (°C, 1 Kb)195195194192190186
T (°C, 7.77 Kb)283283282279277273

