Article

Molecular Modeling of Interactions between N-(Carboxymethyl)-N-tetradecylglycine and Fluorapatite

College of Resources and Civil Engineering, Northeastern University, Shenyang 110819, China
*
Author to whom correspondence should be addressed.
Minerals 2019, 9(5), 278; https://doi.org/10.3390/min9050278
Submission received: 28 March 2019 / Revised: 25 April 2019 / Accepted: 30 April 2019 / Published: 6 May 2019

Abstract

:
In this study, a flotation collector N-(carboxymethyl)-N-tetradecylglycine (NCNT) was introduced for the purpose of energy-saving, and its adsorption ability on a fluorapatite (001) surface was investigated by density functional theory calculation. The results of frontier molecular orbital analysis of NCNT and adsorption energy between NCNT and fluorapatite (FAp) showed that NCNT possessed better activity and stronger interactions in the reagent–FAp system than oleic acid (OA). A simulation model revealed that the adsorption positions of NCNT on the fluorapatite surface are calcium atoms, at which NCNT chemisorbed on (001) fluorapatite surface via a bidentate geometry involving the formation of two Ca–O bonds. Flotation experiments verified that NCNT had a good recovery of 92.27% on FAp at pH 3.5, which was slightly lower than OA. Moreover, NCNT was used at 16 °C, which was much lower than the OA’s service condition (25 °C).

1. Introduction

Fluorapatite (FAp, Ca10(PO4)6F) is the most important of all apatites, including chlorapatite and hydroxyapatite, due to its large natural reserves. It is a major raw material of phosphate fertilizer and, as the global consumption of phosphate fertilizer reaches 90 million tons per year, FAp has high commercial value around the world. Hence, it is very important to exploit and concentrate FAp [1].
There are many methods for FAp concentration, with the most widely recognized being flotation [2]. This method is very effective for separating minerals from gangue, based on differences in hydrophobicity between mineral surfaces [3]. To meet production requirements, such differences in hydrophobicity can be magnified by the addition of a collector. Three types of collectors, including anionic, cationic, and amphoteric collectors, are commonly used in FAp flotation processes. Anionic collectors are a widely used phosphorite collector. Alkyl hydroxamic acid [4], vegetal oil [5,6], and new compounds such as Atrac [7], have been employed to separate apatite from dolomite, silicate, and magnetite, respectively. Mixed anionic collectors have been adopted to improve the phosphate flotation recovery [8]. A cationic collector is usually used in a reverse flotation process to separate phosphorite from silicate [9]. An amphoteric collector is relatively new compared to the other two collectors. Recently, dodecyl-N-carboxyethyl-N-hydroxyethyl-imidazoline [10], dodecyl-N-carboxyethyl-N-hyroxyethyl-imidazoline [11] and alpha-benzol amino benzyl phosphoric acid [12] have been synthesized, and used in phosphate mineral separations. Among the three types of collectors, anionic collectors have the advantage of being less expensive. However, sodium oleate, the most commonly used anionic collector, requires relatively high temperature in the flotation progress, therefore it is costly and unfriendly to the environment.
In the present study, to counter the energy cost problem, a new anionic collector, N-(carboxymethyl)-N-tetradecylglycine (NCNT) was introduced, which is low-cost and can be applied at room temperature. NCNT’s interaction mechanism with FAp was investigated using molecular simulation methods.
Molecular simulation is a common practice for flotation studies at the atomic level and includes first principle calculations, the Monte Carlo method, and the molecular dynamic method. A considerable number of theoretical works on apatite have been published. The bulk structure properties of Ca5(PO4)3X (X = F, Cl or Br) have been investigated by the density functional theory (DFT) method with the generalized gradient approximation [13]. The structure and energy of FAp surfaces have been modeled by Mkhonto using the classical energy minimization technique [14]. The adsorption system of different adsorbates, including water [15], glycine [16,17], alkyl hydroxamate [18], diphosphonic acid [19], citric acid [20], and some small organic adsorbates [21], on apatite surfaces had been well investigated using the molecular dynamic simulation method and semi-empirical quantum mechanical calculations. However, to our present knowledge, the DFT method has not yet been introduced into the surface structure computing and adsorption system simulation of FAp [22,23].
In this study, the energies of FAp surfaces, optimization convergence tests on surface depth and vacuum were performed to obtain the optimal surface model. Nest, frontier molecular orbital and adsorption energies were computed to compare the interaction strengths of NCNT and OA on FAp surfaces. Then, the adsorption mechanism of NCNT on FAp (001) surface was explained from the partial density of states and electron density differences. Finally, flotation experiments were executed to investigate the NCNT’s flotation ability.

2. Computational Details and Experimental Method

Calculations were carried out using the Cambridge serial total energy package [24,25] (CASTEP) and DMol3 modules [26,27]. The CASTEP module was employed to optimize geometry, calculate energies, and analyze the properties of adsorbates and mineral surfaces. The DMol3 module was used to calculate frontier orbital energies. Parameter consistency was maintained in geometry optimization and property analysis.

2.1. NCNT Characterization

The frontier molecular orbitals of adsorbates were calculated using the DMol3 modules, after their optimization by CASTEP. The calculation parameters of the collectors were consistent with the FAp bulk and surface optimization.

2.2. FAp Bulk Structure Optimization

Different exchange-correlation functionals of the generalized gradient approximation (GGA), cutoff energies for the plane wave basis set and Brillouin zone k-points [28,29] were tested. The lattice parameters of the computed bulk were compared to the experimental values from XRD spectra of the real mineral to verify the validity of the simulation parameters. Ultrasoft pseudopotentials were adopted and the calculated atomic orbitals were H—1s1, C—2s22p2, N—2s22p3, O—2s22p4, F—2s22p5, P—3s23p3, Ca—3s23p64s2 [30]. Convergence criteria were set as follows: when the Broyden–Fletcher–Goldfarb–Shanno (BFGS) algorithm was used, 2 × 10⁻⁵ eV for energy, 0.05 eV/Å for maximum force, 0.1 GPa for maximum stress, and 2 × 10⁻³ Å for maxmum displacement, the SCF tolerance was set at 2 × 10⁻⁶ eV/atom.

2.3. Surface Energy Calculation

Surface energy was the measurement of bond destruction that occurred during surface creation. A small surface energy of a certain crystal surface means that the surface has more stable thermodynamic stability. For the same surface, different slab terminations might impact the surface thermodynamic stability and adsorption activity with the collector. Therefore, it was necessary to investigate the surface energies of different slab terminations. The surface energy was calculated by Equation (1).
Esurf = [Eslab – (Nslab/Nbulk) Ebulk]/2A
where Eslab and Ebulk refer to the total energies of the FAp surface slab and bulk unit cell, respectively; Nslab and Nbulk are the numbers of atoms contained in the slab and bulk unit cells, respectively; A is the unit area; and 2 signifies two surfaces along the z-axis in the FAp surface slab.

2.4. Adsorption Energy Calculation

The relative affinity of the interactions of the optimized FAp mineral surface and various adsorbates was quantified in terms of the total adsorption energy (Eads), defined as Equation (2).
Eads = Ecomplex – (Eadsorbate + Emineral)
where Ecomplex is defined as the energy of the optimized adsorption system of the collector and FAp, and Eadsorbate and Emineral are the energy of the adsorbate and FAp surface, respectively [31].

2.5. Flotation Experiment

Flotation experiments were performed using an XFG 1150 flotation machine (Jilin Exploration Machinery Plant, Changchun, China). The procedure was as follows: the pure FAp mineral sample (2.00 g) was mixed with deionized water (30 mL) and then added in the flotation cell. The slurry was stirred for 3 min at a rotation rate of 1992 r/min. The pH regulator (0.1% HCl or NaOH solution) and collector (NCNT/OA) were added into the cell at 2 min intervals. After the flotation procedure, the concentrate and the tailing were dried separately for the recovery rate calculations.

3. Results

3.1. Structure and Property of NCNT

NCNT contained two acetic acid groups connected by an nitrogen (N) atom and a shorter hydrophobic carbon chain (C14) than OA for the purpose of good adsorbability on FAp as well as better solubility. The structure of NCNT and OA are shown in Figure 1.
The frontier molecular orbitals of NCNT were calculated to represent the reaction activity between NCNT and the FAp surface. Frontier molecular orbitals were presented by Fukui and constituted with the highest occupied molecular orbital (HOMO) and the lowest unoccupied molecular orbital (LUMO). The energy gap (EHOMO-LUMO) between these two molecular orbitals was a criterion of compound activity, with a higher value indicating better compound activity [32]. The calculation results for the adsorbates are shown in Table 1.
According to the values in Table 1, the EHOMO-LUMO increased as H2O < OH < OA < NCNT < OA < NCNT2−. According to frontier molecular orbital theory, the activity of the ionization state of NCNT (NCNT2−) was remarkably stronger than its molecular state, indicating that the ionization state of NCNT was more likely to interact with FAp. This was mainly because lone pair electrons from a p orbital of an oxygen (O) atom in −OH and the π bond of C=O formed a p–π conjugation. This conjugation induced the electrons of the O atom in −OH to drift toward the π bond and make the dissociation of the H atom in OH easier. On the other hand, NCNT2− more easily reacted with the FAp surface than with OA, water, and hydroxyl ions, indicating that the adsorption ability of NCNT2− might be stronger than that of OA, and it could repel the hydration shell, and then absorb onto the FAp surface.
The HOMO of NCNT2− and OA showed that a large proportion of the HOMO of NCNT2− was provided by O atoms and a small portion was provided by N atoms (Figure 2). The HOMO of OA was afforded only by O atoms.

3.2. Simulation Parameter Screening and Rationality Verification of FAp Bulk

To obtain a rational model, the simulation parameters were screened as follows [33]. The geometry optimizations of FAp bulk were executed under the condition of 340 eV cutoff energy and Brillouin zone k-point of 2 × 2 × 2 using different DFT functionals, including Perdew–Burke–Ernzerhof (PBE), revised Perdew–Burke–Ernzerhof (RPBE), Perdew–Wang’s 1991 (PW91), Wu–Cohen (WC) revised and Perdew–Burke–Ernzerhof solids (PBESOL). The results were compared with experimental values [34] and are listed in Table 2.
The calculated lattice parameters agreed well with the experimental results when the GGA-PBE functional was adopted, and the difference between simulation and experimental results was 0.593%, which was acceptable in theoretical calculations. The total energies of cutoff energy and Brillouin zone k-point for convergence testing were calculated using this functional (Figure 3).
With a cutoff energy of 340 eV and using the PBE functional, total energy decreased with increased cutoff energy. When the k-point was beyond 2 × 2 × 2, the total energy converged very well. When the cutoff energy was >340 eV, the difference in total energies was <1 eV. Thus, the k-point 2 × 2 × 2 and cutoff energy at 340 eV were suitable for calculation accuracy.
To ensure that the present simulation methods were credible, the simulated X-ray diffraction (XRD) was compared with experimental results, which showed that the simulated FAp XRD was in good agreement with the experimental spectra (Figure 4). This indicated that the simulated bulk was reliable and the parameter settings mentioned above rational and reasonable.

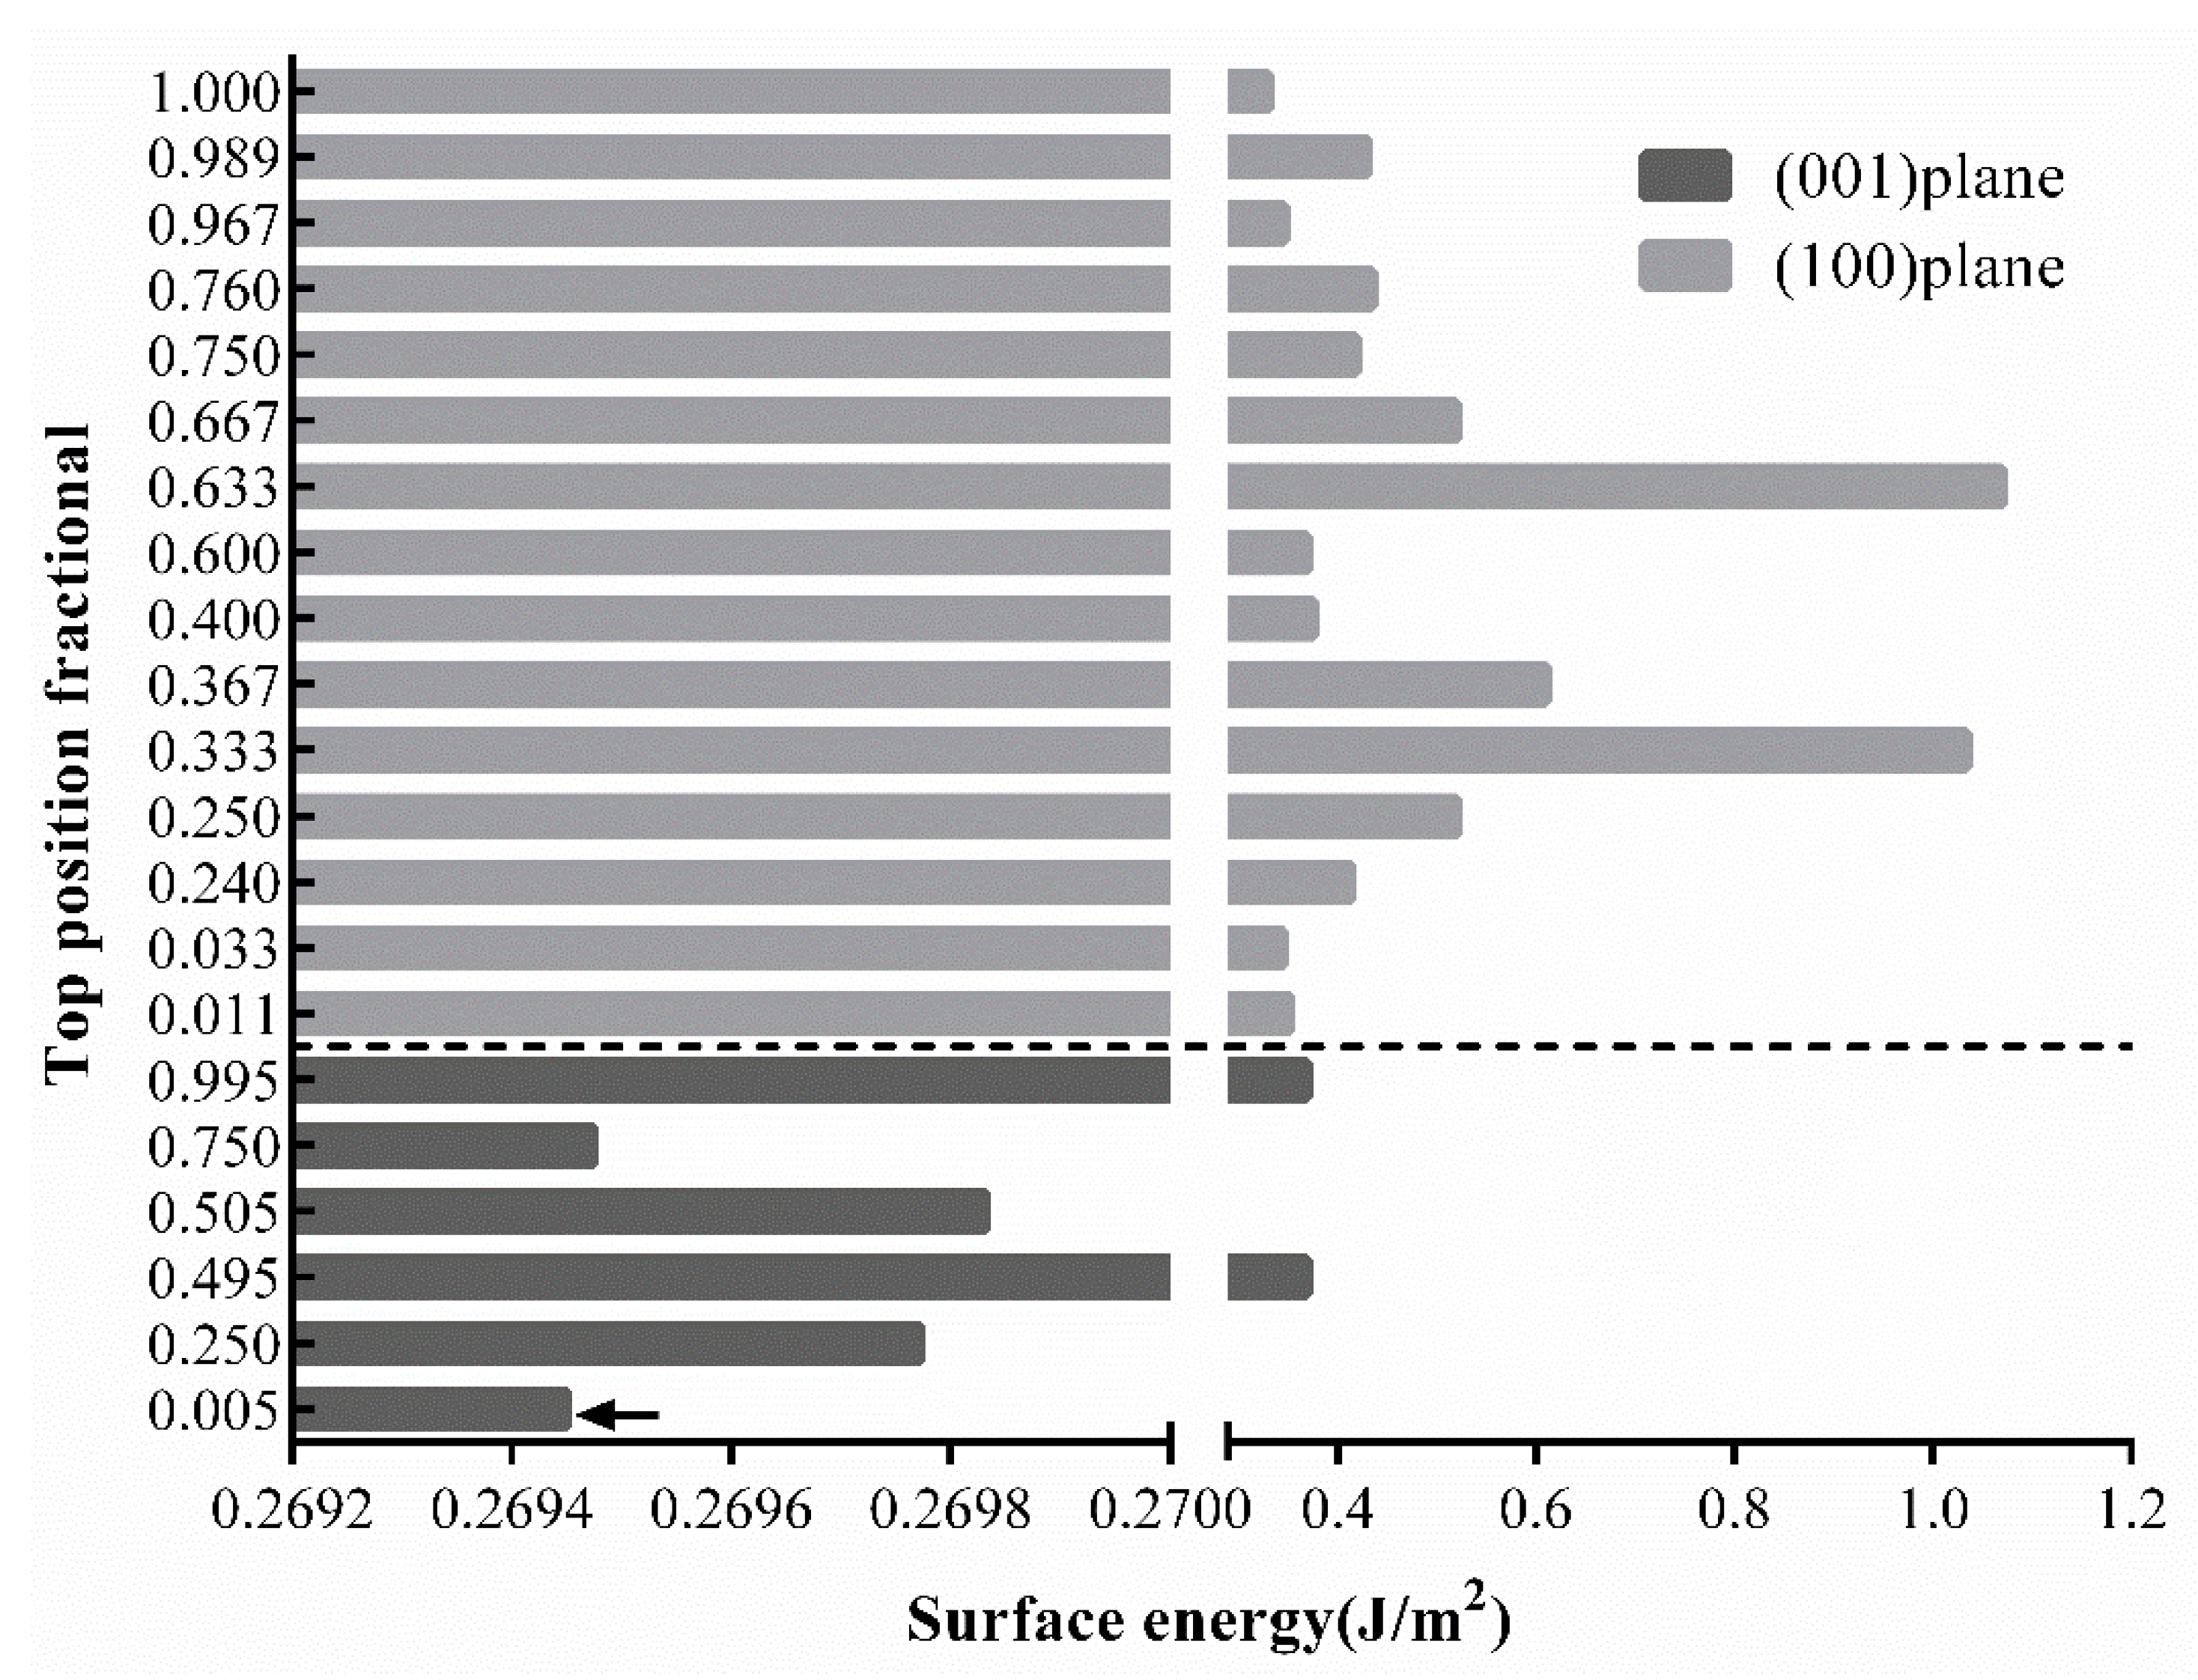
3.3. Structure Optimization of FAp Surface

According to the literature [35], the FAp (001) and (100) surfaces have been experimentally shown to be the dominant cleavage surfaces. As different slab terminations might generate different surface structures and thus affect surface energy, the surface energies of different slab terminations on FAp (001) and (100) surfaces were calculated. The slab termination with lowest surface energy was the most thermodynamically stable structure, which was then used as the surface model, with the slab sliced from geometry optimized FAp bulk. Vacuum thickness was set at 10 Å and the other surface simulation parameters employed were the same as for the bulk except that the k-point was set as 2 × 2 × 1 (Figure 5).
In general, the surface energies of (001) were smaller than those of (100), indicating that (001) was the more thermodynamically stable surface. This conclusion confirmed the literature report that used the quantum mechanical method [14]. Moreover, when the top position was 0.005, (001) had the smallest surface energy (0.26945 J∙m−2). At this point, the slab termination was Ca–O–Ca.
Surface relaxation and reconstruction are common phenomena during the cleavage of solid materials. The top atoms on the surface lose their surrounding atoms, which leads to an unbalanced interaction between atoms. Thus, after cleavage, the top atoms relax to seek new balanced positions. In the inner surface, the relaxation phenomenon recedes, accompanied with increased distance from the top surface; therefore, surface energy will tend to be stable along with the increased slab depth. In the simulation calculation, the two surfaces along the c-axis (top and bottom) will act upon each other. This influence will reduce to negligible when increasing the vacuum thickness to a certain value. For these reasons, convergence tests of surface depth and vacuum thickness were performed to insure the reliability of the surface simulation model. Results of surface energy convergence tests are listed in Table 3.
When the surface depth was larger than 10.287 Å, variation in surface energy was <0.03 J∙m−2. When the vacuum thickness was larger than 14 Å, surface energy changes tended to be small. Thus, the optimized parameters of the FAp (001) surface were 10.287 Å for surface depth and 18 Å for vacuum thickness in consideration of collector size. The optimized FAp (001) surface model is shown in Figure 6.

3.4. Adsorption Site and Adsorption Configurations

To obtain the adsorption site of the collector on the FAp (001) surface, mulliken charges were calculated (Figure 6). On the FAp (001) surface, calcium (Ca) atoms have positive charges, while O atoms and fluorine atoms have negative charges. According to the electronic theory of acid and alkali, a metal cation is a kind of Lewis acid, which is an electron pair acceptor, and an anion is a Lewis alkali, which is an electron pair donor. Based on this theory, Ca on the FAp surface was a Lewis acid and it could accept an electron from an anion collector (HOMO). Thus, Ca was the adsorption site on the FAp (001) surface.
After confirming the adsorption site, the adsorption configurations of NCNT2− and OA on FAp surfaces were considered with multiple possibilities and the most stable one was selected (Figure 7). In the resulting representation, the angle of C–N–C between the two acetates of NCNT2− was 111.289° due to the existence of the N atom. This angle provided NCNT2− with a specific steric configuration that allowed the NCNT2− to adsorb in a bidentate mode on the Ca–O–Ca terminated (001) surface, forming two Ca–O bonds with two surface Ca. This structure had the possibility of making the NCNT2−–FAp interaction stronger than the OA–FAp interaction.

3.5. Adsorption Energy

Comparison of adsorption energies (Eads) was the most credible evidence of interaction strengths in the computer simulation approach. A more negative Eads indicated that interaction of the collector on the FAp surface was stronger. Therefore, adsorption energies of adsorbates on the FAp (001) surface were calculated, and it was observed that the adsorption energy of NCNT2− was 8.936 J∙m−2, larger than that of OA, which indicated that the interaction strength of the NCNT–FAp system was a bit stronger than in the OA–FAp system (Table 4). These results showed that NCNT2− expelled the hydration shell, such that it adsorbed on the FAp surface. On the other hand, the adsorption energy of NCNT2− on the FAp (001) surface was smaller than that of H2O and OH.

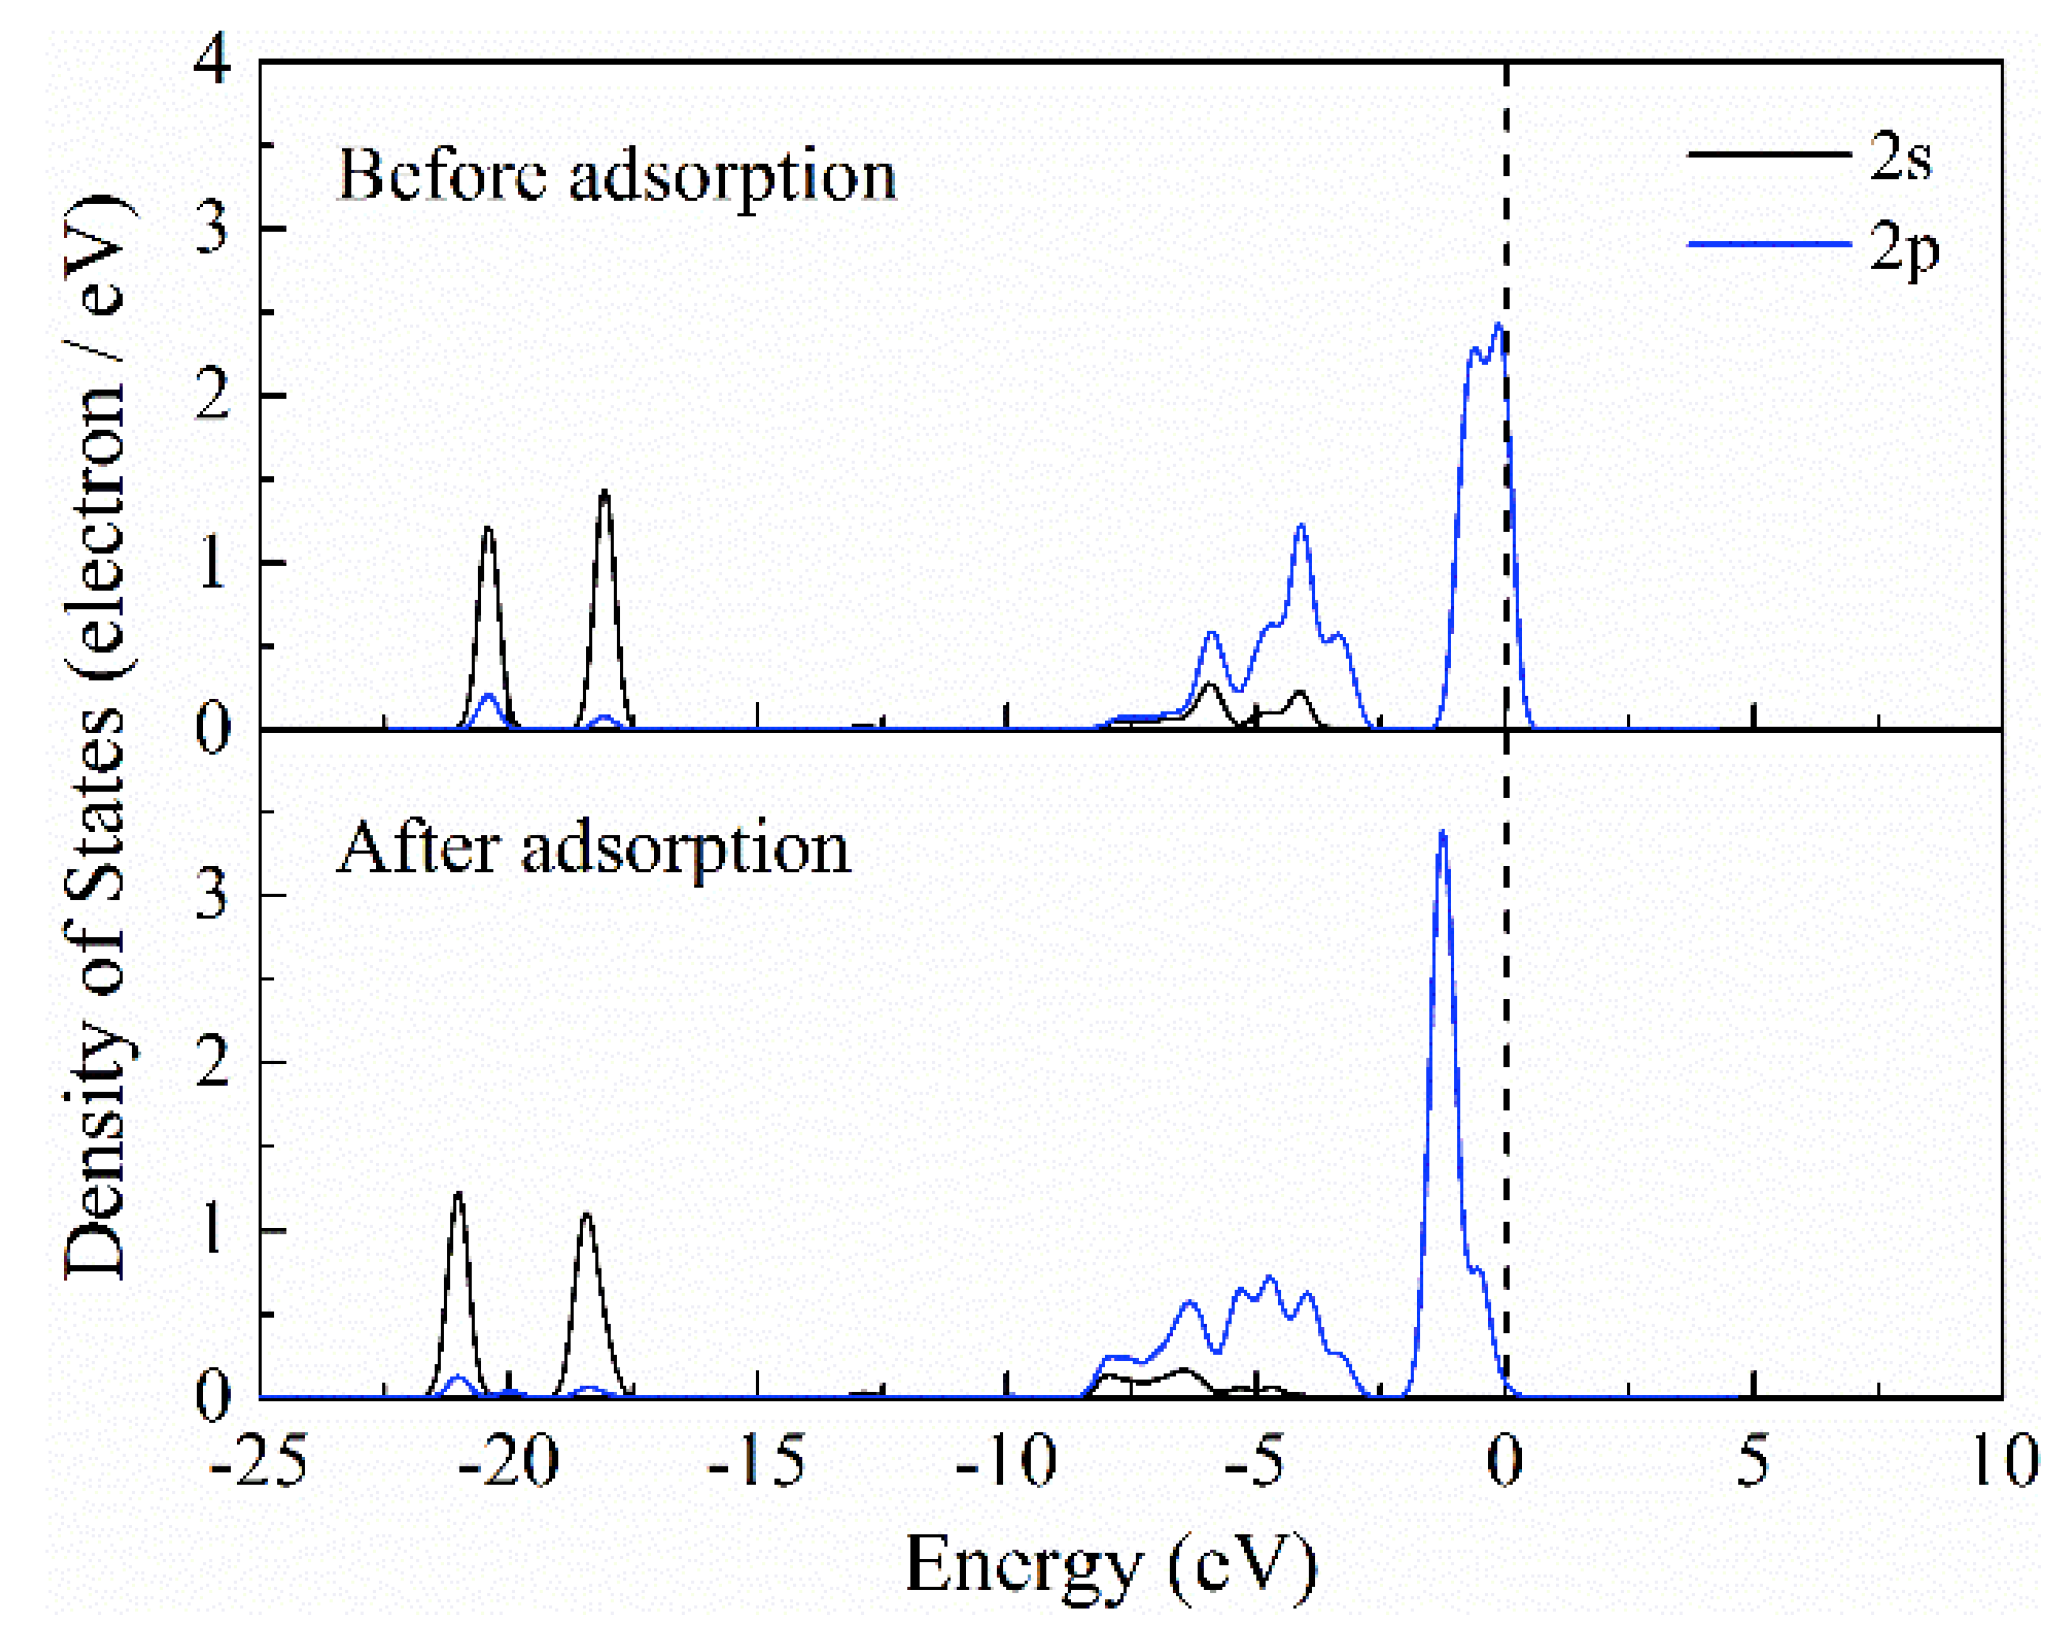
3.6. Adsorption Mechanism Study of NCNT2−

The overall picture showed the partial density of the state of the O atom of NCNT2− and the Ca atom bonding with the collector on the FAp surface (Figure 8 and Figure 9). Before NCNT2− was adsorbed on the FAp (001) surface, a valence band of O was constituted of teh p state, which was localized. The phenomenon that the valence band appeared near the Fermi surface indicated that the compound had good activity. After adsorption, the O p state shifted in the lower energy direction and the Ca conduction band was constituted of d and s states in the initial state. After bonding with the O, the conduction band of Ca disappeared. In short, after adsorption, the partial density of the state of O and Ca both moved in the lower energy direction. This phenomenon indicated that O and Ca become stable because of the O–Ca bond.
The calculated electron density difference depicted electron transmission in the bonding progress (Figure 10). The results showed that, after adsorption, Ca atoms on the surface gained electrons, while O atoms lost electrons. This phenomenon suggested that charges transfer from Ca atoms to O atoms. In addition, the electron depletion zone was around O atoms and the electron accumulation zone was around Ca atoms, which indicated that Ca and O bonded together by ionic bonding.

3.7. Flotation Results

Flotation results demonstrated that the best FAp recovery with the NCNT collector was 92.27%, which was slightly lower than the recovery with OA (94.52%, Figure 11). It was noteworthy that the optimal pH of NCNT was 3.5, which might be an inconvenience for processing equipment. When the temperature was dropped to 16 °C, FAp recovery with the NCNT collector still surpassed 90%, while the recovery with OA was reduced to 70.02%. This outcome indicated that, as expected, NCNT could be employed under a relatively low temperature, thus conserving energy.

4. Discussion

The traditional collector sodium oleate requires heating because of its poor solubility [36]. The factors that affect the surfactant solubility include a shorter carbon chain length, multiple hydrophilic groups, increased branches and so on. Compared to oleic acid, the hydrophobic groups of NCNT were reduced from C18 to C14, and a carboxylic acid group was added to increase water solubility of the molecule, thereby achieving its low temperature tolerance. In order to quantify the solubility of the collector, we introduced the logP parameter, which is commonly used in the chemical industry. LogP is the logarithm of the ratio of the partition coefficient of a substance between n-octanol (oil) and water which is a measure of the relative distribution of the substance between the oil phase and water phases. A small logP value means that the substance has higher hydrophilicity, so it is very soluble in water. According to the database Scifinder, the logP of NCNT is 6.402, which is less than the 7.421 value of oleic acid. Therefore, as expected, the solubility of NCNT in water is significantly better than oleic acid.
Through simulation, the EHOMO-LUMO of NCNT2− was larger than that of OA, and the interaction strength of the NCNT–FAp system was a bit stronger than that of the OA–FAp system. These results indicated that NCNT’s molecular structure met the demands for a sufficient interaction strength with the apatite surface. However, a strong interaction strength might not directly lead to good flotation ability. Meanwhile, the collector’s increased hydrophilicity caused concern regarding its flotation ability. Flotation experiments certified that NCNT had good recovery, 92.27%, on FAp, which was slightly lower than with OA. The temperature condition experiment revealed that, due to good hydrophilicity, NCNT could be employed at 16 °C, which was much lower than OA’s service condition of 25 °C. Despite the advantages of NCNT, this new collector has its disadvantages. The first is poor foamability. In the flotation experiment, the foam generated by NCNT was not quite as much as with OA. It was projected here that the addition of a foaming agent might help NCNT attain a better flotation performance. The second was that the optimal pH condition for NCNT was 3.5. By mixing with other reagents, a highly efficient and low-energy mixed collector could be expected to be attained, which will be the focus of a future research project.

5. Conclusions

From the above analysis, the following conclusions were drawn:
1. The calculated FAp bulk lattice parameters agreed well with the experimental values when simulation parameters adopted were GGA-PBE functional, cutoff energy at 340 eV, and k-point 2 × 2 × 2. The (001) surface of FAp was more stable than the (100) surface. Employing the parameters of surface depth (10.287 Å) and vacuum thickness (18 Å) obtained a rational structure for the FAp (001) surface.
2. According to the results of ELUMO-HOMO and adsorption energies, the new collector NCNT had better activity and stronger interactions in the reagent–FAp system than did OA.
3. Combining the results of the partial density of states, electronic density difference and the angle between two oxalic acids, the mechanism of NCNT adsorption on the FAp surface was described as the chemisorption of NCNT on the (001) surface via a bidentate geometry which formed two Ca–O bonds.
4. Flotation results confirmed the simulation results, which indicated that the NCNT collector could be used in FAp flotation at a lower temperature than OA.
In summary, NCNT was shown to be an energy-saving collector. If its disadvantages can be remedied by combination with other reagents, this new collector has potential for applications in the flotation industry.

Author Contributions

Conceptualization, Y.Z.; Data curation, N.N.; Formal analysis, N.N.; Funding acquisition, Y.Z. and J.L.; Investigation, N.N.; Project administration, Y.H.; Writing—original draft, N.N.; Writing—review & editing, N.N.

Funding

This research was funded by National Natural Science Foundation of China (grant number 51474055, 51774069 and 51674066).

Conflicts of Interest

The authors declare no conflict of interest.

References

  1. Sharpley, A.; Rekolainen, S.; Tunney, H.; Carton, O. Phosphorus Loss from Soil to Water; CABI Publishing: Cambridge, UK, 1997. [Google Scholar]
  2. Sis, H.; Chander, S. Reagents used in the flotation of phosphate ores: A critical review. Miner. Eng. 2003, 16, 577–585. [Google Scholar] [CrossRef]
  3. Wills, B.A.; Napier-Munn, T. Mineral Processing Technology, 7th ed.; Elsevier Science & Technology Books: Amsterdam, The Netherlands, 2006. [Google Scholar]
  4. Yu, J.; Ge, Y.Y.; Hou, J.T. Behavior and Mechanism of Collophane and Dolomite Separation Using Alkyl Hydroxamic Acid as a Flotation Collector. Physicochem. Probl. Mineral Pro. 2016, 52, 155–169. [Google Scholar]
  5. Borges, A.A.; da Luz, J.A.M.; Ferreira, E.E. Characterization of the magnetic phase from carbonatitic phosphate ore. Rem: Revista Escola de Minas 2008, 61, 29–34. [Google Scholar]
  6. Santos, E.P.; Dutra, A.J.B.; Oliveira, J.F. The effect of jojoba oil on the surface properties of calcite and apatite aiming at their selective flotation. Int. J. Miner. Process. 2015, 143, 34–38. [Google Scholar] [CrossRef]
  7. Su, F.W.; Rao, K.H.; Forssberg, K.S.E.; Samskog, P.O. The influence of temperature on the kinetics of apatite flotation from magnetite fines. Int. J. Miner. Process. 1998, 54, 131–145. [Google Scholar] [CrossRef]
  8. Cao, Q.B.; Cheng, J.H.; Wen, S.M.; Li, C.X.; Bai, S.J.; Liu, D. A mixed collector system for phosphate flotation. Miner. Eng. 2015, 78, 114–121. [Google Scholar] [CrossRef] [Green Version]
  9. Filippov, L.O.; Duverger, A.; Filippova, I.V.; Kasaini, H.; Thiry, J. Selective flotation of silicates and Ca-bearing minerals: The role of non-ionic reagent on cationic flotation. Miner. Eng. 2012, 36–38, 314–323. [Google Scholar] [CrossRef]
  10. Karlkvist, T.; Patra, A.; Rao, K.H.; Bordes, R.; Holmberg, K. Flotation selectivity of novel alkyl dicarboxylate reagents for apatite-calcite separation. J. Colloid Interface Sci. 2015, 445, 40–47. [Google Scholar] [CrossRef]
  11. Ahmed, E.; Salah, E.M.; Mohamed, A.K.; Nagui, A.K.; Ayman, E.M. Dolomite-apatite separation by amphoteric collector in presence of bacteria. J. Cent. South Univ. 2013, 20, 1645–1652. [Google Scholar] [CrossRef]
  12. Hu, Y.H.; Xu, Z.H. Interactions of amphoteric amino phosphoric acids with calcium-containing minerals and selective flotation. Int. J. Miner. Process. 2003, 72, 87–94. [Google Scholar] [CrossRef]
  13. Li, C.-X.; Duan, Y.-H.; Hu, W.-C. Electronic structure, elastic anisotropy, thermal conductivity and optical properties of calcium apatite Ca5(PO4)3X (X = F, Cl or Br). J. Alloy Compd. 2015, 619, 66–77. [Google Scholar] [CrossRef]
  14. Mkhonto, D.; de Leeuw, N.H. A computer modelling study of the effect of water on the surface structure and morphology of fluorapatite: Introducing a Ca10(PO4)6F2 potential model. J. Mater. Chem. 2002, 12, 2633–2642. [Google Scholar] [CrossRef]
  15. Pareek, A.; Torrelles, X.; Angermund, K.; Rius, J.; Magdans, U.; Gies, H. Structure of interfacial water on fluorapatite (100) surface. Langmuir 2008, 24, 2459–2464. [Google Scholar] [CrossRef]
  16. Pareek, A.; Torrelles, X.; Angermund, K.; Rius, J.; Magdans, U.; Gies, H. Competitive Adsorption of Glycine and Water on the Fluorapatite (100) Surface. Langmuir 2009, 25, 1453–1458. [Google Scholar] [CrossRef] [PubMed]
  17. Schepers, T.; Brickmann, J.; Hochrein, O.; Zahn, D. Atomistic simulation study of calcium, phosphate and fluoride ion association to the teleopeptide-tails of collagen—Initial steps to biomineral formation. Zeitschrift für anorganische und allgemeine Chemie 2007, 633, 411–414. [Google Scholar] [CrossRef]
  18. Pradip; Rai, B.; Rao, T.K.; Krishnamurthy, S.; Vetrivel, R.; Mielczarski, J.; Cases, J.M. Molecular modeling of interactions of alkyl hydroxamates with calcium minerals. J. Colloid Interface Sci. 2002, 256, 106–113. [Google Scholar] [CrossRef]
  19. Pradip; Rai, B.; Rao, T.K.; Krishnamurthy, S.; Vetrivel, R.; Mielczarski, J.; Cases, J.M. Molecular modeling of interactions of diphosphonic acid based surfactants with calcium minerals. Langmuir 2002, 18, 932–940. [Google Scholar] [CrossRef]
  20. Filgueiras, M.R.T.; Mkhonto, D.; de Leeuw, N.H. Computer simulations of the adsorption of citric acid at hydroxyapatite surfaces. J. Cryst. Growth 2006, 294, 60–68. [Google Scholar] [CrossRef]
  21. Mkhonto, D.; Ngoepe, P.E.; Cooper, T.G.; de Leeuw, N.H. A computer modelling study of the interaction of organic adsorbates with fluorapatite surfaces. Phys. Chem. Miner. 2006, 33, 314–331. [Google Scholar] [CrossRef]
  22. Kohn, W.; Sham, L.J. Self-Consistent Equations Including Exchange and Correlation Effects. Phys. Rev. 1965, 140, A1133–A1138. [Google Scholar] [CrossRef]
  23. Xie, X.-D.; Lu, D. Energy Band Theory of Solids; Fudan University Press: Shanghai, China, 1998. [Google Scholar]
  24. Clark, S.J.; Segall, M.D.; Pickard, C.J.; Hasnip, P.J.; Probert, M.J.; Refson, K.; Payne, M.C. First principles methods using CASTEP. Zeitschrift für Kristallographie-Crystalline Materials 2005, 220, 567–570. [Google Scholar] [CrossRef]
  25. Segall, M.D.; Lindan, P.J.D.; Probert, M.J.; Pickard, C.J.; Hasnip, P.J.; Clark, S.J.; Payne, M.C. First-principles simulation: Ideas, illustrations and the CASTEP code. J. Phys. Condens. Mat. 2002, 14, 2717–2744. [Google Scholar] [CrossRef]
  26. Delley, B. From molecules to solids with the DMol3 approach. J. Chem. Phys. 2000, 113, 7756–7764. [Google Scholar] [CrossRef]
  27. Delley, B. An all-electron numerical method for solving the local density functional for polyatomic molecules. J. Chem. Phys. 1990, 92, 508–517. [Google Scholar] [CrossRef]
  28. Monkhorst, H.J.; Pack, J.D. Special points for Brillouin-zone integrations. Phys. Rev. B 1976, 13, 5188–5192. [Google Scholar] [CrossRef]
  29. Pack, J.D.; Monkhorst, H.J. Special points for Brillouin-zone integrations-a reply. Phys. Rev. B 1977, 16, 1748–1749. [Google Scholar] [CrossRef]
  30. Vanderbilt, D. Soft self-consistent pseudopotentials in a generalized eigenvalue formalism. Phys. Rev. B Condens. Matter. 1990, 41, 7892–7895. [Google Scholar] [CrossRef] [PubMed]
  31. Zhu, Y.M.; Luo, B.B.; Sun, C.Y.; Liu, J.; Sun, H.T.; Li, Y.J.; Han, Y.X. Density functional theory study of alpha-Bromolauric acid adsorption on the alpha-quartz (101) surface. Miner. Eng. 2016, 92, 72–77. [Google Scholar] [CrossRef]
  32. Sauer, J.; Sustmann, R. Mechanistic Aspects of Diels-Alder Reactions: A Critical Survey. Angew. Chem. Int. Ed. 1980, 19, 779–807. [Google Scholar] [CrossRef]
  33. Perdew, J.P.; Chevary, J.A.; Vosko, S.H.; Jackson, K.A.; Pederson, M.R.; Singh, D.J.; Fiolhais, C. Atoms, molecules, solids, and surfaces: Applications of the generalized gradient approximation for exchange and correlation. Phys. Rev. B 1992, 46, 6671–6687. [Google Scholar] [CrossRef] [Green Version]
  34. Hendricks, S.B.; Jefferson, M.E.; Mosley, V.M. The Crystal Structures of some Natural and Synthetic Apatite-Like Substances. Zeitschrift für Kristallographie-Crystalline Materials 1932, 81, 352–369. [Google Scholar] [CrossRef]
  35. Deer, W.A.; Howie, R.A.; Zussman, J. An Introduction to the Rock-Forming Minerals; Longman Group: Harlow, UK, 1992. [Google Scholar]
  36. Zhu, H.; Qin, W.; Chen, C.; Liu, R. Interactions Between Sodium Oleate and Polyoxyethylene Ether and the Application in the Low-Temperature Flotation of Scheelite at 283 K. J. Surfactants Deterg. 2016, 19, 1289–1295. [Google Scholar] [CrossRef]
Figure 1. Molecular structure of NCNT (a) and OA (b).
Minerals 09 00278 g001
Figure 2. HOMO constitution of the ionic form: NCNT2− (left) and OA (right). Carbon, nitrogen, oxygen and hydrogen atoms are in gray, dark blue, red and white, respectively.
Minerals 09 00278 g002
Figure 3. The k-points convergence test with cutoff energy of 340 eV (left) and cutoff energy convergence test with k-point 2 × 2 × 2 (right).
Minerals 09 00278 g003
Figure 4. Comparison of (a) simulated and (b) experimental XRD spectra.
Minerals 09 00278 g004
Figure 5. Surface energy of different top position fractionals on (100) and (001) surface.
Minerals 09 00278 g005
Figure 6. Surface structure of FAp (001) before (a) and after optimization (b). (Ca—green, phosphorus—purple, O—red, fluorine—light blue)
Minerals 09 00278 g006
Figure 7. Adsorption configuration of NCNT2− on FAp. (Ca—green, phosphorus—purple, O—red, H—white, fluorine—light blue, N—dark blue).
Minerals 09 00278 g007
Figure 8. Partial density of states for O of FAp surface.
Minerals 09 00278 g008
Figure 9. Partial density of states for Ca of NCNT2−.
Minerals 09 00278 g009
Figure 10. Electron density difference plot of adsorbed NCNT2− on FAp (001) surface. Red contours correspond to electron density depletion, while blue contours represent electron density accumulation.
Minerals 09 00278 g010
Figure 11. Effect of slurry Ph (left) and flotation temperature (right) on the recovery of FAp.
Minerals 09 00278 g011
Table 1. Energy gap (EHOMO-LUMO) of the adsorbates and adsorption energies on FAp (001) surface.
AdsorbateNCNTNCNT2−OAOAH2OOH
EHOMO (eV)−5.3572.786−5.780.336−6.4544.78
ELUMO (eV)−1.1783.718−0.9671.486−0.2759.757
EHOMO-LUMO (eV)−4.179−0.932−4.813−1.15−6.179−4.977
Table 2. Comparison of lattice parameters of FAp bulk obtained from different exchange-correlation functionals with cutoff energy 340 eV and k-point 2 × 2 × 2 condition.
Data ResourceFunctionala/Åb/Åc/ÅDifference/%
Experimental 9.3709.3706.880-
SimulationGGA-PBE9.3059.3056.8580.593
GGA-RPBE9.4509.4596.9410.862
GGA-PW919.2949.2946.8400.749
GGA-WC9.2129.2126.7701.66
GGA-PBESOL9.1999.1996.7851.71
Table 3. Convergence tests of slab depth and vacuum thickness.
Slab depth (Å)6.85810.28713.71617.14520.574
Surface energy (J∙m−2)0.31070.54830.57690.58560.6022
Vacuum thickness (Å)1012141618
Surface energy (J∙m−2)0.31500.31670.31840.31860.3188
Table 4. Adsorption energy of the adsorbates on FAp (001) surface.
AdsorbateNCNT2−OAH2OOH
Eads (J∙m−2)−210.297−219.233−192.71−189.65

