Article

In Situ Chalcophile and Siderophile Element Behavior in Sulfides from Moroccan Middle Atlas Spinel Peridotite Xenoliths during Metasomatism and Weathering

1
GeoZentrum Nordbayern, Friedrich-Alexander Universität Erlangen-Nürnberg (FAU), Schlossgarten 5, D-91054 Erlangen, Germany
2
Forschungsbereich Archäometallurgie, Deutsches Bergbau-Museum Bochum, Am Bergbaumuseum 31, D-44791 Bochum, Germany
3
Department of Geosciences and Geography, University of Helsinki, P.O. Box 64, 00014 Helsinki, Finland
4
Deutsche Rohstoffagentur (DERA) in der Bundesanstalt für Geowissenschaften und Rohstoffe (BGR), Wilhelmstraße 25 – 30, D-13593 Berlin-Spandau, Germany
5
Florida Department of Environmental Protection, 3900 Commonwealth Boulevard, Tallahassee, FL 32399-3000, USA
*
Authors to whom correspondence should be addressed.
Minerals 2019, 9(5), 276; https://doi.org/10.3390/min9050276
Submission received: 1 April 2019 / Revised: 29 April 2019 / Accepted: 30 April 2019 / Published: 4 May 2019
(This article belongs to the Special Issue Sulfide Geochemistry)

Abstract

:
In situ chalcophile and siderophile major and trace elements were analyzed in sulfides from eight Moroccan Middle Atlas lherzolite xenoliths using electron microprobe and laser ablation inductively coupled plasma mass spectrometry. The sulfides occur enclosed in primary silicates, interstitial in the peridotite matrix, and associated with glass-bearing melt pockets. Monosulfide solid solutions are enriched in these xenoliths relative to pentlandite and intermediate solid solutions. Regardless of the textural occurrence, sulfide platinum-group element (PGE) patterns are distinguished into residual ([Pd/Ir]N < 1 and [Pt/Pd]N > 1 or [Pt/Pd]N < 1), melt-like ([Pd/Ir]N > 1), and unfractionated patterns. The coexistence of both residual and melt-like PGE signatures on a cm scale in a single sample implies that sulfides may record initial depletion and subsequent re-enrichment more effectively than constituent silicates do. Chalcophile and siderophile trace elements other than the PGEs are fractionated between the precipitated sulfide phases, but do not vary systematically with the PGE signatures, suggesting that the PGEs are comparatively sensitive to melting and depletion. In addition, Fe-rich hydroxides generated by sulfide breakdown due to atmospheric weathering display PGE systematics almost identical to their precursor sulfides, implying that they may be reliable tracers of mantle processes even after extensive weathering.

1. Introduction

The geochemical and petrological nature of the subcontinental lithospheric mantle (SCLM) underlying the earth’s continental crust remains a matter of active debate (e.g., [1,2,3]). The rare preservation of mantle xenoliths and their melting signatures from the convecting upper mantle, however, provides a view into one of the earth’s major geochemical sources [4,5,6]. These peridotites have typically been investigated for their lithophile major and trace element and isotope composition in whole rocks and constituent silicate minerals (i.e., Cr-diopside), and only recently have siderophile elements, i.e., platinum-group elements (PGEs) and their isotopes, received increasing attention (reviews provided by [1,7,8,9,10] and references therein). The compatibility of PGEs in mantle sulfides and alloys is extremely high, resulting in a 100,000-fold enrichment relative to coexisting silicate phases in host whole-rock peridotites [11,12]. The relatively high PGE contents of mantle sulfides alleviate their accessory modal abundance in the fertile mantle (≤0.08 wt %; [13,14,15,16]). Combining PGE abundances with Re-Os isotope data in sulfides and ultramafic xenoliths has led to major advances in deciphering the timing and formation of the cratonic SCLM [2,12,17,18,19,20,21,22,23], in that combining PGE abundances and Os isotope ratios allows for determining both the ages and processes of melt depletion and melt–rock interaction.
To date, two differing analytical approaches have commonly been used to determine the PGE budget of the earth’s materials. Osmium isotope and PGE abundance data are mostly generated from whole-rock samples, i.e., peridotite xenoliths, which has led to a relatively large database for PGE concentrations and Os isotope data available for mantle rocks [2,3,23,24,25,26]. However, geochemical data for other siderophile and chalcophile elements are almost absent (e.g., Lorand and Luguet [27]). Laser ablation inductively coupled plasma mass spectrometry (LA-ICP-MS) has been used to acquire in situ Os isotope data from mantle sulfides (e.g., Griffin et al. [28]), and these are commonly then combined with the whole-rock PGE data. A general setback of whole-rock data is that the mineralogy and distribution of sulfides in peridotites is manifold and diverse, making the interpretation of whole-rock Os isotopes and PGE abundance data difficult.
Here, we present new geochemical sulfide data for eight mantle xenoliths from the off-cratonic Middle Atlas along with sulfide mineralogy and petrography and combine these observations with state-of-the-art in situ major, minor, and trace element analyses by electron microprobe (EMP) and LA-ICP-MS. The whole-rock major element, PGE, and Re-Os isotope data, in addition to clinopyroxene trace element and Sr-Nd-Hf-Pb isotope systematics, have previously been published for these xenoliths [20,29,30,31]. We complement this dataset with a detailed sulfide mineralogy and compare our newly obtained PGE signatures of individual sulfides with signatures typical for residual and melt-like monosulfide sulfide solutions (mss).

2. Materials and Methods

2.1. Samples

Spinel-facies xenoliths were sampled by the Quaternary intraplate volcanism in the Azrou volcanic field of the Middle Atlas (Morocco) and are petrographically and geochemically well characterized [20,29,30,31]. The suite predominantly consists of lherzolites (Table 1) and a single harzburgite (sample Atl-3I).
The published dataset comprises whole-rock major element, clinopyroxene trace element, and Sr-Nd-Hf-Pb isotope data, as well as whole-rock PGE and Os isotope compositions [20,29,30,31]. The coarse-grained protogranular xenoliths have a diameter of at least 15 cm and are free of any obvious and substantial serpentinization. Whole-rock FeO-MgO systematics are correlated and indicate melt extraction ranging from 5% to 25% along a 2-GPa polybaric depletion trend. Other chemical tracers of depletion are less well correlated (i.e., bulk SiO2-Al2O3 abundances deviating from mantle depletion trends) and strongly suggest re-enrichment after initial depletion with the introduction of Al-bearing silicate phases (e.g., amphibole), probably due to silicate melt–rock reaction (i.e., the reaction of the peridotite with mafic melts and the subsequent introduction of amphibole and/or clinopyroxene). This is also evident from the constituent clinopyroxenes, which record substantial metasomatic trace element enrichments with an REE inventory in agreement with precipitation from carbonatite melts. Metasomatic re-enrichment yields unrealistic melting degrees for models based on Cr# and REE abundances [32]. Whole-rock PGE systematics and Os isotopes indicate extensive depletion coupled with a distinctive enrichment in Pd. In addition, Al2O3 is correlated with Ir, Re, and 187Os/188Os isotope ratios (R² = 0.92, 0.99, 0.96, respectively), suggesting a link between the metasomatic introduction of Al-bearing phases (clinopyroxene, amphibole) and PGE modification.

2.2. Analytical Techniques

2.2.1. Electron Microprobe

The major and minor element contents of sulfides and Fe-hydroxides were determined using a JEOL JXA-8200 Superprobe electron microprobe (EMP) at GeoZentrum Nordbayern, Friedrich-Alexander Universität Erlangen-Nürnberg. The instrument was operated with an acceleration of 20 kV, a beam current of 20 nA, and a focused beam. The counting times for peak and background were set to 20 s and 10 s, respectively. Natural and synthetic standards (Fe2O3, NiO, chalcopyrite, pyrite) were measured as replicates (n = 5), and analyses were corrected using the ZAF method [33]. In addition to Fe, Ni, Cu, and S, the abundances of Si, Ti, Al, Cr, Mn, Mg, Ca, Na, K, F, and Cl were determined in Fe-hydroxides, silicates, spinel, and glass. Elemental mappings of sulfides and Fe-hydroxides were conducted using a step width of 1 µm (see Figures S1 and S2).

2.2.2. Laser Ablation ICP-MS

In situ trace element analysis of sulfides, Fe-hydroxides, and spinels was conducted by laser ablation inductively coupled plasma mass spectrometry (LA-ICP-MS) during three analytical sessions at GeoZentrum Nordbayern, Friedrich-Alexander Universität Erlangen-Nürnberg. A UP 193FX Excimer, New Wave Research laser was coupled with an Agilent 7500i quadrupole ICP-MS. The laser was operated with a repetition rate of 20 Hz and crater sizes of 20 and 25 µm. Irradiance and fluence were 0.29 GW/cm² and 1.44 J/cm², respectively. The data were collected for 40 s, consisting of 20 s of gas blank analysis and 20 s of mineral analysis. An individual mass scan required 0.69 s: 29Si, 34S and 63Cu were analyzed for 10 ms; 59Co, 60Ni, 67Zn, 75As, 77Se, 95Mo, 111Cd, 117Sn, 121Sb, 125Te, 208Pb for 20 ms; and 99Ru, 101Ru, 103Rh, 105Pd, 108Pd, 109Ag, 185Re, 189Os, 193Ir, 195Pt, 197Au for 35 ms on the maximum peak. In addition to isobaric interferences on Ru and Pd isotopes, polyatomic Co-, Ni-, Zn-, and Cu-argide interferences affect the mass range of Ru, Rh, and Pd (99Ru: 59Co40Ar, 63Cu36Ar; 103Rh: 63Cu40Ar, 65Zn38Ar, 67Zn36Ar; 101Ru: 61Ni40Ar, 63Cu38Ar, 65Cu36Ar; 105Pd: 65Cu40Ar; 108Pd: 68Zn40Ar). Here, we used 99Ru and 108Pd due to lower Co and Zn abundances in the analyzed sulfides. Larger-sized grains were repeatedly analyzed to ensure homogeneity.
Data reduction was performed using the software package GLITTER 3.0 (ARC National Key Centre for Geochemical Evolution and Metallogeny of Continents (GEMOC) and CSIRO Exploration and Mining, Sydney and Canberra, Australia; van Achterberg et al. [34]). Internal standards for spinel, sulfide, and Fe-hydroxide were Ni and S, respectively, previously determined by EMP. For external calibration of Os, Ir, Ru, Rh, Pt, Pd, and Au, the synthetic pyrrhotite standard Po724 B2 SRM (Memorial University, St. John’s, NL, Canada) was used. Nickel, Re, and S were calibrated against a (Fe,Ni)1-xS monosulfide standard (University of Münster, Germany; Wohlgemuth-Ueberwasser et al. [35]), while a polymetal sulfide standard (MASS-1; United States Geological Survey) was used for Ag, As, Cd, Co, Cu, Mo, Pb, Sb, Se, Sn, Te, and Zn. The relative standard deviation (RSD %) of all elements was ≤10% with the exception of Re (≤14.7 RSD %), Se (≤16.7 RSD %), and Te (≤13.6 RSD %).

3. Results

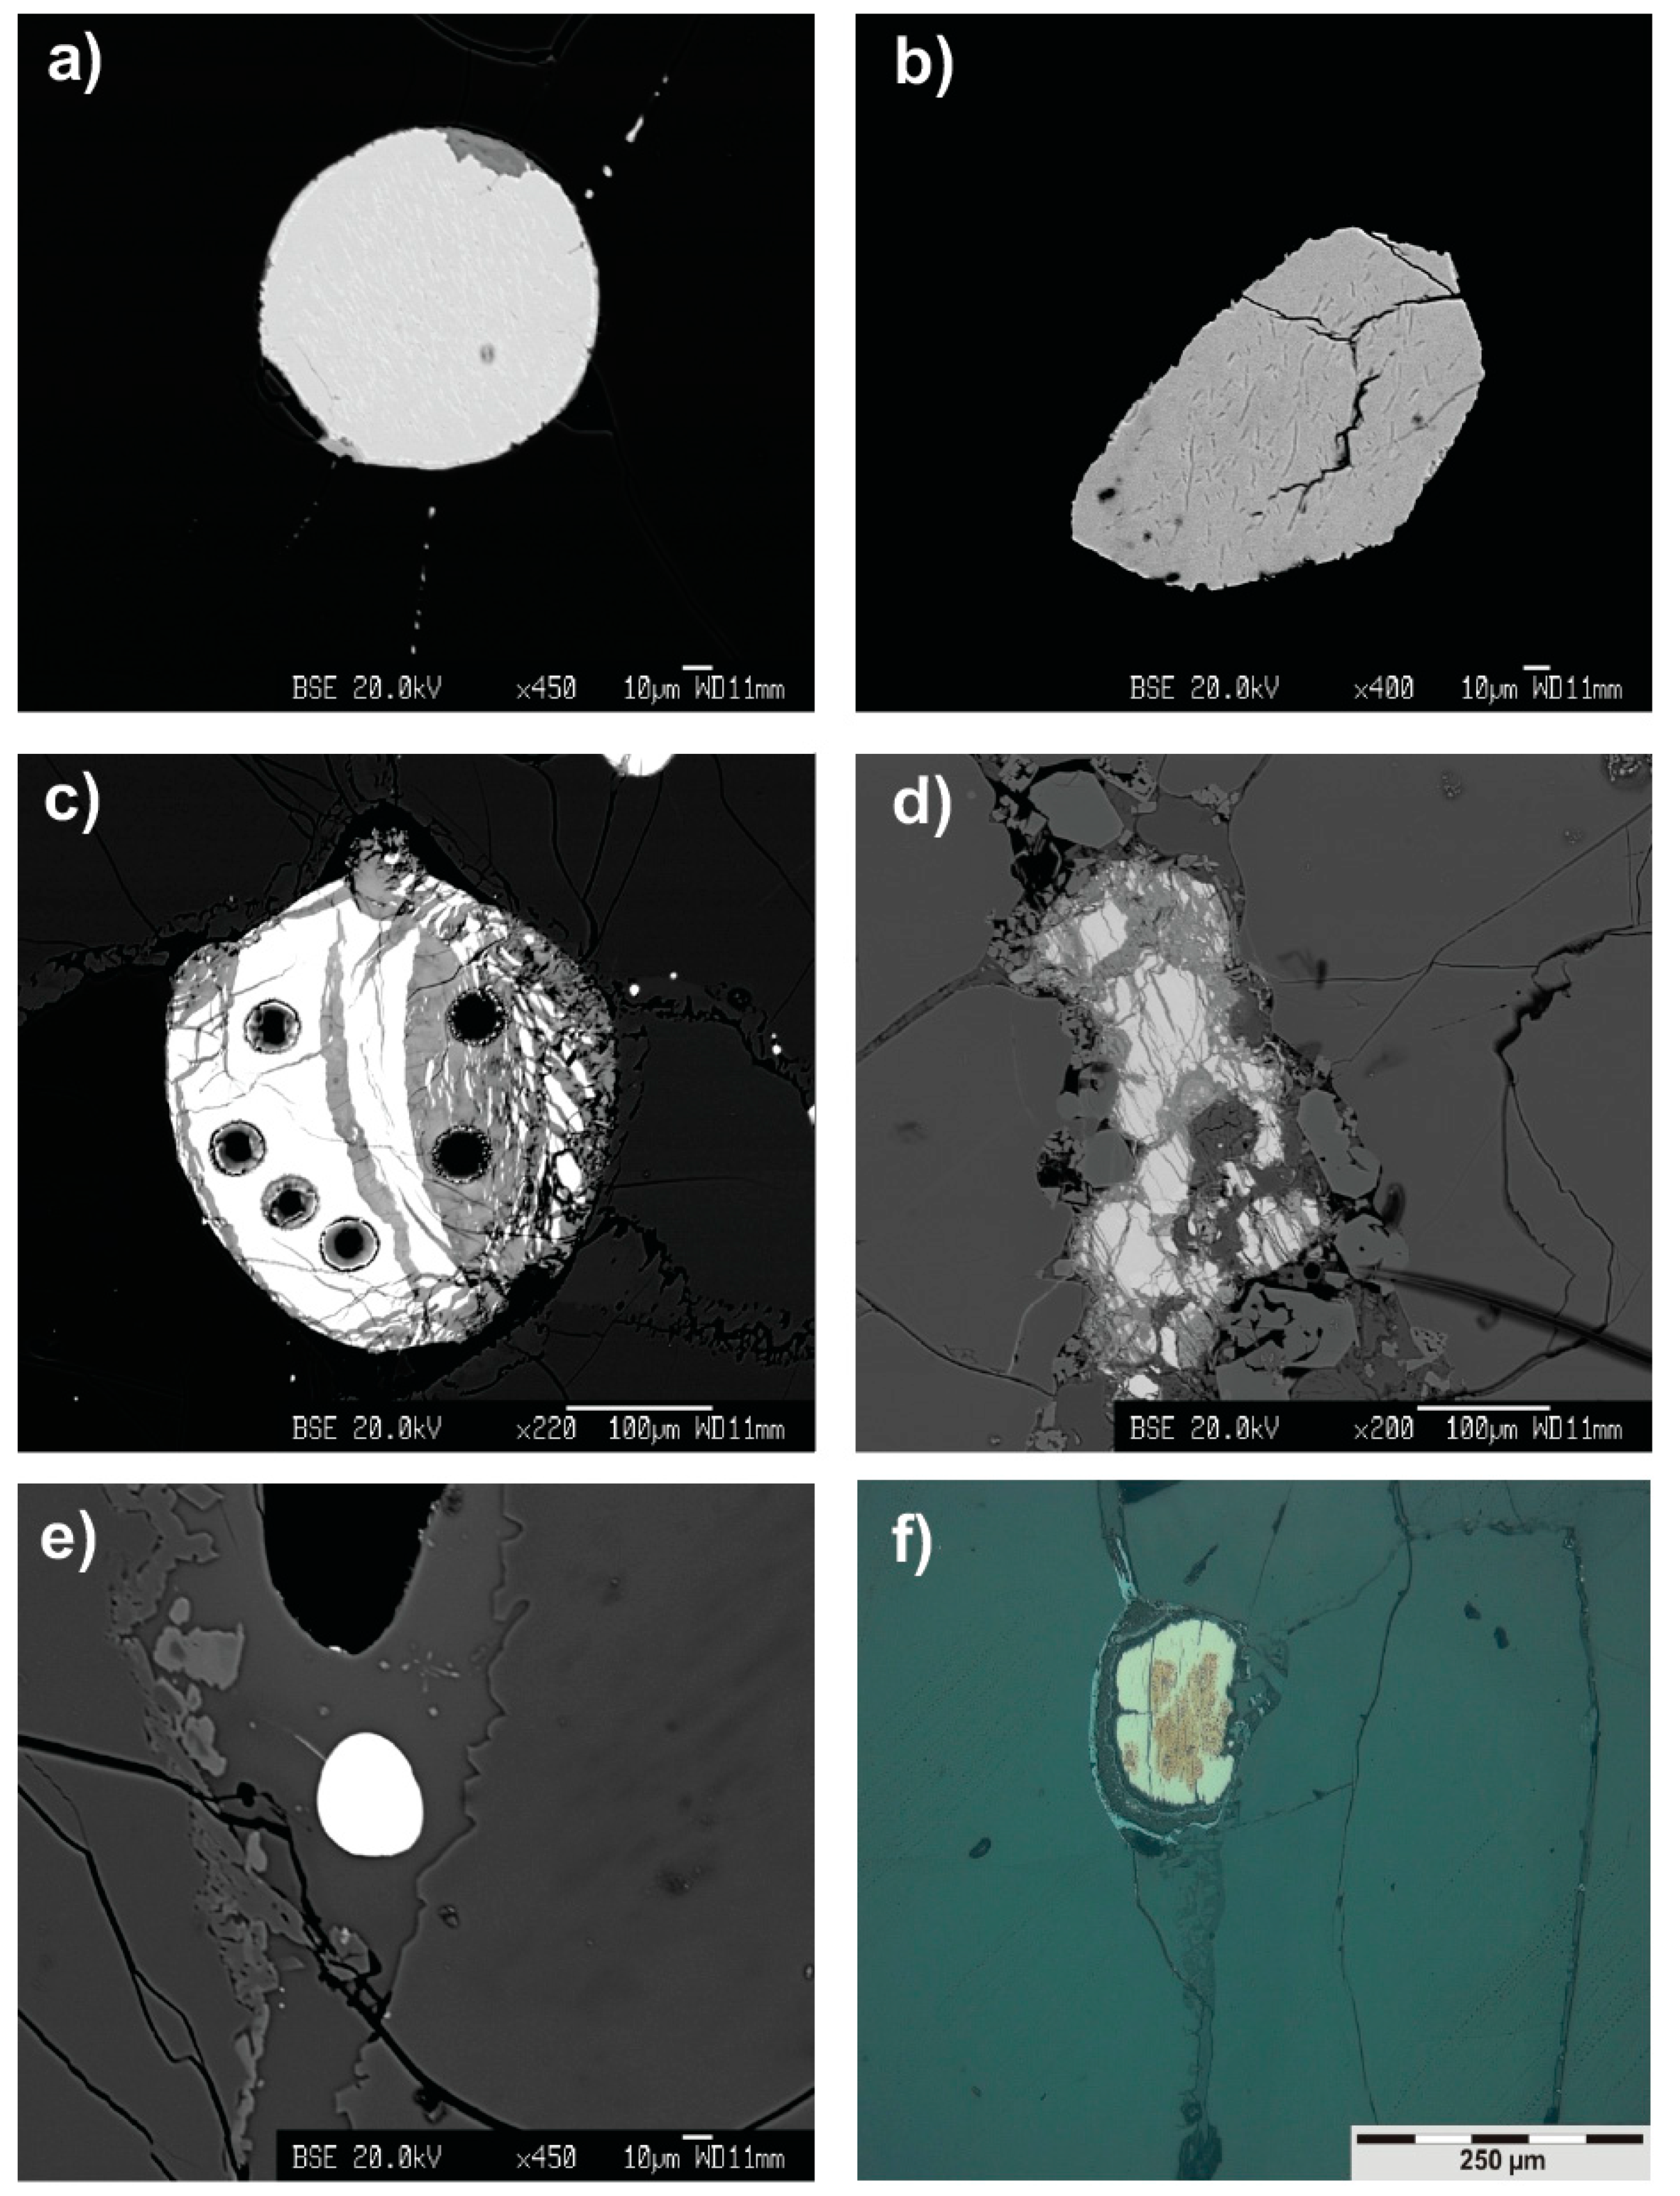
3.1. Petrographic Description of Sulfide Phases and Associated Fe-Hydroxides

This study used 11 ultramafic xenolith samples, which were investigated for their sulfide inventory utilizing a total of 58 thin and thick sections. All xenolith samples host sulfide phases. However, only seven of these also contained mss and a subordinate fraction of pentlandite and intermediate solid solution (iss) that were large enough for LA-ICP-MS analyses. This contribution focuses on the sulfide mineralogy and their major and trace element composition. However, we provide brief descriptions of the relationships between silicates, oxides, and sulfides in the Appendix A and Appendix B. More detailed descriptions are available from Wittig [36] and Westner [37]. Generally, sulfides are minor constituents (<1 vol %) in the Middle Atlas xenoliths. We could not perform sulfide trace element analysis in samples Atl-3L, Atl-3F, and Atl-3U due to their small size. Hence, these samples were not used in the current study. According to their textural occurrence, we grouped the sulfides into three types (Figure 1): Sulfides enclosed in olivines and pyroxenes (Type e), interstitial sulfides among primary silicates and spinel (Type i), and sulfides associated with secondary melt pockets (Type m). The type e sulfide inclusions range in size from 10 to 100 µm. They typically occur as spherical droplet-like grains, although some crystals are sub- to euhedral and frequently display hexagonal cross-sections. The host phases of these inclusions are olivine, orthopyroxene, and clinopyroxene. Interstitial Type i sulfides range in size from 10 to 300 µm and are commonly observed along the grain boundaries of the primary silicate and oxide assemblages and also appear predominantly as droplet-like grains. Type m sulfides associated with secondary melt pockets are 10 to a few hundred micrometers in size and occur either as spherical inclusions in glass or as altered, interstitial grains within the melt pockets.
All textural sulfide types are occasionally affiliated with minute sulfide melt trails. However, melt tracks are predominantly associated with type e sulfides. These grains form straight or curved tracks, which can be traced over several millimeters. Due to their small diameter (~1 µm), the compositions were determined quantitatively using EMP elemental mappings (Supplementary Materials, Figures S1 and S2). Sulfides interstitial to the primary phase assemblage and within melt pockets as well as sulfides enclosed in primary silicates or secondary glass adjacent to fractures are to a variable degree altered to hydroxide phases. These weathering products (Figure 1f and Figure S1) display spongy textures and have a porous surface. They are partially amorphous and, based on their optical properties, compositionally heterogeneous.
The sulfide phase assemblage is dominated by mss equally distributed between the three textural types. Pentlandite was observed in samples Atl-3B, 3C, and 3V, where it is associated with mss as interstitial grains or within secondary melt pockets. Isotropic Cu-Fe-rich iss occur in all three sulfide types and either are present as rims of mss grains or as small patchy inclusions within mss. Three different exsolution phenomena were observed in the mss: (a) anisotropic lamellae of a comparatively somewhat Cu-enriched mss phase (1–2 µm width, Figure 1b,f; Figure S1; Figure S2b); (b) lamellae of Ni-enriched mss in relatively Fe-rich mss (Figure 1a; Figure S2a); and (c) flames, blades, and patches of pentlandite within Fe-rich mss, which were rarely observed in Atl-3B, -3C, and -3V sulfides.

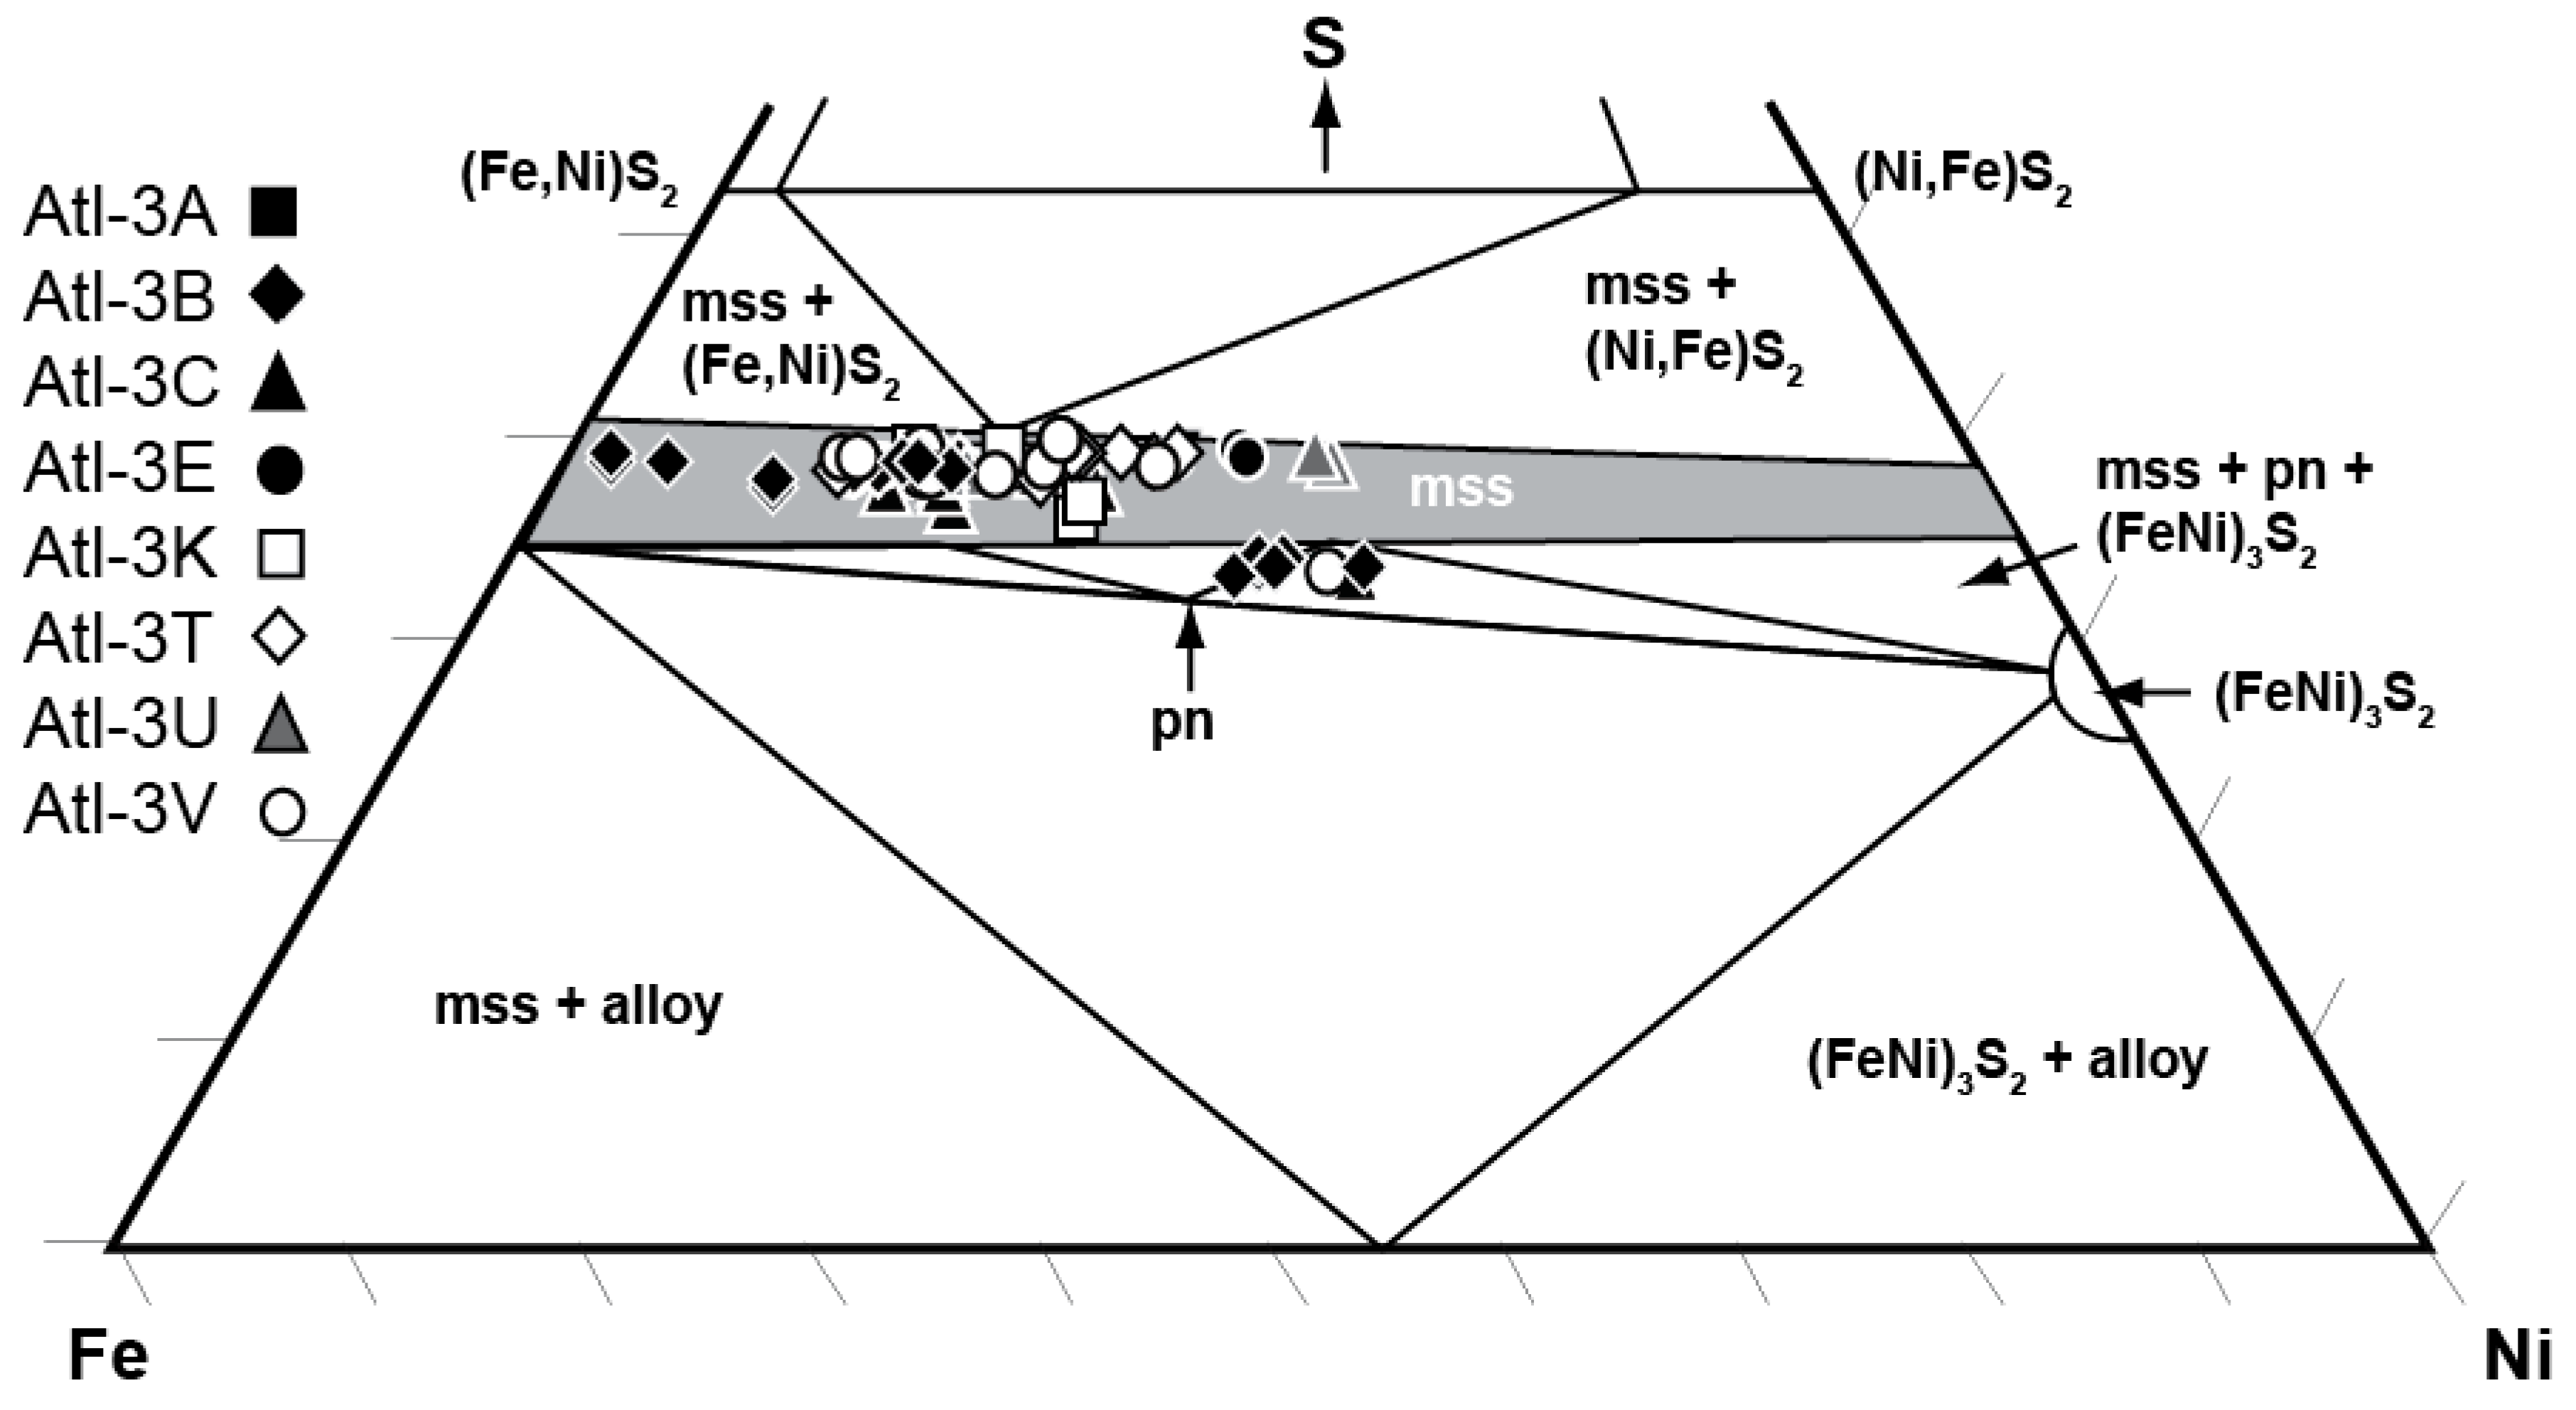
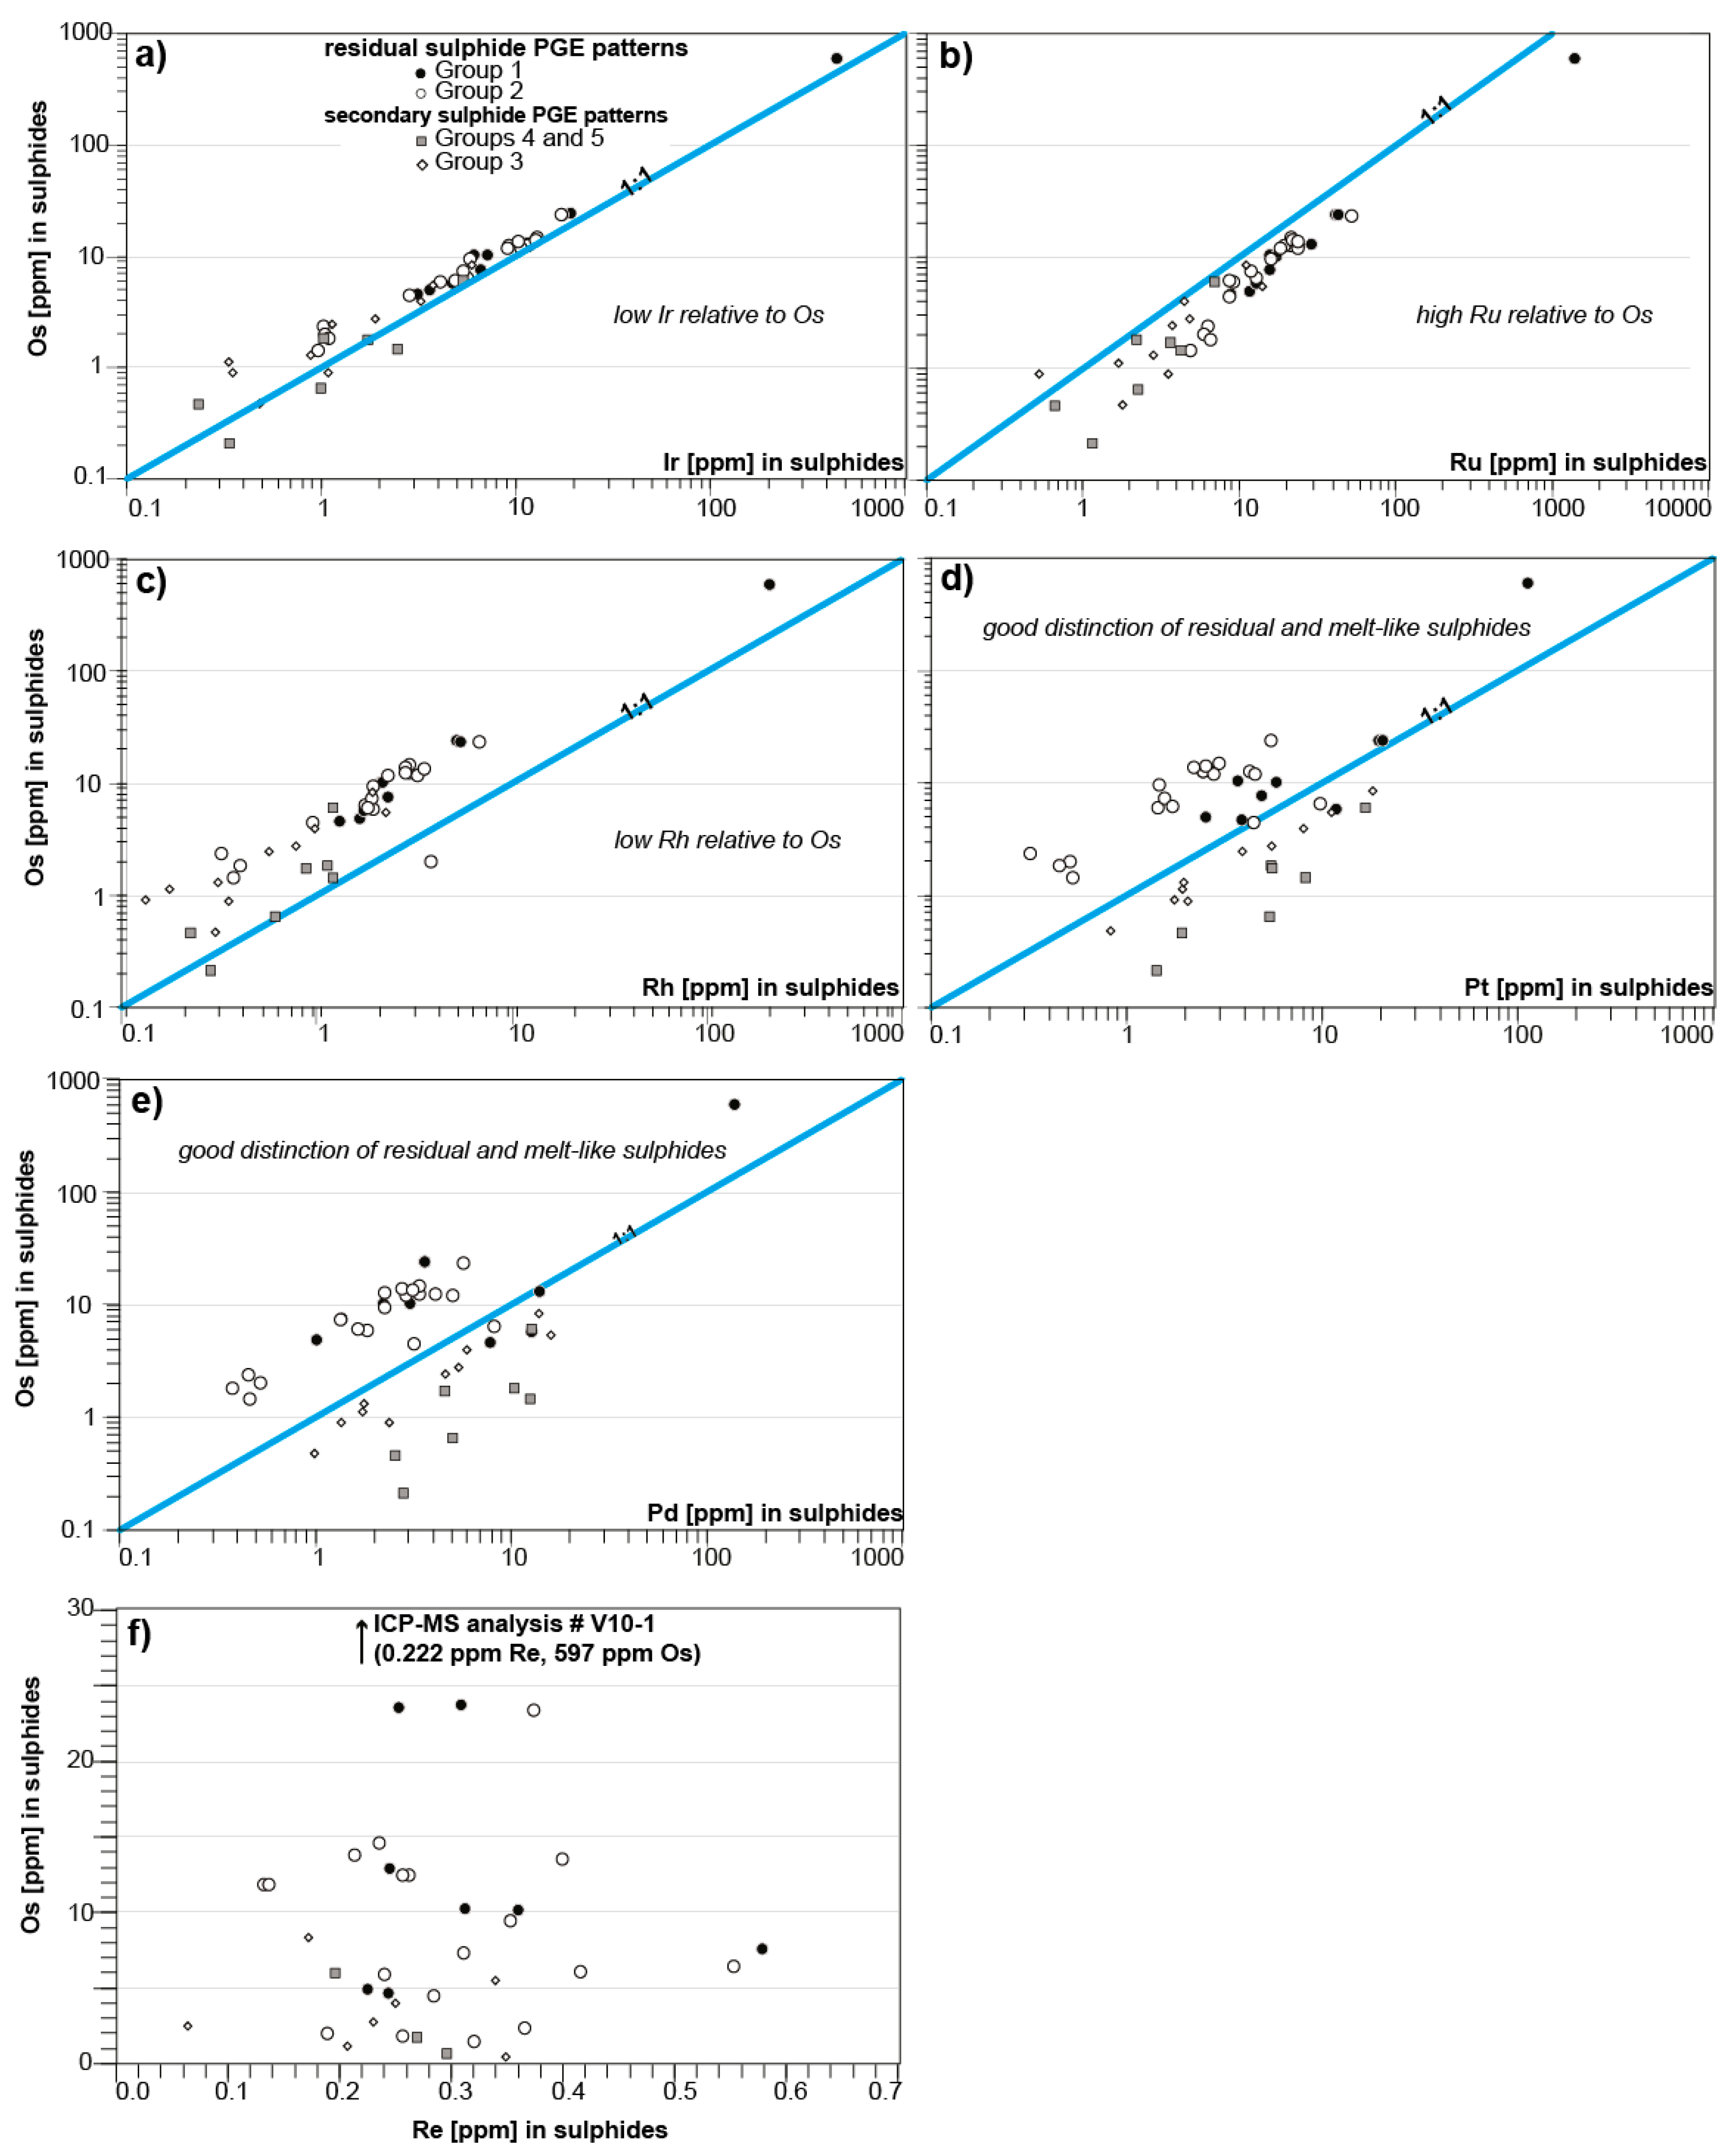
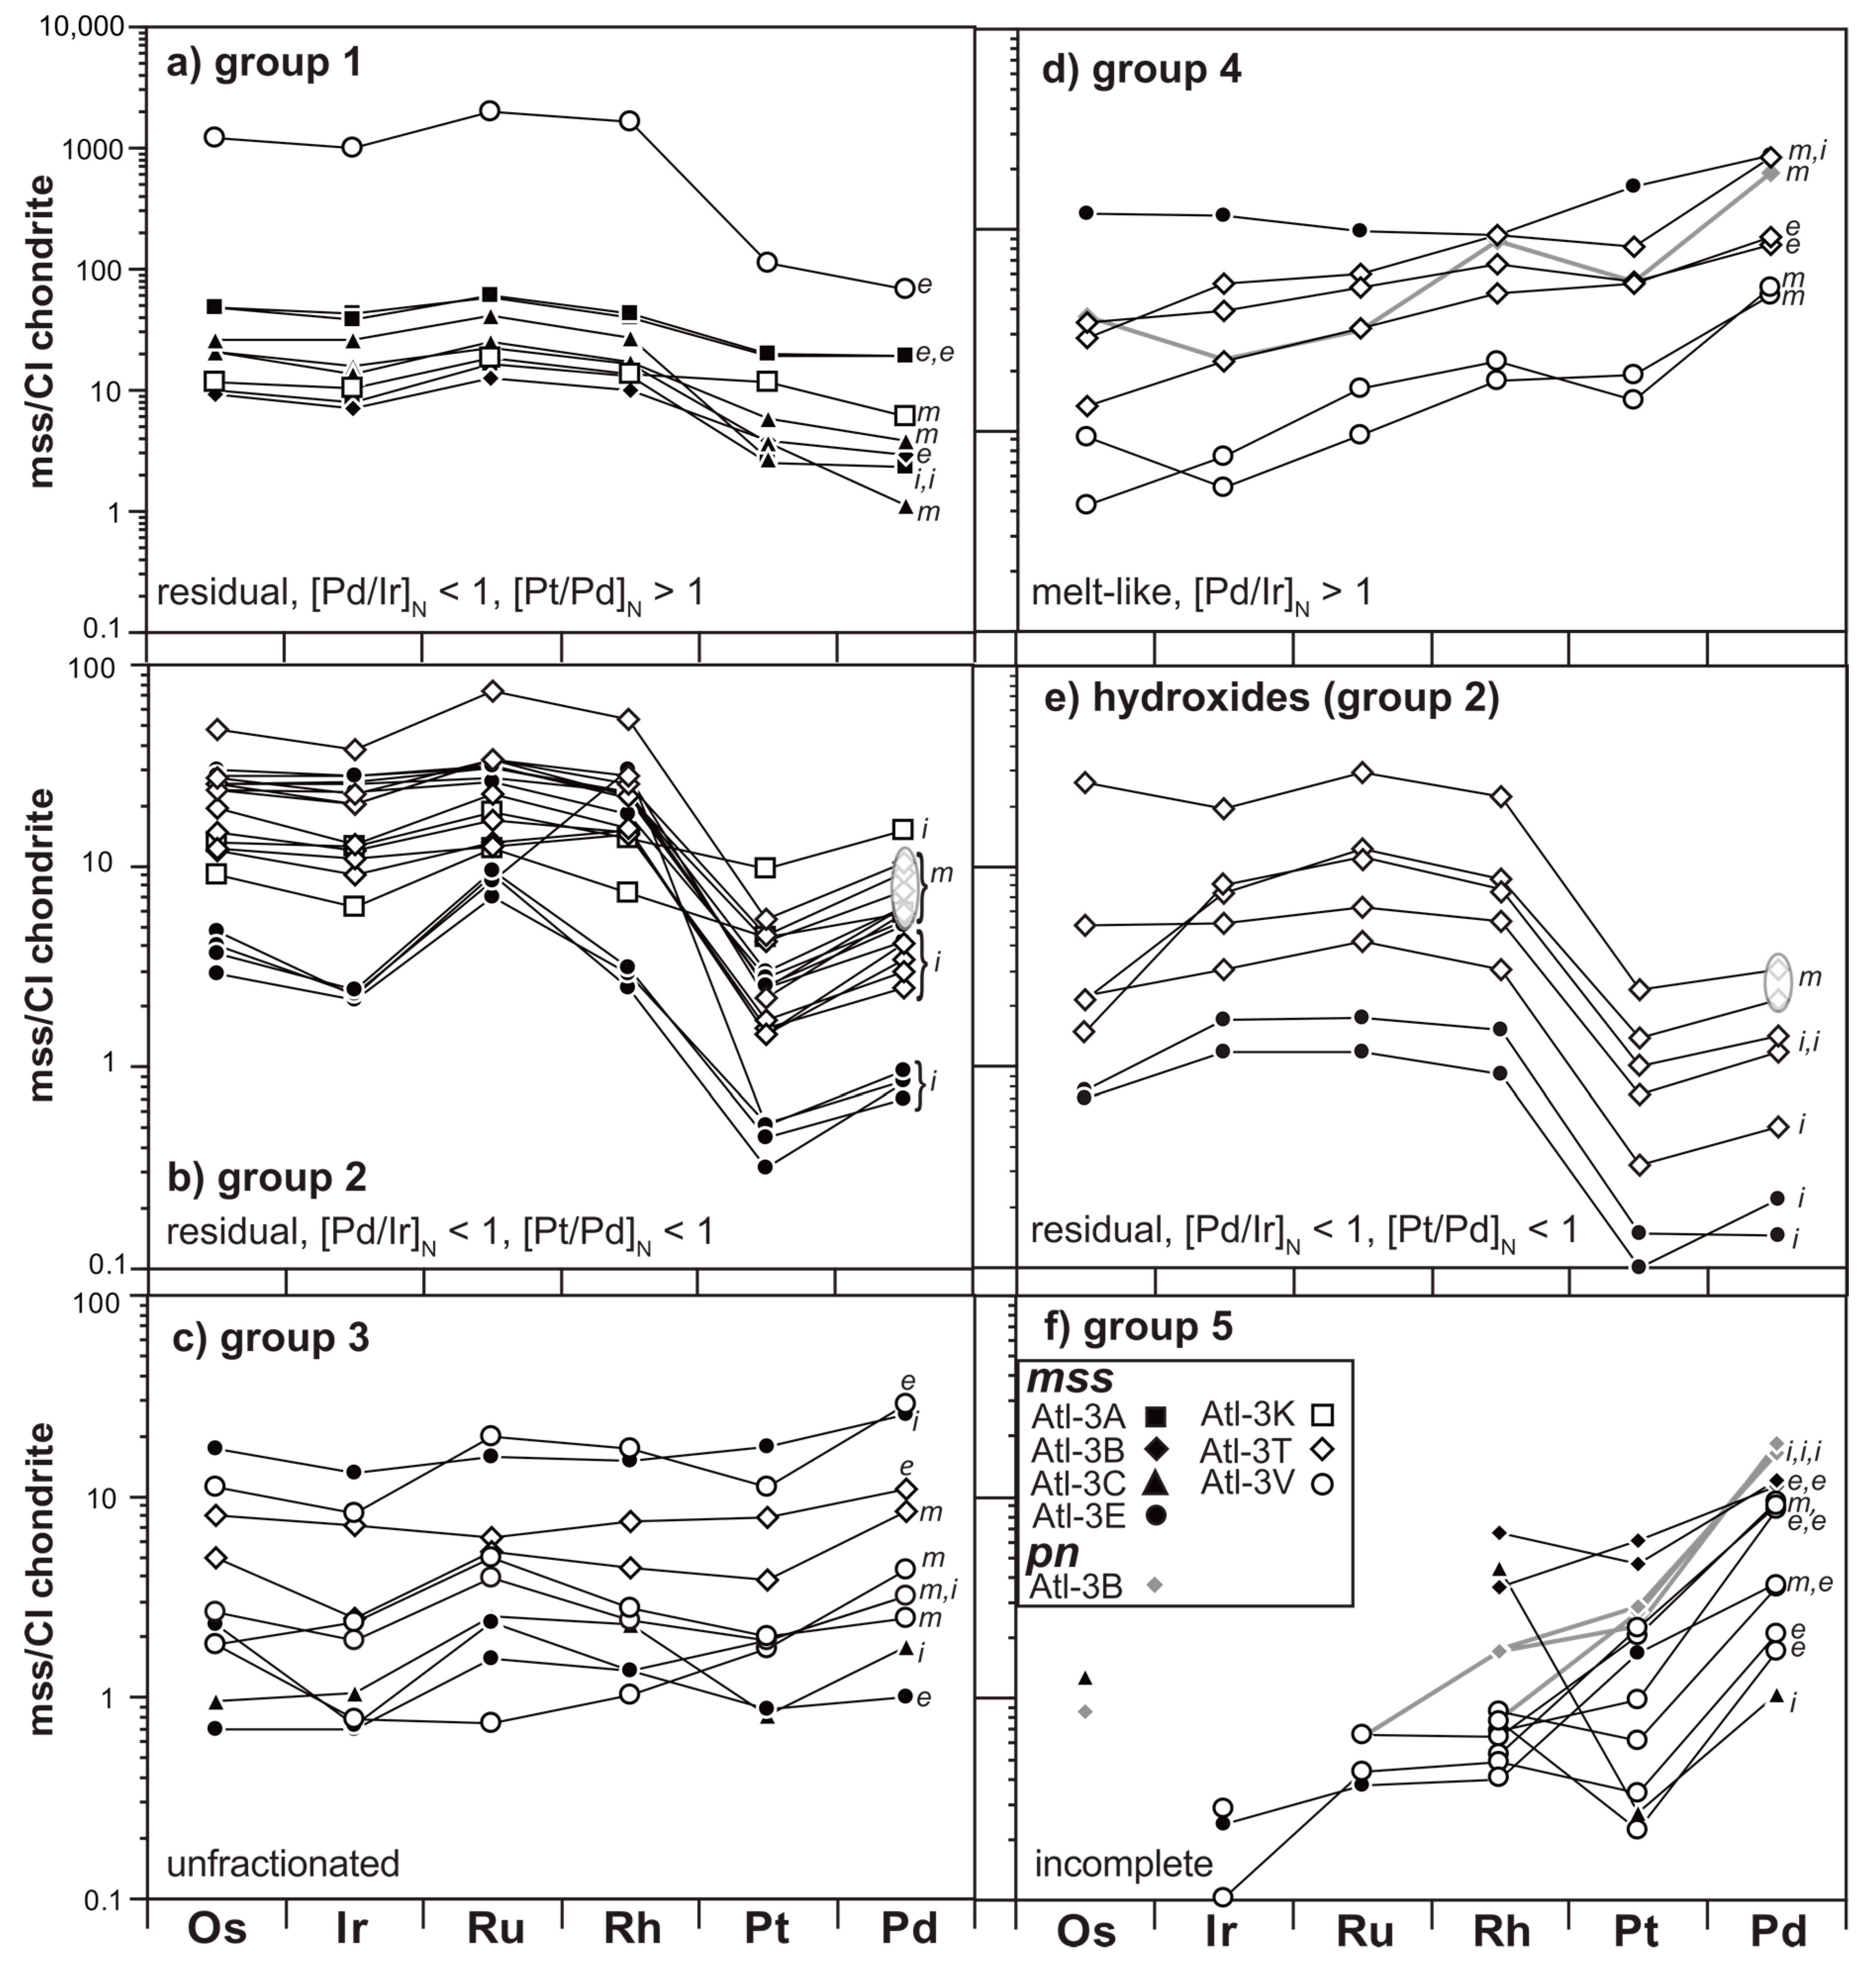
3.2. Siderophile/Chalcophile Major and Trace Element Composition of Sulfides

The majority of the sulfides display Fe, Ni, Cu, and Co systematics comparable to the mss (Table 2, Figure 2, Supplementary Materials Table S1). Pentlandite (Atl-3B, -3C, -3V) and iss (Atl-3A, -3B) were only rarely analyzed due to their small grain size and subordinate occurrence (Supplementary Materials, Table S2).
The Fe and Ni contents of the mss vary from 28.2 to 59.8 wt % and 2.1 to 33.4 wt %, respectively. The S contents range from 35.3 to 39.8 wt %, while Co concentrations are subordinate (0.1 to 0.3 wt %). The Cu abundances are highly variable and scatter between 0.1 and 5.9 wt %. The Ni/(Ni + Fe)at and M/Sat (metal/sulfur) ratios range from 0.03 to 0.53 and from 0.86 to 1.03, respectively. The textural occurrence of the mss do not correlate with their M/Sat ratios (Figure 3).
Replicate analysis of selected mss grains (n = 23) document the relatively homogeneous distribution of Fe, Ni, and S contents (RSDs ≤ 3.3 %, ≤8.9 %, and ≤1.1 %) and typically show highly scattered Cu abundances (RSD ≤ 67.3 %) related to the exsolution phenomena described previously. Pentlandites (n = 17) are relatively Ni-poor (26.9 to 37.6 wt %), with Ni/(Ni + Fe)at ratios from 0.39 to 0.55. Cobalt concentrations are relatively uniform (~0.1 wt %), whereas Cu varies between 0.1 and 1.3 wt %. The iss analyses (n = 2) yielded a mineral formula close to the composition of isocubanite, i.e., CuFe2S3 (see Table S2). The relatively high Ni contents of 2.3 and 3.9 wt % may have resulted from contamination by associated mss.
The majority of the LA-ICP-MS analyses were performed on mss (n = 57), while 10 analyses were performed on pentlandite. Due to scarcity and small grain size, only one analysis of iss occurring in an intergrowth with mss was possible (Table 3). The PGE contents of the mss vary over several orders of magnitude (Figure 4 and Figure 5), e.g., Os abundances range from 0.21 to 597 ppm within the same thick section. Within single mss grains, the abundances of the Ir-group PGE (IPGE, i.e., Ir, Os, Ru; Ir: ≤59%; Os: ≤80%; Ru: ≤47%) and, even more significantly, of the Pd-group PGE (PPGE, i.e., Pt, Pd; Pt: ≤141%; Pd: ≤131%) and Rh (≤140%) show a very large scatter. For two mss–pentlandite pairs (n = 2) and pentlandite replicates (n = 2), the PGE variation is comparable to those of the monophase mss grains. The IPGEs are positively correlated with each other, Rh, and Pt, while the PPGEs are less well correlated (Figure 4).
Five distinct PGE groups were identified in the mss and pentlandites independent of their textural occurrence (Figure 4 and Figure 5). A first-order distinction among the sulfide population was made based on the fractionation of IPGEs from the PPGEs ([Pd/Ir]N < 1 and > 1). While both sub- and suprachondritic [Pd/Ir]N ratios were observed in mss grains, the PGE systematics of all pentlandite analyses show [Pd/Ir]N > 1. Mss with low Pd contents relative to Ir resemble residual sulfides generated during melting experiments [39] and were further distinguished by their degree of PPGE fractionation ([Pt/Pd]N < 1 and > 1, groups 1 and 2). PGE patterns with suprachondritic [Pd/Ir]N and higher PPGE than IPGE content (group 4) were observed in both mss and pentlandite. Unfractionated, “flat” signatures also exhibit [Pd/Ir]N ratios > 1 (group 3) and were identified only in mss. Group 3 and 4 PGE signatures correspond to sulfides experimentally precipitated from melts [39]. The PGE patterns of some mss and pentlandites and the intergrowth of isses and mss could not be assigned to any of the four established groups due to several of their IPGE and PPGE abundances being below the limit of detection (Group 5). Sub- and suprachondritic [Pd/Ir]N PGE signatures occur in all xenoliths with the exception of the extremely sulfide-poor harzburgite Atl-3I, where only one minute sulfide grain could be measured.
The contents of other siderophile and chalcophile elements vary widely among the analyzed sulfides and partially range over hundreds of ppm. Antimony and Sn abundances generally are below the limit of detection. Repeat analyses showed that within single mss grains, trace elements are distributed according to their partitioning behavior between Fe-Ni- and Cu-rich sulfide liquids and phases precipitated from these melts [41,42,43,44,45]. In agreement with their experimentally determined mss–iss partition coefficients [41], particularly the contents of Ag, Te, Pb, and As are generally comparatively enriched (along with Cu) in the analyzed mss. The pattern of siderophile/chalcophile elements in mss do not show a discernible relation with the petrographic occurrence of the grains and the PGE systematics of the respective in situ analyses (Figure 6a–d,f). Consequently, the abundances of the trace elements are generally not correlated with the [Pd/Ir]N ratios. The exceptions are the positive correlations of Te (R2 = 0.88) and Au (R2 = 0.93) in Group 2 mss and a negative correlation of Cd (R2 = −0.87) in group 4 mss. Large variations in the trace elements were observed within the mss dataset as a whole, but also within the groups defined on the basis of their PGE patterns. Particularly the abundances of Cu, Pb, and Ag exhibit a large scatter in all systematics, which is thought to be related to exsolution phenomena of Cu-bearing mss and according elemental partitioning as described above. As a consequence, the variation of trace element distribution within single mss grains caused by different partitioning behavior exceeds potential fractionation (along with [Pd/Ir]N) as defined in established PGE systematics.
In agreement with previous studies [46,47,48,49,50,51,52,53], pentlandites have elevated concentrations of Co, Pd, and Ag when compared to mss (Figure 6g). Replicate analysis of pentlandite grains revealed a relatively homogeneous trace element inventory where chalcophile elements (including Cd, Sb, Te, and As), which are highly compatible in iss [41,54], are enriched together with Cu. The iss–mss intergrowth (Table 3, Figure 6g) has an incomplete PGE inventory with an elevated Pd content. The abundances of Sb, Pb, Ag, Sn, and Zn are several times higher relative to mss and pentlandites and document the enrichment of these elements together with Cu.
The PGE concentrations of sulfides with residual PGE patterns (Groups 1 and 2) are generally higher than those with secondary signatures (Groups 3, 4, and 5). The abundances of trace elements, which are incompatible in mss and are partitioned into sulfide melts (Dmss/Lsul < 1; i.e., Zn, Ag, Pb, As, Sb, Sn, Se, Te, Cd, and Au; Liu & Brenan [41], Helmy et al. [45]), are, however, comparatively enriched in sulfides with secondary PGE patterns. This was particularly observed for sulfide grains with an incomplete PGE inventory (Group 5; Figure 7). Unlike the distribution of single elements, which are affected by grain size heterogeneity and are consequently uncorrelated with the PGE systematics, the abundances of incompatible elements appear overall to be related to the residual or secondary character of PGE patterns.

3.3. Siderophile/Chalcophile Major and Trace Element Composition of Fe-Hydroxides

The hydroxides found in the Middle Atlas xenoliths show a large compositional variability (Table 3 and Table 4), which is comparable to analyses by Locmelis et al. [55] and Lorand [56]. The Fe2O3, NiO, and CuO contents range from 17.5 to 86.74 wt %, 1.5 to 32.3 wt %, and 0.1 to 6.2 wt %, respectively. Restitic S abundances are up to 6.6 wt %, with a mean of 0.3 wt %. Low totals between 74.6 and 94.0 wt % reflect the presence of a hydrous component. Based on these element systematics, we classified these phases as impure goethites. Significant amounts of SiO2 (≤25.5 wt %), Al2O3 (≤5.7 wt %), and CaO (≤4.3 wt %) were detected, indicating very fine-grained clay minerals resulting from the alteration of nearby silicate and oxides phases intermingled with the Fe-hydroxides.
LA-ICP-MS analyses of Fe-hydroxides were performed in samples Atl-3E and Atl-3T (Table 3, Figure 5e and Figure 6e). Since S was used as an internal standard and was hence closely monitored during the analysis, contamination of the trace element signatures by relictic sulfides could be excluded. The abundances of the PGEs are significantly lower in the weathering products. In agreement with other studies (e.g., [57,58,59,60]), particularly Pd and Os appear to be sensitive toward atmospheric weathering and commonly exhibit the largest losses of all PGEs. Overall, however, the PGE systematics of the hydroxides are clearly inherited from the host mss. The contents of other siderophile/chalcophile trace elements are usually depleted in the weathering products. Copper, Zn, and Pb are partially enriched in the Fe-hydroxides of sample Atl-3T. According to Frei [61], Cu and Zn are predominantly incorporated in the goethite lattice, while Pb either is adsorbed on its surface or precipitated by jarosite phases. A pronounced enrichment of Te and Mo determined in one case is presumably caused by the presence of secondary, oxidized microinclusions within the Fe-hydroxide matrix. This observed variability likely is a result of the higher removal rate of some elements during weathering, which depends on multiple factors (e.g., pH, temperature, formation of aqueous complexes); the discussion of this is beyond the scope of this study. Furthermore, the trace element pattern also depends on the highly varying major element composition of the Fe-hydroxides as well as the nature and amount of secondary silicate phases intermingled with them.

4. Discussion

4.1. The Relationship of Sulfide Inventory and Whole-Rock PGE Compositions

4.1.1. Late-Stage Exsolution, Elemental Mobility, and Breakdown of Sulfides

The silicates in the Middle Atlas xenoliths appear to be very fresh, with almost no visual evidence of hydrothermal alteration and serpentinization. While the in situ mss analyses were performed on fresh portions of the mss, breakdown regions of these sulfides are ubiquitous. Major element systematics in the breakdown products are consistent with impure goethite, with S being absent or very low in these hydroxides. The overall PGE abundances are lower in the hydroxides relative to their host mss, indicating that these elements are not as efficiently removed during the breakdown as e.g., S. However, the PGE patterns in the hydroxides are generally identical to those of the host mss, although some hydroxides have low Os relative to Ir. These data indicates that the breakdown of mss is only related to small-scale alteration, which was not pervasive enough to completely destroy the sulfides or leave traces in the silicates. It has been suggested by Lorand [56] that such hydroxide alteration of mss may be related to the emplacement of xenoliths above resident aquifers during the eruption of the host basalts, thus exclusively recording late-stage weathering.
The thermal evolution of the Middle Atlas SCLM can be retraced from the sulfide mineralogy. The stability of iss in the samples indicates that equilibration was not established after the ambient temperature fell below 200 °C (i.e., close to or at the crust–mantle boundary), when the high-temperature phase iss becomes unstable [62]. For most xenoliths, pentlandites are absent or subordinate to mss in abundance, suggesting (among other criteria) rapid cooling during ascent so that the temperature-related breakdown of mss to pentlandites and Fe sulfide (e.g., pyrrhotite, pyrite) was not completed (cf. Etschmann et al. [63]). The determined comparatively Fe-rich chemistry of the pentlandites might have been related to (partially) incomplete segregation from mss, which ultimately transformed into, e.g., Ni-poor pyrrhotite and hence might further indicate a lack of equilibration at lower temperatures. All investigated samples, however, contain mss grains with exsolution lamellae differing in their Ni and Cu contents, the occurrence of which clearly points to the beginning of temperature-induced breakdown of mss. Altogether, the sulfide inventory of the Middle Atlas records, for the most part, high-temperature processes, and thus can be used to trace the evolution of the SCLM.

4.1.2. Implications of Elemental Heterogeneity in mss

Sulfide trace element abundances are extremely variable on a section scale. Consequently, a discussion of mss formation and alteration must be based on trace element ratios rather than concentrations. The heterogeneity observed in the Middle Atlas xenoliths indicates that potential siderophile/chalcophile element equilibrium in mantle xenoliths can only be applied at the µm scale of an individual sulfide inclusion. Moreover, numerous sulfides show exsolution phenomena, often producing Ni- and Fe- and/or Cu-rich domains, which fractionate siderophile/chalcophile trace elements according to their partitioning behavior. While these internal mss exsolution structures can also be used to elucidate the late-stage cooling history of the xenoliths (Section 4.1.1), in situ analyses of mantle sulfides must be carried out with care. Detailed petrographic documentation is required in order to accurately decipher trace element systematics, since siderophile/chalcophile element abundances and signatures do not correlate with the textural occurrence of sulfides. For example, a distinct fractionation of Pd from Ir was found in mss that are enclosed in primary silicates (Type e), are interstitially in the peridotite matrix (type i), and are associated with melt pockets (Type m, Figure 3). This is in contrast to other in situ mss PGE studies [64], which have highlighted that enclosed mss host residual PGE signatures ([Pd/Ir]N < 1) and thus record mantle melting, while those in the peridotite matrix have PGE patterns suggesting that mss precipitated from basaltic melts (melt-like mss) and by other forms of metasomatism. All Middle Atlas xenoliths host mss populations with different PGE systematics, which occur together on a thin-section scale. We conclude that equilibration of mss does not occur on a thin-section scale, but may likely occur on a µm scale of the individual mss.

4.1.3. The PGE Relationship of mss and Peridotite Whole Rocks

The whole-rock PGE analyses are interpreted to represent a cumulative picture of the SCLM evolution (Figure 8 and Figure 9; Wittig et al. [20]). Our detailed petrographic analysis, coupled with our in situ trace element determination, indicate that a complicated geochemical history of the Middle Atlas SCLM is preserved in the xenolith sulfide mineralogy and geochemistry. The reconstruction of the whole-rock siderophile/chalcophile element systematics from the sulfide trace element inventory was extremely difficult due to the large petrographic and elemental heterogeneity. While numerous thin and thick sections were examined, we did not find evidence for IPGE-rich alloys and/or sulfides. These phases likely exist in refractory xenoliths and host much of the IPGE inventory [15,27,65]. For example, the harzburgitic sample Atl-3I yielded the highest whole-rock PGE abundances, with low [Pd/Ir]N and residual whole-rock PGE patterns while detectable sulfides in this sample are rare and have very small grain sizes. A single analysis of an iss–mss intergrowth was possible in Atl-3I. It yielded a pattern with an incomplete PGE inventory along with enriched Pd and thus is not representative of the whole-rock xenolith signature. This indicates that this xenolith originates from an extremely depleted portion of the off-cratonic SCLM (which evaded pervasive metasomatic enrichment), and thus the whole-rock PGE budget appears to be hosted by PGE-rich alloys and/or sulfides. While the variability of mss abundances and trace element inventory is substantial in these off-cratonic mantle xenoliths, a broad correlation of olivine mode and sulfide abundances could be observed with the more fertile xenoliths having a higher sulfide modal abundance (Table 1). This relationship between the degree of depletion and re-enrichment, evidenced by the xenolith whole-rock and sulfide composition, is also shown in Figure 8, in which refractory xenoliths with comparatively low Al2O3 contents contain no or only very minor mss (Atl-3I, -3L, -3U, -3F, -3B). Peridotites with Al2O3 between 2 and 2.5 wt % seem to show whole-rock PGE systematics that are not reflected by the analyzed mss (Atl-3A, -3K), while those peridotites with higher Al2O3 contents appear to inherit their [Pd/Ir]N from the mss population (Atl-3C, -3E, -3V). In addition, the variability in mss [Pd/Ir]N increases systematically with increasing Al2O3 contents, with the more fertile samples displaying a stronger Pd-enrichment (i.e., they display elevated [Pd/Ir]N ratios in individual mss (Figure 8)). Applying a melting model in the [Pd/Ir]N-Al2O3 space suggests that those xenoliths with highly variable mss [Pd/Ir]N (Atl-3C, -3E, -3V) also have mss with the most extreme depletion signature. This can best be explained if these mss experienced partial melting exceeding 20%, suggesting that both Pd and Al2O3 were enriched in these samples by a similar process and that the SCLM comprised harzburgites, which after extensive metasomatic re-enrichment constitute the lherzolites that now dominate the Middle Atlas SCLM.

4.2. Evidence for Mantle Depletion and Metasomatic Enrichment in mss

4.2.1. Melt Extraction Recorded in Middle Atlas Xenolith mss PGE Signatures

Many geochemical proxies may be used to determine the degree of melt extraction in peridotites (e.g., References [68,69,70]). Commonly, lithophile elements have been used for this purpose (e.g., K, Rb, Ba), although most of these are also sensitive to post-melting metasomatic alteration resulting from chemical equilibration reactions between silicates and liquids and the precipitation of secondary silicates (e.g., References [71,72,73,74,75]). Both mechanisms are ubiquitous in the SCLM and may eradicate signatures from previous melting events. In the last decades, the relationship between melt extraction and PGE fractionation has been established based on experiments (e.g., Bockrath et al. [39]) and a strongly depleted cratonic SCLM [2,24,66,76]. These results show that IPGEs and PPGEs fractionate during large-volume melting events, whereas Pt and Pd behave less compatible in mss and may have been concentrated in the silicate melt generated in the mantle. The IPGEs, on the other hand, remain in the refractory peridotite matrix and are hosted in residual mss, IPGE alloy nuggets, and IPGE-rich sulfides. The residual PGE signatures are evident from lower [Pd/Ir]N. The relationship between Pt and Pd in residual mss provides information as to whether initially depleted Pd re-equilibrated with the melt portion of the mss, inducing [Pt/Pd]N < 1. Group 1 and 2 mss, which were found in all of the xenoliths studied, have residual PGE systematics, with the latter showing a slight Pd re-enrichment. These mss PGE systematics provide evidence that the Middle Atlas off-cratonic continental keel records large-scale initial depletion event(s). Melt extraction between 5% and 25%, as recorded by whole-rock FeO-MgO systematics [20], allowed for detectable IPGE and PPGE fractionation, but did not exhaust the mss in the refractory peridotite (e.g., References [54,64,77]). The group 1 and 2 mss can be characterized in a melting model if the partition coefficients (KD) of Pt/Pd vary between 0.4 (group 1) and 0.7 (group 2). However, the melting experiments by Bockrath et al. [39] suggest a Pt/PdKD of ~1, resulting in residual mss with PGE systematics that require approximately equal compatibility of Pt and Pd (Figure 9). Recovery of the strong depletion signature recorded in the mss from all investigated xenoliths provides unambiguous evidence that all Middle Atlas xenoliths experienced substantial depletion. This further confirms that the lithophile elements and the whole-rock PGE inventory with elevated [Pd/Ir]N (Figure 8) reflects a mix of depletion and multiple metasomatic events.
Because the mss population in sample Atl-3I is virtually absent, but the whole-rock PGE abundances are distinctly higher than those of the majority of Middle Atlas xenoliths, most likely this sample hosts elusive IPGE alloy nuggets and/or sulfides that were difficult to detect with the methods available for this study (cf. Osbahr et al. [51], Reisberg and Meisel [78]). Sample Atl-3I suggests an even stronger overall depletion (>25%) exceeding the melt extraction rate recorded by the other xenoliths, which perhaps accumulated in multiple events. Clearly, the in situ siderophile/chalcophile element analyses of mss in the Middle Atlas xenoliths highlight that this otherwise typical fertile off-cratonic SCLM experienced substantial depletion as a whole, which is unlikely to be discovered using whole-rock PGE signatures or lithophile elements. Nevertheless, the mss population also records other PGE systematics that provides further details on the metasomatic evolution of this continental keel (Section 4.2.2).

4.2.2. Precipitation of Melt-Like mss during the Initial Melting Event or from Ascending Basaltic Melts?

We established that a large fraction of mss (Groups 1 and 2) has PGE systematics that are the result of mantle melting and that are typically referred to as “residual” (Figure 8 and Figure 9). In melting experiments [39], a second mss is generated that is complimentary to the residual mss, i.e., enriched in PPGE relative to IPGE (Figure 9). Group 4 mss have PGE signatures that exhibit similarities to melt-like mss produced in melting experiments [39]. In [Pd/Ir]N-[Pt/Pt]N space (Figure 9), mss with little to no Pd-Ir fractionation (Group 3) are intermediate between Groups 1 and 4. This suggests that groups 1 and 4 are genetically related by the initial melting event, and group 3 mss reflect an intermediate stage likely resulting from incomplete melt extraction and/or melt/mss reaction. However, the prevalence of [Pd/Ir]N values which are higher than primitive mantle and higher than melt mss [Pd/Ir]N (<8; Reference [39]; cf. Figure 8] in mss from xenoliths with elevated Al2O3 contents may suggest that this relationship results from the introduction of additional mss or the Pd enrichment of existing mss.
It is therefore difficult to conclusively determine if the melt-like mss are a first-generation product of incomplete melt removal and the formation of residual mss during melt extraction, and/or were formed during a later metasomatic episode that introduced Al2O3 and other mobile lithophile elements. The PGE systematics appear to be more reliable than other siderophile/chalcophile trace elements for the understanding of the overall origin of individual mss in peridotites. However, combining the total content of trace elements incompatible in mss [41,45] with total PGE values may help in understanding the origin of Group 3 and 4 sulfides as well as those with an incomplete PGE inventory (Group 5). Figure 4 shows that the IPGE and to a lower degree PPGE systematics of all sulfides are correlated and that individual groups with residual (Groups 1 and 2) and secondary patterns (Groups 3, 4, and 5) overlap in their PGE concentrations. Similarly, residual mss have comparatively high total PGE contents (Figure 8), but commonly exhibit (in comparison) lower abundances of incompatible trace elements. These are in contrast rather enriched in secondary sulfides, particularly in those with an incomplete PGE budget (Group 5), and therefore possess characteristics typical of a sulfide melt. Thus, we favor a model in which the absence of elemental correlation suggests that PPGEs and other chalcophile/siderophile trace elements were introduced to the SCLM by melt/-rock reaction with passing mafic melts instead of being redistributed between mss during an initial melting event in a closed system. This interpretation is clearly tentative and will have to be tested with more in situ trace element data from mss and complementary experimental data.

5. Conclusions

In the present study, we investigated the sulfide mineralogy of 11 well-characterized mantle xenoliths from the Middle Atlas (Morocco). The sulfides were analyzed for their major and trace element content. Our results show that the combined PGE-chalcophile-siderophile in situ analysis of mss reveal the complex evolutionary history of xenoliths from the Moroccan SCLM. We found that the petrographic occurrence of sulfides in mantle xenoliths is not correlated with their PGE systematics and hence may not provide a reliable tracer for the processes involved in their formation. The preservation of sub-µm heterogeneity in sulfides stresses the importance of in situ trace element measurements as opposed to whole-rock approaches. The coexistence of both residual and melt-like PGE signatures in a single sample implies that sulfides may record initial depletion and subsequent re-enrichment more effectively than the constituent silicates. Chalcophile and siderophile trace elements other than the PGEs are fractionated between the precipitated sulfide phases, suggesting that the PGEs are more sensitive to melting and depletion than the other sulfide trace elements. Finally, PGE systematics of Fe-rich hydroxides are almost identical to their precursor sulfides, implying that they may be used as reliable tracers of mantle processes even after extensive weathering.

Supplementary Materials

The following are available online at https://www.mdpi.com/2075-163X/9/5/276/s1, Figure S1: Elemental mapping (S, Mg, Cu, Fe, Ni, Al, Na and Ti) of an interstitial mss with exsolution lamellae and weathering to Fe-hydroxide phases, Figure S2: Elemental mappings (S, Mg, Cu, Fe and Ni) of enclosed mss, partially with melt trails, showing exsolution lamellae and segregated Cu-Fe sulphide phase, Table S1: Complete dataset of Middle Atlas mss major element composition, Table S2: Complete dataset of Middle Atlas pentlandite (pn) and iss major element composition, Table S3: Complete data set of Middle Atlas spinel major and trace elements.

Author Contributions

Conceptualization, R.K. and N.B.; methodology, R.K., I.O., and N.B.; investigation, K.J.W., I.O., and N.B.; resources, R.K.; writing—original draft preparation, K.J.W., N.B., and R.K.; writing—review and editing, C.B. and R.K.; visualization, K.J.W. and N.B.; supervision, R.K. and N.B.; project administration, R.K. and N.B.; funding acquisition, R.K. and N.B.

Funding

This research was funded by the Deutsche Forschungsgemeinschaft (DFG), grant number KL 692/22-1.

Acknowledgments

The authors would like to thank Helene Brätz for assisting in LA-ICP-MS analyses at the GeoZentrum Nordbayern. Sonja Aulbach is thanked for comments and suggestions on a previous version of the manuscript.

Conflicts of Interest

The authors declare no conflicts of interest. The funders had no role in the design of the study; in the collection, analyses, or interpretation of data; in the writing of the manuscript; or in the decision to publish the results.

Appendix A. Petrography of Middle Atlas Xenoliths

The primary mineral assemblage of the protogranular Middle Atlas spinel peridotite xenoliths comprises sub- to anhedral olivine, ortho- and clinopyroxene, and accessory spinel [36,37]. Occasionally, the primary silicate assemblage hosts rounded pyroxene inclusions and, less frequently, eu- to subhedral spinel grains. The primary mineral assemblage displays a protogranular texture in the majority of the cases. However, in a few sections, areas with a porphyroclastic texture were observed. The crystals of primary olivine and ortho- and clinopyroxene commonly contain kink bands. Smaller subhedral to euhedral grains of olivine and ortho- and clinopyroxene, which show no signs of deformation, occur adjacent to some porphyroblasts. They presumably originate from post-deformational recrystallization. Primary olivine, clinopyroxene, and spinel adjacent to melt pockets often possess reaction rims.
The melt pockets are abundant in all Middle Atlas spinel peridotite xenoliths, with the exception of harzburgite sample Atl-3I. Their shape is commonly round to ellipsoidal, and their diameters range from 1 mm to several tens of millimeters. The contact between melt pockets and the primary peridotite phase assemblage usually is very sharp. These melt pockets and veins contain olivine, clinopyroxene, and spinel neoblasts, and in some cases relictic amphibole with rounded grain boundaries and glass. In addition, the melt pockets partially comprise small clinopyroxene microliths [36], as well as neoblasts of plagioclase, calcite, and K-laumontite. The neoblasts are eu- to subhedral, although skeletal growth is also seen. Little secondary alteration (e.g., serpentinization) is present. In rare cases, infiltration of basaltic host magma was found (clinopyroxene-magnetite ± olivine ± orthopyroxene). These areas were avoided in this study.

Appendix B. Composition of Silicates and Spinel

The major composition of primary (porphyroblastic) and secondary (neoblastic) silicates and oxides (detailed in Wittig [36] and Westner [37]) is typical for off-cratonic xenoliths (e.g., [79]), although the primary minerals have a more restricted composition relative to the neoblast generation found in the melt pockets. The comparatively higher compositional variability of the neoblasts is assumed to reflect their relatively fast precipitation (as evidenced by skeletal growth, see above) and lack of equilibration.
Primary olivines have Mg#s (Mg/(Mg + Fe) × 100) between 89.2 and 91.1. Their NiO and abundances range from 0.2 to 0.7 wt % and from 0.1 to 0.2 wt %, respectively. The neoblasts are more variable in composition, with Mg#s between 88.8 and 94.3. Their NiO contents are scattered between 0.2 and 0.8 wt %, while the CaO abundances are between 0.1 and 0.4 wt %. The orthopyroxenes show a restricted compositional range and are dominated by the enstatite component. Their Mg#s range from 89.8 to 91.4, similar to those of the analyzed primary olivines. The Al2O3 and CaO contents range from 3.4 to 5.5 wt % and from 0.6 to 1.0 wt %, respectively. Most of the primary clinopyroxenes are augites, but some diopsides were also identified. The Mg#s straddle between 88.8 and 91.5. The Al#s (Al/(Al + Si) × 100) and Cr#s (Cr/(Cr + Al) × 100) display a stronger variability and range from 3.2 to 20.8 and from 5.0 to 27.4, respectively. Their CaO contents are scattered between 18.0 and 20.9 wt %. The clinopyroxene neoblasts show a considerably larger variability in comparison to the porphyroblasts. We identified few more neoblasts with augitic than diopsidic compositions. The Mg#s, Al#s, and Cr#s of the clinopyroxene neoblasts are highly variable and range from 67.2 to 91.8, 4.4 to 25.2 and 5.6 to 24.0, respectively, and their CaO contents are scattered between 17.5 and 23.7 wt %. The amphiboles were found to be associated with melt pockets only and in most cases are pargasites. Only in sample Atl-3T kaersutites with at least 0.5 formula units of Ti were identified. The Mg#s scatter between 76.9 and 89.7. Amphiboles typically contain between 14.6 and 15.6 wt % Al2O3. The CaO contents scatter between 9.6 and 12.1 wt %, and the sum of Na2O and K2O usually is between 3.0 and 4.0 wt %. The TiO2 contents range between 0.6 and 5.0 wt %. The composition of the amphiboles can vary significantly in a single grain.
Primary spinels possess Mg#s and Cr#s between 72.5 and 85.9 and between 10.3 and 34.3, respectively, while the Fe3+/(Fe3+ + Cr + Al) ratio is between 0.03 and 0.06 (Fe2O3 contents were calculated according to Droop [80]). The spinel neoblasts found in melt pockets possess Cr#s (8.1–26.4) lower than those of the porphyroblasts and widely scattering Mg#s (76.6–91.1). The range of the Fe3+/(Fe3+ + Cr + Al) ratio is equal to that of the porphyroblasts and varies between 0.03 and 0.06. Spinel porphyroblasts were analyzed for their trace element inventory (see Table S3), particularly to check for their potential contribution to the whole-rock PGE budget. Cobalt and Zn were always detected and range from 193 to 334 ppm and from 754 to 1377 ppm. Cu often could be determined with a content of up to 8.28 ppm. Chalcophile and siderophile elements are typically absent from the spinel, although on occasion Ag, Cd, Sb, Re, Au, and Pb were detected with values up to 0.426, 4.96, 0.228, 0.261, 0.319, and 0.348 ppm. The spinels do not contain detectable PGE abundances.

References

  1. Pearson, D.G.; Wittig, N. The Formation and Evolution of Cratonic Mantle Lithosphere—Evidence from Mantle Xenoliths. In Treatise on Geochemistry, 2nd ed.; Holland, H.D., Turekian, K.K., Eds.; Elsevier: Oxford, UK, 2014; pp. 255–292. ISBN 978-0-08-098300-4. [Google Scholar]
  2. Aulbach, S.; Gerdes, A.; Viljoen, K.S. Formation of diamondiferous kyanite–eclogite in a subduction mélange. Geochim. Cosmochim. Acta 2016, 179, 156–176. [Google Scholar] [CrossRef]
  3. Luguet, A.; Reisberg, L. Highly Siderophile Element and Os-187 Signatures in Non-cratonic Basalt-hosted Peridotite Xenoliths: Unravelling the Origin and Evolution of the Post-Archean Lithospheric Mantle. Rev. Mineral. Geochem. 2016, 81, 305–367. [Google Scholar] [CrossRef]
  4. Lee, C.T.A.; Lenardic, A.; Thiagarajan, N.; Agranier, A.; O’Neill, C.J.; Yin, Q.Z. Remnant iron oxide/sulfide mattes from a Hadean magma ocean at the core-mantle boundary: Insights from a small scale post-Archean analog. Geochim. Cosmochim. Acta 2006, 70, A347. [Google Scholar] [CrossRef]
  5. Griffin, W.L.; O’Reilly, S.Y.; Afonso, J.C.; Begg, G.C. The Composition and Evolution of Lithospheric Mantle: A Re-evaluation and its Tectonic Implications. J. Petrol. 2009, 50, 1185–1204. [Google Scholar] [CrossRef]
  6. Griffin, W.L.; O’Reilly, S.Y.; Abe, N.; Aulbach, S.; Davies, R.M.; Pearson, N.J.; Doyle, B.J.; Kivi, K. The origin and evolution of Archean lithospheric mantle. Precambrian Res. 2003, 127, 19–41. [Google Scholar] [CrossRef]
  7. Carlson, R.W.; Pearson, D.G.; James, D.E. Physical, chemical, and chronological characteristics of continental mantle. Rev. Geophys. 2005, 43. [Google Scholar] [CrossRef] [Green Version]
  8. Lorand, J.P.; Luguet, A.; Alard, O. Platinum-group element systematics and petrogenetic processing of the continental upper mantle: A review. Lithos 2013, 164, 2–21. [Google Scholar] [CrossRef]
  9. Lorand, J.P.; Barrat, J.A.; Chevrier, V.; Sautter, V.; Pont, S. Metal-saturated sulfide assemblages in NWA 2737: Evidence for impact-related sulfur devolatilization in Martian meteorites. Meteorit. Planet. Sci. 2012, 47, 1830–1841. [Google Scholar] [CrossRef] [Green Version]
  10. Day, J.M.D.; Brandon, A.D.; Walker, R.J. Highly Siderophile Elements in Earth, Mars, the Moon, and Asteroids. Rev. Mineral. Geochem. 2016, 81, 161–238. [Google Scholar] [CrossRef] [Green Version]
  11. Kiseeva, E.S.; Kamenetsky, V.S.; Yaxley, G.M.; Shee, S.R. Mantle melting versus mantle metasomatism—“The chicken or the egg” dilemma. Chem. Geol. 2017, 455, 120–130. [Google Scholar] [CrossRef]
  12. Brenan, J.M. Re-Os fractionation by sulfide melt-silicate melt partitioning: A new spin. Chem. Geol. 2008, 248, 140–165. [Google Scholar] [CrossRef]
  13. Lorand, J.P.; Luguet, A.; Alard, O. Platinum-group elements: A new set of key tracers for the earth’s interior. Elements 2008, 4, 247–252. [Google Scholar] [CrossRef]
  14. Luguet, A.; Alard, O.; Lorand, J.P.; Pearson, N.J.; Ryan, C.; O’Reilly, S.Y. Laser-ablation microprobe (LAM)-ICPMS unravels the highly siderophile element geochemistry of the oceanic mantle. Earth Planet. Sci. Lett. 2001, 189, 285–294. [Google Scholar] [CrossRef]
  15. Luguet, A.; Lorand, J.P.; Seyler, M. Sulfide petrology and highly siderophile element geochemistry of abyssal peridotites: A coupled study of samples from the Kane Fracture Zone (45 degrees W 23 degrees 20N, MARK Area, Atlantic Ocean). Geochim. Cosmochim. Acta 2003, 67, 1553–1570. [Google Scholar] [CrossRef]
  16. Luguet, A.; Shirey, S.B.; Lorand, J.P.; Horan, M.F.; Carlson, R.W. Residual platinum-group minerals from highly depleted harzburgites of the Lherz massif (France) and their role in HSE fractionation of the mantle. Geochim. Cosmochim. Acta 2007, 71, 3082–3097. [Google Scholar] [CrossRef]
  17. Pearson, D.G.; Carlson, R.W.; Shirey, S.B.; Boyd, F.R.; Nixon, P.H. Stabilization of Archean Lithospheric Mantle—A Re-Os Isotope Study of Peridotite Xenoliths from the Kaapvaal Craton. Earth Planet. Sci. Lett. 1995, 134, 341–357. [Google Scholar] [CrossRef]
  18. Schilling, M.E.; Carlson, R.W.; Conceicao, R.V.; Dantas, C.; Bertotto, G.W.; Koester, E. Re-Os isotope constraints on subcontinental lithospheric mantle evolution of southern South America. Earth Planet. Sci. Lett. 2008, 268, 89–101. [Google Scholar] [CrossRef]
  19. Tsuru, A.; Walker, R.J.; Kontinen, A.; Peltonen, P.; Hanski, E. Re-Os isotopic systematics of the 1.95 Ga Jormua Ophiolite Complex, northeastern Finland. Chem. Geol. 2000, 164, 123–141. [Google Scholar] [CrossRef]
  20. Wittig, N.; Pearson, D.G.; Baker, J.A.; Duggen, S.; Hoernle, K. A major element, PGE and Re–Os isotope study of Middle Atlas (Morocco) peridotite xenoliths: Evidence for coupled introduction of metasomatic sulphides and clinopyroxene. Lithos 2010, 115, 15–26. [Google Scholar] [CrossRef] [Green Version]
  21. Zhang, Z.; Zhi, X.; Chen, L.; Saunders, A.D.; Reichow, M.K. Re-Os isotopic compositions of picrites from the Emeishan flood basalt province, China. Earth Planet. Sci. Lett. 2008, 276, 30–39. [Google Scholar] [CrossRef]
  22. Gonzalez-Jimenez, J.M.; Villaseca, C.; Griffin, W.L.; O’Reilly, S.Y.; Belousova, E.; Ancochea, E.; Pearson, N.J. Significance of ancient sulfide PGE and Re-Os signatures in the mantle beneath Calatrava, Central Spain. Contrib. Mineral. Petrol. 2014, 168. [Google Scholar] [CrossRef]
  23. Aulbach, S.; Luchs, T.; Brey, G.P. Distribution and behaviour during metasomatism of PGE-Re and Os isotopes in off-craton mantle xenoliths from Namibia. Lithos 2014, 184, 478–490. [Google Scholar] [CrossRef]
  24. Pearson, D.G.; Irvine, G.J.; Ionov, D.A.; Boyd, F.R.; Dreibus, G.E. Re-Os isotope systematics and platinum group element fractionation during mantle melt extraction: A study of massif and xenolith peridotite suites. Chem. Geol. 2004, 208, 29–59. [Google Scholar] [CrossRef]
  25. Becker, H.; Horan, M.F.; Walker, R.J.; Gao, S.; Lorand, J.-P.; Rudnick, R.L. Highly siderophile element composition of the Earth’s primitive upper mantle: Constraints from new data on peridotite massifs and xenoliths. Geochim. Cosmochim. Acta 2006, 70, 4528–4550. [Google Scholar] [CrossRef]
  26. Pernet-Fisher, J.F.; Howarth, G.H.; Pearson, D.G.; Woodland, S.; Barry, P.H.; Pokhilenko, N.P.; Pokhilenko, L.N.; Agashev, A.M.; Taylor, L.A. Plume impingement on the Siberian SCLM: Evidence from Re-Os isotope systematics. Lithos 2015, 218, 141–154. [Google Scholar] [CrossRef]
  27. Lorand, J.P.; Luguet, A. Chalcophile and Siderophile Elements in Mantle Rocks: Trace Elements Controlled by Trace Minerals. Rev. Mineral. Geochem. 2016, 81, 441–488. [Google Scholar] [CrossRef]
  28. Griffin, W.L.; O’Reilly, S.Y.; Pearson, N.J.; Graham, S. In situ Re-Os dating of sulfides in Kaapvaal xenoliths. Geochim. Cosmochim. Acta 2002, 66, A292. [Google Scholar]
  29. Malarkey, J.; Wittig, N.; Pearson, D.G.; Davidson, J.P. Characterising modal metasomatic processes in young continental lithospheric mantle: A microsampling isotopic and trace element study on xenoliths from the Middle Atlas Mountains, Morocco. Contrib. Mineral. Petrol. 2011, 162, 289–302. [Google Scholar] [CrossRef]
  30. Wittig, N.; Pearson, D.G.; Duggen, S.; Baker, J.A.; Hoernle, K. Tracing the metasomatic and magmatic evolution of continental mantle roots with Sr, Nd, Hf and and Pb isotopes: A case study of Middle Atlas (Morocco) peridotite xenoliths. Geochim. Cosmochim. Acta 2010, 74, 1417–1435. [Google Scholar] [CrossRef] [Green Version]
  31. Wittig, N.; Pearson, D.G.; Downes, H.; Baker, J.A. The U, Th and Pb elemental and isotope compositions of mantle clinopyroxenes and their grain boundary contamination derived from leaching and digestion experiments. Geochim. Cosmochim. Acta 2009, 73, 469–488. [Google Scholar] [CrossRef]
  32. Hellebrand, E.; Snow, J.E.; Dick, H.J.B.; Hofmann, A.W. Coupled major and trace elements as indicators of the extent of melting in mid-ocean-ridge peridotites. Nature 2001, 410, 677–681. [Google Scholar] [CrossRef]
  33. Armstrong, J.T. Citzaf—A Package of Correction Programs for the Quantitative Electron Microbeam X-Ray-Analysis of Thick Polished Materials, Thin-Films, and Particles. Microbeam Anal. 1995, 4, 177–200. [Google Scholar]
  34. van Achterbergh, E.; Ryan, C.G.; Jackson, S.E.; Griffin, W.L. Data reduction software for LA-ICP-MS. In Laser-Ablation-ICPMS in the Earth Sciences: Principles and Applications; Sylvester, P., Ed.; Mineralogical Association of Canada: Ottawa, ON, Canada, 2001. [Google Scholar]
  35. Wohlgemuth-Ueberwasser, C.C.; Ballhaus, C.; Berndt, J.; Paliulionyte, V.S.N.; Meisel, T. Synthesis of PGE sulfide standards for laser ablation inductively coupled plasma mass spectrometry (LA-ICP-MS). Contrib. Mineral. Petrol. 2007, 154, 607–617. [Google Scholar] [CrossRef]
  36. Wittig, N. Application of Novel U-Th-Pb and Lu-Hf Isotopic Techniques to Tracing the Melting and Metasomatic History of Mantle Rocks. Ph.D. Thesis, Copenhagen University, Copenhagen, Denmark, 2006. [Google Scholar]
  37. Westner, K.J. Identifying Clinopyroxene-Sulphide Co-Precipitation, Rejuvenation Mechanisms and Platinum-Group Element Fractionation Processes in Young Continental Mantle Roots. Diploma Thesis, Friedrich-Alexander-Universität, Erlangen-Nürnberg, Germany, 2011. [Google Scholar]
  38. Barnes, S.J.; Lightfoot, P.C. Formation of magmatic nickel-sulfide ore deposits and processes affecting their copper and platinum-group element contents. In Economic Geology 100th Anniversary Volume; Hedenquist, J.W., Thompson, J.F.H., Goldfarb, R.J., Richards, J.P., Eds.; Society of Economic Geologists: Littleton, CO, USA, 2005; pp. 179–213. [Google Scholar]
  39. Bockrath, C.; Ballhaus, C.; Holzheid, A. Fractionation of the platinum-group elements during mantle melting. Science 2004, 305, 1951–1953. [Google Scholar] [CrossRef] [PubMed]
  40. McDonough, W.F.; Sun, S.-S. The composition of the Earth. Chem. Geol. 1995, 120, 223–253. [Google Scholar] [CrossRef]
  41. Liu, Y.N.; Brenan, J. Partitioning of platinum-group elements (PGE) and chalcogens (Se, Te, As, Sb, Bi) between monosulfide-solid solution (MSS), intermediate solid solution (ISS) and sulfide liquid at controlled fO2-fS2 conditions. Geochim. Cosmochim. Acta 2015, 159, 139–161. [Google Scholar] [CrossRef]
  42. Patten, C.; Barnes, S.-J.; Mathez, E.A.; Jenner, F.E. Partition coefficients of chalcophile elements between sulfide and silicate melts and the early crystallization history of sulfide liquid: LA-ICP-MS analysis of MORB sulfide droplets. Chem. Geol. 2013, 358, 170–188. [Google Scholar] [CrossRef]
  43. Li, Y.; Audétat, A. Partitioning of V, Mn, Co, Ni, Cu, Zn, As, Mo, Ag, Sn, Sb, W, Au, Pb, and Bi between sulfide phases and hydrous basanite melt at upper mantle conditions. Earth Planet. Sci. Lett. 2012, 355–356, 327–340. [Google Scholar] [CrossRef]
  44. Li, Y.; Audétat, A. Effects of temperature, silicate melt composition, and oxygen fugacity on the partitioning of V, Mn, Co, Ni, Cu, Zn, As, Mo, Ag, Sn, Sb, W, Au, Pb, and Bi between sulfide phases and silicate melt. Geochim. Cosmochim. Acta 2015, 162, 25–45. [Google Scholar] [CrossRef]
  45. Helmy, H.M.; Ballhaus, C.; Wohlgemuth-Ueberwasser, C.; Fonseca, R.O.C.; Laurenz, V. Partitioning of Se, As, Sb, Te and Bi between monosulfide solid solution and sulfide melt—Application to magmatic sulfide deposits. Geochim. Cosmochim. Acta 2010, 74, 6174–6179. [Google Scholar] [CrossRef]
  46. Barnes, S.J.; Prichard, H.M.; Cox, R.A.; Fisher, P.C.; Godel, B. The location of the chalcophile and siderophile elements in platinum-group element ore deposits (a textural, microbeam and whole rock geochemical study): Implications for the formation of the deposits. Chem. Geol. 2008, 248, 295–317. [Google Scholar] [CrossRef]
  47. Dare, S.A.S.; Barnes, S.J.; Prichard, H.M. The distribution of platinum group elements (PGE) and other chalcophile elements among sulfides from the Creighton Ni-Cu-PGE sulfide deposit, Sudbury, Canada, and the origin of palladium in pentlandite. Mineralium Deposita 2010, 45, 765–793. [Google Scholar] [CrossRef]
  48. Godel, B.; Barnes, S.J.; Maier, W.D. Platinum-group elements in sulphide minerals, platinum-group minerals, and whole-rocks of the Merensky Reef (Bushveld Complex, South Africa): Implications for the formation of the reef. J. Petrol. 2007, 48, 1569–1604. [Google Scholar] [CrossRef]
  49. Godel, B.; Barnes, S.J. Platinum-group elements in sulfide minerals and the whole rocks of the J-M Reef (Stillwater Complex): Implication for the formation of the reef. Chem. Geol. 2008, 248, 272–294. [Google Scholar] [CrossRef]
  50. Osbahr, I.; Oberthur, T.; Klemd, R.; Josties, A. Platinum-group element distribution in base-metal sulfides of the UG2 chromitite, Bushveld Complex, South Africa-a reconnaissance study. Mineralium Deposita 2014, 49, 655–665. [Google Scholar] [CrossRef]
  51. Osbahr, I.; Klemd, R.; Oberthür, T.; Brätz, H.; Schouwstra, R. Platinum-group element distribution in base-metal sulfides of the Merensky Reef from the eastern and western Bushveld Complex, South Africa. Mineralium Deposita 2013, 48, 211–232. [Google Scholar] [CrossRef]
  52. Grokhovskaya, T.L.; Bakaev, G.F.; Shelepina, E.P.; Lapina, M.I.; Laputina, I.P.; Muravitskaya, G.N. PGE Mineralization in the Vuruchuaivench Gabbronorite Massif, Monchegorsk Pluton (Kola Peninsula, Russia). Geol. Ore Depos. 2000, 42, 133–146. [Google Scholar]
  53. Barnes, S.-J.; Cox, R.A.; Zientek, M.L. Platinum-group element, Gold, Silver and Base Metal distribution in compositionally zoned sulfide droplets from the Medvezky Creek Mine, Noril’sk, Russia. Contrib. Mineral. Petrol. 2006, 152, 187–200. [Google Scholar] [CrossRef]
  54. Lorand, J.P.; Alard, O. Platinum-group element abundances in the upper mantle: New constraints from in situ and whole-rock analyses of Massif Central xenoliths (France). Geochim. Cosmochim. Acta 2001, 65, 2789–2806. [Google Scholar] [CrossRef]
  55. Locmelis, M.; Melcher, F.; Oberthür, T. Platinum-group element distribution in the oxidized Main Sulfide Zone, Great Dyke, Zimbabwe. Mineralium Deposita 2010, 45, 93–109. [Google Scholar] [CrossRef]
  56. Lorand, J.P. Are spinel Iherzolite xenoliths representative of the abundance of sulfur in the upper mantle? Geochim. Cosmochim. Acta 1990, 54, 1487–1492. [Google Scholar] [CrossRef]
  57. Oberthür, T. The Fate of Platinum-Group Minerals in the Exogenic Environment-From Sulfide Ores via Oxidized Ores into Placers: Case Studies Bushveld Complex, South Africa, and Great Dyke, Zimbabwe. Minerals 2018, 8, 581. [Google Scholar] [CrossRef]
  58. Oberthür, T.; Melcher, F. Behaviour of PGE and PGM in the supergene environment: A case study of persistence and redistribution in the Main Sulfide Zone of The Great Dyke, Zimbabwe. In Exploration for Platinum-Group Element Deposits; Mungall, J.E., Ed.; Short Course Series Volume 35; Mineralogical Association of Canada: Ottawa, ON, Canada, 2005; pp. 97–111. [Google Scholar]
  59. Suarez, S.; Prichard, H.M.; Velasco, F.; Fisher, P.C.; McDonald, I. Alteration of platinum-group minerals and dispersion of platinum-group elements during progressive weathering of the Aguablanca Ni-Cu deposit, SW Spain. Mineralium Deposita 2010, 45, 331–350. [Google Scholar] [CrossRef]
  60. Traoré, D.; Beauvais, A.; Auge, T.; Chabaux, F.; Parisot, J.C.; Cathelineau, M.; Peiffert, C.; Colin, F. Platinum and palladium mobility in supergene environment: The residual origin of the Pirogues River mineralization, New Caledonia. J. Geochem. Explor. 2006, 88, 350–354. [Google Scholar] [CrossRef]
  61. Frei, M. Composition, Formation and Leaching Behaviour of Supergene, Polymetallic Ores from the Sanyati Deposit (Zimbabwe); Schweizerbart Science Publishers: Stuttgart, Germany, 2011; ISBN 978-3-510-95992-1. [Google Scholar]
  62. Cabri, L.J. New Data on Phase Relations in Cu-Fe-S System. Econ. Geol. 1973, 68, 443–454. [Google Scholar] [CrossRef]
  63. Etschmann, B.; Pring, A.; Putnis, A.; Grguric, B.A.; Studer, A. A kinetic study of the exsolution of pentlandite (Ni,Fe)(9)S8 from the monosulfide solid solution (Fe,Ni)S. Am. Mineral. 2004, 89, 39–50. [Google Scholar] [CrossRef]
  64. Alard, O.; Griffin, W.L.; Lorand, J.P.; Jackson, S.E.; O’Reilly, S.Y. Non-chondritic distribution of the highly siderophile elements in mantle sulphides. Nature 2000, 407, 891–894. [Google Scholar] [CrossRef] [PubMed] [Green Version]
  65. O’Driscoll, B.; Gonzalez-Jimenez, J.M. Petrogenesis of the Platinum-Group Minerals. Rev. Mineral. Geochem. 2016, 81, 489–578. [Google Scholar] [CrossRef]
  66. Wittig, N.; Webb, M.; Pearson, D.G.; Dale, C.W.; Ottley, C.J.; Hutchison, M.; Jensen, S.M.; Luguet, A. Formation of the North Atlantic Craton: Timing and mechanisms constrained from Re–Os isotope and PGE data of peridotite xenoliths from S.W. Greenland. Chem. Geol. 2010, 276, 166–187. [Google Scholar] [CrossRef]
  67. Shaw, D.M. Trace element fractionation during anatexis. Geochim. Cosmochim. Acta 1970, 34, 237–243. [Google Scholar] [CrossRef]
  68. Johnson, K.T.M.; Dick, H.J.B.; Shimizu, N. Melting in the oceanic upper mantle: An ion microprobe study of diopsides in abyssal peridotites. J. Geophys. Res. Solid Earth 1990, 95, 2661–2678. [Google Scholar] [CrossRef]
  69. Pearson, N.J.; Alard, O.; Griffin, W.L.; Jackson, S.E.; O’Reilly, S.Y. In situ measurement of Re-Os isotopes in mantle sulfides by laser ablation multicollector-inductively coupled plasma mass spectrometry: Analytical methods and preliminary results. Geochim. Cosmochim. Acta 2002, 66, 1037–1050. [Google Scholar] [CrossRef]
  70. Griffin, W.L.; O’Reilly, S.Y.; Ryan, C.G. The composition and origin of sub-continental lithospheric mantle. In Mantle Petrology: Field Observations and High Pressure Experimentation: A Tribute to Francis R. (Joe) Boyd; Fei, Y., Bertka, C.M., Mysen, B.O., Eds.; Geochemical Society: Houston, TX, USA, 1999; pp. 13–45. [Google Scholar]
  71. Zindler, A.; Jagoutz, E. Mantle Cryptology. Geochim. Cosmochim. Acta 1988, 52, 319–333. [Google Scholar] [CrossRef]
  72. Bodinier, J.L.; Menzies, M.A.; Shimizu, N.; Frey, F.A.; McPherson, E. Silicate, hydrous and carbonate metasomatism at Lherz, France: Contemporaneous derivatives of silicate melt-harzburgite reaction. J. Petrol. 2004, 45, 299–320. [Google Scholar] [CrossRef]
  73. Gregoire, M.; Bell, D.R.; Le Roex, A.P. Trace element geochemistry of phlogopite-rich mafic mantle xenoliths: Their classification and their relationship to phlogopite-bearing peridotites and kimberlites revisited. Contrib. Mineral. Petrolol. 2002, 142, 603–625. [Google Scholar] [CrossRef]
  74. Menzies, M.; Hawkesworth, C. Mantle Metasomatism; Academic Press Inc.: Orlando, FL, USA, 1986. [Google Scholar]
  75. Downes, H. Formation and modification of the shallow sub-continental lithospheric mantle: A review of geochemical evidence from ultramafic xenolith suites and tectonically emplaced ultramafic massifs of western and central Europe. J. Petrol. 2001, 42, 233–250. [Google Scholar] [CrossRef]
  76. Irvine, G.J.; Pearson, D.G.; Kjarsgaard, B.; Carlson, R.; Kopylova, M.; Dreibus, G. A Re–Os isotope and PGE study of kimberlite-derived peridotite xenoliths from Somerset Island and a comparison to the Slave and Kaapvaal cratons. Lithos 2003, 71, 461–488. [Google Scholar] [CrossRef]
  77. Wang, K.L.; O’Reilly, S.Y.; Griffin, W.L.; Pearson, N.J.; Zhang, M. Sulfides in mantle peridotites from Penghu Islands, Taiwan: Melt percolation, PGE fractionation, and the lithospheric evolution of the South China block. Geochim. Cosmochim. Acta 2009, 73, 4531–4557. [Google Scholar] [CrossRef]
  78. Reisberg, L.; Meisel, T. The Re-Os isotopic system: A review of analytical techniques. Geostand. Newsl. 2002, 26, 249–267. [Google Scholar] [CrossRef]
  79. Pearson, D.G.; Canil, D.; Shirey, S.B. Mantle Samples Included in Volcanic Rocks: Xenoliths and Diamonds. In Treatise on Geochemistry; Holland, H.D., Turekian, K.K., Eds.; Pergamon: Oxford, UK, 2003; pp. 171–275. ISBN 978-0-08-043751-4. [Google Scholar]
  80. Droop, G.T.R. A general equation for estimating Fe3+ concentrations in ferromagnesian silicates and oxides from microprobe analyses, using stoichiometric criteria. Miner. Mag. 1987, 51, 431–435. [Google Scholar] [CrossRef]
Figure 1. Overview of textural features of Middle Atlas sulfides and hydroxides. (a) Back scatter electron (BSE) image of a droplet-shaped monosulfide sulfide solution (mss), which is enclosed in orthopyroxene (Atl-3A). Note the two sulfide melt trails traversing this grain and the fine, slightly lighter-colored exsolution blades of Ni-rich mss, which are also visible in the elemental mapping of this grain provided in Figure S2a. (b) BSE image of a euhedral mss with a hexagonal cross-section and darker-colored comparatively Cu-enriched exsolution lamellae (cf. Figure S2b), enclosed in olivine (Atl-3A). (c) BSE image of an interstitial mss exhibiting a strong alteration to Fe-hydroxide (Atl-3E). Laser ablation inductively coupled plasma mass spectrometry (LA-ICP-MS) spots are 25 µm in diameter. (d) BSE image of altered interstitial sulfide, consisting of mss and pentlandite, associated with a secondary melt pocket (Atl-3C). (e) BSE image of mss in silicate glass of a secondary melt pocket (Atl-3V). (f) Micrograph of interstitial mss with reddish-brown comparatively Cu-enriched exsolution lamellae, enclosed by dark grey and bluish-grey Fe-hydroxide phases (Atl-3T). An elemental mapping of this grain is provided in Figure S1.
Minerals 09 00276 g001
Figure 2. Composition of mss from Middle Atlas mantle xenoliths shown in the ternary system Fe-Ni-S at 600 °C [38]. Pentlandite is abbreviated to pn.
Minerals 09 00276 g002
Figure 3. In metal/sulfur ratio (M/S)-[Pd/Ir]N space, the Middle Atlas mss do not show discernible correlation with textural occurrence (type e (enclosed), type i (interstitial), and type m (melt pocket)).
Minerals 09 00276 g003
Figure 4. The abundances of Ir (a), Ru (b), Rh (c), Pt (d), Pd (e), and Re (f) in mss and pentlandites plotted against Os. IPGEs (Os, Ir, Ru) are well correlated along a 1:1 line, while Rh abundances are higher relative to Os. Pt and Pd are less well correlated with Os. Rhenium and Os do not display a systematic trend. PGE patterns are grouped as residual for [Pd/Ir]N < 1 and secondary for [Pd/Ir]N > 1. Residual PGE patterns are further subdivided on the basis of their [Pt/Pd]N ratios (group 1: PtN > PdN; group 2: PtN < PdN). Subgroups of secondary PGE patterns are group 3 (unfractionated PGE pattern), group 4 (melt-like PGE pattern), and Group 5 (incomplete PGE inventory). Also see text for more details on the groupings.
Minerals 09 00276 g004
Figure 5. Chondrite-normalized [40] PGE patterns of mss and pentlandites from Middle Atlas xenoliths. Panels (a) and (b) show mss with residual PGE signatures ([Pd/Ir]N < 1), with the distinction of slight Pd enrichment for (b). For comparison, panel (e) shows hydroxides associated with group 2 mss of panel (b). Panel (c) shows mss with unfractionated PGE patterns. Mss and pentlandite with melt-like PGE signatures are displayed in (d). Panel (f) shows mss and pentlandites with an incomplete PGE inventory. Letters e, i, and m indicate the textural occurrence of the sulfides as enclosed, interstitial, and associated with melt pockets.
Minerals 09 00276 g005
Figure 6. Chondrite-normalized [40] siderophile/chalcophile element systematics determined in residual mss, Panels (a) and (b); secondary mss, Panels (c) and (d); mss with an incomplete PGE inventory (f), Fe-hydroxides (e), and pentlandites and the mss–iss intergrowth (g). The dashed line separates PGE systematics from those of the other (trace) elements. Host xenoliths are indicated by symbols.
Minerals 09 00276 g006aMinerals 09 00276 g006b
Figure 7. Comparison of total PGE abundances and total concentrations of trace elements incompatible in mss (i.e., Zn, Ag, Pb, As, Sb, Sn, Se, Te, Cd, and Au; Liu and Brenan [41]; Helmy et al. [45]). The broken line roughly delimits the characteristics of sulfides with primary and secondary PGE patterns. Residual mss generally have higher PGE abundances than secondary sulfides (Groups 3, 4, and 5). Secondary sulfides typically are comparatively enriched in incompatible trace elements. Data are from mss unless otherwise stated. Pentlandite is abbreviated as pn.
Minerals 09 00276 g007
Figure 8. Relationship of [Pd/Ir]N in sulfides (mss: open circle; pentlandite: filled rhombs) and whole-rock [Pd/Ir]N-Al2O3 in their host xenoliths (black squares; Wittig et al. [20]), highlighting that refractory peridotites with low bulk Al2O3 contents (Atl-3I, -3L, -3U, -3F) do not comprise a substantial sulfide population. In xenoliths Atl-3A and -3K, the investigated sulfides do not seem to represent the whole-rock PGE systematics, while with increasing bulk Al2O3 content (>2.5 wt %), sulfides become more representative of the whole-rock PGE systematics (Atl-3C, -3E, -3V). In addition, the range of [Pd/Ir]N of the sulfides systematically increases from infertile to fertile xenoliths (dashed gray field). Sulfide and whole-rock [Pd/Ir]N are correlated with whole-rock Al2O3 content, confirming the conclusion of Wittig et al. [20] that the Middle Atlas subcontinental lithospheric mantle (SCLM) probably experienced coupled introduction of sulfides and Al-bearing phases (i.e., clinopyroxene, amphibole; see above). Sample Atl-3T exceeds the primitive mantle (PRIMA) Al2O3 content, while its range in sulfide [Pd/Ir]N is more comparable to Atl-3E, suggesting that lithophile elements in this sample experienced more vigorous metasomatic enrichment relative to other xenoliths, which is consistent with its clinopyroxene modal abundances and trace element and isotope data [20,30]. Also shown are two PGE-Al2O3 melting models [20,24,66], which are based on a PRIMA S content of 250 ppm [40] and rely on sulfide mineralogy and fractional melting equations [67]. These models differ in the presumed Pt/PdKD, which was set to 0.4 and 0.7 (see Figure 9).
Minerals 09 00276 g008
Figure 9. Relationship of [Pt/Pd]N-[Pd/Ir]N with residual mss (group 1, open circles; Group 2, black circles), melt-like mss (Group 4, open diamonds), and mss with unfractionated PGE patterns (Group 3, grey squares) relative to refractory peridotite and melt trends, shown in 5% increments (unless otherwise stated). The Group 1 and 2 mss record >20% melt extraction. For clarity, average data of individual mss are shown. Experimentally derived residual and melt-like mss are also shown [39], they appear to suggest a Pt/PdKD of ca. 1. However, Group 1 and 2 mss from the Middle Atlas do not correspond with this Pt and Pd partitioning, but would have if Pt/PdKD is ca. 0.4 and 0.7, respectively. Whole-rock systematics of the Middle Atlas xenoliths [20] are indicated as black squares.
Minerals 09 00276 g009
Table 1. Modal abundances of Middle Atlas xenolith silicates and sulfides (in %) and whole-rock Al2O3 content (in wt %). Silicate modal abundances and Al2O3 content are from Wittig et al. [20]. Sulfide modes are taken from petrographic observation. Note that samples Atl-3F, 3L, and 3U were excluded from further use in this study, since no in situ trace element analyses were possible.
SampleOlivineOrthopyroxene ClinopyroxeneSpinel SulfideAl2O3 (wt %)
Atl-3A7014160.20.0052.18
Atl-3B781380.20.0051.98
Atl-3C6720120.30.0062.69
Atl-3E6518160.40.022.92
Atl-3F7214130.20.00011.99
Atl-3I90730.10.0020.72
Atl-3K6821110.30.0042.36
Atl-3L752040.1-1.44
Atl-3T5720230.580.0094.88
Atl-3U771670.40.00011.87
Atl-3V6421140.50.0043.11
Table 2. Representative electron microprobe (EMP) analyses of mss from Middle Atlas xenoliths. Iron, Ni, Cu, and S contents are given in wt %. Textural occurrence is indicated as e (enclosed), i (interstitial), and m (melt pocket). Exsolution phenomena and associations with pentlandite (pn) are indicated with “x” when abundant. M/S indicates the metal/sulfur ratio. Both M/S and Ni/(Ni + Fe) ratios were calculated for atomic proportions.
EMP Analysis #TypeCu-Rich Lamellaemss LamellaeAssociated with pnFeNiCuSTotalFe/SFe/NiFe/CuNi/(Ni + Fe)atM/Sat
3a-4-15ex--45.0416.880.4137.88100.211.192.67109.690.260.93
3a-15-47i---33.0329.160.1138.39100.690.861.13301.820.460.91
3a-18-52m---48.0514.44-37.84100.391.273.33-0.220.94
atl-3b-10e---44.0017.45-37.9999.481.162.52-0.270.92
3b-13-103i--x59.822.08-39.38101.371.5228.76-0.030.90
3c-2-4m---40.8821.17-38.06100.111.071.93-0.330.92
3c-8-19i-x-45.4216.860.1137.61100.001.212.69403.250.260.94
3c-10-21e---47.8514.77-37.42100.101.283.24-0.230.95
3e-1-71i---31.3129.30-38.0498.650.821.07-0.470.89
3e-6-85e---42.9719.35-38.02100.381.132.22-0.300.93
3k-5-35e-x-40.3424.04-35.2899.721.141.68-0.361.03
3k-9-45i-x-43.3318.68-37.99100.031.142.32-0.290.92
3k-17-49m-x-41.6319.24-38.9999.861.072.16-0.310.88
3t-4-61ix--48.8712.920.1038.14100.031.283.78477.950.200.92
3t-11-77mx--38.4422.230.3538.6499.650.991.73111.390.350.89
3t-13-79e---34.7326.420.2138.78100.130.901.31169.180.420.89
3v-1-38i---39.4321.35-39.81100.580.991.85-0.340.86
3v-1-40m---48.6812.310.7538.47100.221.273.9664.560.190.91
3v-3-43ex--36.8019.855.8836.6899.211.001.856.260.340.95
Table 3. LA-ICP-MS abundance data of sulfides and hydroxides from Middle Atlas mantle xenoliths. All abundances are given in parts per million (ppm) except for S (wt %). ICP-MS analysis # denotes the xenolith (capital letter) and sulfide number (first digit), whereas the following digit indicates the number of measurements performed on individual grains. Elemental ratios are normalized to chondrite [40]. Textural occurrence is indicated as e (enclosed), i (interstitial), and m (melt pocket). For the enclosed sulfides, the host silicate is also provided. The platinum-group element (PGE) patterns are 1 (residual PGE pattern, PtN > PdN), 2 (residual PGE pattern, PtN < PdN), 3 (unfractionated PGE pattern), 4 (melt-like PGE pattern), and 5 (incomplete PGE inventory). Abbreviations for phase names are ol (olivine), opx (orthopyroxene), cpx (clinopyroxene), hy (hydroxide phase), and pn (pentlandite).
ICP-MS Analysis #TypeHostGroupPhaseS (wt %)NiCoCuZnMoCdOsIrRuRh
A 4-1eol1mss37.91132,7871432741111.820.11.1623.719.241.75.23
A 4-2eol1mss37.88138,48814753806-4.67-23.517.643.85.56
A 6i-1mss37.83126,278157181958.921.020.774.873.6511.71.67
B 11eol1mss38.14148,896141431710.932.1-4.583.168.851.32
C 9-3m-1mss37.18156,8041562994-4.94-10.27.2715.82.15
C 9-4m-1mss37.18148,76315231036-5.55-10.16.217.62.19
C 9ai-1mss-184,31116801131-12.5-12.911.729.23.52
K 12-2m-1mss36.71152,74111703476-0.819-5.74.7712.91.76
V 10-1ecpx1mss38.39131,9701838193372.342.8-5974481406211
E 5-2i-2mss38.24116,1851719514926.11.6-12.611.921.72.99
E 5-3i-2mss38.00111,3501723316323.41.190.88412.411.619.53
E 5-4i-2mss38.00113,874177611,51127.51.080.81814.612.921.93.01
E 5-5i-2mss38.00102,4121837327220.50.7710.75211.810.718.42.36
E 5-6i-2mss38.24121,2581765568125.21.721.0613.812.822.22.86
E 14-1i-2mss38.10120,0041926500816.74.030.9692.341.046.350.326
E 14-2i-2mss38.10113,3261795775921.71.250.6321.420.9744.970.376
E 14-3i-2mss38.10111,8281789789125.96.730.5461.981.065.993.87
E 14-4i-2mss37.80121,6961978567323.81.62-1.811.116.680.411
K 9-1i-2mss37.99173,18513971643-1.161.364.412.858.760.958
K 9-2i-2mss37.99207,50715456837-5.671.816.45.6713.11.8
T 3-1i-2mss38.01110,122159111,38212.729.20.995.894.169.351.96
T 3-2i-2mss38.01112,494162912,07413.1360.9887.275.3911.91.93
T 3-3i-2mss38.01108,393162710,96618.431-6.014.918.821.86
T 3-7i-2mss38.01125,8981856311131.92661.199.415.8616.11.98
T 4-1m-2mss38.14110,765168810,77315.312.11.1412.49.2924.22.9
T 4-2m-2mss38.14120,113173766878.34210.61111.89.17243.3
T 4-4m-2mss-130,4521900398915.336.61.6113.510.424.13.62
T7-3m-2mss38.00111,383183769447.134.05-23.317.252.46.92
E5-7i-2hy0.26299114.383.11.750.075-0.3730.7811.240.198
E5-8i-2hy0.44280812.846.10.6160.052-0.340.5380.8410.115
T3-4i-2hy0.2926,25194.361310.912.60.1162.472.394.410.689
T3-5i-2hy0.3046,56437393719.419.40.2190.7293.677.920.986
T3-6i-2hy3.1010,40253.93686.8738.30.1141.11.43.030.403
T4-3m-2hy0.2819,75863.6423123.660.2611.073.348.611.12
T4-5m-2hy0.3560,688228506718.911.4-12.98.9121.12.9
C 8a-2i-3mss38.26146,337171413,71749.855.4-0.4750.4821.80.304
E6eopx3mss38.02157,471174578111.62.12-0.3440.321.110.178
E 14-6i-3mss-192,0022671101911.155.70.5581.130.3331.690.176
E 16-2i-3mss38.67222,492147679925.4286-8.385.9211.11.95
T 2-1e-3mss38.66153,138177424559.8871.41.523.953.244.430.979
T 11-1m-3mss38.54156,006141111,022-2.660.6082.451.143.740.572
V 3-1m-3mss36.68173,35719166955-0.6950.3680.9060.3540.5310.134
V 12ecpx3mss37.66132,84218551193-3.32-5.463.75142.27
V 15-2m-3mss37.82189,7841330646-6.63-1.310.882.810.312
V 15-3m-3mss38.82197,7241378521-23.1-0.8921.093.520.358
E 16-1i-4mss38.67219,1551457421-22.5-5.945.387.021.23
T 1m-4mss38.52200,7021228102719.177.8-1.432.484.281.22
T 2-2eopx4mss38.66135,20315742372-50.31.951.711.813.650.886
T 2-3eopx4mss38.06140,35916092453-12.6-0.64312.290.622
V 3-2m-4mss36.68162,91915506388--0.9080.4570.2360.6730.229
V 15-1m-4mss37.82202,685139695410.82.6-0.2090.3381.160.288
B 14m-4pn32.28237,0461384341013.91.48-1.811.042.251.14
B 6eol5mss37.14136,753122727,88552.725.62.14---0.465
B 7eol5mss36.23116,23999452,53510222.13.01---0.864
C8b-1i-5mss38.26157,668154552,34458.826.44.010.625--0.58
C8b-2i-5mss38.26133,6011398579-11.3-----
C8b-3i-5mss38.26128,41814521193-14.6-----
E 11eol5mss38.60128,64017296236.1435.5--0.1090.2630.051
V 1m-5mss38.47125,4351611444814.40.8961.32---0.089
V 4m-5mss37.26148,483141024268.4530.81.19---0.113
V 5-1eopx5mss38.30111,71114463370-4.931.22--0.4710.084
V 5-2eopx5mss38.30134,57616463755-6.440.898-0.128-0.069
V5-3eol5mss-128,53018596665-1.410.6-0.0470.3070.063
V5-5eopx5mss37.55131,41818187605-10.9----0.053
V 13-1eol5mss38.11118,86322409146107120----0.1
B 2i-5pn32.82240,81012204719-3.622.29---0.102
B 4i-5pn33.26222,135122913,538-7.352.120.422--0.226
B 5i-5pn32.89229,77312239954-4.084.06--0.4590.223
I 3-1eol5mss + iss-188,046146131,27810117.75.8---0.573
ICP-MS #PtPdReAuAgPbAsSbSnSeTeNi/(Ni + Fe)atM/Sat[Pd/Ir]N[Pt/Pd]N
A 4-119.510.50.3090.4170.4693.649.57-0.95241.94.160.260.940.451.01
A 4-220.510.60.2530.4330.0823.639.65--405.580.260.930.501.05
A 62.551.260.2260.3510.1231.038.57--47.42.10.230.930.291.10
B 113.891.60.244-0.2347.937.470.747-36.27.950.280.90.421.32
C 9-33.70.6140.3130.4550.6053.07---64.5-0.260.960.073.28
C 9-45.832.090.3611.77.662.24---59.2-0.260.960.281.52
C 9a2.7400.245-3.114.2---79.8-----
K 12-211.83.38-0.561-12.8---43.16.340.370.990.591.90
V 10-111336.80.222-7.331408.811.47-71.46.920.250.880.071.67
E 5-22.482.3--0.0752.176.35--35.3-0.220.920.160.59
E 5-32.53.420.2630.0730.1341.565.22--38.5-0.220.920.240.40
E 5-433.430.2360.0490.1920.5214.29--36.9-0.220.920.220.48
E 5-52.822.930.133-0.1210.8447.36--21.9-0.220.920.230.52
E 5-62.572.780.214--0.6324.47--421.620.220.920.180.50
E 14-10.3220.4610.366--3.547.88-0.90326.8-0.220.930.370.38
E 14-20.5350.4680.321-0.061.336.63--35.3-0.220.930.400.62
E 14-30.5150.5250.189-0.2530.8385.17--40.51.370.220.930.410.53
E 14-40.4580.3810.2570.051-0.6255.54--32.9-0.20.930.280.65
K 9-14.483.220.2850.7220.2693.912.1-1.4868.5-0.370.990.930.76
K 9-29.778.310.5530.8236.435.6111.4--54.18.840.370.991.210.64
T 3-11.461.870.2410.0750.3690.828.04--68.63.750.220.930.370.43
T 3-21.571.360.3120.130.430.428.71--77.92.520.220.930.210.63
T 3-31.741.660.4160.1670.2880.2885.69-0.87262.92.330.220.930.280.57
T 3-71.482.280.353--0.68327.90.254-70.7-0.220.930.320.35
T 4-14.314.140.2570.286-0.5489.11-0.89468.53.230.20.920.370.57
T 4-24.565.050.1370.3460.1940.9725.03--72.3-0.20.920.460.49
T 4-42.213.180.40.1610.2285.415.510.17-68.5---0.250.38
T7-35.545.760.3750.060.0950.3547.25--68.4-0.190.920.280.52
E5-70.1510.082---0.3020.234--0.793---0.091.00
E5-80.0960.115---0.181---0.791---0.180.45
T3-40.7370.6510.013-0.0680.8051.02--11.70.537--0.230.62
T3-51.020.786-0.0620.0431.153--13.10.453--0.180.71
T3-60.3290.282--0.0540.4412.07--1.87---0.170.64
T4-31.411.190.0120.0790.0241.161.02--10.10.4--0.290.65
T4-52.431.68-0.1750.0480.265-0.08-38.80.757--0.160.79
C 8a-20.8230.9860.3490.7435.9915.26.06--54.95.460.250.921.690.45
E60.8920.553-0.105-3.3710.5-1.1925.3-0.30.931.430.88
E 14-61.931.760.207-0.15410.26.28-0.91152.23.64--4.370.60
E 16-218140.1720.891-71.566.40.467-67.77.280.420.91.960.70
T 2-185.990.251.150.77831.29.060.884-77.16.510.270.91.530.73
T 11-13.914.610.0640.703-0.6979.25--64.6-0.350.893.350.46
V 3-11.762.38-0.9110.2882.3411.3--49.30.8860.340.955.560.40
V 1211.215.90.340.0790.5123.2313.2-0.58656.26.370.260.933.510.38
V 15-21.951.77-0.4745.071.3212.6--51.12.740.370.921.660.60
V 15-32.051.35-0.3280.2722.937.33--42.2-0.370.921.020.83
E 16-116.712.90.1960.217-25.729.60.314-56.415.90.420.91.980.70
T 18.2612.6-0.1881.2429.9130.406-1296.020.410.94.200.36
T 2-25.584.640.270.4680.2046.0410.4--75.4-0.260.922.120.65
T 2-35.475.070.2960.1870.071.7910.9--83.92.650.260.924.190.59
V 3-21.922.57-0.730.0882.639.87--54.2-0.340.959.010.41
V 15-11.442.84-0.440.5412.797.94--30.4-0.370.926.950.28
B 145.5310.5--7.8524.19.971.36-12933.10.461.168.350.29
B 66.136.220.2961.194.977.7712.6--57.810.10.230.93-0.54
B 74.716.660.2041.275.959.9611--61.77.110.230.93-0.39
C8b-10.2760.5730.2580.80711.19.53---64.4100.260.94-0.26
C8b-20.35600.3240.8040.442.66---65.34.510.260.94--
C8b-3000.2410.7110.26.8810.9--59.78.820.260.94--
E 111.72.05---26.210.7--56.64.520.240.915.560.45
V 114.81-0.1840.2641.245.89--56.3-0.190.91-0.11
V 40.6291.98-0.3033.6330.911.9-1.4897.15.940.30.95-0.17
V 5-12.095.20.386-1.042.6311.1--71.62.450.250.91-0.22
V 5-22.274.990.3650.1590.4593.596.66--502.910.250.9232.250.25
V5-30.3391.160.2120.090.2144.79.88--522.24--20.420.16
V5-501.990.234-0.2292.655.31--57.21.460.250.94--
V 13-10.2230.9390.1190.111.4610.222.30.550.81950.41.760.20.91-0.13
B 22.719.81-0.1579.911820.41.07-10420.10.451.14-0.15
B 42.99.020.5-13.415.7-0.895-10221.20.391.13-0.18
B 52.3110.2--12.129.118.60.889-65.3180.451.15-0.12
I 3-1016.60.2261.82105119624.15.119.019.9713.5----
Table 4. Representative EMP analyses of Fe-hydroxides.
EMP #3a-1-33a-2-73e-5-43k-13-103t-8-773t-11-813b-5a-703k-9-30
SiO224.8022.7410.566.8315.3925.470.201.35
Al2O33.000.360.082.745.663.480.060.82
Cr2O3-0.130.10-----
Fe2O348.2663.2258.0739.1166.5117.5086.7477.40
MgO0.390.13-0.951.534.74--
CaO4.284.211.450.861.590.820.070.11
NiO6.251.4715.9225.751.9932.275.582.27
CuO0.140.110.243.090.431.64--
S--0.340.200.18-0.130.23
Cl--0.110.300.150.250.760.47
Total87.1292.3786.8779.8393.4386.1793.5482.65

