Threshold Value Determination Using Machine Learning Algorithms for Ba Interference with Eu in Coal and Coal Combustion Products by ICP-MS


Abstract
:1. Introduction
2. Proposed Machine Learning Models for Prediction of Ba Interference with Eu
2.1. Linear Regression Model for Prediction of Ba Interference with Eu
2.1.1. Linear Regression Model
2.1.2. Ba-Eu Interference Prediction Error
2.1.3. Machine Learning Process for Ba-Eu Interference Prediction
2.2. Regression Tree Model for Prediction of Ba Interference with Eu
Regression Tree Model
2.3. Model Tree
2.4. Machine Learning Process for Ba-Eu Interference Prediction
3. Results and Performance Evaluation
3.1. Simulation Setup
3.2. Model Tree for Prediction of Ba Interference with Eu
3.3. Results
3.4. Performance Evaluation
4. Conclusions
Author Contributions
Funding
Acknowledgments
Conflicts of Interest
References
- Barakos, G.; Mischo, H.; Gutzmer, J. An outlook on the rare earth elements mining industry. 2016. Available online: https://www.ausimmbulletin.com/feature/an-outlook-on-the-rare-earth-elements-mining-industry/ (accessed on 1 November 2018).
- Hower, J.C.; Granite, E.J.; Mayfield, D.B.; Lewis, A.S.; Finkelman, R.B. Notes on contributions to the science of rare earth element enrichment in coal and coal combustion by-products. Minerals 2016, 6, 32. [Google Scholar] [CrossRef]
- Seredin, V.V.; Dai, S. Coal deposits as potential alternative sources for lanthanides and yttrium. Int. J. Coal Geol. 2012, 94, 67–93. [Google Scholar] [CrossRef]
- Dai, S.; Graham, I.T.; Ward, C.R. A review of anomalous rare earth elements and yttrium in coal. Int. J. Coal Geol. 2016, 159, 82–95. [Google Scholar] [CrossRef]
- Dai, S.; Ward, C.R.; Graham, I.T.; French, D.; Hower, J.C.; Zhao, L.; Wang, X. Altered volcanic ashes in coal and coal-bearing sequences: A review of their nature and significance. Earth Sci. Rev. 2017, 175, 44–74. [Google Scholar] [CrossRef]
- Dai, S.; Yan, X.; Ward, C.R.; Hower, J.C.; Zhao, L.; Wang, X.; Zhao, L.; Ren, D.; Finkelman, R.B. Valuable elements in Chinese coals: A review. Int. Geol. Rev. 2018, 60, 590–620. [Google Scholar]
- Dai, S.; Finkelman, R.B. Coal as a promising source of critical elements: Progress and future prospects. Int. J. Coal Geol. 2018, 186, 155–164. [Google Scholar] [CrossRef]
- Seredin, V.V. REE-bearing coals from Russian Far East deposits. Int. J. Coal Geol. 1996, 30, 101–129. [Google Scholar] [CrossRef]
- Hower, J.C.; Ruppert, L.F.; Eble, C.F. Lanthanide, yttrium, and zirconium anomalies in the fire clay coal bed, Eastern Kentucky. Int. J. Coal Geol. 1999, 39, 141–153. [Google Scholar] [CrossRef]
- Hower, J.C.; Eble, C.F.; Dai, S.; Belkin, H.E. Distribution of rare earth elements in eastern Kentucky coals: Indicators of multiple modes of enrichment? Int. J. Coal Geol. 2016, 160–161, 73–81. [Google Scholar] [CrossRef]
- Hower, J.C.; Dai, S. Petrology and chemistry of sized Pennsylvania anthracite, with emphasis on the distribution of rare earth elements. Fuel 2016, 185, 305–315. [Google Scholar] [CrossRef]
- Lin, R.; Soong, Y.; Granite, E.J. Evaluation of trace elements in U.S. coals using the USGS COALQUAL database version 3.0. Part I: Rare earth elements and yttrium (REY). Int. J Coal Geol. 2018, 192, 1–13. [Google Scholar] [CrossRef]
- Taggart, R.K.; Hower, J.C.; Dwyer, G.S.; Hsu-Kim, H. Trends in the rare earth element content of U.S.-based coal combustion fly ashes. Environ. Sci. Technol. 2016, 50, 5919–5926. [Google Scholar] [CrossRef]
- Kolker, A.; Scott, C.; Hower, J.C.; Vazquez, J.A.; Lopano, C.L.; Dai, S. Distribution of rare earth elements in coal combustion fly ash, determined by SHRIMP-RG ion microprobe. Int. J. Coal Geol. 2017, 184, 1–10. [Google Scholar] [CrossRef]
- Laudal, D.A.; Benson, S.A.; Addleman, R.S.; Palo, D. Leaching behavior of rare earth elements in Fort Union lignite coals of North America. Int. J Coal Geol. 2018, 191, 112–124. [Google Scholar] [CrossRef]
- Zhang, W.; Honaker, R.Q. Rare earth elements recovery using staged precipitation from a leachate generated from coarse coal refuse. Int. J Coal Geol. 2018, 195, 189–199. [Google Scholar] [CrossRef]
- Vito, I.E.D.; Olsina, R.A.; Masi, A.N. Enrichment method for trace amounts of rare earth elements using chemofiltration and XRF determination. Fresen. J. Anal. Chem. 2000, 368, 392–396. [Google Scholar] [CrossRef]
- Smoliński, A.; Stempin, M.; Howaniec, N. Determination of rare earth elements in combustion ashes from selected Polish coal mines by wavelength dispersive X-ray fluorescence spectrometry. Spectrochim. Acta B 2016, 116, 63–74. [Google Scholar] [CrossRef]
- Ohde, S. Determination of rare earth elements in carbonatites from the kangankunde mine, Malawi by instrumental neutron activation analysis. J. Radioanal. Nucl. Chem. 2003, 257, 433–435. [Google Scholar] [CrossRef]
- Kumar, K.; Saion, E.; Halimah, M.K.; Yap, C.K.; Hamzah, M.S. Rare earth element (REE) in surface mangrove sediment by instrumental neutron activation analysis. J. Radioanal. Nucl. Chem. 2014, 301, 667–676. [Google Scholar] [CrossRef]
- El-Taher, A. Rare earth elements content in geological samples from the Eastern Desert, Egypt, determined by instrumental neutron activation analysis. Appl. Radiat. Isot. 2010, 68, 1859–1863. [Google Scholar] [CrossRef]
- Cook, N.J.; Ciobanu, C.L.; O’Rielly, D.; Wilson, R.; Das, K.; Wade, B. Mineral chemistry of rare earth element (REE) mineralization, Browns Ranges, Western Australia. Lithos 2013, 172–173, 192–213. [Google Scholar] [CrossRef]
- Thompson, R.L.; Bank, T.; Roth, E.; Granite, E. Resolution of rare earth element interferences in fossil energy by-product samples using sector-field ICP-MS. Fuel 2016, 185, 94–101. [Google Scholar] [CrossRef]
- Gaft, M.; Dvir, E.; Modiano, H.; Schone, U. Laser induced breakdown spectroscopy machine for online ash analyses in coal. Spectrochim Acta B 2008, 63, 1177–1182. [Google Scholar] [CrossRef]
- Stankova, A.; Gilon, N.; Dutruch, L.; Kanicky, V. A simple LIBS method for fast quantitative analysis of fly ashes. Fuel 2010, 89, 3468–3874. [Google Scholar] [CrossRef]
- Haider, A.F.M.Y.; Rony, M.A.; Lubna, R.S.; Abedin, K.M. Detection of multiple elements in coal samples from Bangladesh by laser-induced breakdown spectroscopy. Opt. Laser Technol. 2011, 43, 1405–1410. [Google Scholar] [CrossRef]
- Yan, X.; Dai, S.; Graham, I.T.; He, X.; Shan, K.; Liu, X. Determination of Eu concentrations in coal, fly ash and sedimentary rocks using a cation exchange resin and inductively coupled plasma mass spectrometry (ICP-MS). Int. J. Coal Geol. 2018, 191, 152–156. [Google Scholar] [CrossRef]
- Zhang, Y.; Jiang, Z.; He, M.; Hu, B. Determination of trace rare earth elements in coal fly ash and atmospheric particulates by electrothermal vaporization inductively coupled plasma mass spectrometry with slurry sampling. Environ. Pollut. 2007, 148, 459–467. [Google Scholar] [CrossRef]
- Ardini, F.; Soggia, F.; Rugi, F.; Udisti, R.; Grotti, M. Comparison of inductively coupled plasma spectrometry techniques for the direct determination of rare earth elements in digests from geological samples. Anal. Chim. Acta 2010, 678, 18–25. [Google Scholar] [CrossRef]
- Gray, A.L.; Williams, J.G. Oxide and doubly charged ion response of a commercial inductively coupled plasma mass spectrometry instrument. J. Anal. At. Spectrom. 1987, 2, 51–82. [Google Scholar] [CrossRef]
- Jarvis, K.E.; Gray, A.L.; McCurdy, E. Avoidance of spectral interference on europium in inductively coupled plasma mass spectrometry by sensitive measurement of the doubly charged ion. J. Anal. At. Spectrom. 1989, 4, 743–747. [Google Scholar] [CrossRef]
- Raut, N.M.; Huang, L.S.; Aggarwal, S.K.; Lin, K.C. Determination of lanthanides in rock samples by inductively coupled plasma mass spectrometry using thorium as oxide and hydroxide correction standard. Spectrochim. Acta B 2003, 58, 809–822. [Google Scholar] [CrossRef]
- Raut, N.M.; Huang, L.S.; Lin, K.C.; Aggarwal, S.K. Uncertainty propagation through correction methodology for the determination of rare earth elements by quadrupole based inductively coupled plasma mass spectrometry. Anal. Chim. Acta 2005, 530, 91–103. [Google Scholar] [CrossRef]
- Zawisza, B.; Pytlakowska, K.; Feist, B.; Polowniak, M.; Kita, A.; Sitko, R. Determination of rare earth elements by spectroscopic techniques: A review. J. Anal. Atom. Spectrom. 2011, 26, 2373–2390. [Google Scholar] [CrossRef]
- Loges, A.; Wagner, T.; Barth, M.; Bau, M.; Göb, S.; Markl, G. Negative Ce anomalies in Mn oxides: The role of Ce4+ mobility during water-mineral interaction. Geochim. Cosmochim. Acta. 2012, 86, 296–317. [Google Scholar] [CrossRef]
- Ketris, M.P.; Yudovich, Y.E. Estimations of Clarkes for Carbonaceous biolithes: World average for trace element contents in black shales and coals. Int. J. Coal Geol. 2009, 78, 135–148. [Google Scholar] [CrossRef]
- Palmer, C.A.; Oman, C.L.; Park, A.J.; Luppens, J.A. The U.S. Geological Survey Coal Quality (COALQUAL) Database Version 3.0. Data Series; The U.S. Geological Survey: Reston, VA, USA, 2015; p. 57.
- Finkelman, R.B.; Palmer, C.A.; Wang, P. Quantification of the modes of occurrence of 42 elements in coal. Int. J. Coal Geol. 2018, 185, 138–160. [Google Scholar] [CrossRef]
- Dai, S.F.; Ren, D.Y.; Chou, C.-L.; Li, S.S.; Jiang, Y.F. Mineralogy and geochemistry of the No. 6 Coal (Pennsylvanian) in the Junger Coalfield, Ordos Basin, China. Int. J. Coal Geol. 2006, 66, 253–270. [Google Scholar] [CrossRef]
- Dai, S.F.; Wang, X.B.; Zhou, Y.P.; Hower, J.C.; Li, D.H.; Chen, W.M.; Zhu, X.W.; Zou, J.H. Chemical and mineralogical compositions of silicic, mafic, and alkali tonsteins in the Late Permian coals from the Songzao Coalfield, Chongqing, Southwest China. Chem. Geol. 2011, 282, 29–44. [Google Scholar] [CrossRef]
- Liu, J.J.; Yang, Z.; Yan, X.Y.; Ji, D.; Yang, Y.P.; Hu, L.C. Modes of occurrence of highly-elevated trace elements in superhigh-organic-sulfur coals. Fuel 2015, 156, 190–197. [Google Scholar] [CrossRef]
- Johnston, M.N.; Hower, J.C.; Dai, S.; Wang, P.; Xie, P.; Liu, J. Petrology and Geochemistry of the Harlan, Kellioka, and Darby Coals from the Louellen 7.5-Minute Quadrangle, Harlan County, Kentucky. Minerals 2015, 5, 894–918. [Google Scholar] [CrossRef]
- Dai, S.; Ren, D.; Zhou, Y.; Chou, C.-L.; Wang, X.; Zhao, L.; Zhu, X. Mineralogy and geochemistry of a superhigh-organic-sulfur coal, Yanshan Coalfield, Yunnan, China: Evidence for a volcanic ash component and influence by submarine exhalation. Chem. Geol. 2008, 255, 182–194. [Google Scholar] [CrossRef]
- Dai, S.; Xie, P.; Jia, S.; Ward, C.R.; Hower, H.C.; Yan, X.; French, D. Enrichment of U-Re-V-Cr-Se and rare earth elements in the Late Permian coals of the Moxinpo Coalfield, Chongqing, China: Genetic implications from geochemical and mineralogical data. Ore Geol. Rev. 2017, 80, 1–17. [Google Scholar] [CrossRef]
- Hower, J.C.; Eble, C.F.; O’Keefe, J.M.K.; Dai, S.; Wang, P.; Xie, P.; Liu, J.; Ward, C.R.; French, D. Petrology, Palynology, and Geochemistry of Gray Hawk Coal (Early Pennsylvanian, Langsettian) in Eastern Kentucky, USA. Minerals 2015, 5, 592–622. [Google Scholar] [CrossRef]
- Liu, J.; Ward, C.R.; Graham, I.T.; French, D.; Dai, S.; Song, X. Modes of occurrence of non-mineral inorganic elements in lignites from the Mile Basin, Yunnan Province, China. Fuel 2018, 222, 146–155. [Google Scholar] [CrossRef]
- Chang, C.; Fu, Q.; Wang, X. Linear Correlation of Ba and Eu Contents by Hydrothermal Activities: A Case Study in the Hetang Formation, South China. Geofluids 2019. [Google Scholar] [CrossRef]
- Dulski, P. Interferences of oxide, hydroxide and chloride analyte species in the determination of rare earth elements in geological samples by inductively coupled plasma-mass spectrometry. Fresenius J. Anal. Chem. 1994, 350, 194–203. [Google Scholar] [CrossRef]
- Smirnova, E.V.; Fedorova, I.N.; Sandimirova, G.P.; Petrov, L.L.; Balbekina, N.G.; Lozhkin, V.I. Determination of rare earth elements in black shales by inductively coupled plasma mass spectrometry. Spectrochim. Acta B 2003, 58, 329–340. [Google Scholar] [CrossRef]
- Wang, J.; Chen, D.; Wang, D.; Yan, D.; Zhou, X.; Wang, Q. Petrology and geochemistry of chert on the marginal zone of Yangtze platform, western Hunan, South China, during the Ediacaran-Cambrian transition. Sedimentology 2012, 59, 809–829. [Google Scholar] [CrossRef]
- Jiang, S.Y.; Zhao, H.X.; Chen, Y.Q.; Yang, T.; Yang, J.H.; Ling, H.F. Trace and rare earth element geochemistry of phosphate nodules from the lower Cambrian black shale sequence in the Mufu Mountain of Nanjing, Jiangsu province, China. Chem. Geol. 2007, 244, 584–604. [Google Scholar] [CrossRef]
- Shields, G.; Stille, P. Diagenetic constraints on the use of cerium anomalies as palaeoseawater redox proxies: An isotopic and REE study of Cambrian phosphorites. Chem. Geol. 2001, 175, 29–48. [Google Scholar] [CrossRef]
- Dai, S.; Guo, W.; Nechaev, V.P.; French, D.; Ward, C.R.; Spiro, B.F.; Finkelman, R.B. Modes of occurrence and origin of mineral matter in the Palaeogene coal (No. 19-2) from the Hunchun Coalfield, Jilin Province, China. Int. J. Coal Geol. 2018, 189, 94–110. [Google Scholar] [CrossRef]
- Dai, S.; Ji, D.; Ward, C.R.; French, D.; Hower, J.C.; Yan, X.; Wei, Q. Mississippian anthracites in Guangxi Province, southern China: Petrological, mineralogical, and rare earth element evidence for high-temperature solutions. Int. J. Coal Geol. 2018, 197, 84–114. [Google Scholar] [CrossRef]
- Dai, S.; Xie, P.; Ward, C.R.; Yan, X.; Guo, W.; French, D.; Graham, I.T. Anomalies of rare metals in Lopingian super-high-organic-sulfur coals from the Yishan Coalfield, Guangxi, China. Ore Geol. Rev. 2017, 88, 235–250. [Google Scholar] [CrossRef]
- Wang, Z.; Dai, S.; Zou, J.; French, D.; Graham, I.T. Rare earth elements and yttrium in coal ash from the Luzhou power plant in Sichuan, Southwest China: Concentration, characterization and optimized extraction. Int. J. Coal Geol. 2019, 203, 1–14. [Google Scholar] [CrossRef]
- Harrington, P. Machine Learning in Action; Manning Publications: Shelter Island, NY, USA, 2012; p. 384. [Google Scholar]
- Han, J.; Pei, J.; Kamber, M. Data Mining: Concepts and Techniques; Morgan Kaufmann: Burlington, MA, USA, 2011; p. 744. [Google Scholar]
- Wu, X.; Kumar, V.; Ross Quinlan, J.; Ghosh, J.; Yang, Q.; Motoda, H.; McLachlan, G.J.; Ng, A.; Liu, B.; Yu, P.S.; et al. Top 10 algorithms in data mining. Knowl. Inf. Syst. 2008, 14, 1–37. [Google Scholar] [CrossRef]
- McKinney, W. Python for Data Analysis; O’Reilly Media: Sebastopol, CA, USA, 2017; p. 511. [Google Scholar]
- Dai, S.; Wang, X.; Seredin, V.V.; Hower, J.C.; Ward, C.R.; O’Keefe, J.M.K.; Huang, W.; Li, T.; Li, X.; Liu, H.; et al. Petrology, mineralogy, and geochemistry of the Ge-rich coal from the Wulantuga Ge ore deposit, Inner Mongolia, China: New data and genetic implications. Int. J. Coal Geol. 2012, 90–91, 72–99. [Google Scholar] [CrossRef]
- Dai, S.; Wang, P.; Ward, C.R.; Tang, Y.; Song, X.; Jiang, J.; Hower, J.C.; Li, T.; Seredin, V.V.; Wagner, N.J.; et al. Elemental and mineralogical anomalies in the coal-hosted Ge ore deposit of Lincang, Yunnan, southwestern China: Key role of N2–CO2-mixed hydrothermal solutions. Int. J. Coal Geol. 2015, 152, 19–46. [Google Scholar] [CrossRef]
- Wei, Q.; Rimmer, S.M.; Dai, S. Distribution of trace elements in fractions after micronization and density-gradient centrifugation of high-Ge coals from the Wulantuga and Lincang Ge ore deposits, China. Energy Fuels 2017, 31, 11818–11837. [Google Scholar] [CrossRef]
- Dai, S.; Li, D.; Chou, C.L.; Zhao, L.; Zhang, Y.; Ren, D.; Ma, Y.; Sun, Y. Mineralogy and geochemistry of boehmite-rich coals: New insights from the Haerwusu Surface Mine, Jungar Coalfield, Inner Mongolia, China. Int. J. Coal Geol. 2008, 74, 185–202. [Google Scholar] [CrossRef]
- Duan, P.; Wang, W.; Liu, X.; Sang, S.; Ma, M.; Zhang, W. Differentiation of rare earth elements and yttrium in different size and density fractions of the Reshuihe coal, Yunnan Province, China. Int. J. Coal Geol. 2019, 207, 1–11. [Google Scholar] [CrossRef]
- Li, L.; Ota, K.; Dong, M.; Borjigin, W. Eyes in the dark: Distributed scene understanding for disaster management. IEEE Trans. Parallel Distrib. Syst. 2017, 28, 3458–3471. [Google Scholar] [CrossRef]
- Li, L.; Ota, K.; Dong, M. DeepNFV: A Light-weight Framework for Intelligent Edge Network Functions Virtualization. IEEE Network 2019, 33, 136–141. [Google Scholar] [CrossRef]
- Ota, K.; Dao, M.S.; Mezaris, V.; De Natale, F.G. Deep Learning for Mobile Multimedia: A Survey. ACM Trans. Multimedia Comput. Commun. Appl. (TOMM) 2017, 13, 21. [Google Scholar] [CrossRef]


| Sample | Ba/Eu | Type | Description |
|---|---|---|---|
| SRM2682b | 2247 | Coal | National Institute of Standards and Technology (NIST) standard reference samples |
| SRM2685b | 292 | Bituminous Coal | |
| SRM2690 | 2900 | Fly ash | |
| SRM2691 | 2950 | ||
| WLTG C6-2 | 18,598 | Low-rank Coal | No. 6 coal of Wulantuga Deposit (Shengli Coalfield, Inner Mongolia [61]) |
| ZJ-4-6 | 3813 | Low-rank Coal | No. 4 coal of Zhoujing Mine, Baise Coalfield, Guangxi Province |
| ZJ-5-12 | 2083 | No. 5 coal from Zhoujing Mine, Baise Coalfield, Guangxi Province | |
| X1-1R | 202,200 | Carbonate metasomatites | Dazhai Mine, Lincang Ge ore deposit, Yunnan Province [62,63] |
| X1-2R | 42,236 | ||
| Z2-15F | 51,027 | Quartz-carbonate metasomatites | |
| Z2-16F | 33,816 | ||
| LL5-K3-8 | 13.18 | Semi-anthracite | No. K3 coal from the La-Lang 5 Mine, Yishan Coalfield, Guangxi Province [55] |
| LL5-K3-13 | 10.69 |
| Elements | SRM2690 (Ba/Eu = 2900) | X1-1R (Ba/Eu = 202,200) | X1-2R (Ba/Eu = 42,236) | |||||||||||||
| Cer | BS | Step 1 | Step 2 | Step 3 | Step 4 | BS | Step 1 | Step 2 | Step 3 | Step 4 | BS | Step 1 | Step 2 | Step 3 | Step 4 | |
| 153Eu | 2.00 | 4.01 | BDL | 0.00 | 1.87 | 2.00 | 0.52 | BDL | 0.00 | 0.62 | 0.01 | 0.25 | BDL | BDL | 0.25 | 0.02 |
| 137Ba | 5800.00 | 6390 | 1.06 | 0.34 | 5852.23 | 112.10 | 1895.23 | 0.45 | 0.07 | 2022.00 | 22.03 | 814.53 | 4.02 | 0.09 | 844.67 | 12.66 |
| Elements | SRM2691 (Ba/Eu = 2950) | Z2-15F (Ba/Eu = 51,027) | Z2-16F (Ba/Eu = 33,816) | |||||||||||||
| Cer | BS | Step 1 | Step 2 | Step 3 | Step 4 | BS | Step 1 | Step 2 | Step 3 | Step 4 | BS | Step 1 | Step 2 | Step 3 | Step 4 | |
| 153Eu | 2.00 | 4.08 | BDL | BDL | 1.88 | 1.93 | 0.44 | BDL | BDL | 0.45 | 0.03 | 0.38 | BDL | BDL | 0.42 | 0.05 |
| 137Ba | 5900.00 | 6109.00 | 0.88 | 0.52 | 6392.00 | 193.00 | 1493.23 | 0.79 | 0.03 | 1530.89 | 32.79 | 1357.23 | 2.85 | 0.26 | 1690.89 | 22.93 |
| Elements | SRM2682b (Ba/Eu = 2247) | ZJ-4-6 (Ba/Eu = 3813) | ZJ-5-12 (Ba/Eu = 2083) | |||||||||||||
| Cer | BS | Step 1 | Step 2 | Step 3 | Step 4 | BS | Step 1 | Step 2 | Step 3 | Step 4 | BS | Step 1 | Step 2 | Step 3 | Step 4 | |
| 153Eu | 0.17 | 0.23 | BDL | BDL | 0.07 | 0.16 | 0.18 | BDL | 0.00 | 0.08 | 0.10 | 0.24 | BDL | BDL | 0.08 | 0.17 |
| 137Ba | 382.00 | 368.77 | BDL | 0.54 | 407.21 | 0.83 | 350.47 | BDL | 0.42 | 381.32 | BDL | 329.47 | 1.80 | 0.60 | 353.99 | BDL |
| Elements | SRM2685b (Ba/Eu = 292) | WTGC6-2 (Ba/Eu = 18,598) | LL5-K3-8 (Ba/Eu = 13.18) | |||||||||||||
| Cer | BS | Step 1 | Step 2 | Step 3 | Step 4 | BS | Step 1 | Step 2 | Step 3 | Step 4 | BS | Step 1 | Step 2 | Step 3 | Step 4 | |
| 153Eu | 0.36 | 0.33 | BDL | BDL | 0.02 | 0.34 | 0.61 | BDL | BDL | 0.54 | 0.14 | 2.59 | BDL | BDL | 0.03 | 2.41 |
| 137Ba | 105.00 | 97.60 | BDL | 0.40 | 113.10 | BDL | 2428.27 | 0.40 | 0.40 | 2603.77 | BDL | 26.23 | 3.43 | 0.68 | 31.77 | 3.72 |
| Elements | LL5-K3-13(Ba/Eu = 10.69) | |||||||||||||||
| BS | Step 1 | Step 2 | Step 3 | Step 4 | ||||||||||||
| 153Eu | 2.23 | BDL | 0.01 | BDL | 2.24 | |||||||||||
| 137Ba | 19.00 | BDL | BDL | 23.94 | 2.15 | |||||||||||
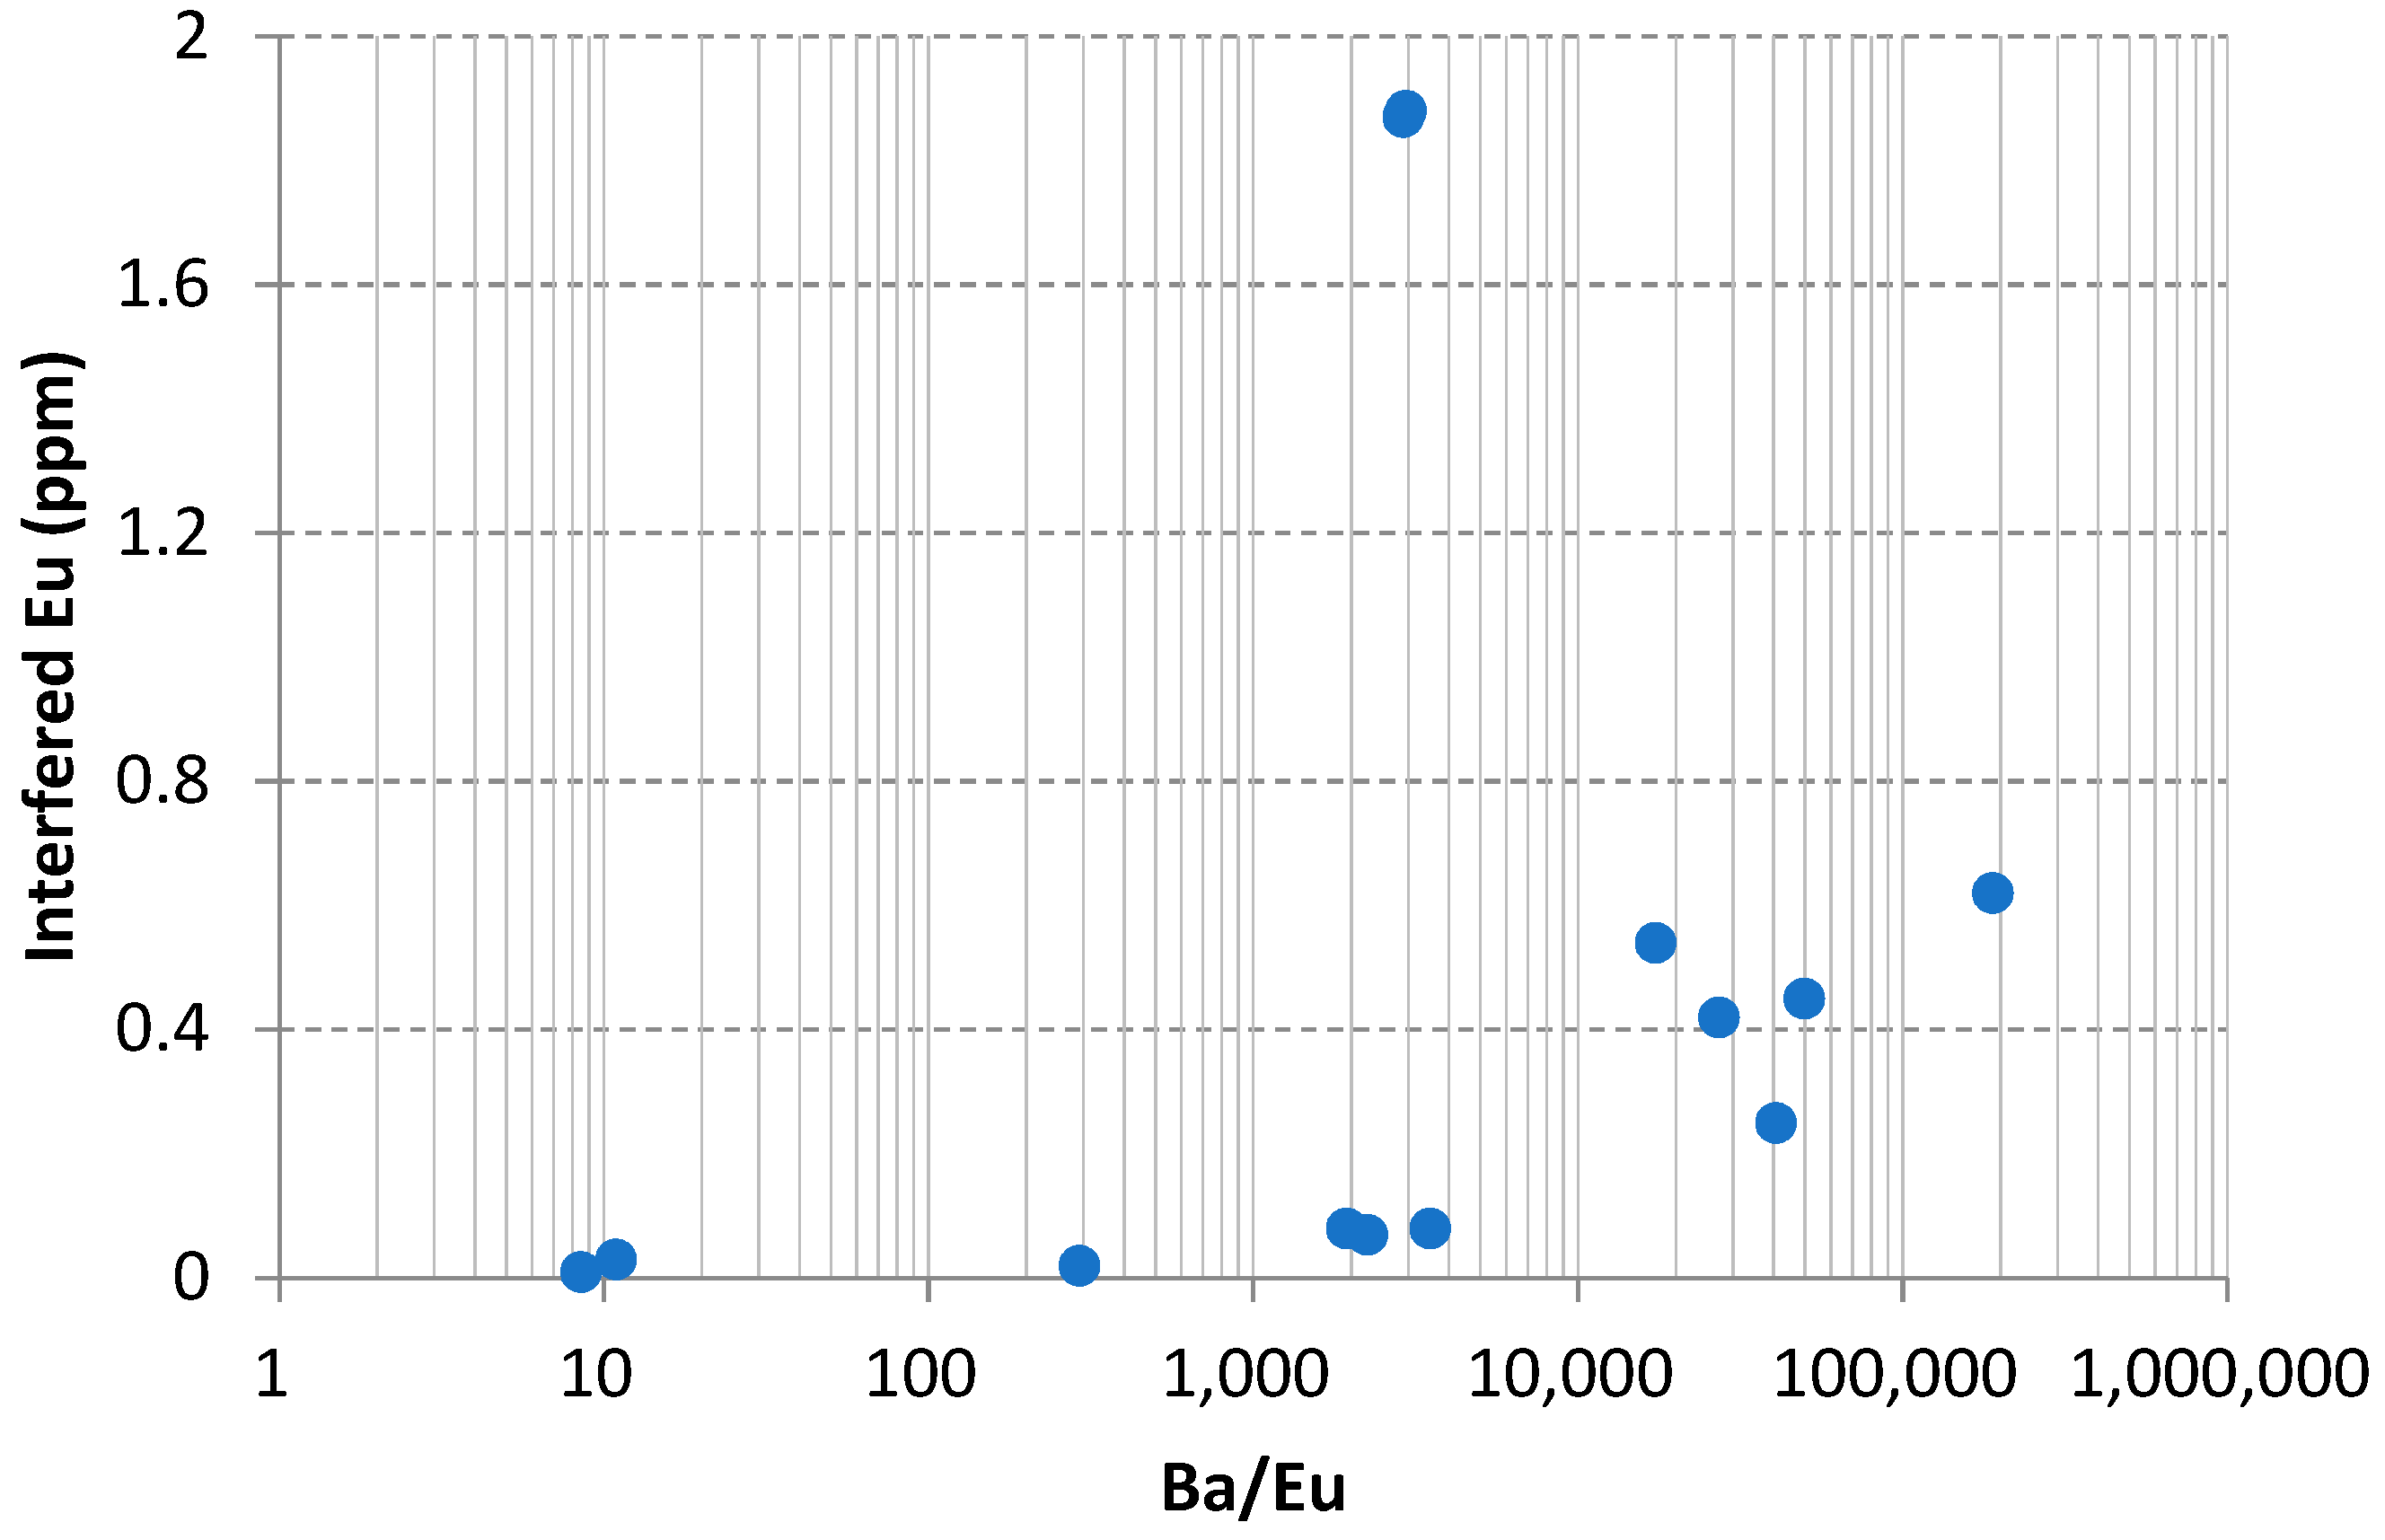
| Sample | Group No | Ba/Eu | Ba Interference with Eu |
|---|---|---|---|
| SRM2682b | 1 | 8.48 | 0.01 |
| SRM2685b | 2 | 10.88 | 0.03 |
| SRM2690 | 3 | 291.67 | 0.02 |
| SRM2691 | 4 | 1938.06 | 0.08 |
| WLTGC6-2 | 5 | 2247.06 | 0.07 |
| ZJ-4-6 | 6 | 2900 | 1.87 |
| ZJ-5-12 | 7 | 2950 | 1.88 |
| X1-1R | 8 | 3504.7 | 0.08 |
| X1-2R | 9 | 17,344.79 | 0.54 |
| Z2-15F | 10 | 27,144.6 | 0.42 |
| Z2-16F | 11 | 40,726.5 | 0.25 |
| LL5-K3-8 | 12 | 49,774.33 | 0.45 |
| LL5-K3-13 | 13 | 189,523 | 0.62 |
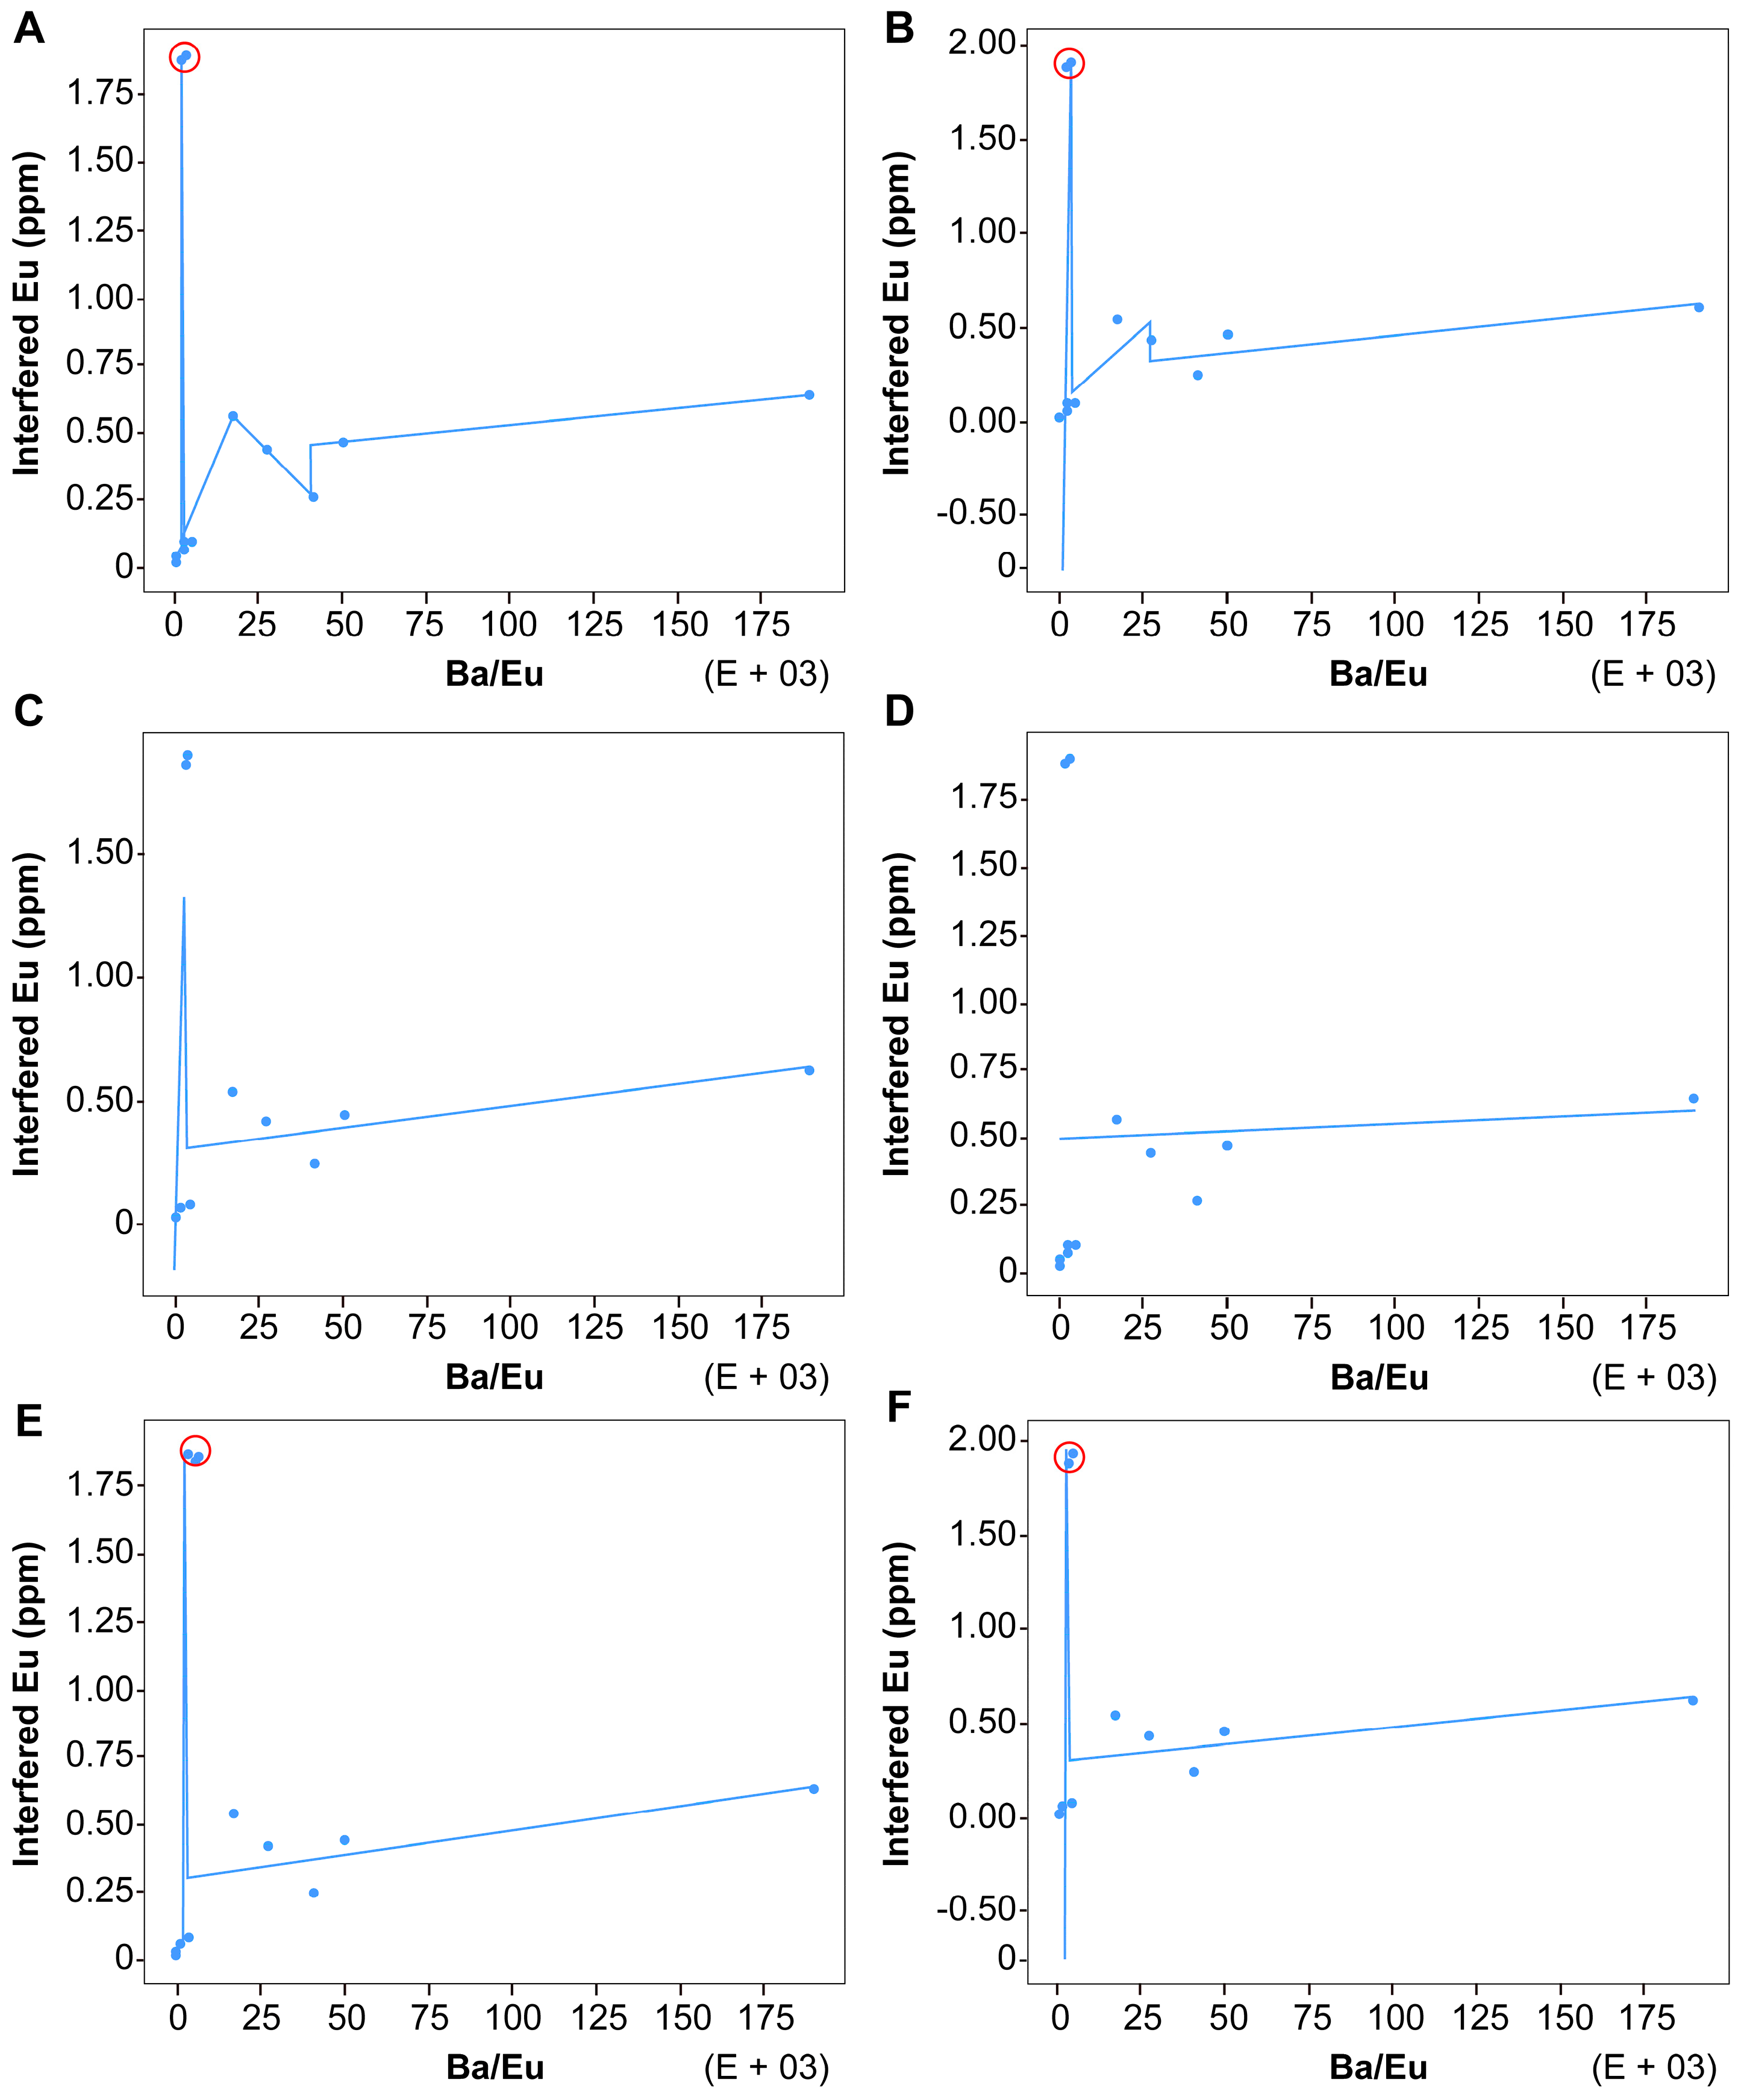
| Variables (tolS, tolN) | Prediction Models for Ba Interference with Eu Based on Model Tree |
|---|---|
| (0,1), (0,2) | |
| (0,3) | |
| (0,4), (0,5), (0,6), (1,4), (1,5), (1,6), (2,4), (2,5), (2,6) | |
| (0,7,…,∞), (1,7,…,∞), (2,7,…,∞), (3,…,∞, 1,…,∞) | |
| (1,1), (1,2), (2,1), (2,2) | |
| (1,3) (2,3) |
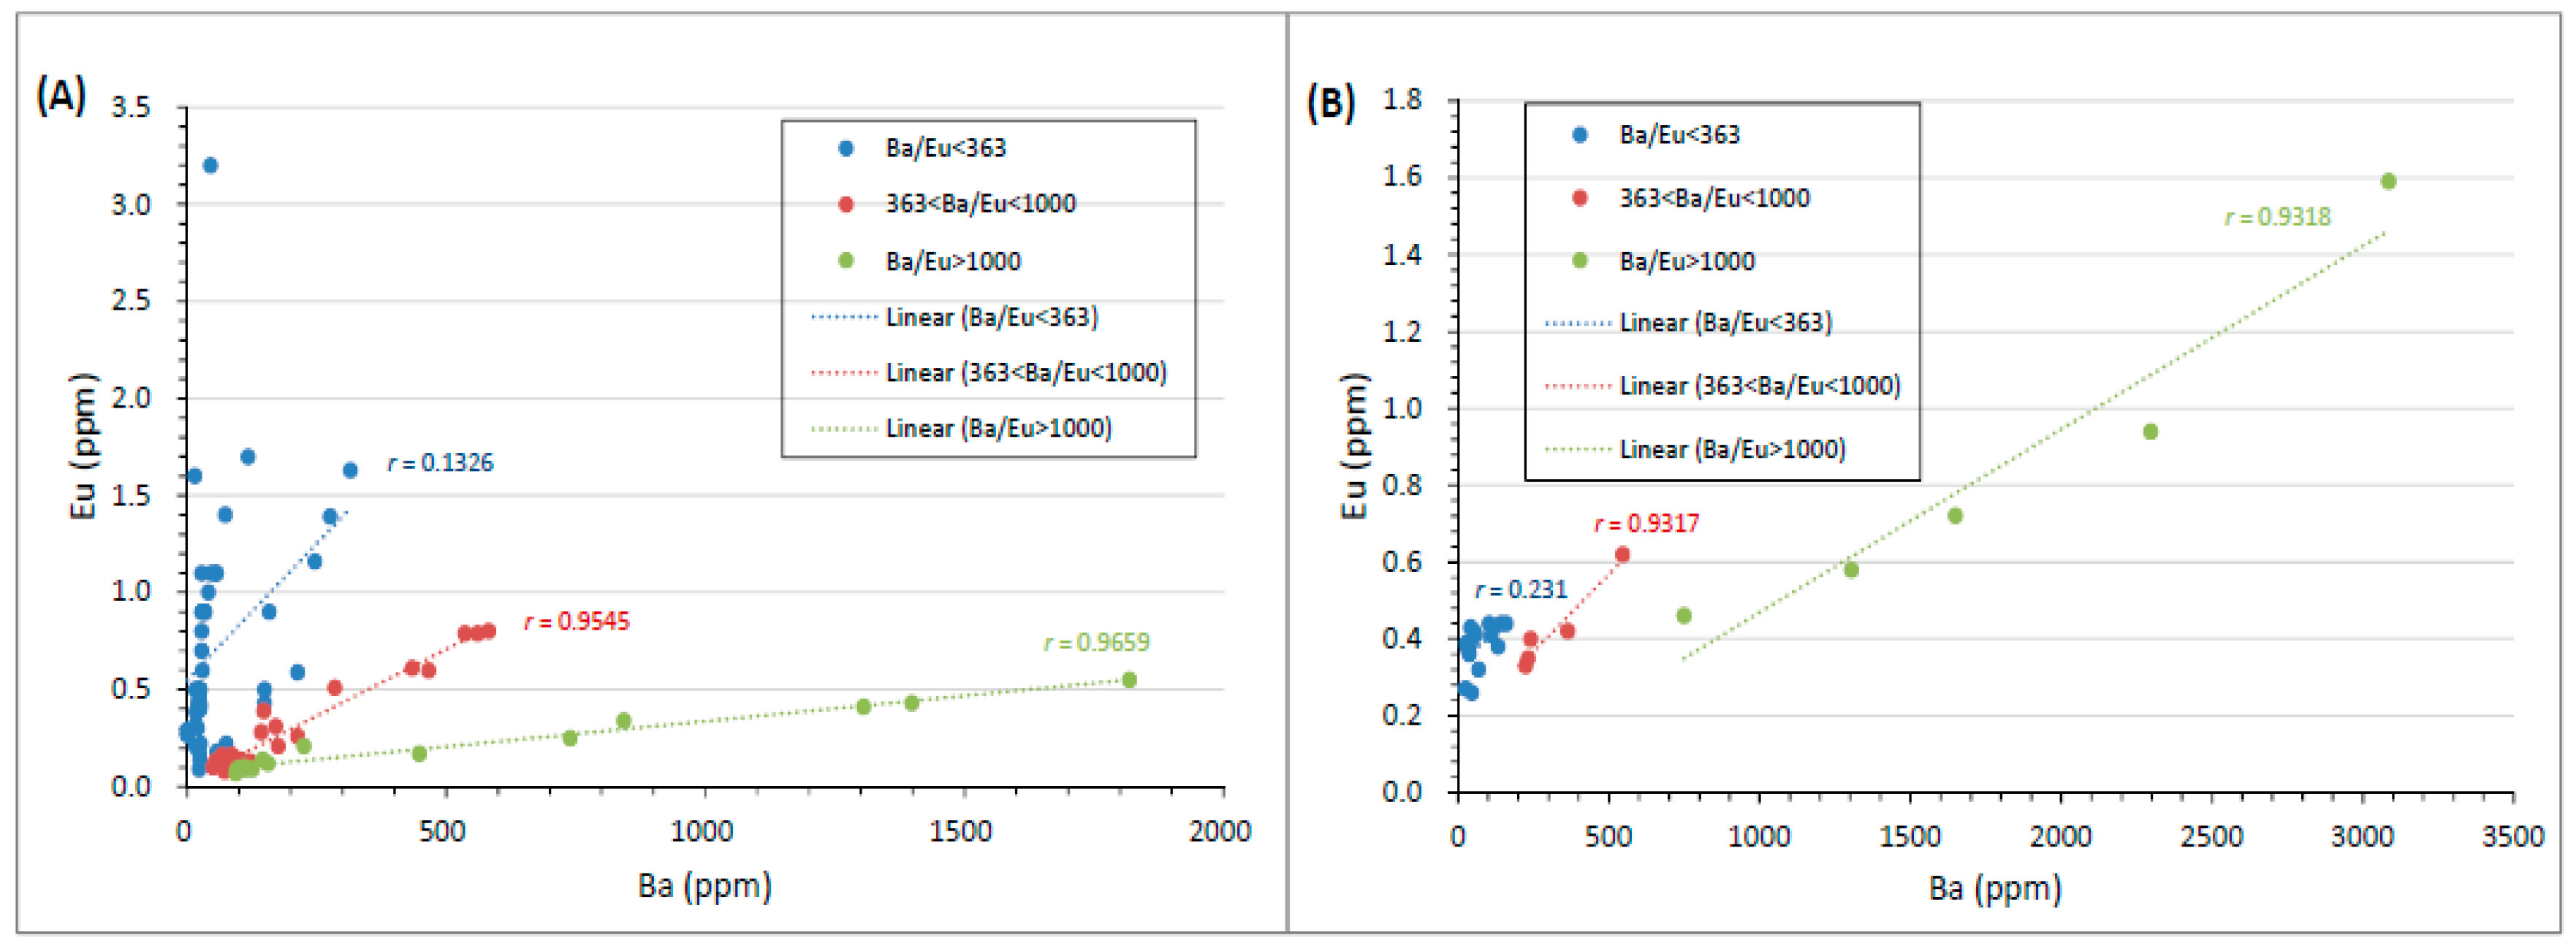
| Sample | Ba | Eu | Ba/Eu |
|---|---|---|---|
| S3-1R | 434 | 0.61 | 711.4754098 |
| S3-2R | 315 | 1.63 | 193.2515337 |
| S3-4 | 81.3 | 0.12 | 677.5 |
| S3-5 | 87.3 | 0.14 | 623.5714286 |
| S3-6 | 85.9 | 0.16 | 536.875 |
| S3-7 | 93.0 | 0.10 | 930 |
| S3-8 | 113 | 0.09 | 1255.555556 |
| S3-9F | 213 | 0.59 | 361.0169492 |
| S3-10F | 536 | 0.79 | 678.4810127 |
| S3-11F | 561 | 0.79 | 710.1265823 |
| WA-S3 | 90.6 | 0.13 | 696.9230769 |
| Z2-1R | 466 | 0.60 | 776.6666667 |
| Z2-2 | 103 | 0.14 | 735.7142857 |
| Z2-3 | 111 | 0.10 | 1110 |
| Z2-4P | 448 | 0.17 | 2635.294118 |
| Z2-5P | 94.6 | 0.07 | 1351.428571 |
| Z2-5LP | 156 | 0.12 | 1300 |
| Z2-6P | 285 | 0.51 | 558.8235294 |
| Z2-7 | 101 | 0.09 | 1122.222222 |
| Z2-8 | 97.0 | 0.09 | 1077.777778 |
| Z2-9 | 79.4 | 0.11 | 721.8181818 |
| Z2-10 | 171 | 0.31 | 551.6129032 |
| Z2-11P | 213 | 0.26 | 819.2307692 |
| Z2-12 | 126 | 0.09 | 1400 |
| Z2-13 | 107 | 0.13 | 823.0769231 |
| Z2-14 | 226 | 0.21 | 1076.190476 |
| Z2-15F | 1398 | 0.43 | 3251.162791 |
| Z2-16F | 1305 | 0.41 | 3182.926829 |
| WA-Z2 | 122 | 0.13 | 938.4615385 |
| X1-1R | 1818 | 0.55 | 3305.454545 |
| X1-2R | 739 | 0.25 | 2956 |
| X1-3R | 843 | 0.34 | 2479.411765 |
| X1-4 | 84.2 | 0.13 | 647.6923077 |
| X1-5 | 77.7 | 0.12 | 647.5 |
| X1-6 | 86.1 | 0.12 | 717.5 |
| X1-7 | 67.8 | 0.12 | 565 |
| X1-8 | 99.3 | 0.11 | 902.7272727 |
| X1-9 | 146 | 0.14 | 1042.857143 |
| X1-10 | 87.0 | 0.16 | 543.75 |
| X1-11 | 82.5 | 0.14 | 589.2857143 |
| X1-12 | 75.7 | 0.22 | 344.0909091 |
| X1-13 | 86.9 | 0.13 | 668.4615385 |
| X1-14 | 70.6 | 0.10 | 706 |
| X1-15 | 143 | 0.28 | 510.7142857 |
| X1-16F | 276 | 1.39 | 198.5611511 |
| X1-17F | 247 | 1.16 | 212.9310345 |
| X1-18F | 582 | 0.80 | 727.5 |
| WA-X1 | 91 | 0.14 | 650 |
| 1418-1 | 58 | 0.18 | 322.2222222 |
| 1418-2 | 54 | 0.13 | 415.3846154 |
| 1418-3 | 148 | 0.39 | 379.4871795 |
| H-15 | 25 | 0.5 | 50 |
| H-16 | 28 | 0.8 | 35 |
| H-17 | 24 | 0.46 | 52.17391304 |
| H-18 | 16 | 0.21 | 76.19047619 |
| H-19 | 23 | 0.42 | 54.76190476 |
| H-20 | 26 | 0.22 | 118.1818182 |
| H-21 | 18 | 0.39 | 46.15384615 |
| H-22 | 21 | 0.39 | 53.84615385 |
| H-22-23-P | 25 | 0.14 | 178.5714286 |
| H-23 | 18 | 0.38 | 47.36842105 |
| H-24 | 20 | 0.30 | 66.66666667 |
| H-24-25-P | 24 | 0.17 | 141.1764706 |
| H-25 | 34 | 0.9 | 37.77777778 |
| H-26 | 16 | 0.5 | 32 |
| H-27 | 24 | 0.49 | 48.97959184 |
| H-28 | 30 | 0.9 | 33.33333333 |
| H-29 | 28 | 0.9 | 31.11111111 |
| H-B1 | 17 | 0.32 | 53.125 |
| H-B2 | 28 | 1.1 | 25.45454545 |
| H-B3 | 118 | 1.7 | 69.41176471 |
| WG-1 | 176 | 0.21 | 838.0952381 |
| CS-1 | 68 | 0.16 | 425 |
| 1104/1 | 50.6 | 0.1 | 506 |
| H-T | 1029 | 1.0 | 1029 |
| H-1 | 25 | 0.5 | 50 |
| H-1-2-P | 45 | 3.2 | 14.0625 |
| H-4 | 74 | 1.4 | 52.85714286 |
| H-5 | 32 | 0.9 | 35.55555556 |
| H-5-6-P1 | 57 | 1.1 | 51.81818182 |
| H-5-6-P2 | 25 | 0.4 | 62.5 |
| H-6 | 35 | 0.9 | 38.88888889 |
| H-7 | 46 | 1.1 | 41.81818182 |
| H-8 | 30 | 0.6 | 50 |
| H-8-9-P | 23 | 0.09 | 255.5555556 |
| H-9 | 15 | 1.6 | 9.375 |
| H-10 | 28 | 0.7 | 40 |
| H-11 | 22 | 0.44 | 50 |
| H-12 | 26 | 0.42 | 61.9047619 |
| H-13 | 21 | 0.41 | 51.2195122 |
| H-14 | 22 | 0.5 | 44 |
| S3-4 | 81.3 | 0.12 | 677.5 |
| 1418-4 | 73 | 0.08 | 912.5 |
| Sample | Ba | Eu | Ba/Eu |
|---|---|---|---|
| 1 | 41.37 | 0.43 | 96.2093023 |
| 2 | 37.07 | 0.36 | 102.972222 |
| 3 | 57.96 | 0.41 | 141.365854 |
| 4 | 102.69 | 0.44 | 233.386364 |
| 5 | 142.94 | 0.44 | 324.863636 |
| 6 | 223.67 | 0.33 | 678 |
| 7 | 34.81 | 0.38 | 91.6052632 |
| 8 | 30.59 | 0.38 | 80.5 |
| 9 | 33.97 | 0.37 | 91.8108108 |
| 10 | 52.04 | 0.42 | 123.904762 |
| 11 | 110.63 | 0.41 | 269.829268 |
| 12 | 158.85 | 0.44 | 361.022727 |
| 13 | 240.5 | 0.4 | 601 |
| 14 | 32.9 | 0.39 | 84.3589744 |
| 15 | 45.71 | 0.26 | 175.807692 |
| 16 | 67.95 | 0.32 | 212.34375 |
| 17 | 132.77 | 0.38 | 349.394737 |
| 18 | 231.42 | 0.35 | 661 |
| 19 | 364.43 | 0.42 | 868 |
| 20 | 546.4 | 0.62 | 881 |
| 21 | 25.16 | 0.27 | 93.1851852 |
| 22 | 28.98 | 0.39 | 74.3076923 |
| 23 | 749.07 | 0.46 | 1628.41304 |
| 24 | 1304.88 | 0.58 | 2249.7931 |
| 25 | 1648.57 | 0.72 | 2289.68056 |
| 26 | 2296.27 | 0.94 | 2442.84043 |
| 27 | 3086.02 | 1.59 | 1940.89308 |
| 28 | 28.98 | 0.39 | 74.30769231 |
© 2019 by the authors. Licensee MDPI, Basel, Switzerland. This article is an open access article distributed under the terms and conditions of the Creative Commons Attribution (CC BY) license (http://creativecommons.org/licenses/by/4.0/).
Share and Cite
Xu, N.; Li, Q. Threshold Value Determination Using Machine Learning Algorithms for Ba Interference with Eu in Coal and Coal Combustion Products by ICP-MS. Minerals 2019, 9, 259. https://doi.org/10.3390/min9050259
Xu N, Li Q. Threshold Value Determination Using Machine Learning Algorithms for Ba Interference with Eu in Coal and Coal Combustion Products by ICP-MS. Minerals. 2019; 9(5):259. https://doi.org/10.3390/min9050259
Chicago/Turabian StyleXu, Na, and Qing Li. 2019. "Threshold Value Determination Using Machine Learning Algorithms for Ba Interference with Eu in Coal and Coal Combustion Products by ICP-MS" Minerals 9, no. 5: 259. https://doi.org/10.3390/min9050259
APA StyleXu, N., & Li, Q. (2019). Threshold Value Determination Using Machine Learning Algorithms for Ba Interference with Eu in Coal and Coal Combustion Products by ICP-MS. Minerals, 9(5), 259. https://doi.org/10.3390/min9050259