Article

Germanium Crystal Chemistry in Cu-Bearing Sulfides from Micro-XRF Mapping and Micro-XANES Spectroscopy

1
Université de Lorraine, CNRS, GeoRessources, F-54000 Nancy, France
2
Centre de Recherches Pétrographiques et Géochimiques (CRPG), Université de Lorraine, CNRS, UMR 7358, 15 Rue Notre Dame des Pauvres, BP 20, CEDEX, F-54501 Vandoeuvre-lès-Nancy, France
3
Geosciences Montpellier, Université de Montpellier, CNRS, CEDEX 5, 34095 Montpellier, France
4
European Synchrotron Radiation Facility, BP 220, F-38043 Grenoble, France
*
Author to whom correspondence should be addressed.
Minerals 2019, 9(4), 227; https://doi.org/10.3390/min9040227
Submission received: 18 March 2019 / Revised: 8 April 2019 / Accepted: 9 April 2019 / Published: 12 April 2019

Abstract

:
Germanium is considered a critical element, with a demand that has sharply increased due to booming high-technology industries. To understand Ge incorporation mechanisms in natural systems, we investigate Ge speciation in Cu-bearing sulfide minerals using synchrotron X-ray fluorescence (XRF) chemical mapping and Ge K-edge µ-X-ray absorption near-edge structures (µ-XANES) spectroscopy. The samples investigated include (i) a homogeneous chalcopyrite from the Kipushi polymetallic deposit (Central African copperbelt, D.R. Congo) and (ii) a zoned Ge-rich chalcopyrite from the Barrigão Cu deposit (Iberian pyrite belt, Portugal). First, our spectroscopic analysis supports the occurrence of tetrahedrally-coordinated Ge4+ in chalcopyrite, independently from origins or zoning patterns observed for these minerals. Then, based on statistical analyses of XRF chemical maps, we demonstrate that tetravalent germanium most likely incorporates chalcopyrite through the Fe crystallographic site via coupled substitutions with the following form: (2x + 3y)Fe3+ ⟷ (x + 2y)(Ge,Sn)4+ + x(Zn,Pb)2+ + y(Cu,Ag)+, although the presence of lattice vacancies cannot be completely excluded.

1. Introduction

Germanium is an indispensable high-tech element in many modern industries [1] and has been considered a critical raw material by the European Union since 2014 [2]. In the Earth’s upper crust, germanium is a trace element, with average abundances as low as ~1.3 μg/g [3]. Geranium can be incorporated in a large array of minerals as a result of various geochemical behaviors in distinct geological environments (see the review of Reference [4]), which enables its use as a tracer in a range of fields, such as for deciphering hydrothermal activity [5] and ore deposition processes [6,7,8,9,10]. In sulfide ore deposits, germanium concentrations can increase by several orders of magnitude due to its chalcophile behavior. Although sphalerite (ZnS) represents one of the primary sources of Ge, with concentrations of up to several thousands of μg/g, other sulfide minerals that have similar crystal structures—such as chalcopyrite (CuFeS2)—can host significant amounts of Ge (Figure 1). Cook et al. [11] observed that Ge concentrations are typically below the μg/g level in bornite, chalcocite, and digenite from various deposits, with the exception of bornite from Sasca Montană (Cu–Au skarn, Romania), as well as Radka and Chelopech (high to intermediate sulfidation, epithermal Cu–Au deposits, Bulgaria), which exhibit mean Ge contents of 31, 20, and 6 μg/g, respectively. Reiser et al. [12] reported significant Ge concentrations in chalcopyrite from the Barrigão Cu vein-type deposit (Portugal), with averages of 0.19 wt. %. Copper sulfides can be associated with accessory Ge-sulfides in Cu–Zn-rich ores, the latter grading from 6 to 18 wt. % Ge (e.g., renierite from Kipushi, D.R. Congo; [13]), making sphalerite only a minor Ge carrier in such Cu–Zn-rich deposits [14]. In addition, chalcopyrite can exhibit compositional zoning in trace elements [12]. This, however, remains poorly documented due to the opacity of chalcopyrite and the relatively low chemical sensitivity of classic characterization techniques.
Modeling incorporation mechanisms of minor/trace metals in chalcopyrite requires accurate Ge speciation information, such as the oxidation state, ligand nature, and coordination number. In addition, the latter are key parameters involved in stable isotope fractionation in a large variety of systems [15] and Ge isotopes are increasingly used as a proxy of sulfide deposition processes [5,6,7,8,9,10]. Therefore, determining Ge crystal chemistry is not only crucial to characterize and understand concentration processes, but also to gain insight into Ge partitioning and isotope fractionation in sulfide-rich systems. Two recent spectroscopic studies, devoted to Ge-bearing sphalerite, suggest the presence of tetrahedral Ge4+ in chalcopyrite [16,17]. However, the oxidation state of Ge relative to zoning patterns and enrichment processes in chalcopyrite was not addressed in these former studies.
Synchrotron X-ray absorption near-edge structures (XANES) spectroscopy is a powerful element-specific technique that can obtain information on the oxidation state of the absorbing atom and its coordination symmetry. Advances in XANES spectroscopy have led to high-resolution in situ analysis, where elements can be probed in minor or trace amounts in various types of materials [17,18]. Germanium K-edge data from natural Ge-bearing specimens remain relatively scarce in the literature. Bernstein and Waychunas [19] found that Ge4+ occurs in octahedral coordination with O ligands when they conducted a study on Ge-bearing iron oxides—i.e., hematite, goethite, and stottite. Recent XANES measurements [16,17] on Ge-bearing sphalerite demonstrated the occurrence of Ge4+ in tetrahedral coordination with S ligands.
In this study, we aim to probe the distribution and oxidation state of Ge at the micrometer scale using synchrotron micro X-ray fluorescence (XRF) chemical maps and Ge K-edge µ-XANES in zoned Ge-rich Cu-sulfides to gain further insight into Ge enrichment processes relative to zoning patterns. An enhanced understanding of Ge uptake in sulfide minerals is relevant when attempting to improve Ge source exploration and recovery.

2. Materials and Methods

2.1. Sample Description

The model compounds and samples studied are listed in Table 1, including the Ge concentrations determined by either electron probe micro analysis (EPMA) or laser ablation inductively coupled plasma mass spectrometry (LA-ICP-MS) [20].
Regarding model compounds, three Ge-sulfides were used for referencing Ge4+ in a S-tetrahedron, namely renierite, briartite (from Kipushi), and a germanite sample (from Tsumeb, Namibia) that were analyzed as both a pressed-pellet powder and polished section. Synthetic GeS was used for referencing Ge2+ in (3 + 2) coordination with S ligands and GeO2 (argutite form) was used for referencing Ge4+ with octahedral coordination involving O ligands. The calibration method is similar to that proposed by Belissont et al. [17] for Ge-bearing sphalerite.
Samples labelled BARR1, BARR3, and BARR8 originate from the Barrigão Cu deposit (Iberian pyrite belt, Portugal). The mineralization occurs as fault breccia chiefly composed of chalcopyrite (grading up to 0.64% Ge; [12]) and tennantite-tetrahedrite solid-solution (referred to as “tennantite” in the remainder of this study). Detailed petrographic descriptions of the samples can be found in Reiser et al. [12]. Chalcopyrite samples contain from 96 to 6260 μg/g Ge while tennantite samples contain up to 70 μg/g Ge [20].
On the other hand, chalcopyrite samples labelled U25 and U48 originate from the Kipushi Zn-Cu deposit (Central African copper-belt, D.R. Congo) and present an averaged Ge content of 630 and 280 μg/g, respectively [20]. Finally, two samples of bornite and covellite from Kipushi contain a maximum of 14 and 3000 μg/g of Ge, respectively [20]. Based on petrographic scanning electron microscope (SEM) observations and LA-ICP-MS analysis, areas of interest for subsequent µ-XRF chemical mapping, combined with Ge K-edge µ-XANES measurements, were selected.

2.2. Synchrotron Data Collection and Processing

The experimental setup is similar to our preceding experiments on sphalerite [17]. Data was collected at the BM23 beamline of the European Synchrotron Radiation Facility (ESRF, Grenoble, France). The storage ring was operated at 6 GeV in 16 bunch mode with a current ranging from 90 to 75 mA between each refill. X-rays were generated using a bending magnet (BM) and filtered using a fixed-exit double-crystal Si(111) monochromator. Micro-focusing of X-rays into an incident beam of ~5 × 5 µm2 was achieved using two mirrors in Kirkpatrick–Baez (KB) geometry. The spectrum of a Ge metallic foil, collected in transmission mode, was used to calibrate the energy (edge inflection at 11,103.0 eV). Note that this relative calibration is different than that adopted in Reference [17], which results in an energy shift of 3.9 eV compared with the present spectra. Data collection in samples and reference compounds was performed in fluorescence mode using a Vortex silicon-drift energy-dispersive detector, located 90° from the incident beam.
XRF maps were collected at 12 keV, yielding X-ray emission lines up to As-Kβ (11,726.2 eV). Selected regions in the samples were mapped with a step-size of 10 to 3 µm depending on the level of detail required. The dwell time was adjusted to 500 ms. XRF spectra (one spectrum per pixel) were converted into XRF chemical maps using the PyMca software (version 5.4.0, ESRF Software Group, Grenoble, France; [26]). Fluorescence line intensities were determined for pre-defined regions of interest on the XRF spectra or from batch curve fitting of the emission lines. Resulting µ-XRF chemical maps were used to select each spot to be analyzed by µ-XANES.
Germanium K-edge XANES spectra were collected at room temperature with exposure to ambient air by scanning the monochromator over the energy range of 11,000–11,600 eV, with the smallest energy increments near the absorption edge (11,070–11,110 eV), above which the energy increment was progressively increased to 2.5 eV at the upper end of the scan (11,600 eV). XANES spectra acquisitions were stopped at 11,600 eV because the LIII-edge absorption of Pt (at 11,564 eV) that constitutes the coating of the KB mirrors was visible, especially for samples with low Ge contents. The drift in the incident X-ray beam position was verified to be lower than 3 µm. For optimal fluorescence detection, the dead-time was adjusted to 10%. Except for germanite, the crystal system of the samples studied in polished sections was not cubic. Therefore, theoretically, orientation effects may affect the XANES region due to the linear polarization of the incident beam [27]. However, after a careful examination of the collected spectra, no significant polarization/orientation effect was detected. The Athena (Demeter suite), based on the IFEFFIT program [28], was used for data reduction, including data merging and normalization. The absorption edge position, referred to as the inflection point of the edge, was determined visually as the root of the second derivative spectra. Each XANES spectrum results from the acquisition of 200 points along the energy range with a dwell time of 4 s per point. Depending on sample Ge concentration, an average of 4, 8, or 16 spectra were required to obtain a sufficient signal-to-noise ratio, such that the total acquisition time for each spectrum was between 1 and 4 h. Despite such long acquisition times, no beam damage to the samples was detected, either through observation of changes in spectral signatures or after examination of the sample surface after data acquisition.
µ-XRF mapping and subsequent µ-XANES data were collected when Ge concentrations were high enough to enable data collection with sufficient signal-to-noise ratios. Consequently, µ-XRF chemical maps were obtained for the different chalcopyrite grains. However, only the BARR8 sample contains sufficient germanium concentrations to allow the recording of Ge K-edge µ-XANES spectra (Table 1). Other Cu-sulfides, such as bornite and tennantite observed in both deposits, could not be analyzed by µ-XANES due to low Ge concentrations (Table 1). In addition, the tennantite samples suffered from interference between the Ge-Kα and Zn-Kβ fluorescence lines, which drastically decreased the signal-to-noise ratio of the absorption spectra.

3. Results

3.1. Element Distribution

Synchrotron X-ray fluorescence maps were used to characterize the distribution of Ge and other elements, such as Cu, Fe, As, and Sb. In sulfide minerals from Kipushi, XRF maps reveal homogeneous distributions including Ge, either in chalcopyrite (Cp), tennantite (Tn), bornite (Bn), or galena (Gn) (Figure 2). Germanium concentrations in chalcopyrite are 279 μg/g and we note that chalcopyrite is enriched in Sb (i.e., 0.45 μg/g) relative to tennantite.
In contrast to the samples from Kipushi, chalcopyrite from Barrigão showed significant variation in Ge content, which was associated with specific textures. Figure 3 and Figure 4a,b present XRF maps of samples BARR1, BARR3, and BARR8, respectively.
Figure 3 highlights a fracture through a large chalcopyrite grain depleted in Ge and filled with tennantite at the center. All around the tennantite vein, the damaged area reveals chalcopyrite grains of various size that have clear Ge enrichments mainly located at the grain boundaries (as revealed by the detailed map collected with a 2.5 µm spatial sampling; see inset 2 in Figure 3), which underlines the micro-fracture network observed in the secondary electron microphotograph (Figure 3, inset 1). Note that, similar to germanium, arsenic also appears enriched at grain boundaries in the damaged zone. Finally, a homogeneous Ge-rich zone is observed in chalcopyrite in the upper left side of the XRF map.
In Figure 4a, another type of texture is observed with a “core” zone on one side of a large chalcopyrite grain (bottom right of the picture), as well as the occurrence of tennantite grains (up to tens of µm in size) as inclusions on the other side of grain. The core of the chalcopyrite grain appears depleted in Ge, however, significant Ge enrichment can be observed near tennantite inclusions. Similar to the Kipushi sample (Figure 3), Ge appears relatively correlated to As in the Ge-rich zones of the chalcopyrite. Figure 4b highlights a third type of texture, where Ge(-As)-rich vein-like patterns occur in a large, Ge-poor chalcopyrite grain. Such an occurrence of Ge-rich veins superimposed on primary Ge-poor chalcopyrite is in good agreement with the observations of Reiser et al. [12], who suggested the existence of two stages of Ge enrichment in chalcopyrite, the latter of which yields the highest Ge contents in fractures.
The XRF dataset was further processed using principal component analysis (PCA) to highlight potential relationships between elements in chalcopyrite. The intensity of Ge, As, Cu, Fe, Zn, and Sb (i.e., loadings) of each pixel on the chemical maps (i.e., the intensity of the X-ray fluorescence lines) corresponds to a statistic individual (i.e., score). All pixels corresponding to tennantite were removed from the computation. All PCAs showed similar trends; Figure 5 being a prime example. Two statistically-independent clusters (i.e., sub-perpendicular tie lines) of elements appear in Figure 5a (As–Ge–Zn and Cu–Fe–Sb), as well as two groups of scores divided mostly along the first cluster, i.e., As–Ge–(Zn)-rich spots (blue dots) and spots depleted in these trace elements (red dots). The corresponding regions on the intensity map are presented in Figure 5b.
In addition, both red and blue dot groups in Figure 5a are elongated along the Cu–Fe–Sb cluster, highlighting variations in the concentration of major elements. Between Cu and Fe (major elements in chalcopyrite), Cu appears to be most independent from As and Ge, while these elements are slightly anti-correlated with Fe. Therefore, As and Ge substitution for Cu in chalcopyrite remains unlikely. Intensity maps of the PCs in Figure 5b–d clearly indicate that the As–Ge–(Zn)-rich spots correspond to vein-like networks previously identified in the XRF maps of Ge and As (Figure 3). Statistically-independent clusters and the presence of two distinct chalcopyrite groups both suggest that there is a gap between the deposition of As–Ge–(Zn)-rich chalcopyrite and former chalcopyrite grains depleted in trace elements. Therefore, the strong correlation of Ge with As and Zn, which are major tennantite components, and the common association of Ge-rich chalcopyrite and tennantite both suggest the involvement of a late-stage hydrothermal overprint that deposited the two types of Ge-rich chalcopyrite with, possibly, coeval tennantite.

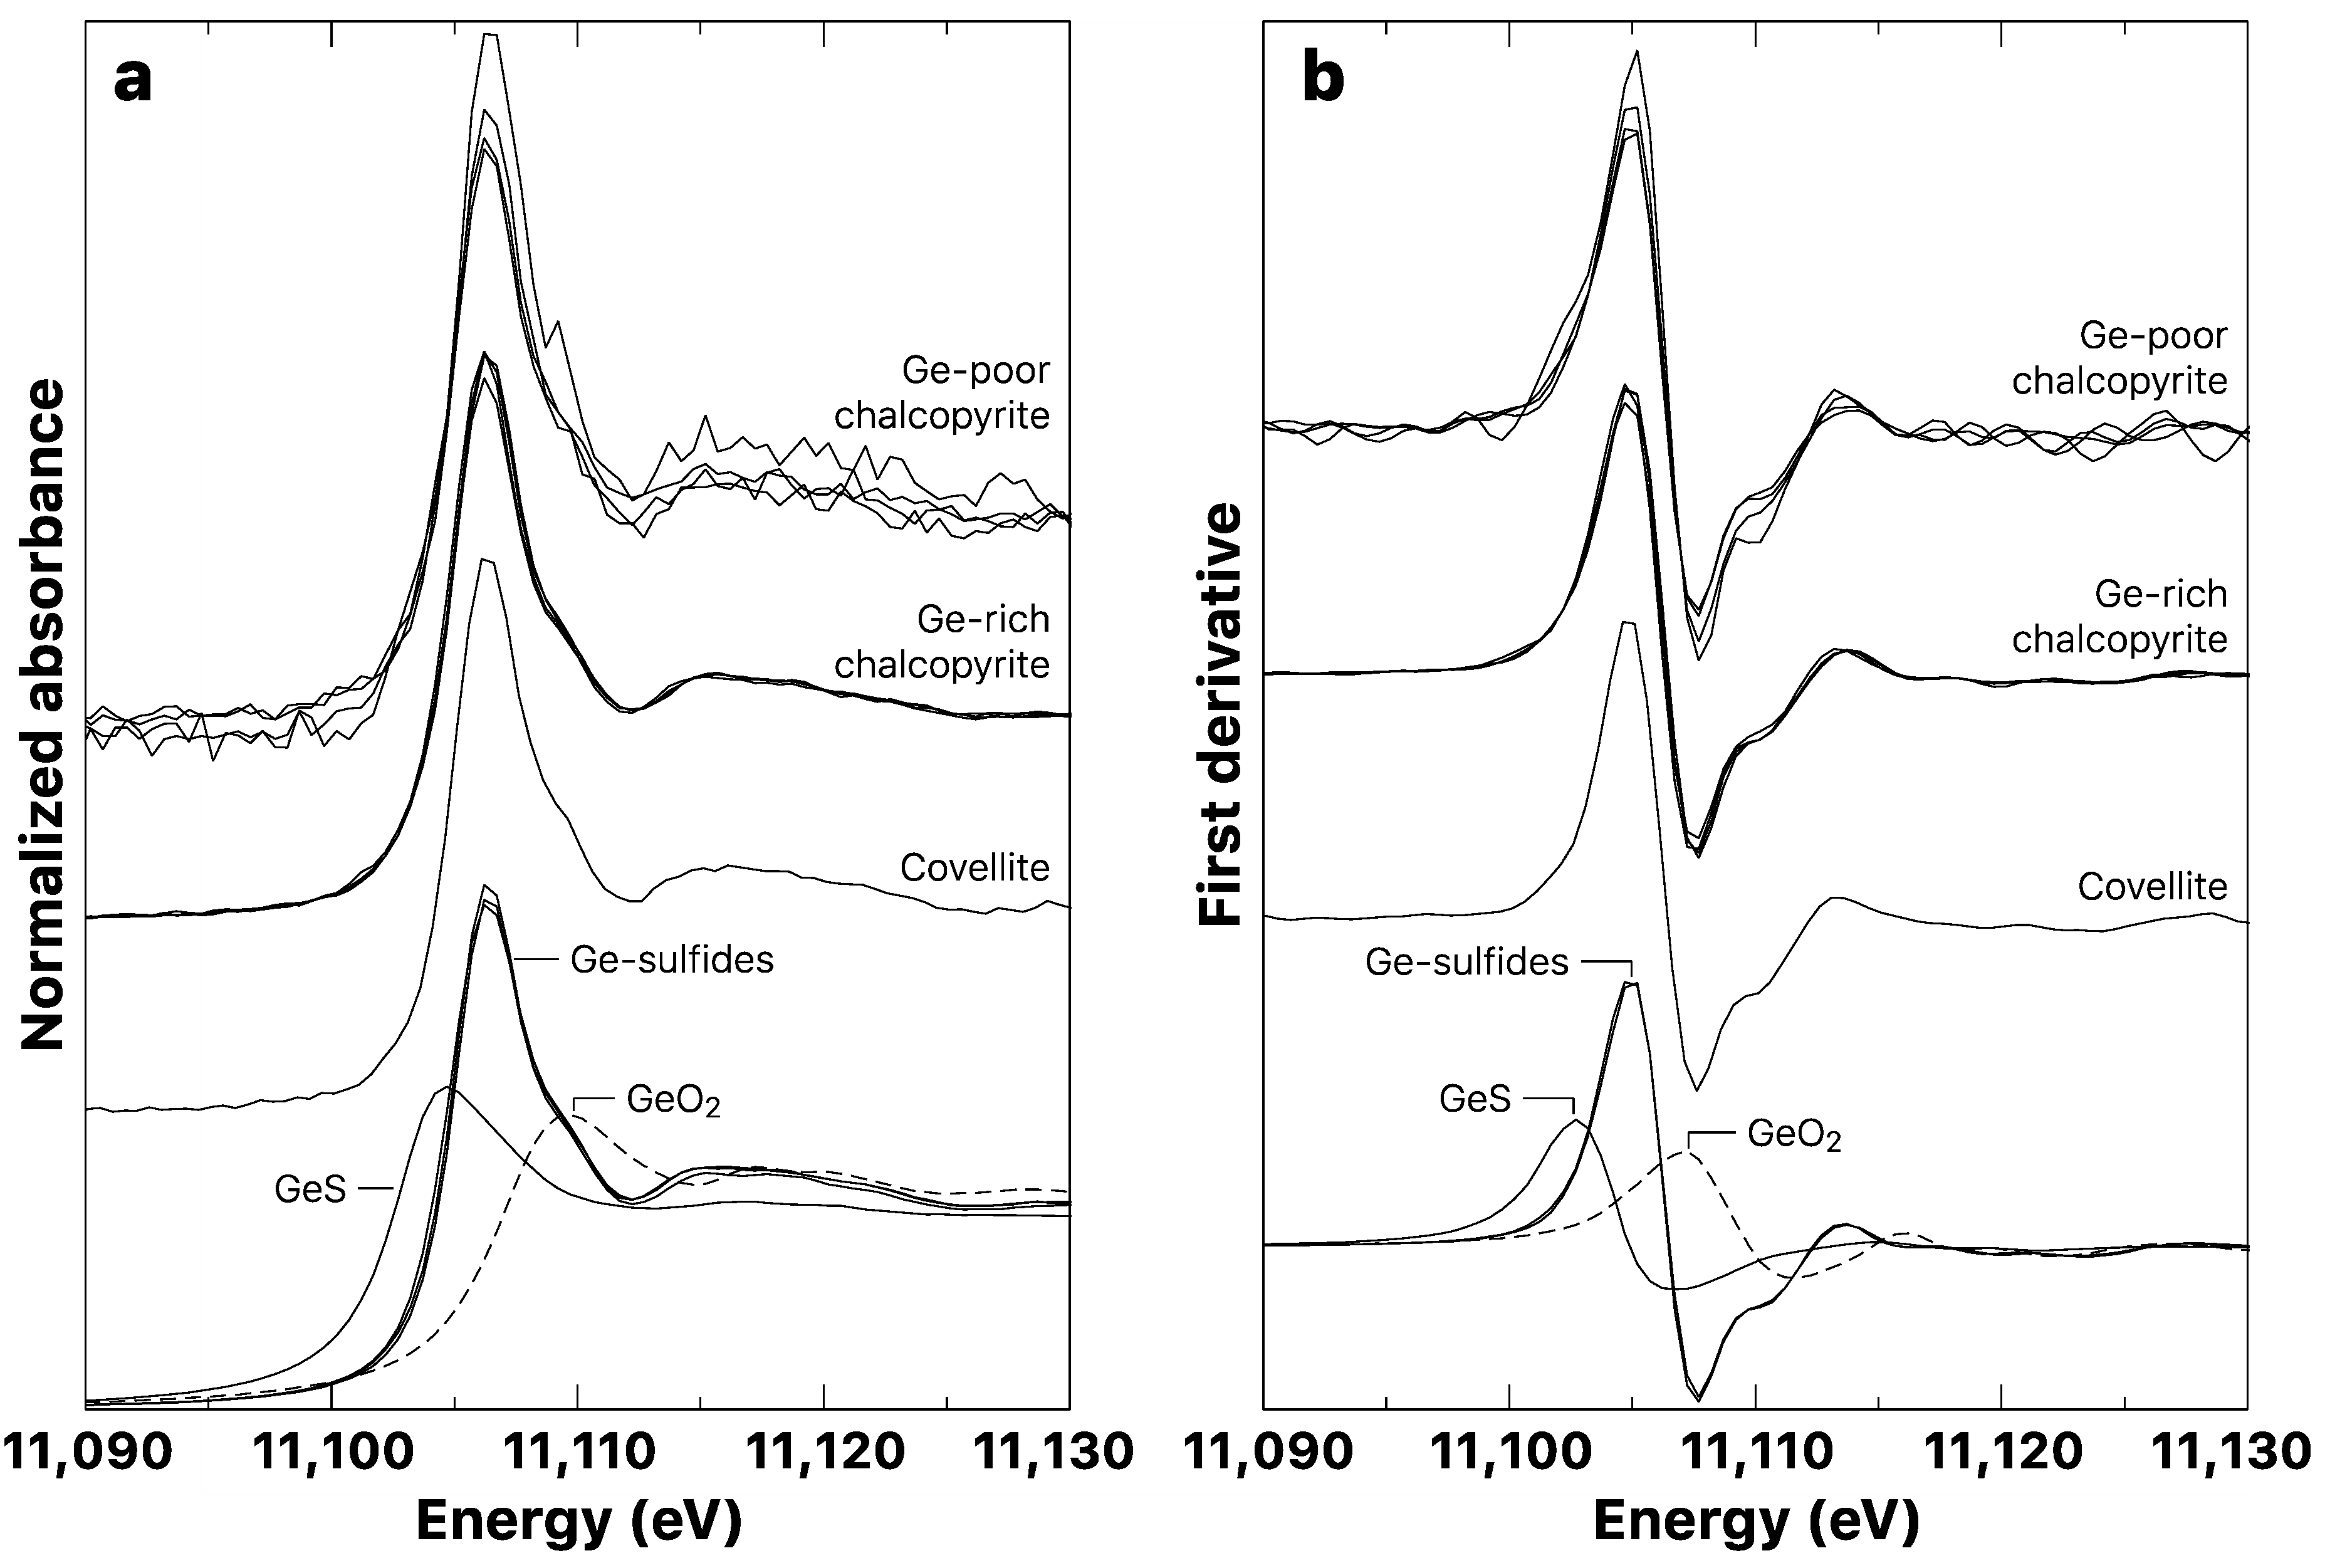
3.2. Germanium K-Edge XANES

Germanium K-edge XANES spectra for Ge-bearing model compounds and studied copper sulfides are shown in Figure 6a, while their respective first derivatives are shown in Figure 6b. For each spectrum, the edge feature energy position, i.e., the edge position, and the maximum of the white line are listed in Table 2.

3.2.1. Model Compounds

Ge4+-bearing sulfide model compounds (renierite, briartite, and germanite; labelled “Ge-sulfides”) all show similar XANES spectra, with an average edge position of 11,105.0 ± 0.1 eV, a steep white line (1s → 4p transitions) of similar height (at 11,106.4 eV), and post-edge features, which represent transitions towards p-like partially filled states and multiple scattering resonances. Germanium monosulfide (GeS)–Ge2+-bearing standard exhibits less-intense post-edge features, together with an absorption edge at 11,102.8 eV—i.e., shifted ~2.2 eV below Ge4+-bearing compounds. On the other hand, the Ge4+-bearing oxide–GeO2 displays a K-edge position at 11,107.1 eV, which is ~2.1 eV above the absorption edges of the Ge4+-bearing sulfides. This is fully consistent with the shift in energy derived from ab initio XANES calculations presented in our previous study [17]. Such a shift towards higher energy primarily originates from the strong difference in bond nature and length between Ge–S and Ge–O (approximately 2.27 and 1.75 Å, respectively; [29]), as well as from the difference in coordination symmetry, to a lesser extent. The shorter/stronger Ge–O bond increases the core electron binding energy and, likewise, the onset of the absorption edge.

3.2.2. Copper Sulfide Samples

The covellite spectrum is very similar to those of the Ge4+-bearing sulfides, with an edge position located at 11,104.9 eV and analogous post-edge features, which is compatible with our previous study [17] taking into account the 3.9 eV relative calibration difference (see Section 2.2 “Synchrotron Data Collection and Processing”). Chalcopyrite spectra are all highly similar to each other, either in Ge-rich or Ge-poor spots. Both Ge-rich and Ge-poor spectra show an average edge position at 11,105.0 ± 0.1 eV, such that no significant difference is observed compared with that for the Ge4+-sulfides model compounds. This suggests that only tetravalent Ge is present in chalcopyrite regardless of the Ge concentration and chemical patterning. Post-edge features for chalcopyrite and Ge4+ compounds are also identical in all respects up to at least 150 eV above the absorption edge, which indicates very similar coordination environments, i.e., tetrahedral coordination. This is consistent with previous XANES spectra collected for sample 2BARR5 from Barrigão [17].

4. Discussion

Our multivariate statistics applied to X-ray fluorescence data (Figure 5) show that As and Ge unlikely substitute for Cu in chalcopyrite. Moreover, LA-ICP-MS data for chalcopyrite from Barrigão and Kipushi indicate a strong anti-correlation in the sum of the trace elements (i.e., Ge, Ga, Sn, As, and Sb) with Fe, suggesting that these elements integrate at the Fe site [20]. In addition, our results derived from XANES spectroscopy (Figure 6) demonstrate that only tetravalent Ge enters the crystal structure of chalcopyrite and covellite at tetrahedral sites, thus substituting for Cu in this latter structure. Neither the Ge content nor the chemical configuration appear to affect Ge speciation.
Based on the copper 2p XPS (X-ray photoelectron spectroscopy) and Cu LIII-edge XANES, previous studies have demonstrated that chalcopyrite and covellite contain solely Cu+ [30,31]. Moreover, Fe 2p XPS and Fe LIII-edge XANES confirm that iron in chalcopyrite only occurs as Fe3+ [30,32]. Accordingly, the incorporation of non-trivalent elements in chalcopyrite entails that coupled substitutions and/or the presence of lattice vacancies are required to accommodate charge balance. Particularly, charge balancing related to Ge4+ uptake can be achieved through coupled substitutions with monovalent elements, e.g., 3Fe3+ ⟷ 2Ge4+ + Cu+, divalent elements, e.g., 2Fe3+ ⟷ Ge4+ + Zn2+, or through unfilled Cu sites, e.g., Fe3+ + Cu+ ⟷ Ge4+ + ◻ (◻ denotes a lattice vacancy). Therefore, by integrating these simple mechanisms, we can depict a broad co-substitution mechanism as:
(2x + 3y + z)Fe3+ + zCu+ ⟷ (x + 2y + z)M4+ + xM2+ + yM+ + z
where M4+ is Ge4+ or Sn4+; M2+ is Zn2+, Pb2+ or Cd2+; M+ is Cu+, Ag+ (M4+, M2+, and M+ substitute in the Fe site); and ◻ is a lattice vacancy at the Cu site. Similar to sphalerite, such a set of co-substitutions moves the chalcopyrite composition towards a stannite group phase, such as briartite (Cu2(Zn,Fe)GeS4). Similarly, Bernstein [33] suggested that the coupled substitution, i.e., As5+ + Cu+ ⟷ Ge4+ + Zn2+, modifies the composition of enargite (Cu3AsS4) towards the renierite join Cu10ZnGe2Fe4S16–Cu11GeAsFe4S16.
Two structural positions exist for copper in covellite: The tetrahedral and triangular coordination geometries with S atoms [34,35]. The Ge K-edge spectrum collected for covellite suggests that Ge4+ substitutes for Cu+ only in four-fold coordination geometry (i.e., in the tetrahedral site). Then, in such a case, the only way to accommodate the charge balance is through the occurrence of a large number of lattice vacancies, such as 4Cu+ ⟷ Ge4+ + 3◻, which may trigger a significant shift in crystal lattice parameters. However, we cannot ignore the possibility that small inclusions of Ge-sulfides occur in covellite, which could not be detected by the scope of our instruments.
Divalent Ge is not likely to occur in tetrahedral coordination with S ligands, but rather, it forms a trigonal-pyramidal or distorted octahedral-like coordination, such as in SnS and GeS, respectively [33]. Bonnet et al. [36] reported the presence of Ge2+ in tetrahedral coordination in sphalerite from Mississipi Valley type (MVT) deposits of Central Tennessee, USA. The formation conditions related to Ge2+ in sphalerite, as controlled by differences in fS2 and fO2, however, remain somewhat unclear. In addition to the present study, both of the studies on Ge in Ge-rich sphalerite from the Très Marias (Mexico) [16] and Saint-Salvy (France) [17] deposits conclude that only Ge4+ substitutes for tetrahedrally-coordinated Zn and no further evidence was found to support the presence of Ge2+ in sulfide minerals. Redox variations appear to not be sufficiently large enough to form Ge2+ species in the Ge geochemical cycle since Ge4+ is also the prevalent oxidation state found in most Ge sources (e.g., silicate minerals or organic-rich sediments [28]) and aqueous Ge species (e.g., Ge(OH)0, [37]). Even small-scale processes that occur during ore formation, such as crystal-fluid partitioning and crystal-chemical zoning or isotope fractionation [17], are unrelated to Ge redox effects.

5. Conclusions

Studies on the speciation and incorporation mechanisms of Ge in Cu-bearing sulfide minerals based on synchrotron µ-XRF chemical mapping combined with Ge K-edge µ-XANES spectroscopy have yielded the following conclusions:
  • Spectroscopic analysis supports the occurrence of tetrahedrally-coordinated Ge4+ in chalcopyrite, without any significant correlation with zoning patterns based on analyses of (i) a zoned Ge-rich chalcopyrite from the Barrigão Cu deposit (Iberian pyrite belt, Portugal) and (ii) a homogeneous chalcopyrite from the Kipushi polymetallic deposit (Central African copperbelt, D.R. Congo).
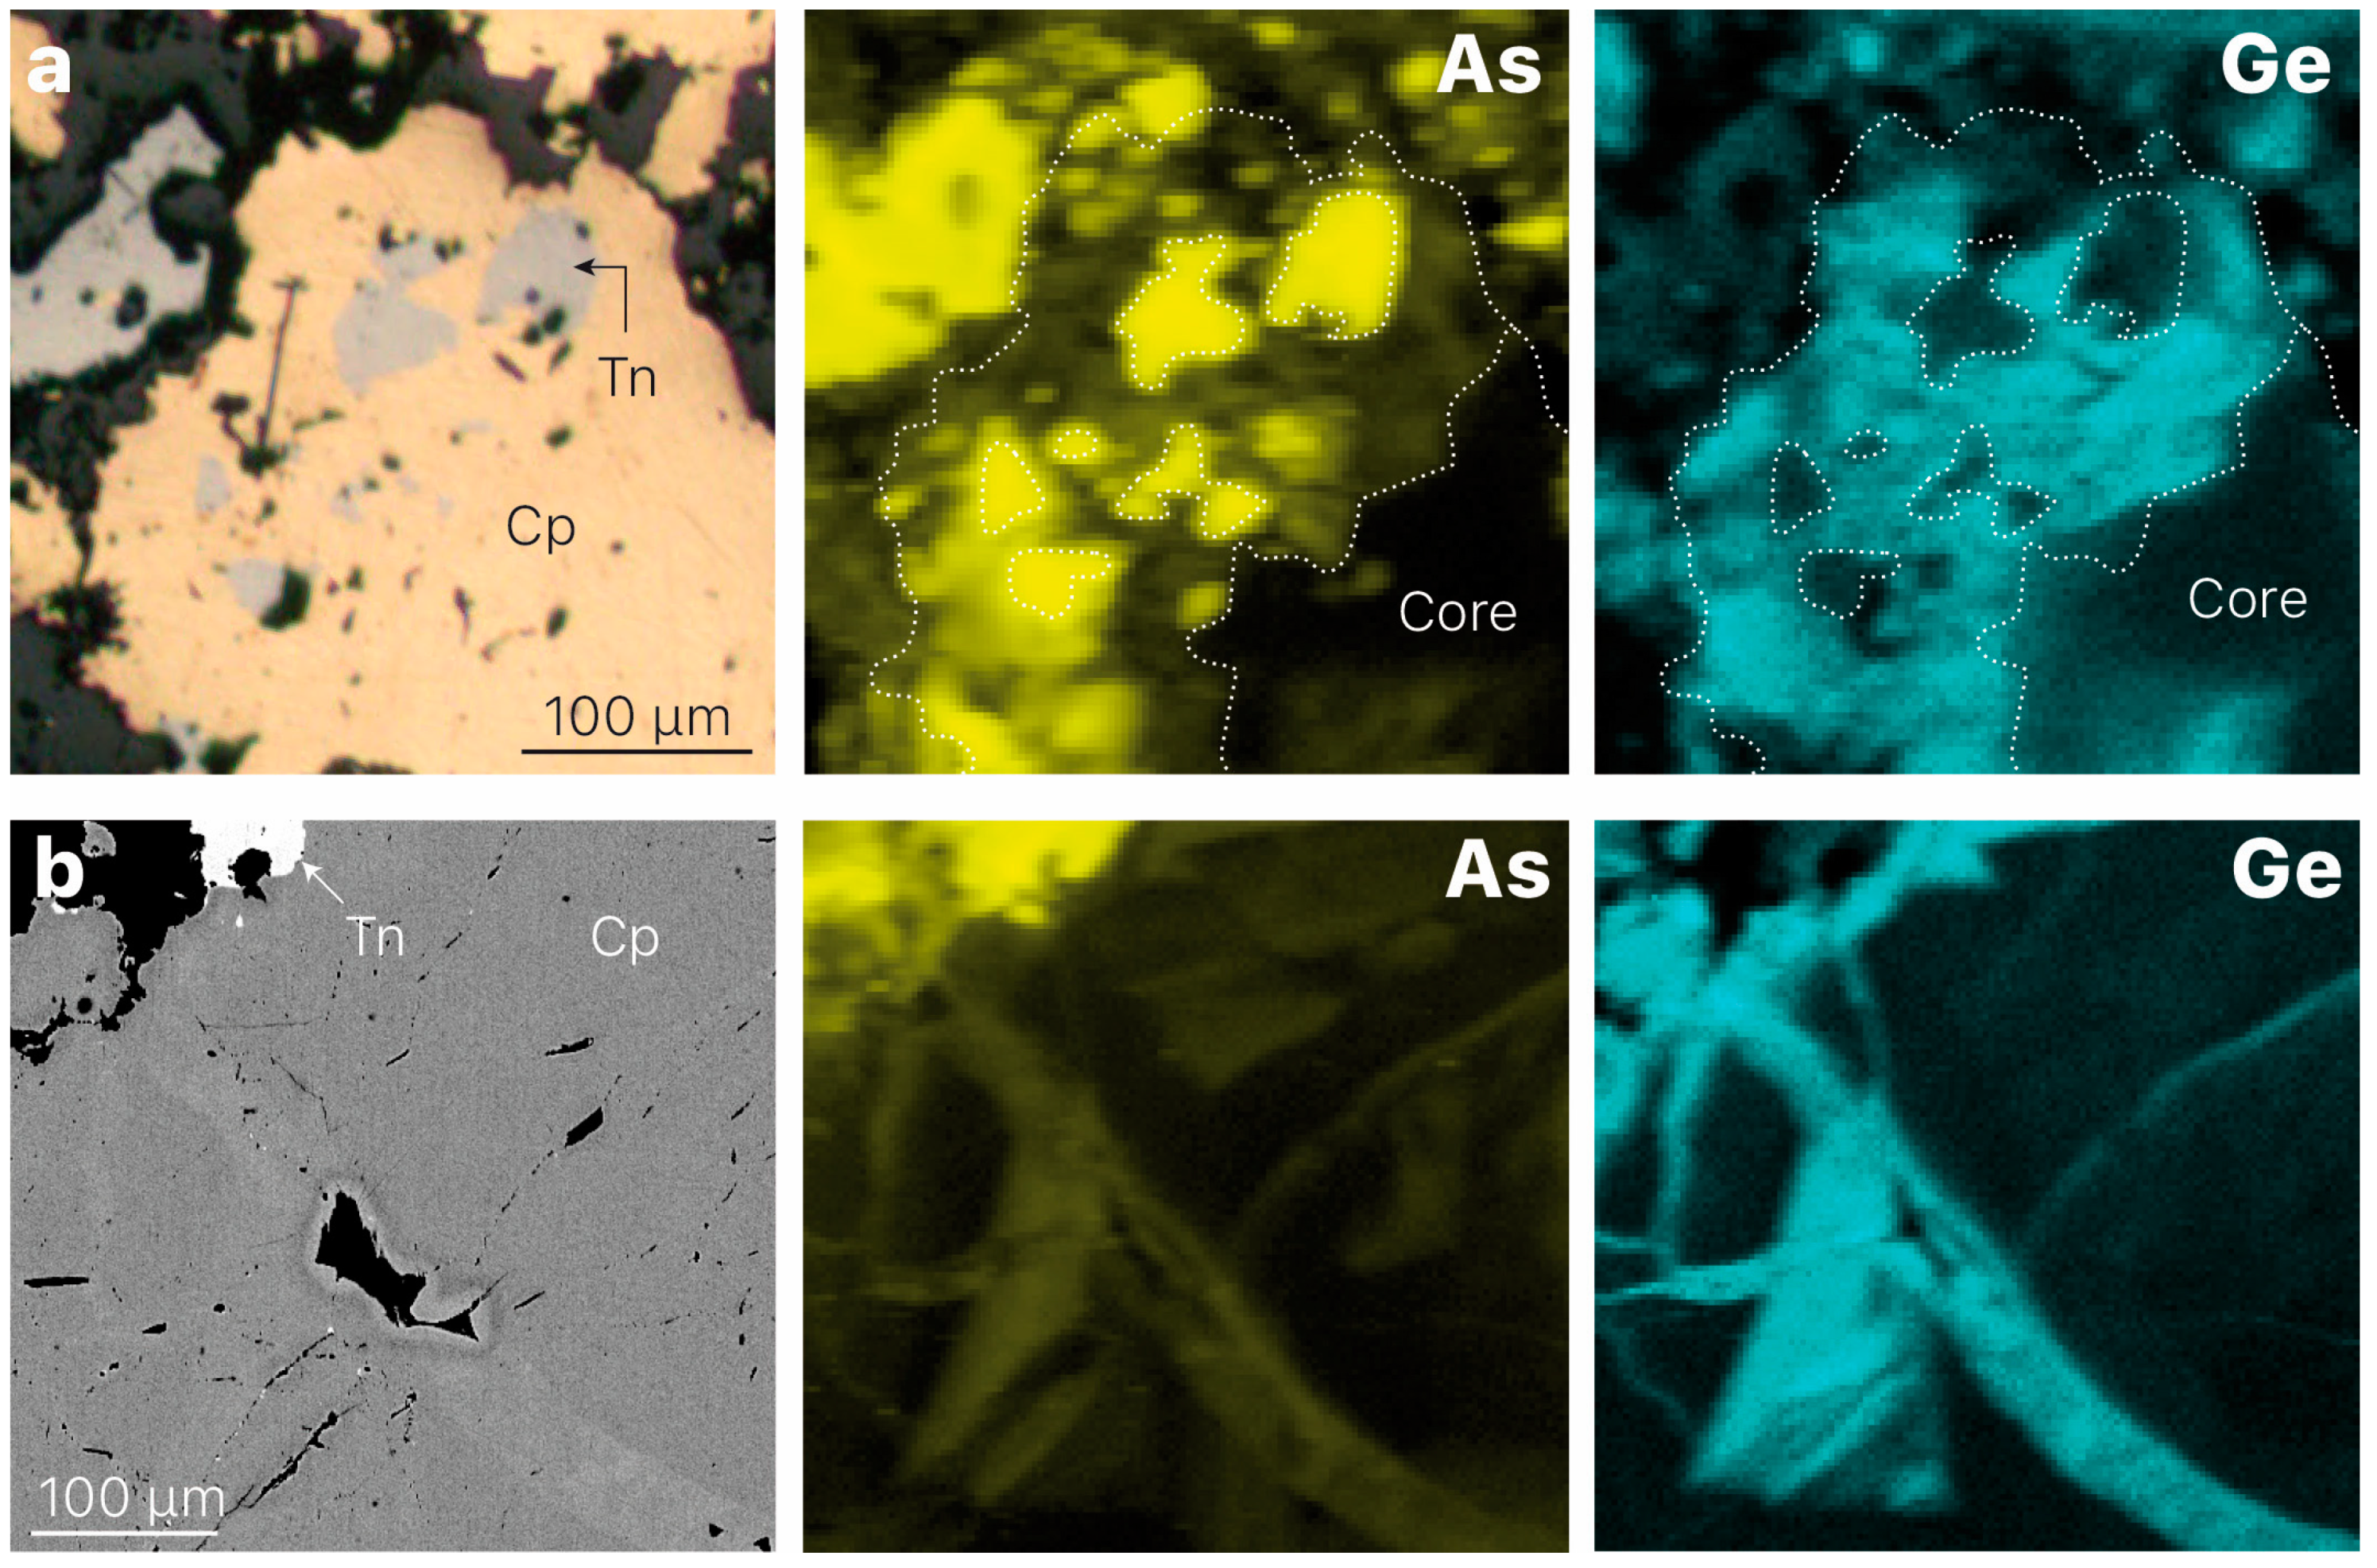
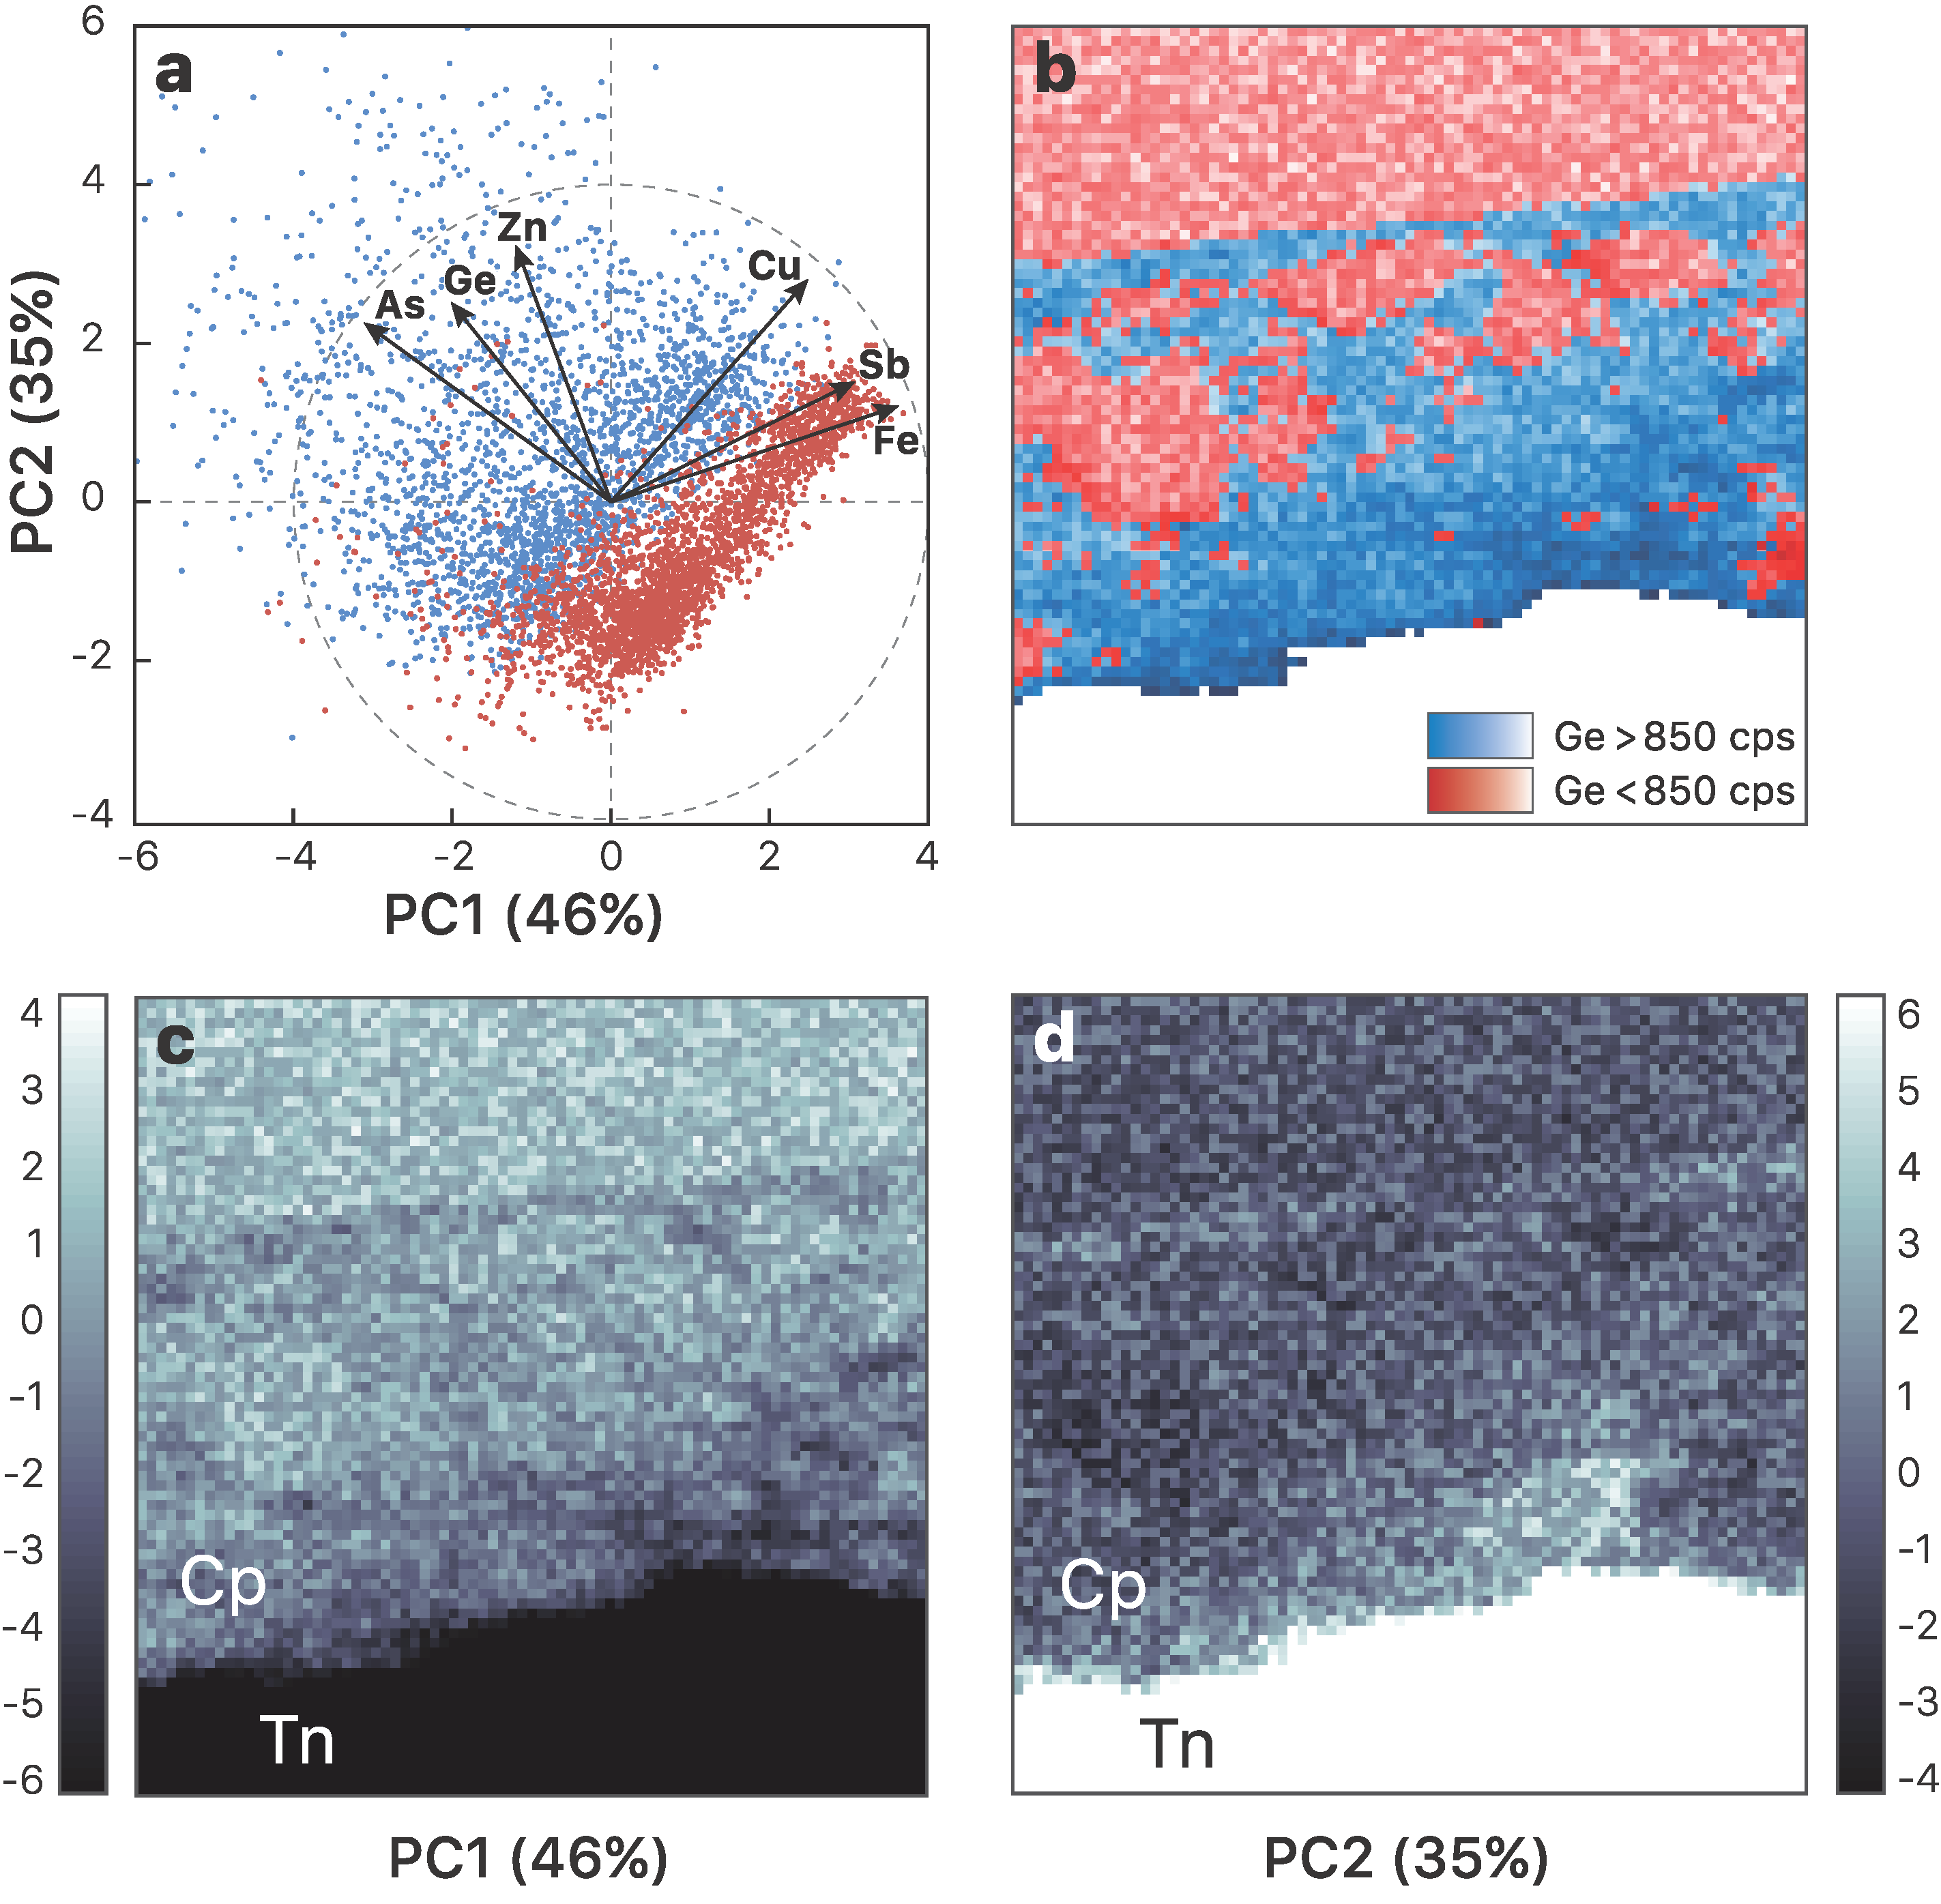
  • Germanium enrichment can occur through late-stage reworking/remobilization in sulfide-bearing deposits. Based on the distribution of germanium from XRF chemical maps of zoned chalcopyrite from Barrigao, the Ge-rich zones appear to be superimposed on a primary Ge-poor chalcopyrite. These observations suggest the existence of two stages of Ge enrichment, of which the latter stage contains fractures that have the highest Ge concentrations.
  • Incorporation mechanisms of Ge in Cu-bearing sulfides are proposed based on principal component analysis using the µ-XRF chemical maps. Although the presence of lattice vacancies cannot be completely excluded, we demonstrate that Ge4+ incorporates chalcopyrite through the Fe site via coupled substitutions with the following form: (2x + 3y)Fe3+ ⟷ (x + 2y)(Ge,Sn)4+ + x(Zn,Pb)2+ + y(Cu,Ag)+.
  • Ge4+ is shown to be the prevalent oxidation state found in most Ge sulfide minerals (i.e., sphalerite and Cu-sulfides), suggesting that variations in the redox conditions during the Ge geochemical cycle are small enough to prevent any changes in the Ge oxidation state.
Finally, this study emphasizes the highly chalcophile behavior of Ge in various sulfide-rich environments, as underlined by its ability to be incorporated in a large array of common sulfide minerals with sphalerite-like structures.

Author Contributions

R.B. selected the samples and areas of interests for analyses. R.B., M.M., M.-C.B., and B.L. performed the X-ray absorption analyses and interpreted the data. R.B. wrote the manuscript together with M.M., M.-C.B., and B.L. O.M. provided technical support for experiments on the beam line BM 23 at European Synchrotron Radiation Facility (ESRF).

Funding

This research was funded by the French National Research Agency through the “Investissements d’avenir” national research program (ANR-10-LABX-21–LABEX RESSOURCES21), the Lorraine Region, the Observatoire Terre Environnement Lorraine (OTELo), and the INSU-CESSUR (CNRS) program.

Acknowledgments

This work was possible thanks to the ESRF facilities (Project ES305, BM23 beamline). The authors thank P. Muchez (KU Leuven, Belgium) and D. Oliveira (LNEG, Lisbon, Portugal) for the Kipushi and Barrigão samples, as well as M. Cathelineau (GeoRessources, Nancy) for the germanite sample. J. Davenport is warmly thanked for his careful English editing of the manuscript. Two anonymous reviewers, and associated editor are thanked for their helpful comments. This is CRPG-CNRS contribution n°2700.

Conflicts of Interest

The authors declare no conflict of interest. The funding sponsors had no role in the design of the study; in the collection, analyses, or interpretation of data; in the writing of the manuscript, and in the decision to publish the results.

References

  1. Melcher, F.; Buchholz, P. Germanium. In Critical Metal Handbook; Gunn, G., Ed.; Wiley Online Library: Hoboken, NJ, USA, 2013; pp. 177–203. [Google Scholar]
  2. European Commission. Critical Raw Materials for the EU. Report of the Ad Hoc Working Group on Defining Critical Raw Materials; European Commission: Brussels, Belgium, 2014. [Google Scholar]
  3. Hu, Z.; Gao, S. Upper crustal abundances of trace elements: A revision and update. Chem. Geol. 2008, 253, 205–221. [Google Scholar] [CrossRef]
  4. Rouxel, O.J.; Luais, B. Germanium Isotope Geochemistry. Rev. Mineral. Geochem. 2017, 82, 601–656. [Google Scholar] [CrossRef]
  5. Escoube, R.; Rouxel, O.J.; Edwards, K.; Glazer, B.; Donard, O.F.X. Coupled Ge/Si and Ge isotope ratios as geochemical tracers of seafloor hydrothermal systems: Case studies at Loihi Seamount and East Pacific Rise 9°50′ N. Geochim. Cosmochim. Acta 2015, 167, 93–112. [Google Scholar] [CrossRef]
  6. Luais, B. Isotopic fractionation of germanium in iron meteorites: Significance for nebular condensation, core formation and impact processes. Earth Planet. Sci. Lett. 2007, 26, 21–36. [Google Scholar] [CrossRef]
  7. Luais, B. Germanium chemistry and MC-ICPMS isotopic measurements of Fe–Ni, Zn alloys and silicate matrices: Insights into deep Earth processes. Chem. Geol. 2012, 334, 295–311. [Google Scholar] [CrossRef]
  8. Escoube, R.; Rouxel, O.J.; Luais, B.; Ponzevera, E.; Donard, O.F.X. An Inter- comparison Study of the Germanium Isotope Composition of Geological Reference Materials. Geostand. Geoanal. Res. 2012, 36, 149–159. [Google Scholar] [CrossRef]
  9. Belissont, R.; Boiron, M.-C.; Luais, B.; Cathelineau, M. LA-ICP-MS analyses of minor and trace elements and bulk Ge isotopes in zoned Ge-rich sphalerites from the Noailhac–Saint-Salvy deposit (France): Insights into incorporation mechanisms and ore deposition processes. Geochim. Cosmochim. Acta 2014, 126, 518–540. [Google Scholar] [CrossRef]
  10. Meng, Y.M.; Qi, H.W.; Hu, R.Z. Determination of germanium isotopic compositions of sulfides by hydride generation MC-ICP-MS and its application to the Pb–Zn deposits in SW China. Ore Geol. Rev. 2015, 65, 1095–1109. [Google Scholar] [CrossRef]
  11. Cook, N.J.; Ciobanu, C.L.; Danyushevsky, L.V.; Gilbert, S. Minor and trace elements in bornite and associated Cu–(Fe)-sulfides: A LA-ICP-MS study. Geochim. Cosmochim. Acta 2011, 75, 6473–6496. [Google Scholar] [CrossRef]
  12. Reiser, F.K.M.; Rosa, D.R.N.; Pinto, Á.M.M.; Carvalho, J.R.S.; Matos, J.X.; Guimarães, F.M.G.; Alves, L.C.; de Oliveira, D.P.S. Mineralogy and geochemistry of tin- and germanium-bearing copper ore, Barrigão re-mobilized vein deposit, Iberian Pyrite Belt, Portugal. Int. Geol. Rev. 2011, 53, 1212–1238. [Google Scholar] [CrossRef]
  13. Heijlen, W.; Banks, D.A.; Muchez, P.; Stensgard, B.M.; Yardley, B. The nature of mineralizing fluids of the Kipushi Zn-Cu deposit, Katanga, Democratic Republic of Congo: Quantitative fluid inclusion analysis using laser ablation ICP-MS. Econ. Geol. 2008, 103, 1459–1482. [Google Scholar] [CrossRef]
  14. Höll, R.; Kling, M.; Schroll, E. Metallogenesis of germanium—A review. Ore Geol. Rev. 2007, 30, 145–180. [Google Scholar] [CrossRef]
  15. Schauble, E.A. Applying stable isotope fractionation theory to new systems. Rev. Mineral. Geochem. 2004, 55, 65–111. [Google Scholar] [CrossRef]
  16. Cook, N.; Etschmann, B.; Ciobanu, C.; Geraki, K.; Howard, D.; Williams, T.; Rae, N.; Pring, A.; Chen, G.; Johannessen, B.; et al. Distribution and Substitution Mechanism of Ge in a Ge-(Fe)-Bearing Sphalerite. Minerals 2015, 5, 117–132. [Google Scholar] [CrossRef] [Green Version]
  17. Belissont, R.; Muñoz, M.; Boiron, M.-C.; Luais, B.; Mathon, O. Distribution and oxidation state of Ge, Cu and Fe in sphalerite by µ-XRF and K-edge µ-XANES: Insights into Ge incorporation, partitioning and isotopic fractionation. Geochim. Cosmochim. Acta 2016, 177, 298–314. [Google Scholar] [CrossRef]
  18. Muñoz, M.; De Andrade, V.; Vidal, O.; Lewin, E.; Pascarelli, S.; Susini, J. Redox and speciation micromapping using dispersive X-ray absorption spectroscopy: Application to iron in chlorite mineral of a metamorphic rock thin section. Geochem. Geophys. Geosyst. 2006, 7, 1–10. [Google Scholar] [CrossRef]
  19. Bernstein, L.R.; Waychunas, G.A. Germanium crystal chemistry in hematite and goethite from the Apex Mine, Utah, and some new data on germanium in aqueous solution and in stottite. Geochim. Cosmochim. Acta 1987, 51, 623–630. [Google Scholar] [CrossRef]
  20. Belissont, R. Germanium and Related Elements in Sulfide Minerals: Crystal Chemistry, Incorporation and Isotope Fractionation. Ph.D. Thesis, Université de Lorraine, Nancy, France, 2016; 238p. [Google Scholar]
  21. Vaughan, D.J.; Craig, J.R. Mineral Chemistry of Metal Sulfides; Cambridge Earth Science Series; Cambridge University Press: Cambridge, UK, 1978. [Google Scholar]
  22. Bernstein, L.R. Renierite, Cu10ZnGe2Fe4S16-Cu11GeAsFe4S16: A coupled solid solution series. Am. Mineral. 1986, 71, 210–221. [Google Scholar]
  23. Imbert, P.; Varret, F.; Wintenberger, M. Etude par effet Mössbauer de la briartite (Cu2FeGeS4). J. Phys. Chem. Sol. 1973, 34, 1675–1682. [Google Scholar] [CrossRef]
  24. Wiedemeier, H.; Schnering, H.G. Refinement of the structures of GeS, GeSe, SnS and SnSe. Z. Kristallogr. 1978, 148, 295–303. [Google Scholar] [CrossRef]
  25. Smith, G.S.; Isaacs, P.B. The crystal structure of quartz-like GeO2. Acta Crystallogr. 1964, 17, 842–846. [Google Scholar] [CrossRef]
  26. Solé, V.A.; Papillon, E.; Cotte, M.; Walter, P.; Susini, J. A multiplatform code for the analysis of energy-dispersive X-ray fluorescence spectra. Spectrochim. Acta Part B Atomic Spectrosc. 2007, 62, 63–68. [Google Scholar] [CrossRef]
  27. Muñoz, M.; Vidal, O.; Marcaillou, C.; Pascarelli, S.; Mathon, O.; Farges, F. Iron oxidation state in phyllosilicate single crystals using Fe-K pre-edge and XANES spectroscopy: Effects of the linear polarization of the synchrotron X-ray beam. Am. Mineral. 2013, 98, 1187–1197. [Google Scholar] [CrossRef]
  28. Ravel, B.; Newville, M. ATHENA, ARTEMIS, HEPHAESTUS: Data analysis for X-ray absorption spectroscopy using IFEFFIT. J. Synchrotron Radiat. 2005, 12, 537–541. [Google Scholar] [CrossRef]
  29. Li, X.; Zhao, H.; Tang, M.; Liu, Y. Theoretical prediction for several important equilibrium Ge isotope fractionation factors and geological implications. Earth Planet. Sci. Lett. 2009, 287, 1–11. [Google Scholar] [CrossRef]
  30. Goh, S.W.; Buckley, A.N.; Lamb, R.N.; Rosenberg, R.A.; Moran, D. The oxidation states of copper and iron in mineral sulfides, and the oxides formed on initial exposure of chalcopyrite and bornite to air. Geochim. Cosmochim. Acta 2006, 70, 2210–2228. [Google Scholar] [CrossRef]
  31. Goh, S.W.; Buckley, A.N.; Lamb, R.N. Copper(II) sulfide? Miner. Eng. 2006, 19, 204–208. [Google Scholar] [CrossRef]
  32. Pearce, C.I.; Pattrick, R.A.D.; Vaughan, D.J.; Henderson, C.; Van Der Laan, G. Copper oxidation state in chalcopyrite: Mixed Cu d9 and d10 characteristics. Geochim. Cosmochim. Acta 2006, 70, 4635–4642. [Google Scholar] [CrossRef]
  33. Bernstein, L.R. Germanium geochemistry and mineralogy. Geochim. Cosmochim. Acta 1985, 49, 2409–2422. [Google Scholar] [CrossRef]
  34. Evans, H.T.; Konnert, J.A. Crystal structure refinement of covellite. Am. Mineral. 1976, 61, 996–1000. [Google Scholar]
  35. Tagirov, B.R.; Trigub, A.L.; Kvashnina, K.O.; Shiryaev, A.A.; Chareev, D.A.; Nickolsky, S.; Abramova, V.D.; Kovalchuk, E.V. Covellite CuS as a matrix for ‘‘invisible” gold: X-ray spectroscopic study of the chemical state of Cu and Au in synthetic minerals. Geochim. Cosmochim. Acta 2016, 191, 58–69. [Google Scholar] [CrossRef]
  36. Bonnet, J.; Cauzid, J.; Testemale, D.; Kieffer, I.; Proux, O.; Lecomte, A.; Bailly, L. Characterization of Germanium Speciation in Sphalerite (ZnS) from Central and Eastern Tennessee, USA, by X-ray Absorption Spectroscopy. Minerals 2017, 7, 79. [Google Scholar] [CrossRef]
  37. Wood, S.A.; Samson, I.M. The aqueous geochemistry of gallium, germanium, indium and scandium. Ore Geol. Rev. 2006, 28, 57–102. [Google Scholar] [CrossRef]
Figure 1. A comparison of the crystal structures of sphalerite (cubic, space group F-43m) and chalcopyrite (tetragonal, space group I-42d). Sphalerite is a major host for Ge in many Zn–Pb deposits and Ge4+ substitutes for Zn2+ at tetrahedral sites. Sphalerite and chalcopyrite share similar diamond-like structures and the trigonal unit of chalcopyrite can be observed as two vertically stacked cubic units (highlighted by the dotted lines). Color legend: S—yellow, Zn—grey, Cu—blue, Fe—brown.
Minerals 09 00227 g001
Figure 2. Reflected-light microphotograph of sample U48 from Kipushi (top-left) and corresponding X-ray fluorescence (XRF) chemical maps at 500 × 500 µm2, with a step size of 10 µm for Cu, Fe, As (log-scaled), Ge, and Sb, which consist of tennantite (Tn), chalcopyrite (Cp), bornite (Bn), and galena (Gn). Concentrations indicated in Cp (laser ablation hole) were obtained via LA-ICP-MS analysis.
Minerals 09 00227 g002
Figure 3. Backscattered electron image (left) and corresponding XRF chemical maps of As (log-scaled) and Ge in sample BARR1 from Barrigão (800 × 800 µm2, step size = 10 µm) showing a fracture through a large chalcopyrite (Cp) grain, filled with tennantite (Tn) at the center, and surrounded by a Ge-rich damage zone in the chalcopyrite grains (Cp*). Inset 1 corresponds to the backscattered electron (BSE) image on the left. Inset 2 displays a detailed map of the fractured zone (200 × 200 µm2; step size = 2.5 µm) showing Ge concentrations mainly located at the grain boundaries.
Minerals 09 00227 g003
Figure 4. (a) Microphotograph (left) and corresponding XRF intensity maps of As (log-scaled) and Ge in sample BARR3 (330 × 330 µm2; step size = 3 µm). Ge in chalcopyrite is well correlated with As in chalcopyrite and Ge-rich zones that surround the tennantite inclusions. (b) Backscattered electron image (left) and corresponding XRF chemical maps of As (log-scaled) and Ge in sample BARR8 (400 × 400 µm2; step size = 3 µm) showing vein-like Ge-rich zones in chalcopyrite (Cp). Tn denotes tennantite.
Minerals 09 00227 g004
Figure 5. Principal component analysis (PCA) of XRF chemical maps (intensities of X-ray fluorescence lines) within chalcopyrite in the 200 × 200 µm2 map obtained for sample BARR1 (i.e., inset 2 in Figure 3). (a) Bi-plot of scores and loadings projected onto PC1 versus PC2, which yield 81% of the total variance (tennantite is not included in the PCA). Note the clear separation between Ge–As-rich pixels (Ge > 850 cps, blue dots) and Ge–As-poor pixels (Ge < 850 cps, red dots). (b) Corresponding regions on the XRF map (PC1 intensity). (c,d) Intensity maps of PC1 and PC2 (respectively). Cp—chalcopyrite, Tn—tennantite.
Minerals 09 00227 g005
Figure 6. Germanium K-edge X-ray absorption near-edge structures (XANES) normalized spectra (a) and first derivatives (b). Model compounds at the bottom include GeS (Ge2+), GeO2 (Ge4+ bonds to O), and Ge4+-bearing sulfides, i.e., renierite and briartite from Kipushi and germanite (powder pellet and polished section) from Tsumeb. Studied samples include µ-XANES spectra in covellite from Kipushi and chalcopyrite spots of low (hundreds of μg/g) and high Ge contents (thousands of μg/g) from Barrigão and Kipushi (low Ge contents only).
Minerals 09 00227 g006
Table 1. Origin and composition of analyzed reference compounds and samples of known Ge crystal chemical state.
MineralFormulaSampleGe Content 1CN 2StateOriginReference
Model Compounds wt. %
GermaniteCu13Fe2Ge2S16TSU16.0–11.14Ge4+Tsumeb[21]
RenieriteCu10ZnGe2Fe4S16K22087.8–9.04Ge4+Kipushi[22]
BriartiteCu2(Zn,Fe)GeS4P71716.64Ge4+Kipushi[23]
GeSGeSGeS69.36(3 + 2)Ge4+Synthetic[24]
GeO2GeO2 (quartz-like)GeO269.416Ge4+Synthetic[25]
Samples μg/g
ChalcopyriteCuFeS2BARR1/3/896–6260uknuknBarrigão[20]
ChalcopyriteCuFeS2U25, U48180–647uknuknKipushi[20]
Tennantite 3(Cu,Fe)12(As,Sb)4S13BARR1/3/81–70uknuknBarrigão[20]
BorniteCu5FeS4-2–14uknuknKipushi[20]
CovelliteCuSP7172500–3500uknuknKipushi[20]
1 determined by electron probe micro analysis (EPMA) (wt. %) or laser ablation inductively coupled plasma mass spectrometry (LA-ICP-MS) (μg/g) using the analytical setup reported in Belissont et al. [9]; 2 coordination number; 3 tennantite-tetrahedrite series; ukn: unknown; bdl: below detection limit.
Table 2. Ge K-edge feature positions for model compounds and samples. Edge energy positions (i.e., inflection point) were assigned visually as the root of the second derivative spectra. White lines were determined through Athena’s fine grid interpolation process.
Spectral Feature Position (eV) 2
MineralSampleGe Content 1Edge EnergyWhite Line
Model Compounds
GeSGeS69.35 wt. %11,102.811,104.7
GeO2GeO269.39 wt. %11,107.111,109.6
Ge4+-sulfides----
GermaniteTSU16.0–11.1 wt. %11,105.011,106.4
RenieriteK22087.8–9.0 wt. %11,105.111,106.4
BriartiteP71716.6 wt. %11,104.811,106.3
Samples
CovelliteP7170.25–0.35 wt. %11,104.911,106.3
Chalcopyrite----
Ge-richBARR8 (4)767–3150 µg/g11,105.011,106.3
Ge-poorBARR8 (2)174–395 µg/g11,105.211,106.3
-U25616–647 µg/g11,105.111,106.2
-U48180–323 µg/g11,105.011,106.3
1 determined by EPMA (wt. %) or LA-ICP-MS (μg/g) using the analytical setup of Belissont et al. [9]. For the samples, Ge contents are only indicative as the µ-XANES spot location may differ slightly from the EPMA/LA-ICP-MS spot location; 2 uncertainty due to merging and averaging is less than 0.2 eV; (n) gives the number of probed spots when n > 1.

