Article

Effect of Depressants and Temperature on Bastnaesite and Monazite Flotation Separation from a Canadian Rare Earth Element (REE) Ore

GMN—Department of Mining, Metallurgical and Materials Engineering, Université Laval, Quebec, QC G1V 0A6, Canada
*
Author to whom correspondence should be addressed.
Minerals 2019, 9(4), 225; https://doi.org/10.3390/min9040225
Submission received: 13 March 2019 / Revised: 5 April 2019 / Accepted: 8 April 2019 / Published: 10 April 2019
(This article belongs to the Special Issue Flotation Reagents)

Abstract

:
A full factorial experimental design was conducted to investigate the effect of temperature and depressants on the flotation of monazite and bastnaesite from carbonate gangue minerals. Temperature, sodium silicate, and guar gum dosage were examined. Mineral reconstruction from energy-dispersive x-ray fluorescence (EDXRF) data was performed to quantify bastnaesite, monazite, and gangue mineral recoveries. Bastnaesite and monazite both follow first-order rates of recovery, with bastnaesite recovering faster and to a larger extent than monazite. The main gangue minerals were depressed together. Optimal separation efficiency was achieved using a larger Na2SiO3 dosage (2400 g/t), no guar gum addition, and a high temperature (75 °C). The rate of bastnaesite recovery increased with the temperature, while sodium silicate improved the ultimate recovery. An economic analysis was performed to evaluate the impact of increasing Rare Earth Element (REE) recovery by allowing a lower grade concentrate to be generated. Despite the high value of REEs, increasing recovery by producing a concentrate bearing more than 68 wt % carbonaceous gangue was uneconomical.

1. Introduction

Bastnaesite CeFCO3 and monazite CePO4 are the main minerals exploited in the production of Rare Earth Elements (REEs) [1,2]. These minerals are usually recovered from ore using direct flotation, as is the case at the Bayan Obo and Weishan mines in China, and the Mount Weld mine in Australia [3]. Little distinction is made in the literature regarding the individual flotation behaviour of these minerals in assemblages. Flotation kinetics and the impact of depressants and temperature on gangue recovery are also seldom discussed. These aspects are important since many proposed REE projects intend to extract REE from deposits containing both bastnaesite and monazite [4].
One of the projects where REE are hosted in bastnaesite and monazite is the Niobec REE zone [5], which represents one of the world’s largest resources in tonnes of REE [6,7]. Being a carbonatite, the deposit bears similarities with other Canadian REE projects, including Montviel (Geomega Resources) and Ashram (Commerce Resources), both located in the province of Quebec, Canada. This article presents the results of flotation tests conducted on the Niobec REE ore using sodium silicate Na2SiO3 and guar gum as depressants at various operating temperatures. This study aims to improve performance assessment procedures for use in flotation experiments and to identify optimal operating conditions for the flotation separation of REE minerals from carbonate gangue minerals.
An increase in temperature has been known to improve the flotation kinetics of bastnaesite, thus improving separation efficiency [8]. However, the increase in operating costs associated with high slurry temperatures are an incentive for operators to look at strategies to operate flotation circuits for bastnaesite and monazite at room temperature [9].
This paper also examines the effects of depressants to assess if their use may allow acceptable flotation performance at room temperature. Sodium silicate is one of the most commonly used depressants in REE flotation [3,9,10,11,12], but the ideal dosage and potential interactions with temperature and other depressants are rarely discussed. Although guar gum is often used to depress naturally hydrophobic minerals, such as talc [13], guar gum has also been used in non-sulfide mineral flotation schemes for the depression of Fe minerals [14], although no information has been found regarding its application to REE minerals, hence the interest in testing this reagent.
Such an analysis implies examination of the behaviour of gangue and REE minerals, a subject that has rarely been discussed in recent publications [15,16]. The approach put forward here allows the quantitative evaluation of flotation performance for individual REE and gangue minerals making up the studied REE ore.

2. Materials and Methods

2.1. Sample Preparation and Grinding

1.5 kg bags of 100 wt % minus 10 mesh (−1.7 mm) crushed ore, representative of the Niobec REE zone, were mixed and separated in 2 kg batches using rotary splitting. Some of the prepared batches were sampled using a riffle splitter to produce a sample assayed using EDXRF (Epsilon 1, Malvern Panalytical Ltd., Royston, UK), and inductively-coupled plasma mass spectrometry (ICP-MS8800, Agilent Technologies, Santa Clara, CA, USA). Some feed samples were also submitted for quantitative evaluation of mineral phases by scanning electron microscope (QEMScan) at SGS Canada Mineral Laboratories in Lakefield (ON, Canada). The minerals identified by QEMScan are presented in Table 1.
The main REE bearing minerals are bastnaesite/synchisite (referred to as bastnaesite) and monazite with minor amounts of allanite (Ce,Ca,Y)2(Al,Fe3+)3(SiO4)3(OH). Bastnaesite and monazite account for roughly 57% and 42% of the REE content, respectively, with the balance reporting to allanite. Dolomite (Mg,Ca)CO3, ankerite Ca(Fe,Mg)(CO3)2 and calcite CaCO3 are the main gangue minerals, accounting respectively for 50 wt %, 14 wt % and 13 wt % of the ore. Electron Microprobe Analysis (EMPA) was conducted at Université Laval (Quebec, QC, Canada). This method involves firing an electron beam at particular mineral grains observed through a scanning electron microscope (SEM) and analyzing the emitted x-ray intensities at the wavelengths characteristic to certain elements. Results indicate that bastnaesite contains 0.8 ± 0.6 wt % Th, while monazite grains contain on average 1.4 wt % ± 0.4 Th. These two mineral phases are the main Th bearers.
Grinding was conducted on the 2 kg ore batches in a 178 mm × 356 mm laboratory rod-mill at 67 wt % solids for 25 min, using a 19.8 kg stainless steel rod charge. The d80 of the ground product was 37 µm. This slurry was filtered, dried, and the 2 kg batches were combined, homogenized, and split into 1 kg batches to be used for froth flotation testing. This approach decreased the fundamental errors associated with sampling for preparation of the flotation batches [17]. Validation tests (not published) were conducted to verify that the drying of the ground samples did not affect the flotation response compared to that of freshly ground ores.

2.2. Froth Flotation

Froth flotation was conducted in a standard 3 L stainless steel cell using a Denver D-12 flotation machine. The slurry was conditioned at 60 wt % solids. Tap water was added to bring the slurry solids fraction to 35 wt % for flotation. During conditioning and flotation, the slurry temperature was controlled using an electrical water heater. The pH was measured but not controlled.
Sodium silicate (Na2SiO3∙9H2O of modulus Na2O/SiO2 = 1) purchased from Fisher Scientific was dissolved in tap water to a concentration of 37.5 wt %. KP-4000 guar gum from Rantec was dissolved in tap water to a concentration of 0.5 wt %. The collector used was Florrea 7510, a benzohydroxamic acid typically used for tungsten-bearing mineral flotation [18], acquired from Flottec. The collector was prepared as a 2 wt % solution by stirring the solid hydroxamic acid in a 0.5 wt % NaOH aqueous solution heated to 50 °C. The frother, F-150, was supplied by Flottec.
The various steps, durations, and collector dosages used for the conditioning and flotation are presented in Table 2. Dosages refer to the mass in grams of undiluted reagent added to 1 tonne of ground ore sample (g/t). Frother was added 30 s prior to each roughing step. The total collector dosage was 1800 g/t.
Upon completion of a flotation test, the concentrates and the tailings left in the flotation cell were filtered, dried, sampled, and pressed as pellets for EDXRF analysis. A data reconciliation procedure was applied to ensure coherency with elemental mass conservation and to obtain the most reproducible estimates of the grades and recoveries to the concentrate [19].
The reconciled elemental assays were then converted into mineral compositions using the minerals/elements conversion matrix given in Table 3. Only the main gangue minerals and the REE minerals were considered for the mineral reconstruction. The chemical elements identified in the first row of Table 3 were measured by EDXRF and the measured concentrations were used to estimate the mineral concentrations using a method similar to the one described by Whiten [20]. The stoichiometric factors of the conversion matrix were either calculated (calcite and Fe-oxides), obtained from EMPA analyses of the studied ore (bastnaesite and monazite) or retrieved from mineral compositions given in the literature. For instance:
  • The initial composition of ankerite was taken from the Mineral Data website (http://webmineral.com/);
  • The 3.1 wt % Th value used for monazite is in accordance with the 3–9 wt % Th reported range of values [21], as opposed to the EMPA value of 1.4 wt %. Although the 1 wt % Th value for bastnaesite is larger than the reported range of 0–0.3 wt % Th [22], it is close to the EMPA value of 0.8 wt % Th.
  • Some compositions (underlined in Table 3) were calculated to ensure coherency with feed measured chemical assays, shown in Table 3.
The factorial plan used is a 23 full-factorial with a triplicate center point. The three factors considered are the sodium silicate dosage in g/t, the guar gum dosage in g/t, and the slurry temperature in °C. The 11 randomized test conditions used in the factorial design of experiments are given in Table 4. The three replicates at the centre of the factorial design, tests 1, 7, and 10, were used to assess the experimental reproducibility.

3. Results

3.1. Calculated Composition of the Flotation Test Feed

The composition of the flotation feed as calculated from the combination of flotation concentrate and tailings (left in the cell) sample assays is given on an elemental basis in Table 5 and as mineral fractions in Table 6. The reconciled assays are provided in a spreadsheet as supplementary material. The low variability of the elemental composition indicates that the preparation procedure generates reproducible feed material. The average feed mineral composition observed in Table 6 is close to that obtained through quantitative evaluation of minerals by scanning electron microscopy (QEMScan) quantitative mineralogy, which shows that the mineral compositions in Table 3 account for the elements present.
The phosphorus content shows the greatest relative standard deviation. This, along with the presence of P-bearing apatite, explains why the mineral reconciliation method uses Th content to discriminate between bastnaesite and monazite; the use of P induces a large degree of variability. Test 5 composition deviates from the others, and its results should be treated carefully.

3.2. Time-Recovery and Grade-Recovery Curves

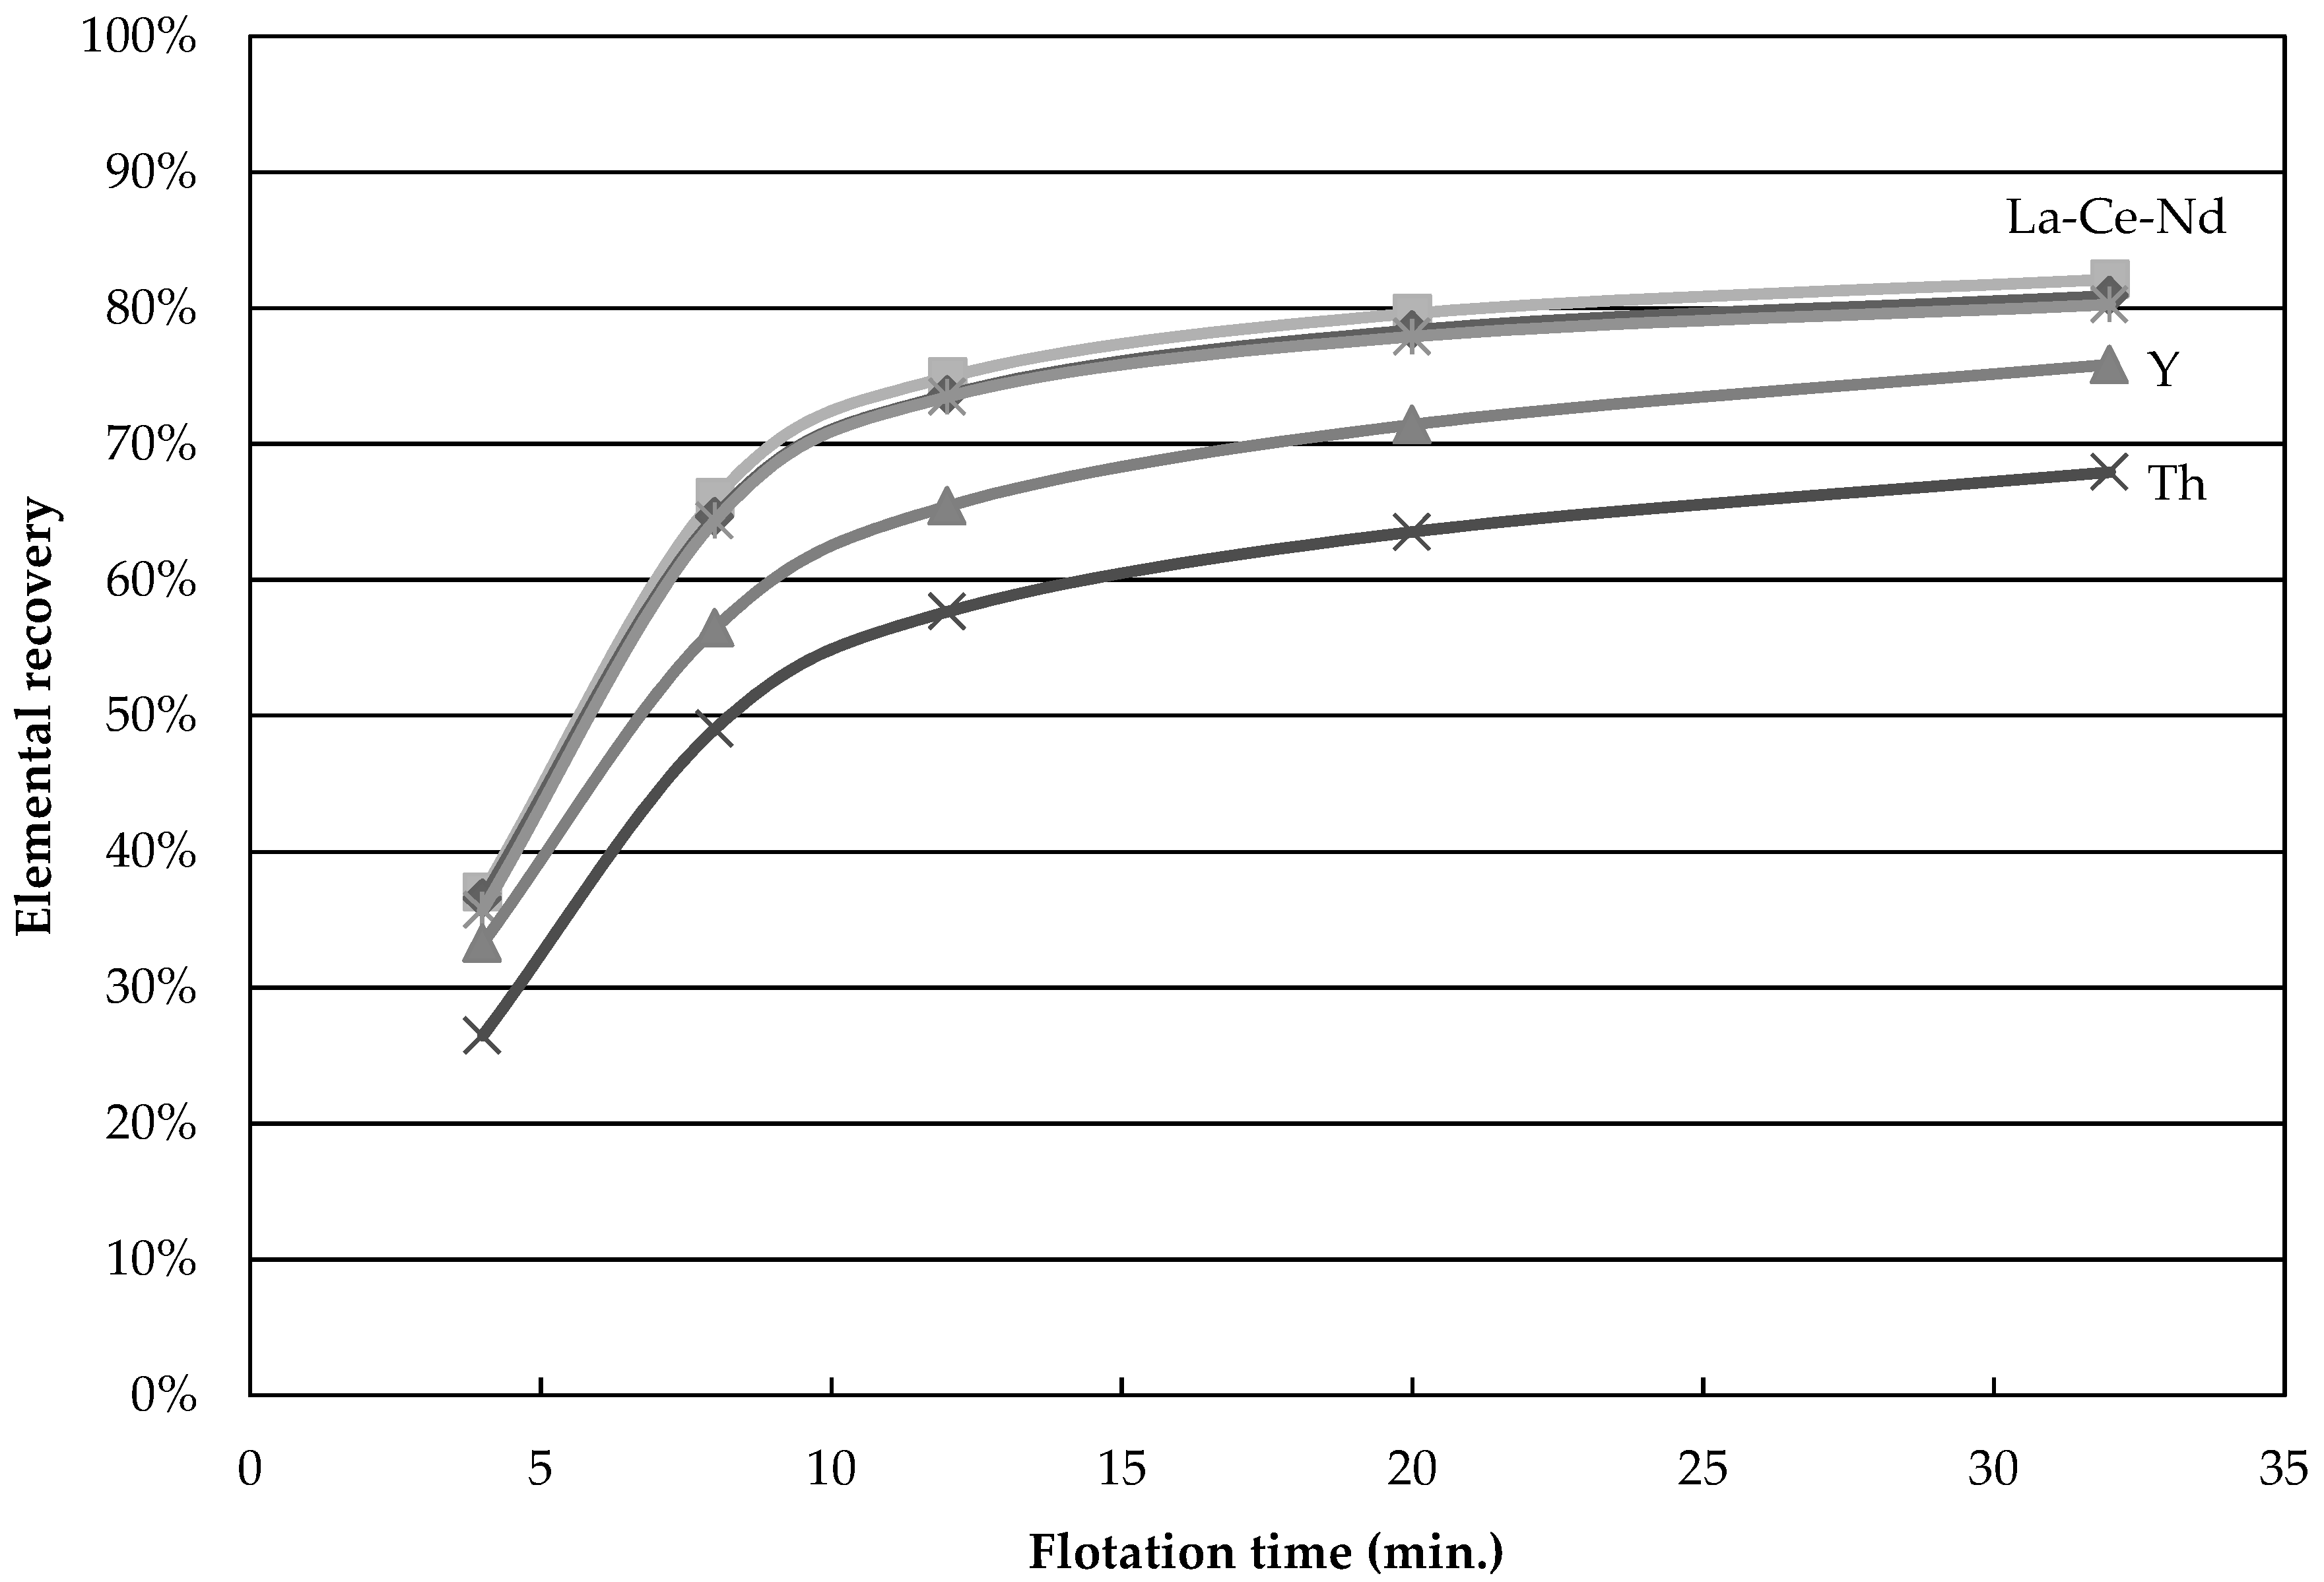
The recovery of Nd, La, Y, and Th as a function of time for test 4 is shown in Figure 1. Nd and La nearly fall on the same curve while Y and Th behave differently, indicating that La and Nd are carried by the same REE minerals in the same proportions, while Y and Th are distributed among minerals that respond differently to flotation. This result is a clear indication that more than one element should be considered when a concentration process is studied for a REE ore. Indeed, incorrect conclusions would have been drawn if yttrium was used here to assess the flotation performances. Ideally one should always look at the mineral behavior in the concentration process, as done below.
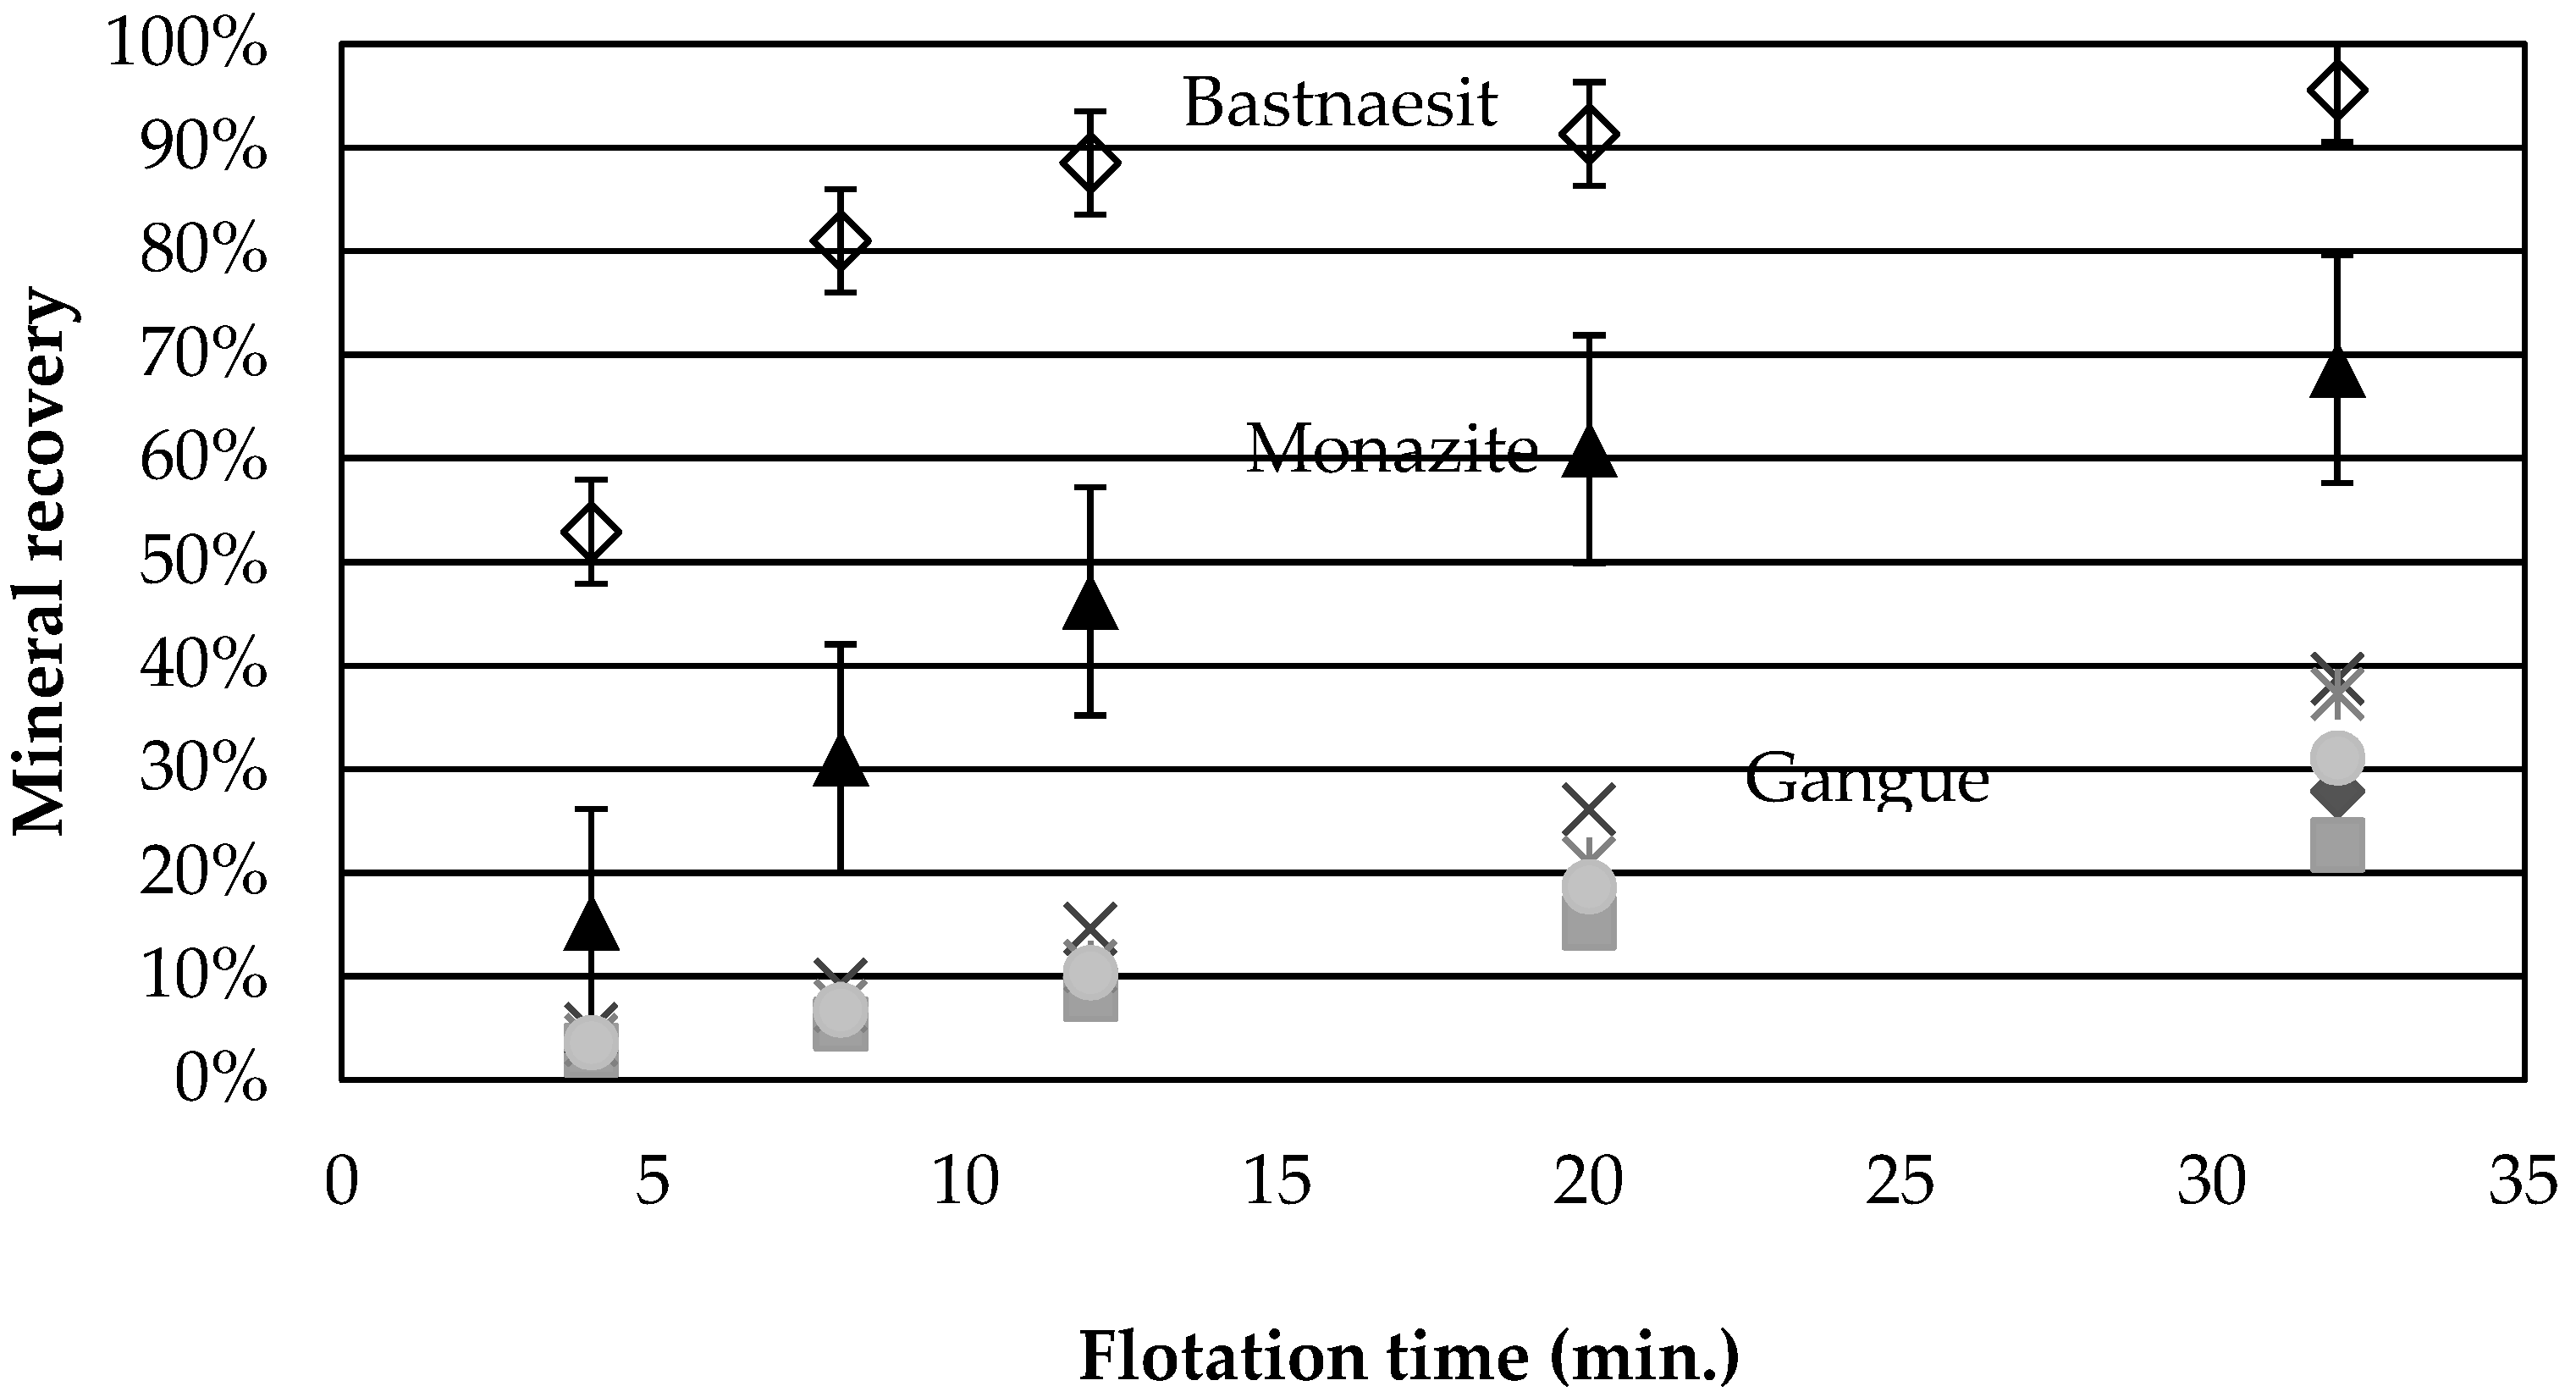
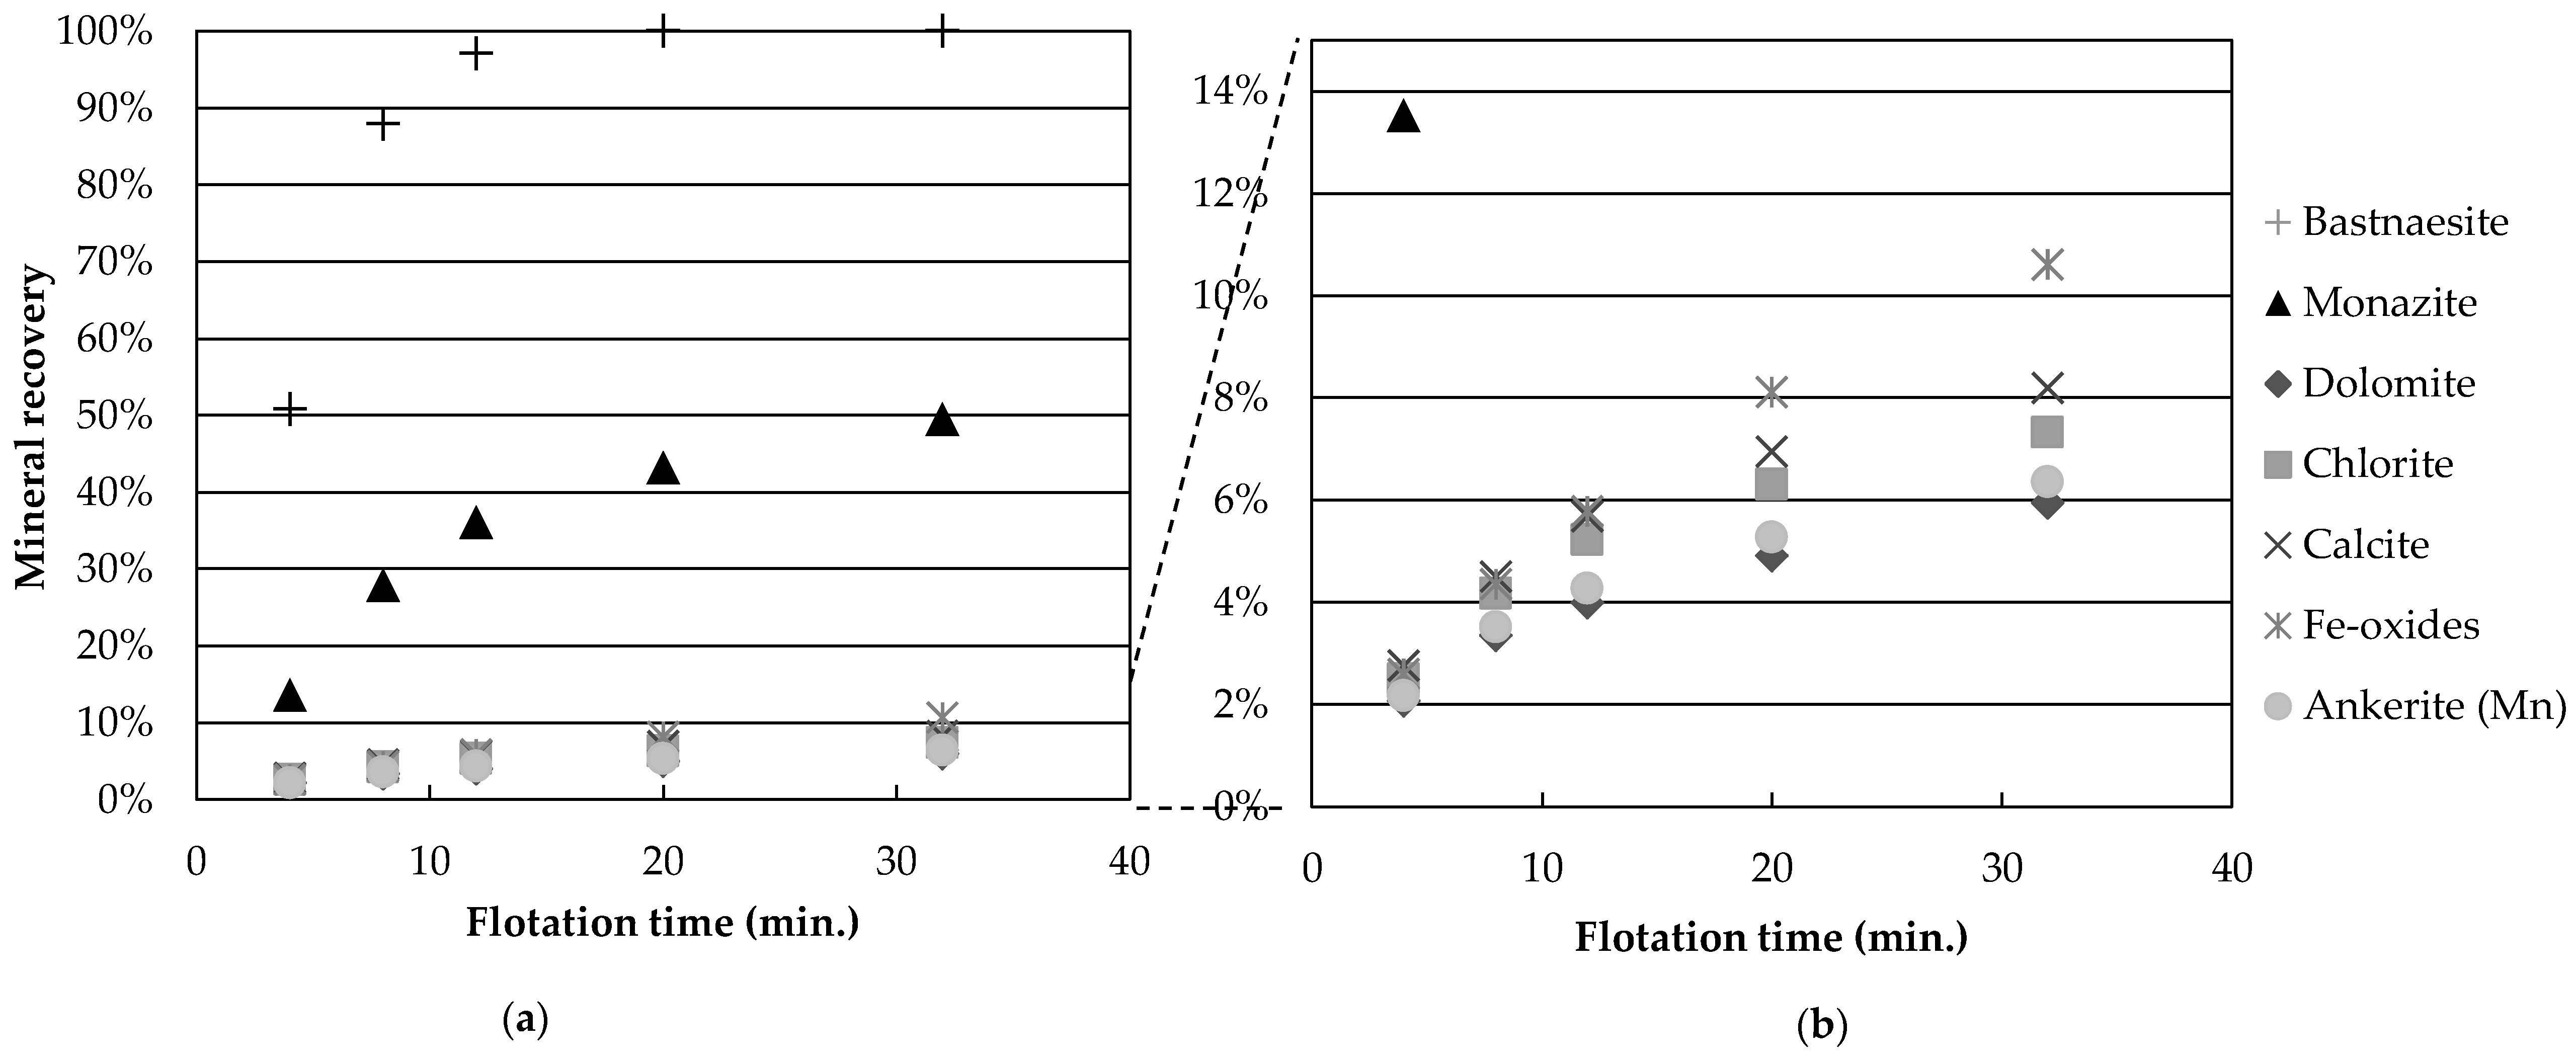
Figure 2 presents the average cumulative mineral recoveries as a function of time for tests 1, 7, and 10, the central points. The recovery is greater for bastnaesite than for monazite, a behaviour observed for all experiments. The faster flotation rate of bastnaesite over monazite was also observed for the Bayan Obo ore [9], and this behaviour was attributed to the better adsorption of the collector onto the bastnaesite surface than onto the monazite. In the present case, the behaviour is also attributed to the liberation characteristics of the ore. According to QEMScan results, at a d80 of 120 µm, 47 wt % of bastnaesite is free or liberated compared to only 27 wt % for monazite. Monazite grains are also smaller, with a d50 of 19 µm compared to 25 µm for bastnaesite, which can further decrease the recovery kinetics. Depression of the monazite by calcium ions [23] is another phenomenon which may be at play in this complex system.
None of the gangue minerals in Figure 2 appear to follow a 1st order recovery rate. Calcite and Fe-oxide recoveries are greater than those for chlorite and dolomite. The same behaviour is obtained for all the tests.
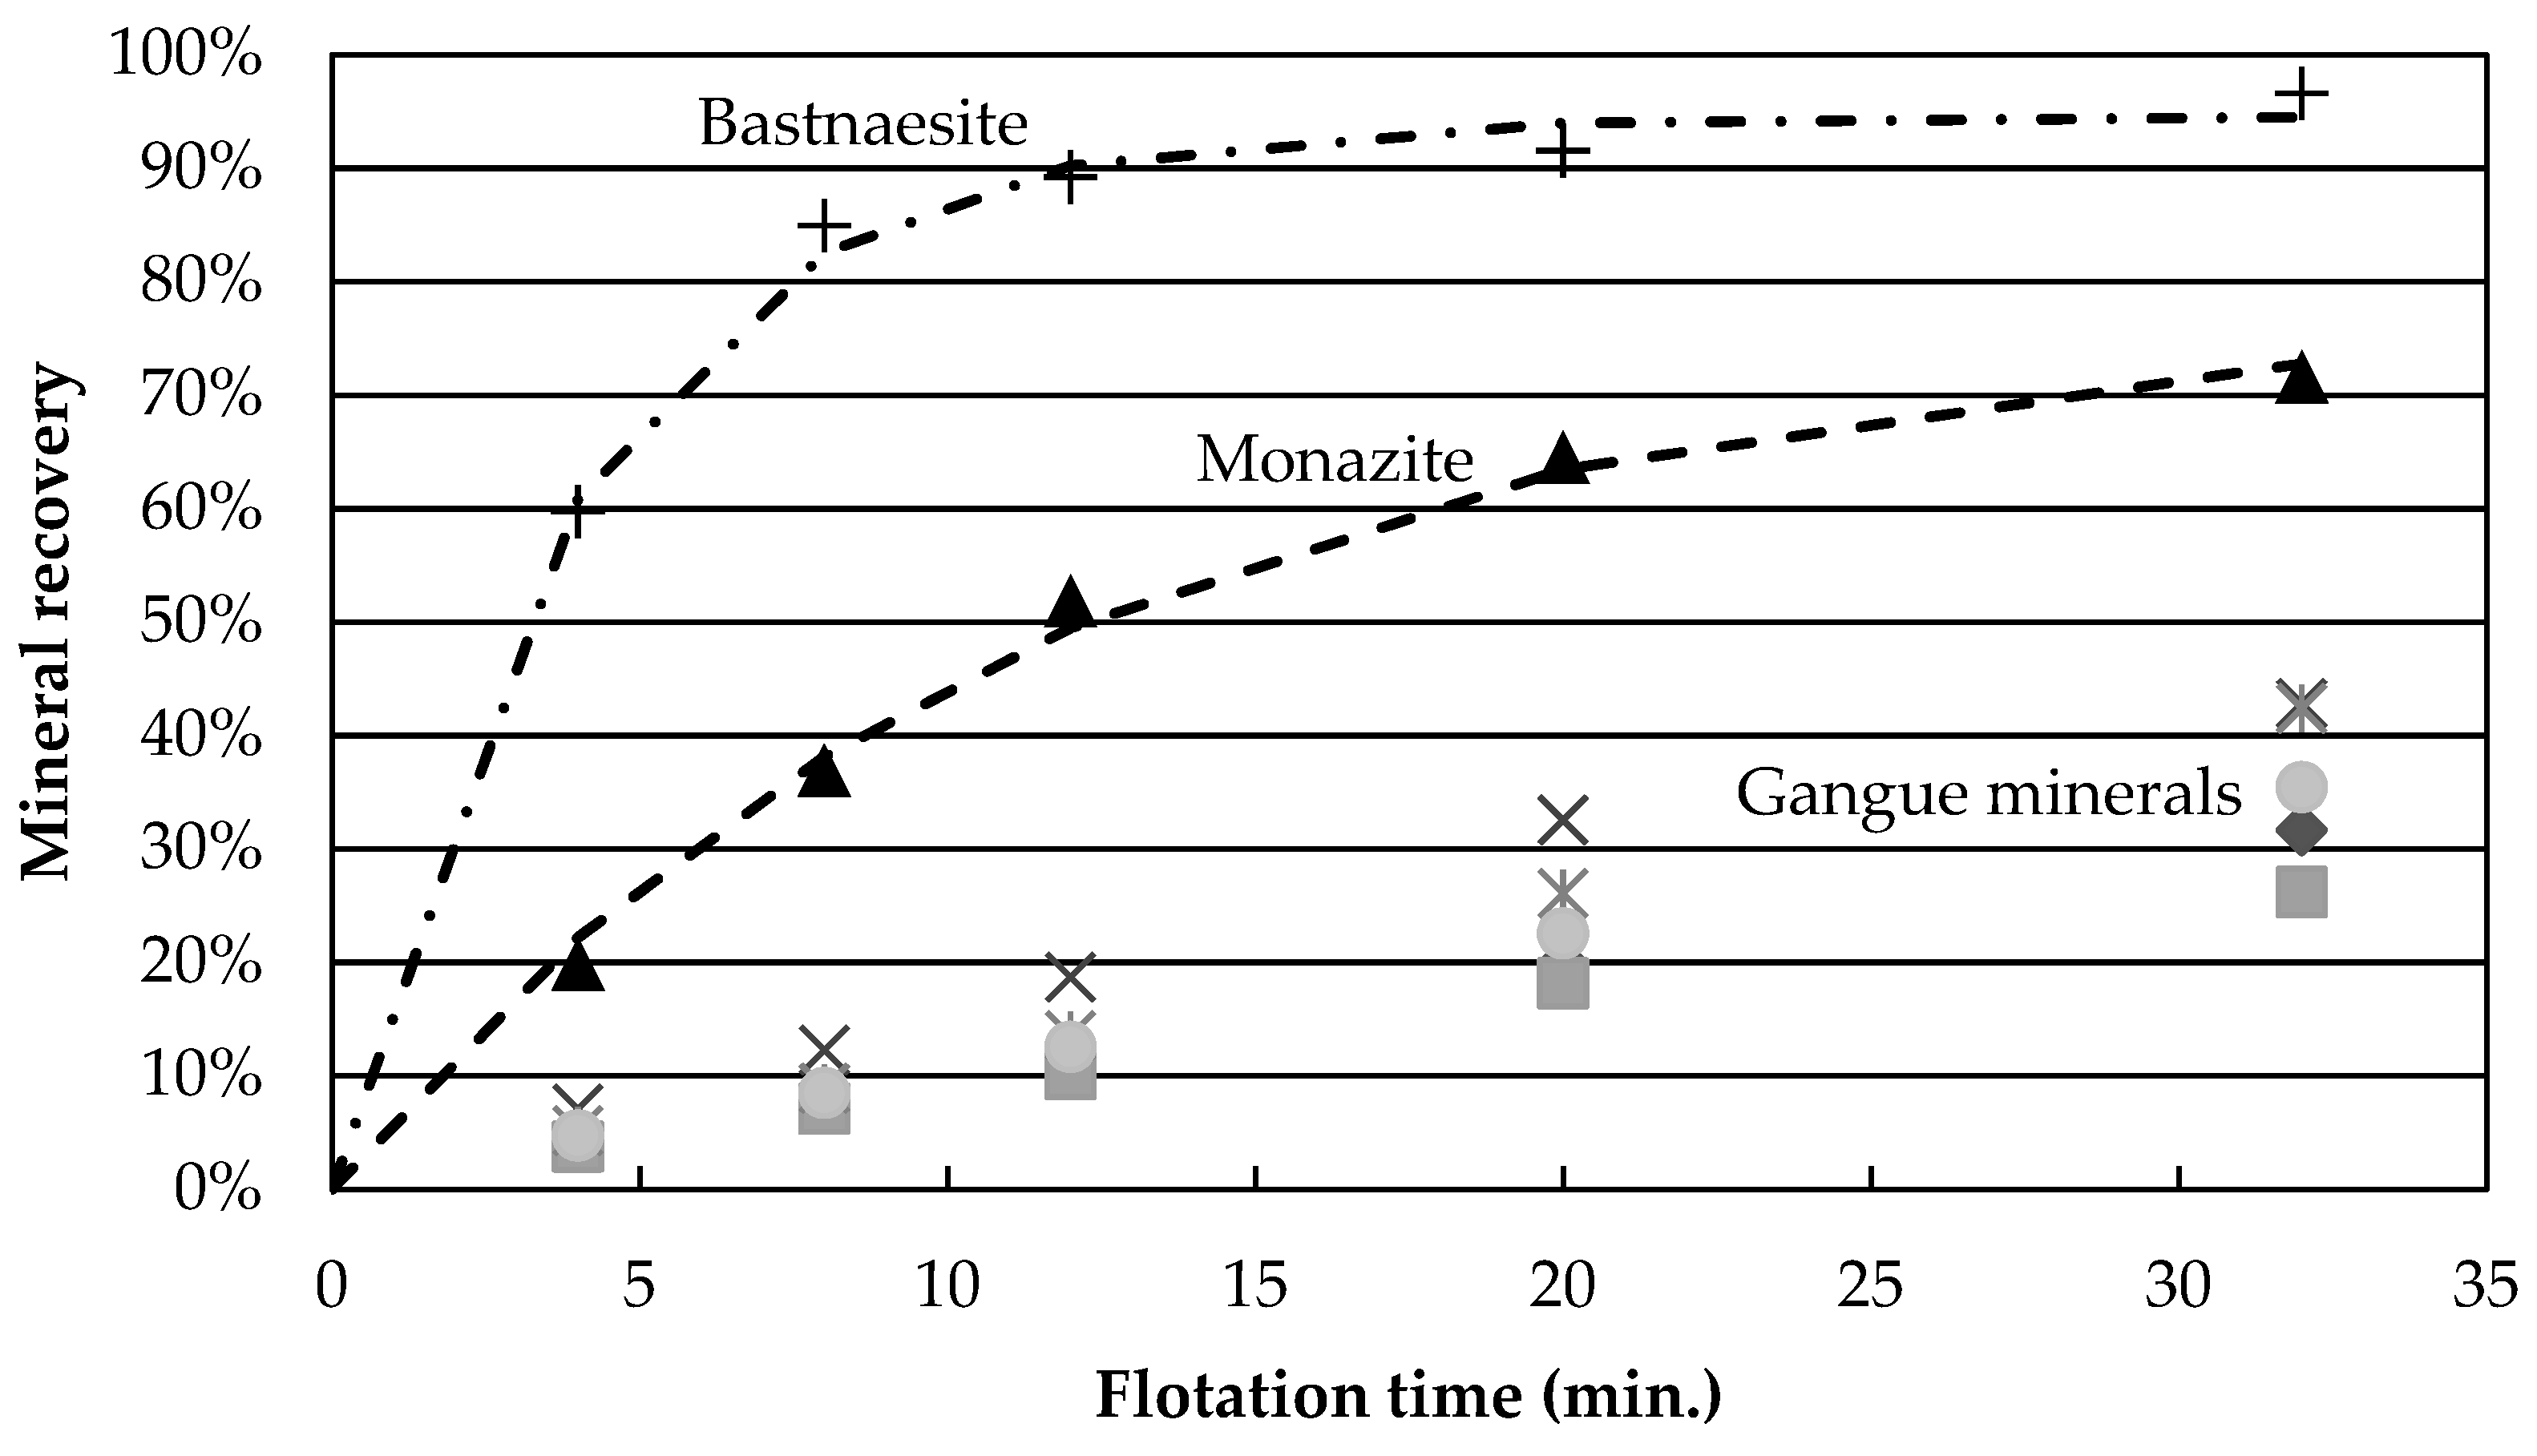
Figure 3 presents the mineral recoveries as a function of time for test 4 (high temperature, high Na2SiO3, no guar gum). The recovery of all gangue minerals is reduced by a four-fold factor, compared to the central points. This grouping of gangue mineral recovery is observed for gangue recoveries below 25% (experiments 2, 4, 5, 9 and 11). Thus, it appears that the depression caused by the flotation conditions of experiment 4 (temperature and depressants) affects all gangue minerals independently of species. One hypothesis explaining this would be a reduction in unselective entrainment of gangue particles with water. However, the low degree of correlation (R2 = 0.34) between dolomite and water recovery suggests that entrainment alone is unlikely to explain the variation in gangue mineral recovery and that, instead, actual depression of gangue minerals occurs. This agrees with the work of other authors who have shown that hydroxamic acid type collectors do adsorb onto calcite, one of the minerals present in this study [23,24].
Figure 3b shows that calcite and Fe-oxides have the largest recovery values. Tests at reduced wt % solids, as well as concentrate cleaning tests, could help determine whether the recovered gangue minerals are still attached to the valuable minerals or if they report to the concentrate through entrainment.
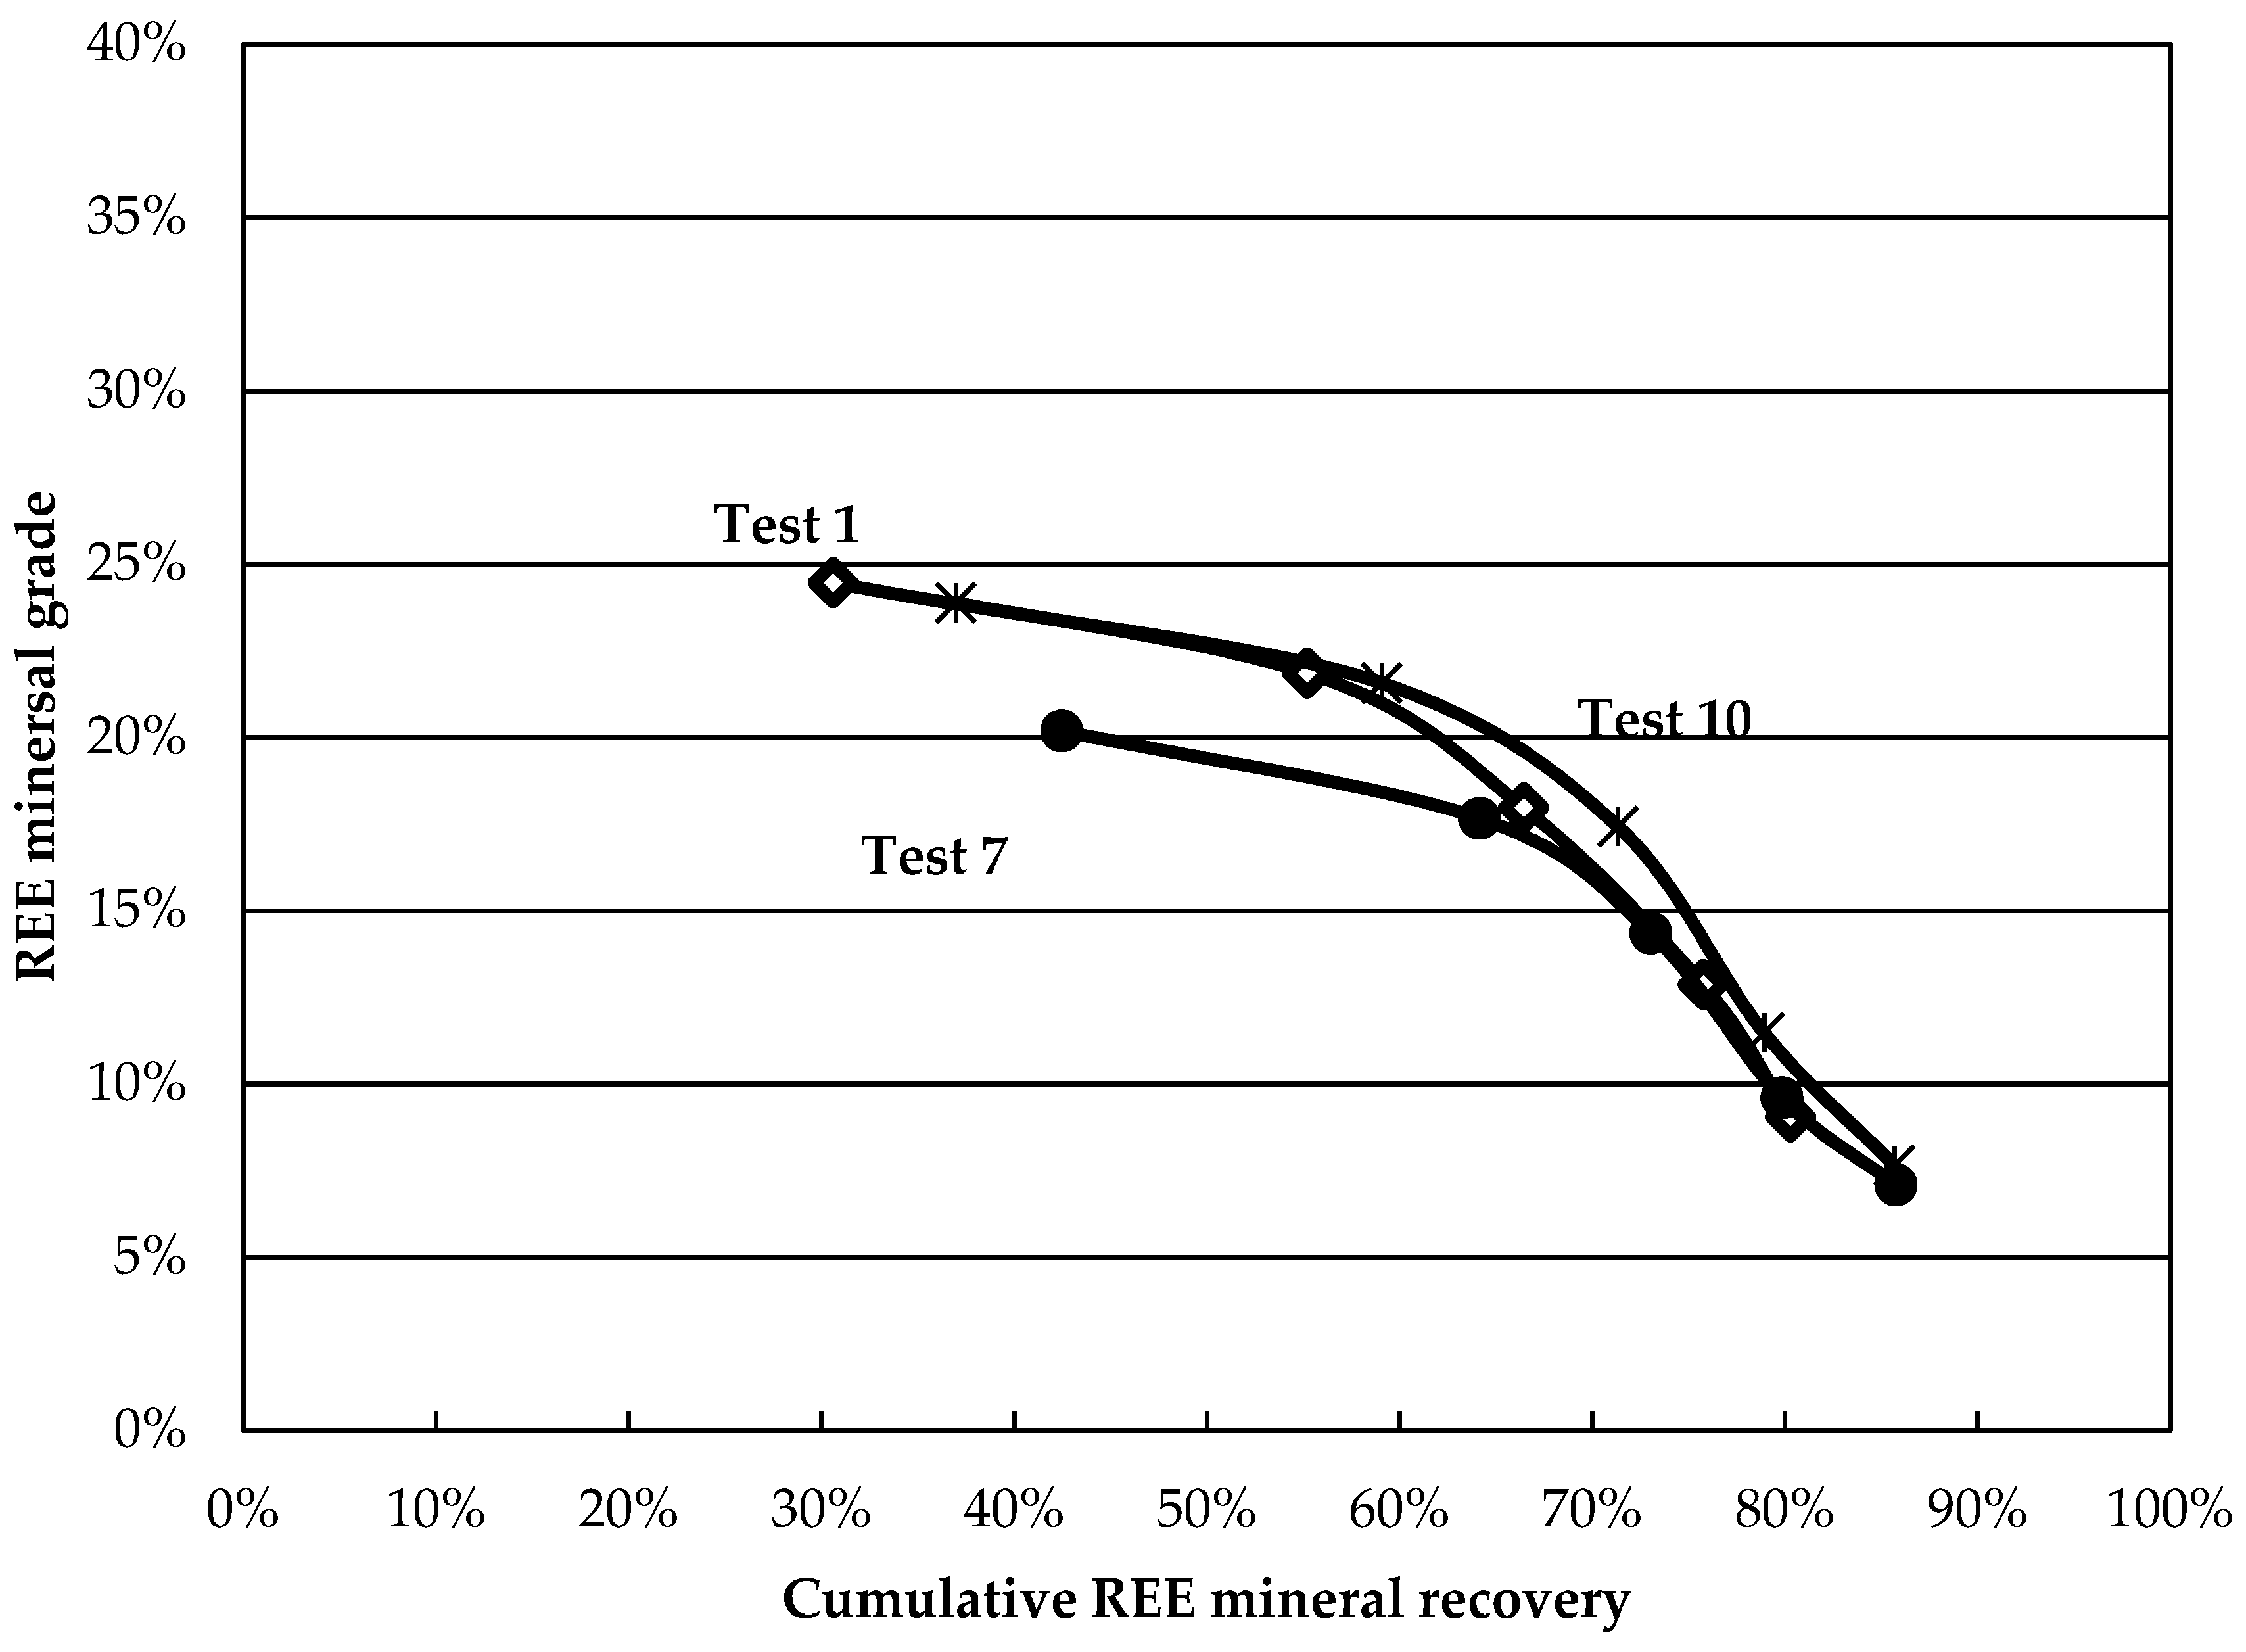
Although these results reveal information about the behaviour of minerals in the various tests, comparative analysis remains tedious. Grade-recovery curves are proposed as simple and rapid tools to resolve this. The higher and further to the right a curve is, the better the separation. The curves for the central points are presented in 
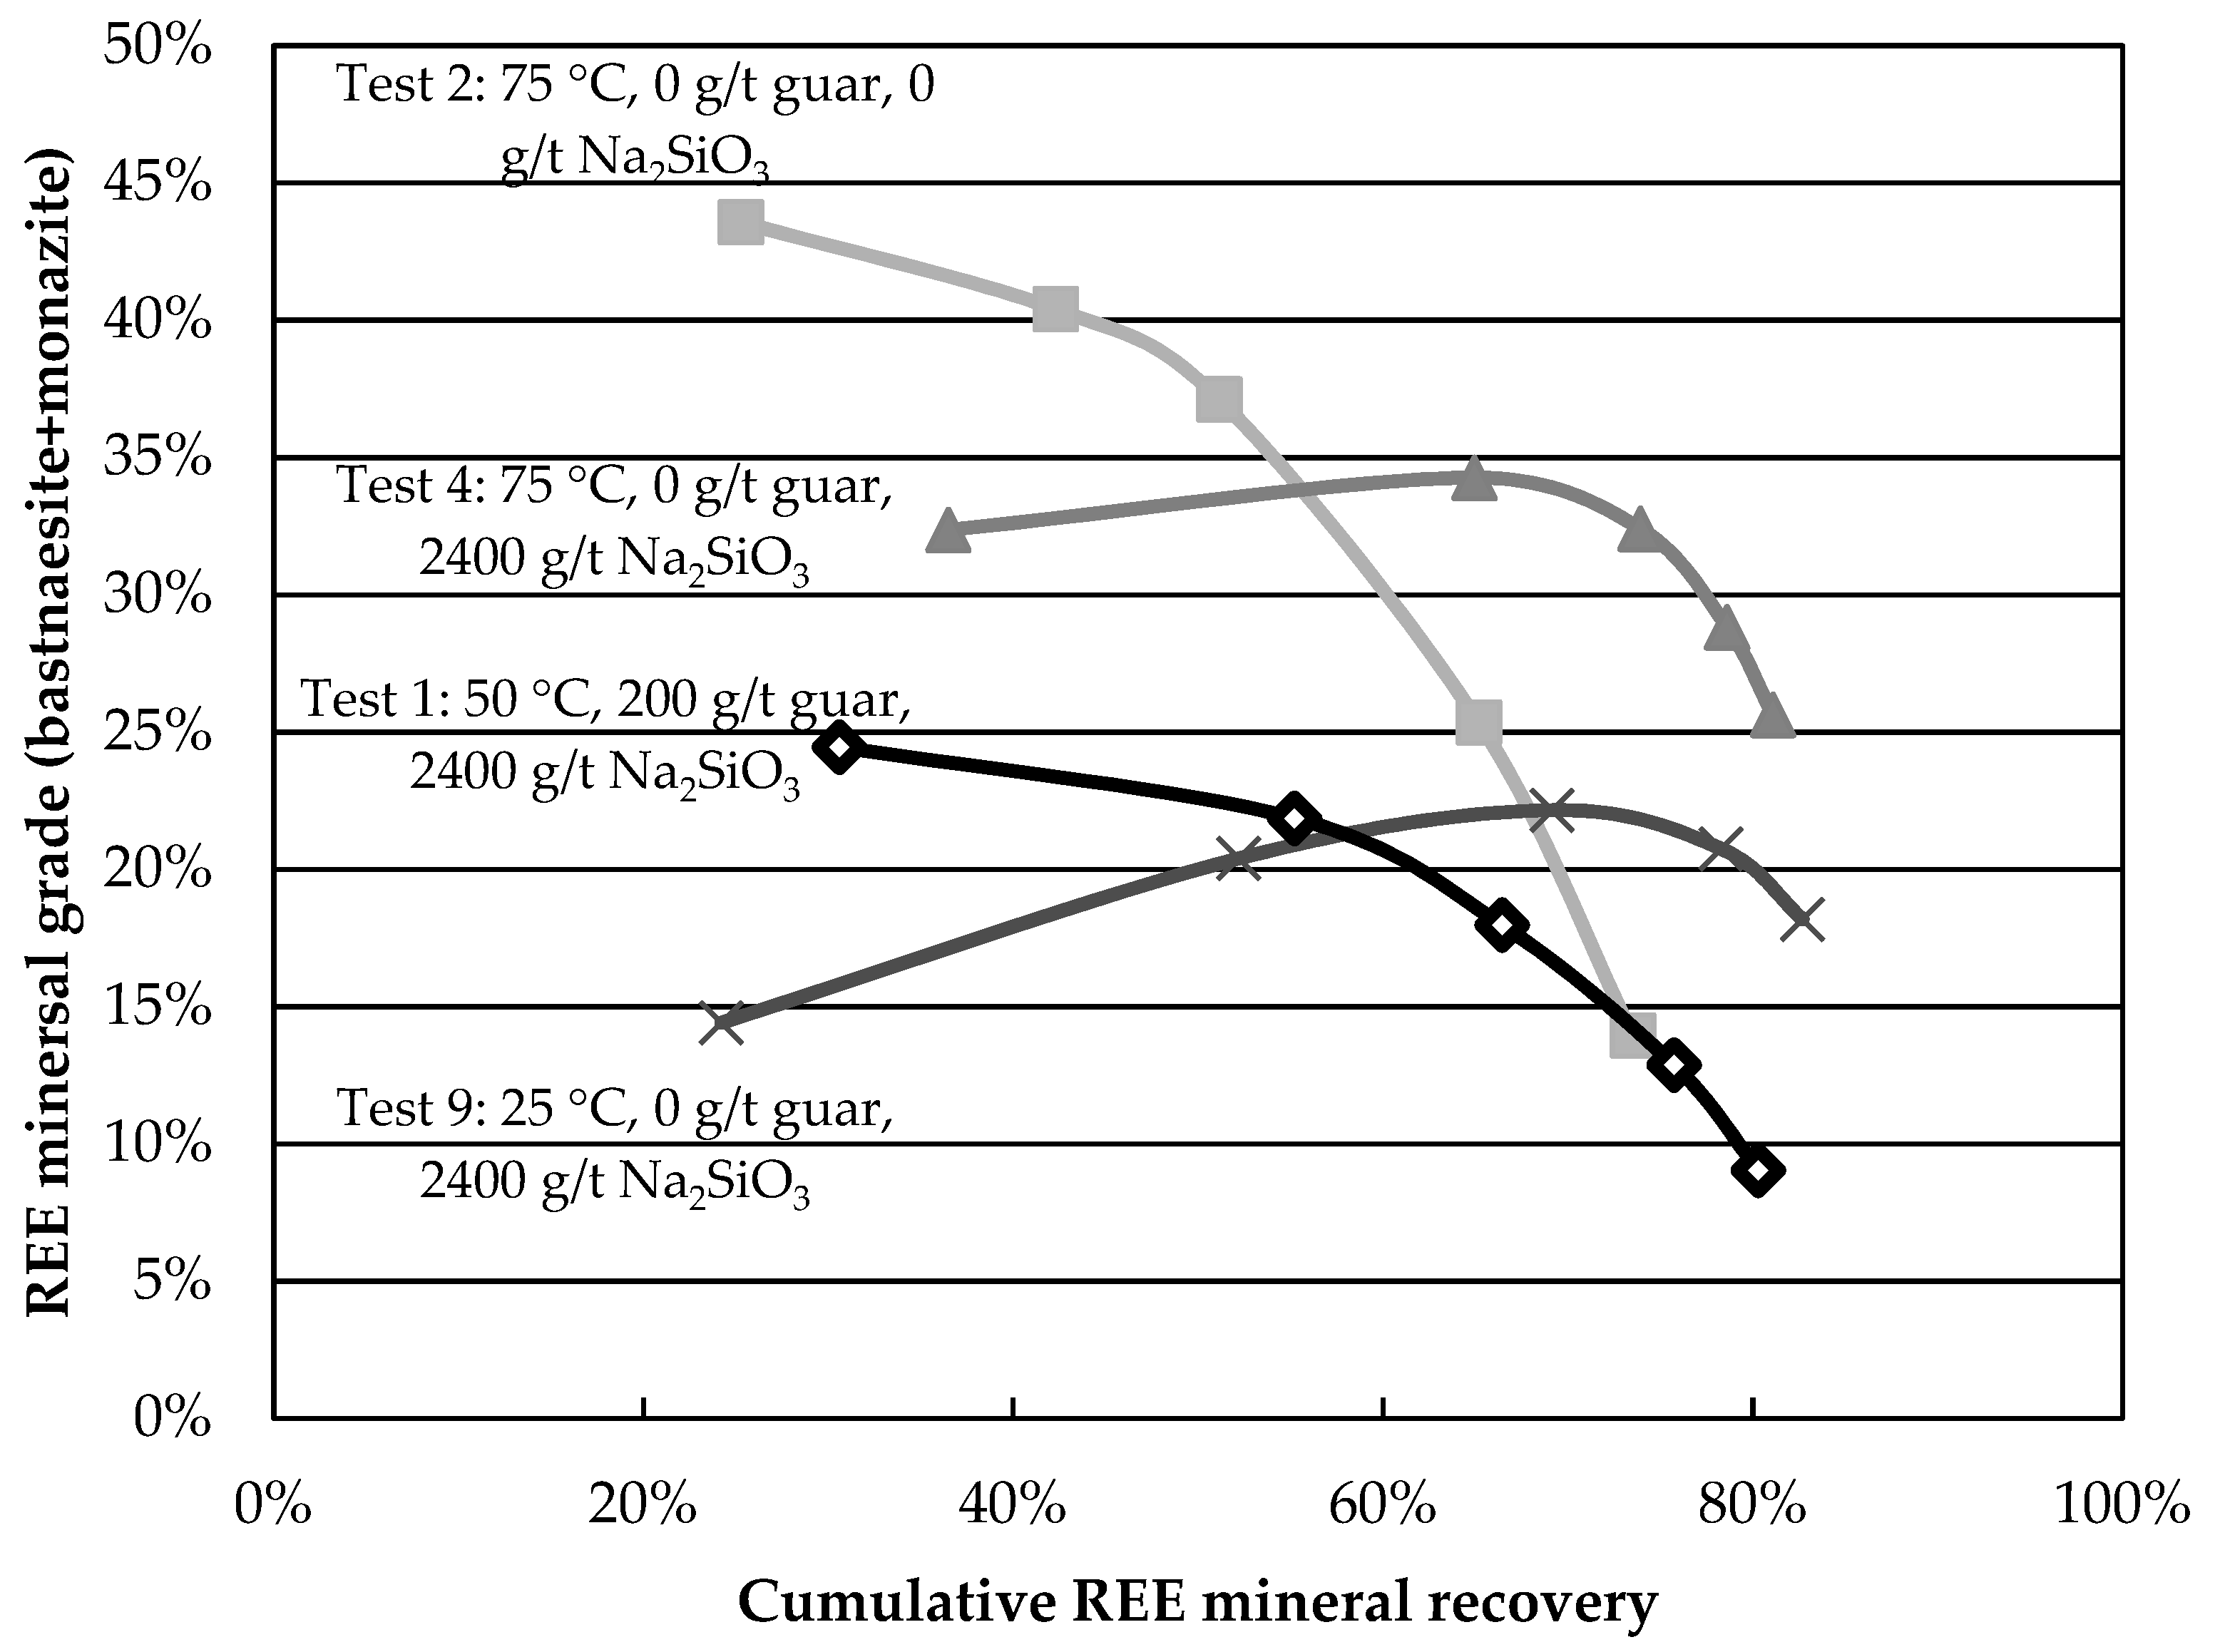
Figure 4. The curves show good reproducibility, especially at larger recovery values. The grade-recovery curves for some factorial tests are shown in Figure 5. Tests 2, 4, and 9 present an improvement over the central point at recoveries above 60%. Test 4 shows the greatest REE mineral content for a REE recovery above 60%. The results obtained in this test (8-fold grade increase at a recovery above 80%) surpass those obtained on most Canadian REE ores for a single rougher flotation stage and compare favourably with others reported using hydroxamic acids [11], despite lower feed grades.
The grade-recovery curves shown here, while helpful in identifying optimal conditions, make a thorough analysis difficult. For instance, they do not provide information regarding the kinetics of bastnaesite and monazite recovery. Furthermore, it is difficult to quantify the degree of improvement provided by one curve over another, making modelling difficult. The means of quantifying these aspects are proposed in the next section.

3.3. Modelling of the Kinetic Curves for the REE Minerals and Analysis of the Factorial Design

First-order models have been used in flotation for over 80 years [25] and are still in use today [26]. Thus, a first-order kinetic flotation model, shown in Equation (1) for bastnaesite, was calibrated for each of the 11 tests, where R, expressed in %, represents a mineral’s ultimate flotation recovery, achieved after an infinite flotation time, and k, expressed in min−1, is the flotation rate constant used to quantify the rate of recovery. Separate R and k values were fitted for each REE mineral (R∞,bast. and kbast. for bastnaesite and R∞,monaz. and kmonaz for monazite) to minimize a criterion J, shown in Equation (2), comprising the sum of the squared differences between the measured (Rbast.) and fitted ( R ^ b a s t . ) cumulative REE mineral recoveries for concentrate i at cumulative flotation time t. An equation similar to Equation (1) is calibrated for monazite, using R∞,monaz. and kmonaz:
R ^ b a s t .   =   R , b a s t . ( 1 e k b a s t . t )
Minimize   J ( R , b a s t . , k b a s t . ) =   i = 1 5 ( R ^ b a s t . ( t i ) R b a s t . ( t i ) ) 2
Figure 6 shows the agreement between the data and the model (dotted line) for test 7, conducted at the baseline conditions. The first-order model is able to describe the flotation kinetics of bastnaesite and monazite. As previously observed, gangue mineral recoveries are typically grouped. Since they also tend to follow a zero-order (constant) rate of increase with time, a single value, R G ; 32 , i.e., the recovery of gangue after 32 min of flotation, will be used to quantify gangue mineral recovery in the next section.
The fitted parameters (R∞,bast., kbast., R∞,monaz. and kmonaz) of the kinetic flotation model discussed above are used as performance indicators. To further define the impact of the three factors tested, several response variables are calculated to be used as additional performance indicators:
  • R g ; 32 is the weight-averaged recovery of gangue minerals after 32 min of flotation.
  • G75 quantifies the combined REE mineral grade (bastnaesite + monazite) obtained at 75% REE recovery.
  • S (for Separation efficiency) is the difference between valuable mineral and gangue recovery, which is calculated using Equation (3):
    S = R R E E , 32 R G , 32
    where RREE,32 is the REE mineral recovery (weighed average between bastnaesite and monazite) after 32 min of flotation.
Test conditions and results are summarized in Table 7. The reproducibility of the test results is quantified using the triplicate center-point, i.e., tests 1, 7, and 10, at the bottom of the table. Since many of the performance indicator values fall well outside the ±2 standard deviation, test conditions likely have a significant impact on performance.
The data shows that gangue recovery ( R G ; 32 ) varies widely, from 7% to 68%. This is an expected result since two of the three factors tested are depressants for gangue minerals. Monazite ultimate recovery R∞,monaz. is systematically lower than that of bastnaesite, in agreement with the above results and observations by other researchers [9].
The analysis of the factorial design begins with the calculation of the main effects of the factors [27] shown in Table 8. These quantify the impact of changing a factor from its baseline value (0) to its larger value (+1) [27]. Higher temperatures appear to decrease REE ultimate recovery R and gangue recovery Rg,32, but promote the recovery kinetics k. In the range tested, temperature appears to be the most important factor affecting the rate of REE mineral flotation. Increasing the sodium silicate addition improves the bastnaesite ultimate recovery R∞,bast. but reduces R∞,monaz. and gangue recovery. Guar gum promotes a larger recovery value for both REE and gangue minerals.
In order to confirm the significance of these effects, it is necessary to conduct statistical analysis. The data in Table 7 was analyzed using a hierarchical stepwise regression at a significance level α = 5%. Among the seven responses shown in Table 8, only the bastnaesite ultimate recovery R∞,bast., the kinetic constant kbast. and the separation efficiency 
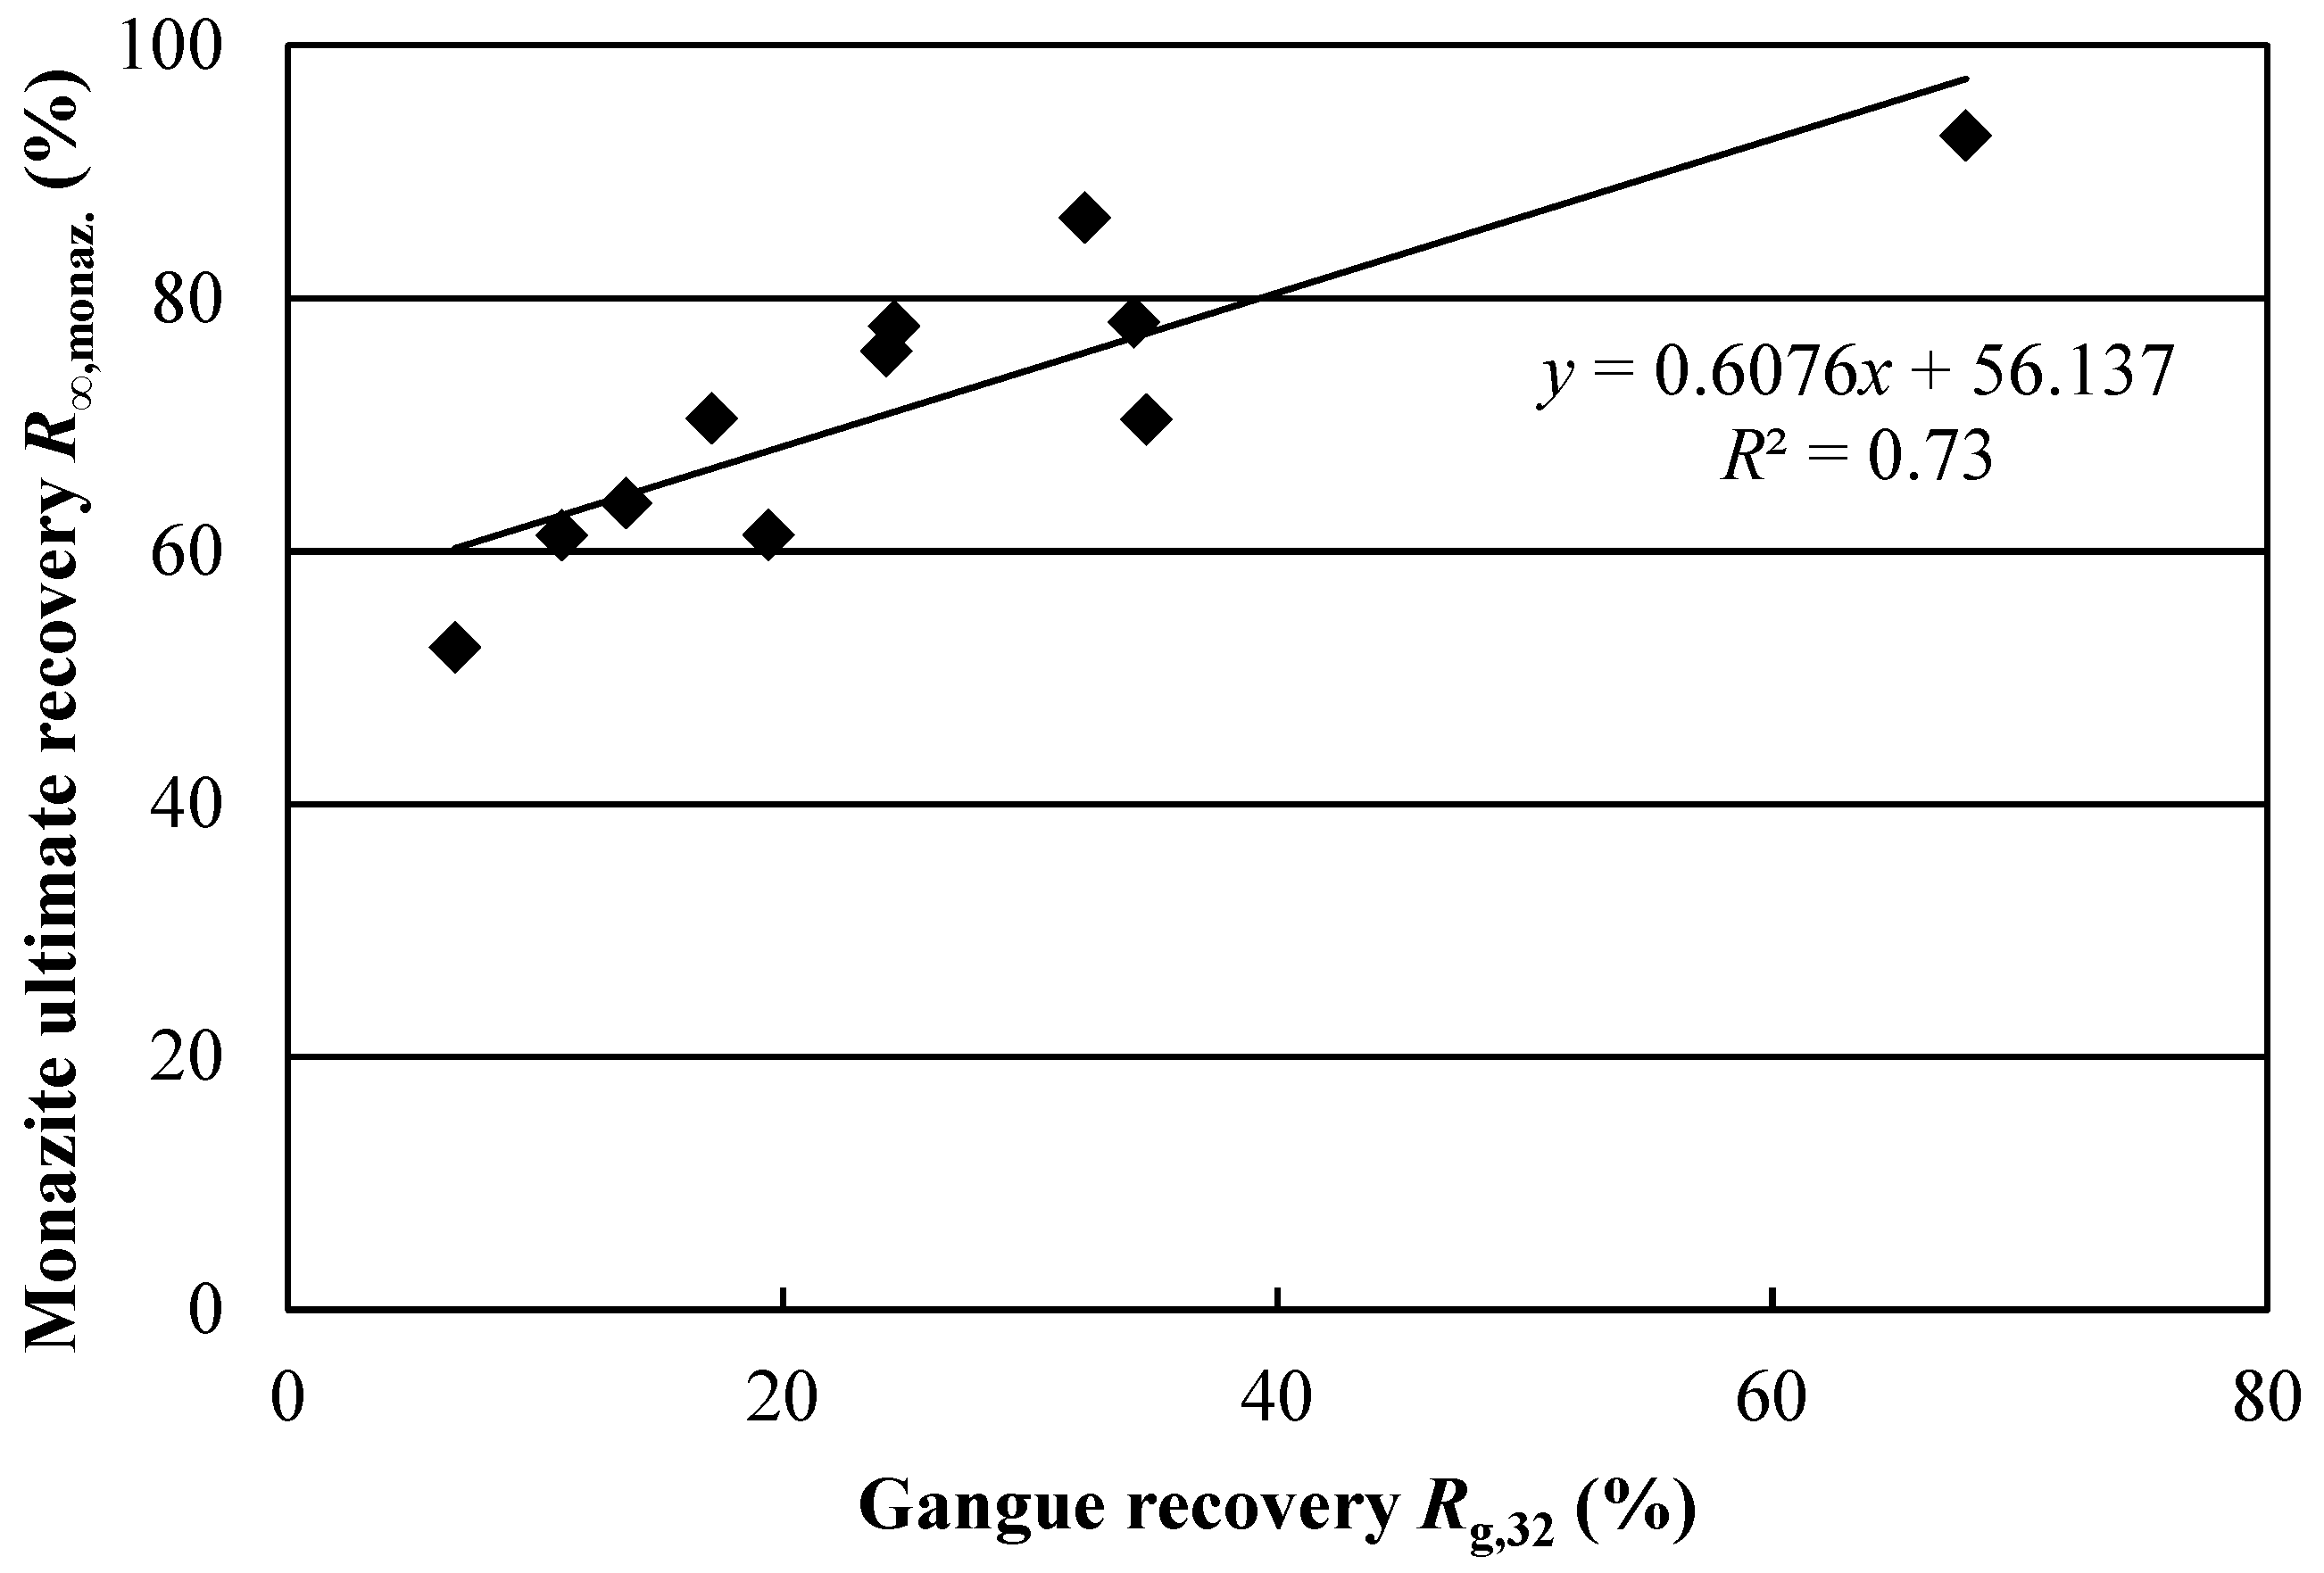
S yielded significant regression models. This indicates that the changes in test conditions either had no effect on monazite recovery or that the effects were masked by experimental error. Furthermore, the correlation between monazite and gangue recovery, shown in Figure 7, suggests that high monazite recoveries may simply result from gangue-associated monazite recovery. These conclusions show how dividing REE mineral recovery between bastnaesite and monazite through mineral reconstruction allows for more accurate conclusions to be drawn. Indeed, if global REE recovery had been used, the issue of lower monazite recovery may have been overlooked.
Equations (4)–(6) are the empirical regression models predicting the responses based on the levels of the tested factors, expressed in engineering units. In these models, T and N, respectively, stand for temperature in °C and Na2SiO3 dosage in g/t.
Bastnaesite ultimate recovery, R , b a s t . increases with sodium silicate dosage, as shown in Equation (4). Since depressants typically do not improve mineral recovery, the effect is likely explained by the higher pH values observed at larger Na2SiO3 dosages (see Table 7). This is in agreement with other studies [28,29], which show that bastnaesite recovery, when using hydroxamic acid type collectors, improves upon going from pH 7 to 9.
The flotation rate constant for bastnaesite kbast. increases with temperature, as shown in Equation (5). This supports the work of other researchers [8], which has shown that increasing temperature increases collector adsorption onto bastnaesite more than on calcite and barite. This observation is also consistent with the results of [9], although in that case, the increase in flotation rate was associated to the production of smaller air bubbles at higher temperatures. A larger flotation kinetic constant for a valuable mineral improves separation efficiency, although other factors can play an important role, as shown in Equation (6).
R , b a s t .   =   93 + 0.00263   N
k b a s t .   =   0.0938 + 0.00159   T
S   =   27.9 + 0.349   T + 0.00875   N
The model presented in Equation (6) shows that higher temperatures and sodium silicate additions improve separation efficiency. This is not surprising: part of the improvement arises from increases in R , b a s t . and kbast. values. However, since sodium silicate has the largest effect on gangue recovery Rg,32 (see Table 8), its capacity to depress gangue minerals [10] likely contributes to its effect on separation efficiency. The dispersing properties of this reagent may add to the improvement. The use of separation efficiency as a performance index helps in fully assessing the effect of Na2SiO3 and better defining the optimal conditions.
Guar gum dosage has a negative effect on all responses, although these effects are not statistically significant. Upon guar gum addition, the slurry appeared more viscous, indicating a possible change in rheological properties. This change could lead to less particle dropback from the froth phase to the slurry phase, thereby promoting gangue mineral entrainment. Given these observations, future testing should be conducted without guar gum or at dosages smaller than 200 g/t.
Exploratory tests using Na2SiO
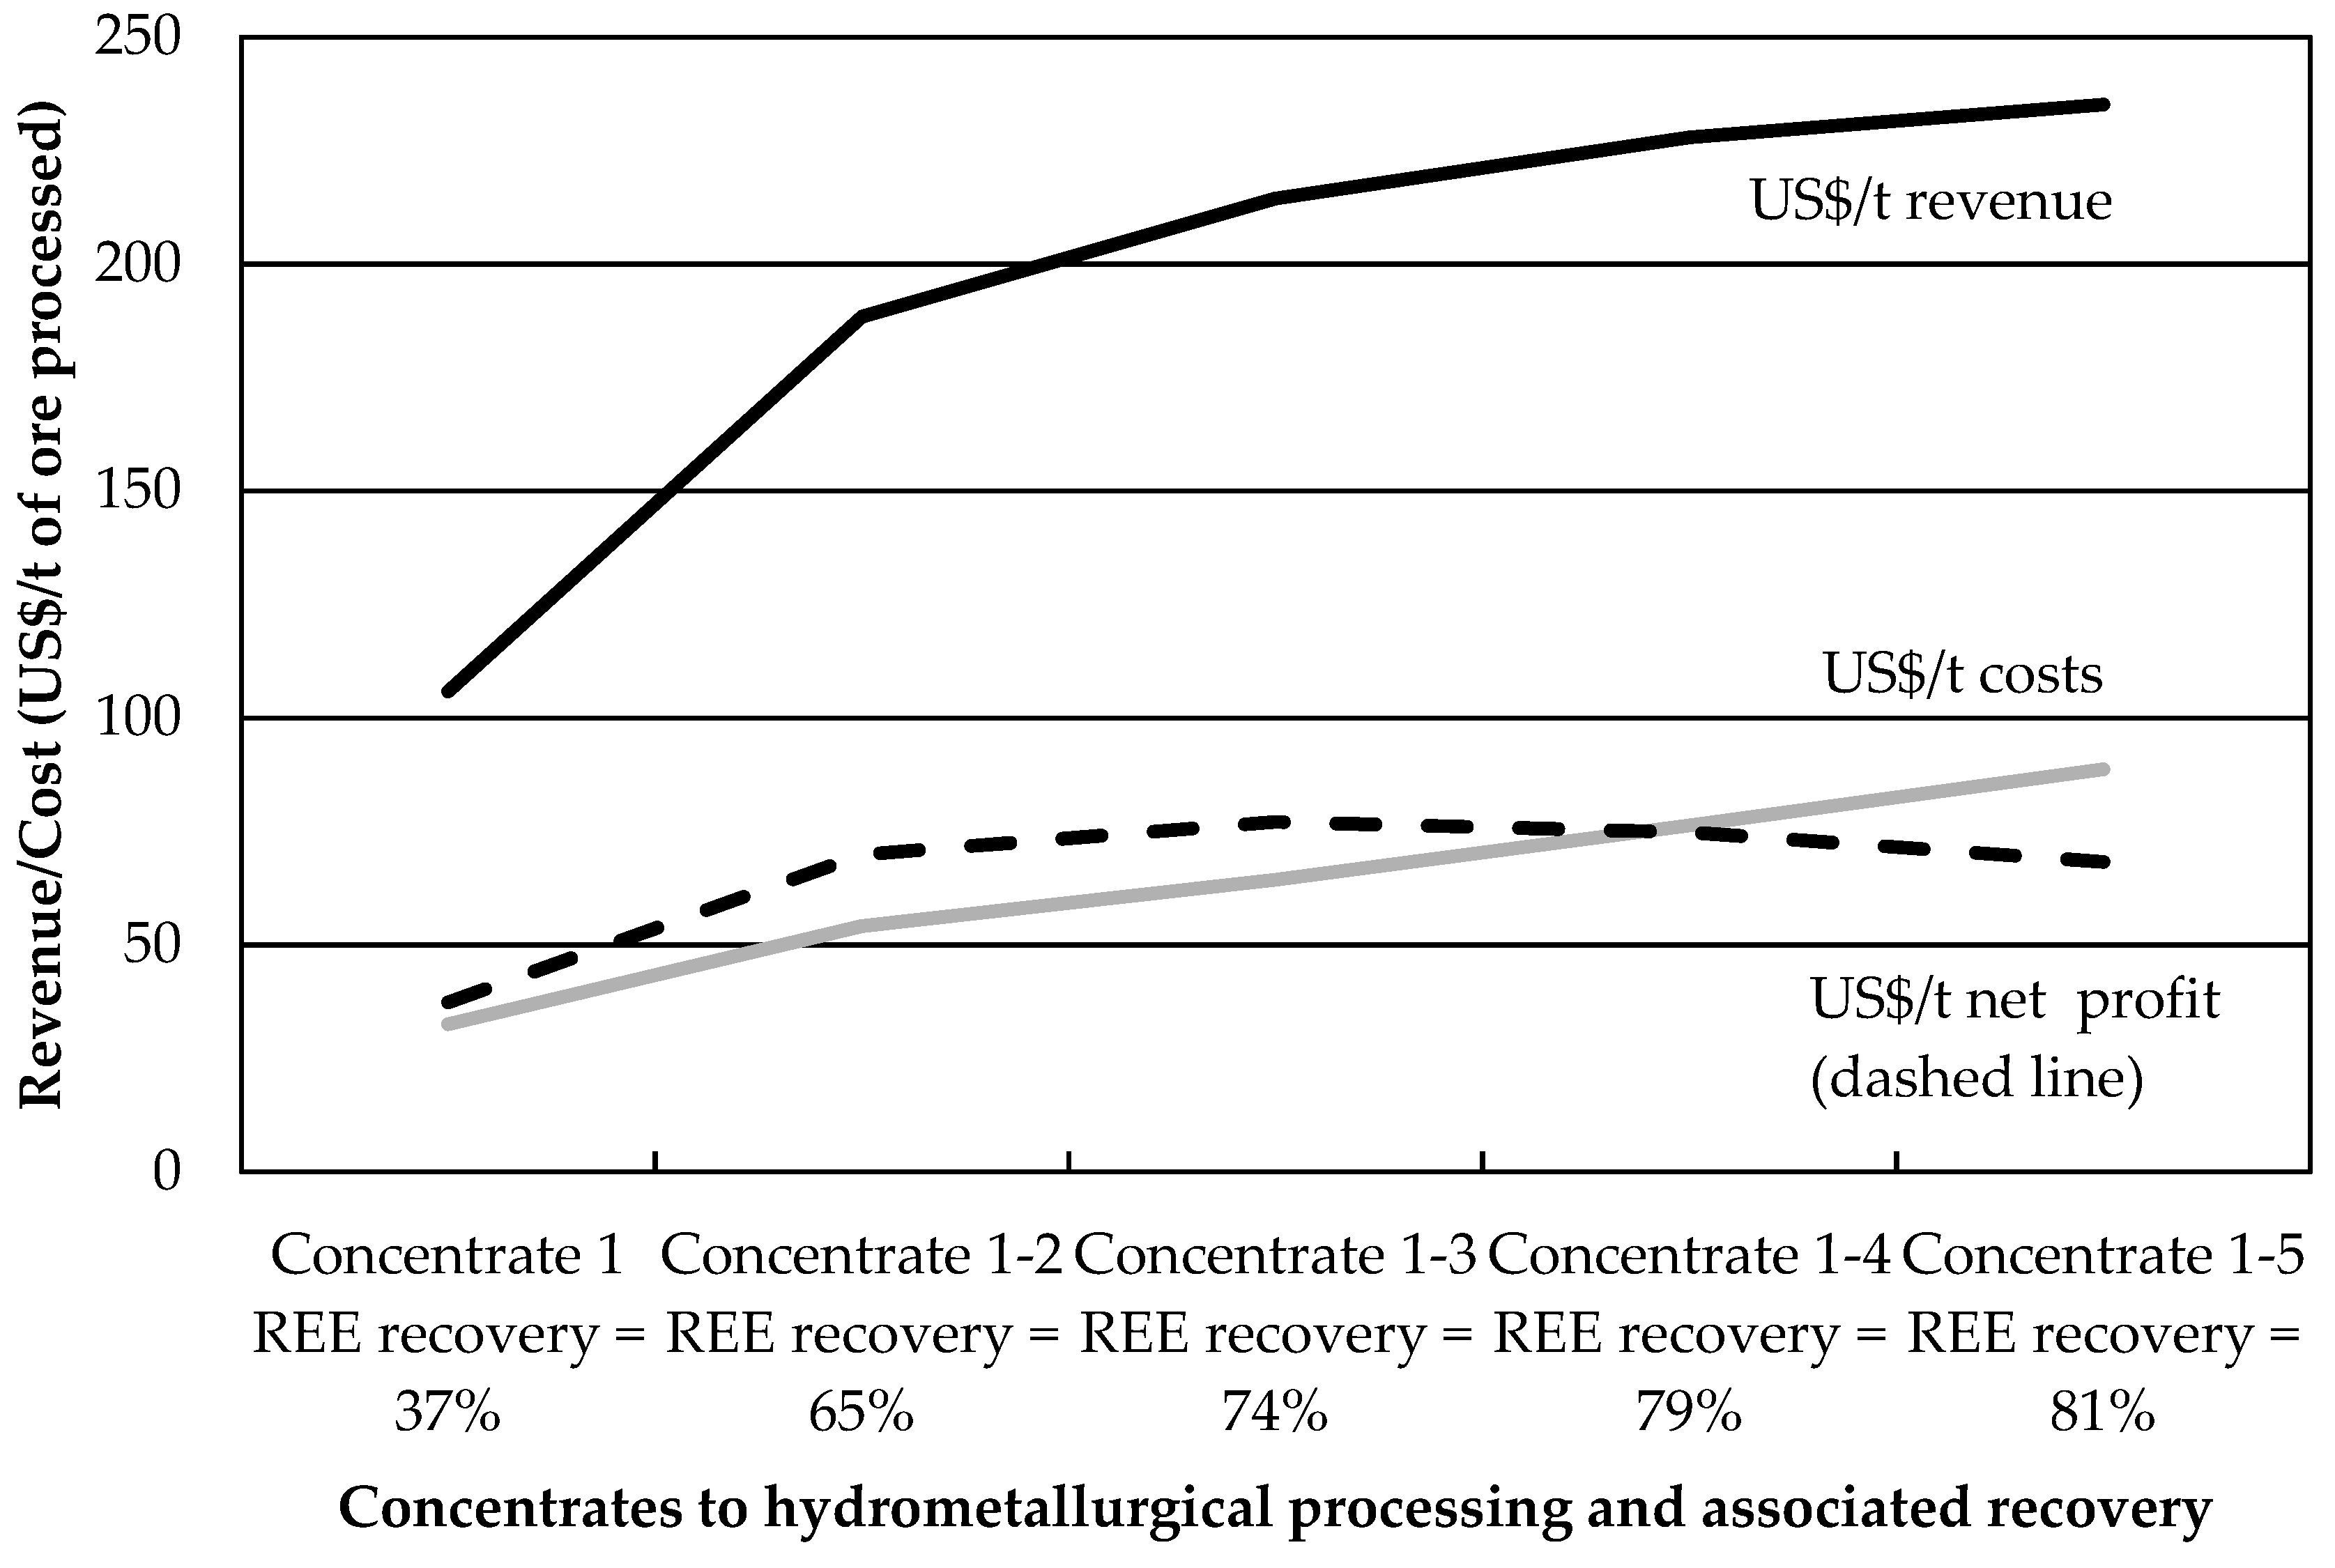
3 dosages above 3000 g/t and no guar gum at 75 °C yielded reduced REE mineral recoveries, partly due to low froth stability. The optimum separation efficiency conditions for this ore sample may thus lie within the factorial design presented in this paper. The economic optimum, however, may lie elsewhere, owing to the increased costs associated with hydrometallurgical processing of REE from flotation concentrates. This is especially true when large amounts of acid-consuming carbonate gangue minerals are present [30]. The next section uses an economic performance indicator to quantify the impact of gangue recovery on the profitability of REE mineral flotation.

4. Economic Efficiency Analysis

Hydrometallurgical processing of REE concentrates is an expensive operation and involves capital-intensive equipment. This high cost explains why many REE projects intend to sell a mineral concentrate as opposed to leaching and separating the components to generate saleable separated rare earth oxides [31]. In order to maintain a high valuable mineral recovery, and owing to poor separation efficiency, many projects choose to conduct little physical upgrading, generating concentrates with large amounts of gangue. Few papers discuss the economic efficiency of REE hydrometallurgical operations and the implications of gangue recovery on operating costs. The results in Figure 5 show that even with the best results obtained in test 4, the rougher concentrate produced is only made up of 26 wt % REE minerals, and hence contains 74 wt % gangue minerals, most of which are carbonates containing large amounts of calcium. Applying sulphuric acid-baking to this type of concentrate would result in the formation of large amounts of gypsum, which tends to capture REE and reduce leach recoveries [32]. Hence an alternate “caustic cracking” process is explored for treating the REE concentrates generated through flotation. This approach has been known for over 60 years [33] and used by various producers. The simplified flowsheet of this process is presented in Figure 8. The process shown is not optimized. For instance, a pre-leach step using dilute HCl could be added to reduce the size of the caustic cracking equipment. The REE concentrate produced through this process could be sold to a REE refinery for REE separation or used as feedstock for refining within an integrated hydrometallurgical complex.
The results of test 4 are used to evaluate the operating revenues and costs associated with the hydrometallurgical processing of the mixed concentrate recovered from one tonne of ore, using the above scheme and the following assumptions:
  • An available REE revenue of 290 US$/t of ore is estimated from current REE prices: [34] and http://www.cre.net/Encre/Prices.asp;
  • Refining (REE separation) charges applied are 30% of REE value contained in the mixed oxalate product;
  • A 90% hydrometallurgical REE processing recovery is achieved;
  • Gangue in the concentrate is made up entirely of dolomite, ankerite, and calcite in the same relative proportions as the feed;
  • Stoichiometric usage of HCl, NaOH, and oxalic acid for operation of the Figure 8 process;
  • These reagents, along with the heating energy for the caustic treatment, represent the bulk of the operating costs;
  • Reagent and energy unit costs are as follows: 156 US$/t of HCl, 680 US$/t of NaOH (January 2019 prices quoted by a large supplier), 300 $/t of oxalic acid and 0.05 US$/kWh.
The result of the above calculations is shown in Figure 9 for scenarios where progressively more of the test 4 concentrates (1 to 5) are sent to hydrometallurgical processing. As expected, beyond a certain point, the increase in REE revenues brought about by higher recovery becomes insufficient to offset the increase in processing costs incurred by excessive gangue. The optimal point observed is at 74% REE recovery, where the concentrate is made up of 32 wt % REE minerals and 68 wt % carbonate gangue. While this analysis does not take into account the capital expenditures of the above process, it already shows an economic limit to the allowed gangue recovery. More than 50% of the processing costs are ascribed to NaOH consumption. The lower cost of H2SO4 compared to NaOH and HCl explains why many producers choose the sulphuric acid-baking route [31].
This analysis explains why the construction of a cleaner flotation circuit would be easily justified, so long as the REE recovery losses are not excessive. One should also be aware of the fact that a higher grade REE concentrate will contain more radionuclides due to the larger thorium content leading to possible handling constraints.

5. Conclusions

Many REE projects propose processing of ores containing both bastnaesite and monazite using flotation, but the behaviour of individual mineral is rarely investigated. Such a system was studied using the Niobec REE zone ore. Individual mineral recovery values were evaluated using 11 flotation tests conducted following a 23 factorial design. Bastnaesite and monazite recoveries are both first-order rate processes with monazite consistently showing smaller recovery values when compared to bastnaesite. This is ascribed in part to the low degree of liberation and small grain size for monazite. This distinction between the two minerals highlights the importance of individually quantifying their recoveries in complex systems, especially when several valuable species co-exist.
The major gangue minerals are recovered to a similar degree, under all the tested conditions. In other words, the temperature and tested depressants have similar effects on the various gangue minerals, most of which were carbonates. The exact mechanism of gangue mineral recovery remains to be confirmed.
Temperatures from 25 °C to 75 °C were tested along with different depressant dosages. Performance indicators were devised to evaluate the process based on kinetic flotation models and mineral recoveries. Higher temperatures increase bastnaesite flotation rate kbast. while increased dosages of Na2SiO3 improve its ultimate recovery value R∞,bast. The use of separation efficiency S, allows assessment of the combined effects of the factors. Separation efficiency is maximized when both temperature and sodium silicate addition are increased. Although its negative effects were not statistically significant, guar gum addition in this system shows no benefit and should be avoided. Further testing at smaller wt % solids is proposed to distinguish between hydraulic entrainment and actual flotation recovery of gangue in these systems.
Hydrometallurgical processing of REE concentrates containing up to 68 wt % reagent-consuming carbonaceous gangue and 32 wt % REE minerals may be profitable but incur large reagent costs. Going beyond 68 wt % gangue minerals to increase REE recovery is uneconomical in the studied system. Future work should aim to produce higher grade concentrates while maintaining recoveries, in order to reduce processing costs. The resulting decrease in capital and operating costs will encourage REE projects to include hydrometallurgical processing in their flowsheet, a positive outcome for the future of REE production.

Supplementary Materials

The following are available online at https://www.mdpi.com/2075-163X/9/4/225/s1, Spreadsheet S1: Detailed results of flotation tests. Contains reconciled masses and elemental assays for all samples generated during flotation tests.

Author Contributions

Conceptualization, J.-F.B.; Methodology, J.-F.B..; Software, J.-F.B..; Validation, J.-F.B.; Formal Analysis, J.-F.B.; Investigation, J.-F.B.; Resources, N/A.; Data Curation, J.-F.B.; Writing—Original Draft Preparation, J.-F.B.; Writing—Review and Editing, J.-F.B., C.B. and K.T.; Visualization, N/A; Supervision, C.B.; Project Administration, J.-F.B.; Funding Acquisition, C.B.

Funding

This research was funded in part by Niobec/Magris through an NSERC/CRD grant managed by professor Jamal Chaouki from École Polytechnique of Montreal, Qc as well as the Quebec FRQNT program.

Acknowledgments

The authors are grateful to Niobec for its permission to present the article. The laboratory support of Jérémie-Maxime Perron-Jean and of SGS Minerals Canada are also acknowledged. The authors also acknowledge the contribution of Flottec and Rantec for providing some of the reagents used.

Conflicts of Interest

The authors declare no conflict of interest.

References

  1. Habashi, F. Extractive metallurgy of rare earths. Can. Metall. Q. 2013, 52, 224–233. [Google Scholar] [CrossRef]
  2. Krishnamurthy, N.; Gupta, C.K. Extractive Metallurgy of Rare Earths, 2nd ed.; CRC Press: Boca Raton, FL, USA, 2015. [Google Scholar]
  3. Zhang, J.; Edwards, C. A Review of Rare Earth Mineral Processing Technology. In Proceedings of the 44th Annual Canadian Mineral Processors Operators Conference, Ottawa, ON, Canada, 17–19 January 2012; pp. 79–102. [Google Scholar]
  4. Grammatikopoulos, T.; Halliday, M.; Mohns, C.; Mina, C.; Downing, S. An Investigation into Resources, Mineralogical Charactristic and Associated Metallurgical Data for Advanced REE Projects in Canada; Natural Resources Canada: Ottawa, ON, Canada, 2016; pp. 1–204.
  5. Grenier, L.; Tremblay, J.F.; Sirois, R. Technical Report NI 43-101, Updated Mineral Resource Estimate for Rare Earth Elements, 2012, Issued Date March 18, 2013, Amended 19th September 2013; Iamgold Corp.: Toronto, ON, Canada, 2013; pp. 1–166. [Google Scholar]
  6. Hatch, G.; Lifton, J. TMR Advanced Rare-Earth Projects Index. Available online: http://www.techmetalsresearch.com/metrics-indices/tmr-advanced-rare-earth-projects-index/ (accessed on 5 April 2019).
  7. Sauber, M.E.; Zinck, J. Update of Canadian Rare Earths Projects and Technology Trends. In Proceedings of the Canadian Mineral Processors (CMP) Conference, Ottawa, ON, Canada, 17–19 January 2017; pp. 374–389. [Google Scholar]
  8. Pradip; Fuerstenau, D.W. Adsorption of hydroxamate collectors on semisoluble minerals Part II: Effect of temperature on adsorption. Colloids Surf. 1985, 15, 137–146. [Google Scholar] [CrossRef]
  9. Li, M.; Gao, K.; Zhang, D.; Duan, H.; Ma, L.; Huang, L. The influence of temperature on rare earth flotation with naphthyl hydroxamic acid. J. Rare Earths 2018, 36, 99–107. [Google Scholar] [CrossRef]
  10. Wen, Q.G. Use of the QEM∗SEM analysis in flotation testwork on a phosphate ore containing monazite. Int. J. Miner. Process. 1993, 37, 89–108. [Google Scholar] [CrossRef]
  11. Jordens, A.; Zhiyong, Y.; Cappuccitti, F. A New Hydroxamate-Based Flotation Collector for the Flotation or Rare Earth Minerals. In Proceedings of the International Mineral Processing Congress (IMPC), Quebec City, QC, Canada, 11–15 September 2016; pp. 1–12. [Google Scholar]
  12. Satur, J.V.; Calabia, B.P.; Hoshino, M.; Morita, S.; Seo, Y.; Kon, Y.; Takagi, T.; Watanabe, Y.; Mutele, L.; Foya, S. Flotation of rare earth minerals from silicate–hematite ore using tall oil fatty acid collector. Miner. Eng. 2016, 89, 52–62. [Google Scholar] [CrossRef]
  13. Wang, J.; Somasundaran, P.; Nagaraj, D.R. Adsorption mechanism of guar gum at solid–liquid interfaces. Miner. Eng. 2005, 18, 77–81. [Google Scholar] [CrossRef]
  14. Nanthakumar, B.; Grimm, D.; Pawlik, M. Anionic flotation of high-iron phosphate ores—Control of process water chemistry and depression of iron minerals by starch and guar gum. Int. J. Miner. Process. 2009, 92, 49–57. [Google Scholar] [CrossRef]
  15. Negeri, T.; Boisclair, M. Flotation-Magnetic Separation Hybrid Process for Concentration of Rare Earth Minerals Contained in a Carbonatite Ore. In Proceedings of the International Mineral Processing Congress 2016-Rare Earths Symposium, Quebec City, QC, Canada, 11–15 September 2016; pp. 1–14. [Google Scholar]
  16. Boulanger, J.-F.; Bazin, C.; Turgeon, K. Literature Review of the Concentration of Rare Earth Elements (REE) through Flotation Processes. In Technical Report and Presentation for CanMET Mining; Natural Resources Canada: Ottawa, ON, Canada, 2016; pp. 1–68. Available online: http://reechromite.ca/en/rare-earth-elements/publications/ (accessed on 5 April 2019).
  17. Gy, P.M. Sampling of Particulate Materials: Theory and Practice; Elsevier Scientific Publishing Company: Amsterdam, The Netherlands, 1979. [Google Scholar]
  18. Shenyang Florrea Chemicals Co., Ltd. Florrea Reagents (Brochure 2018); Shenyang Florrea Chemicals: Shenyang, China, 2018. [Google Scholar]
  19. Hodouin, D.; Everell, M.D. A hierarchical procedure for adjustment and material balancing of mineral processes data. Int. J. Miner. Process. 1980, 7, 91–116. [Google Scholar] [CrossRef]
  20. Whiten, B. Calculation of Mineral Composition from Chemical Assays. Miner. Process. Extr. Metall. Rev. 2007, 29, 83–97. [Google Scholar] [CrossRef]
  21. Krishnamurthy, N.; Gupta, C.K. Extractive Metallurgy of Rare Earths; CRC Press: Boca Raton, FL, USA, 2004. [Google Scholar]
  22. Jordens, A.; Cheng, Y.P.; Waters, K.E. A review of the beneficiation of rare earth element bearing minerals. Miner. Eng. 2013, 41, 97–114. [Google Scholar] [CrossRef]
  23. Zhang, W.; Honaker, R.Q.; Groppo, J.G. Flotation of monazite in the presence of calcite part I: Calcium ion effects on the adsorption of hydroxamic acid. Miner. Eng. 2017, 100, 40–48. [Google Scholar] [CrossRef]
  24. Pradip; Fuerstenau, D.W. The adsorption of hydroxamate on semi-soluble minerals. Part I: Adsorption on barite, Calcite and Bastnaesite. Colloids Surf. 1983, 8, 103–119. [Google Scholar] [CrossRef]
  25. Zuñiga, H.G. The efficiency obtained by flotation is an exponential function of time. Bol. Min. Soc. Nac. Min. 1935, 47, 83–86. [Google Scholar]
  26. Dunne, R.C.; Kawatra, S.K.; Young, C.A. SME Mineral Processing and Extractive Metallurgy Handbook; Society for Mining, Metallurgy, and Exploration, Inc.: Littleton, CO, USA, 2019. [Google Scholar]
  27. Hines, W.W.; Montgomery, D.C.; Goldsman, D.M.; Borror, C.M. Probability and Statistics in Engineering; Wiley: Hoboken, NJ, USA, 2003. [Google Scholar]
  28. Jordens, A.; Marion, C.; Kuzmina, O.; Waters, K.E. Surface chemistry considerations in the flotation of bastnäsite. Miner. Eng. 2014, 66–68, 119–129. [Google Scholar] [CrossRef]
  29. Ren, J.; Lu, S.; Song, S.; Niu, J. A new collector for rare earth mineral flotation. Miner. Eng. 1997, 10, 1395–1404. [Google Scholar] [CrossRef]
  30. Qi, D. Hydrometallurgy of Rare Earths: Extraction and Separation; Elsevier Science: Amsterdam, The Netherlands, 2018; p. 804. [Google Scholar]
  31. Verbaan, N.; Bradley, K.; Brown, J.; Mackie, S. A review of hydrometallurgical flowsheets considered in current REE projects. In Proceedings of the Symposium on critical and strategic materials, Victoria, BC, Canada, 13–14 November 2015; pp. 147–162. [Google Scholar]
  32. Dutrizac, J.E. The behaviour of the rare earth elements during gypsum precipitation. Hydrometallurgy 2017, 174, 38–46. [Google Scholar] [CrossRef]
  33. Bohlmann, E.G.; Calkins, G.D. Processing of Monazite Sand. U.S. Patent 2,815,264, 3 December 1957. [Google Scholar]
  34. Gambogi, J. Mineral Commodity Summaries 2018-Rare Earths; United States Geological Survey: Reston, VA, USA, 2019.
Figure 1. Elemental recovery as a function of flotation time for test 4.
Minerals 09 00225 g001
Figure 2. Mineral recovery as a function of time for tests 1, 7, and 10 (central point).
Minerals 09 00225 g002
Figure 3. Mineral recovery as a function of time for experiment 4 (75 °C, 2400 g/t Na2SiO3, 0 g/t guar gum). (a) Overall; (b) Close-up on gangue minerals.
Minerals 09 00225 g003
Figure 4. Grade-recovery curve for central points.
Minerals 09 00225 g004
Figure 5. Grade-recovery curves for selected flotation tests.
Minerals 09 00225 g005
Figure 6. Measured (points) and modelled (lines) for test 7 (central point).
Minerals 09 00225 g006
Figure 7. Monazite ultimate recovery R,monaz. as a function of gangue recovery Rg,32.
Minerals 09 00225 g007
Figure 8. Process proposed for REE flotation concentrates.
Minerals 09 00225 g008
Figure 9. Calculated costs, revenues and profits (dashed) of hydrometallurgical processing as a function of REE recovery.
Minerals 09 00225 g009
Table 1. Composition of Niobec rare earth element (REE) zone ore tested.
GroupMineralFormulaWeight %
REE mineralsBastnaesite/SynchysiteCeFCO3/CaCeF(CO3)21.96
MonaziteCePO41.43
Allanite(Ce,Ca)2(Al,Fe3+)3(SiO4)3(OH)0.13
OxidesIron oxidesFe2O3/Fe3O45.85
SilicatesQuartzSiO20.92
Mica/ClayKAl2(Si3Al)O10(OH,F)21.15
Amphibole(Fe,Mg,Ca)SiO30.75
Chlorite(Mg,Al,Fe)12[(Si,Al)8O20]OH164.43
CarbonatesDolomiteCaMg(CO3)250.00
CalciteCaCO313.20
AnkeriteCa[Mg,Fe](CO3)213.70
SideriteFeCO30.21
SulfidesPyriteFeS22.87
PhosphatesApatite(F,Cl,OH)Ca5(PO4)30.28
SulfatesBaryteBaSO41.99
Others 1.13
Total 100
Table 2. Duration and collector addition for the flotation procedure.
StepDuration (min.)
Ground solid addition and stabilization5
Depressant addition 5
Collector addition 1 (1200 g/t)5
Roughing 14
Collector addition 2 (150 g/t)3
Roughing 24
Collector addition 3 (150 g/t)3
Roughing 34
Collector addition 4 (150 g/t)3
Roughing 48
Collector addition 5 (150 g/t)3
Roughing 512
Total59
Table 3. Mineral compositions and feed composition. (EMPA, Electron Microprobe Analysis).
MineralWt %SourceElemental Weight Fraction (%)
MgAlSiCaMnFeLaCeNdThP
Bastnaesite1.96EMPA 5.8 2.411.522.79.51.0
Monazite1.43EMPA 0.311.522.79.53.111.4
Fe-oxides5.85Database0.0 69.2
Fe-Chlorite4.43Database0.010.611.6 0.0
Dolomite50Database13.2 21.7 3.3
Calcite13.2Database 40.0
Ankerite13.7Database0.0 14.99.224.8
Feed (calculated % w/w)6.60.50.518.31.39.10.40.80.30.10.2
Feed (measured % w/w)6.60.51.018.31.310.40.40.70.30.10.2
Difference (% relative)0.30.8-5.70.80.00.00.20.00.010.07.1
Underlined values are adjusted from initial source estimate.
Table 4. Factorial design test conditions.
Test1234567891011
Temperature (°C)5075757575255025255025
Sodium Silicate dosage (g/t)12000024002400012000240012002400
Guar gum dosage (g/t)2000400040002004000200400
Table 5. Calculated flotation feed elemental compositions (wt %).
TestMgAlSiPCaTiMnFeYLaCeNdTh
16.650.450.990.2318.40.101.2710.50.0090.350.710.280.057
26.570.450.980.2318.40.101.2810.50.0080.360.720.290.056
36.900.451.000.2718.40.101.2710.50.0080.360.730.260.059
46.470.450.990.2518.40.111.2810.60.0080.360.740.290.058
55.990.380.940.1617.40.101.2110.10.0090.350.710.260.058
66.760.480.990.2418.00.091.2410.20.0080.320.660.270.049
76.860.500.990.2018.40.101.2710.50.0090.350.720.270.058
86.720.531.020.2518.30.101.2710.50.0090.340.710.260.054
96.040.451.020.2318.40.101.2810.50.0080.360.740.260.058
106.680.521.020.2518.30.101.2810.50.0090.360.740.270.059
116.630.461.020.2818.30.101.2710.50.0090.350.720.270.056
Mean6.570.471.000.2418.30.101.2710.40.0080.350.720.270.057
Rel. std. dev.*5%9%3%15%2%5%2%1%7%3%3%4%5%
* Relative standard deviation.
Table 6. Flotation feed mineral compositions (wt %).
TestDolomiteChloriteCalciteFe-oxidesAnkeriteBastnaesiteMonaziteΣ
150.44.2913.25.9513.81.691.3590.7
249.94.2213.65.9613.81.871.2490.6
352.44.2612.25.8213.81.821.2591.5
449.14.2413.96.0313.91.931.3190.4
545.43.6313.66.1213.11.741.3084.9
651.34.5211.95.4713.41.761.0889.4
752.04.7312.45.6113.81.731.3291.6
851.04.9812.75.6013.81.841.1691.0
945.94.2315.76.2013.91.921.2188.9
1050.74.9012.95.6713.81.831.3091.1
1150.34.3613.25.9013.71.841.2390.5
Mean49.84.4013.25.8513.71.821.2590.1
QEMScan50.04.4313.25.8513.71.961.4390.6
Table 7. Conditions and results of flotation tests.
TestTemp.Na2SiO3Guar gumpHR∞,bast.kbast.R∞,monaz.kmonaz.Rg,32G75S
(°C)(g/t)(g/t)(%)(min−1)(%)(min−1)(%)(%)(%)
15012002009.196.20.1977.80.0524.513.056
275008.387.10.1163.80.0613.712.560
37504008.196.50.2375.80.1024.218.962
475240009.2100.00.2252.50.096.830.673
57524004009.2100.00.2270.60.0817.115.466
625008.996.40.1170.40.0534.77.444
75012002009.194.50.2678.10.0834.213.152
82504008.893.70.1192.90.0667.86.918
9252400010.2100.00.1461.30.0611.120.671
105012002009.194.00.2186.40.0632.214.754
1125240040010.398.90.1061.30.0819.411.359
Central point (1, 7, and 10) average and standard deviation94.9 ± 1.10.22 ± 0.0380.7 ± 4.80.06 ± 0.0130.2 ± 5.113.5 ± 0.953.6 ± 2.1
Table 8. Main effects of investigated factors on results.
FactorEffect On
R∞,bast.kbast.R∞,monaz.kmonaz.Rg,32G75S
(%)(min−1)(%)(min−1)(%)(%)(%)
Temp. (°C)−0.70.040−2.90.011−8.93.98.7
Na2SiO3 (g/t)3.20.014−7.20.006−10.74.010.5
Guar gum (g/t)0.70.0106.60.0067.8−2.3−5.3

