Article

Mineralogical and Chemical Characterization of Zr-REE-Nb Ores from Khalzan Buregtei (Mongolia)—Approaches to More Efficient Extraction of Rare Metals from Alkaline Granitoids

1
Institute of Applied Mineralogy and Economic Geology, RWTH-Aachen University, Wüllnerstraße 2, 52062 Aachen, Germany
2
Unit of Mineral Processing, RWTH-Aachen University, Lochnerstraße 4-10 Haus C, 52064 Aachen, Germany
3
German-Mongolian Institute of Resource Technology, GMIT Campus, 2nd khoroo, Nalaikh district, Ulaanbaatar, Mongolia
*
Author to whom correspondence should be addressed.
Minerals 2019, 9(4), 217; https://doi.org/10.3390/min9040217
Submission received: 11 February 2019 / Revised: 21 March 2019 / Accepted: 3 April 2019 / Published: 5 April 2019

Abstract

:
Alkaline rocks are worldwide observed as hosts for rare metal (Zr-REE-Nb) minerals. The classification of the ore bearing rock type is challenging due to the fact that textures and mineral assemblage are obscured by post-magmatic alteration. In addition, the alteration causes fine and intricate intergrowth of the ore minerals with associated gangue. Hence, intensive comminution is necessary to liberate the ore minerals, which is one parameter hampering the economical use of this deposit type. This study provides a quantitative mineralogical investigation of the ore bearing rock suite at Khalzan Buregtei as an example of rare metal deposits. R1-R2 multication parameters are shown to be highly appropriate as quantitative mineralogical indicators based on readily available major element datasets to visualize and quantify alteration types of the ore bearing rock suite. The ore minerals were found to be associated with a cluster-forming assemblage of post-magmatic phases. Automated mineralogy was applied to quantify the textural properties of the ore mineral clusters. This finding permits efficient pre-concentration of rare metal ore at coarser particle size fraction, requiring less energy consuming comminution.

1. Introduction

Alkaline granite and syenite magmatic rocks are characterized by a remarkable enrichment of high field-strength elements (HFSEs), including Zr, Nb, Y, U as well as the rare earth elements (REEs). The unusual trace element composition of alkaline rocks is in line with elevated abundances of complex and rare HFSE minerals, which have attracted both petrologists and economic geologists for a long time [1,2,3]. Evolving technical capabilities (e.g., high performance magnets, super-alloys, phosphors, superconductors, ceramics) and a growing high-tech based economy have enhanced the global demand for HFSEs, such as Zr, Nb, Y, or, particularly, Nd, Eu, Tb and Dy among the REE. Notwithstanding, a substantial part of these commodities (i.e., REE, Y, Nb) has a critical character indicative of supply risk for political or environmental reasons [4]. As a response to this situation, alkaline granite and syenite complexes have also come into the focus of exploration campaigns and mining feasibility studies in the last decade (e.g., Khalzan Buregtei, Strange Lake, Motzfeld, Norra Kärr [1,5,6,7]).
Enrichment of HFSE to enhanced grades in alkaline intrusions is generally thought to be caused by magmatic fractionation, but mineralogical and petrologic evidence often points to post-magmatic pneumatolytic or hydrothermal processes. Post-magmatic mineralization events are commonly associated with intensive and highly variable alteration types of both intrusive and wall rocks, thereby superimposing primary petrographic features [1,2,6,8,9,10].
As a consequence, alkaline granites and syenites show a broad range of mineralogical and textural characteristics. Most apparent, these rocks display outstanding associations of rare minerals—among these are also ore phases incorporating the HFSEs as major elements (e.g., elpidite, eudialyte, gittinsite, zircon; Nb pyrochlore; REE + Y monazite, bastnaesite, synchysite, and several REE-silicates). Furthermore, formation in multistage and partially superimposing magmatic to hydrothermal processes frequently leads to narrow and complex intergrowths of fine grained and irregularly sized and shaped crystals. Thus, such rocks display a remarkable spatial variability and heterogeneity in terms of mineral composition, grain size, mineral association, and texture [1,9,10].
In general, these mineralogical and textural characteristics of alkaline rocks represent obstacles for efficient exploration and ore beneficiation, as will be outlined in this study. Owing to the marked mineralogical complexity, alkaline rock classification comprises a confusing multiplicity of partly unfamiliar names, many of these derived with reference to single locations only [11] (p. 558). The multitude of classifying terms is a source of incongruence in field data or core logs in exploration campaigns if work is carried out by different geologists or companies. Furthermore, classification of alkaline rocks implies magmatic genesis and does not reflect intensity of post-magmatic hydrothermal mineral formation. This leads to terminological indistinctness with potential negative effects for data handling, e.g., in 3D numeric deposit modelling.
As a consequence of small grain sizes and intricate intergrowth, liberation sizes of ore minerals can be low. Mining operators have to cope with intensive and energy consuming grinding as well as processing of fine fractions to produce marketable concentrates with acceptable recoveries. In addition to causing high energy costs, the processing of fine fractions of polymineralic ores, comprising phases with different physical properties (e.g., density, magnetic susceptibility), is likely to be inefficient. Such handicaps for efficient, economic, and sustained mining represent bars to the development of prospects associated with alkaline granites and syenites.
In this study the alkaline granite hosted Zr-REE-Nb deposit of Khalzan Buregtei (Mongolia), which was a target of exploration work by different companies in recent years, is used for a case study to demonstrate characteristic problems associated with these types of deposits. Based on results of published studies of the magmatic and post-magmatic (i.e., hydrothermal) evolution of the complex [5,12,13,14,15], detailed sampling work was carried out in the central part of the complex, which is most affected by Zr-REE-Nb mineralization. In contrast to a number of detailed petrological studies addressing genesis and potential processes of either magmatic or metasomatic enrichment of rare metals in the alkaline granite of Khalzan Buregtei [5,13,14,15], this study particularly focusses on the identification of ore properties, which are crucial for the economic exploitation of the mineralized rocks of this deposit.
Whole rock chemical major and trace element composition, chemical composition of HFSE minerals dominating the ore assemblage, and comprehensive textural datasets were determined in characteristic rock specimens. In particular, this study aims to investigate the influence of post-magmatic alteration on classification and to develop solutions to handle terminological indistinctness in such highly altered alkaline rocks. A second target of the study is to characterize mineralogical and textural effects of ore mineralization, to indicate handicaps for mineral processing, but also to discuss the potential of mineralogical and textural characteristics of Zr-REE-Nb mineralization in alkaline rocks to yield enhanced recoveries.

2. Geological Setting

The Khalzan Buregtei massif is situated in west Mongolia Altai mountains approximately 50 km north of the city of Hovd. It was discovered in 1984 by geologists of the former Soviet Union [13]. The complex covers an area of 30 × 8 km and is mainly built up by alkaline syenite to granitic rocks considered to be associated with early Devonian extensional tectonic activity [5]. The Khalzan Buregtei Zr-REE-Nb deposit itself is located in the centre of a roughly oval shaped intrusive body in the south of the massif (Figure 1). The part of the intrusion hosting the deposit is dominated by alkali granites, which are distinct to the surrounding syenitic rocks, classified as nordmarkites by the first investigators [13,14] and in the recent work of [15]. The latter authors assign the mineralized alkali granites to a fifth and seventh intrusive stage, whereas [5] classify the mineralized rocks as ore metasomatites, attesting to the strong imprint of post-magmatic hydrothermal processes. Syenites contacting the central granites were affected by hydrothermal activity as well. Major faulting of the working area postdates the ore formation indicated by the displacement of the rock suite as illustrated in Figure 1. According to [5] the major rare metal deposit of Khalzan Buregtei has an ore content of 2.4 × 10⁶ t ZrO2, 3.5 × 10⁵ t Nb2O5, and 4.9 × 10⁵ t REE2O3 + 1.3 × 10⁵ t Y2O3. The mechanism of rare metal enrichment to final grades has been discussed controversially in recent years by several authors [5,14,15]. The work of [5] explains the ore formation by multistage post-magmatic alteration on the basis of a previous enrichment of alkaline magma with HFS and other rare metals. The post-magmatic alteration is triggered by fluids from further unspecified carbonatite plutons, which explains the abundance of Ca bearing Zr-silicates and carbonates. However, the recent work of [15] discussed the formation of the rare metal granite (V-Phase [14,15]) and the aforementioned ore minerals by differentiated crystallization of alkaline magma strongly enriched in HFSE and other rare metals. The formation of Ca bearing phases is assumed to be caused by enrichment of Ca following assimilation of adjacent limestones in the melt [15].

3. Materials and Methods

3.1. Sampling Method and Bulk Rock Chemical Analysis

The ore bearing rocks of the Khalzan Buregtei deposit were investigated in two particularly well exposed areas characteristic of the central domain (Figure 1A). The deposit covers an area of approximately 1 km² of mountainous arid landscape. The central part of the deposit is built of one central ridge with an elevation up to 1940 m bordering, to the west and east, two valleys filled with sediments and debris.
A sample suite taken from the central ridge was indicated by the addition of KB G to the sample numbers. Another sample suite was taken from one more shallow ridge beyond the western, valley having good accessibility and outcrop condition. Latter samples were named KB S. Samples were taken along outcrop sections, where a macroscopic change in mineralogy and/or texture was recognizable. Hand specimens were later investigated for homogeneity prior to further treatment. In total, 18 samples, each approximately 1 kg in weight, were taken in both outcrop areas. After splitting into two sub-samples one set of sub-samples was crushed by manual crushing and further comminuted using a rotating disc mill (Siebtechnik GmbH, Mühlheim an der Ruhr, Germany). The sample powder was analysed for bulk rock chemical composition at ALS Analytical Service, affiliation Loughrea, Ireland, applying a combined ICP-AES and ICP-MS method after Li-borate fusion (ALS Method Codes: ME-MS81d). Representative blocks were dissected from the other set of the sub-samples for the preparation of polished thin-sections for optical petrological microscopy, electron optical investigation by QEMSCAN© (FEI/Thermo Fisher, Hillsboro, OR, USA), and electron probe micro analyser (EPMA).
Zirconium concentration data were obtained by X-ray fluorescence (XRF) measurement at the Unit of Mineral Processing, RWTH-Aachen University, Niton XL3t (Thermo Fisher, Waltham, MA, USA) with the handheld XRF system. The measurements were performed with three replicates on pressed powder pellets created with 8 g of air-dried sample powder. Data was validated by an external quality check using NIM-L lujavrite standard reference material [17] prepared and handled like the unknowns.

3.2. SEM Based Semi-Automated Mineralogy (QEMSCAN©)

Semi-automated mineralogical analyses were performed by applying a Quanta 650-F QEMSCAN© (FEI/Thermo Fischer) scanning electron microscope (SEM) at the Institute of Applied Mineralogy and Economic Geology, RWTH-Aachen University [18]. Polished thin sections and polished sections were analysed after carbon coating. The measurements were conducted with an acceleration voltage of 25 kV and a fixed sample current of 10 nA. The surface of each sample section was scanned with a spatial resolution of 5 µm. Back scatter (BSE) intensities and individual X-ray spectra were recorded for each pixel with a 4-quadrant BSE detector and two DualXFlash 5030 SDD (Bruker AXS, Karlsruhe, Germany) energy dispersive x-ray spectrometers (EDX). Phase assignment was carried out by comparison of spectral data obtained for each pixel with library information using the iDiscover (Version 5.3.2.501, FEI/Thermo Fisher, Hillsboro, OR, USA) software suite. Automated image analysis was applied to phase maps to compute quantitative mineralogical and textural parameters. The modal composition of each sample in volume (vol.) % was calculated from the volumetric abundance of each mineral phase. Particle size calculations were conducted by measurement of the diameter of the virtual sphere with equivalent perimeter length assigned to each individual target phase [19]. Particle populations were obtained by segmentation of the target minerals or mineral assemblage from QEMSCAN© phase maps.

3.3. Electron Probe Micro Analyzer (EPMA)

The JXA-8900R electron probe micro analyser (Jeol, Jeol Germany GmbH, Freising, Germany), of the Institute of Applied Mineralogy and Economic Geology, RWTH-Aachen University, was used for high-resolution element mapping and for quantitative chemical analyses of ore-forming minerals. For element mapping, the instrument was operated with a focused electron beam and an acceleration voltage of 20 kV. Each pixel of 1 µm size was measured with a dwell time of 50 ms. The setup for the five wavelength dispersive spectrometers of the EPMA is given in the Appendix A (Table A1).
Quantitative analyses of the mineral chemistry were conducted on different ore minerals. REE-carbonate minerals were analysed with an acceleration voltage of 15 kV and an electron beam of 10 µm diameter to avoid intensive damaging of the target minerals. Zircon, in contrast, was analysed with an increased acceleration voltage of 20 kV and a focused electron beam. The beam current was set in all analytical sessions to 24 nA. Detailed spectrometer setup parameters, like peak and background recording times, as well as standards, are given in the Appendix A (Table A2 and Table A3).

4. Results

4.1. Petrography

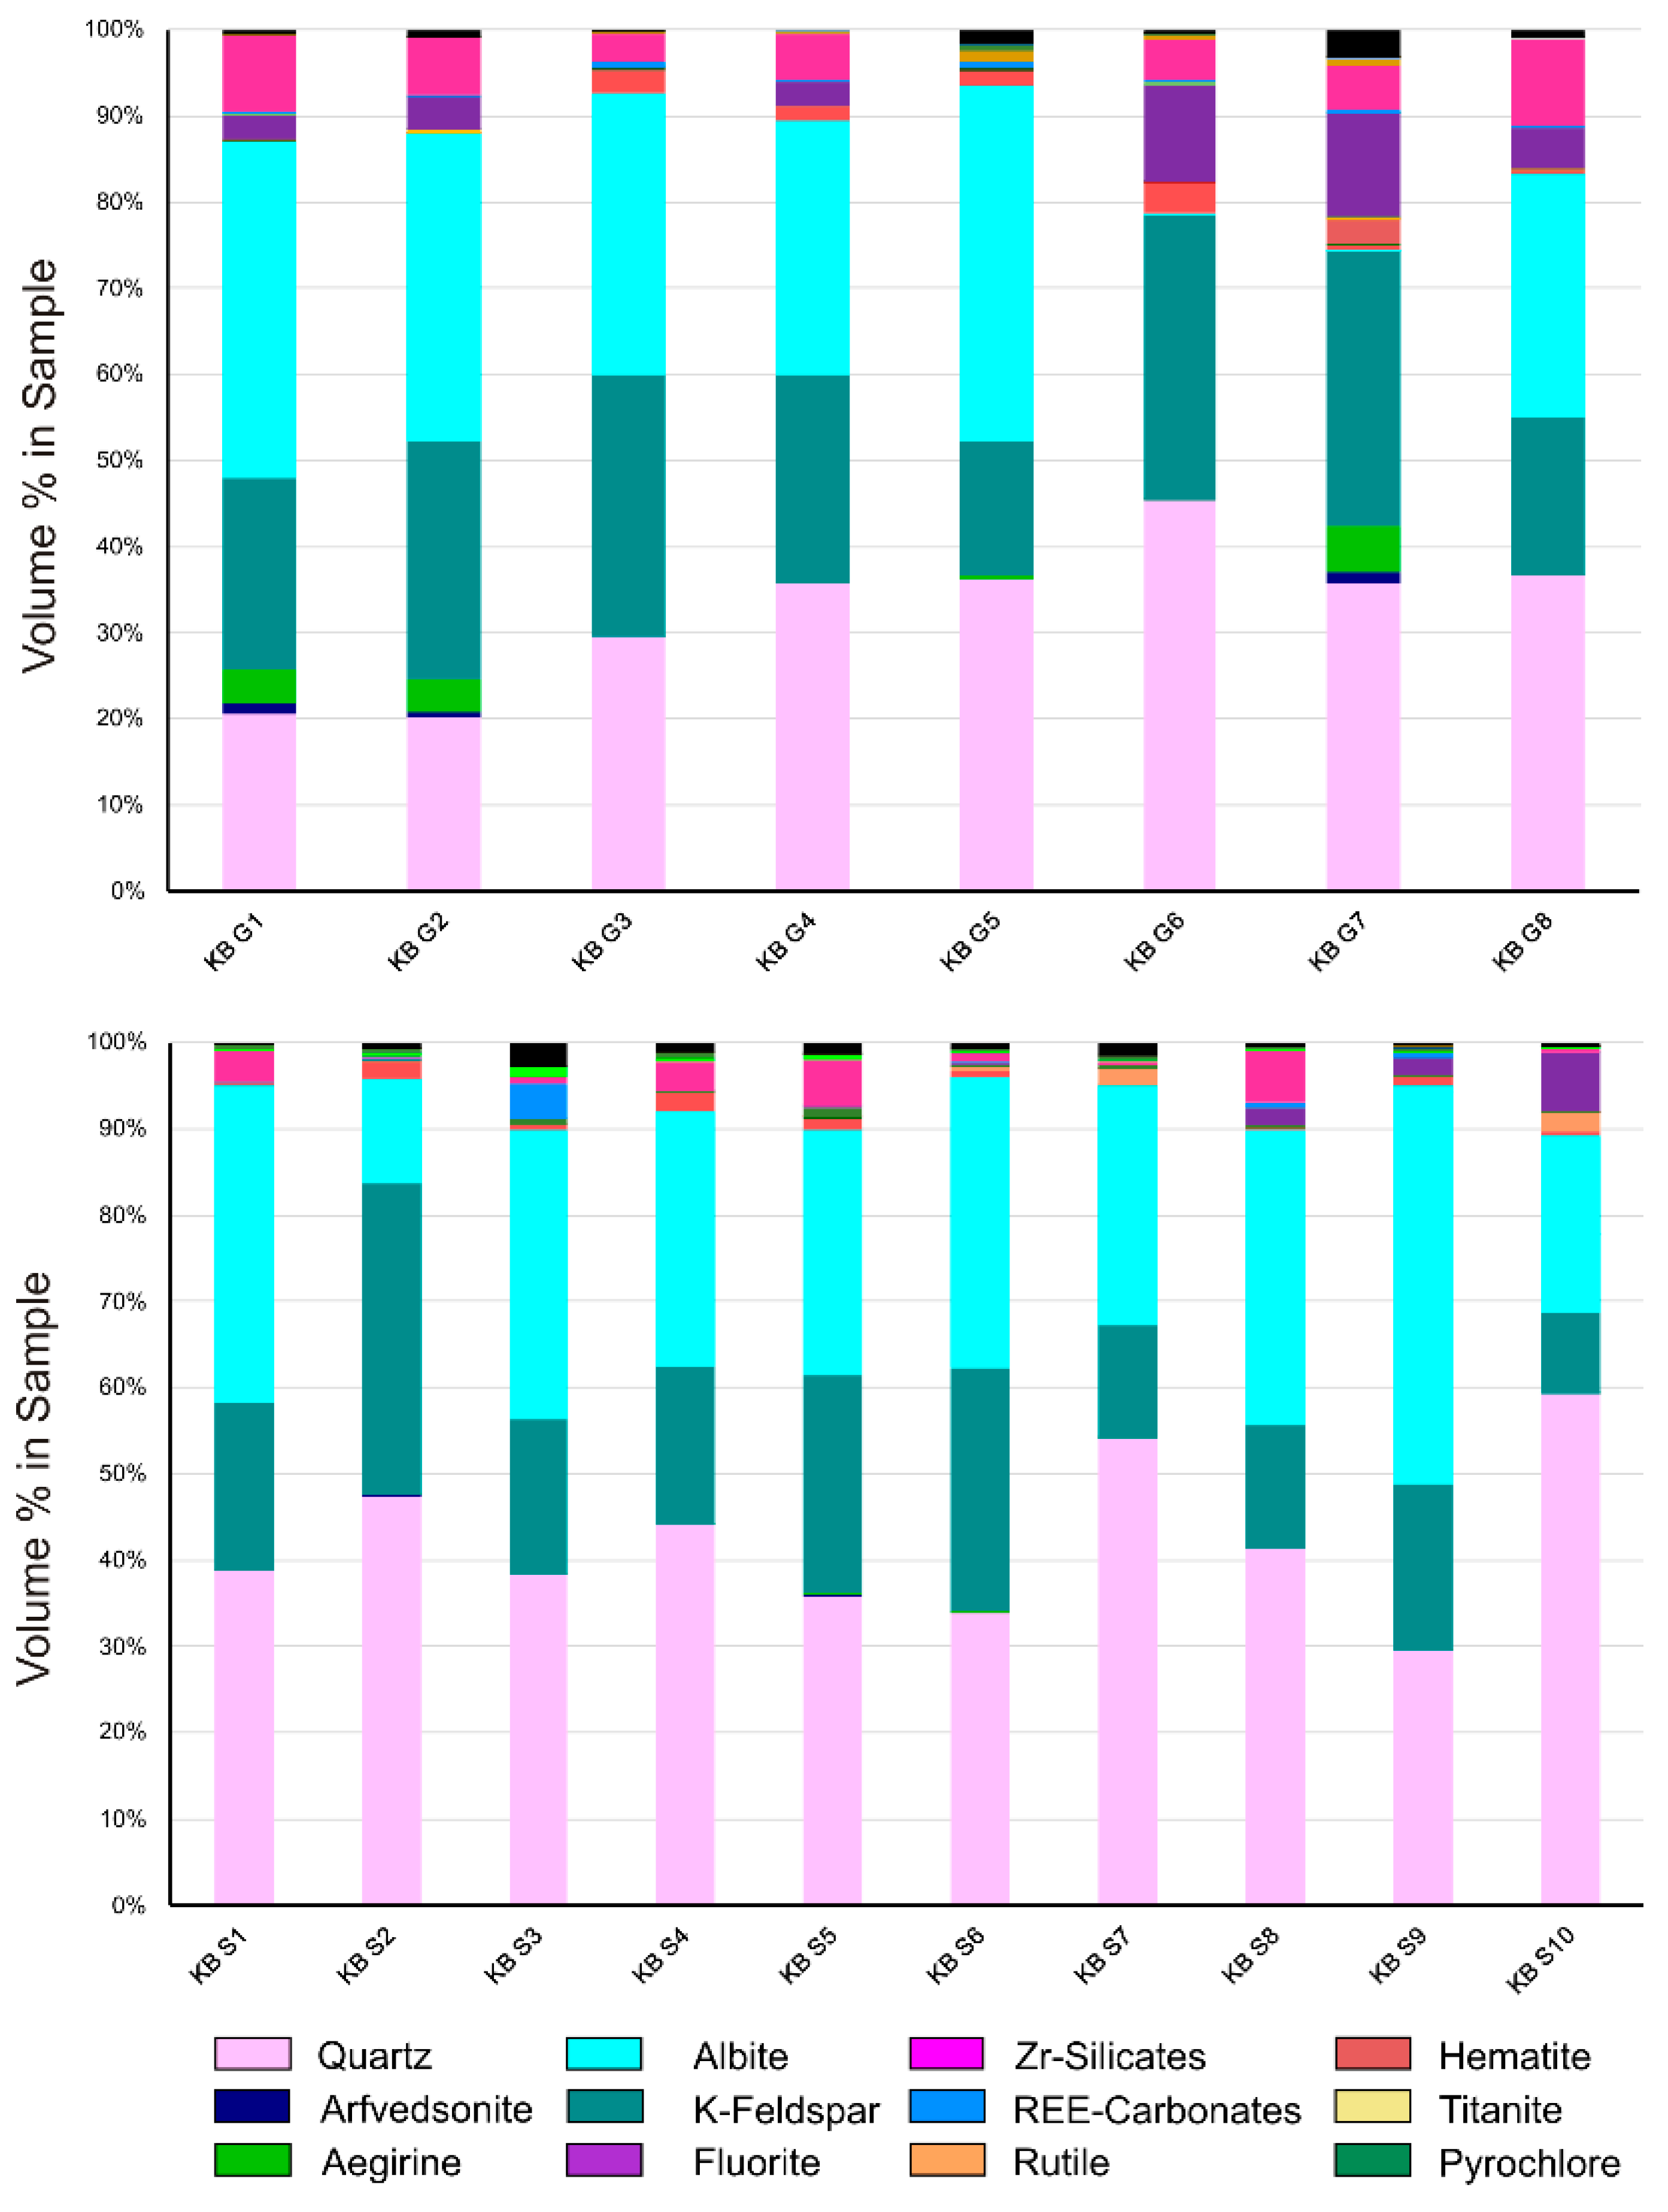
Quartz, K-feldspar, and albite are the dominant rock-forming minerals and in total account for more than 70 vol. % in all samples. The mafic minerals arfvedsonite and aegirine are less abundant (<5 vol. %) and can only locally be observed (Figure 2). Despite the variable proportions of the rock forming minerals, mainly showing higher quartz abundances in the KB-S sampling area, all samples, excluding one, can be classified as alkali granites in terms of the terminology of [20] for magmatic rocks. Only the sample KB S10 was classified as quartz rich granitoid rock due to a significantly higher abundance of quartz. All samples show variable proportions of HFSE ore minerals, such as Zr silicates, REE-carbonates, pyrochlore, as well as of hematite, rutile, titanite, or fluorite (Figure 2).
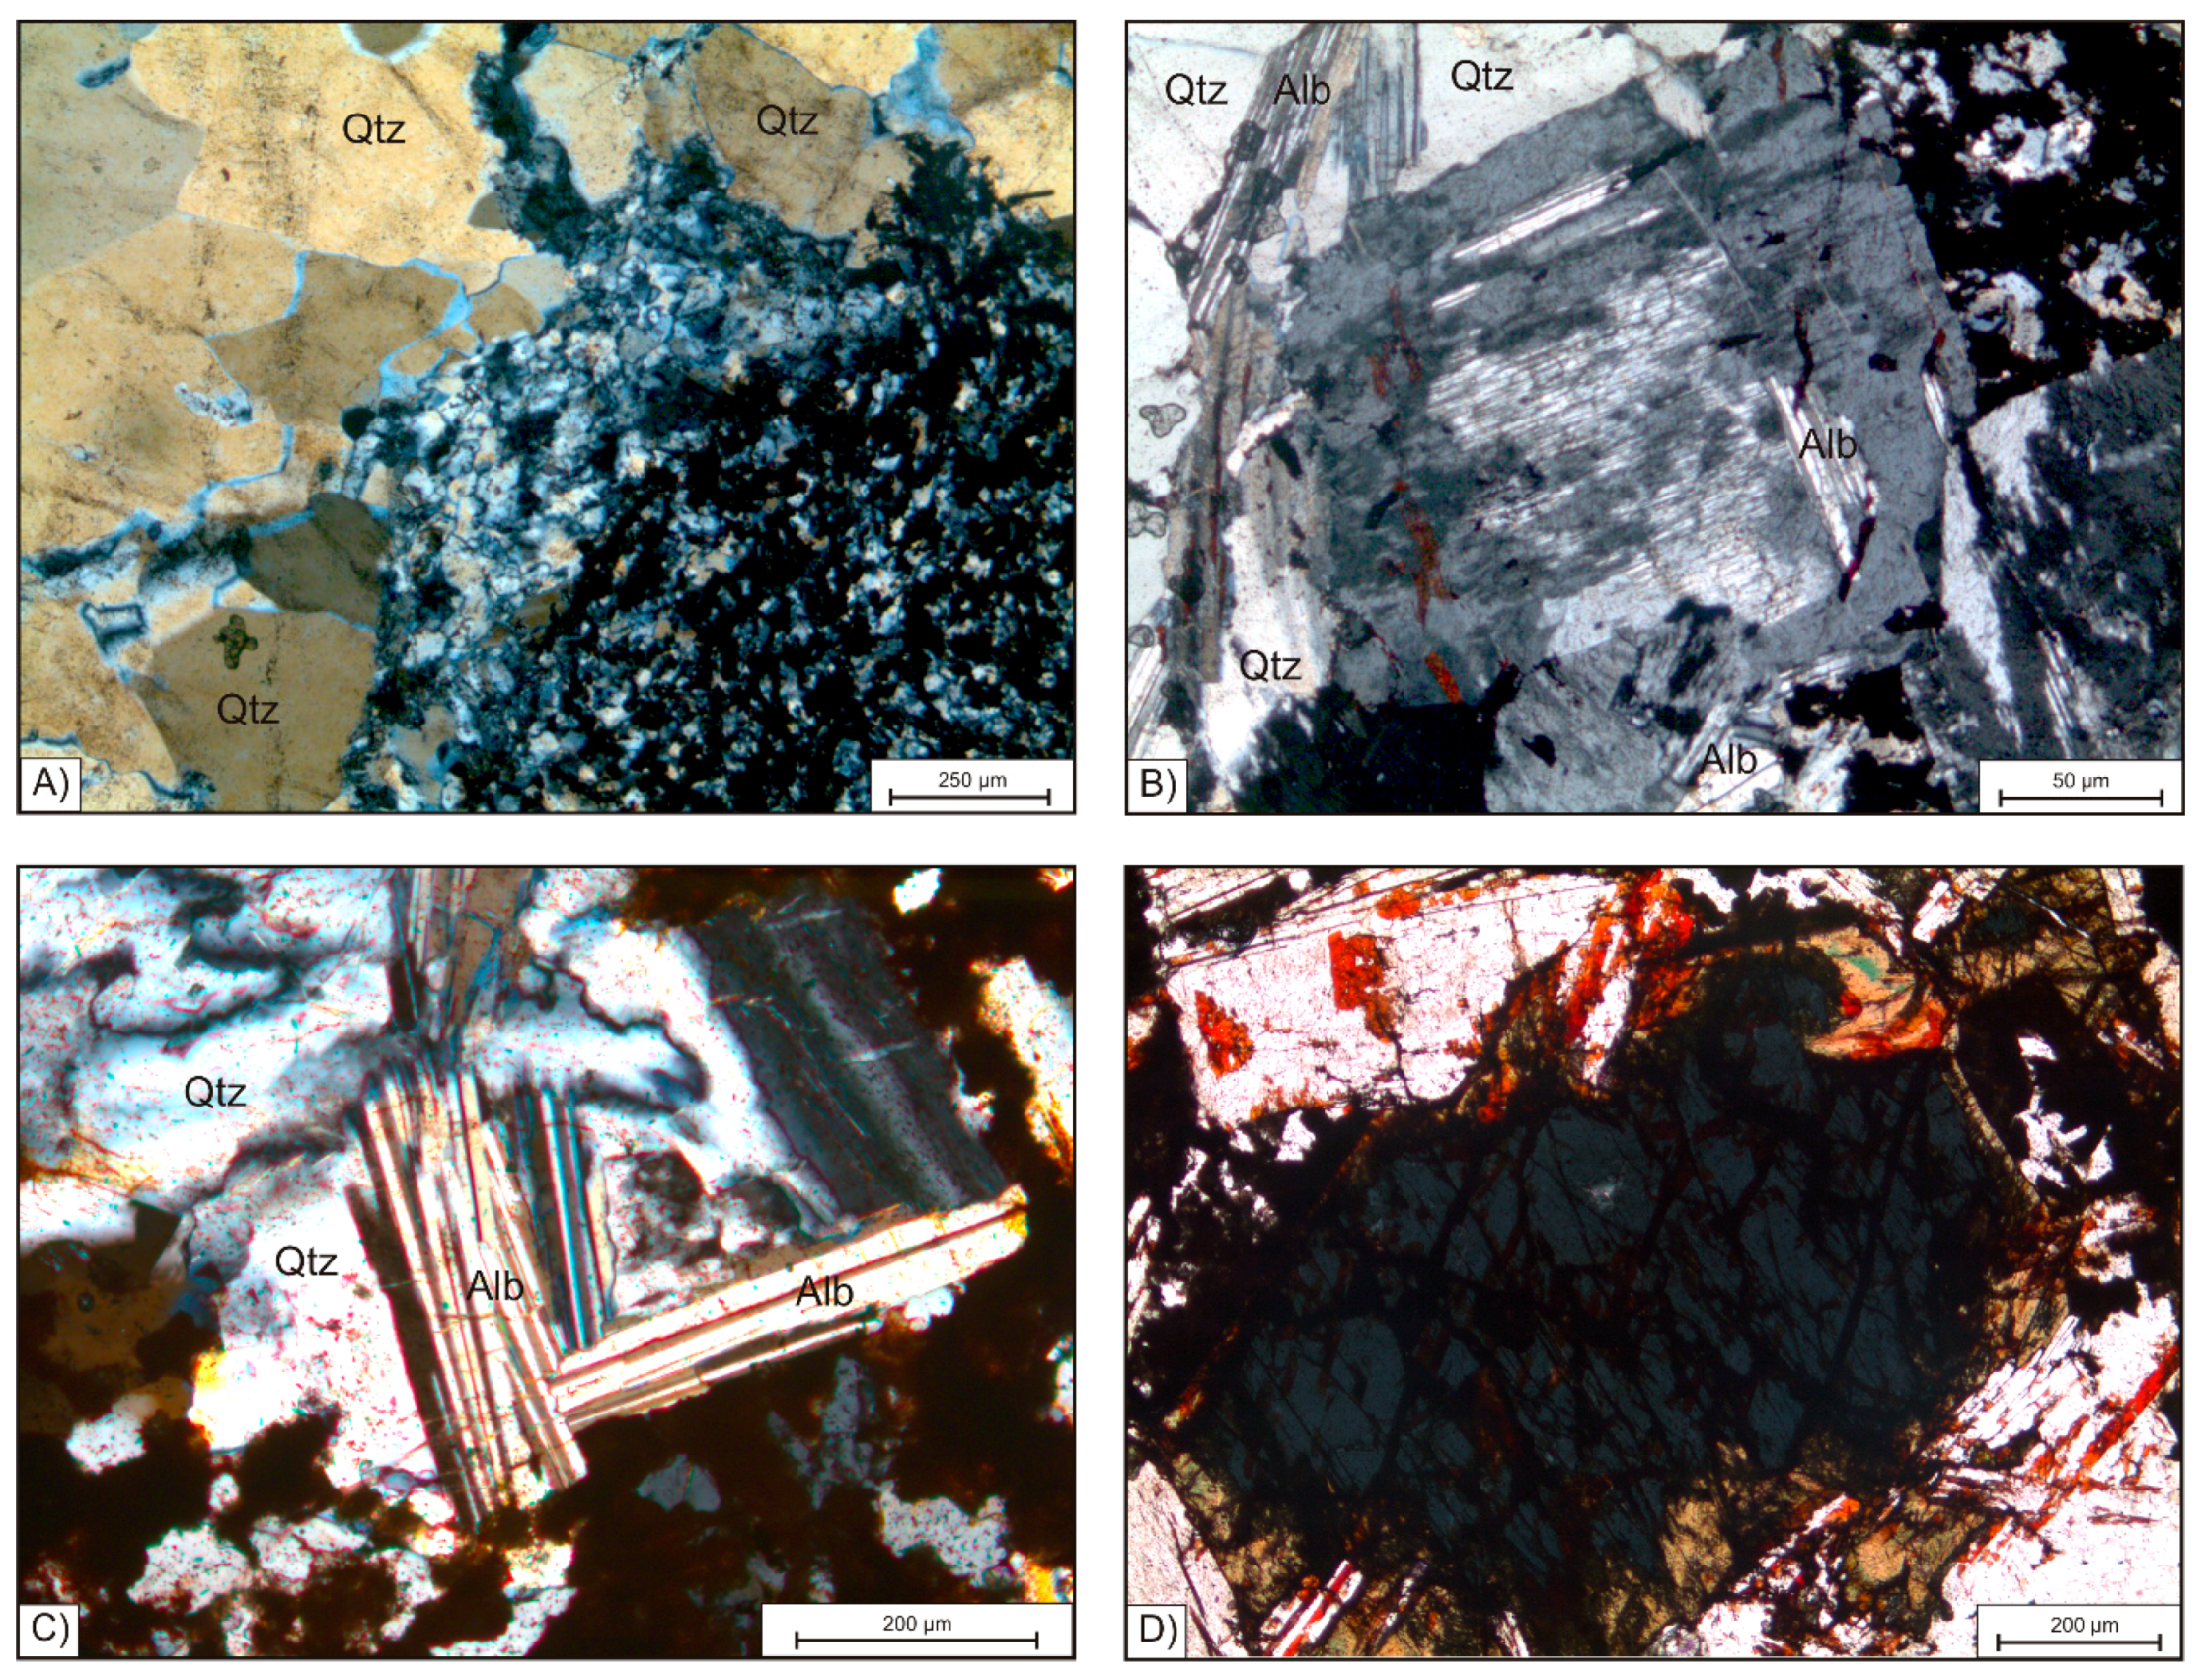
Quartz is present in all samples and shows a variation in grain size. The coarse fraction is represented by quartz grains up to 2 mm in KB G and up to 5 mm in KB S. Some grains show snowball structures enclosing other mineral phases like K-feldspar and albite. Further, big crystals of quartz show evidence of ductile deformation, like bulging and the formation of sub grains (Figure 3A, yellowish). In addition to the coarse fraction, a fraction of fine quartz grains can be observed. The latter is strongly intergrown with HFSE minerals, as well as with hematite and fluorite (Figure 3A).
K-feldspar shows a size distribution similar to the coarse grained quartz in both sample suites. Irregularly shaped crystal domains inside of K-feldspar grains may represent relict hatch-twin domains formed in earlier microclinization (Figure 3B). Euhedral K-feldspar is in close association to albite, which can be observed parallel to grain boundaries. K-feldspar often shares straight boundaries with coarse grained quartz (Figure 3B).
Albite forms lath shaped crystals varying in grain size from 50 µm to 400 µm (Figure 3C). Coarse laths of albite, however, are found at the edges of coarse grained snowball quartz and K-feldspar grains. Fine albite crystals can be observed in interstitial volumes of quartz and K-feldspar. Evidence of the replacement of quartz and K-feldspar by albite is dominant in all samples from the centre of the Khalzan Buregtei deposit. The close intergrowth of lath-shaped albite crystals with each other leads to the formation of a matrix-like texture observable in all samples containing high amounts of albite.
The mafic minerals arfvedsonite and aegirine occur in the rocks with a grain size up to 1 mm but with low modal abundance. As Figure 2 shows, significant amounts are only observed in the samples KB G1, G2, and G9. Arfvedsonite is euhedral and shows good cleavage. Aegirine forms halos surrounding arfvedsonite as illustrated in Figure 3D. Ongoing replacement reaction from arfvedsonite to aegirine is observed propagating along amphibole cleavage plains. Aegirine is further replaced by albite laths. Albite grains in contact with arfvedsonite and aegirine often show red staining (Figure 3D).
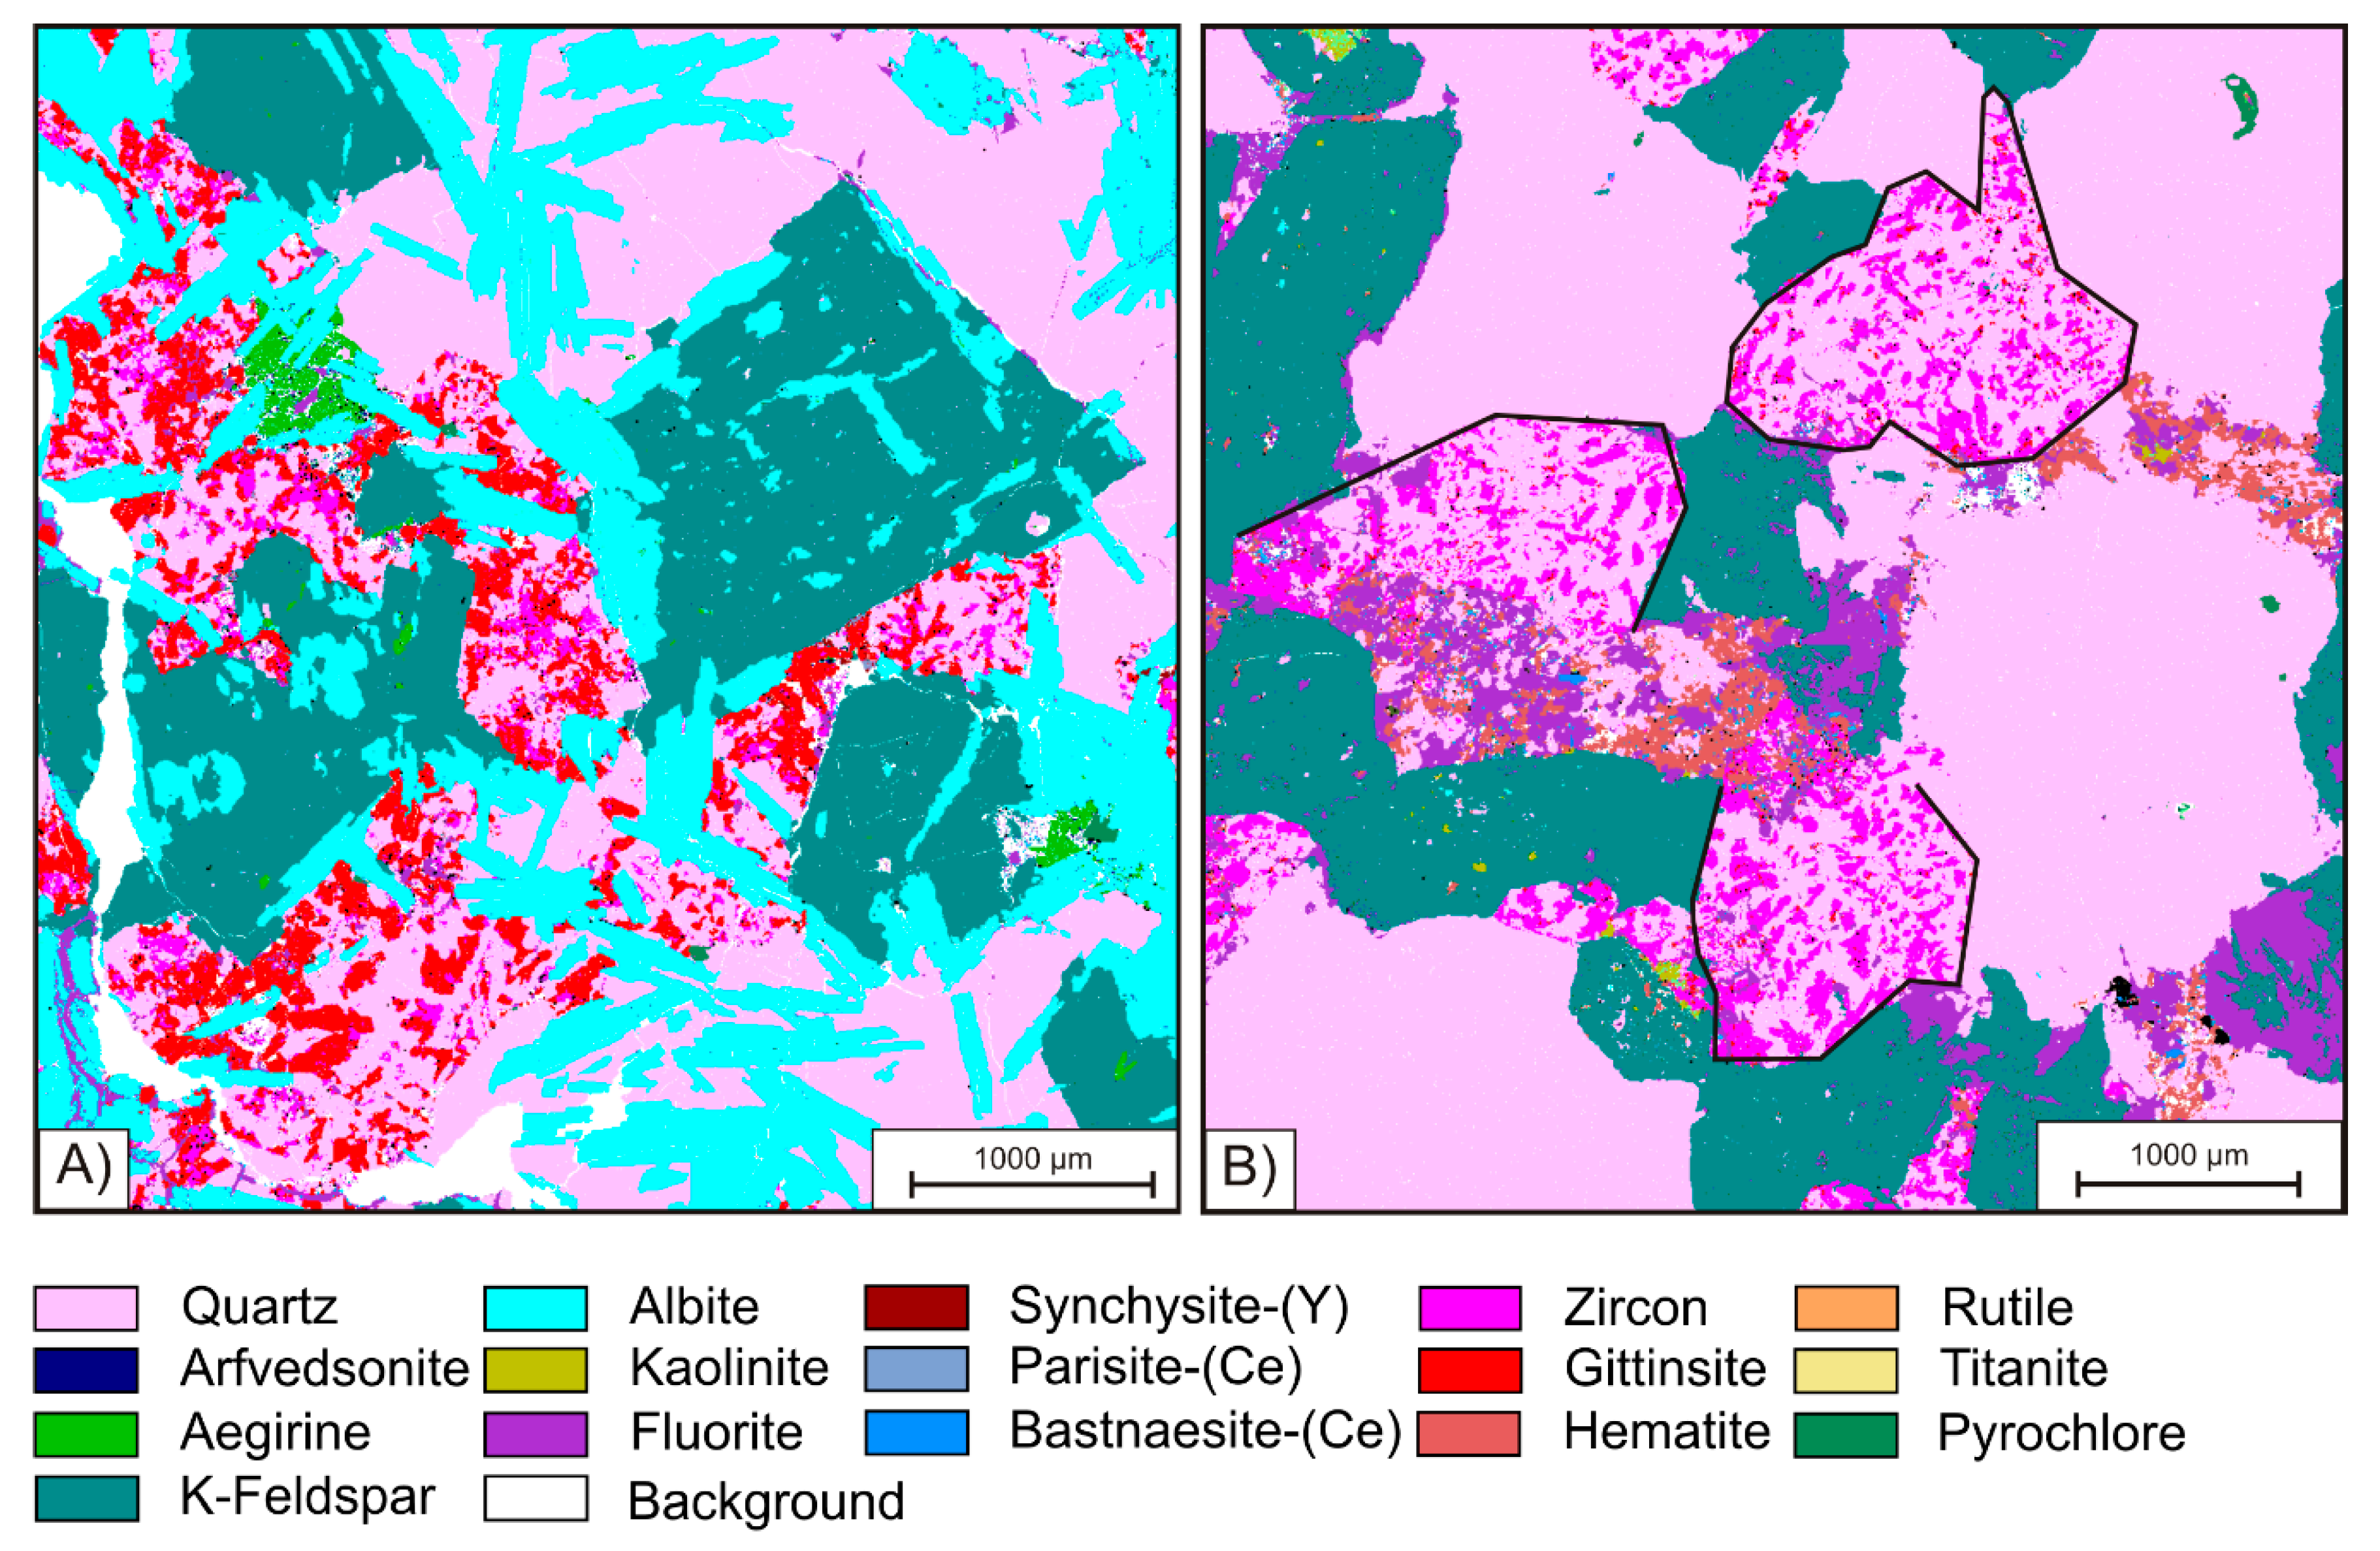
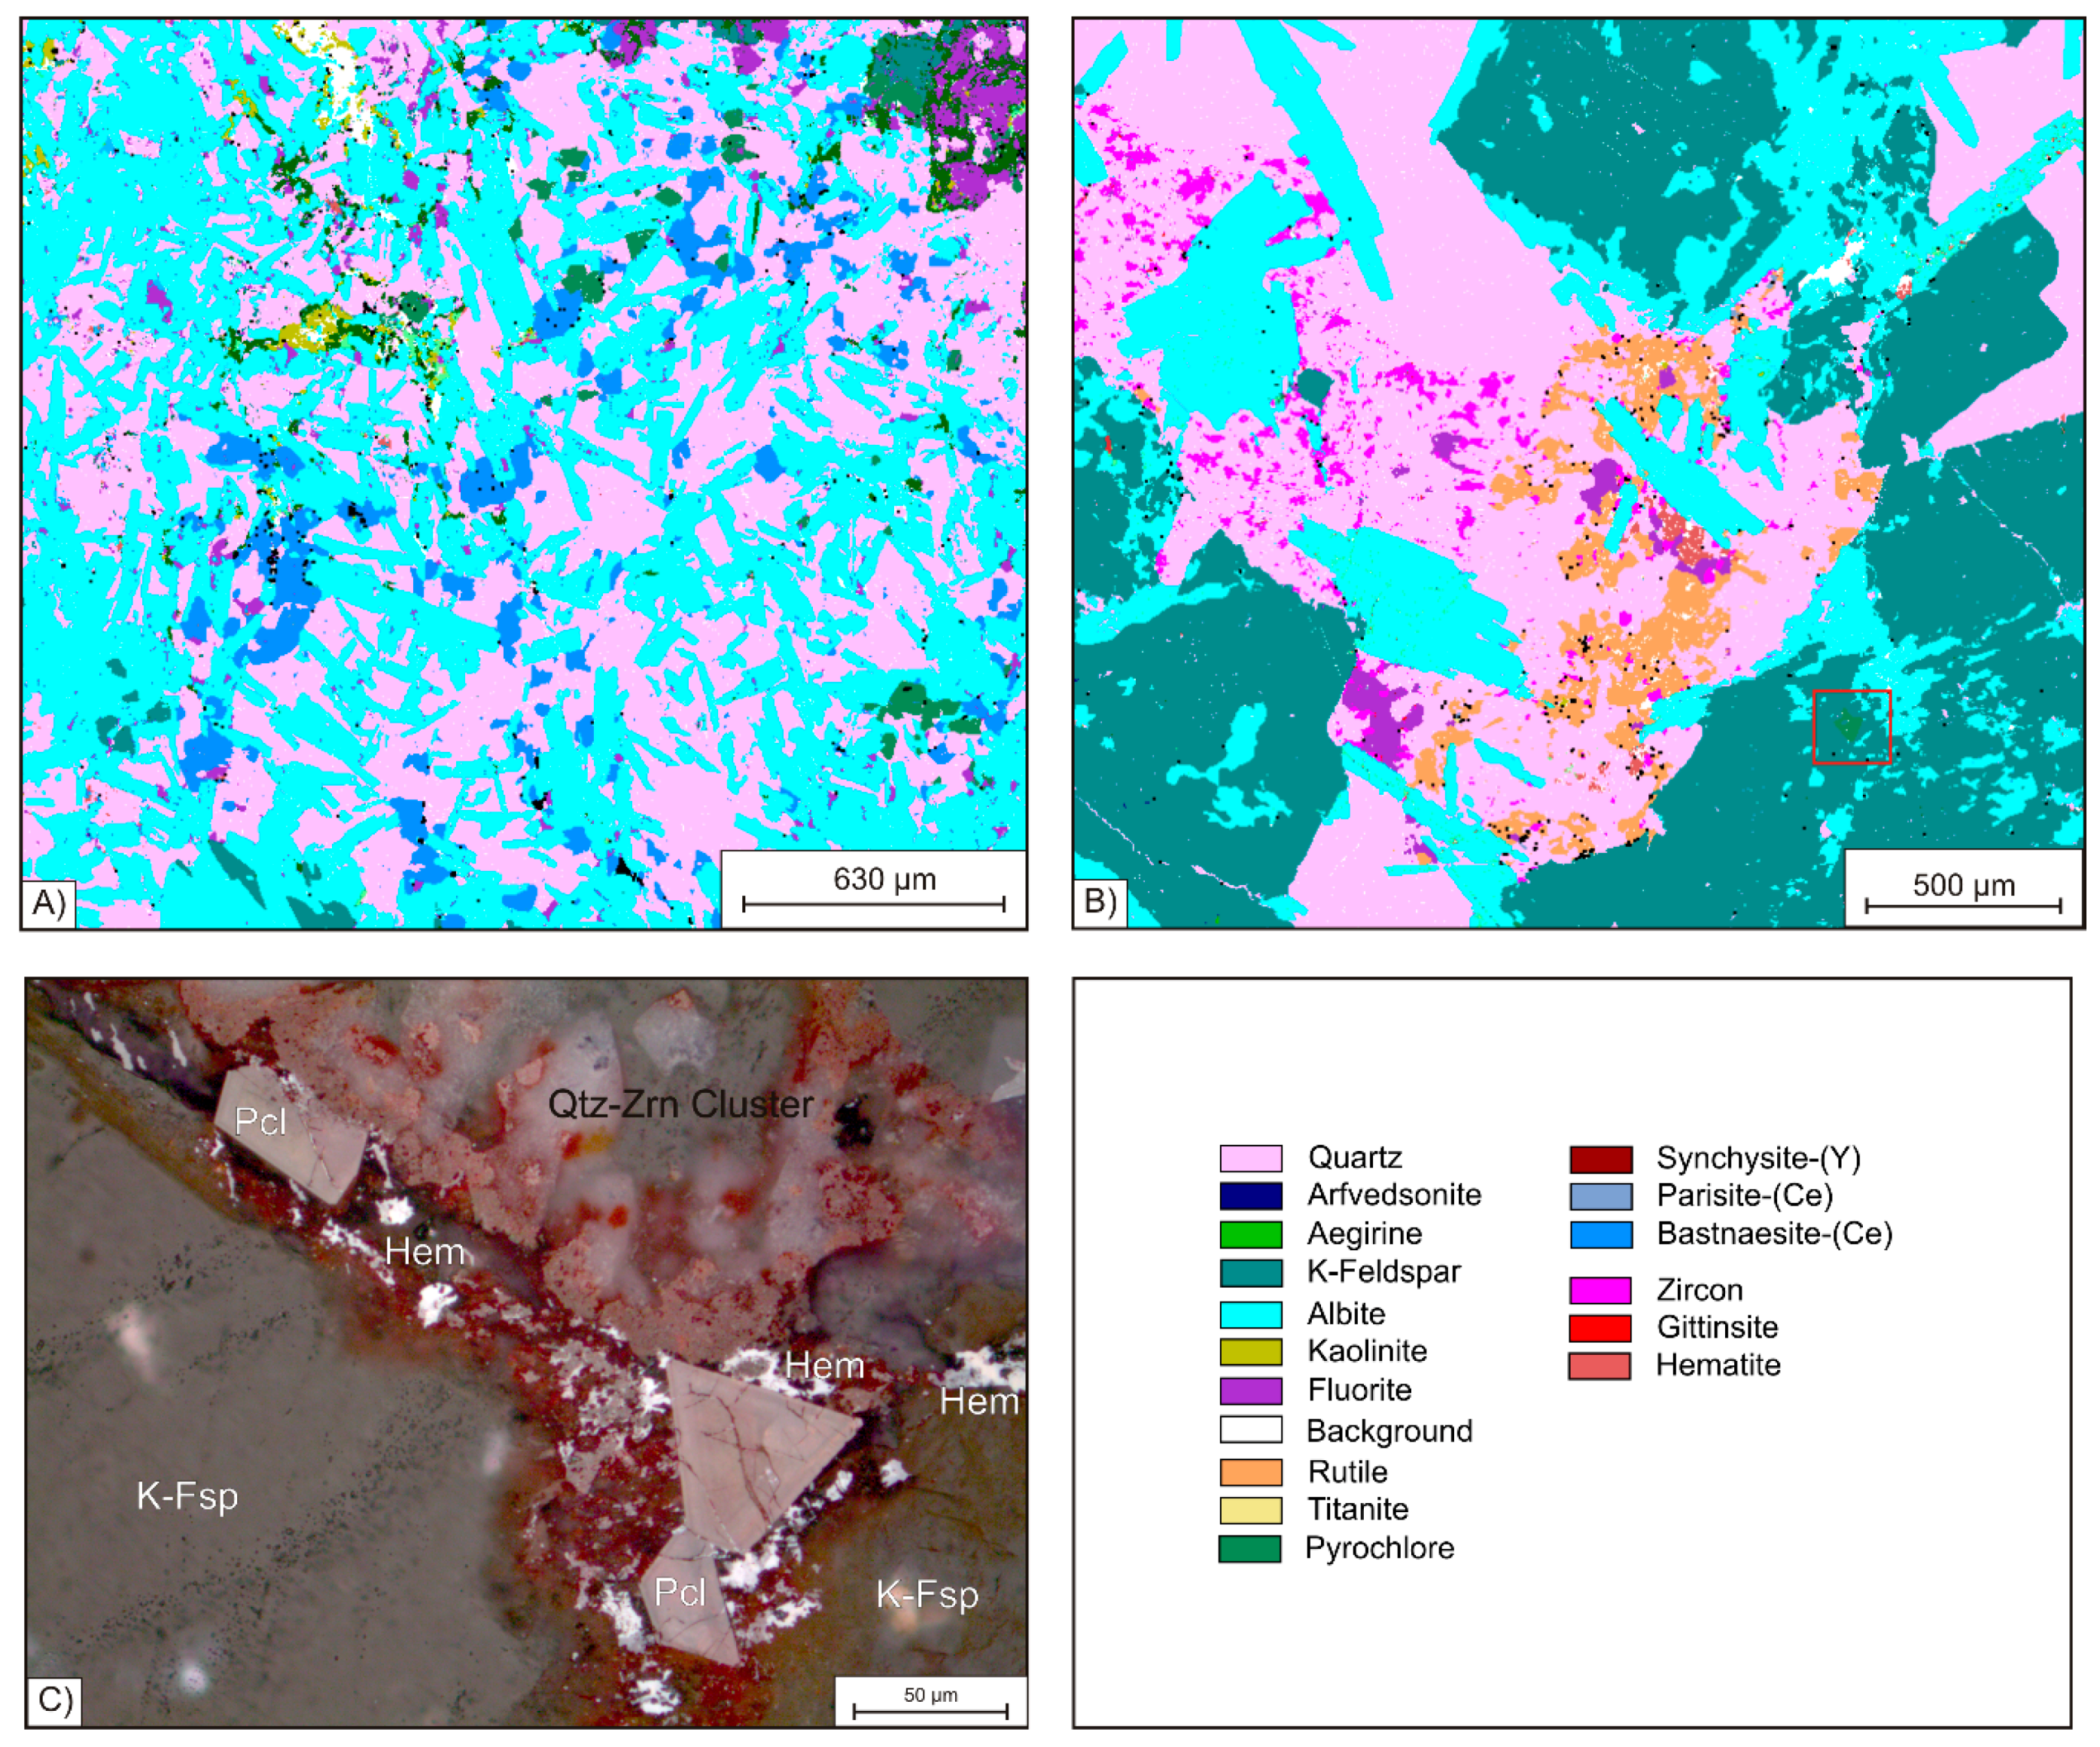
The group of HFSE-bearing minerals comprises Zr-silicates, REE-carbonates, and the Nb mineral pyrochlore. Zircon is the most abundant mineral with concentrations as high as 11 vol. %. The Zr-silicate gittinsite [CaZrSi2O7], in contrast, is only present in samples KB G1 and G2, in which it occurs in aggregates with zircon clustering around relicts of aegirine (green in Figure 4A). According to [14,16] and [6] more Zr-silicate minerals like elpidite [Na2ZrSi6O15∙H2O] and armstrongite [CaZrSi6O15∙H2O] occur at the Khalzan Buregtei deposit; however, at the studied location, these minerals were found only on a very rare level. Due to the low abundance of these minerals at the sampled parts of the deposit, they are not considered as ore minerals in this study.
The REE-carbonates are represented by bastnaesite-(Ce) as the most abundant phase, as well as by parasite-(Ce) and synchysite-(Y). In total, their modal volume is <5 vol. %. Pyrochlore can be observed in nearly all samples, but with low abundance compared to zircon or REE-carbonates.
Except for pyrochlore, the HFSE minerals occur concentrated within cluster-like aggregates together with fine grained quartz. It can be recognized in 
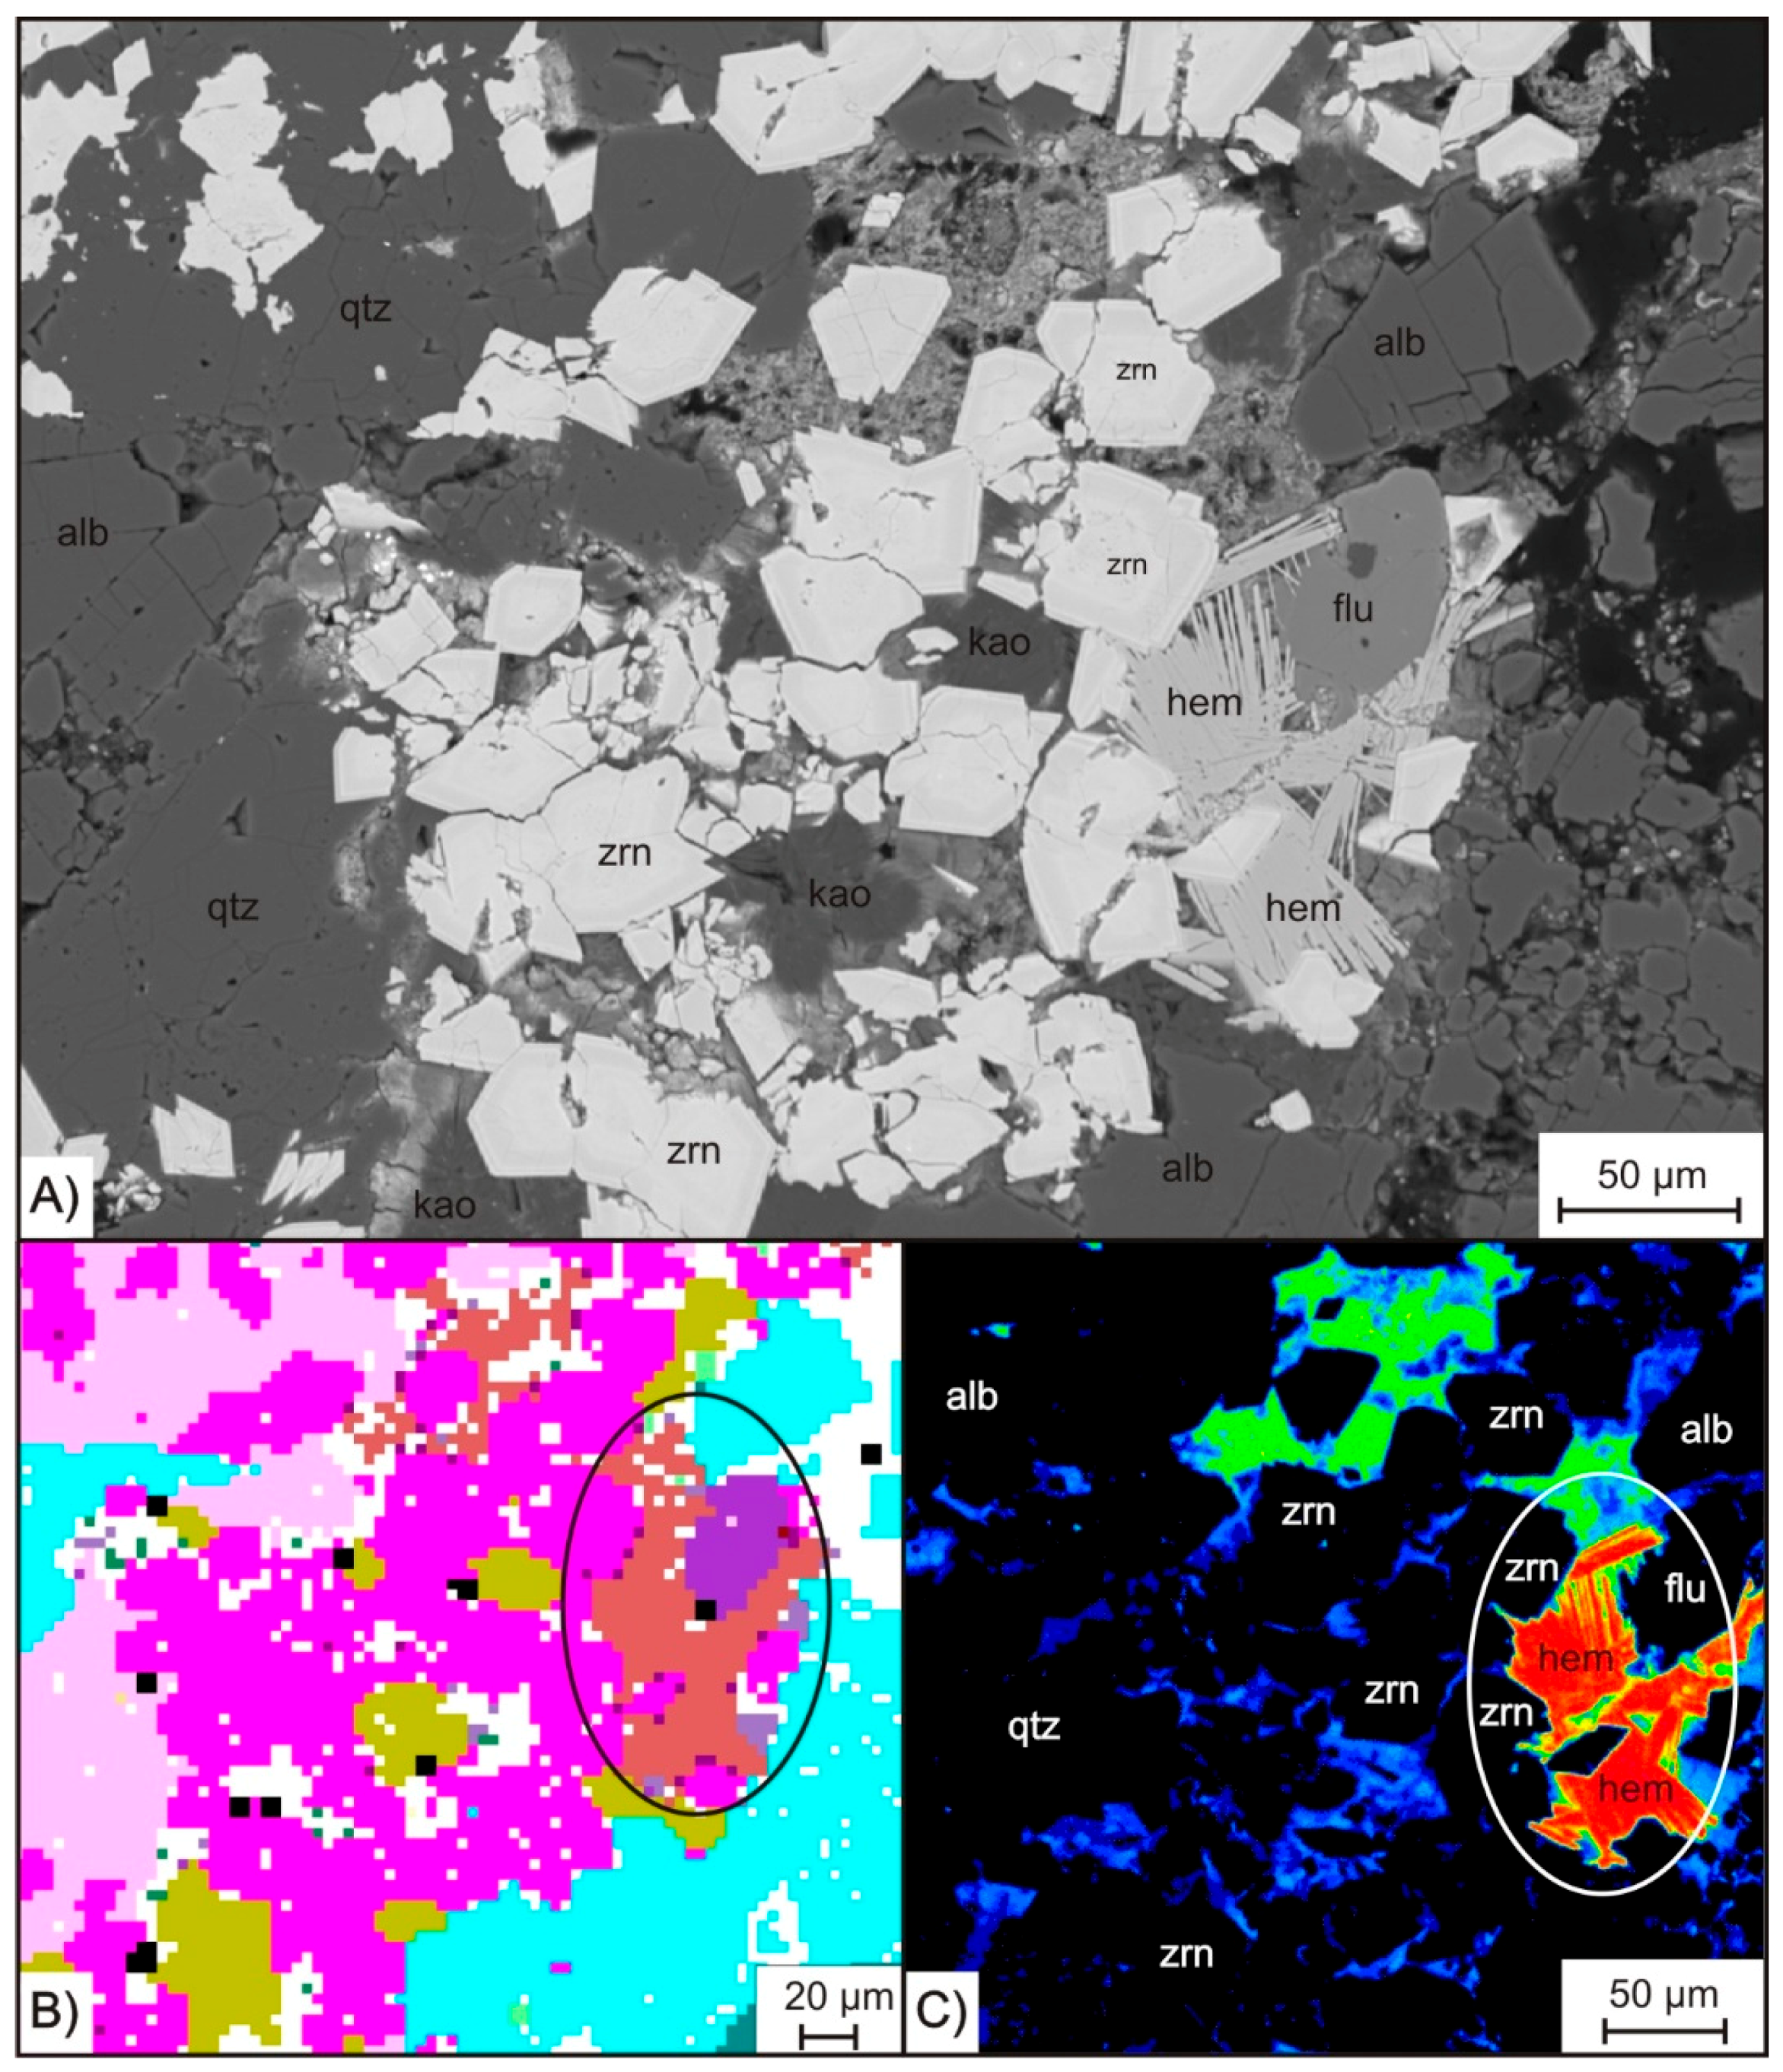
Figure 4B that such clusters form pseudmorphs after amphibole indicated by the subhedral shape of the aggregates, which have straight grain boundaries against coarse grained quartz and K-feldspar. These polymineralic ore clusters, which can be observed through the entire suite of samples from KB G and KB S, have variable sizes from 250 µm up to 2 mm, whereas the minerals within the clusters are mainly anhedral and show smaller diameters. While the REE-carbonates vary in grain-size from 90 to 200 µm, Zr-silicates and quartz grains are even smaller and rarely exceed 50 µm. In addition to Zr-silicate and the REE- and Y-carbonates, the ore clusters also contain abundant hematite and fluorite, as well as, in rare cases, the Ti-phases rutile and titanite. The latter two minerals are strongly intergrown with fine grained quartz. Rutile forms euhedral prismatic crystals characterized by oscillatory zoning, which occasionally reach a maximum diameter exceeding 100 µm (Figure 5A). Locally, hematite also forms individual clusters with fine grained quartz. Fibrous hematite aggregates can be observed exceeding diameters >50 µm of irregular fan or spherulite texture. However, it can be detected as very fine grained (<5 µm) pigments in interstitial volume of mineral phases like zircon, as illustrated by blue colors at the high-resolution Fe mapping in Figure 5C.
Purple colored fluorite can be observed in the cluster assemblage as well as associated with coarse grained quartz, K-feldspar, and albite (Figure 4B, Figure 6A). It is mostly of xenomorphic shape and can locally exceed a grain size of 500 µm. Besides the abundance in interstitial volume, purple fluorite is found in veins cross-cutting the central part of the Khalzan Buregtei deposit. Further, fluorite can be observed as a replacement of K-feldspar and coarse grained quartz.
The Ti-phases rutile and titanite are strongly intergrown with fine grained quartz. Rutile forms euhedral prismatic crystals characterized by oscillatory zoning, which occasionally reach a maximum diameter exceeding 100 µm (Figure 6B). In contrast to the other ore minerals, pyrochlore is not accumulated in clusters, but is mostly associated with K-feldspar and coarse grained quartz. All grains of pyrochlore are euhedral (Figure 6C) and most of the crystals show evidence of brittle deformation. Furthermore, pyrochlore grains are observed being cross-cut by lath shaped albite. Like the other ore minerals, pyrochlore crystals are dominantly <50 µm but can exceed 140 µm in rare cases. As illustrated in Figure 6C, joints within pyrochlore are also healed by hematite precipitation.
Based in the observation of textural properties such as grain size, mineral assemblage, crystal shape, and grain boundaries indicative of equilibrium or replacement reactions, mineral phases can be differentiated into groups of primary or post-magmatic formation. Coarse grained minerals of subhedral shape sharing straight grain boundaries are considered as minerals formed under magmatic conditions. K-feldspar and arfvedsonite are two phases with coarse grain size as well as, in part, semihedral shape. Furthermore, the coarse grains of quartz are observed to share straight grain boundaries with K-feldspar. Thus, the precursor rocks of the metasomatites of the Khalzan Buregtei deposit can be identified as alkali syenite to alkali granites (QAPF, [20]). Owing to their coarse grain size, these rocks had a porphyritic appearance, which is in accordance with the observation of [5,13,14,15] regarding the unaltered rock suite of the main intrusive phase.
Post-magmatic phases are identified by significant change to finer grain size and irregular grain shape. Furthermore, the formation of polymineralic aggregates pseudomorphically replacing magmatic phases (e.g., amphibole) can also best be explained in a reaction of a solid mineral with a fluid, i.e., in a post-magmatic reaction. Thus, aegirine and albite, which grew at the expense of magmatic arfvedsonite and K-feldspar, respectively, are classified as post-magmatic minerals. Fine grained quartz, which shares straight grain boundaries with albite, is considered as cogenetic and thus also as post-magmatic. Post-magmatic formation is also indicated for ore and accessory minerals (e.g., hematite and fluorite) found in clusters intergrown with post-magmatic quartz. The semihedral shape of ore mineral clusters and their straight grain boundaries shared with magmatic phases are evidence that ore clusters mainly represent aggregates pseudomorphically replacing arfvedsonite and aegirine, which itself replaces arfvedsonite before (Figure 3D and Figure 4B). The occurrence of clusters of post-magmatic minerals thus mirrors the texture of precursor porphyritic alkaline granite rock. Veins filled with carbonates were found cross-cutting all other mineralogical and textural features of the rocks and were interpreted to be late stage post-magmatic. It is important to note that these textural observations show that even with the enrichment of Zr, the REE or Nb were probably caused by magmatic fractionation [15]; the textural properties of the rare metal ores of Khalzan Buregtei are predominantly of post-magmatic metasomatic character, which is also in line with the characterization by [5].

4.2. Geochemistry

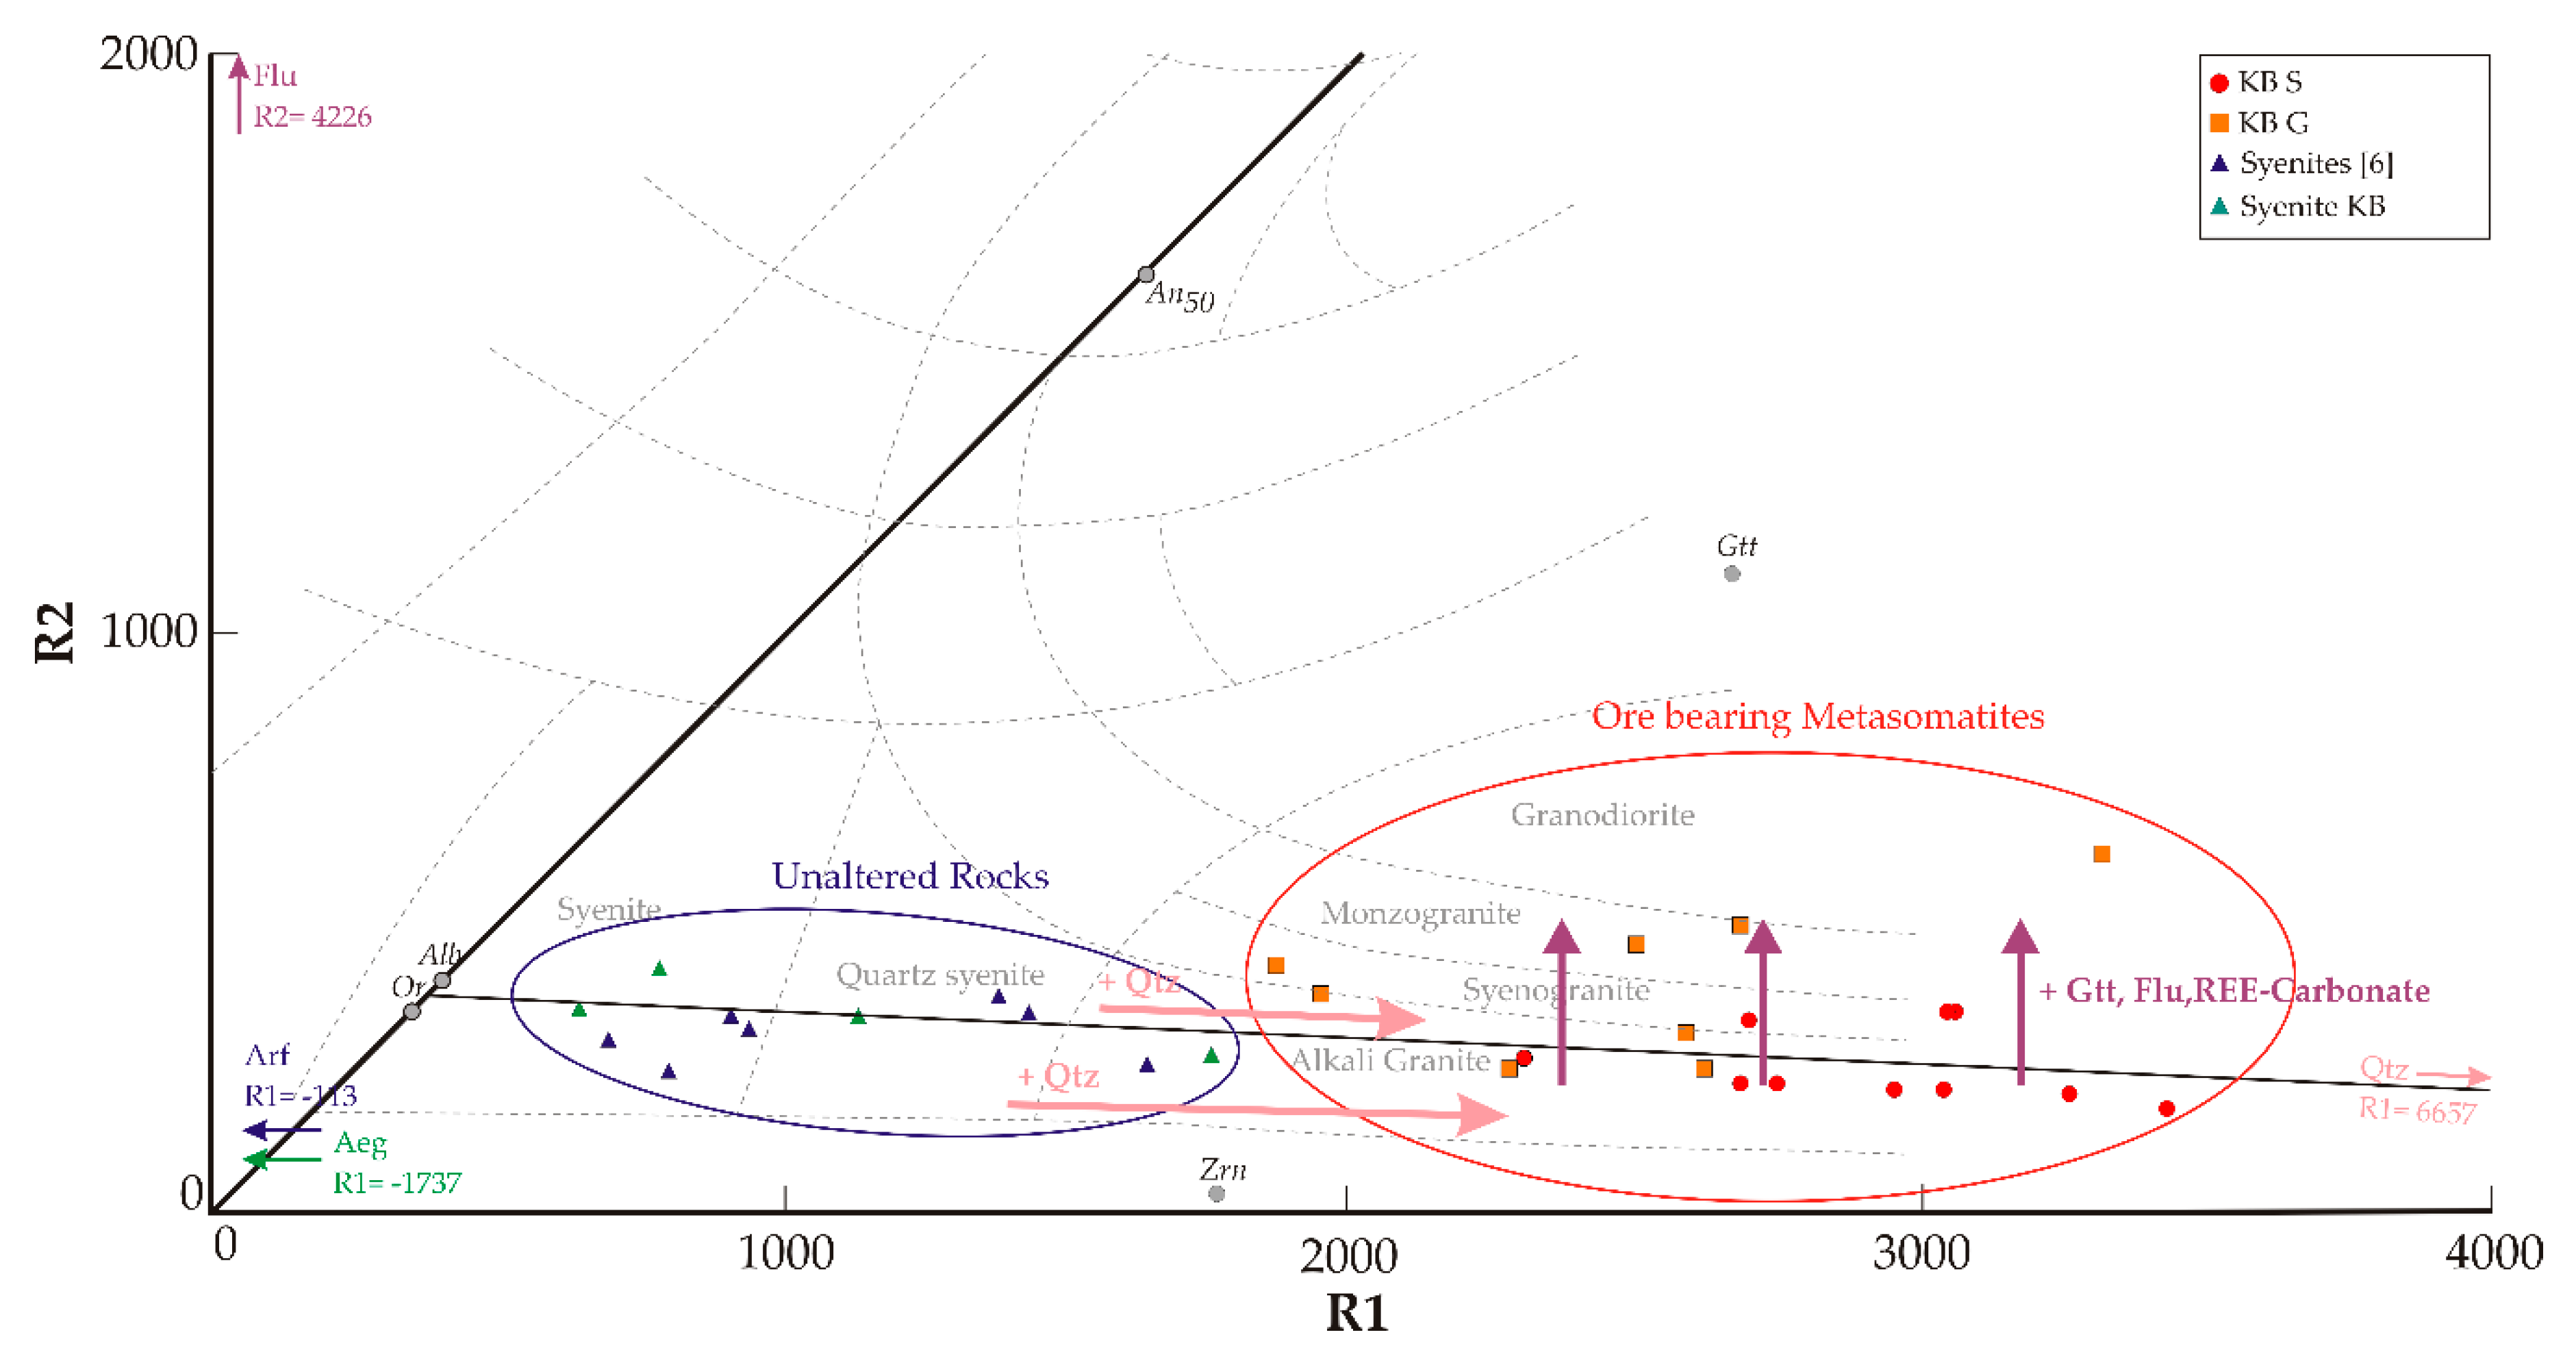
Whole rock major element composition as well as multication parameters (R1, R2 [21]) and rock classification based on major element signatures (TAS for plutonic rocks [22], R1-R2) are listed in Table 1 and Table 2 for both sample series KB G and KB S.
As is indicated by the SiO2 values, all rocks are silica oversaturated. The samples of KB S, especially, show an increased concentration of SiO2 compared to KB G, which is in accordance to the increased quartz content indicated by the modal composition Figure 2. Other major elements are more variably distributed in the KBG sample suite, in which KBG 6 and 7 show elevated amounts of fluorite, but are in contrast to all other samples containing no albite in Figure 2. This leads to significantly decreased Na2O and Al2O3 concentrations, but enhanced values of CaO and LOI (Figure 2, Table 1 and Table 2). In addition to fluorite, gittinsite, which is present among the Zr-silicates in some samples (e.g., KB G1), is a carrier of CaO, too. Variations in major element composition are mirrored in element-based rock classification. Lower SiO2 content in KB G samples but variable sums of Na2O + K2O result in TAS classifications of monzonite, granodiorite, and granite (Table 1). In contrast, the de la Roche classification, which, in addition to Si and the alkalis, includes Fe, Ti, Ca, Mg, and Al, reflects element variability by assigning the classes syenogranite, alkali granite, granodiorite, and monzogranite to the KB G samples. While all KB S samples are entirely classified as granites in the TAS scheme, the de la Roche scheme leads to classification as alkali granite and syeno granite in some cases or does not allow classification at all. The latter can be observed in samples with highest SiO2 concentrations and R1 multication parameter > 3000. Therefore, these samples are classified as “Qtz rich” in this study.
The results of the REE analyses of the bulk rock samples are given in Table 3 and 
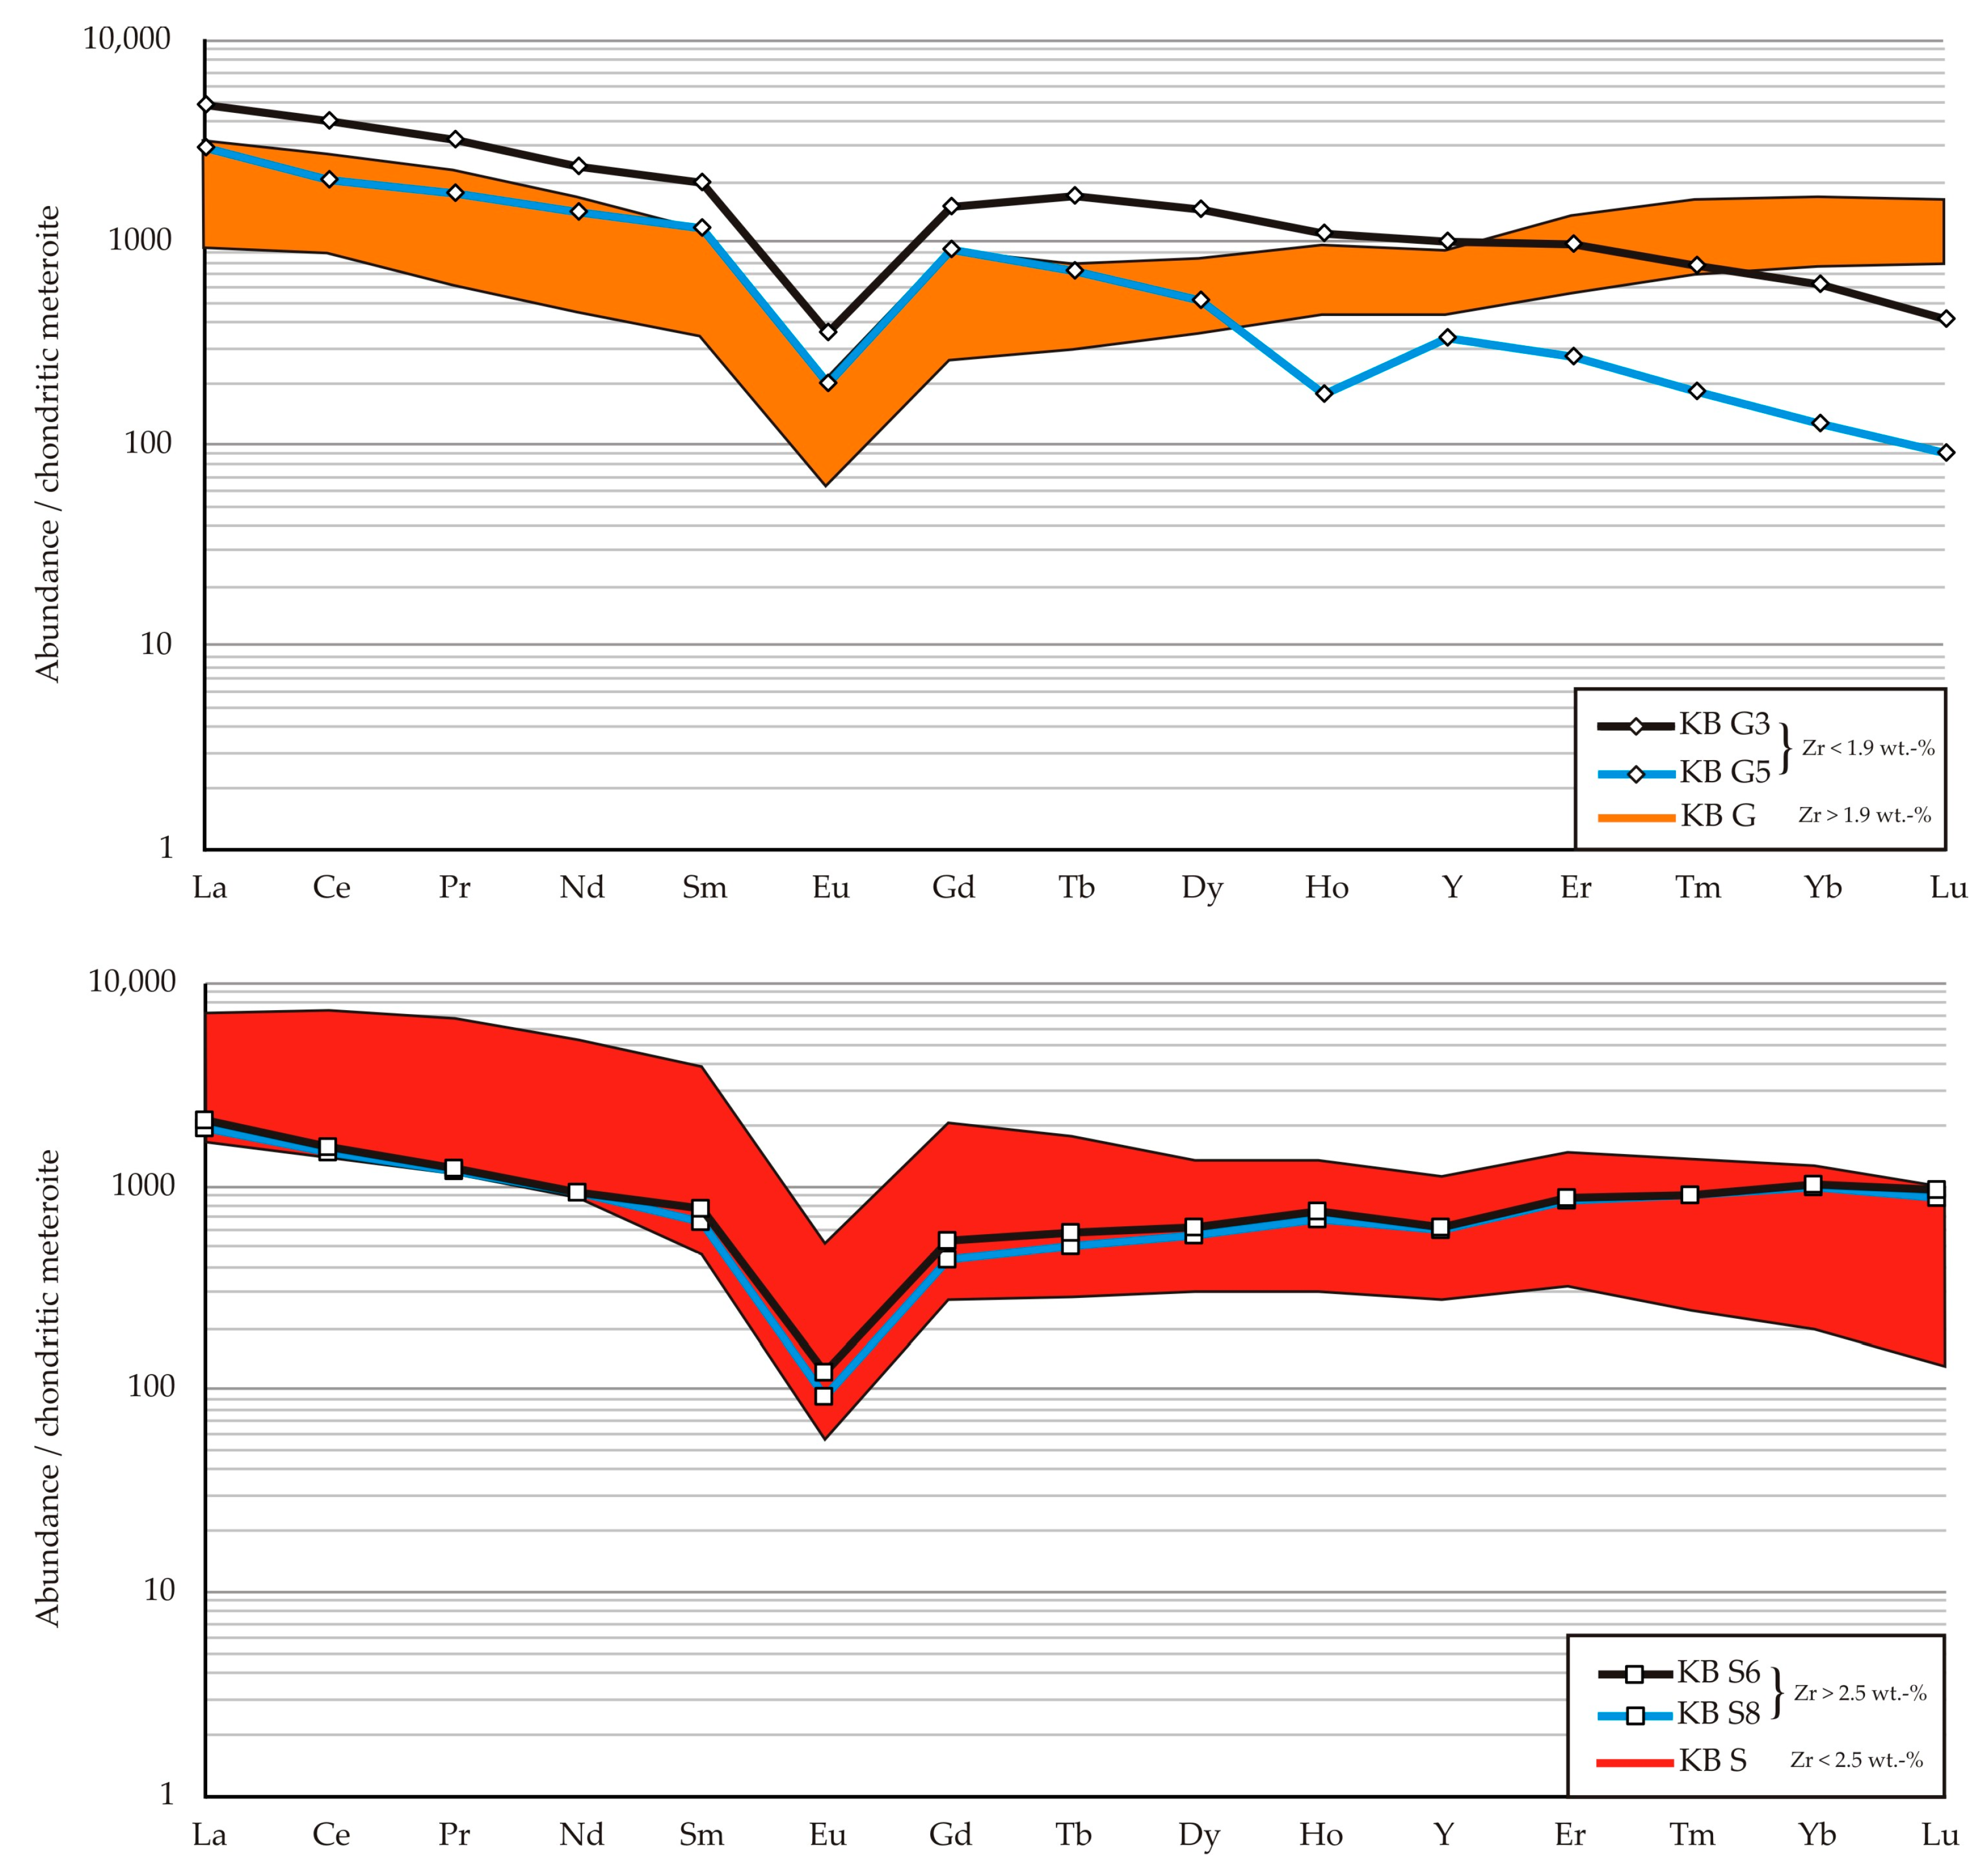
Table 4. Chondrite normalized distribution patterns are given in Figure 7. All samples show REE concentrations strongly enriched in comparison to chondritic composition [23] and they have negative Eu anomalies, which are more pronounced in KB G samples (Eu/Eu* < 0.3) in contrast to KB S (Eu/Eu* < 0.2), see Table 3 and Table 4. The HREE (heavy rare earth elements Gd-Lu) elements show a significantly higher enrichment in the KB G samples in comparison to KB S. The latter samples, on the other hand, show a steeper pattern, with elevated enrichment of LREE (light rare earth-elements La-Eu) ratios up to 7000 but a generally lower enrichment of HREE ≤ 1000 (Figure 7). KB G samples, instead, are less enriched in LREE < 3000, which leads to flat patterns.
Zirconium has variable concentrations across the data set. KB G samples contain Zr up to 3.3 wt. % (Figure 7 orange range) whereas only two samples have concentrations < 1.9 wt. %. Within both sample suites, those of low Zr concentrations show decreasing enrichment of the HREE. In contrast, samples with high Zr concentration are characterized by increased HREE enrichment.
Niobium concentrations show a distribution similar to the Zr. maximum values given by the method’s upper limit of quantification at 2500 mg/kg. Minimum concentrations of Nb in KB G samples generally are two times higher than the concentrations of KB S samples ranging between 490 and 790 mg/kg. Concentrations of Nb are generally higher in KB G and show a variation between 1000 mg/kg and 1900 mg/kg. In comparison, the concentration of Nb in KB S samples, excluding the samples exceeding the upper limit of quantification, cover the range from 490 mg/kg to 1945 mg/kg.

4.3. Elemental Deportment

Petrographic and geochemical investigation points out that the major ore mineral classes are Zr-silicates, REE-carbonates, and Ti/Nb oxides that occur within the metasomatic rocks forming the centre of the Khalzan Buregtei deposit. Zircon is the most abundant ore mineral. It can be detected in all samples of ore metasomatites. Further, it is identified as the major carrier for the rare metals Zr, Hf, Y, and HREE due to the high concentrations of Y, Dy, and Er across the analysed zircon crystals, as demonstrated by the representative analyses of different zircon and gittinsite grains in Table 5.
Table 6 summarizes EPMA analyses of bastnaesite-(Ce), parisite-(Ce), and synchysite-(Y), which are the most abundant minerals of the REE-carbonate group. It can be seen that the LREEs show a high concentration in the first two minerals, whereas synchysite-Y has got elevated concentrations of Y and is thereby suspected to contain unquantified amounts of HREE as well. Low total sums can be explained by unquantified amounts of HREE incorporated into the analysed minerals. The individual concentration levels of these elements are below the limit of quantification of the applied EPMA.
Pyrochlore occurs as a major carrier for Nb in the Khalzan Buregtei deposit. Eight pyrochlore EPMA analyses are given in Table 7. They show that pyrochlore is enriched in the LREEs Ce, La, and Nd. Heavier REE elements were not detected. Due to the content of Ce, pyrochlore is identified as ceriopyrochlore-Ce, which contains only very small amounts of betafite [Ca2(Ti,Nb)2O6O] and microlite [(Na,Ca)2Ta2O6(O,OH,F)], as indicated by the low concentrations of Ti and Ta, respectively. Pyrochlore also shows a capability to enrich U to concentrations up to 1.16 wt. %. Semi-quantitative analyses indicate that, in addition to pyrochlore, rutile can be another carrier of Nb2O5 with variable concentrations from 2 to 5 wt. %.

5. Discussion

5.1. Classification Systematics

The classification of the mineralized rocks of the Khalzan Buregtei deposit applying traditional methods of magmatic petrology (QAPF and TAS, see Table 1 and Table 2) leads to obviously inappropriate results due to a lack of consistency across the different classification schemes. Furthermore, the classification of some samples fails to unequivocally define rock types, as compositions do not match the compositional ranges for which the schemes were defined (R1-R2, see Table 1 and Table 2). This mismatch is thought (see Section 4.2) to be caused by chemical variations due to post-magmatic mineral formation. In particular, the TAS classification for plutonic rocks, derived by [22] from the classic TAS scheme for volcanic rocks, is strongly based on Na2O and SiO2 concentrations and thus notably responds to post-magmatic processes. It is therefore concluded not to use the TAS or QAPF schemes for highly mineralized alkaline granitoid rocks such as those in the centre of the Khalzan Buregtei deposit. This is in accordance with [6], who proposed a more simple classification for the rock suite of the Khalzan Buregtei massif into three classes of barren and ore bearing metasomatites and unaltered rocks of the main intrusion phase, see Figure 1.
The multication parameters R1 and R2 combine concentration data of Si, Ti, Al, Fe, Ca, Mg, K, as well as Na and thus provide the opportunity to display the chemical composition of rocks and individual rock-forming minerals (Figure 8). Consequently, the effects of post-magmatic mineral reactions altering the intrusive alkaline magmatic rocks can be graphically visualized by these parameters. Figure 8 displays the R1-R2 plot of unaltered (blue mark) and metasomatic (red mark) rocks of the Khalzan Buregtei massif. The latter samples show significantly higher R1 values in contrast to the unaltered ones and show an elevated abundance of zircon within the ore cluster. The evolution towards the point representing quartz along the line connecting feldspars and quartz suggests silicification as one major alteration feature. Thus, the formation of post-magmatic quartz can be linked to the increase of the R1 parameter parallel to the pink vectors in Figure 8. Albitization shifts rock compositions towards the albite point. However, this effect is less pronounced in the diagram due to the proximity of the points representing albite and K-feldspar. The formation of other post-magmatic Ca-bearing minerals like fluorite, REE-carbonates, and gittinsite is reflected by increasing R2 values as indicated by the vertical shift along the purple vectors in Figure 8, which can be particularly well observed for the KB G samples. The influence of Mg on the R2 value can be neglected due to the very low concentration of this element in the entire samples series. Due to the R1 and R2 value of arfvedsonite and aegirine, decomposition of these minerals enhances the effect of the elevated R1 values described above.
While traditional magmatic rock classification turns out to be inappropriate, which is also displayed in Figure 8 showing rocks with similar chemical and mineralogical compositions that plot into different fields, the pair of numeric R1-R2 values is nevertheless indicative of the petrographic character of each sample. Being based on whole rock major element data, these numeric values are appropriate for characterizing such complex metasomatically-altered rocks and therefore are considered as highly effective and unambiguous quantitative tools particularly suitable for distinction and visualization of altered or mineralized alkaline rocks and their rare metal ore bodies. Multication parameters are additive numeric values and consequently are a valuable base for modelling and geostatistics [25]. As whole rock chemical data are abundantly available already at pre-feasibility levels, multication parameters are also recommended for use in 3D modelling during exploration work or mine planning. While they fully characterize compositional rock properties, multication parameters are independent of the subjective impression or degree of skill of an individual petrographic investigator. Thus, they represent an important step to deposit characterization by quantitative parameters, which also is a prerequisite for any geometallurgical evaluation.
The geometallurgical approach considers mineralogical features of deposits in a quantitative manner with respect to their significance for mine planning and mineral processing [25]. The main focus lies on the most effective exploitation by accurate adjustment of the entire process chain from mining, mineral processing, and metallurgical procedures to mineralogical and textural ore properties [25,26,27].

5.2. Textural Properties of Ore Minerals and Their Use for Optimized Mineral Processing

Textural properties are crucial for the technology and costs required for ore processing. Therefore, identification and quantification of textural characteristics are as essential for ore evaluation as determination of ore mineral grade. Most ore minerals observed in the centre of the Khalzan Buregtei deposit crystallized in post-magmatic alteration reactions concomitant with the development of textures characterized by fine grain size, partial replacement, and intricate intergrowth between ore minerals and gangue (see Section 4.1, Figure 4 and Figure 6). These textural properties significantly affect the ore mineral liberation size, indicating the coarsest size fraction produced in comminution that guarantees the maximum detachment of ore minerals and associated gangue [28]. For the ore-bearing rock samples of KB G and KB S at Khalzan Buregtei, the liberation size of the ore minerals was obtained by image analyses applied on the phase maps generated with the QEMSCAN© technique. The liberation size distribution of the bulk group of ore minerals comprising Zr-silicates and REE-carbonates are displayed in Figure 9A. The graphs for representative samples KB G 5, 8, and KB S 8 show that 80 wt. % of all ore minerals would be liberated in fractions varying between P80 < 45 µm and P80 < 85 µm. This is well in accordance with mineral processing test work on rare metal ores from Khalzan Buregtei conducted by [29]. Likewise, [30] suggested a comminution of <80 µm followed by scavenger flotation for REE-carbonate minerals for processing of a similar rare metal ore.
In general, comminution to low grain size is an energy and material-consuming step, belonging to the most expensive positions in processing operations [28,31]. In addition, although required for liberation of ore phases, low grain sizes also hamper processing activities, mainly leaving flotation as a suitable technique [28]. This enhances consumption of water and supplies (e.g., flotation chemicals) as well as of operation costs [28]. While flotation turned out to be effective for REE-carbonates, it cannot concentrate ore minerals with distinctly different physical properties, such as zircon or pyrochlore in the same step (e.g., [28,30]). Owing to the prices of Zr, Nb, and the HREE, the latter ore minerals, which remain in the flotation tailings together with a large mass of gangue minerals, would represent a higher value than the LREE predominantly extracted from carbonates. High process costs on one hand and limited concentration efficiency on the other hand would represent an obstacle for mining operations at the Khalzan Buregtei deposit as well as for other rare metal alkaline granites.
However, the aggregation of the ore minerals zircon, gittinsite, and REE-carbonate together with other post-magmatic phases, such as fluorite and hematite in clusters characteristic of the mineralized rocks of sampling sites KB G and KB S, allows an alternative approach to more efficient processing. Image analysis yields quantitative information on the grain size distribution of each individual ore mineral on the one hand as well as of the ore mineral clusters on the other hand. Figure 9B shows that diameters of 80 % of all ore clusters in representative samples KB G 5, 8, and KB S 8 are ≤400 to 500 µm. Consequently, liberation of ore clusters could already be achieved in size fractions, which are significantly coarser than those required for liberation of individual ore minerals (Figure 9A). It is worth mentioning that the increase in liberation size by a factor of, in part, >10 relative to the individual ore minerals, reflects the difference between magmatic and post-magmatic mineral grain sizes. The clusters, which predominantly formed as post-magmatic pseudomorphs after arfvedsonite and elpidite (see Section 4.1) mainly have the size of their former magmatic precursor.
The increased particle size of the ore clusters is a textural feature useable for optimization of mineral processing because the liberation of the ore clusters needs less intensive comminution, which is connected to a decrease in energy consumption (e.g., [31]). In a process chain, the separation of barren and ore bearing material needs to take place as early as possible to enhance the overall process effectiveness due to mass flow reductions and increased yield of target mineral phases. Extracting a pre-concentrate of ore mineral clusters from the coarse particle size fraction will achieve both goals.
For the extraction of ore mineral clusters, physical properties are needed, which distinguish the target phases from the barren material. One possible property is the increased density of the ore-bearing clusters, which is due to the locally-increased modal abundance of mineralogical phases of high specific gravity in contrast to the barren feldspar-quartz dominated rock domains. This makes particles amenable to density separation. Further, the close associations of clustered ore minerals with hematite (Figure 4A,B) represents a marked difference to the barren domains because the magnetic susceptibility of this Fe-bearing phase makes the ore clusters also amenable to magnetic separation.
Based on the detailed quantitative investigations of mineralogical and textural ore properties, a mineral-processing scheme was developed by [29]. The study demonstrates that the extraction of a pre-concentrate by dry magnetic separation on a particle fraction <250 µm was successfully conducted on a high volume ore sample taken from the Khalzan Buregtei deposit. Applying this optimized processing scheme, the mass flow was reduced by 55 wt. %, and an enrichment of zircon by a factor of 2.5 was achieved. As a consequence, following process steps like comminution of fractions rich in ore mineral clusters to liberation size of individual ore minerals and scavenger flotation, needed for the production of concentrates, can be conducted with the enhanced pre-concentrate having increased ore mineral content and decreased total mass.
This example shows that the mineralogical and textural properties “association of ore minerals to hematite” as well as “clustering of ore minerals” have a crucial impact on processing efficiency and thus finally on the profit of a mining operation. For a geometallurgical approach towards optimization of the process chain, it is important to delineate volumes of mineralized rock that are characterized by consistent mineral processing responses such as geometallurgical domains [25,32,33]. In the case of the Khalzan Buregtei deposit both properties are considered as key features for the definition of a geometallurgical domain.
The abundance of ore clusters is described for other alkaline massifs by several authors [34], for example, report clusters of REE rich apatite and allanite [(CaREE)(Al2Fe2+)(Si2O7)(SiO4)O(OH)] connected to Biotite-magnetite veins of the Loch Loyal syenite and conjugated REE-carbonate veins. Further, the replacement of arfvedsonite by hematite-quartz clusters is described by [35] for peralkaline arfvedsonite granites of the Amis complex in Namibia, which are connected to a high abundance of HFES silicates like zircon.
Clusters formed by gittinsite and zircon in association with secondary quartz replacing elpidite and arfvedsonite were also observed by [1] in the rare metal prospects of the alkaline granite at Strange Lake in Canada. These authors, too, describe post-magmatic minerals hematite, quartz and fluorite that formed in close association to ore minerals. The studies from different areas show that rare metal/HFSE enrichment in alkaline granitoid rocks is associated to the post-magmatic formation of ore-bearing clusters replacing precursor magmatic minerals. Consequently, application of the optimized beneficiation strategy, as outlined in this study, to those other rare metal alkaline granitoid deposits could be a step to improve economic mining operations.

6. Conclusion

Alkaline rock hosted rare metal deposits yield potential as future resource for commodities like Zr, Nb, Hf, Y, and the REE. The economic interest in this deposit type is underlined by various international studies of the last decade [1,7,9,10,30]. The complexity of the ore with respect to texture, composition, and variable types of ore minerals is often caused by post-magmatic alteration of the ore-bearing rock suite. The alteration is identified as one key process of the ore formation, because it enhances formation and concentration of ore minerals. However, post-magmatic alteration also causes rearrangement of the precursor magmatic rocks. As demonstrated in this study of Khalzan Buregtei, for Zr-REE-Nb deposits traditional used concepts of magmatic rock classification (e.g. TAS, QAPF) fail to properly characterize the altered alkaline rocks.) fail to properly characterize altered alkaline rocks. While not providing common magmatic-related names, multication R1-R2 parameters defined by [21] can serve as numeric values to characterize altered and mineralized rocks, as well as to visualize the chemical effect of alteration processes observed in petrographic inspection. Owing to their quantitative additive property, multication parameters are recommended to be implemented in numerical models to also display and analyse rare metal ore and their alkaline granitoid host rocks in geological 3D models.
The post-magmatic ore mineral assemblage at Khalzan Buregtei is characterized by overall fine grain size and intricate intergrowth. Consequently, in a mining operation, small liberation size, quantified in this study by QEMSCAN© image analysis, would require intensive comminution. High energy demand and lagged masses of finely-ground rock represent a significant obstacle to an economic use of this deposit. Petrographic inspection revealed that, except for the major Nb carrier pyrochlore, all ore minerals of Zr and REE (i.e., zircon, Zr-silicates, and REE-carbonates) occur in pseudomorph-like association mainly replacing precursor magmatic arfvedsonite. This leads to a concentration of ore minerals in clusters characterized by liberation sizes significantly exceeding those of individual ore minerals.
Furthermore, QEMSCAN© image analysis indicated that hematite is a characteristic constituent of clustered ore mineral aggregates. These textural properties allow pre-concentration of ore mineral clusters after clearly less energy consuming comminution to particle sizes < 250 µm and magmatic separation. Further comminution of the pre-concentrate and processing steps to concentrate zircon, Zr-silicates, and REE-carbonates then only have to be applied to 55% of the initial mass of the ore. This implies a significant reduction of energy consumption as well as of water and other supplies (e.g., flotation chemicals). Taking into account that clustering, as well as associations of ore minerals with hematite, are observed in other rare metal deposits formed in alkaline granitoids in different concentrations, the approaches developed for Khalzan Buregtei are considered as important steps towards more efficient and sustainable extraction of rare metal ores.

Author Contributions

Conceptualization, L.H.G. and S.S.; Investigation, L.H.G., J.L.K., and U.B.; Methodology, L.H.G. and S.S.; Project administration, H.W. and F.M.M.; Supervision, H.W. and F.M.M.; Validation, A.H.; Writing—original draft, L.H.G. and S.S.; Writing—review and editing, J.L.K., H.W., and F.M.M.

Funding

This publication was financially supported by the Aachen Know-How Center Resource Technology (AKR). The surrounding project OptiWiM is financially supported by the German Federal Ministry of Education and Research (BMBF, OptiWiM; FKZ: 033R162B).

Acknowledgments

The authors show gratitude to Chinzorekt of MONNIS International LLC and the staff of TD Bank of Mongolia, for granting access to Khalzan Buregtei license area and the permission to collect samples from outcrops. G. Stehr and the staff of the German-Mongolian Institute of Resource Technology (GMIT) and M. Bauer of Consulting, Business and Management GmbH (CBM GmbH, Bexbach) are gratefully acknowledged for administration and logistical support during the project. R. Klinghardt of technical staff of IML Klockmann Laboratory for Geometallurgy is gratefully thanked for his attendance during EPMA and QEMSCAN© analysis.

Conflicts of Interest

The authors declare no conflict of interest.

Appendix A

Table A1. Spectrometer setup for the EPMA high-resolution mappings.
ElementLineSpectrometerPosition (mm)
AlTAP90.712
CaPETJ107.636
FeLIFH134.262
SiTAP77.208
ZrPETJ192.620
Table A2. Setup for EPMA measurements with focused electron beam on Zr-Silicates and pyrochlore. Sorted according to spectrometer optimization.
ElementLineSpectrometerPosition (mm)Bg +/− (s)Peak (s)Standard Matrix
NaTAP129.468510Jadeite
YPETJ206.3991030Glass
ZrPETJ194.628510Zircon
ThPETJ132.5641020Th-Oxide
HfLIFH109.1141530Zircon
AlTAP90.509510Plagioclase
PPETJ196.998510Monazite
NbPETJ183.5471530Nb-Oxide
UPETJ119.0311530U-Si-Al-Ca-Gla
ErLIFH123.6931530Glass
SiTAP77.225510Zircon
CaPETJ107.636510Plagioclase
DyLIFH132.2841530Glass
TiPETJ88.023510Rutile
FeLIFH134.262510Faylaite
MnLIFH145.742510Mn-Oxide
CeLIFH177.4871530Monazite
Table A3. Setup for EPMA measurements on REE-carbonate minerals with a beam diameter of 10 µm.
ElementLineSpectrometerPosition (mm)Bg +/− (s)Peak (s)Standard Matrix
SiTAP77.237510Plagioclase
FTAP199.162510Apatite
YPETJ206.731030Glass
CaPETJ107.647510Apatite
CeLIFH177.5031530Monazite
SrTAP74.3611030Celestine
ThPETJ132.6091030Th-Oxide
LaLIFH184.7321530Monazite
PrLIFH156.5311530Glass
SmLIFH152.4251530Glass
NdLIFH150.1871530Glass

References

  1. Salvi, S.; Williams-Jones, A.E. Alkaline granite-syenite deposits. In Rare-Element Geochemistry and Mineral Deposits; Linnen, L., Samson, I.M., Eds.; Geological Association of Canada: St. John’s, NL, Canada, 2005; pp. 315–341. [Google Scholar]
  2. Sørensen, H. Agpaitic nepheline syenites: A potential source of rare elements. Appl. Geochem. 1992, 7, 417–427. [Google Scholar] [CrossRef]
  3. Semenov, E.I. Economic mineralogy of alkaline rocks. In The Alkaline Rocks; Sørensen, H., Ed.; Wiley-Interscience: Great Britain, UK, 1974; pp. 543–552. [Google Scholar]
  4. European Commission. Report on critical raw materials and the circular economy. In Commission Staff Working Document; European Commission: Brussels, Belgium, 2018. [Google Scholar]
  5. Kempe, U.; Möckel, R.; Graupner, T.; Kynicky, J.; Dombon, E. The genesis of Zr-Nb-REE mineralisation at Khalzan Buregte (Western Mongolia) reconsidered. Ore Geol. Rev. 2015, 64, 602–625. [Google Scholar] [CrossRef]
  6. Richardson, D.G.; Birkett, T.C. Peralkaline rock-associated rare metals. In Geology of Canadian Mineral Deposit Types; Eckstrand, O.R., Sinclair, W.D., Thorpe, R.I., Eds.; Geological Survey of Canada: Ottawa, ON, Canada, 1995; Volume 8, pp. 523–540. [Google Scholar]
  7. Motzfeldt Project—A Future World Class Multi-Element Project, RAM Resources Limited. Available online: https://www.govmin.gl/images/stories/minerals/events/perth_dec_2010/Ram_Resources.pdf (accessed on 24 January 2018).
  8. Gysi, A.P.; Williams-Jones, A.E.; Collins, P. Lithogeochemical vectors for hydrothermal processes in the Strange Lake peralkaline granitic REE-Zr-Nb deposit. Econ. Geol. 2016, 111, 1241–1276. [Google Scholar] [CrossRef]
  9. Chakrabarty, A.; Mitchell, R.H.; Ren, M.; Pal, S.; Pal, S.; Sen, A.K. Nb-Zr-REE re-mobilization and implications for transitional agpaitic rock formation: Insights from the Sushina Hill complex, India. J. Petrol. 2018, 59, 1899–1938. [Google Scholar] [CrossRef]
  10. Melluso, L.; Guarino, V.; Lustrino, M.; Morra, V.; De’Gennaro, R. The REE- and HFSE-bearing phases in the Itatiaia alkaline complex (Brazil) and geochemical evolution of feldspar-rich felsic melts. Mineral. Mag. 2017, 81, 217–250. [Google Scholar] [CrossRef]
  11. Sørensen, H. The Alkaline Rocks; Wiley-Interscience: Great Britain, UK, 1974; p. 622. [Google Scholar]
  12. Kempe, U.; Götze, J.; Dandar, S.; Habermann, D. Magmatic and metasomatic processes during formation of the Nb-Zr-REE deposits Khaldzan Buregte and Taskhir (Mongolian Altai): Indications from a combined CL-SEM study. Mineral. Mag. 1999, 63, 165–177. [Google Scholar] [CrossRef]
  13. Kovalenko, V.I.; Tsaryeva, G.M.; Goreglyad, A.V.; Yarmolyuk, V.V.; Troitsky, V.A.; Hervig, R.L.; Farmer, G.L. The peralkaline granite-related Khadzan-Buregtey rare metal (Zr, Nb, REE) deposit, Western Mongolia. Econ. Geol. 1995, 90, 530–574. [Google Scholar] [CrossRef]
  14. Kovalenko, V.I.; Kozlovski, A.M.; Yarmolyuk, V.V. Trace element ratios as indicators of source mixing and magma differentiation of alkali granitoids and basites of the Haldzan-Buregtey massif and the Haldzan-Buregtey rare-metal deposit, western Mongolia. Petrology 2009, 17, 227–252. [Google Scholar] [CrossRef]
  15. Andeeva, I.A. Genesis and mechanisms of formation of rare-metal peralkaline granites of the Khaldzan Buregtey massif, Mongolia: Evidence from melt inclusions. Petrology 2016, 24, 462–476. [Google Scholar] [CrossRef]
  16. Google LLC. Google Earth Pro Map Data: Image Digital Globe Landsat/Copernicus; Google LLC: Mountain View, CA, USA, 2019. [Google Scholar]
  17. Gonvindaraju, K. 1994 Compilation of working values and sample descriptions for 383 geostandards. Geostandard. Geoanalytical Res. 1994, 18. [Google Scholar] [CrossRef]
  18. Sindern, S.; Meyer, F.M. Automated quantitative rare earth elements mineralogy by scanning electron microscopy. In Handbook of Rare Earth Elements–Analytics; Golloch, A., Ed.; De Gruyter: Berlin, Germany, 2016. [Google Scholar]
  19. Heilbronner, R.; Barrett, S. Image Analysis in the Earth Science—Microstructures and Textures of Earth Materials; Springer: Berlin, Germany, 2014. [Google Scholar] [CrossRef]
  20. Streckeisen, A.L. To each plutonic rock its proper name. Earth Sci. Rev. 1976, 12, 229–253. [Google Scholar] [CrossRef]
  21. De la Roche, H.; Leterrier, J.; Grandclaude, P.; Marcal, M. A classification of volcanic and plutonic rocks using R1-R2 diagram and major element analyses—Its relationships and current nomenclature. Chem. Geol. 1980, 29, 183–210. [Google Scholar] [CrossRef]
  22. Middlemost, E.A.K. Naming materials in the magma/igneous rock system. Earth Sci. Rev. 1994, 37, 215–224. [Google Scholar] [CrossRef]
  23. McDonough, W.F.; Sun, S.-S. The composition of the Earth. Chem. Geol. 1995, 120, 229–253. [Google Scholar] [CrossRef]
  24. Deer, W.A.; Howie, R.A.; Zussman, J. An Introduction to the Rock Forming Minerals, 3rd ed.; Mineralogical Socitey: London, UK, 2013. [Google Scholar]
  25. Lund, C.; Lamberg, P. Geometallurgy—A tool for better resource efficiency. Eur. Geol. 2014, 37, 39–43. [Google Scholar]
  26. Dominy, S.; O’Connor, L.; Parbhakar-Fox, A.; Glass, H.J.; Purevgerel, S. Geometallurgy—A route to more resilient mine operations. Minerals 2018, 12, 560. [Google Scholar] [CrossRef]
  27. Compan, G.; Pizarro, E.; Videla, A. Geometallurgical model of a copper sulphide mine for long-term planning. J. South. Afr. Inst. Min. Metall. 2015, 115, 549–556. [Google Scholar]
  28. Wills, B.A. Mineral Processing, 6th ed.; Butterworth Heinemann: Oxford, UK, 1992. [Google Scholar]
  29. Katzmarzyk, J.; Gronen, L.; Wotruba, H.; Sindern, S.; Hellmann, A.; Meyer, F.M. Geometallurgical investigation of the processing of REE-Y-Nb-Zr complex ore. In Proceedings of the IMPC International Mineral Processing Congress, Moscow, Russia, 15–21 September 2018. Abstract No. 2009-66. [Google Scholar]
  30. Yang, X.; Satur, J.V.; Sanematsu, K.; Laukkanen, J.; Saastamoinen, T. Beneficiation studies of a complex REE ore. Miner. Eng. 2015, 71, 55–64. [Google Scholar] [CrossRef]
  31. Bond, F.C. Crushing & Grinding Calculations Part I. Br. Chem. Eng. 1951, 622, 378. [Google Scholar]
  32. Gregory, M.J.; Lang, J.R.; Gilbert, S.; Hoal, K.O. Geometallurgy of the peppble porphyry copper-gold-molybdenum deposit, Alaska: Implications for gold distribution and paragenesis. Econ. Geol. 2013, 108, 463–482. [Google Scholar] [CrossRef]
  33. Hoal, K.O. Getting the geo in geomet. SEG Newslett. 2008, 73, 11–15. [Google Scholar]
  34. Walters, A.S.; Goodenough, K.M.; Hughes, H.S.R.; Roberts, N.M.W.; Gunn, A.G.; Rushton, J.; Lacinska, A. Enrichment of rare earth elements during magmatic and post-magmatic processes: A case study from Loch Loyal Syenite, northern Scotland. Contrib. Miner. Petrol. 2013, 166, 1177–1202. [Google Scholar] [CrossRef]
  35. Schmitt, A.K.; Trumbull, R.B.; Dulski, P.; Emmermann, R. Zr-Nb-REE mineralization in peralkaline granites from the Amis complex, Brandberg (Namibia): Evidence for magmatic pre-enrichment from melt inclusions. Econ. Geol. 2002, 97, 399–413. [Google Scholar] [CrossRef]
Figure 1. (A) Satellite image with the outline (magenta) of the entire alkaline massif of Khalzan Buregtei as proposed by [13,15]. The red box marks the area of the Khalzan Buregtei deposit shown as sketch map in B [16]. (B) Geological sketch map of the Khalzan Buregtei Zr-REE-Nb deposit with sampling areas KB S and KB G, see text for further details. Map basis according to [12,15] with nomenclature following [5].
Minerals 09 00217 g001
Figure 2. Modal composition (vol. %) of samples from ore bearing metasomatites in sampling areas KB G (top) and KB S (bottom), calculated from mineralogical phase maps.
Minerals 09 00217 g002
Figure 3. (A) Image of primary coarse quartz (Qtz) in sample KB G2 (yellowish interference color of quartz is due to section thickness > 30 µm) showing sub grain formation in adjacency to fine grained interstitial quartz intergrown with dark zircon-hematite aggregates. Optical microscopic image with cross-polarized light (xpl, transmitted light). (B) K-feldspar grain with irregular internal domains (xpl, transmitted light). (C) Lath shaped albite (Alb) crystals in interstitial volume of coarse grained quartz (xpl, transmitted light). (D) Arfvedsonite grain showing dark blue pleochroic color and typical cleavage, surrounded by aegirine (green pleochroic color). Lath-shaped albite (white to red) is colored red by fine grained hematite on lath planes. Microscopic image of KB G1 plain polarized light (ppl, transmitted light).
Minerals 09 00217 g003
Figure 4. Representative QEMSCAN© phase maps of Zr-REE-Nb ore. (A) Zircon-gittinsite cluster in sample KB G1. The core of a residual aegirine (green) is recognizable within the cluster. (B) Zircon-quartz cluster containing fluorite (purple) and hematite (pale red) in sample KB G6. Lines indicate the preserved subhedral shape of precursor amphibole as straight grain boundaries to K-feldspar and coarse grained quartz.
Minerals 09 00217 g004
Figure 5. (A) Back scatter (BSE) image of a zircon cluster. Hematite (hem) as fibrous shape crystals in interstitial volume between zircons (zrn) and one fluorite (flu) crystal. (B) 5 QEMSCAN© phase map with 5 µm point spacing showing the hematite intergrowth in a close up of the cluster displayed in A. (C) Electron probe micro analyser (EPMA) high-resolution Fe map revealing Fe fine cementation as blue color surrounding individual zircon crystals. Other minerals: quartz (qtz), kaolinite (kao), albite (alb).
Minerals 09 00217 g005
Figure 6. (A) Bastnaesite-quartz ore cluster in sample KB S9. K-feldspar is only found as relict. (B) Rutile-quartz cluster in granitic sample KB G6 containing fine grained quartz, zircon, fluorite and low amounts of hematite. The box indicates pyrochlore (Pcl) grain within the major association to K-feldspar (K-Fsp), being partly replaced by albite. (C) Euhedral pyrochlore on boundaries between K-feldsparand quartz-zircon (Qtz-Zrn) ore cluster. Joints inside the pyrochlore are healed by hematite (hem) precipitation, which also is found around the grains and within the ore cluster (ppl, reflected light, oil).
Minerals 09 00217 g006
Figure 7. REE pattern for KB G (upper) and KB S (lower). Coloured range represents maximum and minimum values of individual sample patterns (orange and red) of parallel evolution for high content of Zr in KB G and low Zr content in KB S. The samples KB G3 and G5 were identified as having the lowest enrichment of Zr in the KB G samples and showed a decreasing tendency within the HREE. The same behaviour is shown for the KB S dataset where, in contrast, the samples KB S6 and S8 contain significantly higher amounts of Zr than the other samples (red range) representing the increasing tendency of the HREE. REE concentrations were normalized against chondritic composition according to [24].
Minerals 09 00217 g007
Figure 8. R1-R2 multication plot of the KB G and S samples, classification after [21] indicated by stippled grey lines. Fluorite (Flu) and quartz (Qtz) compositions plot outside the diagram and are indicated by their R1 and R2 value at the hosting axis. The blue mark indicates unaltered rocks of the Khalzan Buregtei Massif according to [5] (Syenites [5]) and Gronen (unpublished) (Syenite KB). Red mark highlights ore bearing metasomatic rocks of the KB S and KB G dataset. Purple vectors indicate the change of R2 value of samples containing CaO > 1.8 wt. %. Mineral abbreviations: Zrn = zircon, Gtt = gittinsite, Alb = albite, An50 = anorthite, Or = orthoclase K-feldspar, Arf = arfvedsonite, Aeg = aegirine. Composition of Arf and Aeg according to [24].
Minerals 09 00217 g008
Figure 9. Particle size distributions of ore minerals (A) and ore clusters (B). The ore mineral groups Zr-silicates and REE-carbonates were combined into the class of ore minerals because these minerals are mostly observed in cluster assemblage. As can be obtained from the particle size distribution, the ore mineral size at P80 is significantly smaller (45–85 µm) in comparison to the particle size of the ore clusters (400–500 µm).
Minerals 09 00217 g009
Table 1. Major element composition of KB G samples from western part metasomatites. TAS classification for plutonic rocks according to [22]. QAPF classification according to [20] on the basis of volumetric mineral composition as shown in Figure 2. Multication parameters R1 and R2 were calculated according to [21] with: R1 = 4Si − 11(Na + K) − 2(Fe + Ti), and R2 = 6Ca + 2Mg + Al. Abbreviations for TAS and QAPF classification: Gran = granite, Mon = quartz-monzonite, GranDio = granodiorite; abbreviations for de la Roche: Qtz rich = outside the classification fields, Alk Gran = alkali granite, Syeno Gran = syenogranite, Monzo Gran = monzogranite; LOI = loss on ignition.
(wt. %)KB G1KB G2KB G3KB G4KB G5KB G6KB G7KB G8
SiO266.0066.9070.9070.8075.0068.6066.6068.40
Al2O310.6510.1511.5510.0511.355.795.9910.10
Fe2O32.803.184.902.893.583.514.101.72
MgO0.030.020.040.030.040.000.030.01
CaO3.692.990.341.900.428.656.414.48
Na2O4.534.634.193.373.960.081.243.32
K2O3.613.293.513.633.744.795.133.49
Cr2O3<0.01<0.01<0.01<0.010.00<0.01<0.01<0.01
TiO20.140.490.410.250.070.450.300.55
P2O50.040.020.050.020.03<0.01<0.010.03
MnO0.160.190.060.230.010.050.470.04
BaO0.030.03<0.010.01<0.010.020.040.01
LOI 1.751.821.71.571.482.262.392.35
Total93.5293.7897.6694.7699.6894.2792.7694.56
R118691950228025902622332026852503
R2428376249310249623496462
TASMonMonGranGranGranGranDioGranDioGranDio
De la RocheSyeno GranSyeno GranAlk GranAlk GranAlk GranQtz richGranDioMonzo Gran
QAPFAlk GranAlk GranAlk GranAlk GranAlk GranAlk GranAlk GranQtz rich
Table 2. Major element composition of KB S. TAS classification for plutonic rocks according to [22]. QAPF classification according to [20]. Parameters R1 and R2 and resulting classification calculated according to [21]. Abbreviations for TAS, de la Roche, and QAPF classifications as defined in Table 1.
(wt. %)KB S1KB S2KB S3KB S4KB S5KB S6KB S7KB S8KB S9KB S10
SiO279.9077.2072.7074.2071.7076.5077.4072.5075.0073.30
Al2O39.0410.5512.9010.759.778.9110.509.9711.3510.80
Fe2O32.141.711.283.645.101.321.412.474.723.61
MgO0.010.030.040.030.04<0.010.030.030.020.03
CaO0.040.060.200.180.470.520.102.581.872.30
Na2O1.022.274.213.623.432.933.042.693.952.59
K2O6.285.714.273.483.163.224.133.163.293.42
Cr2O3<0.01<0.01<0.01<0.01<0.01<0.01<0.01<0.01<0.01<0.01
TiO20.090.090.380.070.180.221.320.340.160.92
P2O5<0.01<0.010.020.020.020.03<0.010.01<0.01<0.01
MnO0.010.060.010.040.430.020.010.010.010.01
BaO<0.010.01<0.010.010.050.010.010.01<0.010.01
LOI0.640.861.561.362.130.81.21.961.432.25
Total99.1798.5597.5897.4196.4994.4899.1595.74101.899.25
R13434295423062749268532623040306327003048
R2180212267223221205213349334349
TASGranGranGranGranGranGranGranGranGranGran
De la RocheQtz richAlk GranAlk GranAlk GranAlk GranQtz richQtz richQtz richSyeno GranQtz rich
QAPFAlk GranAlk GranAlk GranAlk GranAlk GranAlk GranAlk GranAlk GranAlk GranAlk Gran
Table 3. Rare earth elements (REEs) + Zr and Nb composition of KB G. Zirconium data from handheld X-ray fluorescence (XRF) measurement. Europium anomaly Eu/Eu* calculated based on the geometric mean of normalized Sm and Gd values.
(mg/kg)KB G1KB G2KB G3KB G4KB G5KB G6KB G7KB G8
La2242311120223694307263763
Ce5826592480547125078711001700
Pr5971297581638567212
Nd2112601080207642299239768
Sm6183295601726152160
Eu68205114512
Gd6592298791865256137
Tb1925612426111329
Dy17520335720712988115188
Ho4954605010243341
Y12851460157513555327058981090
Er2002161551834491130142
Tm394019335172425
Yb2692779921321125166166
Lu384010292192624
Eu/Eu*0.280.210.210.210.190.190.290.25
Nb10951140>25001660>2500190514951445
Zr (wt. %)3.272.660.081.911.612.683.282.46
Table 4. REE + Zr and Nb composition of KB S. Zirconium data from handheld XRF measurement.
(mg/kg)KB S1KB S2KB S3KB S4KB S5KB S6KB S7KB S8KB S9KB S10
La460510113089968245812905053851700
Ce93496822801685123090229009648574480
Pr108125281206159112373113115620
Nd399475101076958142113954244562430
Sm699320317615598324115154569
Eu351110951771029
Gd548416016917887251108161406
Tb10152435391839212863
Dy73104142244292143187157149329
Ho17243056733833412556
Y436617838150017759658059756501100
Er5272871722381378613957134
Tm710132433221122615
Yb456579150205159781623292
Lu69101926221124311
Eu/Eu*0.160.160.190.180.170.170.180.190.190.19
Nb49066519451270>2500794>250098214101050
Zr (wt. %)0.390.570.601.302.003.140.182.560.020.12
Table 5. Exemplary analyses of gittinsite and zircon crystals of the metasomatic samples.
(wt. %)GttGttZrnZrnZrnZrnZrnZrn
SiO236.3240.0132.4930.8930.9027.2527.4327.98
ZrO234.7535.4555.9457.8556.2458.9654.7354.62
HfO20.640.711.111.001.181.280.921.00
Fe2O30.890.411.231.040.761.030.262.49
Ce2O30.340.070.410.060.190.070.040.24
Dy2O30.220.250.270.120.260.250.810.38
Er2O30.080.100.310.150.310.360.780.41
Y2O30.420.542.070.782.011.995.983.12
Na2O0.050.050.060.040.070.210.400.42
CaO18.4117.451.032.301.840.450.070.34
MnO0.580.670.110.110.140.020.010.05
Total92.8495.9595.594.6594.4892.4792.5292.11
Table 6. Representative EPMA analysis of REE-carbonate minerals bastnaesite-(Ce), parisite-(Ce), and synchysite-(Y).
(wt. %)Bst-(Ce)Bst-(Ce)Bst-(Ce)Par-(Ce)Par-(Ce)Par-(Ce)Syn-(Y)Syn-(Y)
CaO1.071.490.548.2310.929.3419.5316.64
Y2O32.823.871.620.370.772.3029.6922.43
Ce2O332.5231.8734.6032.8729.6131.261.292.36
La2O311.1910.9013.4318.4613.5011.390.240.54
Pr2O33.793.733.882.542.853.360.230.30
Sm2O34.224.043.610.891.371.990.640.77
Nd2O315.4214.7415.146.609.1912.250.520.85
SrO0.110.140.16nd0.390.500.380.16
ThO20.670.340.08nd0.060.050.180.45
SiO20.480.670.081.381.420.240.4844.37
F8.109.034.566.967.927.255.014.99
CO220.9321.2020.7423.2623.4023.0924.0624.02
Total101.32102.0298.44101.56101.40103.0282.2477.88
Table 7. Elemental composition of representative pyrochlore grains from sampled parts of the Khalzan Buregtei deposit.
(wt. %)Pcl 1Pcl 2Pcl 3Pcl 4Pcl 5Pcl 6Pcl 7Pcl 8
Nb2O567.2568.1366.9057.9662.5470.7166.6366.03
Fe2O30.940.970.922.511.040.910.801.05
TiO24.814.855.308.163.612.444.334.62
Ta2O52.131.612.321.952.221.612.492.22
Na2O2.721.902.541.311.572.733.602.30
CaO3.933.974.214.234.924.793.795.27
Ce2O311.2110.9610.9911.929.3110.1010.794.16
La2O34.344.374.174.333.704.034.4210.92
Nd2O32.542.582.543.072.212.382.632.51
Y2O30.070.120.120.200.720.180.070.09
UO20.370.430.290.601.160.420.290.20
ThO20.070.060.010.080.040.010.010.06
SiO20.460.420.270.652.760.600.750.47
Total100.83100.38100.5896.9995.80100.90100.6099.89

