Article

Microcrystalline Apatite Minerals: Mechanochemical Activation for Agricultural Application

1
School of Materials Science and Technology, Beijing Key Laboratory of Materials Utilization of Nonmetallic Minerals and Solid Wastes, National Laboratory of Mineral Materials, China University of Geosciences (Beijing), Beijing 100083, China
2
School of Materials Science and Engineering, Tsinghua University, Beijing 100084, China
3
Zibo Tsingda Powder Material Engineering Co, Ltd., Zibo 255000, China
4
Functional Materials Laboratory (FML), School of Materials Science and Engineering, Xi’an University of Architecture and Technology, Xi’an 710055, China
5
School of Materials and metallurgy, Guizhou University, Guiyang 550025, China
6
Tianjin Eco-city Municipal Landscape Co. Ltd., Tianjin 300467, China
*
Authors to whom correspondence should be addressed.
Minerals 2019, 9(4), 211; https://doi.org/10.3390/min9040211
Submission received: 29 January 2019 / Revised: 20 March 2019 / Accepted: 26 March 2019 / Published: 31 March 2019

Abstract

:
Phosphate minerals of apatite from three mines with different amounts of gangue minerals were activated by milling to increase their microcrystallinity and subsequent dissolution in a citric acid solution to serve as slow-release fertilizers for agricultural production. XRD (X-ray diffraction), FTIR (Fourier Transform Infrared), and SEM (Scanning electron microscope) were employed to characterize the properties of the prepared samples, such as changes in microcrystallinity, mineral composition, lattice structure, and granule morphology during the milling. With prolonged milling time, accompanied with the progress in microcrystallinity, the ratio of the formed amorphous compositions increased, resulting in higher dissolution in citric acid solution. In the case of carrot plants, the addition of the microcrystalline phosphate rock together with phosphorus bacteria allowed an efficient nutrient (P, K, and N) uptake as high as 77.0%, 36.7%, and 32.2%, which increased by 91.3%, 123.0%, and 105.2%, respectively, from the growth on an original soil without any addition, demonstrating clear contribution of the activated apatites in agricultural production.

1. Introduction

Phosphorus (P) is an essential nutrient for life—high P content is present in the DNA and RNA backbones and plays a crucial role in cell metabolism [1]. Phosphorus-based fertilizers have a key role in the agriculture field, for instance, for crops growth. Unfortunately, the high-grade (P2O5 ≥ 30%) phosphate rock (PR) reserves are limited and may only support the world need for the upcoming 50 years. On the other hand, medium/low-grade PR (P2O5 < 30%) reserves can support the world as long as 300 years but probably at higher costs [2]. The “reactivity” of PRs is influenced strongly by the extent of carbonate substitution for phosphate in the apatite minerals [3]. PRs are mostly apatites with varying physical, chemical, and crystallographic properties [4]. The most widely distributed, fine-grained, and economically valuable carbon-fluorapatite in sedimentary rocks is the most controversial [5]. There are a number of factors controlling their dissolution in soil and availability to plants coupled with the inability to predict their agronomic effectiveness in a given soil climatic and crop situation [6]. It is known that a high-intensity mechanical activation would cause the distortion of the grain lattice of the phosphate crystal and create micro-cracks within the particles [7]. Experimental studies confirmed via planting contrast testing that the presence of these cracks can improve the release rate of available phosphorus, enhancing the PR biological fertilizer efficiency [8]. Indeed, the reduction of particle size of the PR powder and the increased surface area facilitate the PR powder activation, which then occurs just at the beginning of milling. During the mechanical milling process, the material undergoes plastic deformation and destruction when the impact stress exceeds the elastic limit of the material. Plastic deformation causes a large number of dislocations within the material crystal, which then changes the crystal structure, forming a mechanical chemical activation point [9]. In general, the main reason for the increase in PR powder activity is attributed to the crystal defects, including the lattice strain and grain size reductions, as well as the formation of nanostructures during mechanical activation [10]. The main advantage of the mechanochemical method is that it enables the synthesis of nanomaterials in bulk, at ambient temperature, and in a very short processing time [11]. After the PR powder undergoes the ultra-microactivation treatment, the strong Ca–P bond in apatite is broken; however, the phosphate activities of PO43−, HPO42−, and H2PO4 have significantly increased. Consequently, the phosphorus in the PR powder can be more easily absorbed by plants, displaying the higher fertilizer efficiency of the internal factors [12]. A high-energy input density requires a long microcrystalline duration as well as large specific surface area, causing serious damage to the crystal structure. Therefore, the XRD diffraction peak is significantly reduced as a result of crystal structure disintegration [13,14].
Due to the difficulty in mineral processing via traditional methods [15], the use of non-acid methods to process physically and mechanically medium/low-grade PR has become an inevitable trend. However, the difference between the amount of fertilizer usage in soil and that of its uptake by plants leads to the loss of the fertilizer and environmental pollution—the most direct consequence is the decrease in the quality and yield of crops [16]. Research and development shall continue to pursue new alternative innovative technology in terms of fertilizer production and use it to achieve these goals, that is, sustaining crop production and minimizing environmental impacts [17]. Phosphorus solubilizing bacteria play a role in phosphorus nutrition by enhancing its availability to plants through the release from inorganic and organic soil P pools by solubilization and mineralization [18]. In this study, different types and grades of PR were chosen and mechanochemically activated for the development of new, environmentally-friendly, highly efficient slow-release fertilizers. The obtained products were systematically characterized via different techniques including XRD, FTIR, and SEM. The changes of citric acid-soluble P content measurement, mineral composition, and crystal morphology were assessed before and after activation in macroscopic and microscopic scales. To understand the relationship between energy input, phosphorus release characteristics, and the change in the PR powder crystal during microcrystalline activation, we proposed a plausible activation mechanism. Finally, we also investigated the possible agricultural application of these novel fertilizers. Indeed, one of the most performing minerals was selected for application evaluation via a greenhouse pot experiment. This provides insights into the leap-forward development of the phosphorus and phosphating fertilizers for sustainable agricultural application.

2. Experimental Section

2.1. Raw Materials

In this study, raw materials containing Yunnan powder (PR1, collophanite) was provided by Yuntianhua Co, Ltd. (Kunming, China), the Hubei powder (PR2, metamorphosed sedimentary PR) was provided by Hubei Wuhe Yufeng Chemical Co, Ltd. (Zhongxiang, China), and the Henan powder (PR3, sedimentary PR) was provided by Henan Fengye Mining Co, Ltd. (Luoyang, China). They were collected from Qingda Powder Material Engineering Co, Ltd. (Zibo, China). The main chemical composition of these raw materials was analyzed (see in Table 1). All raw materials were crushed by a Jaw crusher (PE-250 × 400, Zhengzhou Linyang Machinery Equipment Co, Ltd., Zhengzhou, China) and then ground by an ordinary grinder (3R1410, Zhengzhou Yingsai Machinery Equipment Co, Ltd., Zhengzhou, China). PRs were sieved with 100-mesh and microcrystallized (WJH-02, developed by Tsinghua University). The performance of the prepared samples was characterized and analyzed for crop nutrient uptake and yields by potted applications. Phosphorus bacteria were collected from Jinan, Shandong Province.
In order to prepare the samples, first of all, large blocks of PR1, PR2, and PR3 raw materials were crushed into small particles by a jaw crusher (PE-250×400). Then, these particles were converted into powder form through an ordinary grinder (3R1410), sieved through 100-mesh and milled for finer and micro-crystallized through a microcrystalline device (WJH-02).
The tank volume of the milling equipment was 2 L; the medium was steel balls. The mass fraction of the slurry concentration was 44%. Samples were dried at 105 °C and then prepared for characterization and chemical analysis. Moreover, for XRD analysis, the samples were sieved with 200-mesh to remove big particles.

2.2. Carrot Cultivation for Nutrient Characterizations

Pot cultivation of carrots was conducted at the greenhouse of Tsinghua University Organic Fertilizer Base in Beijing. The soil (aqui-cinnamon soil) was collected from Changping District, Beijing. The soil had a pH of 8.2 and 11.73 g/kg of organic matter. It also contained some nutrients including phosphorous, potassium, and nitrogen in concentrations of 18.2, 205.2, and 67.0 mg/kg, respectively. The carrot seeds were treated in hot water for 15 min and kept at 25 °C for three days. The cultivation was carried out for 94 days, after which three strains were taken as samples after harvest. Four comparison treatments were arranged: control (blank test without PR addition); ordinary PR powder (PRA, without milling operation) 16 g/pot; microcrystalline PR powder (PRB) 16 g/pot; and phosphorus bacteria 3.2 g/pot (PRC). Each treatment was performed randomly and repeated three times. All scientifically proven best cultivation practices were followed in this experiment. The weights of biomass after harvest were recorded. Active nutrients were also measured in post-harvest soil samples.

2.3. Characterizations of the Products

An ARL Perform’X X-ray fluorescence spectrometer (ThermoFisher, Waltham, MA, USA) was used to characterize the elemental composition of the sample. A SmartLab X-ray diffraction with CuK-Ni filtered radiation (Rigaku, Tokyo, Japan) of the samples was recorded in the 2θ scanning range of 10° to 90° and at a speed rate of 8.2 °/min. FTIR spectroscopy (Vertex 70) (PerkinElmer, Waltham, MA, USA) experiments were conducted with a DTGS (Deuterated triglycine sulfate) detector in the spectral range of 4000–400 cm−1. Morphology and microstructure were identified by a Supra 55 field emission SEM (FE-SEM) (Carl Zeiss, Jena, Germany). HORIBA 7593-H energy dispersive spectroscopies (EDS) (HORIBA Scientific, Kyoto, Japan) associated with the SEM were used to characterize the chemical composition of PR powders. The soil-available phosphorus was extracted by sodium bicarbonate and measured via spectrophotometry. As a reference, the 2% citric acid-soluble is suitable for direct fertilizer application of most phosphate [19]. The data were analyzed using the statistical package of SPSS (SPSS software, Version 17.0, SPSS Institute Inc., New York, NY, USA) [20], with all treatment effects determined using Duncan’s multiple-range test. Significant treatment effects were presented at P ≤ 0.05.

3. Results and Discussion

3.1. Characterization of the Processed PR

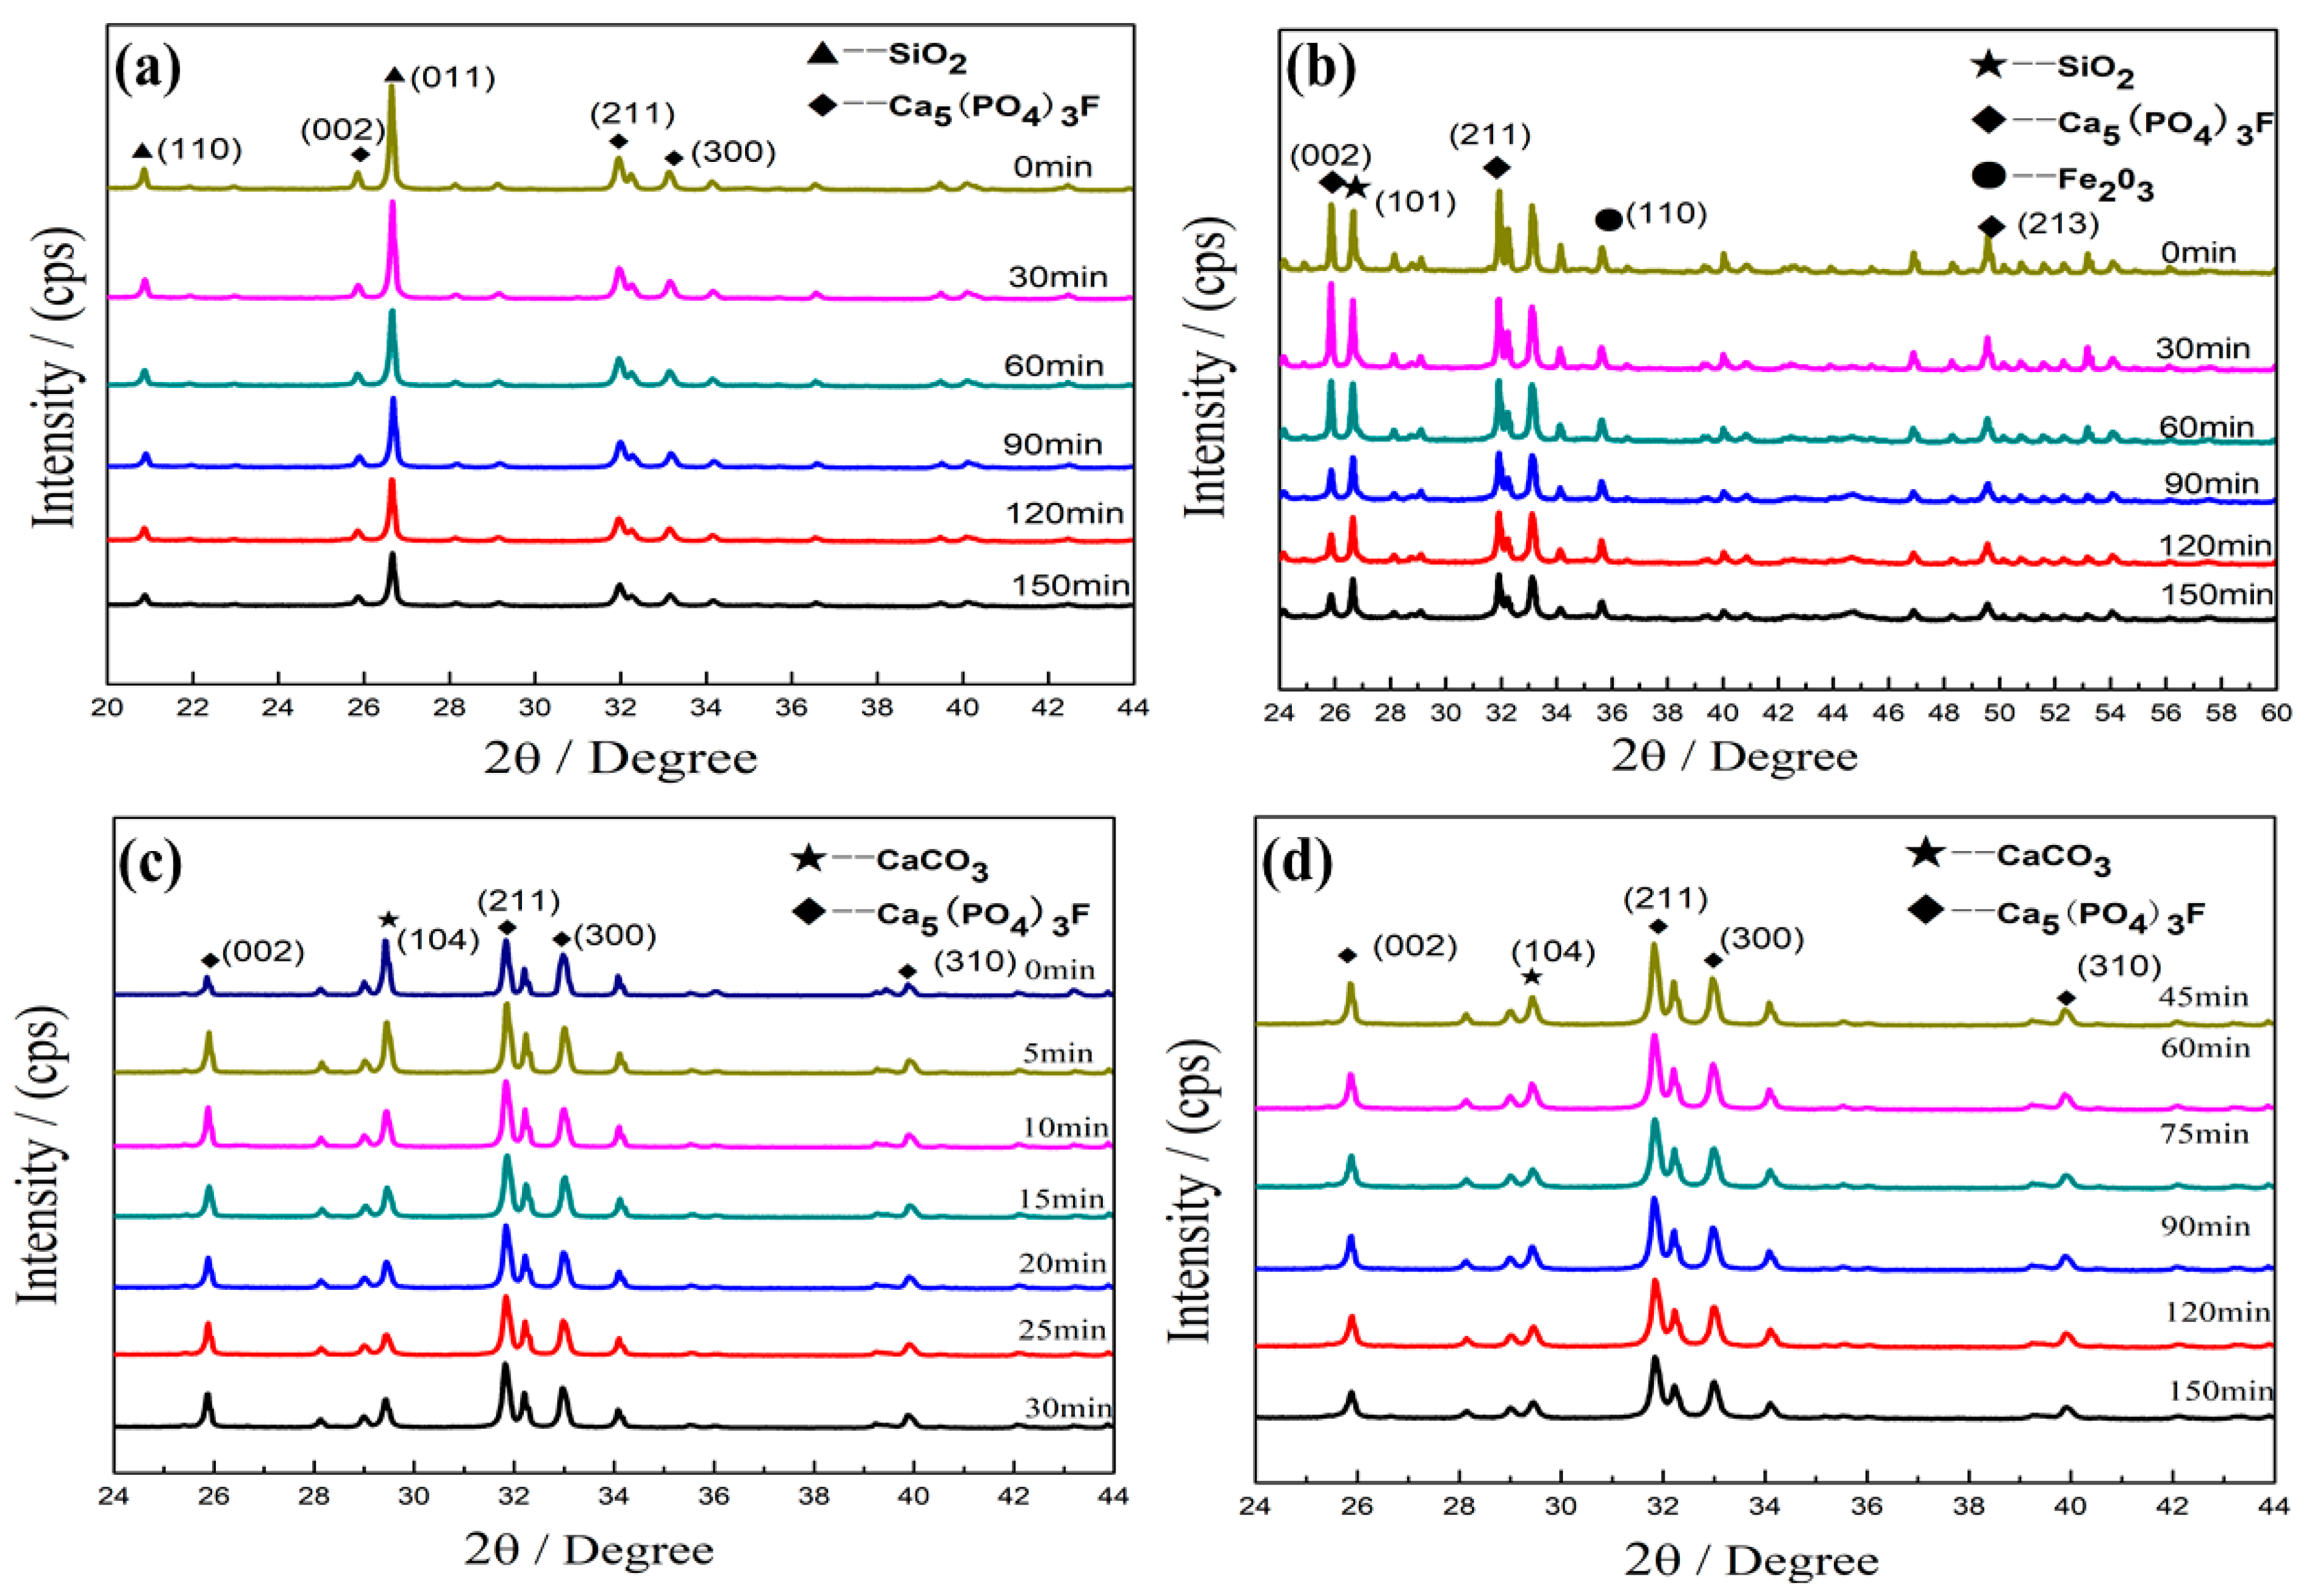
3.1.1. Effects of the Microcrystalline Processing on Diffracted Intensity in PR Powders

Figure 1 shows the XRD patterns of the PR1, PR2, and PR3 samples at different milling times. It is generally believed that the collophane is amorphous. Indeed, it is composed of apocrystalline or ultra-microcrystalline apatite microcrystals, as confirmed by electron microscopic results [21,22]. Based on the phase analysis, it can be concluded that the PR1 is mainly composed of fluoroapatite [Ca5(PO4)3(F,OH)] (Figure 2) and quartz (SiO2) phases (Figure 1a). The diffraction peaks from both phases in the PR1 sample did not change significantly. Compared to the raw materials, the (002), (211), and (300) crystal face diffraction peaks of [Ca5(PO4)3(F,OH)] did not remarkably decrease, whereas the diffraction peaks of the quartz, the (110), and the (011) crystal faces increased slightly with the increase of milling time when compared to the raw materials. Indeed, a slight lattice distortion appeared in the microcrystalline PR1, whereas the crystal structure did not change significantly, which is consistent with the fact that the quartz is a mineral with a high degree of crystallinity and is difficult to grind.
With the increase of milling time, the characteristic diffraction peaks of fluorapatite and the associated SiO2 minerals gradually broadened in PR1. Furthermore, the diffraction peak gradually decreased as the PR powder lattice became distorted; as a consequence, the crystallinity decreased, and the degree of distortion increased. The (002) diffraction peak of the [Ca5(PO4)3(F,OH)] in the samples at 25.9° dropped sharply after 30 min. In the meantime, the (211) diffraction peak of [Ca5(PO4)3(F,OH)] at 32.0° appeared as the milling time became significantly lower until it dropped at 120 min. The (300) diffraction peak of [Ca5(PO4)3(F,OH)] at 33.2° underwent an upward trend before 30 min and beyond 90 min, whereas the overall trend decreased with the increase of milling time.
With the increase of milling time, the (110) diffraction peak of SiO2 at 20.9° decreased in the PR1 sample, while the (011) at 26.7° dropped sharply after 60 min. Consequently, the speed slightly decreased as the diffraction peak gradually decreased.
Figure 1c,d reveals the presence of fluorapatite [Ca5(PO4)3(F,OH)] and calcium carbonate (CaCO3) phases in PR2. In general, the intensity of the diffraction peak in XRD patterns declines with increased milling time. However, the intensity of the (002) peak at 25.9° and the (211) peak at 31.8° belonging to [Ca5(PO4)3(F,OH)], as well as the (104) peak at 29.4° attributed to CaCO3, increased, passing from a milling time of 5 min to 30 min; the diffraction peaks of (300) at 33.0° and (310) around 39.9° of [Ca5(PO4)3(F,OH)] appeared at a significantly high intensity at 5 min, 15 min, and 30 min. The number of (002), (211), (104), (300), and (310) levels may have increased the intensity of the diffraction peak. The diffraction peaks of every crystal face [Ca5(PO4)3(F,OH)] in the sample reached the lowest point after 150 min, with the peak intensity dropping by 24.4% (002), 10.6% (211), 24.5% (300), and 9.3% (310). In contrast, the peak intensity of CaCO3 decreased by 58.5%. Based on the physical phase analysis, we can conclude that fluorapatite crystals, quartz, and ferric oxide crystals (Fe2O3) exist in the PR3 (Figure 1b). With the increase of the milling time, a decrease in diffraction peak intensity of all three phases in PR3 was observed with the value at 120 min being higher at 90 min and with the lowest value reported at 150 min.
The XRD results of the three selected PR powder samples illustrate the plastic deformation and defects on the surface of the powder particles, which could spread to the grain interior, whereas the crystal structures of the grains showed the slightly continuous destruction. Therefore, during the milling PR powder utilization, the overall trend of the main diffraction peaks was continuously declining. This was the major reason why particles allocated in a slightly damaged lattice led to low crystallinity. Indeed, all three PR powders had the lowest diffraction peak at 150 min, which indicated that the activity increased due to lowering crystallinity and an increasing degree of disturbance.
Under the action of multiple stresses, the main diffraction peaks widened, whereas the peak intensity gradually decreased with the increase of milling time. This implied that the crystal structure was destroyed, the crystal was completely deformed in the crystal structure, and the amorphous layer was continuously thickened. The probable cause of the resulting data was that carbonate in PR2 affected the crystal of [Ca5(PO4)3(F,OH)], and while the crystals of carbonate were wrecked, the crystal of [Ca5(PO4)3(F,OH)] released stress and returned to its natural state. Quartz in PR1 and PR3 was harder than phosphate, thus it helped in showing the phosphate crystal wreck. The carbonate in PR2 was softer than phosphate, thus the PR2 was not showing a sharp decrease, but it first had a maximum and then declined more slowly than PR1 and PR3 [5].

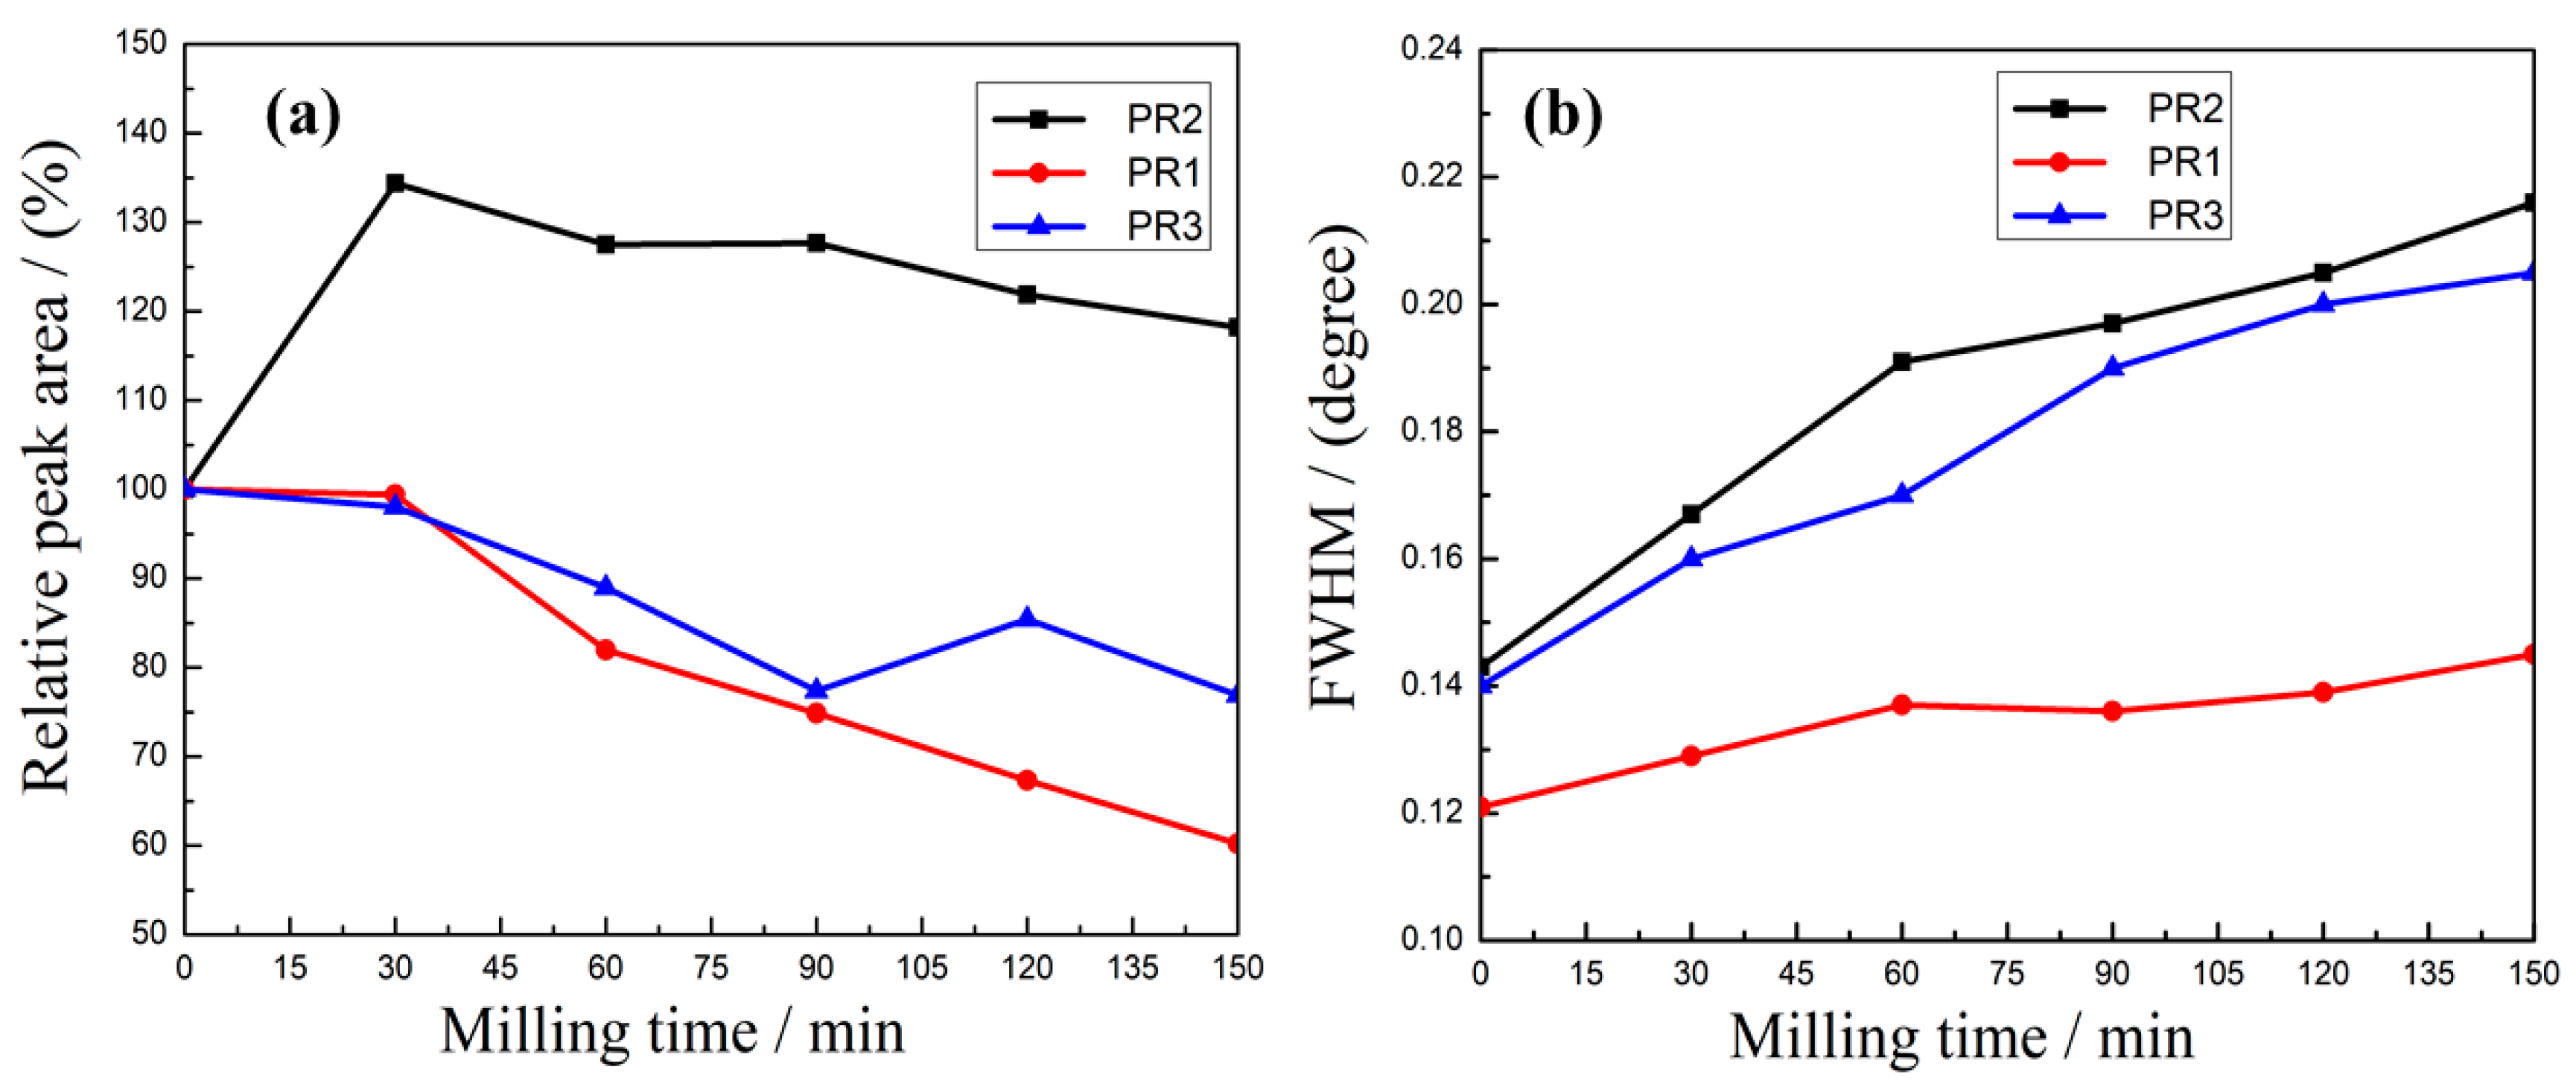
3.1.2. Effects of the Microcrystalline Processing on Relative Peak Area and Half-Width of PR Powders

The peak intensity mirrored the strength of the corresponding crystal orientation in the materials. By measuring the half-width values, the grain size could be calculated [23]. According to the XRD peak intensity value and the half-width value, the lattice distortion of minerals could be quantitatively investigated [24]. The relative peak area and half-width values are presented in Figure 3.
With the increase of milling time, the relative peak areas of the PR1 and PR3 decreased, whereas their half-width values increased.
The relative peak areas of the PR1 and PR3 were insignificant at 150 min compared to the relative peak areas of PR1 and PR3 of raw materials, which were reduced by 39.8% and 23.1%, respectively. Simultaneously, the half-widths of the PR1 and PR3 reached the highest values, which, compared to the raw materials, increased by 19.8% and 46.4%, respectively. From a microcrystalline point of view, the crystal lattices of PR1 and PR3 changed remarkably, demonstrating that a microcrystalline processing can reduce the grain size and lead to a disordered crystal structure (Figure 3).
In addition, with the increase of milling time, the diffraction peak area of PR2 underwent a sharp decrease; however, the relative peak area increased by 34.4% at 30 min compared to that of the raw materials. The half-width value of PR2 gradually increased, subsequently displaying an increasing rising trend (Figure 3).

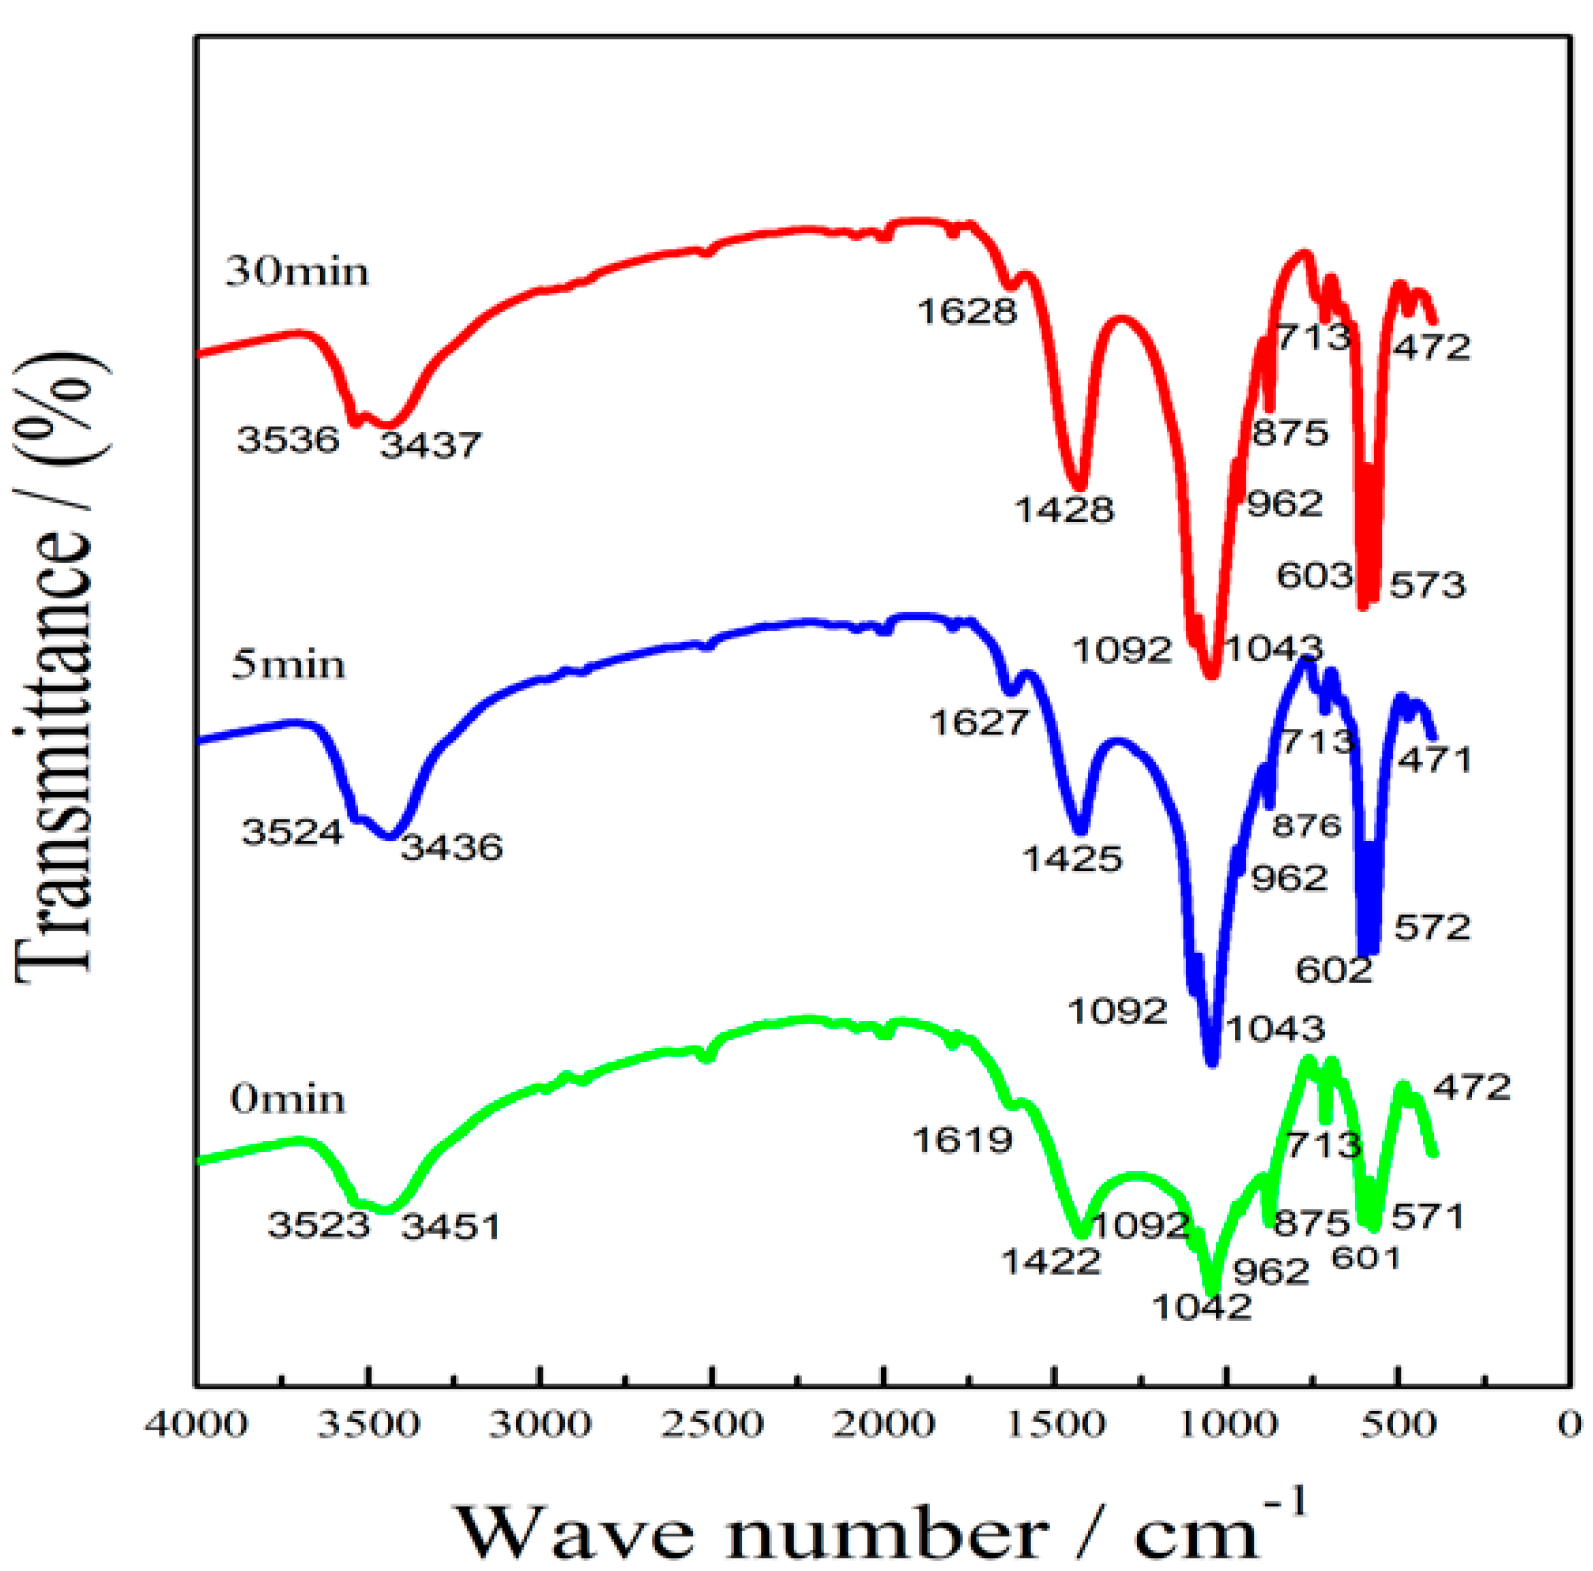
3.1.3. Effects of the Microcrystalline Processing on Infrared Spectrum of PR2

FTIR was employed to study the mineral-like isomorphism and morphology, as demonstrated by [25]. Figure 4 reports the IR spectra of PR2 at 0 min, 5 min, and 30 min. The three spectra demonstrate that PR2 belonged to the high-carbon fluoroapatite mineral [5]. In addition to the characteristic absorption of PO43−, the absorption band of CO32− could also be observed in the IR spectra of carbonate fluorapatite [26]. The peak at 3451 cm−1 corresponded to the stretching vibration of the phosphate hydration. The peak observed at 1042 cm−1 was a strong stretching vibration (V3) absorption, and at 1092 cm−1, its shoulder was located. These two peaks were associated with the PO43− anti-symmetric stretching vibration. The peak at 1422 cm−1 could be related to the CO32− anti-symmetric stretching vibration of the V3 absorption spectrum. The stretching vibration (V1) peak observed at 960 cm −1 corresponded to the PO43− symmetrical stretching vibration, whereas the molecular vibrational (V2) peak at 875 cm−1 belonged to the CO32− bending vibration. At lower frequencies, we could observe the V4 vibration of 571 cm−1 and the sharp band of 601 cm−1 corresponding to the PO43− bending vibration.
The spectral band intensity of the PR2 was affected by the different milling times. Indeed, the prolongation of the grinding time increased the peak intensity of 1422 cm−1 of CO32− and a smaller change in the peak position of the V3 absorption peak appeared. This might have been a consequence of the difference in carbonate contents in the samples [26]. A change of the band of PO43− could not be observed, as the entry of CO32− had not significantly affected the apatite structure but had caused only fine structural changes. Due to the crystallinity of the PR2 raw materials sample being lower than the other samples, the particle size was lower. The specific surface area was higher, as were the substitution degrees of CO32− and PO43− after the mechanical-chemical treatment [27].

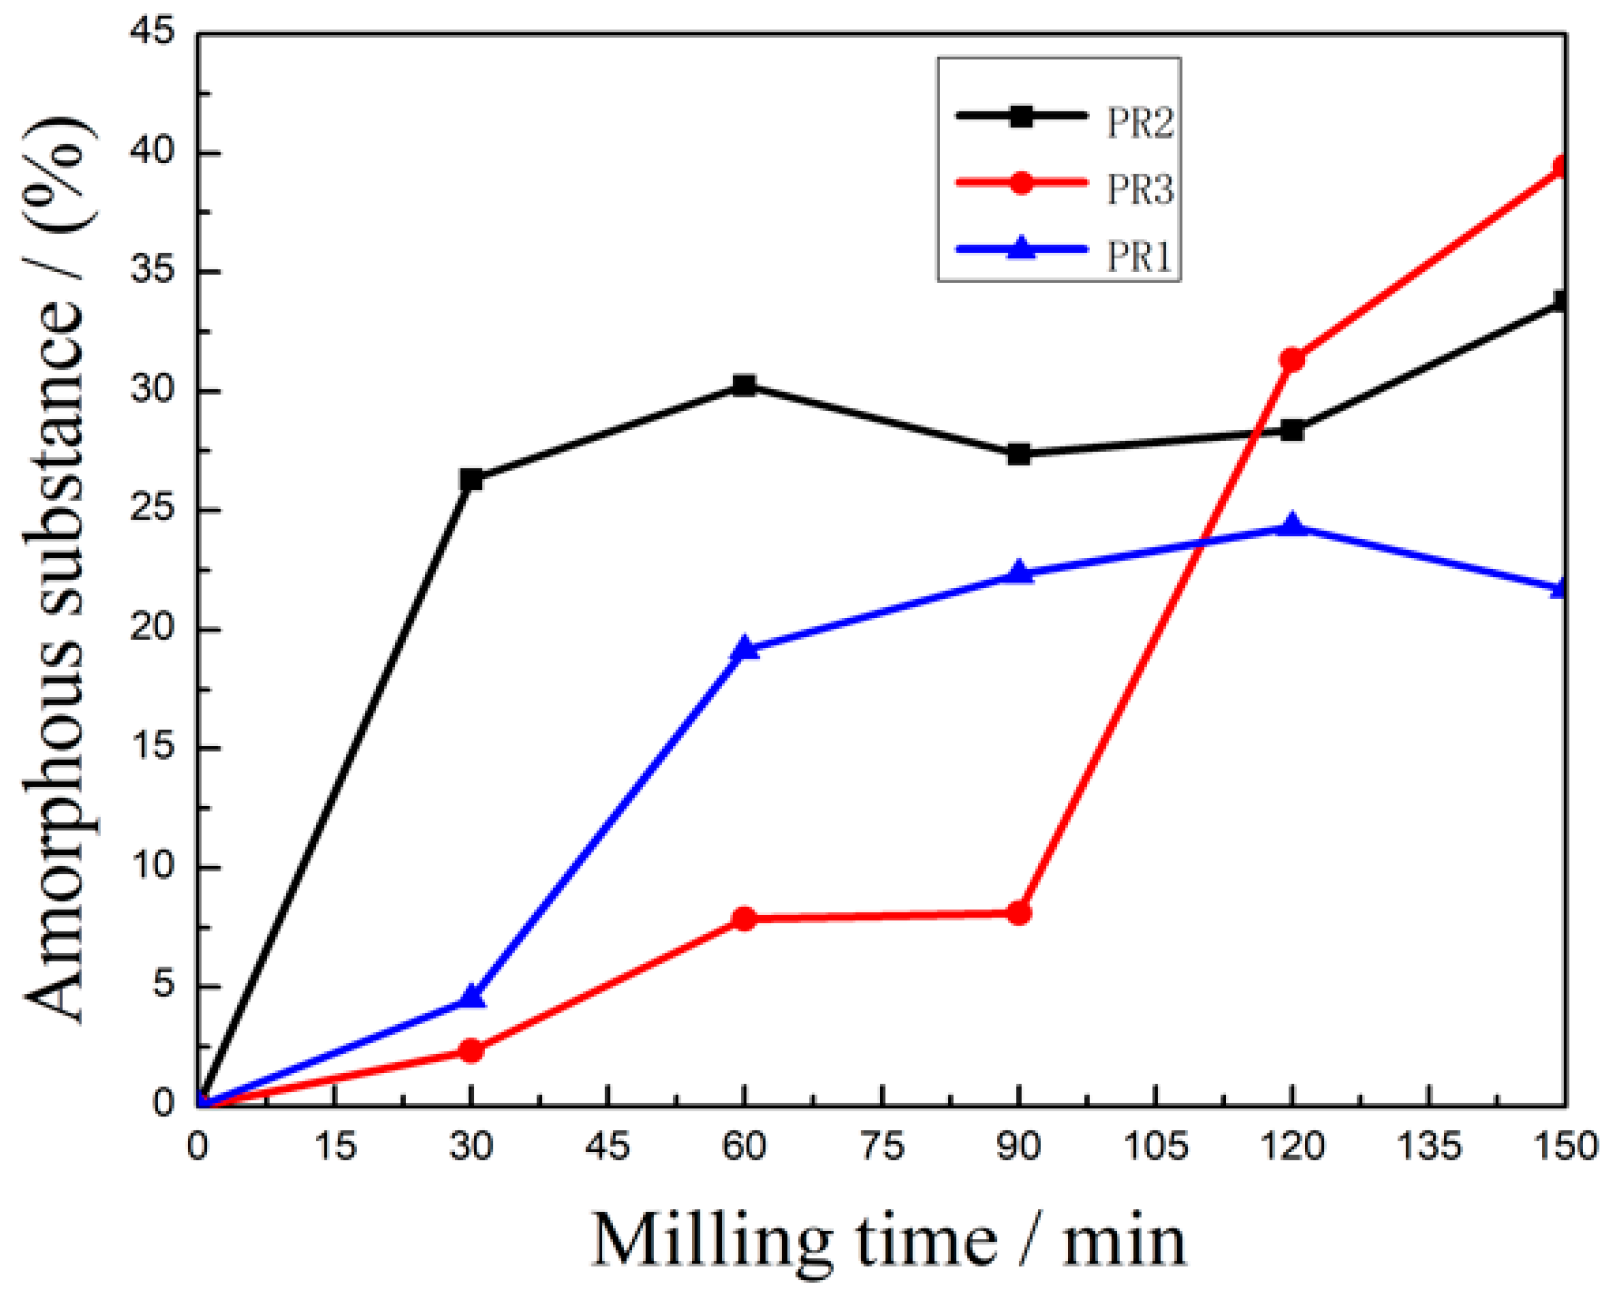
3.1.4. Effects of the Microcrystalline Processing on Amorphous Substance content of PR Powders

The microcrystallinity of particles focused on the importance of interactions forming chemical activity points. A crystal structure disorder led to the formation of dislocations and flows [23]. The changes in the XRD diffraction intensity could be used not only to characterize the degree of mineral crystallinity but also to estimate the relative amorphous content.
Based on the properties of the PR powder without milling, the mineral composition, the crystallinity of fluorapatite, calcium carbonate, quartz, and iron oxide together as 100%, and the content of amorphous material as 0%, the crystallization degrees (M) and the corresponding amorphous content (Rn) were calculated at different milling times using Equation (1).
Rn = 100 − M(%)
where M is the average percentage of the diffraction peak intensity of the mineral crystal plane relative to a crystallinity value of 100% [28]. Relative amorphous content of different types of milling products, as calculated through Equation (1), are shown in Figure 5. With the increase of milling time, the relative amorphous contents of all PR1, PR2, and PR3 increased until they reached a stable degree but with different clear patterns due to the various mineral compositions.
The relative amorphous content of the PR2 increased quickly in the first 30 min, which indicated that the milling had severely affected the PR2 structure during the 30 min. Over 30 min, the relative amorphous content stabilized at a value between 33.8% and 40.5%. Compared to the PR2, the amorphous contents of PR3 and PR1 exhibited slower increasing rates in the first 30 min, followed by rapid increases at milling times over 30 min. The PR1 reached stability between 21.7–22.3% after 60 min, whereas the PR3 powder stabilized at 31.3–39.4% at 120 min. The increase in milling time caused the formation of an amorphous layer on the particle surface. With the thickening of the amorphous layer, the transformation of crystalline particles into amorphous ones was hindered and rendered more difficult.

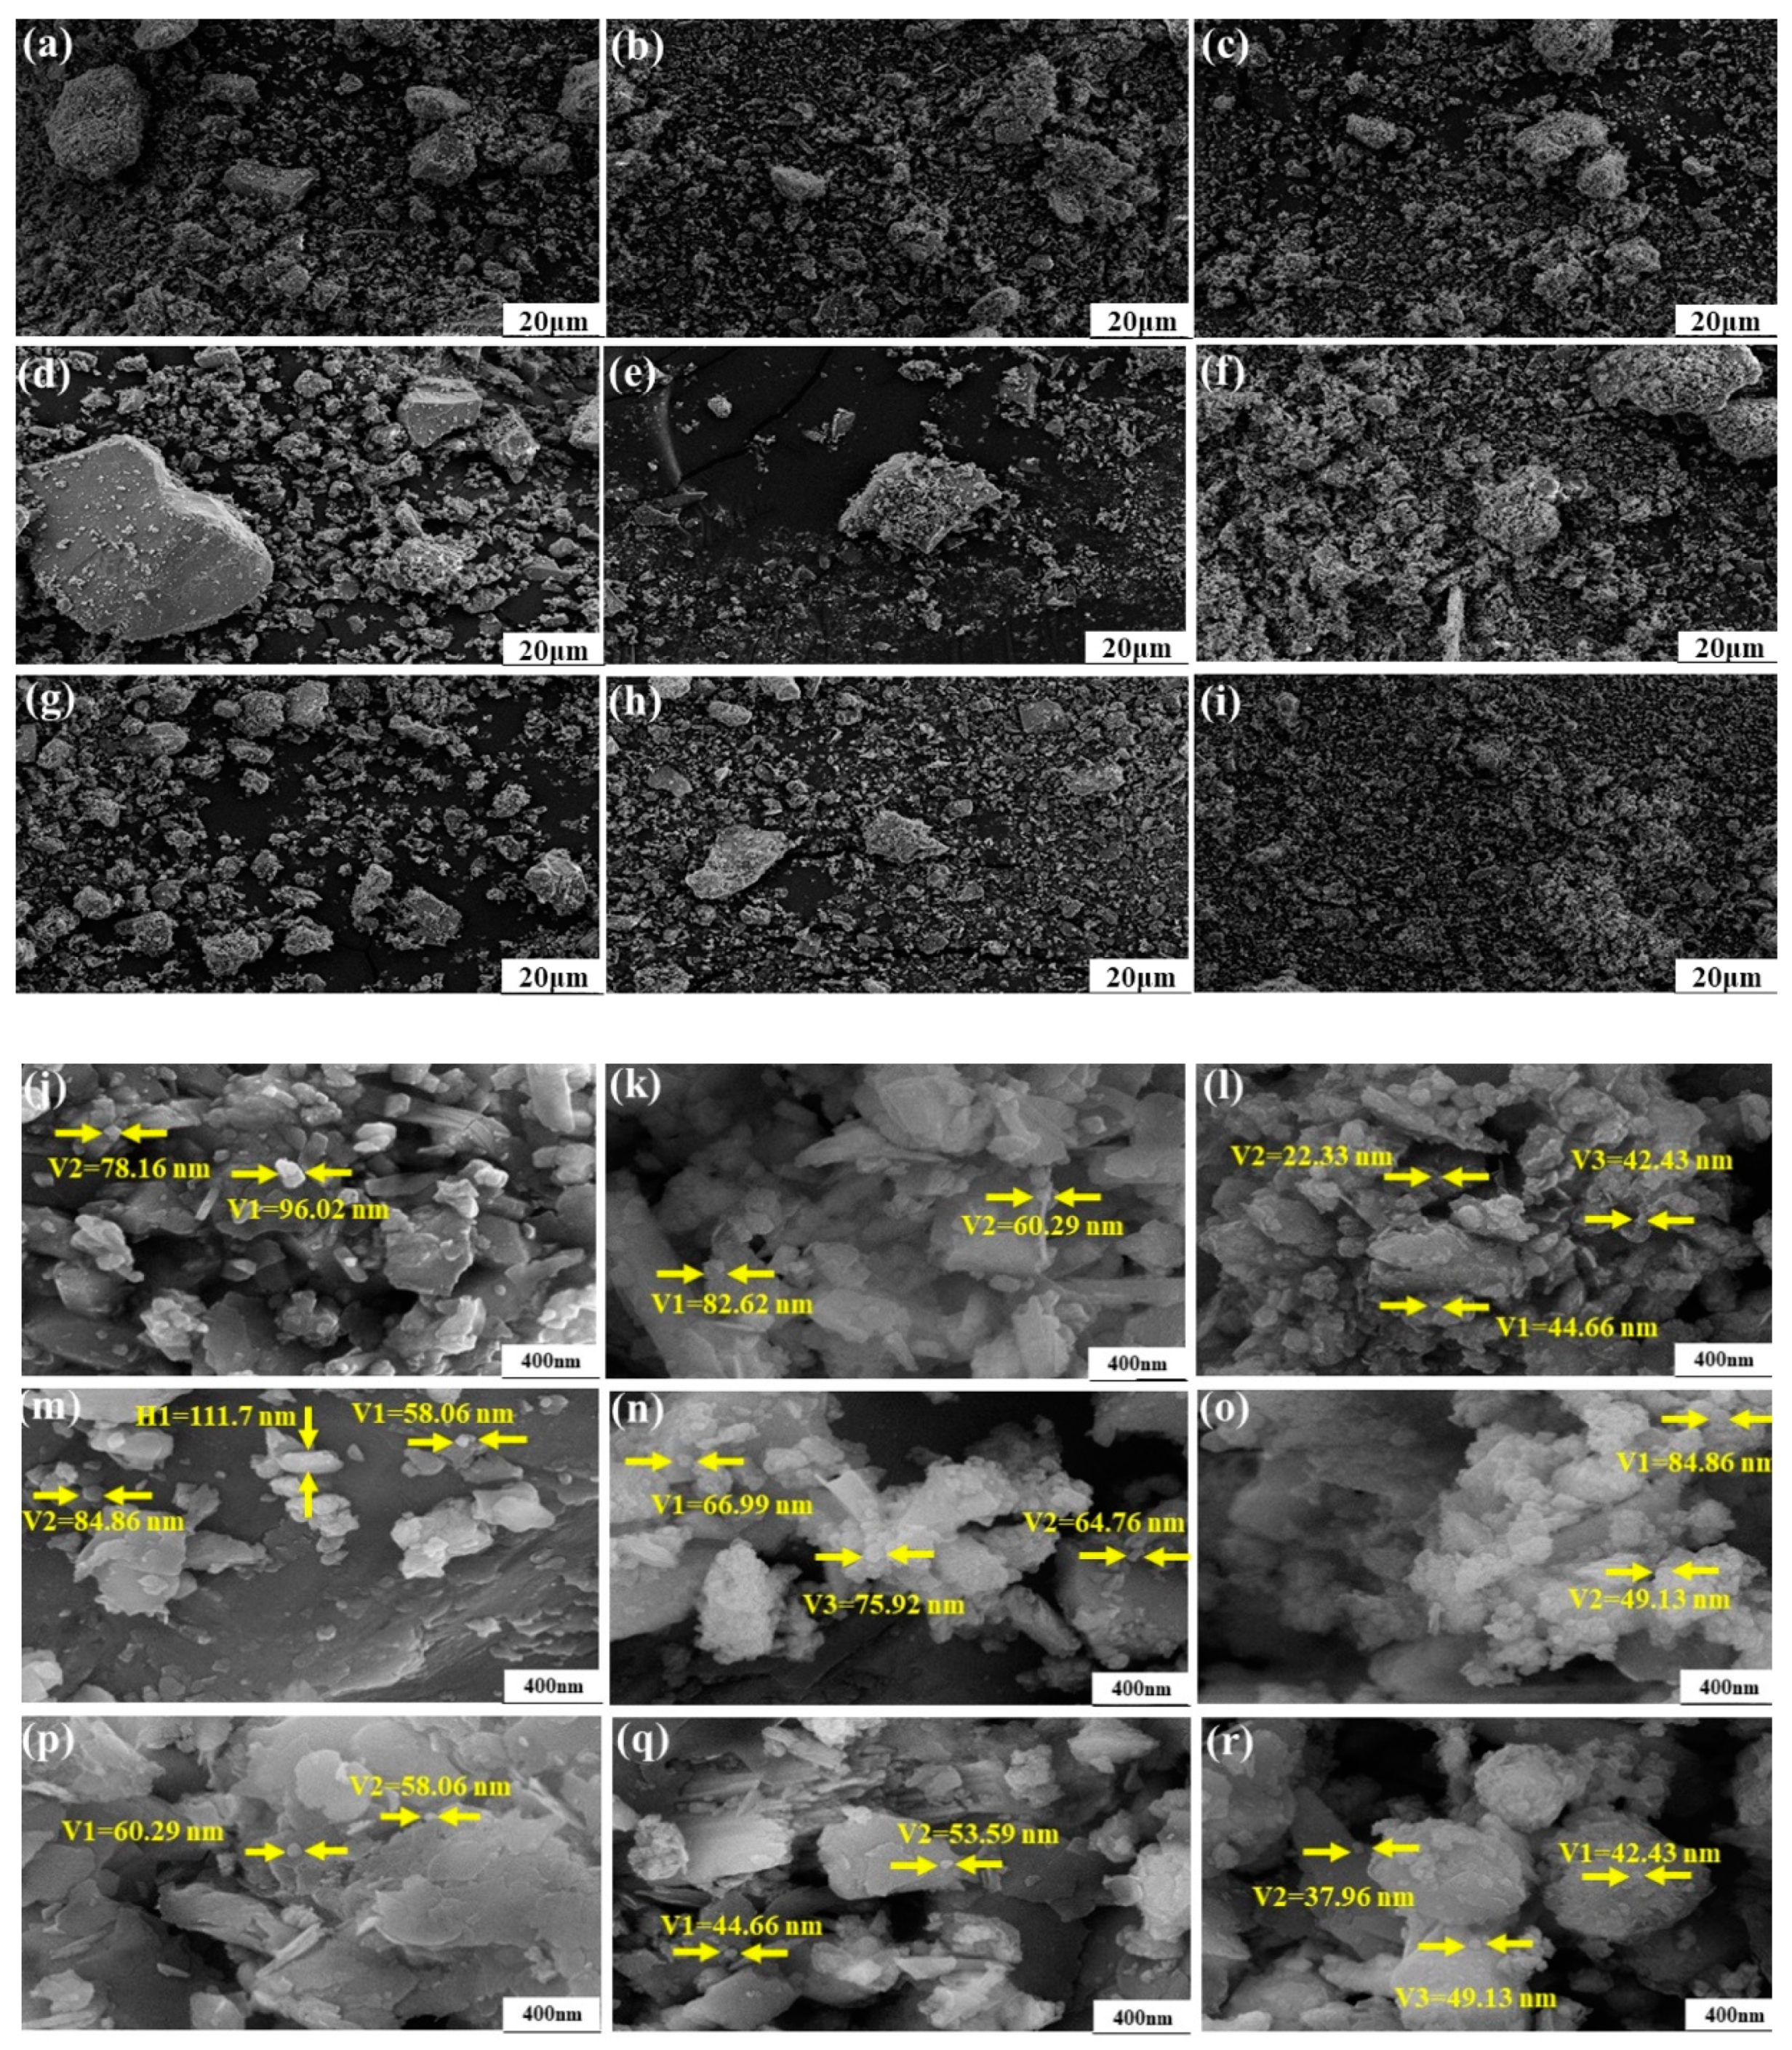
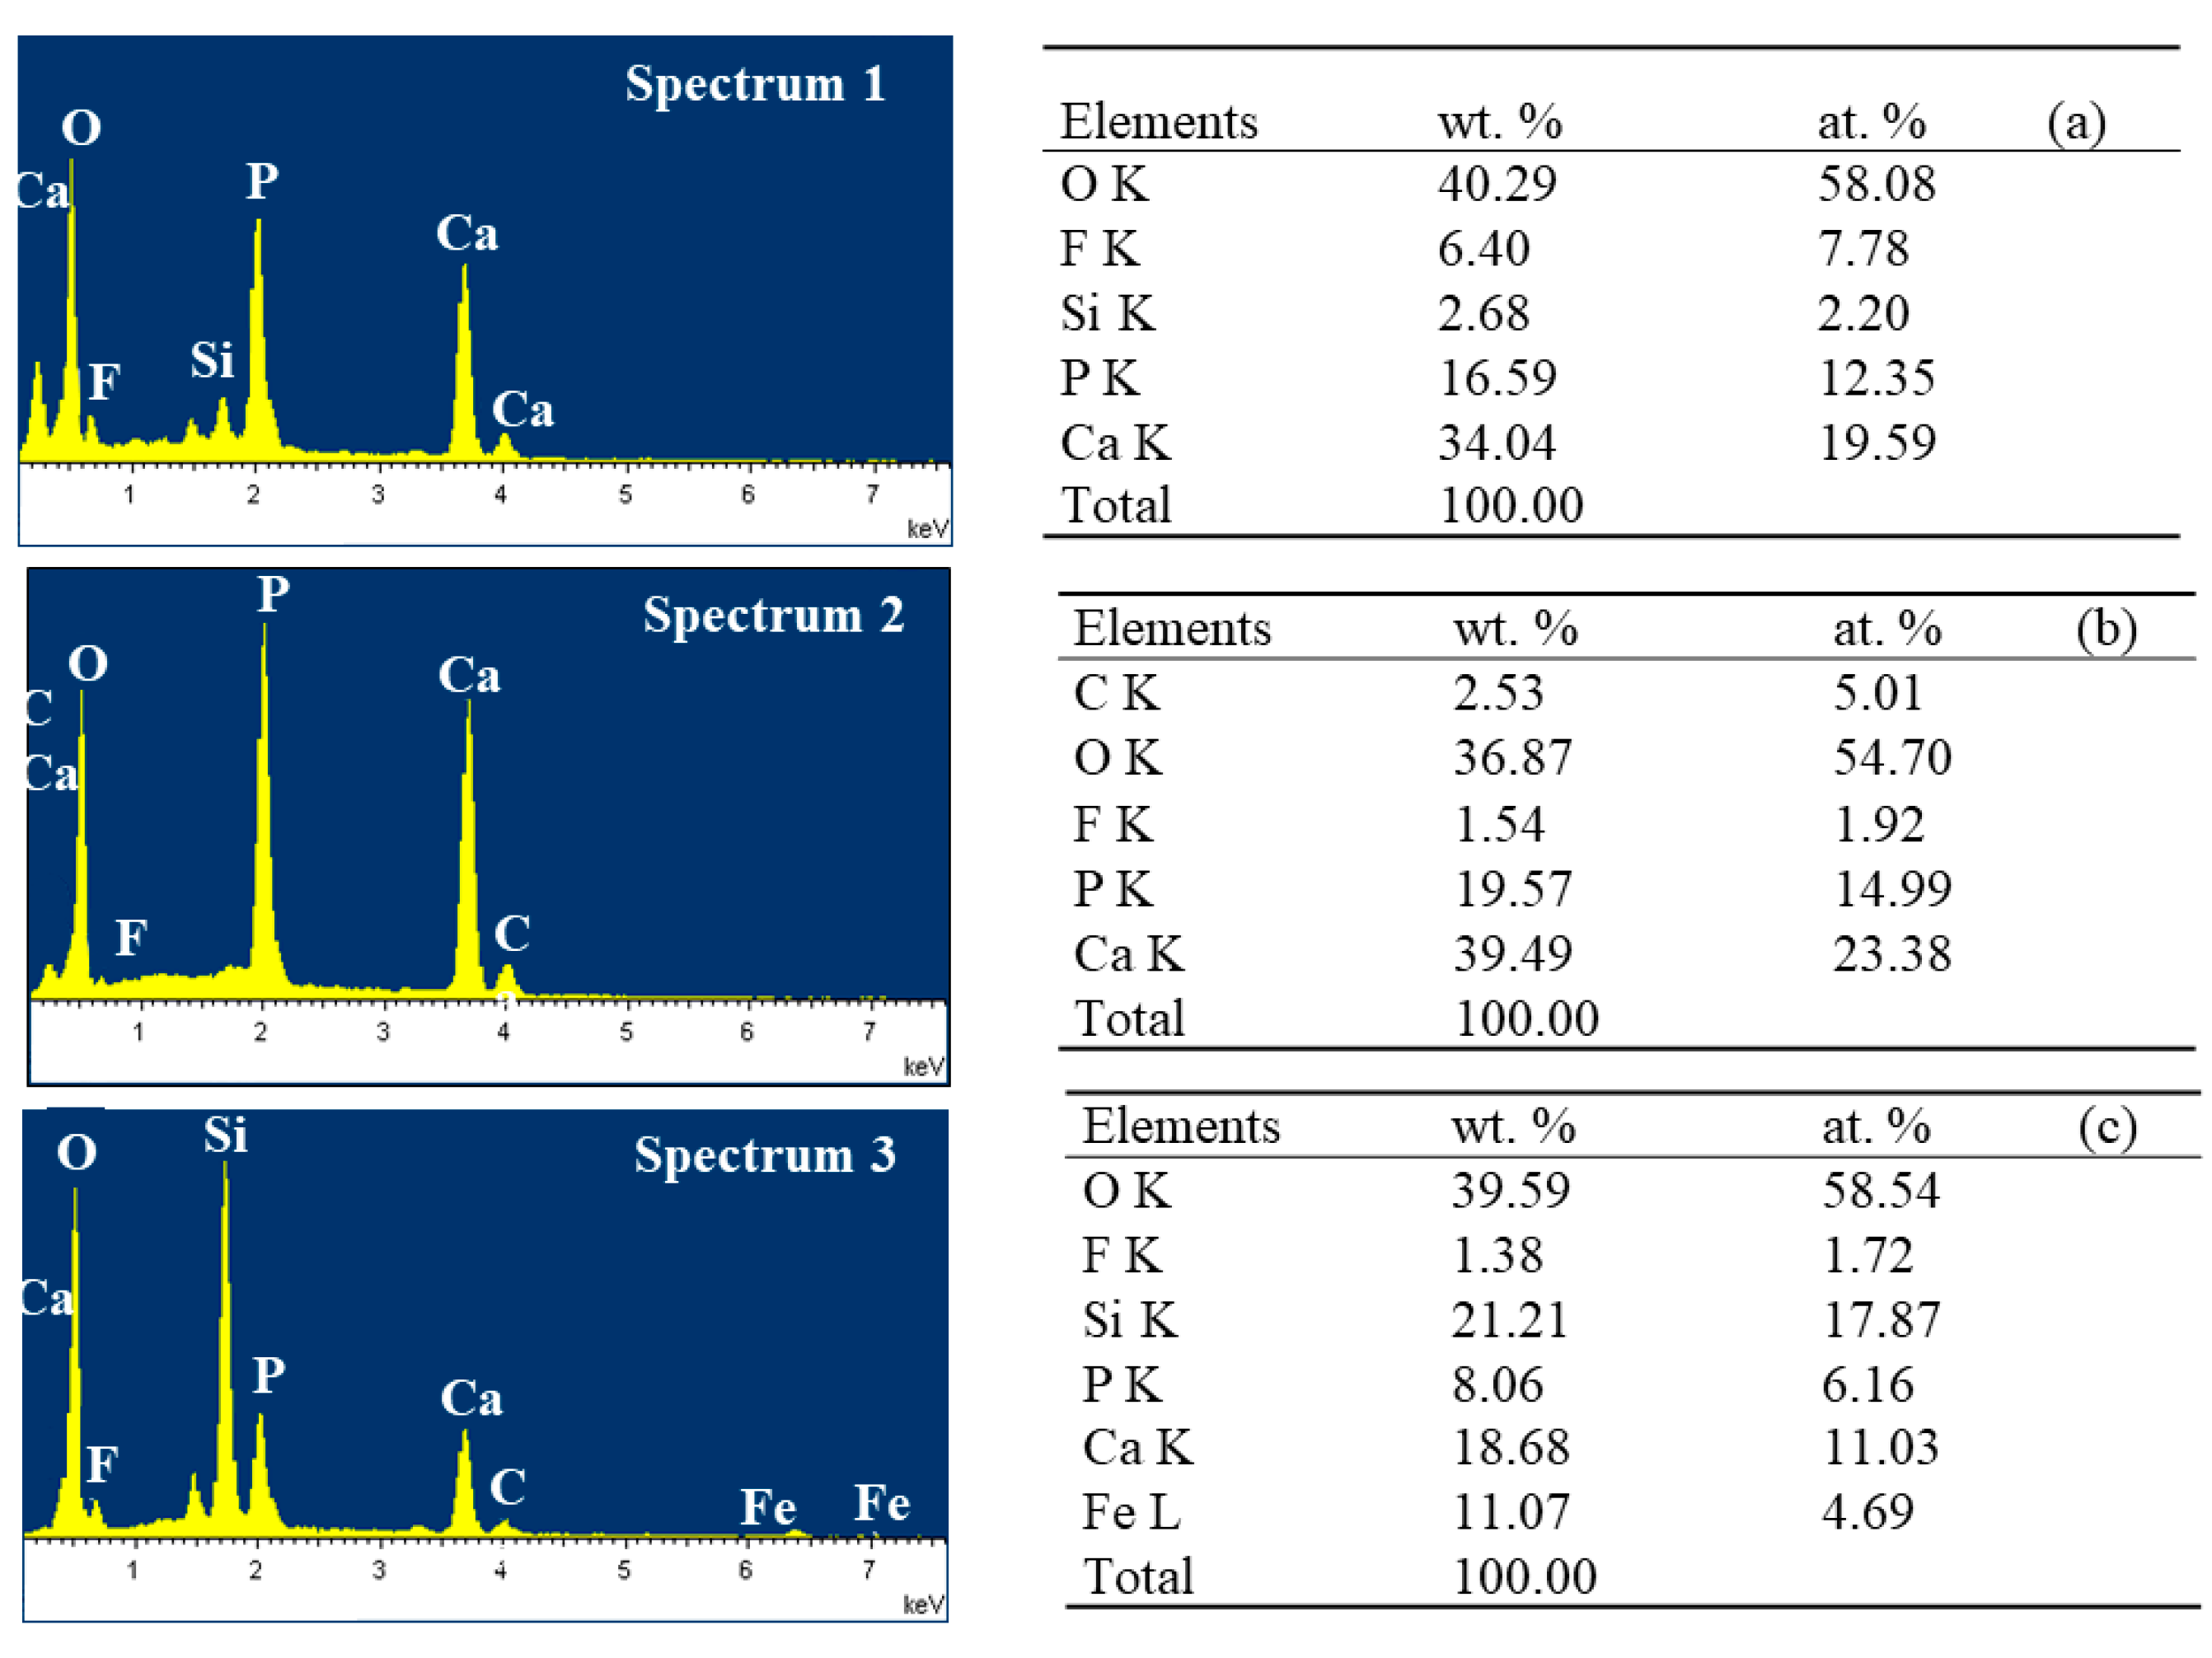
3.1.5. Effects of the Microcrystalline Processing on Granule Morphology of PR Powders

It is commonly known that milling can produce nanoparticles with extraordinary properties [29,30]. SEM measurements revealed the presence of agglomerates in the micrometer range containing nanoparticles of the raw material PR1, whereas PR2 exhibited a sheet structure (Figure 6). The particle size of raw materials follows this order: PR2 > PR1 > PR3. With the increase of milling time, the particle size and the dispersion of particles of three PR powders were reduced, the distribution of particle size had become uniform, and some flake particles had appeared.
After milling for 30 min, a large number of particles <100 nm appeared in PR2, while the distribution of particle size of PR3 was uniform due to the rough surface of the particles (small visible particles of 60–80 nm), good dispersibility, and no visible agglomeration.
After milling for 150 min, it could be observed that the content of nanoparticles had increased, the distribution of particle size had become narrow, and a higher degree of amorphization, lower dispersion, and sheet-like structure appeared in PR2. The fineness of the PR3 decreased while maintaining good dispersibility and a high content of synusia particles.
EDS shows the main elements of PR1and PR2 were O, P and Ca, the main elements of PR3 were O, Si, Ca, P, Fe (Figure 7).

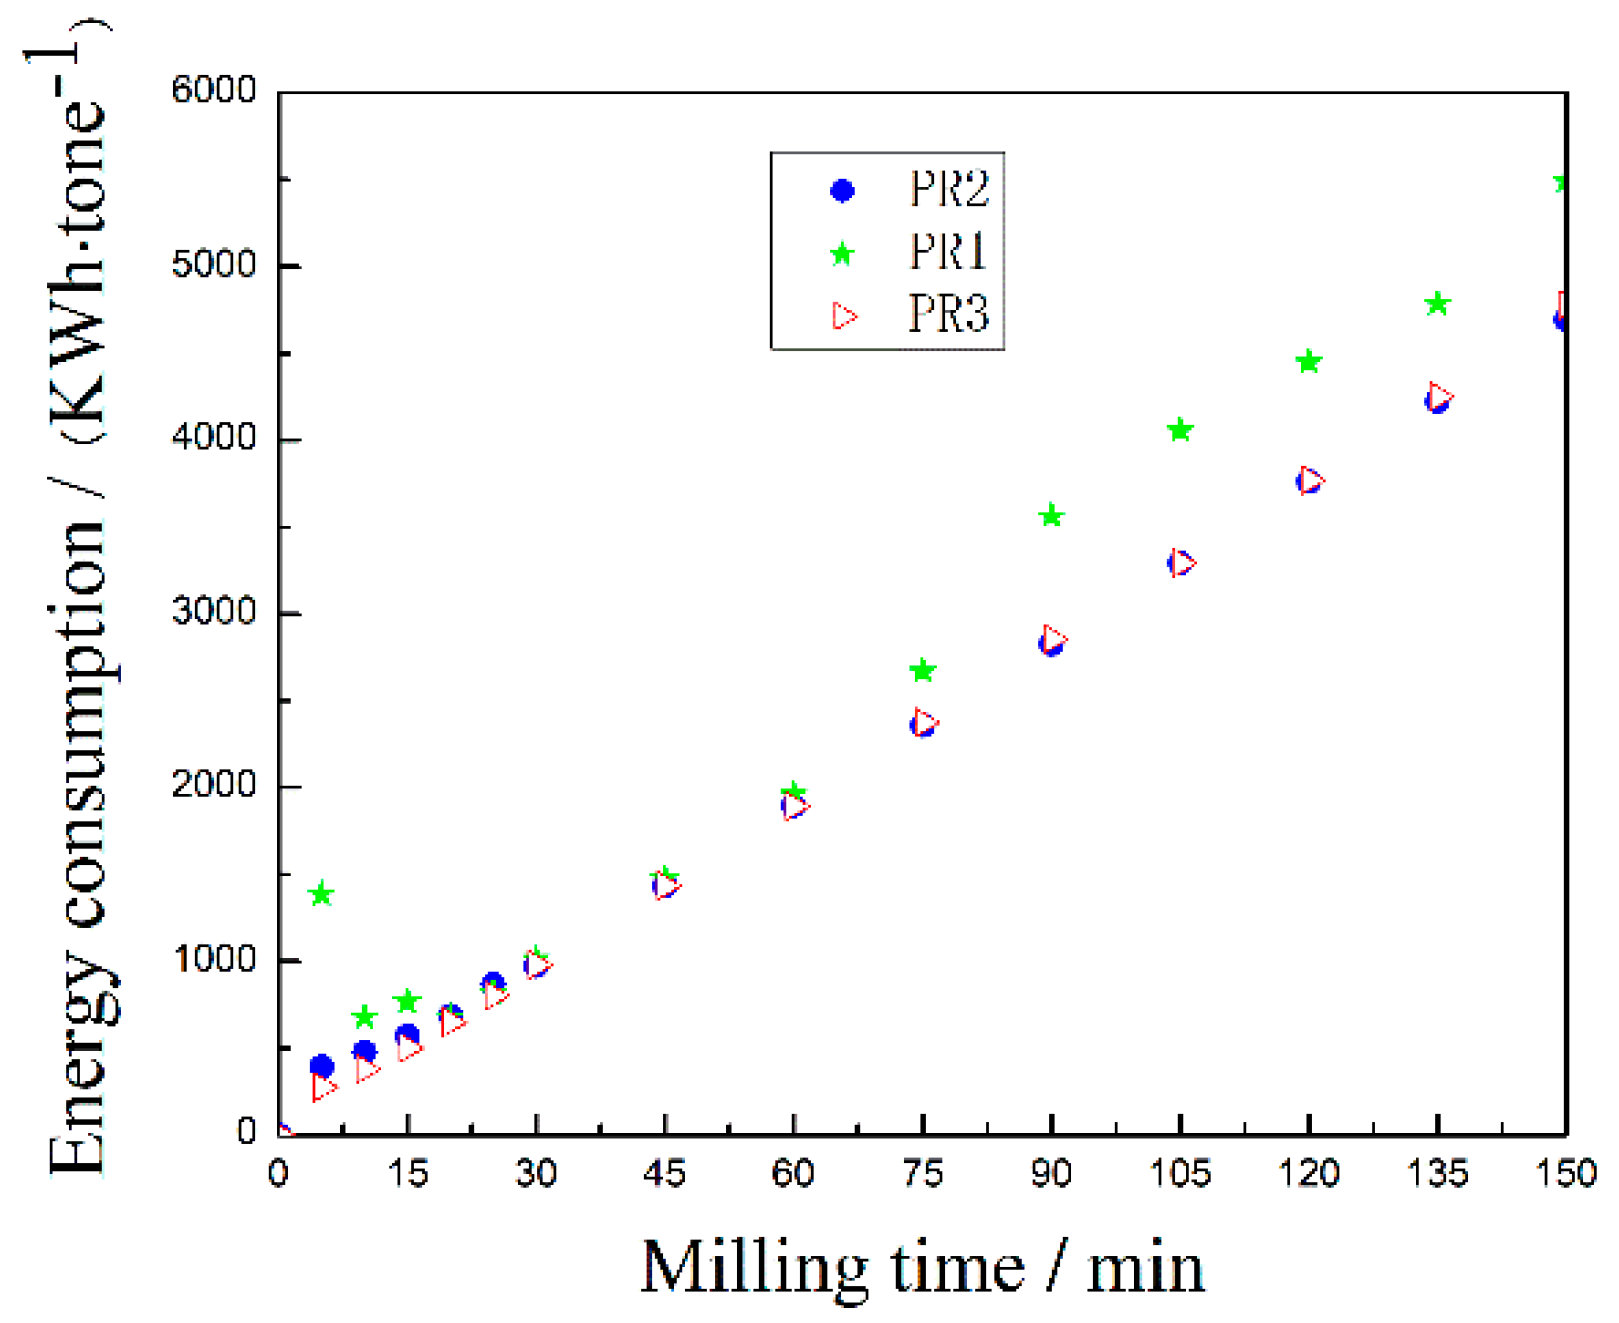
3.2. Analysis of the Energy Consumption of the Microcrystalline PR Powders

A longer microcrystalline milling time leads to a higher processing cost because of the higher energy consumption required [7]. Figure 8 reports the energy consumption of the three PR powders as a function of the milling time.
With the increase of milling time, the energy consumption of every ton of qualified PR powder followed an increasing trend (Figure 8). Furthermore, the processing cost of PR1 was higher than those of PR2 and PR3. The energy consumption values of each ton of qualified PR1, PR2, and PR3 were 5492.0 kWh, 4692.7 kWh, and 4775.0 kWh, respectively. The energy consumption of the PR1 was 17.0% and 15.0% higher than the PR2 and PR3, respectively, which suggested that the efficiency of the microcrystalline equipment was related to the presence of hard minerals as quartz.

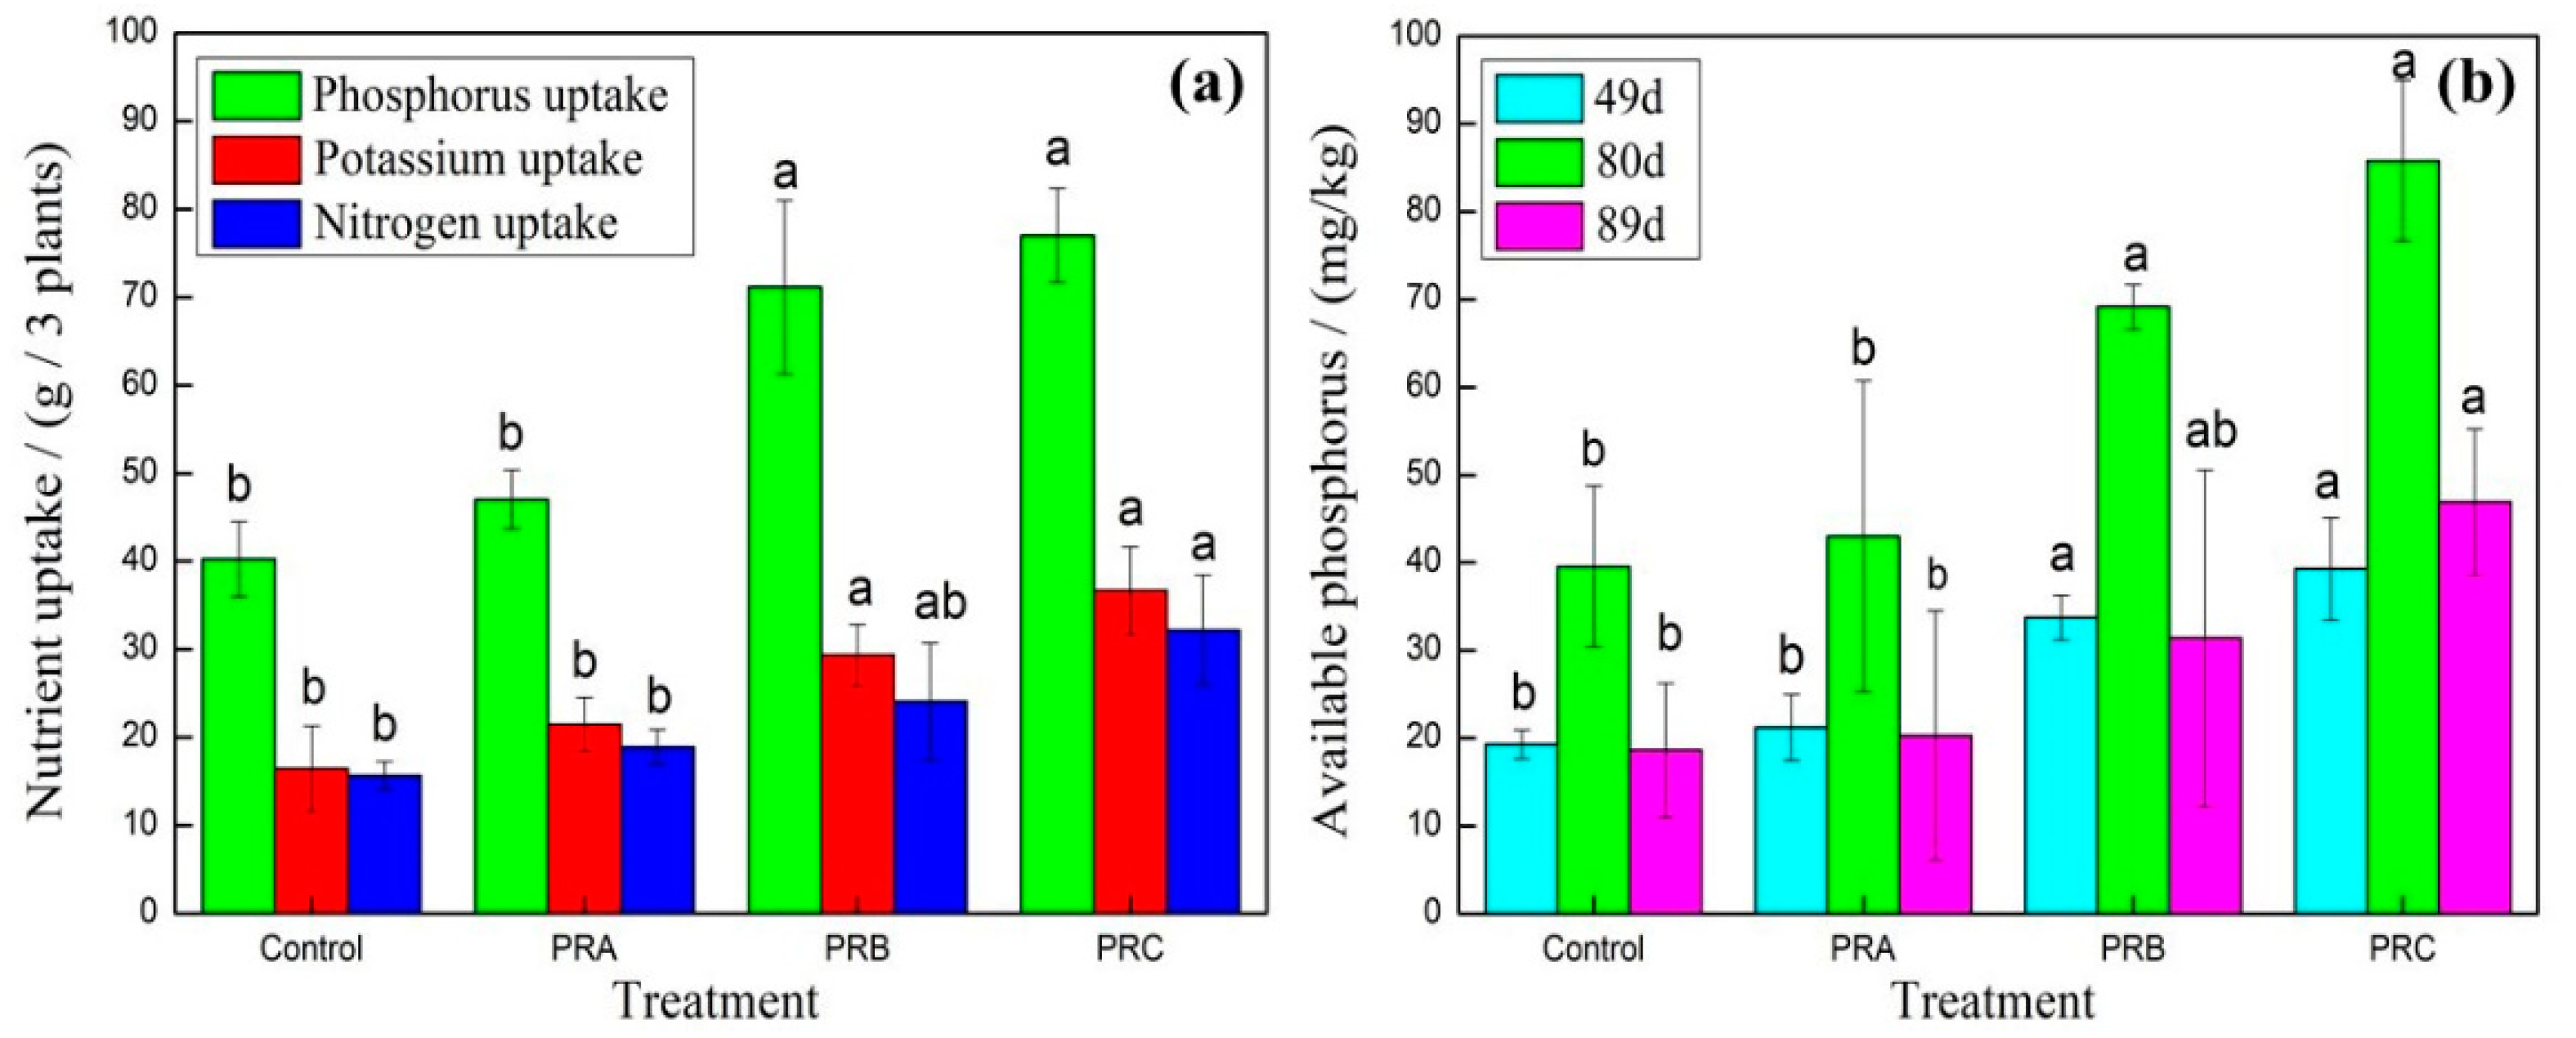
3.3. Evaluation of the Prepared Samples for Agricultural Application

Citric acid-soluble P was measured in PR1, PR2, and PR3 ground to varying degrees (Figure 9). With the increase in milling time, the citric acid-soluble P content of the PR1, PR2, and PR3 showed an overall increasing trend. The citric acid-soluble P content values of the PR1, PR2, and PR3 after 150 min were optimal, having reached 50.1%, 234.9%, and 103.9% more than the raw materials, respectively.
P, K, and N uptakes of carrot plants were carefully examined (Figure 10a). Significant differences in the nutrient uptakes by plants could be observed among PRA, PRB, PRC, and control samples. The maximum uptakes of nutrient P, K, and N by PRC were 77%, 36.7%, and 32.2%, respectively, corresponding to increases of 91.3%, 123.0%, and 105.2% of the control sample, respectively. In the case of PRB, P, K, and N were 71.2%, 29.4%, and 24.1%, which increased by 76.7%, 78.5%, and 53.6%, and 51.1%, 36.6%, and 27.7%, respectively, compared with controlling and ordinary PRA. The effect of microcrystalline PR powder in the accumulation of phosphorus in carrot plants was stronger than ordinary PR, making the PR powder a more efficient fertilizer.
Application of PR powders increased soil available P (Figure 10b). Three soils samples were collected at the 49th day, 80th day, and 89th day after seeding. Although the contents of available P in PRA were not significantly higher than the control, the available P of soils applied microcrystalline PR powders significantly higher than soil samples of the control and PRA. The data revealed that the microcrystalline process could increase the activation of PR in soil. Adding phosphorus bacteria (PRC) increased the soil available P, but there was no significant difference with PRB. All available P of the treatment at the 80th day was higher than those at the 49th day, but they declined at the 89th day, caused perhaps by the P release of PR affected by soil microbe. It was cold at the 89th day, and the activity of the soil microbe went down.
Substantial differences in the carrot and plant yields could be observed for the four samples (Table 2). The carrot and plant yields of PRC, PRB, and PRA were up to 232.3 g/three plants, 197.0 g/three plants, and 169.7 g/three plants, respectively. These values increased by 119.7%, 86.3%, and 60.5% compared with the controlling test. The maximum value of the dry weight of the plants was 9.9 g/three plants, which increased 64.4% when compared with the control sample. This showed that the addition of bacteria increased the organic phosphorus in the soil, promoting the absorption of nutrients by the carrot plants, which therefore led to the increase of plant growth and weight [31].

4. Conclusions

The milling process with high-strength energy input can affect the crystal structure of major minerals {([Ca5(PO4)3(F,OH)]), quartz (SiO2), carbonate (CaCO3), and ferric oxide (Fe2O3)}, such as the diffraction peak heights and diffraction areas of the crystal planes. With variation in milling times, the spectral band intensity is also affected by the milling. Compared to the raw materials, the (211) spectral band intensity of [Ca5(PO4)3(F,OH)] of microcrystalline PR1, PR2, and PR3 decreased by 22.6%, 10.6%, and 41.4% at 150 min, respectively. The relative amorphous substance contents of the three PR powders increased in different patterns by the milling process. The number of nanoparticles on the PR powder surfaces increased with milling times, and the higher degree of amorphization and the lower dispersion and sheet-like structure appeared in PR2.
Milling operation with high-strength energy input can increase the solubility of phosphate. With the increase in milling time, the citric acid-soluble P contents of the three powders showed an overall increasing trend. Using microcrystalline phosphate fertilizers can improve the uptake of nutrition of plants, thus it increased carrot yield.

Author Contributions

X.-M.Z., Z.-Q.H., Y.-F.Y., X.-Y.H. conceived and designed the experiments; X.-M.Z. performed the experiments; X.-M.Z., C.H., Y.L., Y.A., and L.-F.L. analyzed the data; G.-S.G. and Z.-H.H. contributed reagents/materials/analysis tools; X.-M.Z. wrote the paper. G.-S.G., Z.-H.H., S.-N.Y., and X.-Y.H. provided project support.

Funding

This work was financially supported that the National Natural Science Fund Project (Grant No.51374136 and 51472222), “National Key R&D Program of China (Grant No. 2017YFB0310801, and 2018YFC1901503), the Fundamental Research Funds for the Central Universities for Financial Support (Grant No. 2652017362), the High-Level Talents Cross-Training in Beijing Colleges and Universities “Practical Training Plan” Graduation Design (Entrepreneurial) Support Plan (2017), the Development and Construction Foundation Program of Shandong Peninsula (Zibo) Self-dependent Innovation Demonstration Area (2017), and National Science & Technology Pillar Program during the Twelfth Five-year Plan Period (2012BAD47B02).

Conflicts of Interest

The authors declare no conflict of interest.

References

  1. Lin, S.; Litaker, R.W.; Sunda, W.G. Phosphorus physiological ecology and molecular mechanisms in marine phytoplankton. J. Phycol. 2016, 52, 10–36. [Google Scholar] [CrossRef] [PubMed]
  2. Kauwenbergh, S.V. World Phosphate Rock Reserves and Resources; The International Fertilizer Development Center: Muscle Shoals, AL, USA, 2010. [Google Scholar]
  3. Bolan, N.S.; Hedley, M.J.; Loganathan, P. Preparation, forms and properties of controlled-release phosphate fertilizers. Fertil. Res. 1993, 35, 13–24. [Google Scholar] [CrossRef]
  4. Chien, S.H.; Prochnow, L.I.; Mikkelsen, R. Agronomic use of phosphate rock for direct application. Better Crop. 2010, 94, 21–23. [Google Scholar]
  5. Han, X.L. The infrared absorption spectra of carbon-fluorapatite. Sci. Geol. Sin. 1980, 2, 15. [Google Scholar]
  6. Rajan, S.S.S.; Watkinson, J.H.; Sinclair, A.G. Phosphate rocks for direct application to soils. Adv. Agron. 1996, 57, 77–159. [Google Scholar]
  7. Lv, L.F.; Li, X.Y.; Zhang, H.W.; Dou, X.X.; Gai, G.S. Mechano-chemical effects of phosphorite on superfine grinding in ball-stirring mill in wet. Acta Mineral. Sin. 2016, 36, 382–386. [Google Scholar]
  8. He, Z.Q.; Liu, C.S.; Gai, G.S.; Yang, Y.F.; Dong, Y.J.; Zhao, F.T. Effect on phosphorus availability of rock phosphate rock powder by grinding it superfine. J. Soil Water Conserv. 2009, 23, 210–212. [Google Scholar]
  9. Lv, L.F.; Dou, X.X.; Zhang, H.W.; Xie, X.Y.; Gai, G.S. Potassium release characteristics of microcrystalline potassium mineral and its effects on growth of grain amaranth. Acta Prataculturae Sin. 2016, 25, 126–133. [Google Scholar]
  10. Ying, Y.F.; Chen, M.L.; Gao, H. Effect of dry and wet milling on mechanochemically activated phosphorite. J. Dalian Jiaotong Univ. 2015, 36, 80–83. [Google Scholar]
  11. Balaz, P.; Pourghahramani, P.; Dutkova, E.; Turianicova, E.; Kova, J.; Satka, A. Mechanochemistry in preparation of nanocrystalline semiconductors. Phys. Status Solidi C 2008, 5, 3756–3758. [Google Scholar] [CrossRef]
  12. Huang, L.; Mao, X.Y.; Chen, X.; Sun, X.S.; Wang, J.; Liao, Z.W. Phosphorus availability and fertilizer efficiency of rock phosphate as affected by ultrafine activation. Acta Pedol. Sin. 2013, 50, 769–777. [Google Scholar]
  13. Lv, L.F.; Gai, G.S.; Li, X.H.; Yang, Y.F.; Li, M.Q.; He, Z.Q.; Liu, C.S. Effects of microcrystalline grinding on potassium release in K-feldspar rock. J. Plant Nutr. Fertil. 2012, 18, 1428–1433. [Google Scholar]
  14. Palaniandy, S.; Azizli, K.A.M.; Hong, E.X.; Hashim, S.F.S.; Hussin, H. Custom made micronized silica for paint industry via fine grinding process. Adv. Technol. Mater. Mater. Process. J. 2006, 8, 109–116. [Google Scholar]
  15. Liu, J.X. Analysis of domestic phosphate rock resources their exploitation and utilization. Chem. Fertil. Ind. 2009, 36, 27–31. [Google Scholar]
  16. Zhang, Q.W.; Saito, F. A review on mechanochemical syntheses of functional materials. Adv. Powder Technol. 2012, 23, 523–531. [Google Scholar] [CrossRef]
  17. Chien, S.H.; Prochnow, L.I.; Cantarella, H. Recent developments of fertilizer production and use to improve nutrient efficiency and minimize environmental impacts. Adv. Agron. 2009, 102, 267–322. [Google Scholar]
  18. Khan, A.A.; Jilani, G.; Akhtar, M.S.; Naqvi, S.M.S.; Rasheed, M. Phosphorus solubilizing bacteria: Occurrence, mechanisms and their role in crop production. J. Agric. Biol. Sci. 2009, 1, 48–58. [Google Scholar]
  19. Bao, S.D. Soil Agro-chemistrical Analysis, 3rd ed.; China Agriculture Press: Beijing, China, 2007; pp. 268–270, 389–391. [Google Scholar]
  20. Lu, W.D. Statistical Analysis of SPSS for Windows; Electronic Industry Publishing Co.: Beijing, China, 2004; pp. 50–55. [Google Scholar]
  21. Zeng, G.C. Concise Light Mineralogy, 2nd ed.; China University of Geosciences Press: Beijing, China, 1989; p. 104. [Google Scholar]
  22. Shi, H.B.; Wang, S.L.; Liang, Y.Z.; Yao, H. Process mineralogy of mid-low-grade silicate-calcareous phosphate rocks in Yunnan province. J. Wuhan Inst. Technol. 2008, 30, 5–8. [Google Scholar]
  23. Li, L. Metallic Ore Dressing Abroad; BGRIMM Technology Group: Beijing, China, 1991; Volume 28, pp. 36–42. [Google Scholar]
  24. Lv, L.F. Effects of Microcrystalline Grinding on Potassium Release in Silicate Potassium Rocks and Its Application; Shandong Agricultural University: Taian, China, 2014. [Google Scholar]
  25. Thompson, G.E.; Wood, G.C. Anodic films on aluminum. Treatise on Materials Science and Technology. In Corrosion: Aqueous Processed and Passive Films; Elsevier: Amsterdam, The Netherlands, 1983; Volume 23, pp. 205–329. [Google Scholar]
  26. Chow, C.Y. Physico-chemical properties of rock phosphate in relation to the phosphorus availability to plant and its classification. Acta Pedol. Sin. 1966, 14, 23–30. [Google Scholar]
  27. Zhao, F.T. Study on the Effect of Ultra-Fine Combined Treatment Phosphate Rock Powder; Shandong Agricultural University: Taian, China, 2009. [Google Scholar]
  28. Ding, H.; Xin, F. Study on mechano-chemical modification of mineral pigment and filler. Compr. Util. Miner. Resour. 2000, 6, 26–31. [Google Scholar]
  29. Balaz, P.; Achimovicova, M.; Balaz, M.; Billik, P.; Cherkezova-Zheleva, Z.; Criado, J.M.; Delogu, F.; Dutkova, E.; Gaffet, E.; Gotor, F.J.; et al. Hallmarks of mechanochemistry: From nanoparticles to technology. Chem. Soc. Rev. 2013, 42, 7571–7637. [Google Scholar] [CrossRef] [PubMed]
  30. Balaz, M.; Dutkova, E.; Bujnakova, Z.; Tothova, E.; Kostova, N.G.; Karakirova, Y.; Briancin, J.; Kanuchova, M. Mechanochemistry of copper sulfides: Characterization, surface oxidation and photocatalytic activity. J. Alloys Compd. 2018, 746, 576–582. [Google Scholar] [CrossRef]
  31. Zhu, P.M.; Yang, X.X.; Xu, Y.C.; Ouyang, H.; Shen, Q.R. High effective phosphate-solubilizing bacteria: Their isolation and promoting effect on corn seedling growth. Chin. J. Appl. Ecol. 2007, 18, 107–112. [Google Scholar]
Figure 1. XRD patterns of PR at different milling times: PR1 (a), PR2 (c,d), and PR3 (b).
Minerals 09 00211 g001
Figure 2. Projection of apatite molecular structure perpendicular to c axis (purple, red, green, blue, pink spheres refer to F, O, P, Ca1, Ca2, respectively).
Minerals 09 00211 g002
Figure 3. Relative peak areas (a) and half-widths (b) of three PR powders at different milling times.
Minerals 09 00211 g003
Figure 4. IR spectra of PR2 at different milling times.
Minerals 09 00211 g004
Figure 5. Amorphous substance of three PR powders at different milling times.
Minerals 09 00211 g005
Figure 6. SEM images of three PR powder at different milling times: PR1 raw material (a and j), microcrystalline PR1 at 30 min (b and k) and 150 min (c and l); PR2 raw material (d and m), microcrystalline PR2 at 30 min (e and n) and 150 min (f and o); PR3 raw material (g and p), microcrystalline PR3 at 30 min (h and q) and 150 min (i and r).
Minerals 09 00211 g006
Figure 7. Energy dispersive X-ray spectroscopy (EDS) images of three PR powders and their elemental compositions.
Minerals 09 00211 g007
Figure 8. Energy consumption of three PR powders at different milling times.
Minerals 09 00211 g008
Figure 9. Changes of the citric acid-soluble P content with milling time.
Minerals 09 00211 g009
Figure 10. The P, K, and N uptake content (a) and available P in soils (b) of samples that underwent different treatments [reported values are statistically significant (P < 0.05)].
Minerals 09 00211 g010
Table 1. Chemical composition of the selected phosphate rock (PR) powders.
TreatmentP2O5
/%
CaO
/%
MgO
/%
SiO2
/%
Fe2O3
/%
Al2O3
/%
K2O
/%
Na2O
/%
F
/%
CO2
/%
MnO
/%
PR123.633.00.434.10.92.00.30.22.71.20.3
PR237.250.60.72.41.51.0 4.9
PR325.133.81.919.83.0 2.72.9
Table 2. The yields and biomass of samples that underwent different treatments [reported values are statistically significant (P < 0.05)].
TreatmentTotal Yields
g/3 Plants *
Carrots Fresh Weight
g/3 Plants *
Leaves Dry Weight
g/3 Plants *
Control105.7 d ± 5.885.9 d ± 5.16.0 c ± 0.7
PRA169.7 c ± 4.9143.0 c ± 3.86.9 b,c ± 0.8
PRB197.0 b ± 5.4156.8 b ± 6.08.1b ± 0.4
PRC232.3 a ± 11.8180.0 a ± 9.59.9a ± 0.6
* Values are reported as x ± SD, where x is the average value and SD is its standard deviation. The rest of the data in the table is similar, the same below. Different letters in a column indicate statistically significant differences among treatments at the 0.05 level. PRA = ordinary PR powder, PRB = microcrystalline PR powder, PRC = phosphorus bacteria PR powder.

