Article

A Metastable Fo-III Wedge in Cold Slabs Subducted to the Lower Part of the Mantle Transition Zone: A Hypothesis Based on First-Principles Simulations

1
The Key Laboratory of Orogenic Belts and Crustal Evolution, Ministry of Education of China, Beijing 100871, China
2
School of Earth and Space Sciences, Peking University, Beijing 100871, China
3
State Key Laboratory of Ore Deposit Geochemistry, Institute of Geochemistry, Chinese Academy of Sciences, Guiyang 550002, China
*
Author to whom correspondence should be addressed.
Minerals 2019, 9(3), 186; https://doi.org/10.3390/min9030186
Submission received: 3 February 2019 / Revised: 26 February 2019 / Accepted: 12 March 2019 / Published: 17 March 2019

Abstract

:
The metastable olivine (Ol) wedge hypothesis assumes that Ol may exist as a metastable phase at the P conditions of the mantle transition zone (MTZ) and even deeper regions due to inhibition of the phase transitions from Ol to wadsleyite and ringwoodite caused by low T in the cold subducting slabs. It is commonly invoked to account for the stagnation of the descending slabs, deep focus earthquakes and other geophysical observations. In the last few years, several new structures with the forsterite (Fo) composition, namely Fo-II, Fo-III and Fo-IV, were either experimentally observed or theoretically predicted at very low T conditions. They may have important impacts on the metastable Ol wedge hypothesis. By performing first-principles calculations, we have systematically examined their crystallographic characteristics, elastic properties and dynamic stabilities from 0 to 100 GPa, and identified the Fo-III phase as the most likely metastable phase to occur in the cold slabs subducted to the depths equivalent to the lower part of the MTZ (below the ~600 km depth) and even the lower mantle. As disclosed by our theoretical simulations, the Fo-III phase is a post-spinel phase (space group Cmc21), has all cations in sixfold coordination at P < ~60 GPa, and shows dynamic stability for the entire P range from 0 to 100 GPa. Further, our static enthalpy calculations have suggested that the Fo-III phase may directly form from the Fo material at ~22 GPa (0 K), and our high-T phase relation calculations have located the Fo/Fo-III phase boundary at ~23.75 GPa (room T) with an averaged Clapeyron slope of ~−1.1 MPa/K for the T interval from 300 to 1800 K. All these calculated phase transition pressures are likely overestimated by ~3 GPa because of the GGA method used in this study. The discrepancy between our predicted phase transition P and the experimental observation (~58 GPa at 300 K) can be explained by slow reaction rate and short experimental durations. Taking into account the P-T conditions in the cold downgoing slabs, we therefore propose that the Fo-III phase, rather than the Ol, highly possibly occurs as the metastable phase in the cold slabs subducted to the P conditions of the lower part of the MTZ (below the ~600 km depth) and even the lower mantle. In addition, our calculation has showed that the Fo-III phase has higher bulk seismic velocity, and thus may make important contributions to the high seismic speeds observed in the cold slabs stagnated near the upper mantle-lower mantle boundary. Future seismic studies may discriminate the effects of the Fo-III phase and the low T. Surprisingly, the Fo-III phase will speed up, rather than slow down, the subducting process of the cold slabs, if it metastably forms from the Ol. In general, the Fo-III phase has a higher density than the warm MTZ, but has a lower density than the lower mantle, as suggested by our calculations.

1. Introduction

The metastable olivine (Ol) wedge hypothesis assumes that the phase transition of Ol to its thermodynamically stable high-P polymorphs, wadsleyite (Wds; stable at ~14–17.5 GPa or 410–520 km) and ringwoodite (Rwd; stable at ~17.5–24 GPa or 520–660 km), would be kinetically inhibited due to low T (<1000 K) in the inner parts of the subducting oceanic slabs [1,2,3,4,5,6,7,8,9,10]. As a result, Ol might metastably exist at the depths of the mantle transition zone (MTZ) and even around the 660 km seismic velocity discontinuity [11,12]. This hypothesis has been widely used to explain a large range of seismic observations such as the deep focus earthquakes in the MTZ [1,3,6], the stagnated slabs in the MTZ [8,13], the double seismic layers discovered in the Tonga [14] and Izu-Bonin [15] subduction zones, the seismic low-velocity zones in the Pacific, Mariana, Kuril and southwest Japan slabs [9,11,16,17], the seismic anisotropies in the Tonga-Fiji and Northeast Asia regions [18,19], and so on.
Many techniques were used to investigate the possible existence of such metastable Ol in the MTZ, including seismological method [2,9,10,11,16,20,21], numerical modeling [4,5,6,7,8,15,21,22,23,24], and experimental investigation [3,12,17,20,25]. The kinetics of the Ol/Wds and Ol/Rwd phase transitions were shown to be largely controlled by T, but complicated by some other properties such as P, grain size, and shear stress [22,26,27,28,29]. In addition, some experimental studies about the kinetics of the Ol/Wds and Ol/Rwd phase transitions have showed that the transition rates are sensitive to H2O contents [20,30,31,32,33]. It has been found that to ensure the existence of metastable Ol in the MTZ, the slabs must be nearly dry or have very limited amounts of H2O [17,33,34]. Nevertheless, anomalous seismic velocity structures in many subducted slabs, particularly those in the western Pacific regions, likely support the existence of metastable Ol wedges down to the depths up to ~630 km [2,11,16,17].
However, some new high-P polymorphs, compositionally identical to but structurally different from Ol, have been discovered in the last decade or so, which thus introduces new variables to the metastable Ol wedge hypothesis. These new metastable high-P polymorphs were discovered in meteorites [35,36], in in-situ X-ray diffraction single-crystal compression experiments [37,38], in polycrystalline shock-wave compression experiments [39] and in first-principles simulation experiments [40]. Using micro-Raman spectroscopy and high-resolution transmission electron microscopy combined with molecular dynamics simulations, Van de Moortèle et al. [35] reported a new polymorph (ζ-(Mg, Fe)2SiO4) in some shocked Ol grains of the Martian meteorites NWA 2737 and NWA 1950, but did not document the structural details. In their compression experiments with forsterite (Fo) single crystals at room T, Finkelstein et al. [37] discovered two new high-P polymorphs, forsterite-II at ~50 GPa and forsterite-III at ~58 GPa with the space group of P1 and Cmc21, respectively (denoted as Fo-II and Fo-III hereafter in this study). Their meta-dynamics simulation showed a stepwise phase transition sequence from Fo to Fo-II and then to Fo-III via a shear mechanism. Using first-principles molecular dynamic calculations, Zhou et al. [40] found another polymorph with the P21212 space group, which had lower enthalpy than Fo at P > 43.46 GPa and 0 K (named as Fo-IV hereafter in this study). In their compression experiments with a San Carlos Ol single crystal, Santamaria-Perez et al. [38] observed some new “defect” peaks associating with the increase of the Si coordination and the amorphization process when P increased further, which was supported by their molecular dynamics simulations. While studying a heavily shocked meteorite, Tomioka and Okuchi [36] found a new high-P polymorph, the ε*-phase, occurring as nanoscale lamellas and having a topotaxial relationship with the host mineral Rwd. Consequently, they proposed that the ε*-phase could form from all other polymorphs via a shear transformation mechanism, and that such diffusion-free processes could complicate the high-P transformation of Ol and occur not only in shocked meteorites but also in lithospheres subducting into the deep Earth. In total, these studies reported five new Ol polymorphs, three of which had detailed structural information valuable for further first-principles calculations (Fo-II, Fo-III and Fo-IV). Because the phase transition of Ol to its high-P polymorphs may always involve several different processes such as nucleation and growth along the grain boundary where atomic diffusion plays a very important role, and lattice-coherent shear mechanism [1,3,6,22,26,41,42,43], other kinetically favorable (lower activation/nucleation/growth barriers) phase transition paths where Ol transforms into some metastable polymorphs under high P and relatively low T, rather than directly transforms to the high-P stable phases Wds and Rwd (high activation barriers), are certainly possible. As such, these thermodynamically metastable phase transition paths in the inner cold part of a subducting slab could not complicate the phase transformation sequence of Ol only, but also shed new lights on the geodynamic process of the subducted materials in the deep Earth.
In this study, we have conducted extensive first-principles calculations to systematically examine the crystallographic characteristics, elastic properties and dynamic stabilities of these three newly discovered high-P polymorphs, namely Fo-II, Fo-III and Fo-IV, and their phases relations to other common mantle phase or phase assemblages (Fo, Wds, Rwd, akimotoite (Aki) + periclase (Pe), and bridgmanite (Brg) + Pe) at high P and high T. We did not consider the stishovite + Pe assemblage or the majorite phase, because the former is stable only at very low T (<125 K) for the composition Mg2SiO4 and the latter is a low-P (<~22 GPa) and high-T (>1500 K) phase [44]. Our phonon calculation results show that the Fo-II and Fo-IV phases are dynamically unstable, but the Fo-III phase has a distinct dynamic stability for a vast P range. The calculated Fo/Fo-III phase boundary, with a transition pressure of 23.75 GPa at room T and a negative Clapeyron slope of ~−1.1 MPa/K, is very similar to the Rwd/Brg + Pe phase boundary. This calculated phase transition pressure is quite different to the experimentally determined value (~58 GPa at room T; Finkelstein et al. [37]), which was presumably severely affected by a slow reaction rate of the Fo/Fo-III phase transition and short experimental durations. Further, combining the results of previous studies and our calculations, we infer that the Fo/Fo-III phase transition with a shear transformation mechanism is quite possible in the inner part of a slab during its fast subduction to the 660 km depth. Consequently, the Fo-III metastable phase may act as a ‘bridge’ phase linking the low-P Ol with the high-P stable phase or phase assemblages such as the Rwd, Brg + Pe and Aki + Pe, and play an important role in governing the dynamic interactions between the slabs and the ambient mantle.

2. Methods

All the computational work reported here was done on the Tianhe-2 Supercomputer System hosted by the National Supercomputer Center in Guangzhou, China. It was performed with the Vienna Ab-initio Simulation Package (VASP; Kresse and Furthmüller [45]) using density functional theory (DFT; Hohenberg and Kohn [46]; Kohn and Sham [47]). The projector augmented wave pseudopotentials [48] were used to describe the interactions between the ions and electrons. The electronic configurations used in our studied systems were Mg (3s23p0), Si (3s23p2), and O (2s22p4). The generalized gradient approximation (GGA; Perdew et al. [49]) with the PW91 functional [50], a technique well-known in reproducing phase relations (the primary interest of this study), was used to approximate the exchange-correlation interaction. In some particular cases, the local density approximation (LDA; Ceperley and Alder [51]; Perdew and Zunger [52]) method was also employed (see later discussion).
The static geometry optimization and ionic relaxation under different hydrostatic P were performed using the conjugate algorithm [53], and both the lattice parameters and the atomic positions were allowed to change during the optimization. All the initial structures used were adopted from previous studies (Fo: Hazen [54]; Wds: Horiuchi and Sawamoto [55]; Rwd: Hazen et al. [56]; Brg: Horiuchi et al. [57]; Aki: Horiuchi et al. [58]; Pe: Hazen [59]; Fo-II and Fo-III: Finkelstein et al. [37]; Fo-IV: Zhou et al. [40]). The planewave cutoff energy was set as 650 eV for all these structures for consistency, and the energy convergence criterion was set as 10−8 eV. The k-point sampling grid [60] for each phase is listed in Table 1. The cutoff energy and k-point sampling grid were tested with the total energy converging to 1 meV/atom. This observation was in good agreement with Hernandez et al. [44], in which Fo, Wds, Rwd, Brg, Aki, Pe, stishovite and majorite were successfully simulated with a lower planewave cutoff energy of 500 eV. Likewise, it is believed that our higher planewave cutoff energy should be sufficient to converging the atomic forces, a requirement for the phonon calculations, which will be addressed below.
Based on the optimized structures, the lattice vibrational properties were examined by calculating the dynamic matrix using the density functional perturbation theory (DFPT; Gonze and Lee [61]; Baroni et al. [62]) with a unit/primitive cell rather than a supercell, which could save a lot of computing time but lost little accuracy. Using the calculated lattice vibrational information at the Γ point in the first Brillouin zone, the phonon dispersion curve and corresponding density of state were calculated with the PHONOPY code [63], and were in turn used to calculate the thermodynamic quantities such as the equilibrium volume (V), isothermal bulk modulus (KT) and its first pressure derivative ( K T ), adiabatic bulk modulus (KS), Gibbs free energy (G), thermal expansion coefficient (α) and thermal Grüneisen parameter (γth) at certain P and T with a quasi-harmonic approximation method (QHA; Born and Huang [64]; Carrier et al. [65]; Wentzcovitch et al. [66]). The q-point sampling grid for the QHA calculations for each phase was tested for the Gibbs free energy converging to 0.01 kJ/mol, and is listed in Table 1.

3. Results and Discussion

3.1. Crystallographic Characteristics of Fo, Fo-II, Fo-III and Fo-IV

The DFT optimized structures of the Fo, Fo-II, Fo-III and Fo-IV at 0 K and some selected P are plotted in Figure 1, using the VESTA program [67]. The lattice parameters of these phases at 0 K and 0 GPa are compared in Table 2. Their crystallographic details at some selected P are summarized in Supplementary Tables S1–S8.
Essentially identical to the experimental results [54], all the O atoms in the Fo phase form an expanded and distorted hexagonally close-packed array stacked along the a direction whereas the Si atoms locate in the isolated tetrahedra which share corners with the [MgO6] octahedra (Figure 1a). The [MgO6] octahedra fall into two groups, [Mg(I)O6] and [Mg(II)O6] (with the [Mg(II)O6] larger and more-distorted than the [Mg(I)O6]) and share both corners and edges. As expected for the simulation results using the GGA technique [66,68], our optimized unit-cell parameters a, b, c, and V at 0 GPa and 0 K are slightly larger than those experimentally reported values (Hazen [54]; 1 atm and 296 K) by ~0.73%, 0.79%, 0.70% and 2.23%, respectively (Table 3).
The Fo-II phase was experimentally determined as a triclinic phase (space group P1, Z = 4), with no crystallographic details refined from the single-crystal XRD data though (Finkelstein et al. [37]; ~52.4 GPa). Our optimized structure at 0 GPa shows that there are two types of Si atoms, Si(I) and Si(II), in equal proportions (see Supplementary Table S2). The Si(I) atoms locate in tetrahedral sites while the Si(II) atoms locate in octahedral sites (Figure 1b), with one [Si(I)O4] tetrahedron pairing with one [Si(II)O6] octahedron (via corner-sharing) to form one structural unit isolated to other Si-O polyhedra. As for the Mg atoms, they distribute on five crystallographically different sites (from Mg(I) to Mg(V) with the ratio of 2:2:1:2:1), and all form octahedra (see Supplementary Tables S2 and S3). P brings forth some changes in the crystal structure. Our optimized structure at 60 GPa (Figure 1c) shows that although the Si cations maintain as either fourfold-coordinated (50%) or sixfold-coordinated (50%), the Mg cations have divided into two groups, with one quarter of them in sevenfold coordination (forming distorted pentagonal bipyramid) and the rest in sixfold coordination, in good agreement with the simulated results of Finkelstein et al. [37]. The optimized lattice parameters at 52.4 GPa and 0 K are compared in Table 3 with the experimentally obtained ones at the same pressure but 298 K. The agreement between these two sets of lattice parameters is good, with our calculated values slightly larger (a by 0.58%, b by 0.56%, c by 0.31%, and V by 1.32%), a common phenomenon for the GGA method [66,68].
The Fo-III phase was experimentally determined as a non-centrosymmetric version of the Cmcm CaTi2O4-type structure [37], and its crystallographic details were well-refined by the single-crystal XRD method. The experimentally determined lattice parameters at 58.2 GPa (298 K) are compared in Table 3 with our calculated results at the same pressure (0 K). Clearly, our optimization overestimates the b parameter by 1.86%, but abnormally underestimates the a, c and V parameters by 1.02%, 2.15% and 1.28%, respectively. These unexpected minor discrepancies may be attributable to the experimentally observed high defect density in the Fo-III crystal under high P, which might have affected the single-crystal XRD result [37]. At 0 GPa, the optimized structure has only one type of Si atom and two types of Mg atom, Mg(I) and Mg(II). All the Si atoms locate in octahedral sites, forming slightly distorted [SiO6] octahedra (Figure 1d). Neighboring [SiO6] octahedra share one edge and form a chain along the a direction ([SiO6] chain). The Mg(I) and Mg(II) atoms, in equal proportions, are all sixfold-coordinated, with the Mg(I) locating in somewhat distorted octahedral sites and the Mg(II) in triangular prism sites (Figure 1d; Supplementary Tables S4 and S5). Like the [SiO6] octahedra, neighboring [Mg(I)O6] octahedra share one edge and form a chain along the a direction ([Mg(I)O6] chain). In comparison, neighboring [Mg(II)O6] triangular prisms share the basal face and form a chain along the a direction as well ([Mg(II)O6] chain). The [SiO6] and [Mg(I)O6] chains are linked via corner-sharing, the [SiO6] and [Mg(II)O6] chains are linked via edge-sharing, and the [Mg(I)O6] and [Mg(II)O6] chains are also linked via edge-sharing. It should be pointed out that all these chains run along the a direction, so that a distinct elastic anisotropy should be expected for the Fo-III phase. Compared to our optimized structure at 0 GPa, our optimized structure at 60 GPa shows that the coordination of the Mg(II) has become sevenfold, in good agreement with the results obtained at ~58.2 GPa by Finkelstein et al. [37]. Higher P at least up to ~100 GPa produces no further major structural change.
The Fo-IV phase was a theoretical discovery (space group P21212; Zhou et al. [40]). Our optimized lattice parameters for 0 GPa are compared in Table 3 with the results of Zhou et al. [40]. Since we used the GGA method and Zhou et al. [40] used the LDA method, our calculated unit-cell parameters are all slightly larger than theirs (a by 1.28%, b by 1.30%, c by 1.51% and V by 4.15%), as expected. In our optimized structure at 0 GPa, there are one type of Si atom, and two types of Mg atom, Mg(I) and Mg(II), in equal proportions (see Supplementary Tables S6–S8). All Si atoms locate in octahedral sites (Figure 1f), and two [SiO6] octahedra share one edge to form a ‘dioctahedron’, which connects with another ‘dioctahedron’ via corner-sharing to form a chain along the b direction. The Mg(I) atoms locate in sixfold sites and form distorted [Mg(I)O6] octahedra. The Mg(II) atoms locate in fourfold sites and form distorted [Mg(II)O4] tetrahedra, which is unusual for a high-P phase. Neighboring [Mg(I)O6] octahedra and [Mg(II)O4] tetrahedra are connected via corner-sharing (Figure 1f). Higher P leads to some structural variations: at 20 GPa, the coordination of the Mg(II) has changed from fourfold to fivefold; at 40 GPa, it has further changed to sixfold.
The P dependence of the crystallographic characteristics of the Fo, Fo-II, Fo-III and Fo-IV phases at 0 K has been characterized by two kinds of parameters: one is the average bond-length (dmean) of the Mg-O and Si-O polyhedra, and the other is the effective coordination number (ECoN). Both parameters were calculated using the equations provided by Hoppe [69], as implemented in the VESTA code. The results are shown in Figure 2, Figure 3, Figure 4 and Figure 5.
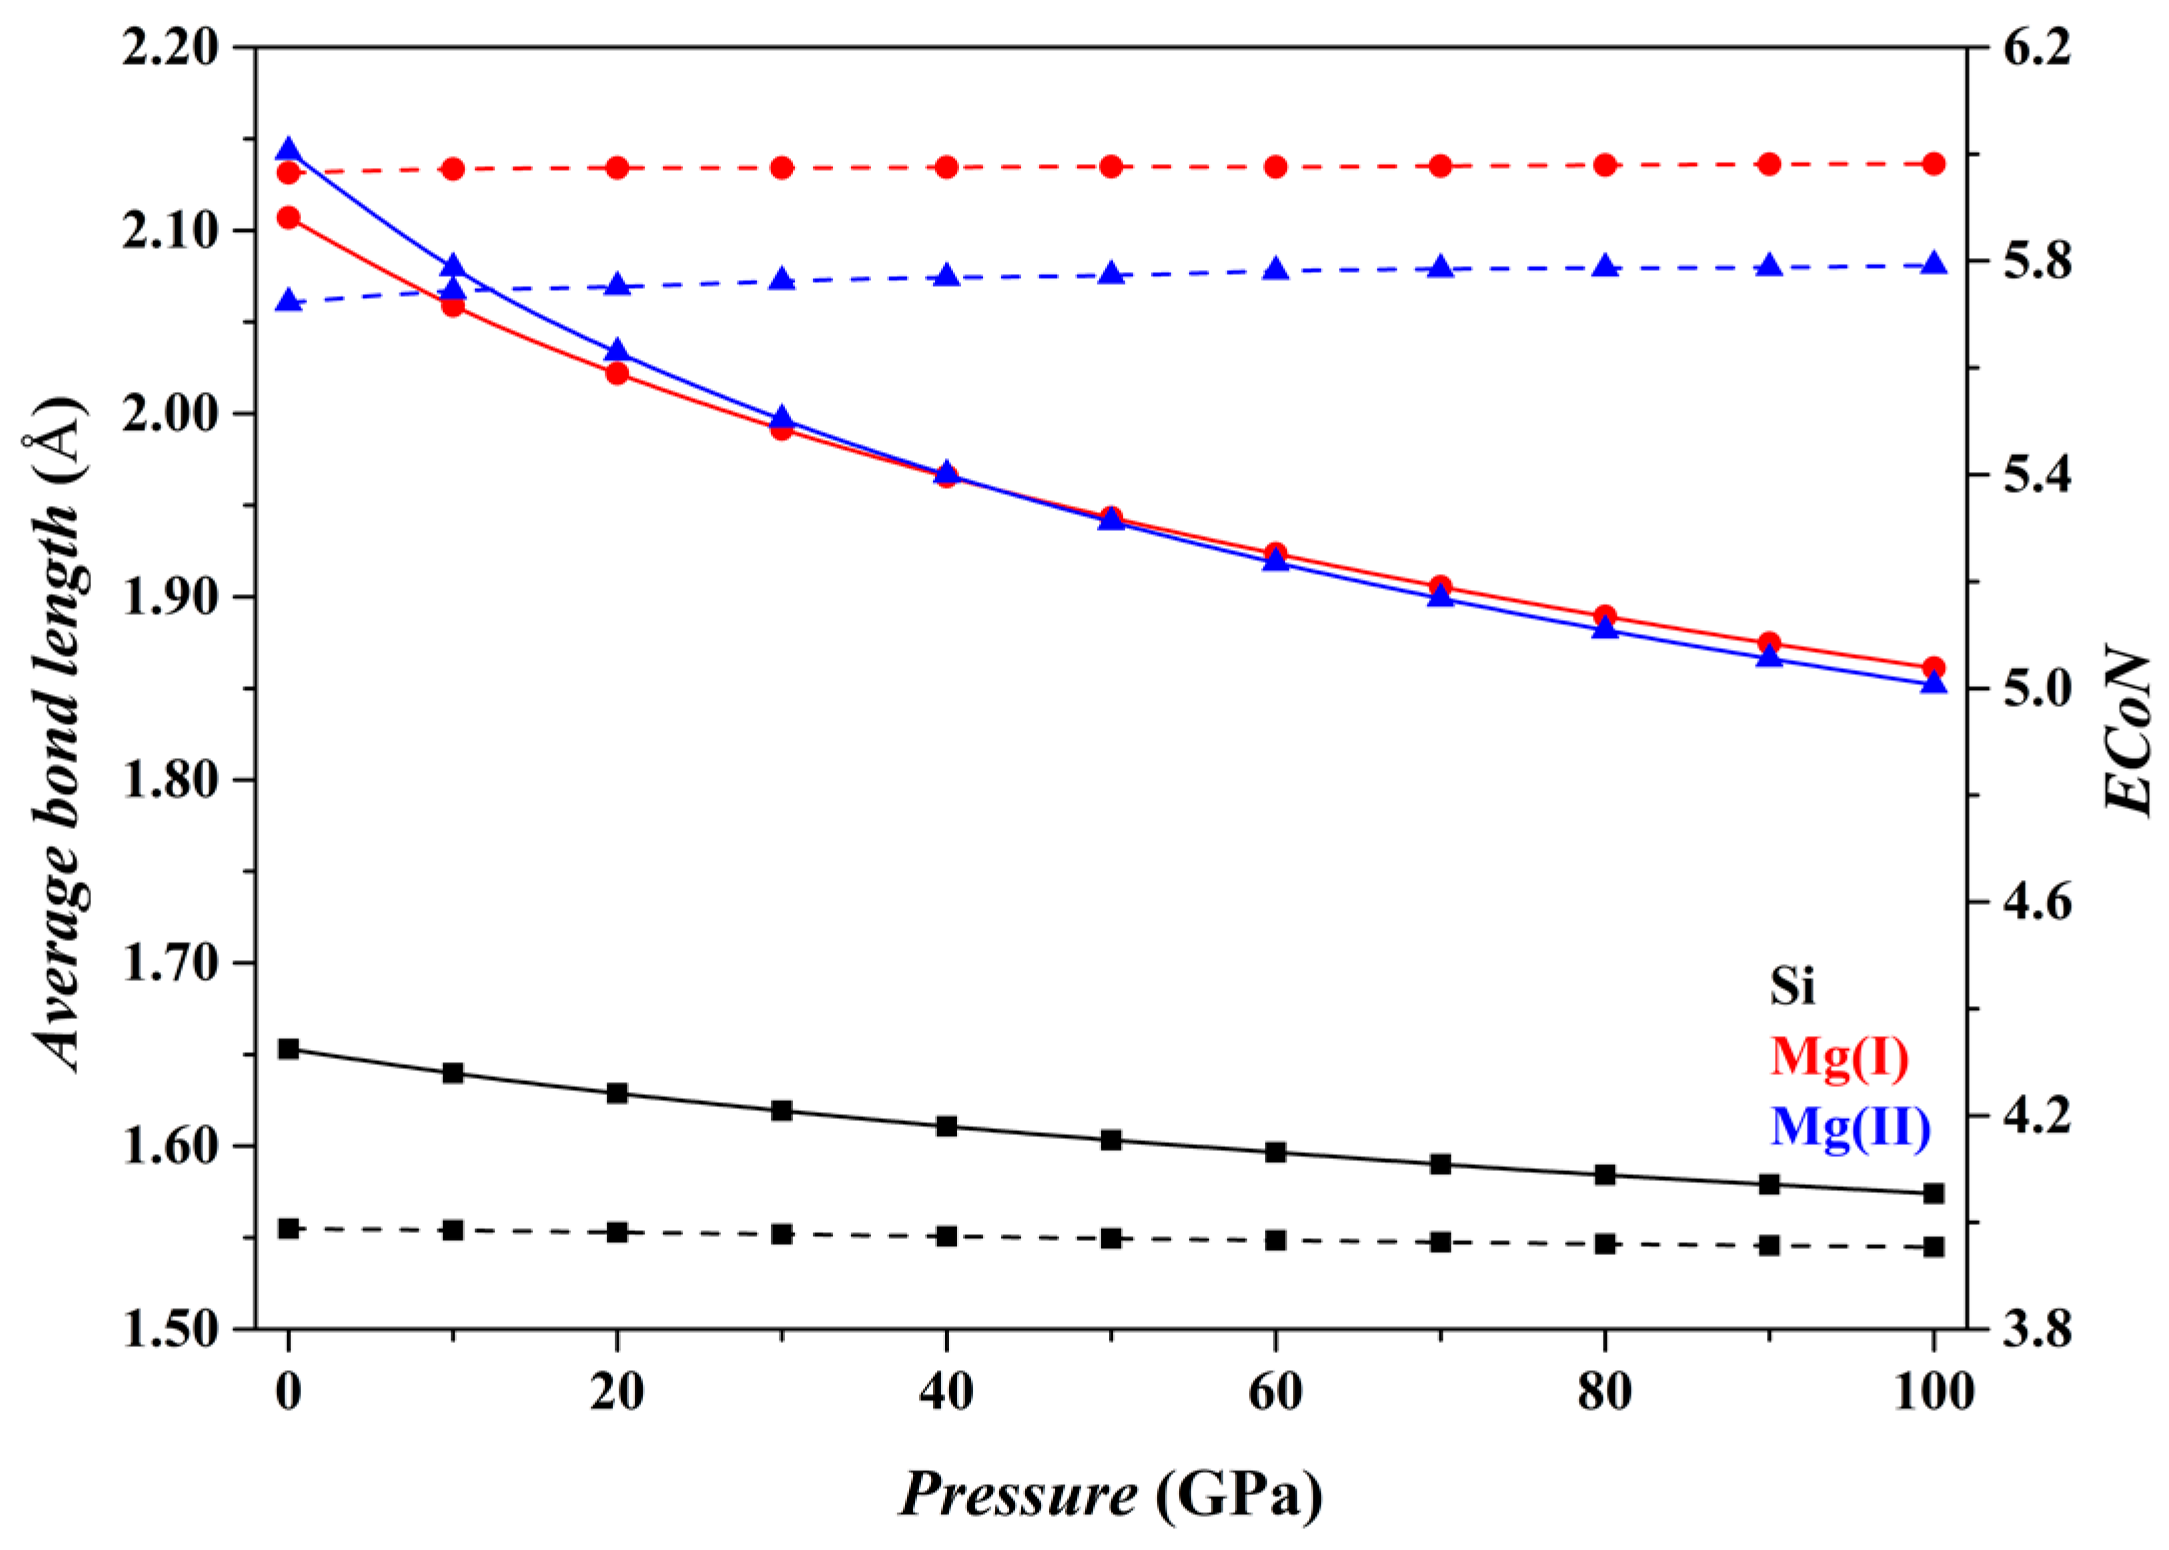
Figure 2 shows the results for the Fo phase. As P increases from 0 to 100 GPa, the dmean parameters for both the [SiO4] tetrahedron and the [MgO6] octahedron (solid curves) decrease smoothly, and the ECoN parameters remain nearly constant (dashed curves). Overall, the microstructural features of the Fo phase do not change suddenly.
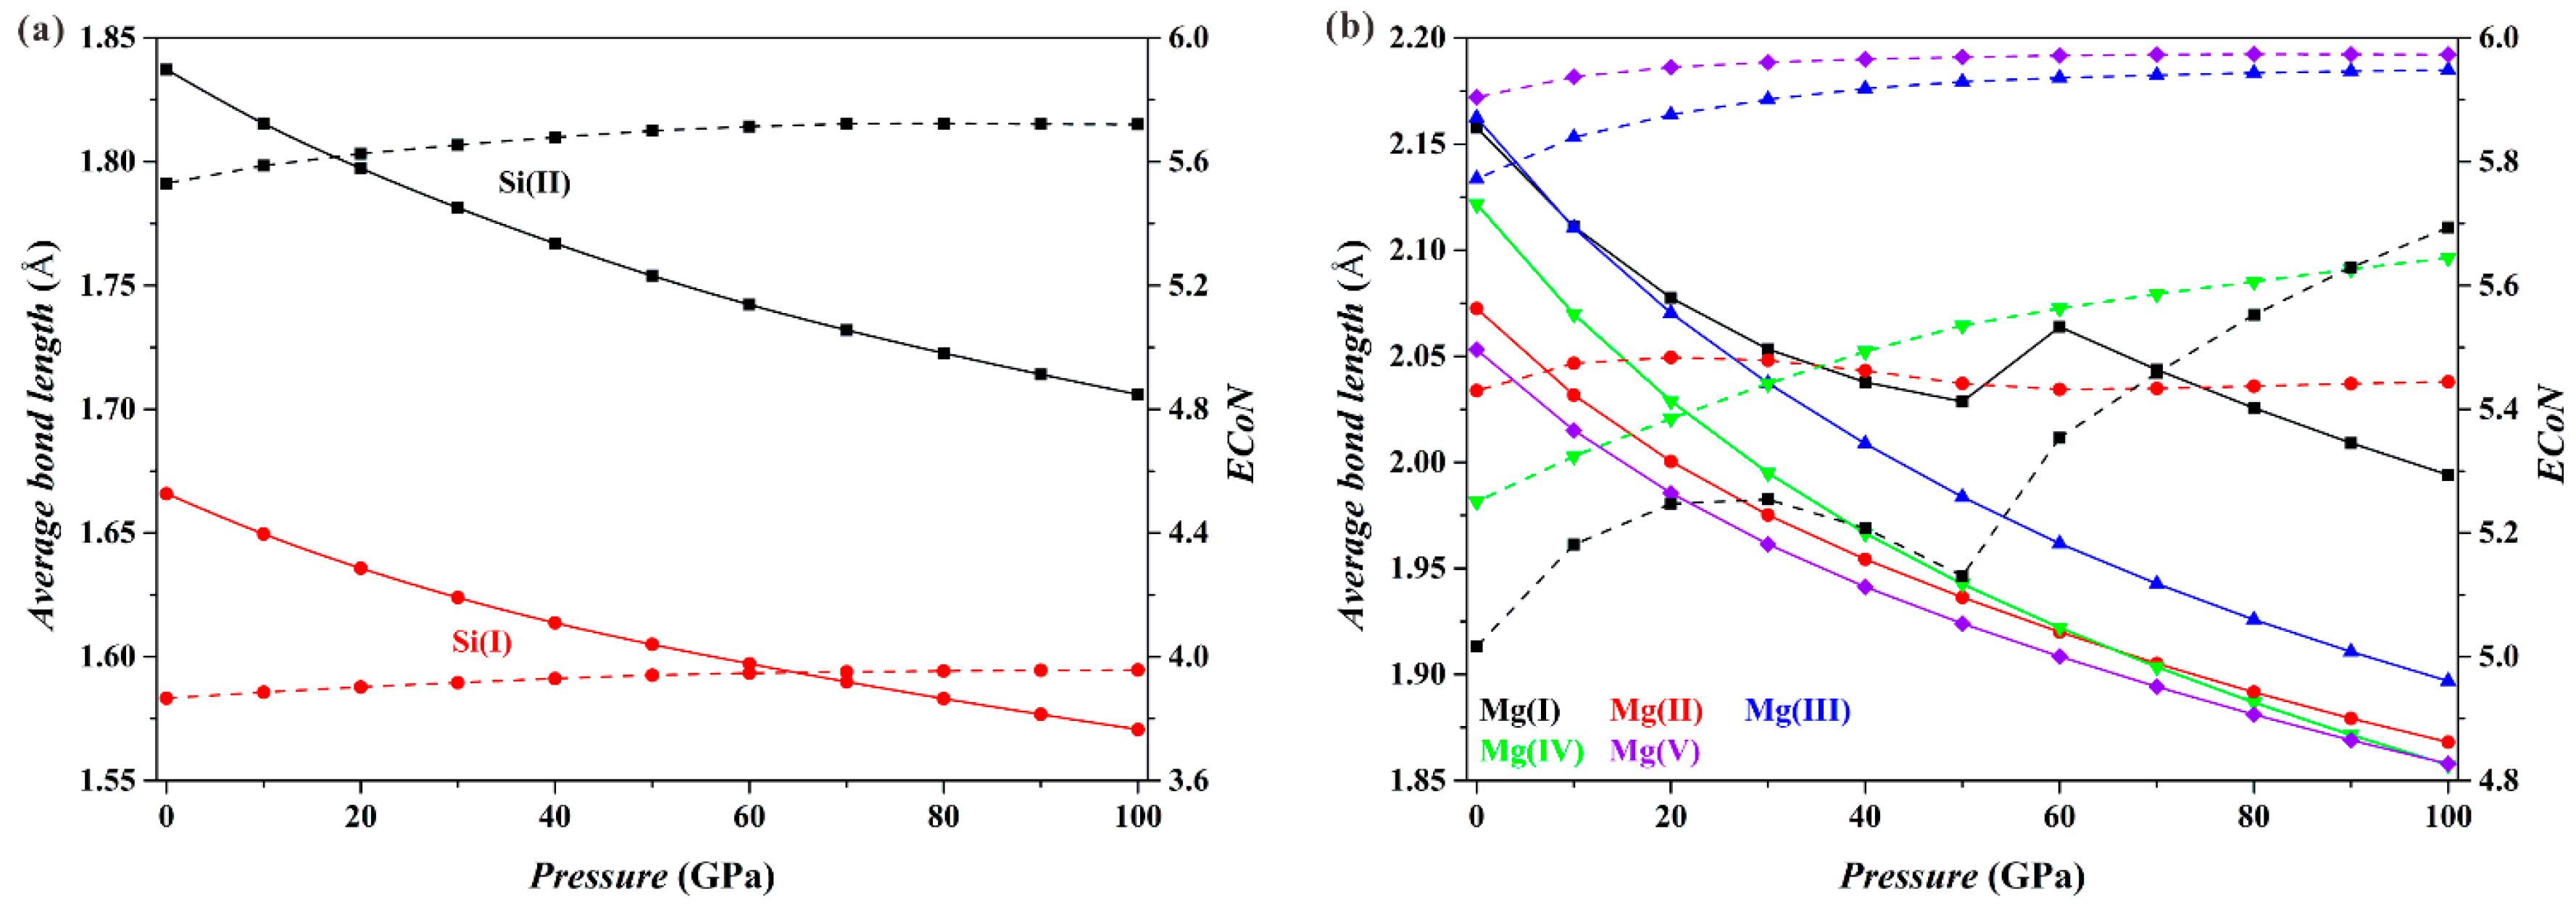
Figure 3 shows the results for the Fo-II phase. As P increases, the dmean parameters for both the [Si(I)O4] tetrahedron and the [Si(II)O6] octahedron (solid curves; Figure 3a) decrease smoothly, and the ECoN parameters increase only slightly (dashed curves; Figure 3a). These results imply that the connection relationships of the Si-O polyhedra in the Fo-II phase do not drastically change with P. However, things are different for the Mg-O polyhedra (Figure 3b). Both the dmean and the ECoN parameters for the [Mg(II)O6], [Mg(III)O6], [Mg(IV)O6] and [Mg(V)O6] polyhedra show smooth variations with P. For the [Mg(I)O6] polyhedron, however, the dmean parameter displays a sudden increase in its magnitude, and the ECoN parameter shows a remarkable change in the slope at the P interval from ~50 to 60 GPa. These dramatic changes of the [Mg(I)O6] octahedron are caused by the approaching O4 and O10 atoms shared by neighboring [Mg(I)O6] octahedron and [SiO4] tetrahedron (Figure 1b), which eventually transform the [Mg(I)O6] octahedron into a capped sevenfold-coordinated [Mg(I)O7] at ~60 GPa (Figure 1c).
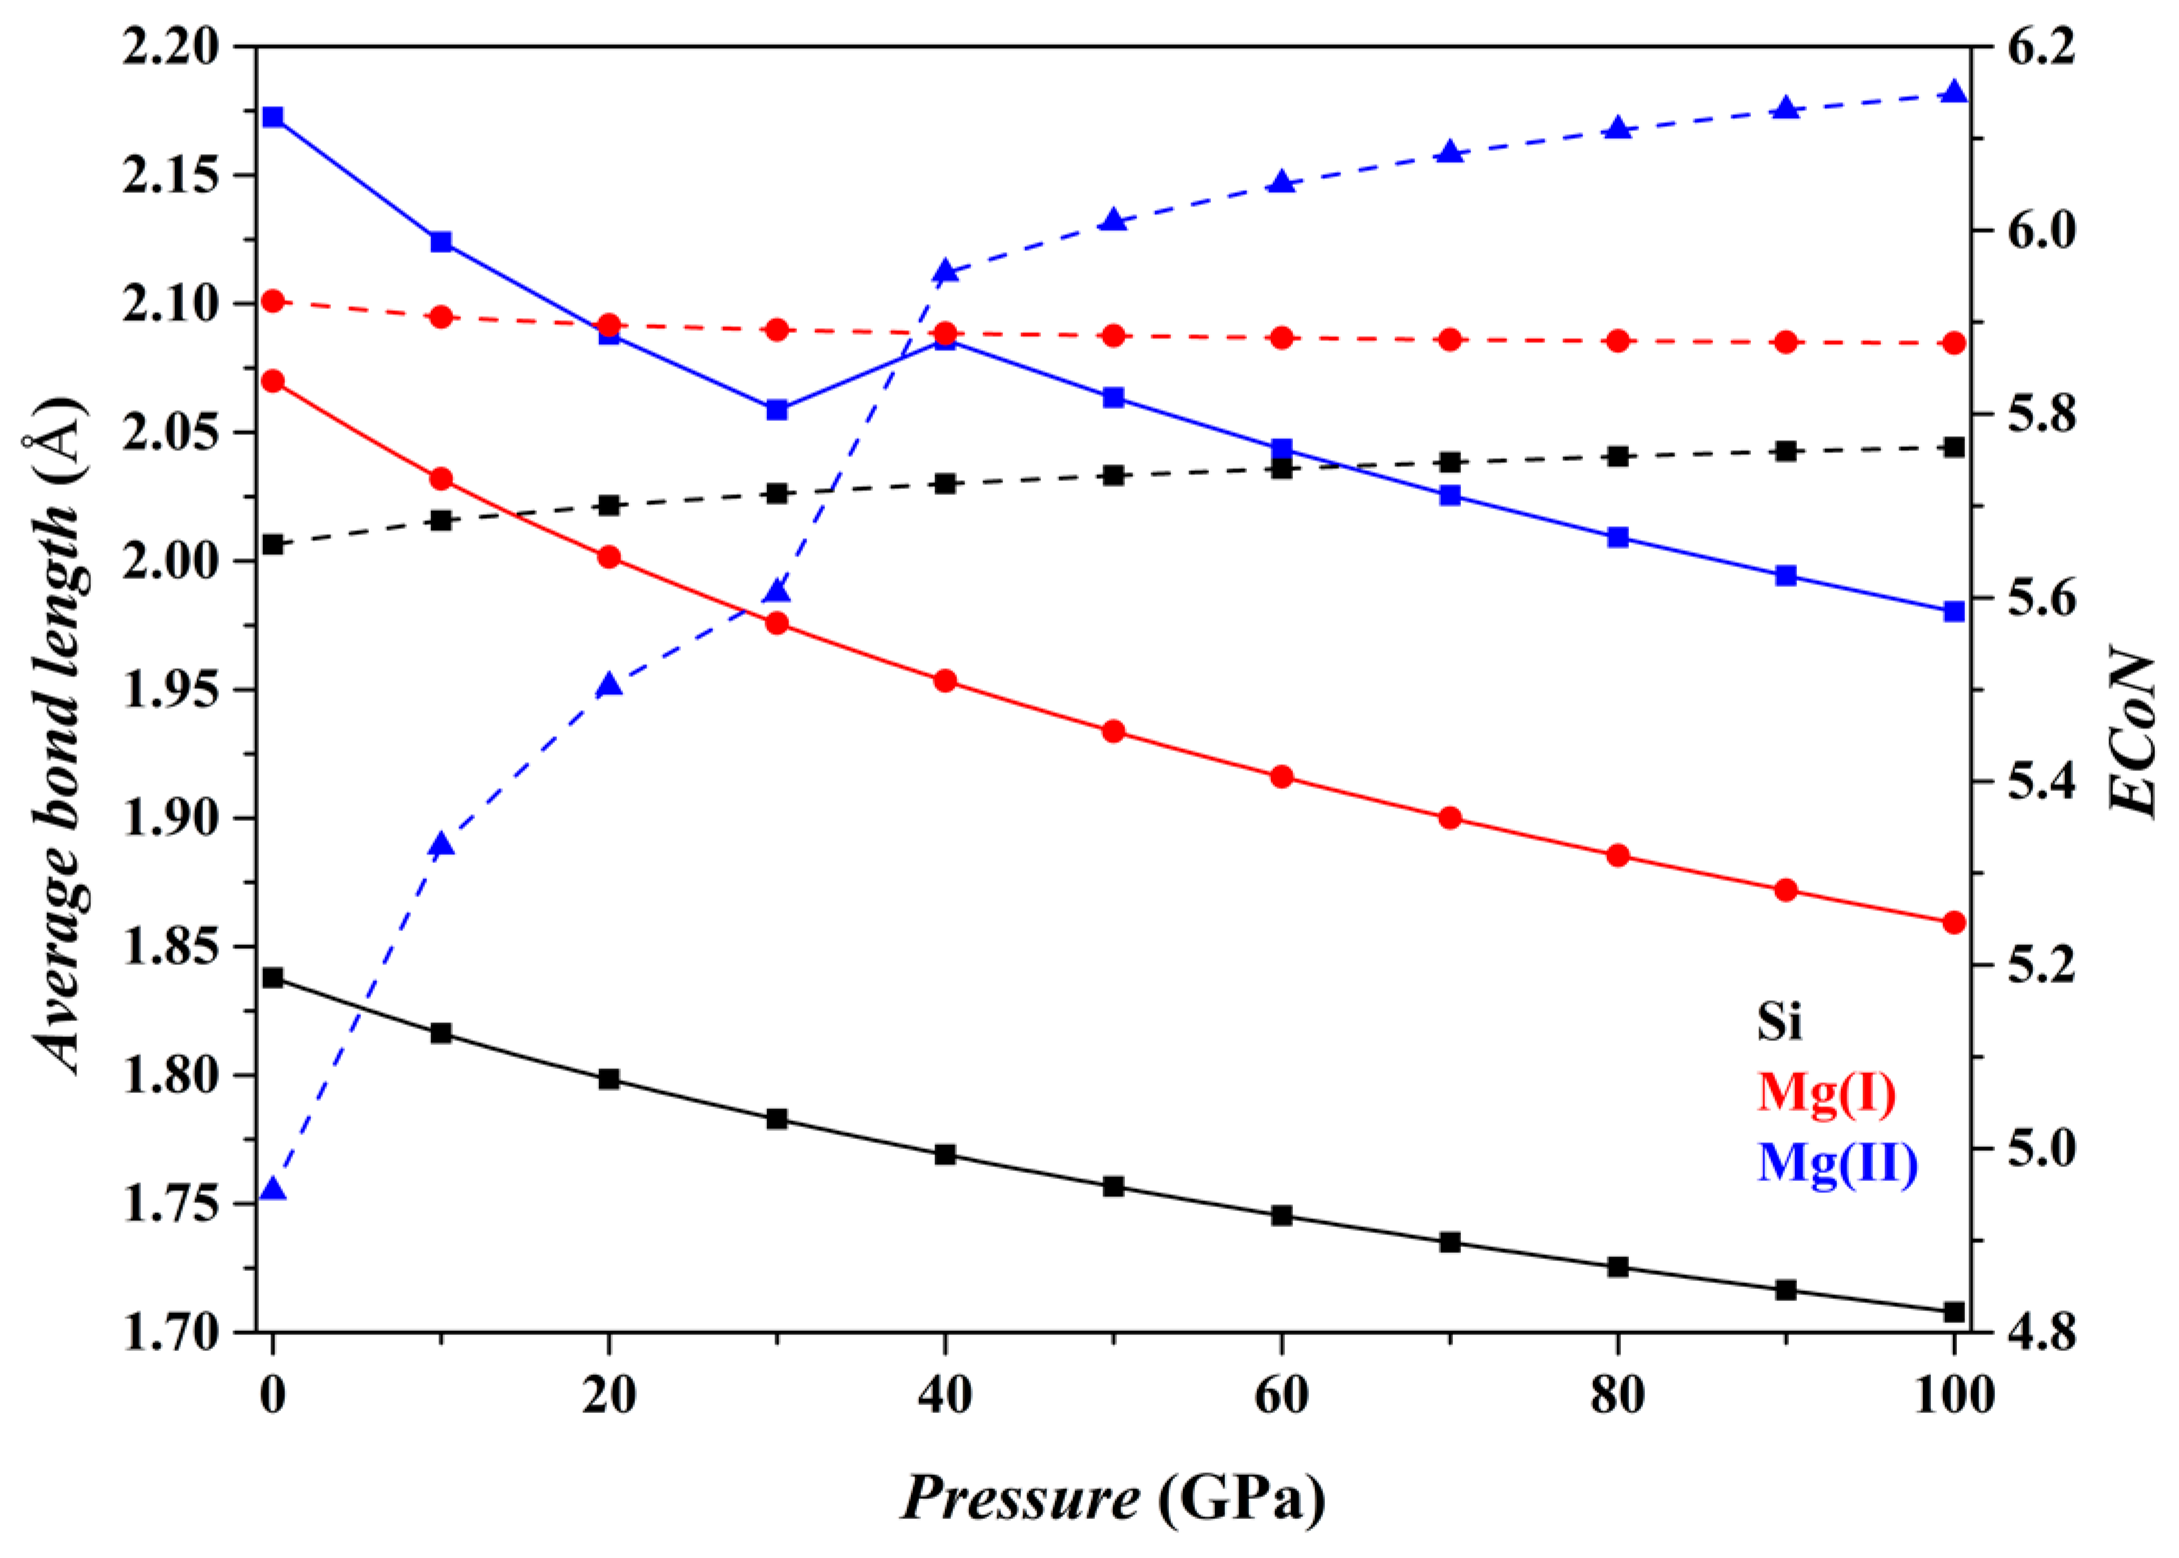
Figure 4 shows the results for the Fo-III phase. The [SiO6] and [Mg(I)O6] octahedra do not change drastically as P increases (black and red curves), with their dmean parameters decreasing smoothly and their ECoN parameters changing little. In contrast, the [Mg(II)O6] triangular prism shows some remarkable changes, a sudden increase in the dmean parameter at pressures from 30 to 40 GPa and an apparent increase of the slope in the ECoN-pressure curve at similar P. These sudden changes are caused by the approaching O1 and O3 atoms shared by the adjacent [SiO6] and [Mg(I)O6] octahedra (Figure 1d), turning the [Mg(II)O6] triangular prism into a capped triangular prism [Mg(II)O7] (Figure 1e).
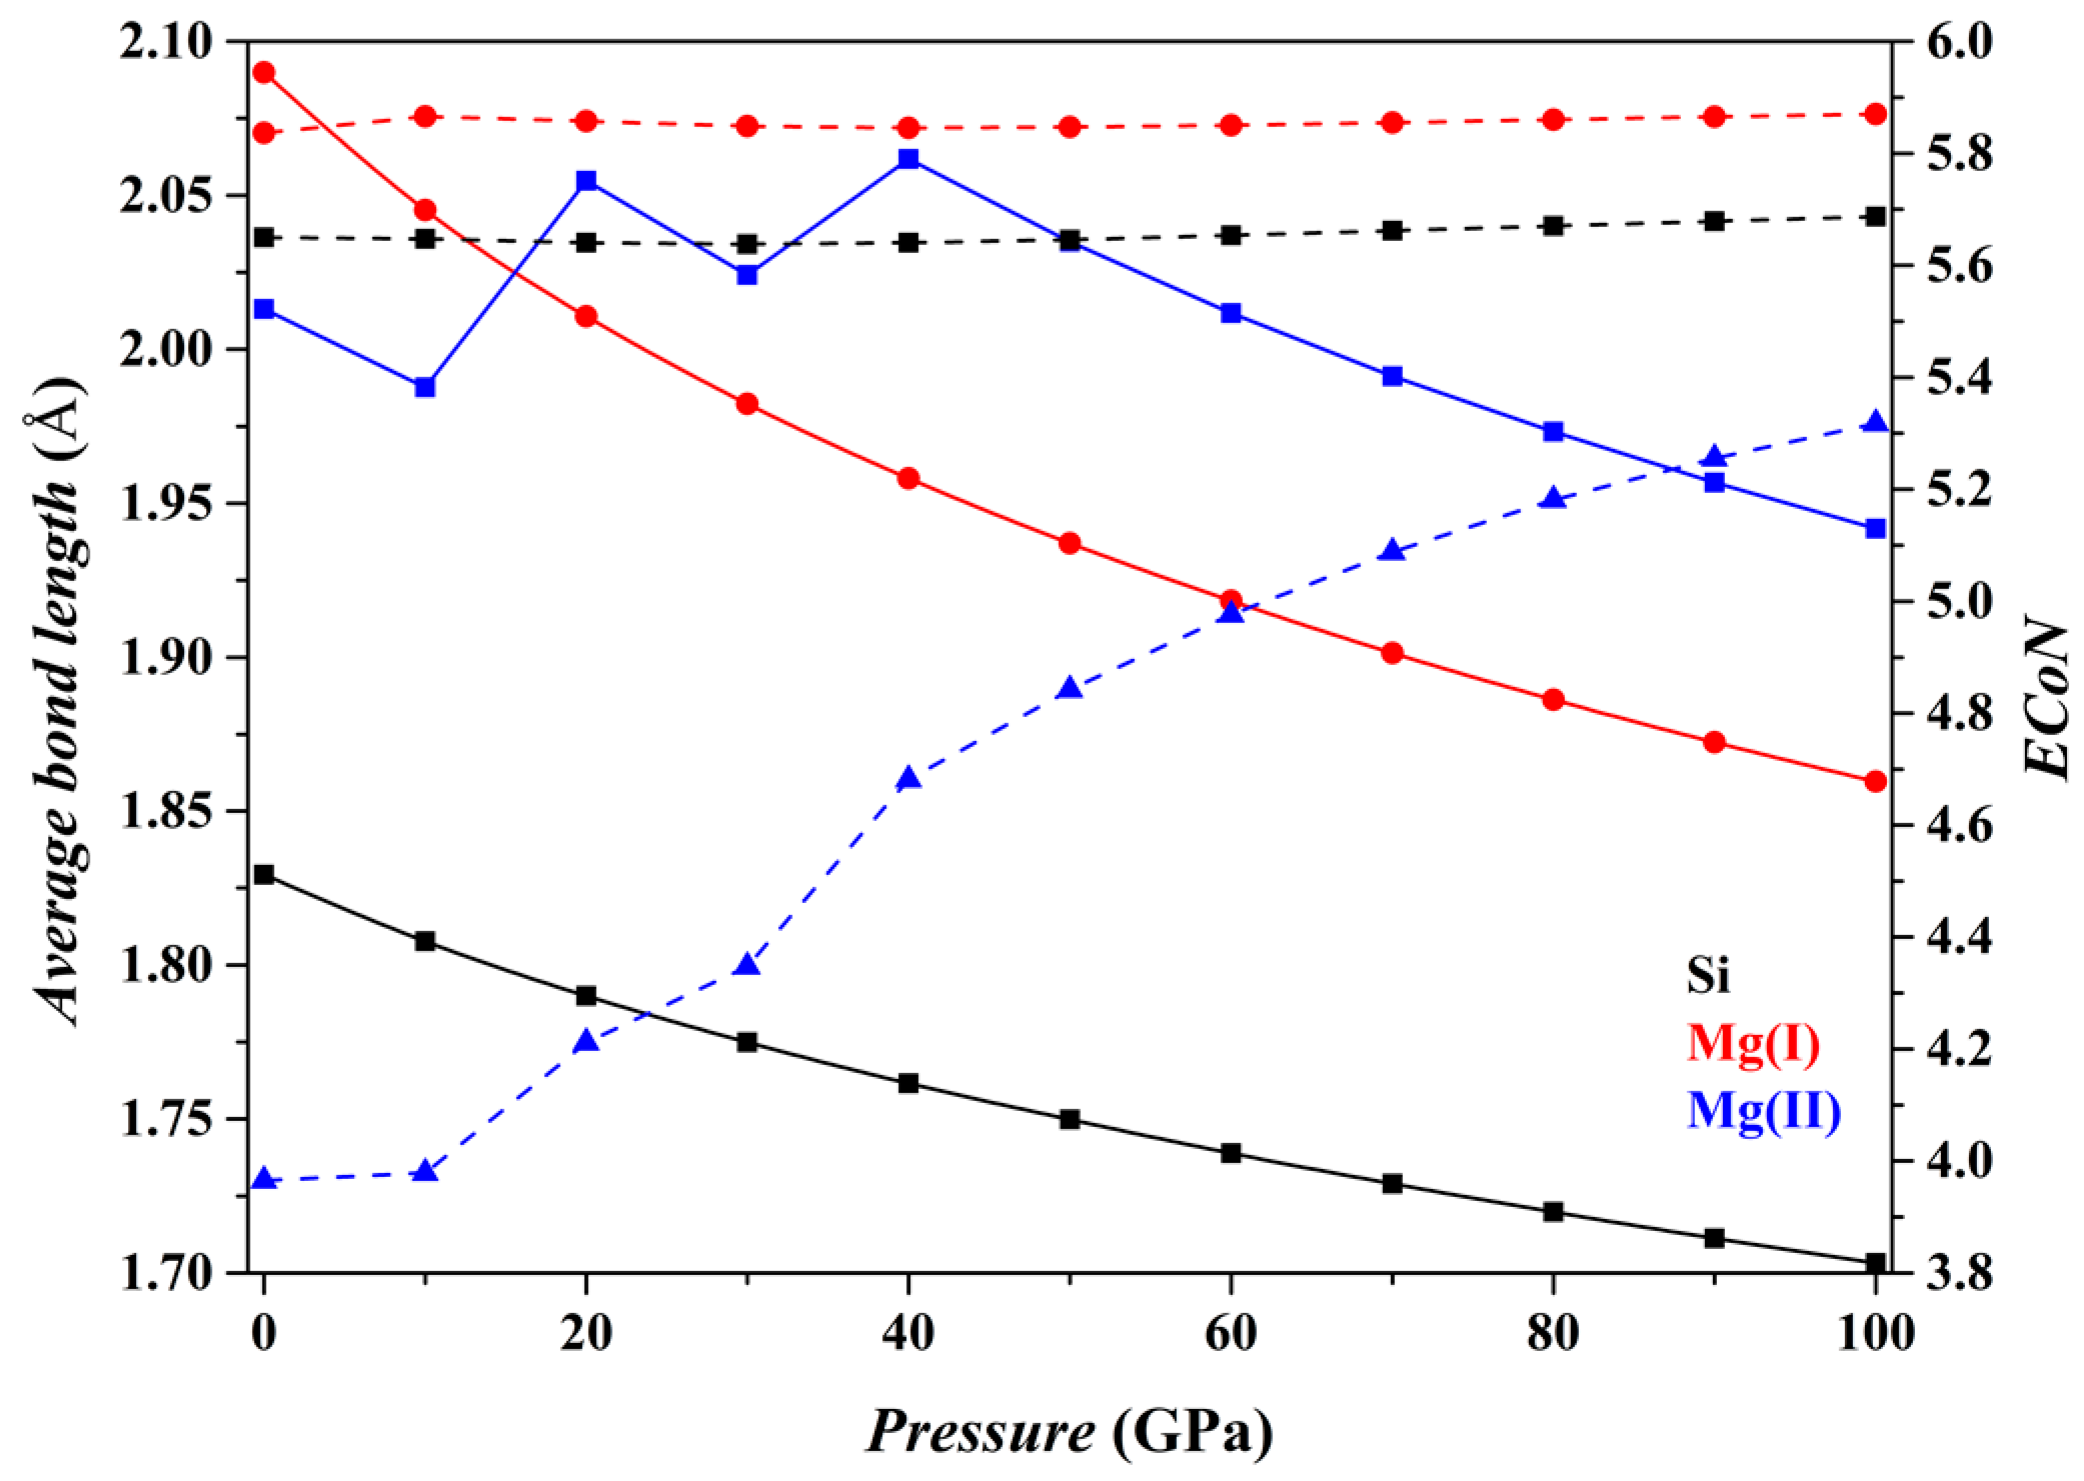
Figure 5 shows the results for the Fo-IV phase. The features of the [SiO6] and [Mg(I)O6] octahedra do not change significantly with P (black and red curves, respectively). But as for the [Mg(II)O4] tetrahedron (blue curves), its dmean parameter suddenly increases between ~10 and 20 GPa, and between ~30 and 40 GPa, but gradually decreases at higher P (solid curve). Correspondingly, the slope of its ECoN parameter shows marked changes at similar P intervals (dashed curve). These dramatic changes are caused by two approaching O atoms, the O7 in the adjacent [SiO6] octahedron and O12 in the adjacent [Mg(I)O6] octahedron (Figure 1f). Eventually, the [Mg(II)O4] tetrahedron transforms into a distorted trigonal bipyramid [Mg(II)O5] (Figure 1g) and further into a triangular prism [Mg(II)O6] (Figure 1h) as P increases.

3.2. Compression Behavior of Fo, Fo-II, Fo-III and Fo-IV at 0 K

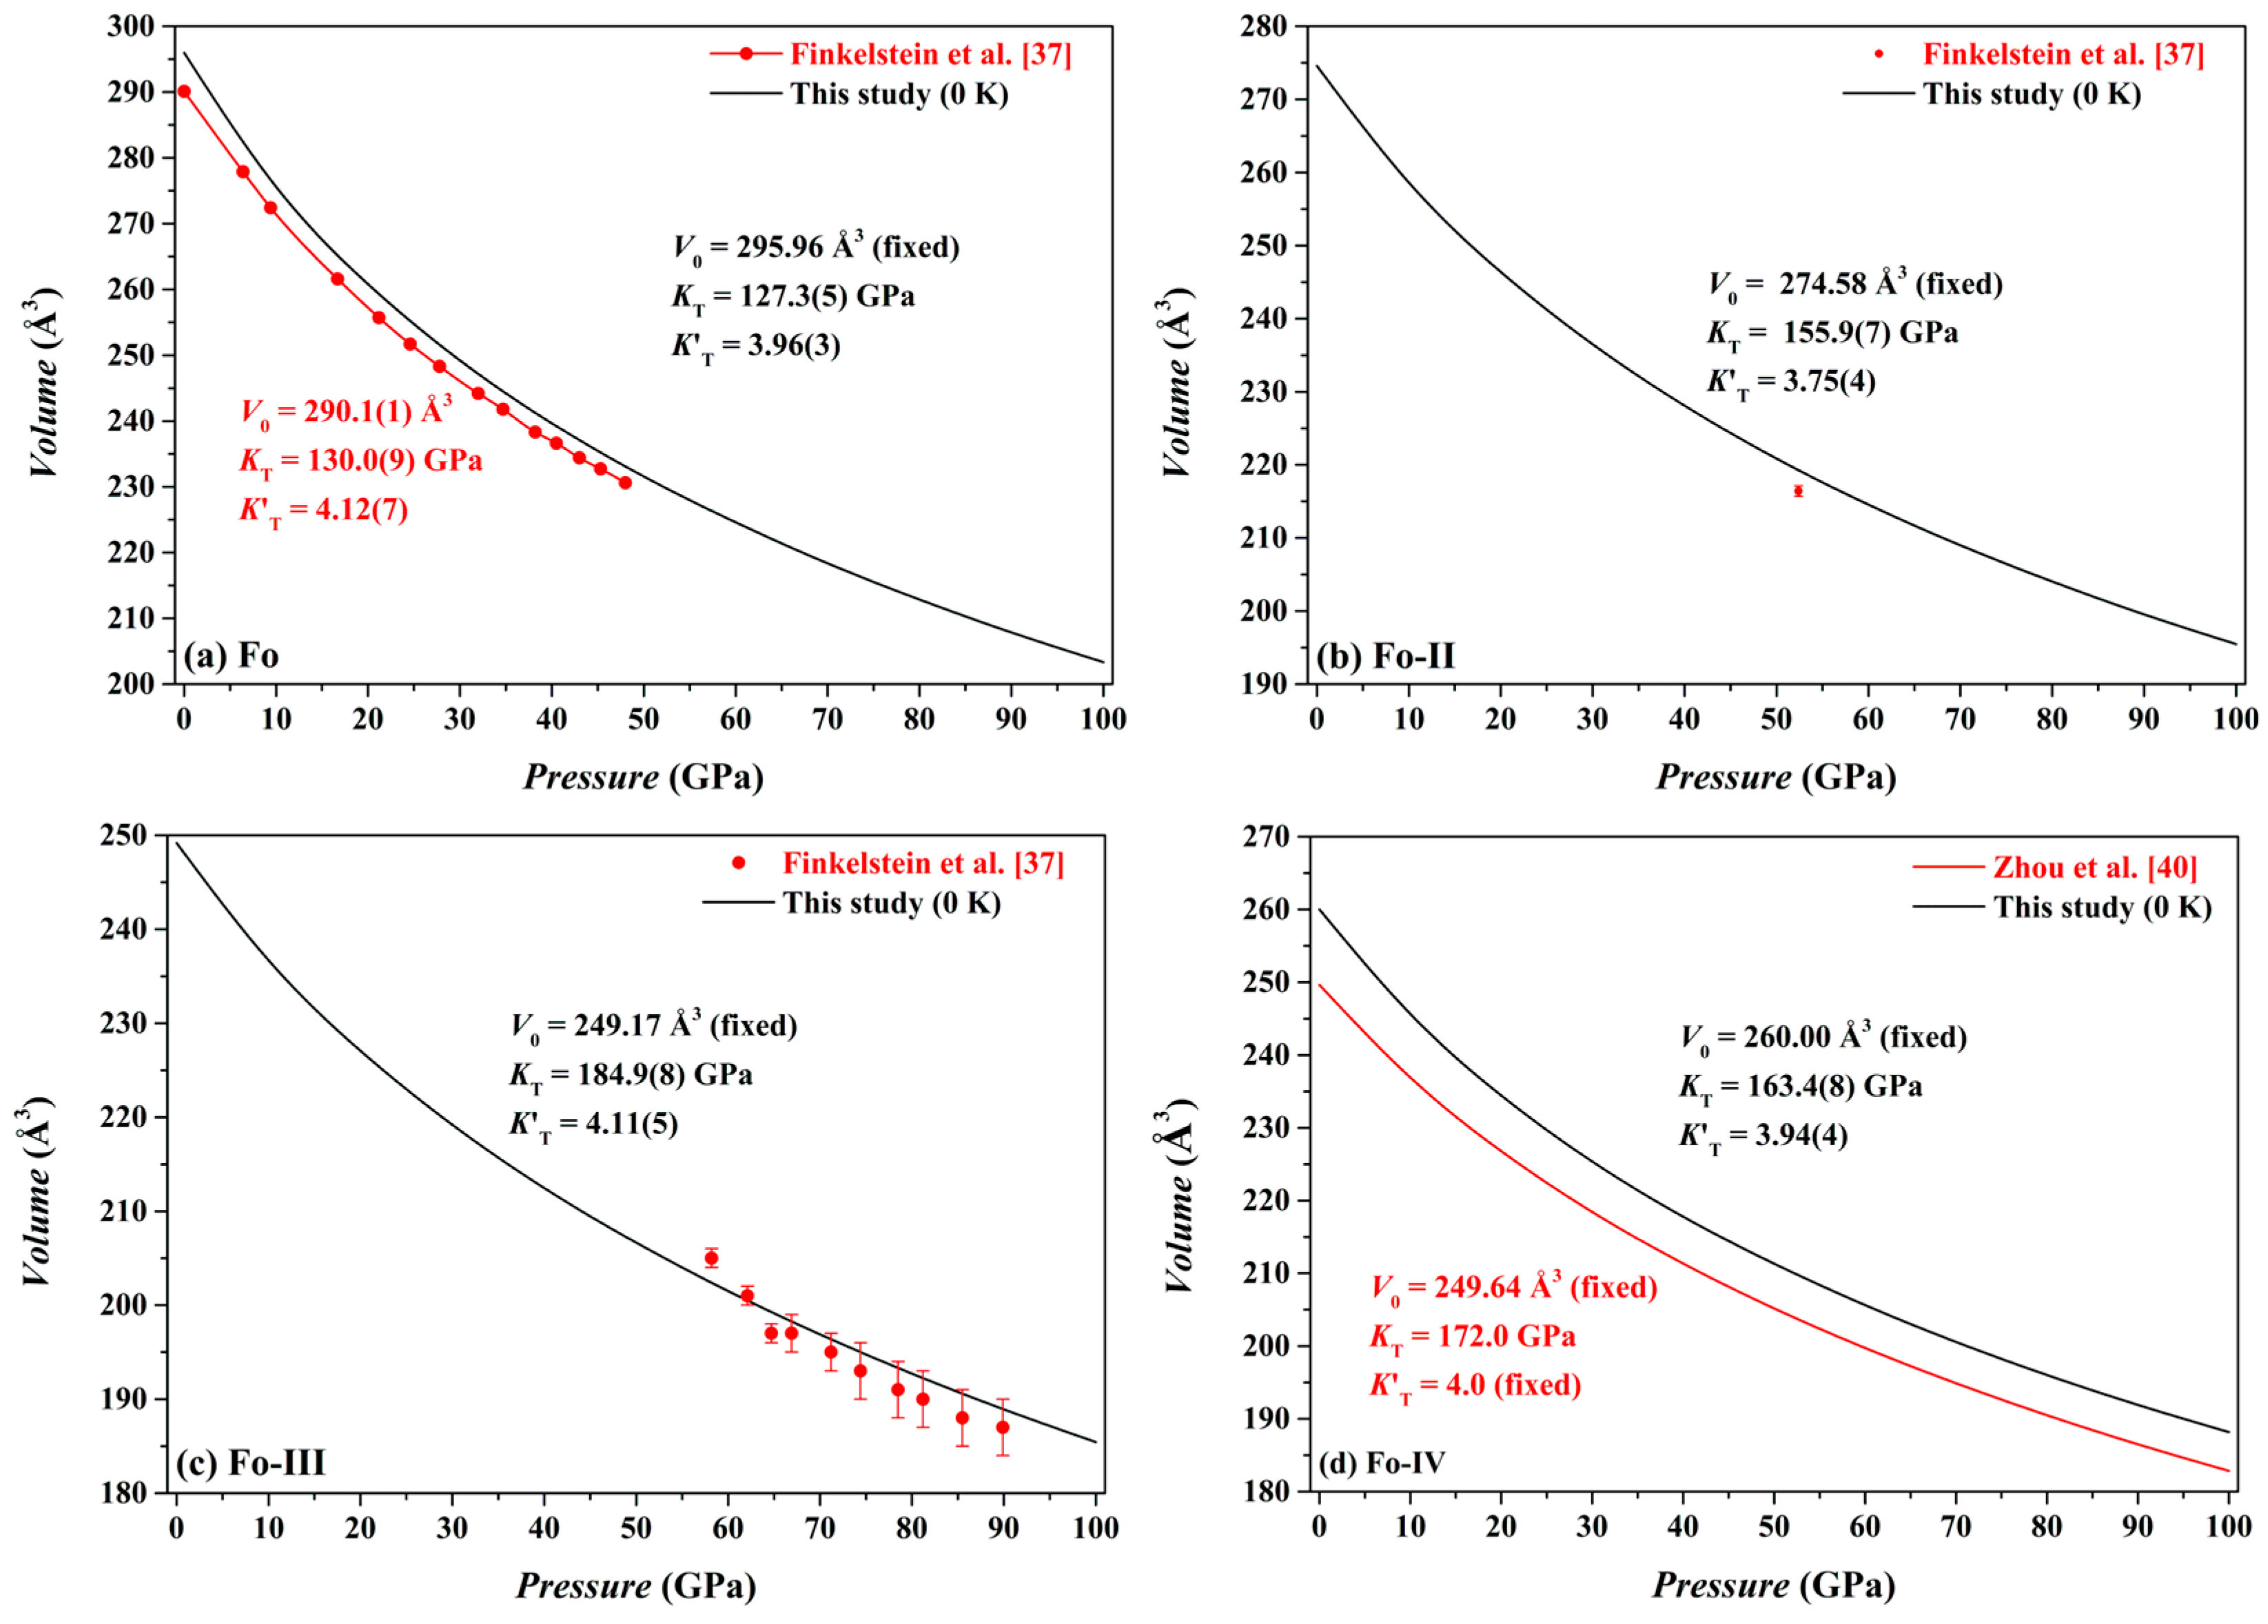
Our optimized volume data for the Fo, Fo-II, Fo-III and Fo-IV phases at different P and 0 K are shown in Figure 6. Using a least-squares method, the pressure-volume data have been fitted to the third-order Birch-Murnaghan equation of state (3rd BM-EoS; Birch [70]),
P = 3 2 K T [ ( V 0 V ) 7 3 ( V 0 V ) 5 3 ] { 1 + 3 4 ( K T 4 ) [ ( V 0 V ) 2 3 1 ] } ,
where P is pressure (GPa), KT isothermal bulk modulus (GPa), K T the first pressure derivative of the K T , V0 the volume at zero pressure, and V the volume at high pressure. The thus-obtained EoS parameters are listed in Table 4.
For the Fo phase, we have obtained V0 = 295.96 Å3 (fixed), KT = 127.3(5) GPa and K T = 3.96(3) (Figure 6a). The EoS of the Fo phase was determined by a range of techniques such as high-P single-crystal XRD [37,54,71,72], high-P powder XRD [73], Brillouin scattering spectroscopy [74], and theoretical simulation [75,76]; see Finkelstein et al. [37] for a summary of the literature. In general, the results reported by the earlier studies are in very good agreement with ours. In specific, the KT from Finkelstein et al. [37] is slightly larger than the present determination (Figure 6a); their KT at 300 K (KT = 131.5(4) GPa, as obtained in this study by refitting their volume-pressure data with the 3rd BM-EoS) is ~3.9% larger than ours at 0 K (KT = 126.6(1) GPa), on the basis of K T = 4. Two factors may have made their contributions to this phenomenon: (1) our theoretical calculation, done with the GGA method, is well known to lead to an underestimated KT [68,77]; (2) the experimental data, collected with the P medium of He which is unquestionably the best available P-transmitting medium but still develops some deviatoric stress at P > ~40 GPa [78], are expected to generate slightly overestimated KT. If we consider the effect of T on the KT (0 K in the theoretical investigation versus 298 K in the compression experiments), the influences of these two factors become even more prominent.
For the Fo-II phase, we have obtained V0 = 274.58 Å3 (fixed), KT = 155.9(7) GPa and K T = 3.75(4) (Figure 6b), with the KT value potentially slightly underestimated because of the GGA method. Using the theoretically constrained 3rd BM-EoS for both phases, the volume of the Fo-II phase is thus ~7.2% smaller than that of the Fo at 0 GPa, or ~4.5% smaller at 52.4 GPa. The latter is in good agreement with the experimental observation of an ~4.8% volume reduction associated with the Fo/Fo-II phase transition at ~52.4 GPa and room T [37].
Our volume-pressure data of the Fo-III phase are compared in Figure 6c to the experimental data collected by Finkelstein et al. [37]. These two data sets are broadly compatible to each other. In detail, the experimental data, surprisingly, define a relatively large compressibility (or a relatively small KT) for the Fo-III phase. Remarkably, Finkelstein et al. [37] reported a high density of defects in their Fo-III crystal, which might have resulted in the relatively large compressibility. Fitted with the 3rd BM-EoS, our volume-pressure data constrain the V0, KT and K T as 249.17 Å3 (fixed), 184.9(8) GPa and 4.11(5), respectively (Figure 6c); as usually, the KT value might have been slightly underestimated with the GGA method. Using the theoretically determined 3rd BM-EoS for both phases, the volume of the Fo-III phase is thus ~15.8% smaller than that of the Fo at 0 GPa, or ~10.4% smaller at 58.2 GPa. The latter is in general agreement with the ~9% volume reduction extrapolated for the assumed Fo/Fo-III phase transition at ~58.2 GPa and room T, taking into account the influence of the high defect density in the Fo-III crystal [37].
The Fo-III phase is a non-centrosymmetric version of the Cmcm CaTi2O4-type structure, or a post-spinel phase [37]. Compared on the basis of K T = 4, our KT value for the Fo-III phase (186.7 GPa) is only slightly larger than that of the Mg2SiO4-spinel, or the Rwd (184(1) GPa; see Liu et al. [79] for a summary of the literature), by ~1.5%, which may have been severely affected by the GGA method used in our simulation. If we compare our GGA result for the Fo-III phase to the GGA result for the Rwd (169.3 GPa; Yu and Wentzcovitch [80]), a much larger difference in the KT values, ~10.3%, is found. Similarly comparable KT values of the spinel and the CaTi2O4-type post-spinel phases with the Zn2TiO4 composition, 162.9(5) versus 171(3) GPa (a 5.0% relative difference; K T = 4; the GGA method), were recently disclosed by Zhang et al. [81]. In comparison, Zhang et al. [82] found a much large difference of ~31.3% in the KT values for the spinel (167.2(12) GPa with K T = 4; diamond-anvil cell compression experiments at room T) and the CaTi2O4-type post-spinel phases (219.6(26) GPa with K T = 4; the GGA method at zero T) with the Co2TiO4 composition. There are however perplexing factors in the latter case, such as Co being a transition metal element and an intermediate phase (CaMg2O4-type Co2TiO4) involved.
For the Fo-IV phase, we have obtained V0 = 260.00 Å3 (fixed), KT = 163.4 GPa and K T = 3.94 (Figure 6d). As expected, our V0 value obtained with the GGA method is slightly overestimated whereas our KT value is slightly underestimated, compared to the values obtained with the LDA method by Zhou et al. [40]. Using our theoretically determined 3rd BM-EoS for the Fo-IV and Fo phases (Table 3 and Table 4), the volume difference at 0 GPa is thus ~12.2%, smaller than the volume difference between the Fo-III and Fo phases (~15.8%).
A linearized 3rd BM-EoS [83] was used to obtain the parameters of the equations of states for the crystallographic axes of the Fo, Fo-II, Fo-III and Fo-IV. The results are also listed in Table 4. Summarily, the most to least compressible axes, in order, are b > c > a for the Fo, a > c > b for the Fo-II, b > a > c for the Fo-III, and c > a > b for the Fo-IV. Our theoretically constrained anisotropic compressibility for the Fo is therefore well in line with the experimental results such as Downs et al. [71], Finkelstein et al. [37] and Zha et al. [74].

3.3. Phase Relations at High P and 0 K

With their nearly hydrostatic compression experiments and metadynamics simulations, Finkelstein et al. [37] claimed that the Fo-II and Fo-III phases are energetically metastable compared to their high-T counterparts (Fo, Wds and Rwd), and the Fo phase transforms to the Fo-II phase at ~50 GPa and later to the Fo-III phase at ~58 GPa. By performing ab initio molecular dynamics and DFT calculations (LDA), Zhou et al. [40] predicted that the Fo-IV phase is relatively metastable compared to the Fo phase at P < ~22 GPa, compared to Wds at P < ~35 GPa, and compared to Rwd at P < ~43.46 GPa, but has the lowest enthalpy among these phases at P > ~43.46 GPa.
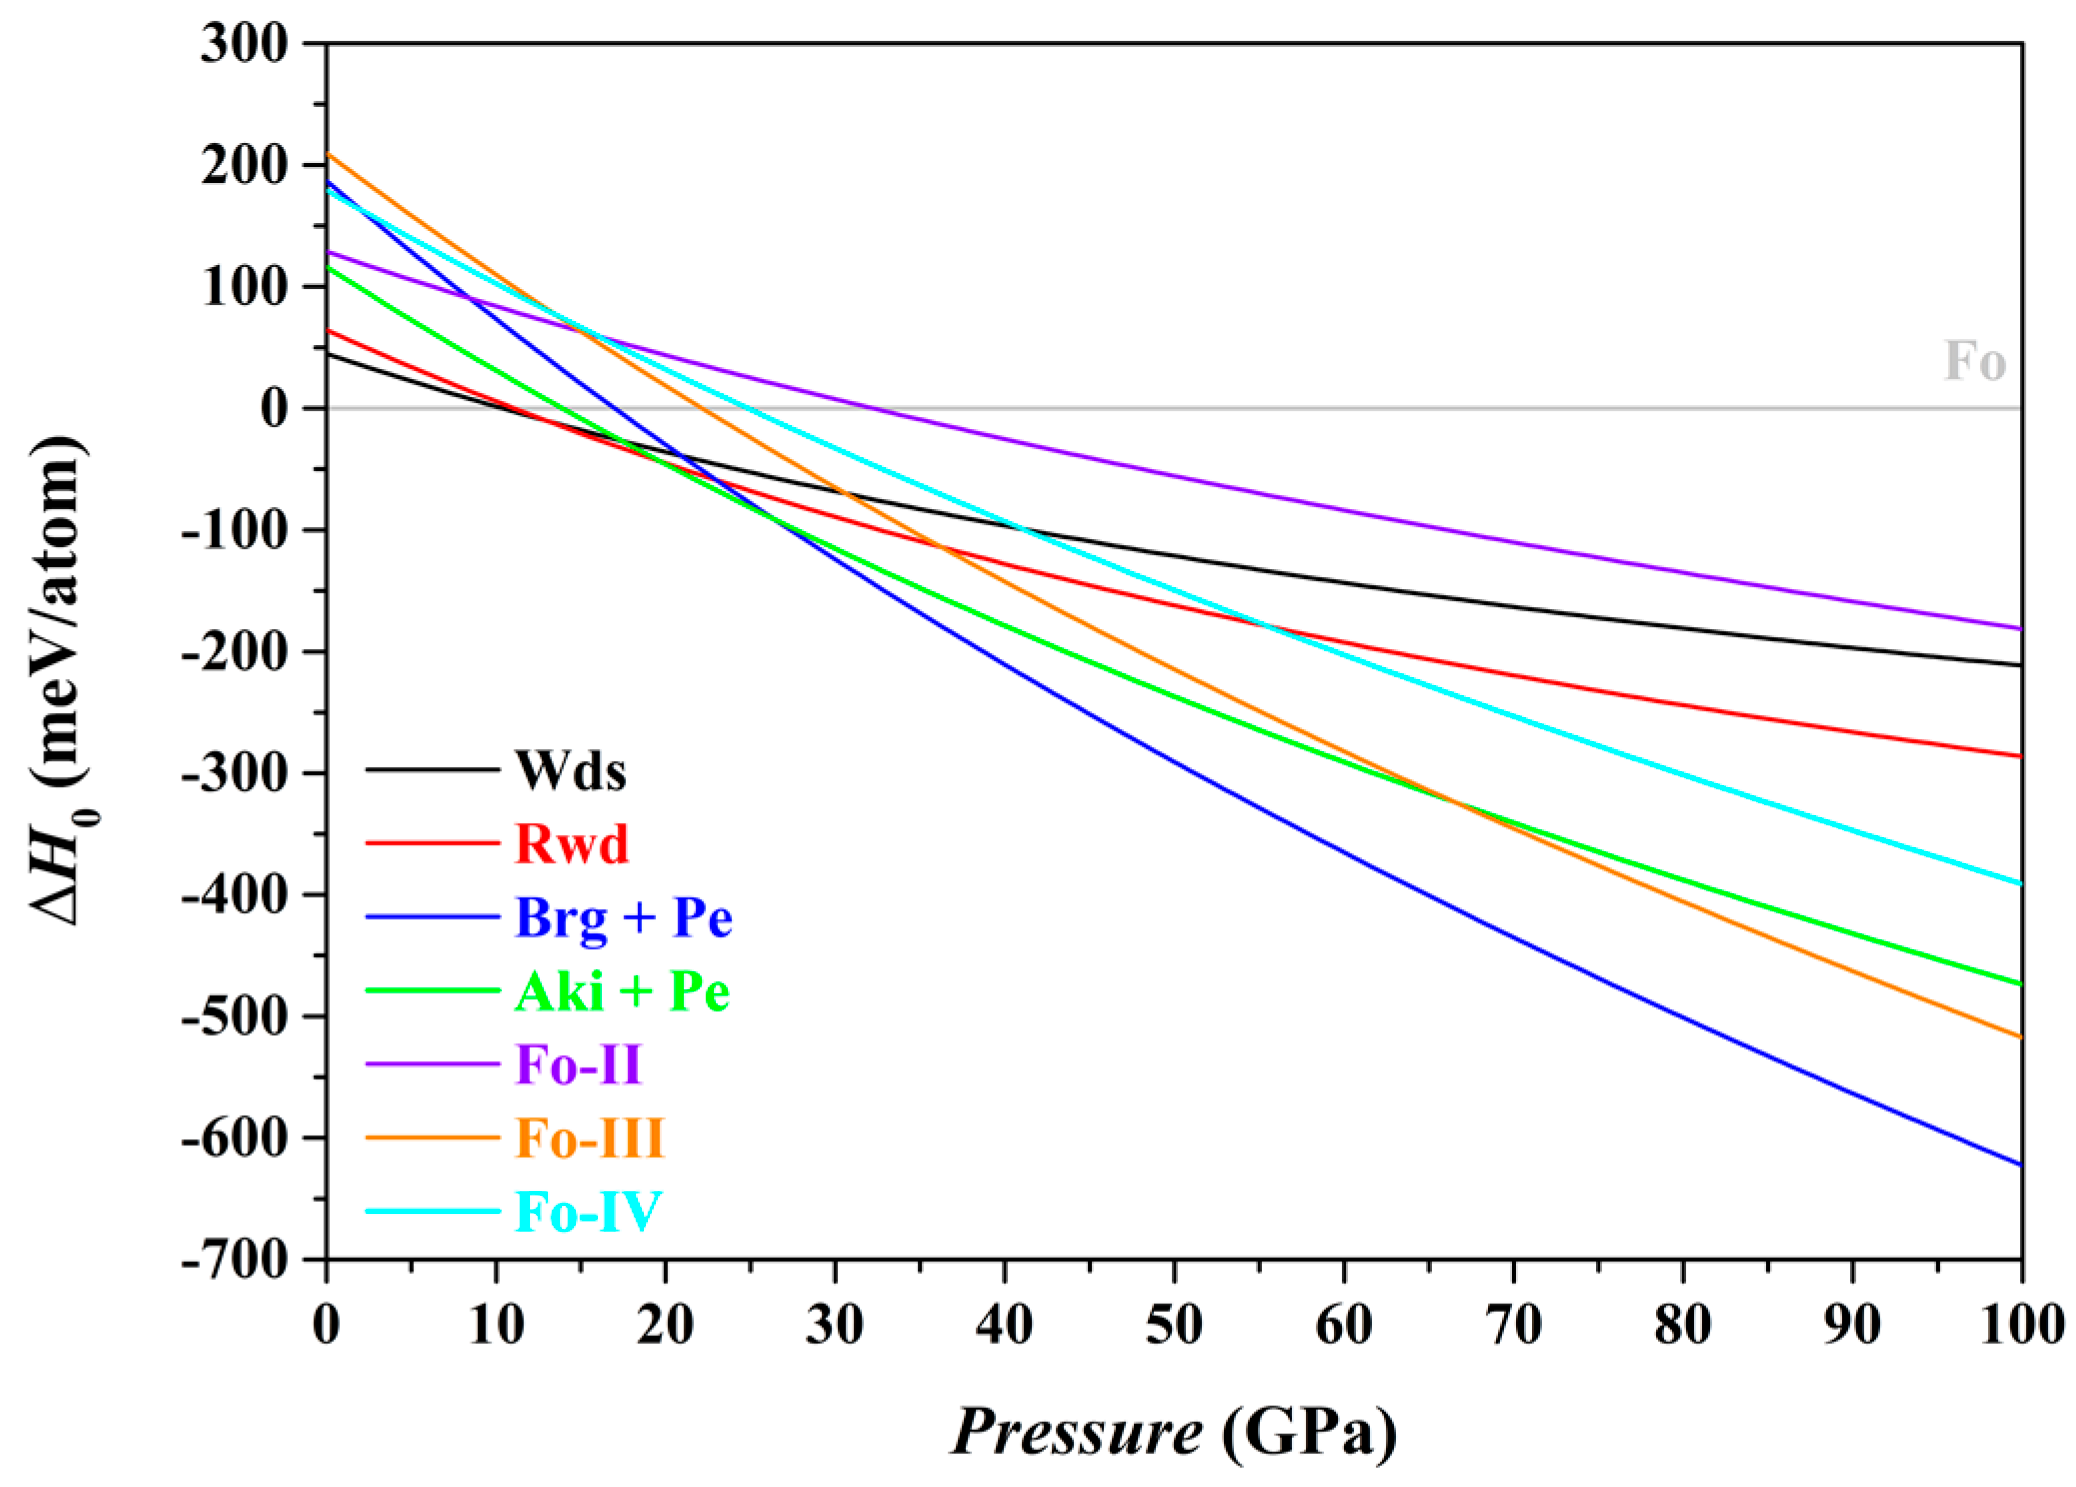
In this study, we have used the optimized structures and corresponding static energies (0 K and 0–100 GPa) for a large number of relevant individual phases, as listed in Table 1, to obtain the zero K enthalpies (H0) of the Fo, Fo-II, Fo-III, Fo-IV, Wds, Rwd, Brg + Pe and Aki + Pe phase assemblages under the constraint of a bulk composition Mg2SiO4, and explored the phase relations among these phase assemblages. The results are summarized in Table 5 and shown in Figure 7.
In terms of the enthalpies at 0 K, the stable phase assemblage for the bulk composition Mg2SiO4 changes from the Fo to the Wds, Rwd, Aki + Pe, and eventually to the Brg + Pe, as P increases from 0 to 100 GPa (Table 5). This result implies that the Fo-II, Fo-III and Fo-IV phases are indeed thermodynamically metastable, in full agreement with Finkelstein et al. [37] and Zhou et al. [40]. Further, it is clear now that the Fo-IV phase does have a lower enthalpy than the Rwd at P > 55.5 GPa (the GGA result; Figure 7) or at P > ~43.46 GPa (the LDA result; Zhou et al. [40]), but has higher enthalpy than the Fo-III, Aki + Pe and Brg + Pe phase assemblages (Figure 7). Zhou et al. [40] did not consider the phase assemblages Fo-III, Aki + Pe and Brg + Pe in their study, so that their simulation was incomplete.
As to the phase relations of the Fo and its polymorphs, Figure 7 shows that for the P interval of ~22.1–24.9 GPa, the Fo-III phase has the minimum difference in enthalpies to the Fo phase, suggesting a possible formation of the Fo-III phase directly from the Fo phase. At P > ~32.2 GPa, Figure 7 indicates that the Fo-II phase has the minimum difference in enthalpies, and might readily form from the Fo staring material due to the small energy barrier. At all P > ~22.1 GPa, further, the Fo-III phase has the lowest enthalpy among the phases Fo, Fo-II, Fo-III and Fo-IV (Figure 7). Provided that the Fo-II phase does not break down to the phase assemblages such as the Brg + Pe and Aki + Pe, it eventually transforms to the Fo-III phase. These theoretically calculated phase transition sequences, Fo → Fo-III in the P interval of ~22–24.9 GPa and Fo → Fo-II → Fo-III at P > ~32.2 GPa, are broadly compatible with the experimental observations of Finkelstein et al. [37] and Newman et al. [39]. In the shockwave experiments of Newman et al. [39], the transition pressure for the Fo → Fo-III phase transition was constrained as ~44 GPa, much higher than our predicted values (~22.1–24.9 GPa). This might largely reflect the fact of an extremely short pressurizing duration in the shockwave experiments. Similarly, the Fo → Fo-II → Fo-III phase transitions were observed at much higher P in the hydrostatic compression experiments with the diamond-anvil cell (at P > ~50 GPa; Finkelstein et al. [37]). In this case, the low experimental T (300 K) and short experimental duration (mostly a few days) might have played important roles. Additionally, the Fo-IV phase has the minimum difference in enthalpies to the Fo phase in the P range from ~24.9 to 32.2 GPa (Table 5), presumably suggesting that it might metastably form from the starting material Fo as well, but somehow either be kinetically hindered or missed in the compression experiments.
It should be interesting to examine what metastable phases might form from a different starting material of either Wds or Rwd. According to Figure 7 and Table 5, the Fo-III phase and Fo-IV phase might metastably form from the starting material Wds at 30.6 GPa and 41.1 GPa, respectively; the Fo-IV phase might further transform into the Fo-III phase with a lower enthalpy though. Kleppe et al. [84] hydrostatically compressed hydrous Wds up to ~50 GPa, but did not observe any new framework Raman mode. In comparison, Figure 7 suggests that the Fo-III phase and Fo-IV phase might metastably form from the starting material Rwd at 36.2 GPa and 55.5 GPa, respectively; the Fo-IV might also further transform into the Fo-III phase. Interestingly, Kleppe et al. [85] hydrostatically compressed the Rwd phase to ~56.5 GPa and observed a new framework Raman mode at ~30 GPa (~802 cm−1, as extrapolated to 1 bar). Presently it is unclear whether or not this new Raman mode is associated with any of the potential metastable polymorphs, Fo-III and Fo-IV.
Summarily, the Fo-III phase is by far the most stable metastable Mg2SiO4 polymorph at P > 22.1 GPa on the ground of the zero K enthalpies of the Fo, Fo-II, Fo-III, Fo-IV, Wds, Rwd, Brg + Pe and Aki + Pe phase assemblages (Figure 7), and may play a pivotal role in the high-P phase relations of the composition Mg2SiO4 at very low T.

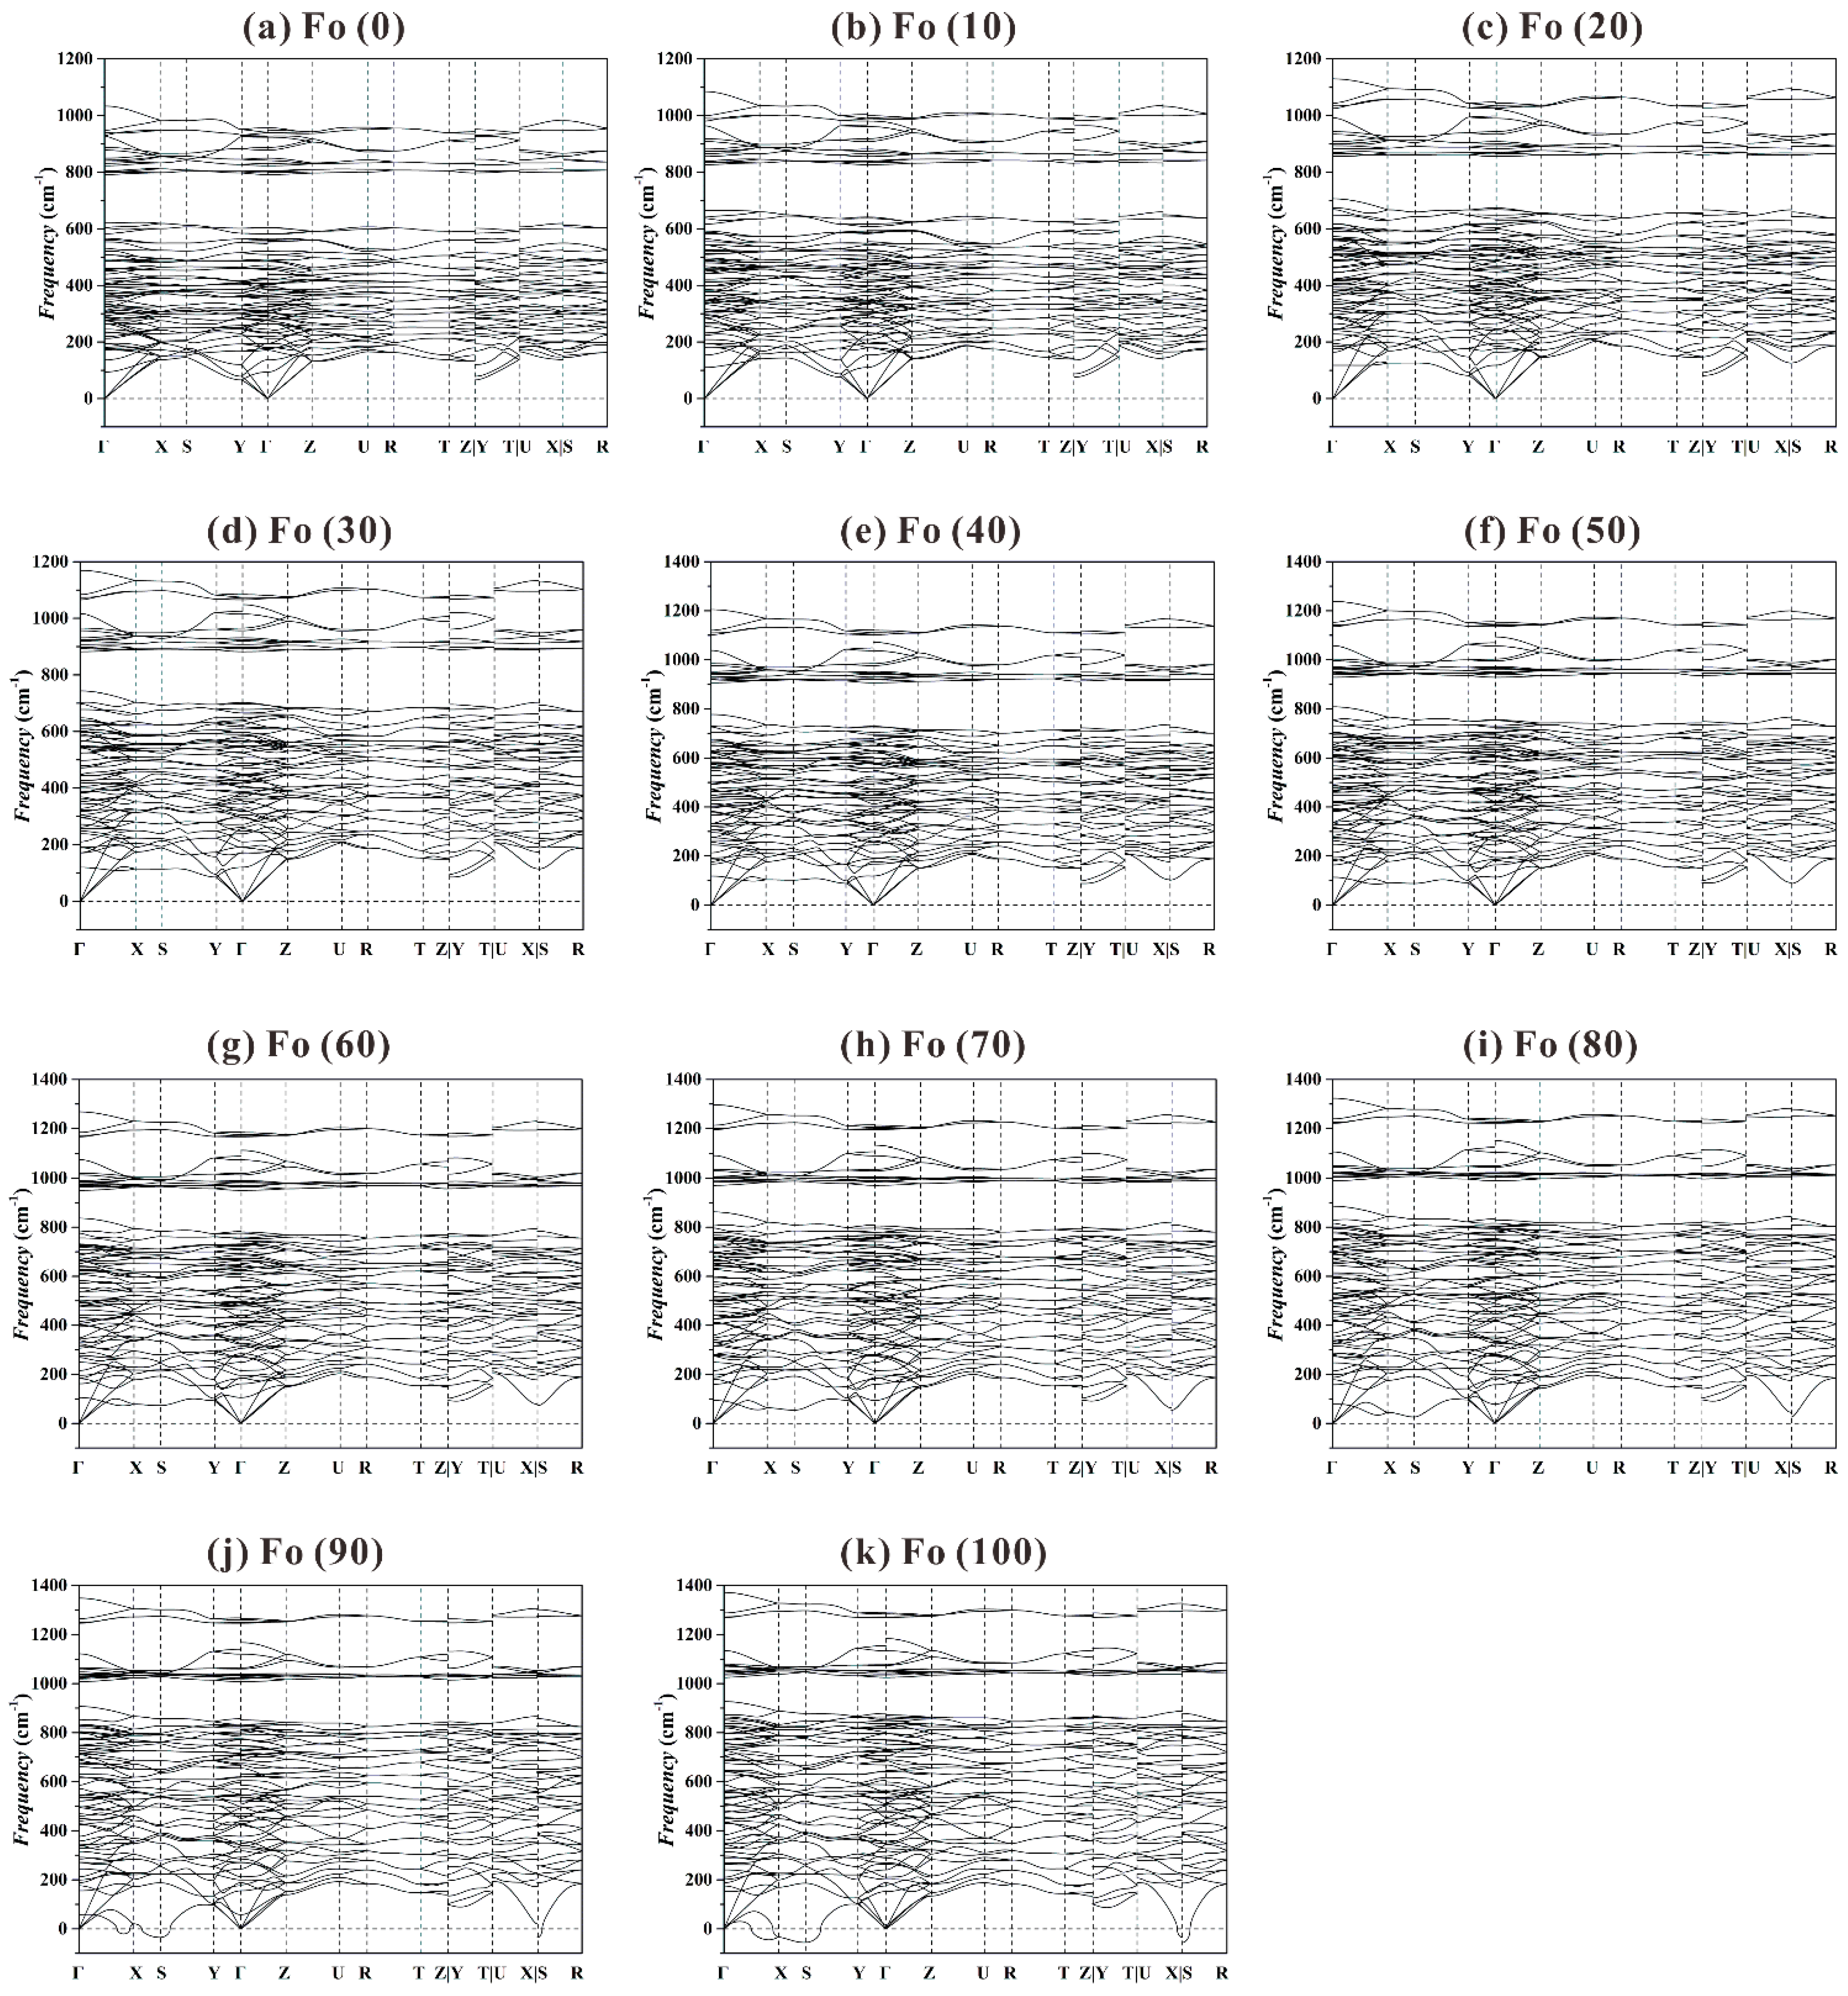
3.4. Dynamic Stability of Fo, Fo-II, Fo-III and Fo-IV

For a dynamically (mechanically) stable crystal, all phonon frequencies (or eigenvalues) should be positive under the harmonic oscillator approximation [63,64]. In other words, any imaginary phonon frequency or negative eigenvalue means a dynamic instability. To examine the dynamic stabilities of the Fo, Fo-II, Fo-III and Fo-IV phases at different P within the harmonic oscillation approximation framework, we have calculated the phonon frequencies at the Γ point in the first Brillouin zone of these structures, and obtained the entire phonon dispersion curves using the PHONOPY code. In addition, the non-analytic term corrections, as outlined by Pick et al. [86], have been described and calculated using the method of Giannozzi et al. [87] and Gonze and Lee [61]. All the calculated dispersion curves are plotted and shown in Figure 8, Figure 9, Figure 10 and Figure 11.
Figure 8 shows that for the P range of 0-80 GPa the Fo structure is dynamically stable, in good agreement with previous theoretical result obtained at P up to 20 GPa [44,75]. At higher P such as 90 and 100 GPa (Figure 8j,k), the phonon dispersion curves display some imaginary phonon frequencies, suggesting a dynamic instability for the Fo structure at P > ~85 GPa.
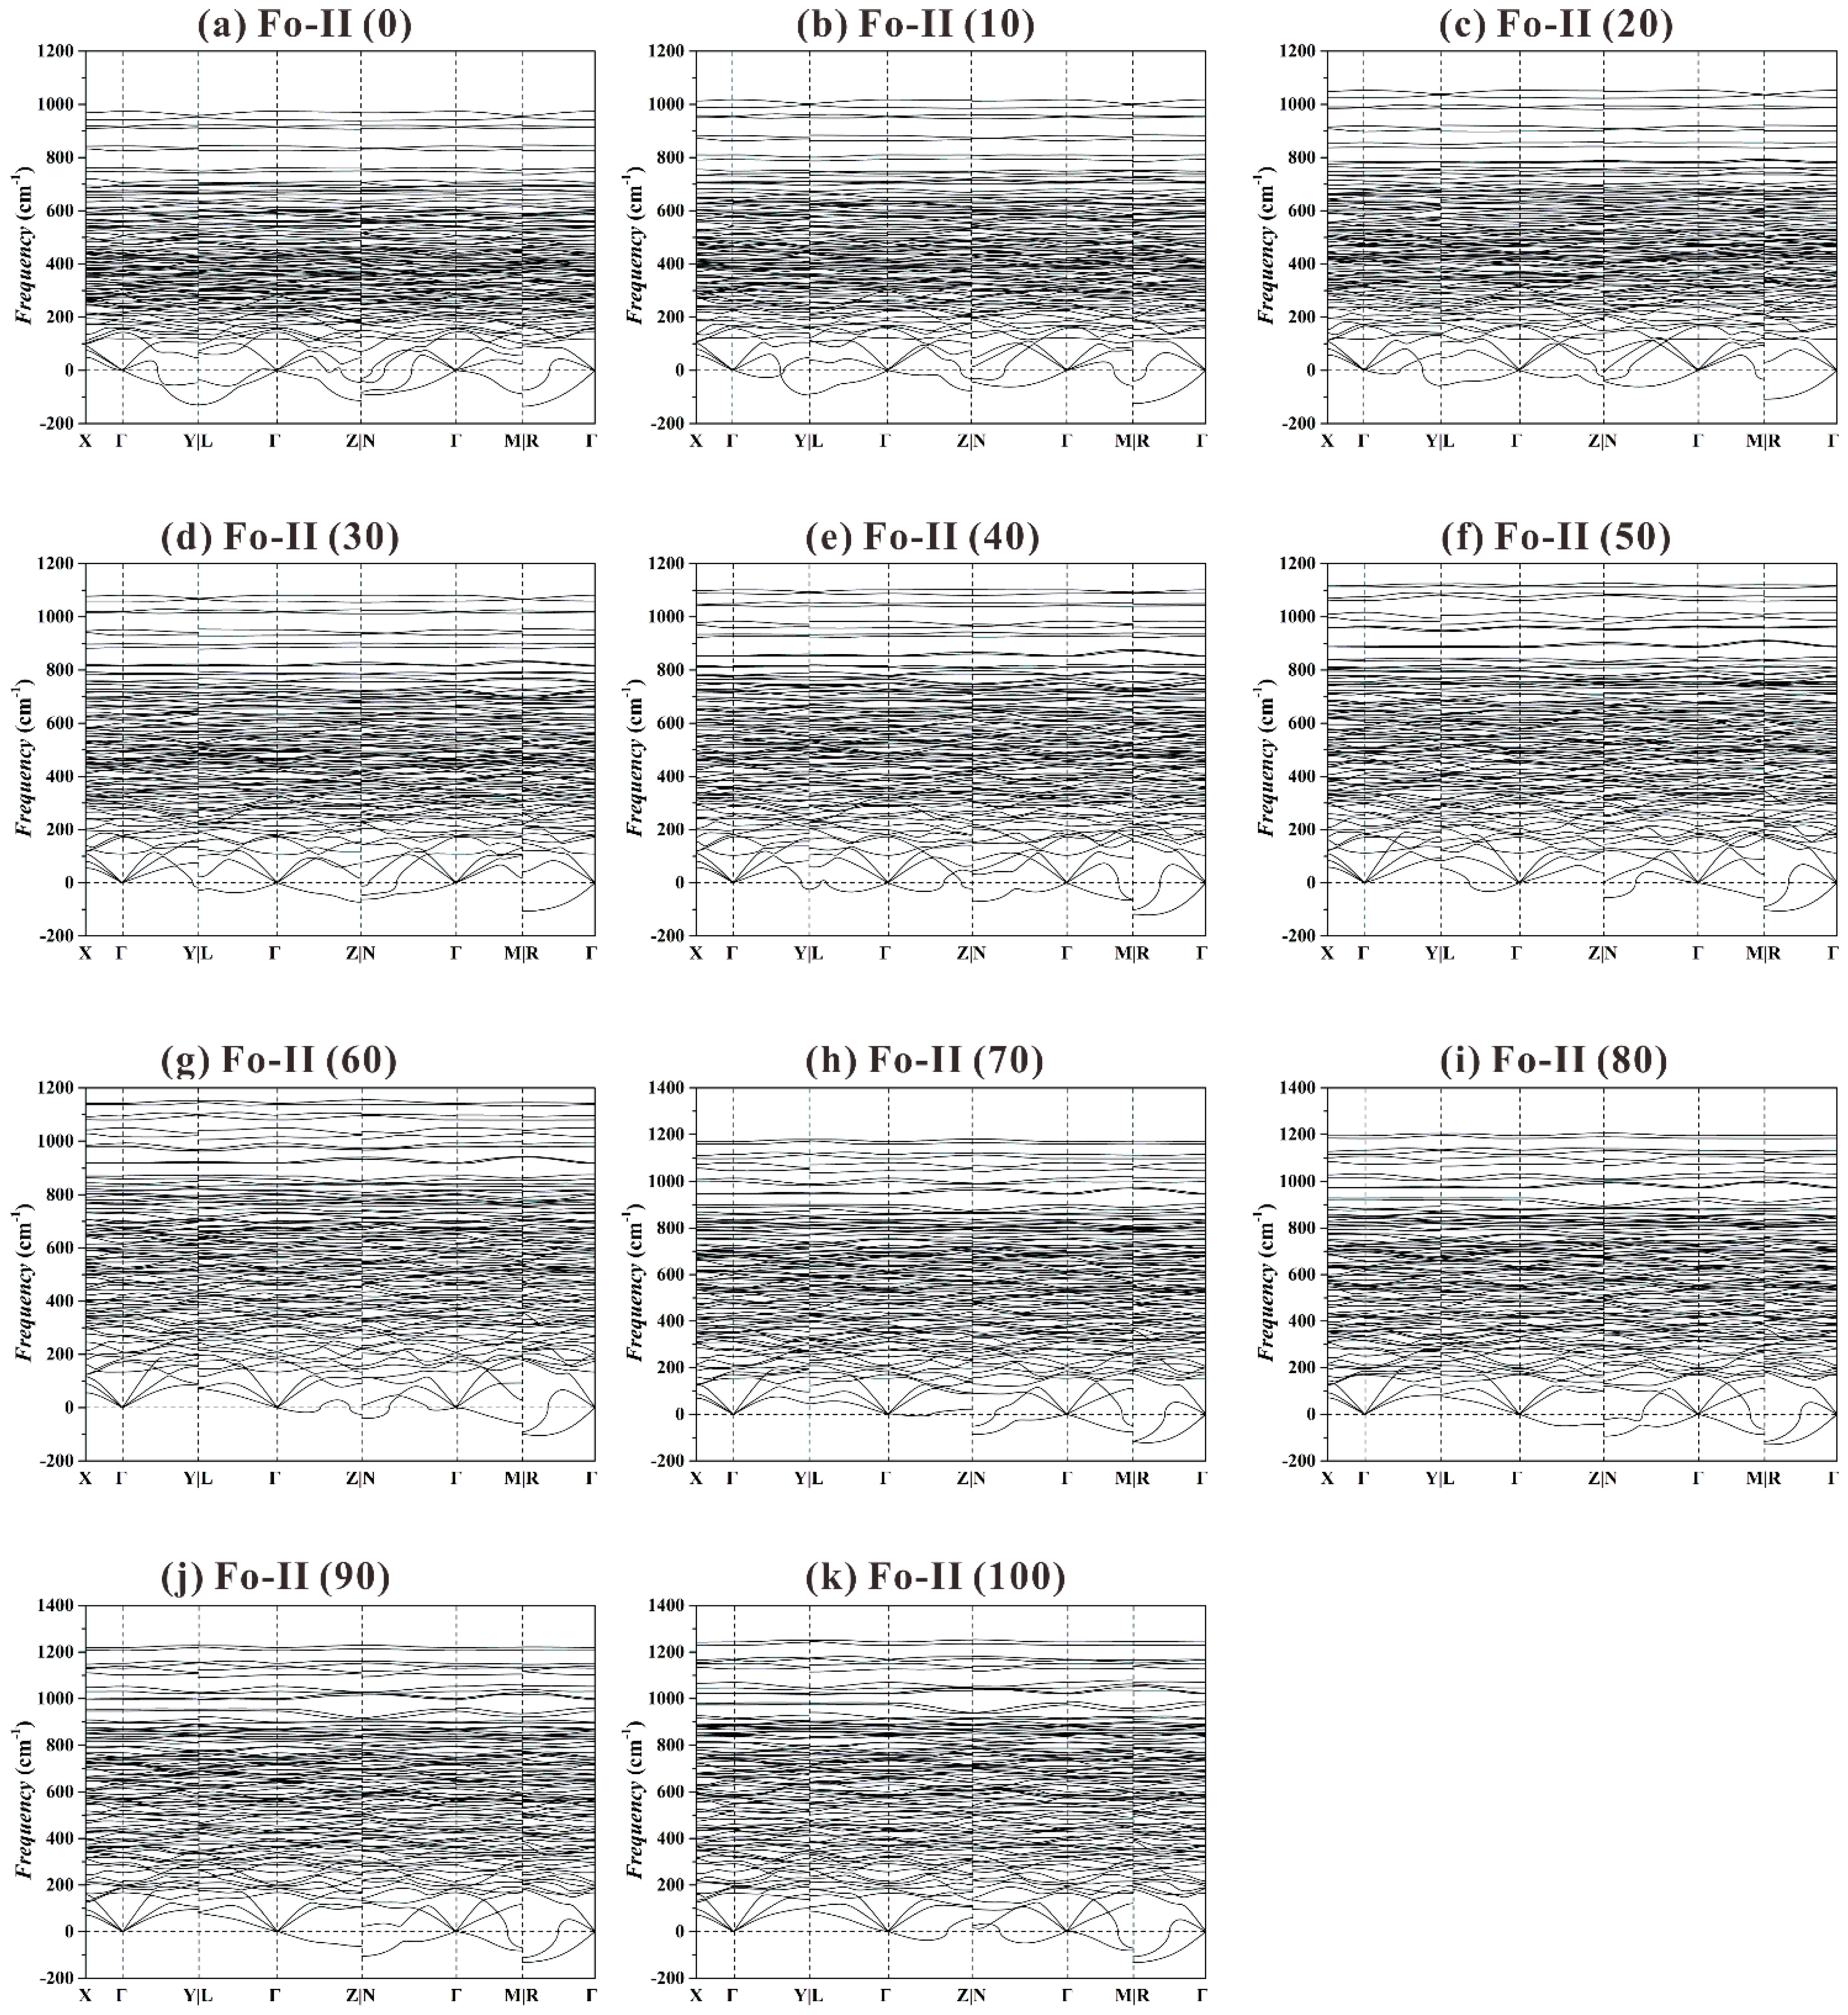
Figure 9 shows the phonon dispersion curves for the Fo-II phase from 0 to 100 GPa. At all these P, a large number of imaginary frequencies have been observed, suggesting a structural instability. This result is generally consistent with the experimental phenomenon that very preliminary XRD data could be obtained for the Fo-II phase at one single P only (~52.4 GPa; Finkelstein et al. [37]).
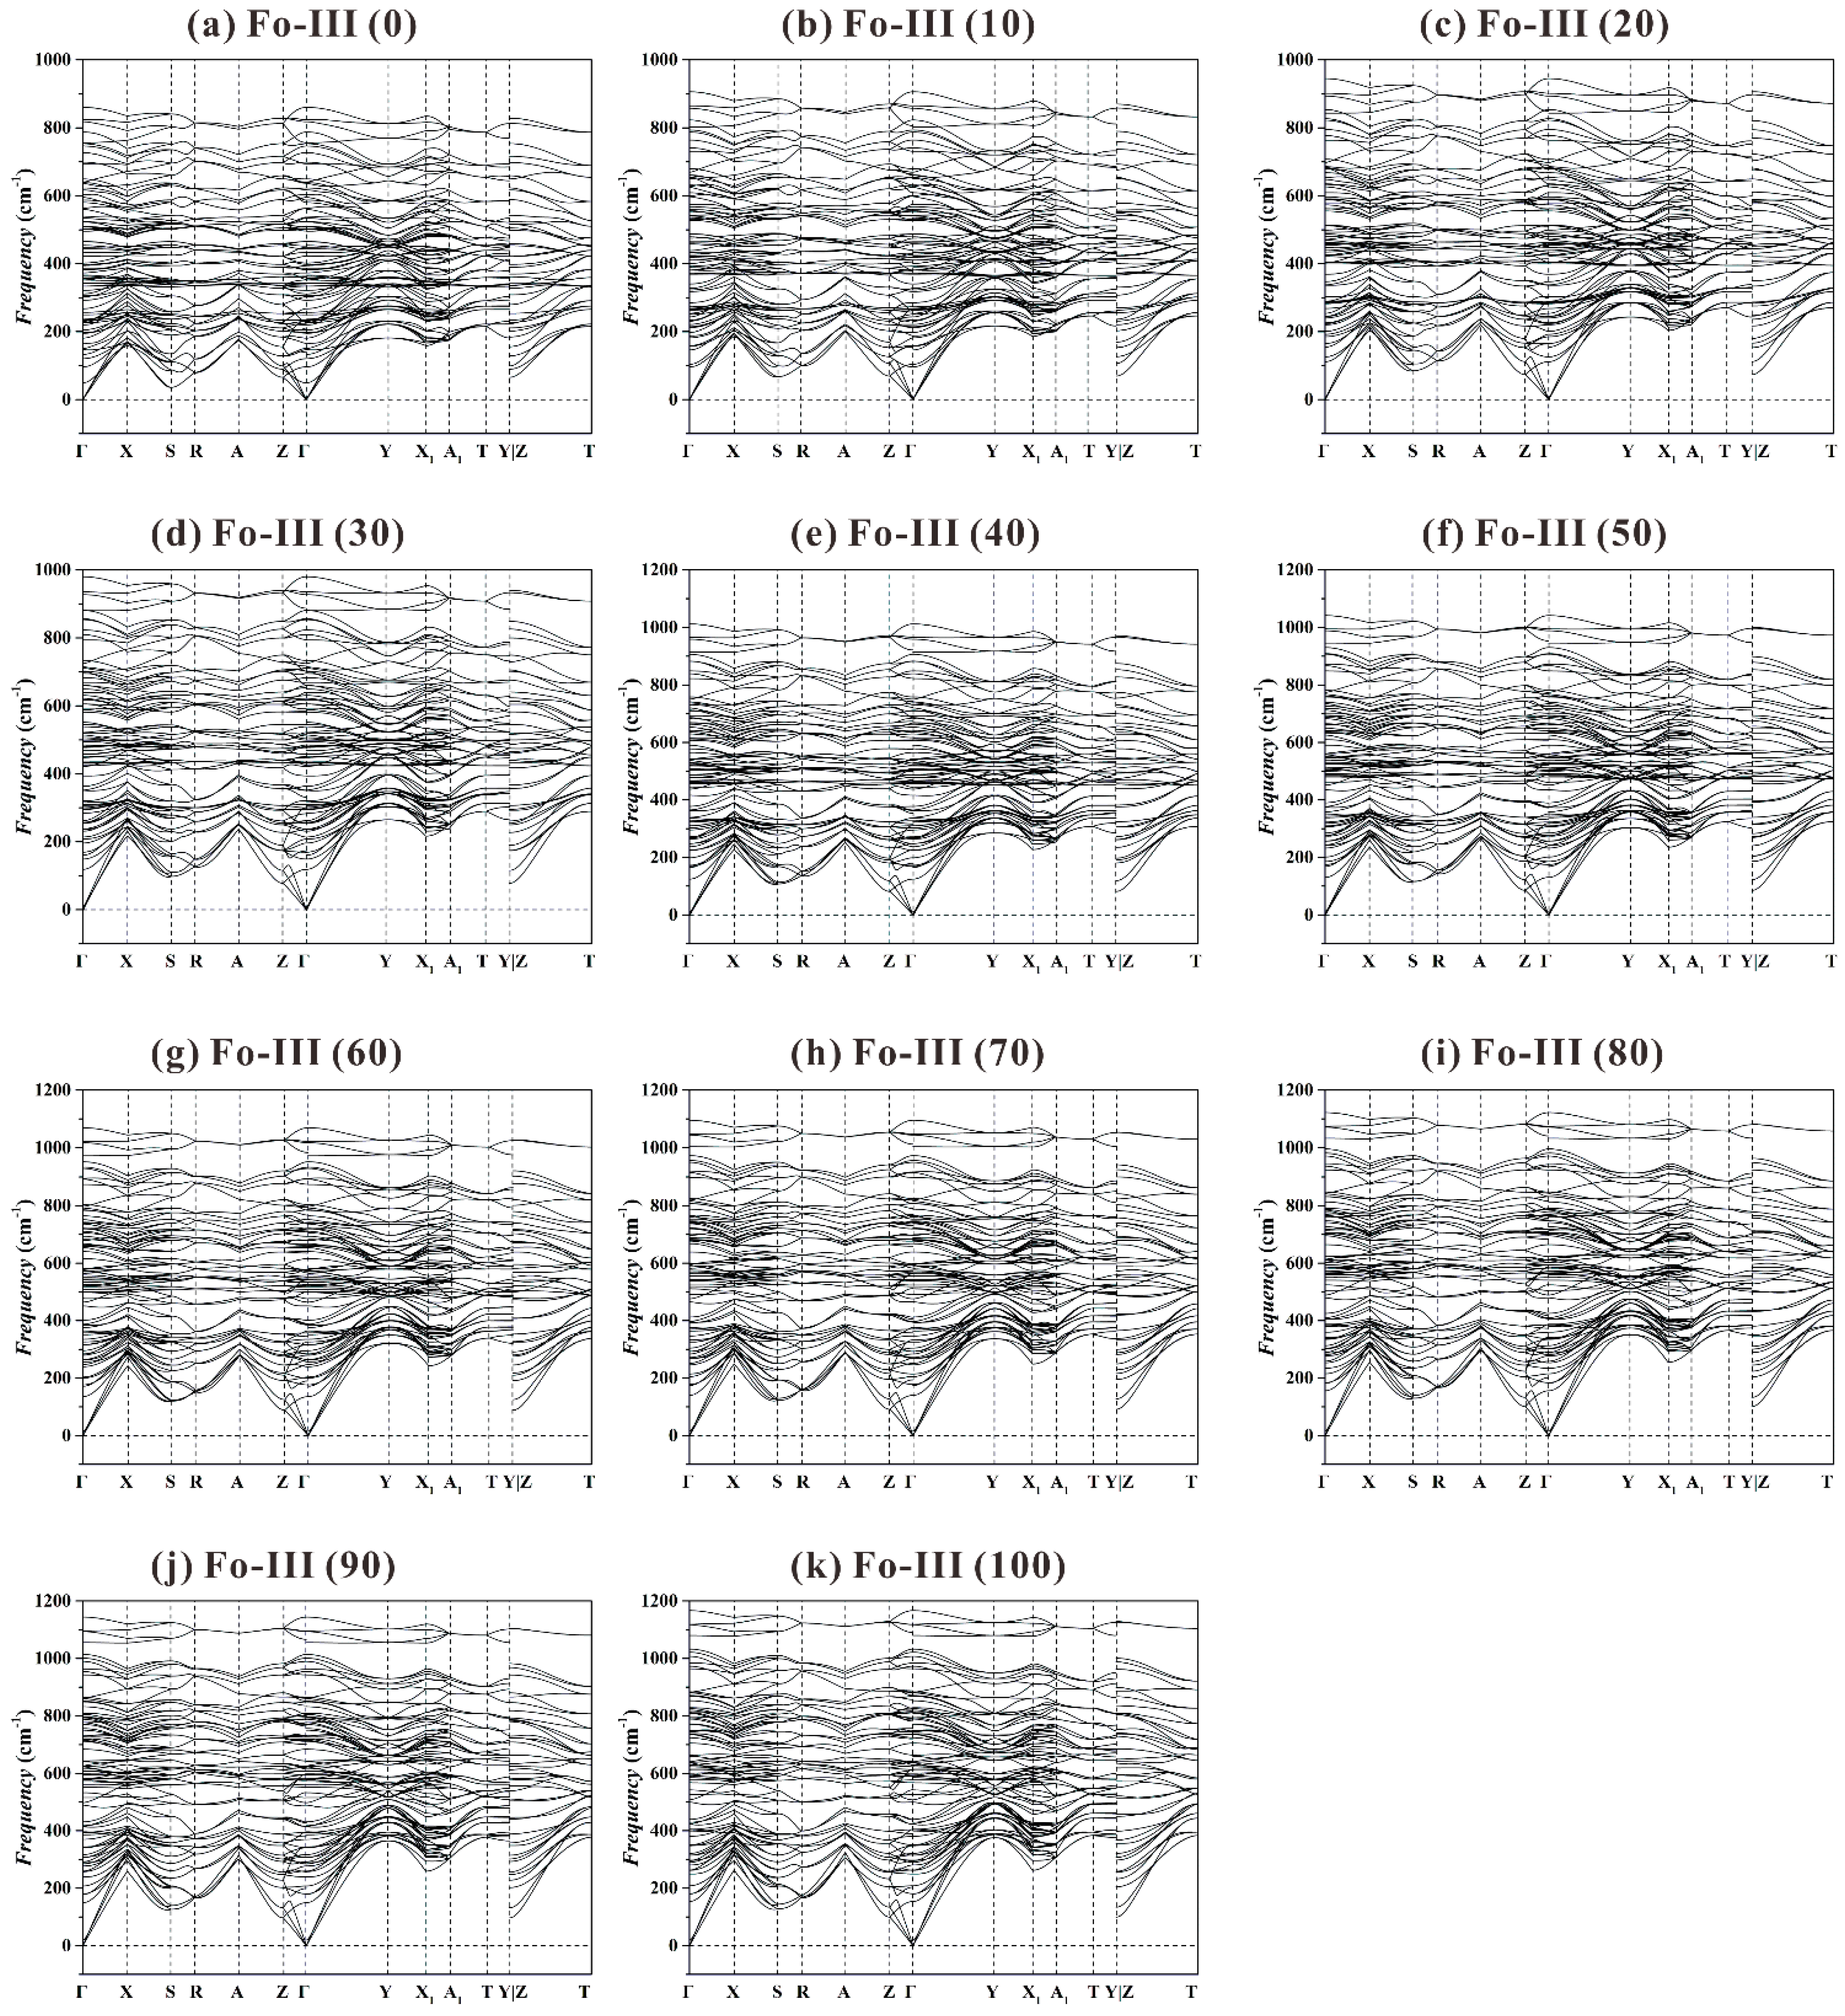
As to the Fo-III phase, we have found no imaginary frequency for the investigated P range from 0 to 100 GPa (see Figure 10). In addition, we do not detect any significant vibrational mode softening at every high-symmetry point along the k-path, which means this phase will remain as dynamically stable under much higher P.
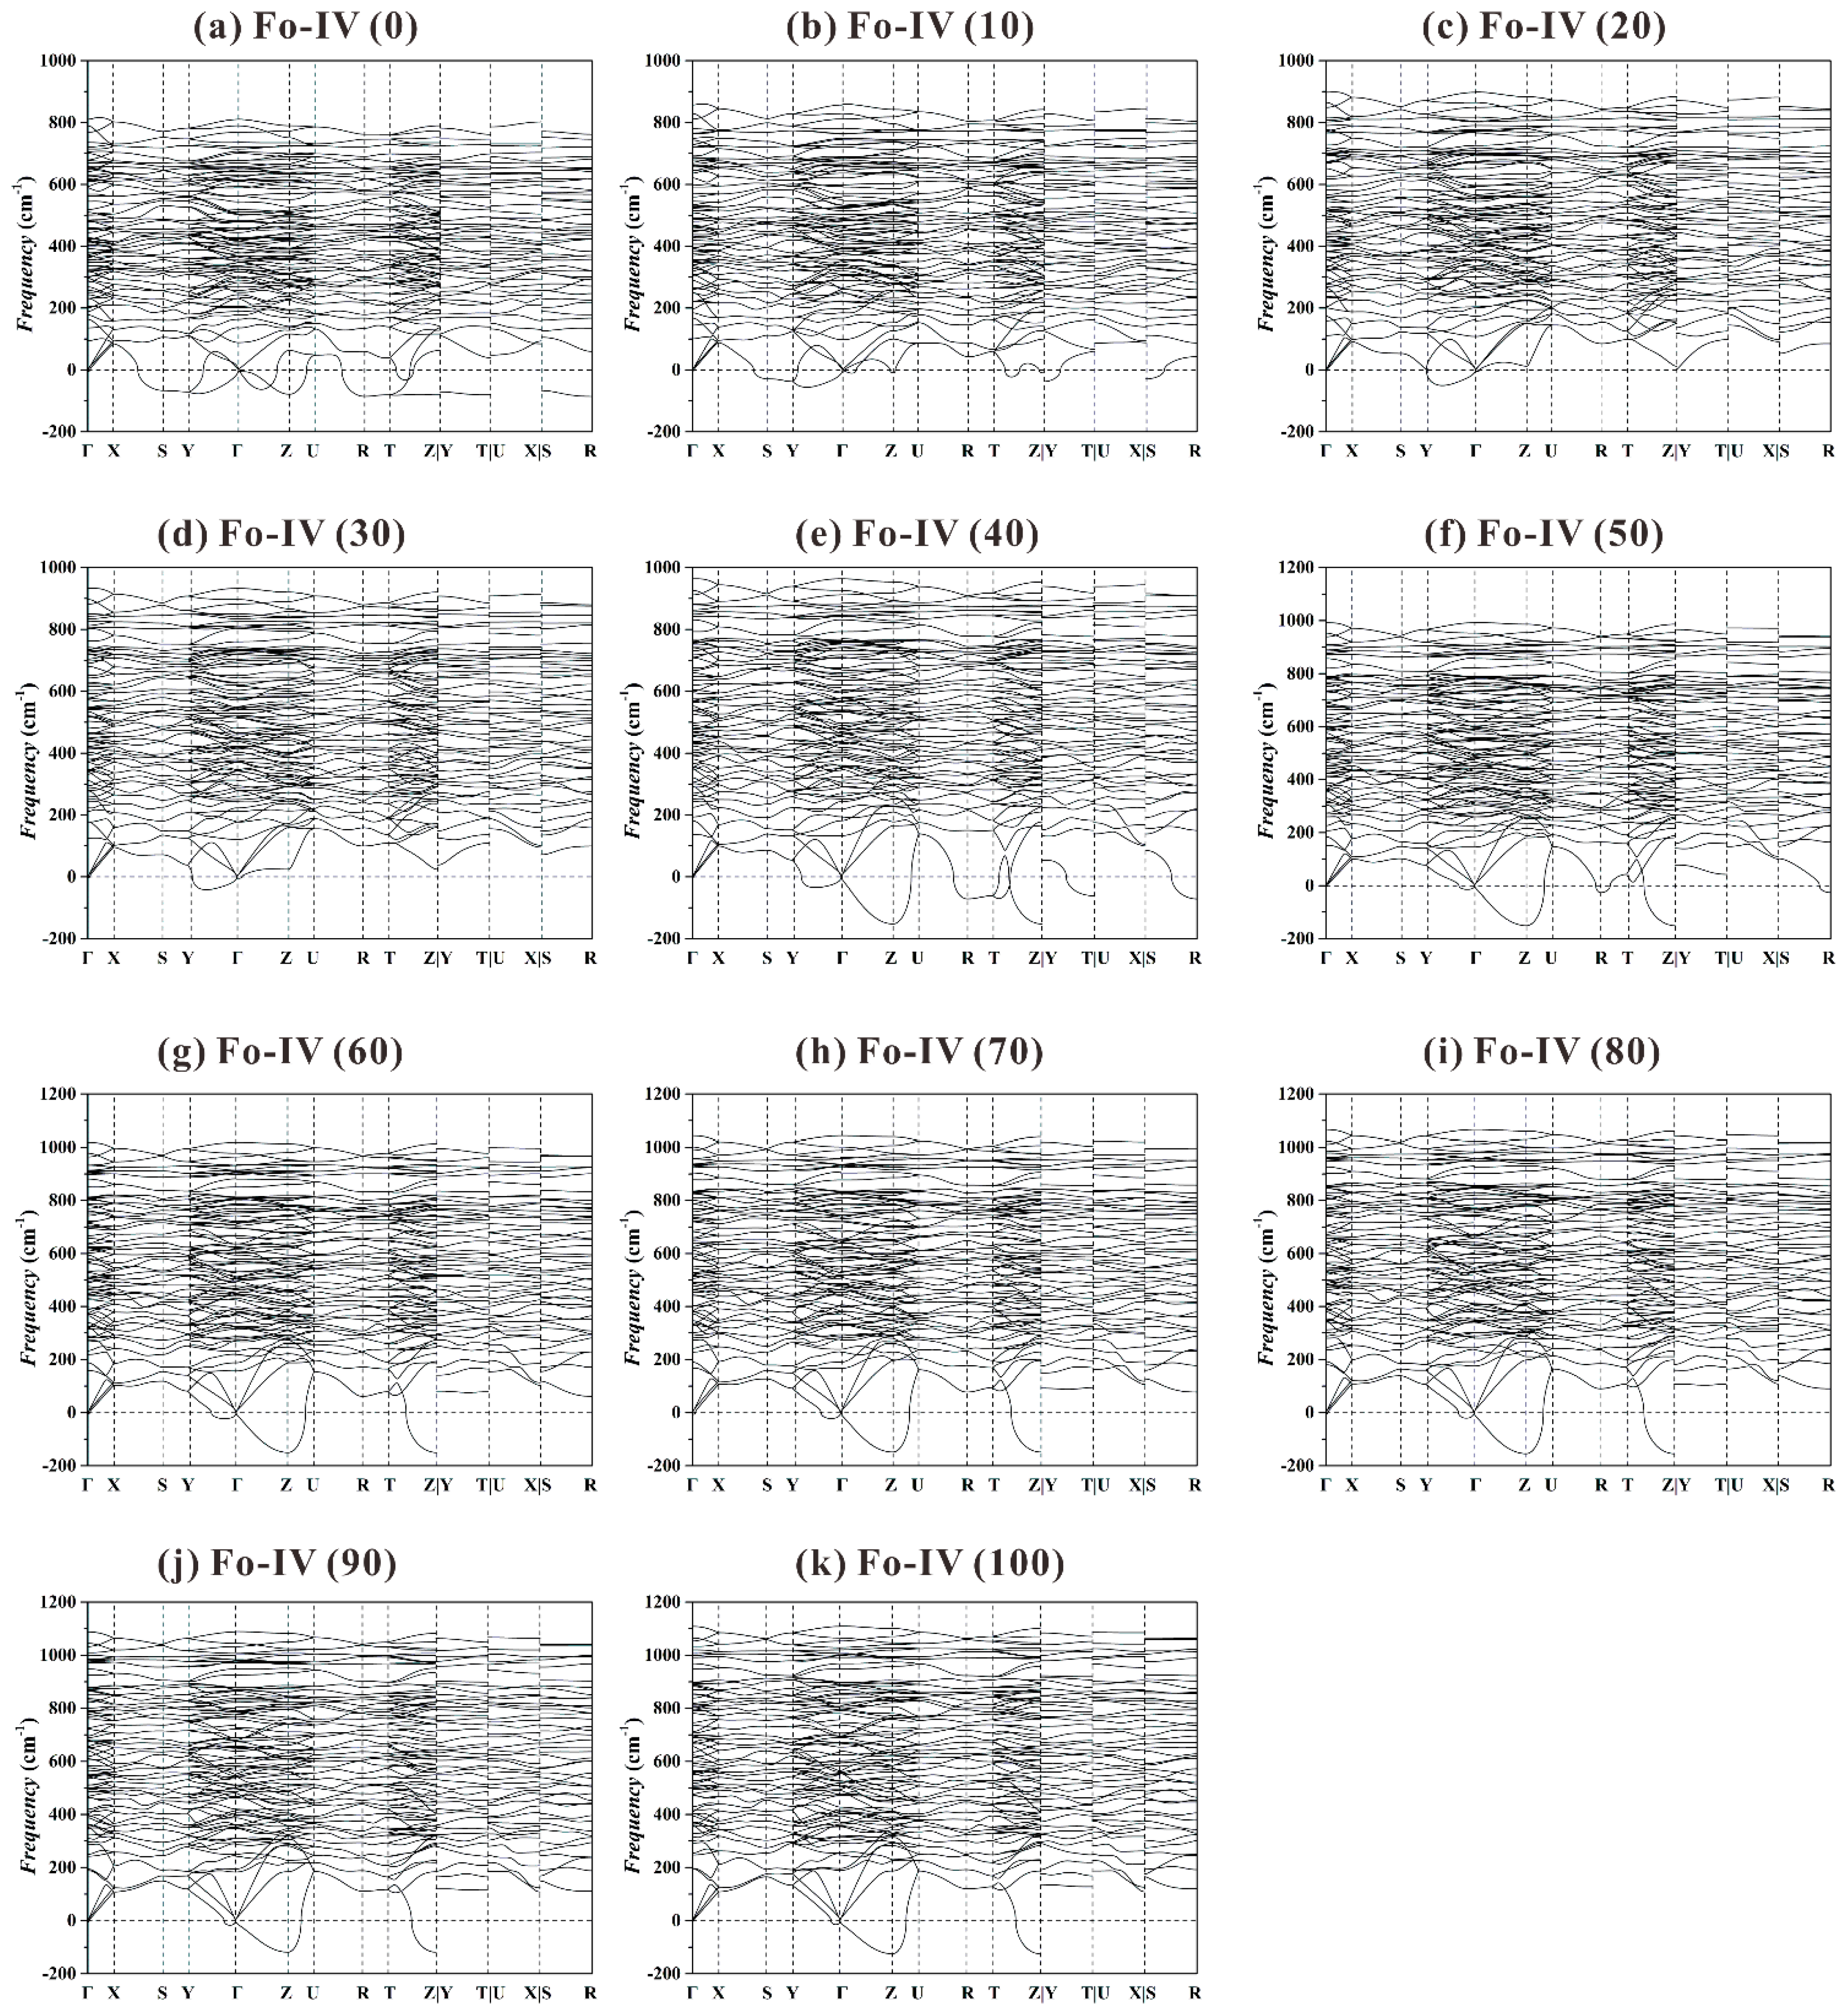
Previous theoretical study showed that the Fo-IV phase was dynamically stable at 44 and 100 GPa (Figure 4 in Zhou et al. [40]). When our phonon dispersion curves (Figure 11) are plotted using a more detailed and complete high-symmetry k-path in the Brillouin zone (Γ-X-S-Y-Γ-Z-U-R-T-Z|Y-T|U-X|S-R; Setyawan and Curtarolo [88]), however, a large number of imaginary frequencies emerge at all P. It follows that the Fo-IV phase is also dynamically instable in the studied P range.
Summarily, our extensive phonon dispersion data suggest that the Fo-III phase is the best candidate as a metastable phase forming from the Fo starting material, and the Fo-II phase is likely an intermediate transitional structure with no dynamic stability. Interestingly, recent shock-wave compression experiments with polycrystalline Fo staring materials performed at 44(3) and 73(5) GPa have showed a direct transformation from the Fo phase to the Fo-III phase, without involving the Fo-II phase (Newman et al. [39]). In addition, the identity of the Fo-IV phase has not been established, either theoretically or experimentally. Nevertheless, the role of the Fo-IV phase is unlikely geologically important due to its much higher enthalpy than the Fo-III phase (Figure 7).

3.5. Thermodynamic Properties of Fo-III

Using calculated phonon dispersion curves and corresponding vibrational densities of state, the thermodynamic properties of one phase can be calculated by the QHA method [44,65,66]. With the PHONOPY code, we have calculated some thermodynamic properties for the Fo, Wds, Rwd, Brg, Aki, Pe and Fo-III phases, such as the Gibbs free energies G, equilibrium volumes V, isothermal bulk moduli KT and their first pressure derivatives K T , adiabatic bulk moduli KS, bulk sound velocities vΦ, thermal expansion coefficients α, thermal Grüneisen parameters γth, entropies S, isochoric heat capacities CV and isobaric heat capacities CP. Due to the dynamic instabilities of the Fo-II and Fo-IV phases, these properties cannot be derived.
Our calculated V, KT, K T , KS, vΦ, α, γth, S, CV and CP at 1 atm and 300 K for the Fo, Wds, Rwd, Aki, Brg, and Pe phases are compared with the experimental results in Table 6. As expected, our results obtained by employing the GGA method show systematic deviations to the experimental results, slightly overestimating the V (maximally by 4.4%) and consequently underestimating the KT (maximally by 13.8%), KS (maximally by 14.5%) and vΦ (maximally by 5.5%). In addition, our calculated S, CV and CP closely match the experimentally determined values, with an utmost difference of ~13.3%, 5.6% and 6.1%, respectively. Further, the largest deviation between our calculated results and the experimental determinations comes with the α (minimally by 9.4%), which is presumably largely due to the low accuracies in the experimental results. Overall, we believe that the thermodynamic properties of the Fo, Wds, Rwd, Aki, Brg, and Pe phases have been well simulated in this study. This claim is strongly supported by the excellent agreement between our values and those obtained by Hernandez et al. [44] using similar theoretic techniques (the GGA method) but with slightly different simulating parameters (e.g., the planewave cutoff energy of 500 eV): for the Fo, Wds, Rwd, Aki, Brg and Pe phases, the absolute relative difference is ~1.9–19.9% for the α, ~0.7–2.1% for the S, ~0.1–2.2% for the CV, and ~0.1–1.4% for the CP.
The Fo-III phase was experimentally discovered lately [37,39]. More importantly, it formed from the Fo starting materials at very high P (P > ~58 GPa in the hydrostatic compression experiments or P > ~44(3) GPa in the dynamic shockwave experiments), and became amorphous as the experimental P decreased to ambient P. Consequently, nearly all of its thermodynamic properties are presently undetermined.
Our simulated thermodynamic properties of the Fo-III phase, as obtained by employing the GGA method, are listed in Table 6. To provide better constraints, these properties have been additionally calculated using the LDA method; this practice is deemed necessary because most thermodynamic properties of this phase cannot be experimentally measured, and because the LDA method has better performance in predicting mineral physical properties than the GGA method. The results obtained by these two methods for 1 atm and 300 K are compared in Table 6. The relative differences between these two sets of values are ~6.1%, −18.2%, −17.8%, −5.2%, 17.4%, 4.2%, 11.5%, 4.2% and 4.6% for the V, KT, KS, vΦ, α, γth, S, CV and CP, respectively. The true values of these thermodynamic properties are expected to be somewhere in between these two sets of values obtained by the GGA and LDA methods, presumably closer to the LDA results.
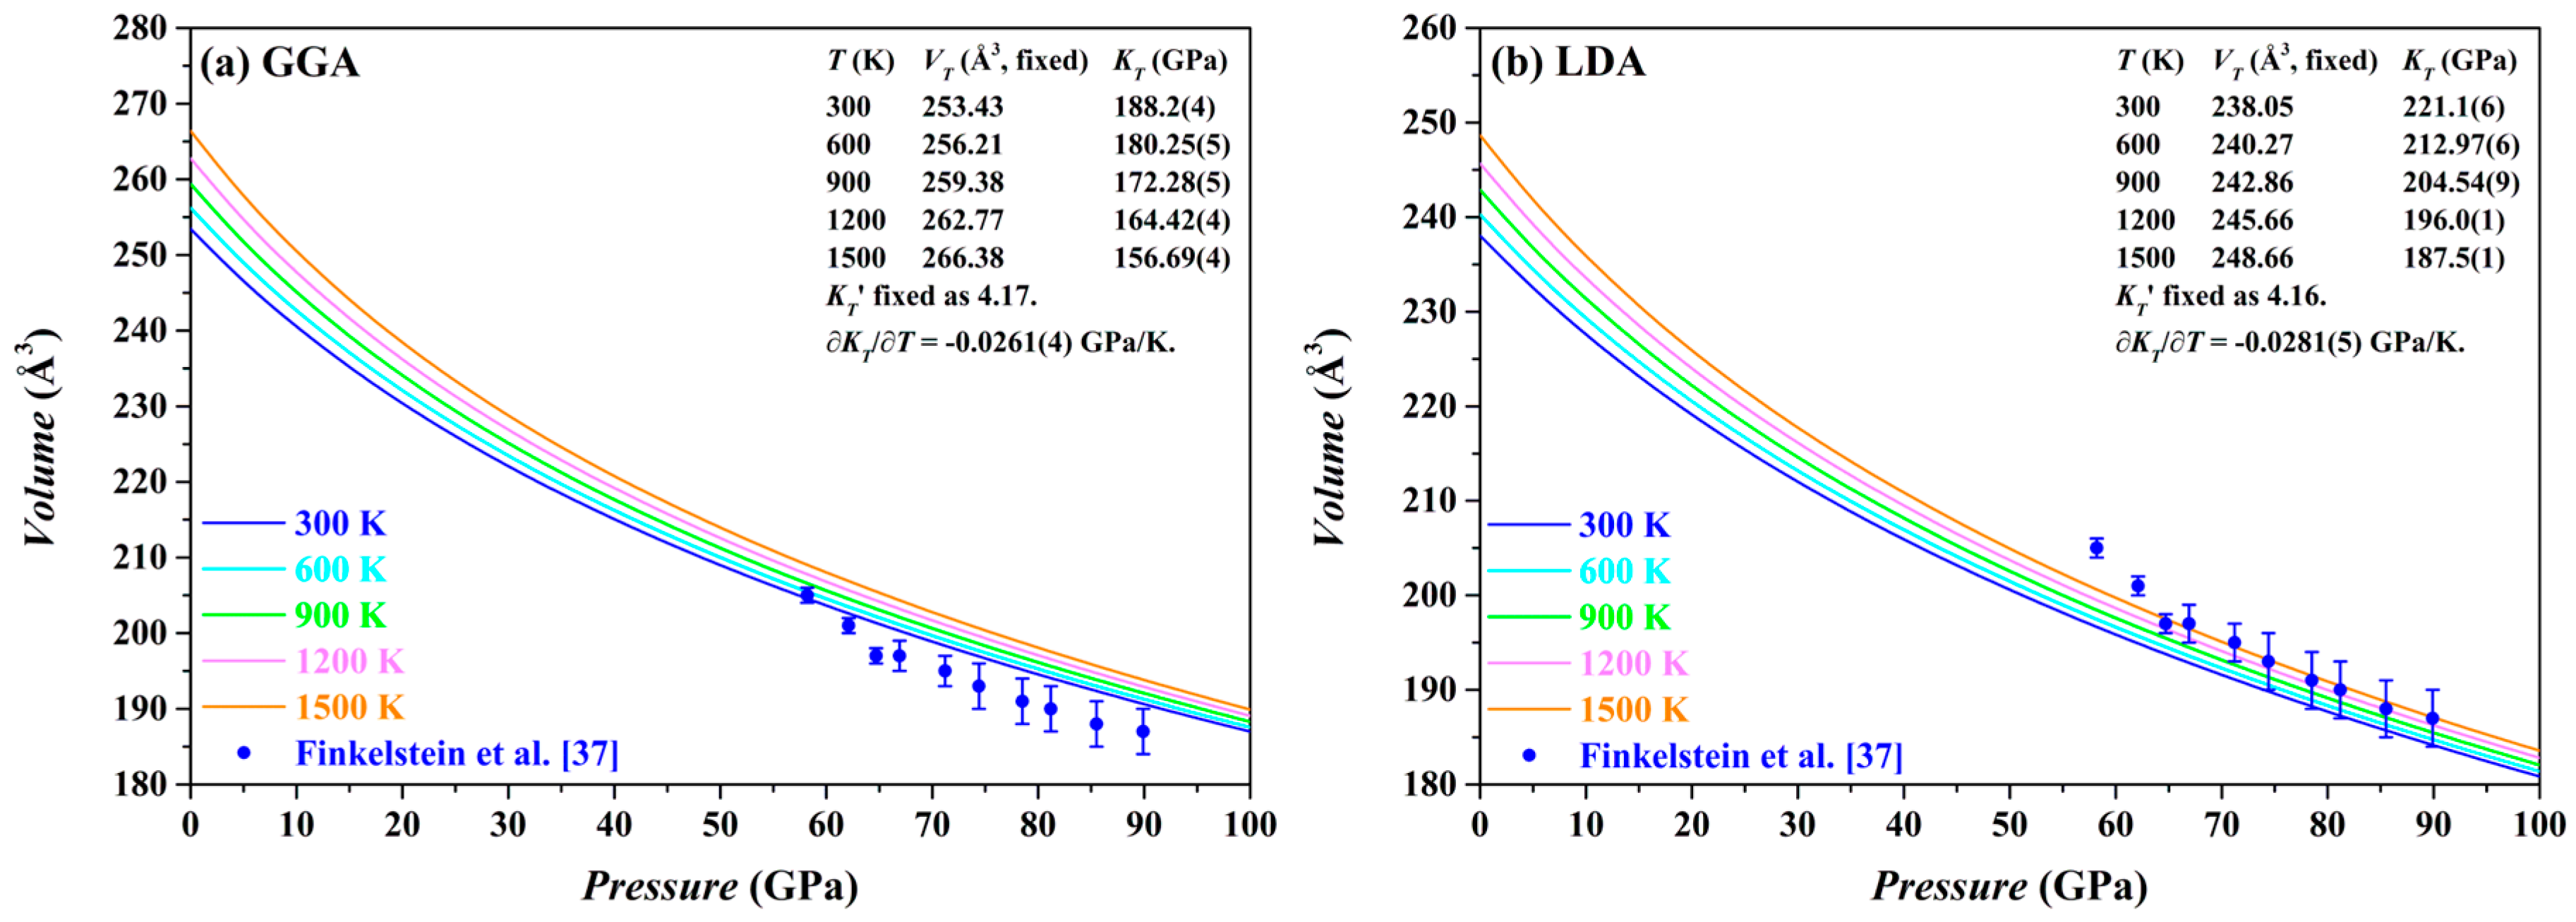
The P-V curves of the Fo-III phase calculated by both the GGA and the LDA methods at 0–100 GPa and 300–1500 K are plotted in Figure 12, along with the relevant parameters. For comparison, the experimental results from Finkelstein et al. [37] are also shown. Usually, the LDA results for the Fo-III phase are expected to be in better agreement with the experimentally observed volumes than the GGA results [44,66]. This is apparently the case for the Fo-III (Figure 12). Comparing our LDA results with the experimental data, it is evident that the experimentally determined volumes have been surprisingly overestimated, by ~1.5% on average, which might be attributable to the high defect density in the Fo-III crystals, as observed by Finkelstein et al. [37].
Our calculated α, γth, CV and CP for the Fo-III phase at 0–100 GPa and 300–1500 K, using both the GGA and the LDA methods, are fitted as polynomial functions of T at different P employing the equations used by Xiong et al. [91]. The only exception is for the γth calculated by the LDA method, in which case we have found that some small modification to the equation used is necessary in order to well reproduce our calculated values. These equations and the fitting constants are listed in Table 7 (the GGA results) and Table 8 (the LDA results). The quality of our data-fitting can be gauged by the average absolute deviation (AAD, %) of the theoretically calculated values and the fitted values. For the α, the AAD increases from ~0.10% at 0 GPa to 0.70% at 100 GPa (GGA) or from 0.13% at 0 GPa to 0.79% at 100 GPa (LDA). For the γth, the AAD increases from ~0.07% at 0 GPa to 0.22% at 100 GPa (GGA) or remains less than 0.03% for all P (LDA). For the CV, the AAD remains less than ~0.56% at all P (both GGA and LDA). For the CP, the AAD decreases from ~1.83% at 0 GPa to 0.18% at 100 GPa (GGA) or from 0.72% at 0 GPa to 0.21% at 100 GPa (LDA). The calculated α, γth, CV and CP for the Fo-III phase are shown in the Supplementary Figures S1–S4.

3.6. Phase Boundaries under High P and High T

The QHA method is a very effective approach to constrain the thermodynamic properties of solid phases at relatively low T [66]. When T is higher than some characteristic value (TC), the phonon-phonon interactions become important, so that the QHA method cannot work properly. It is hence important to determine the TC of every phase in the study system if one aims at an accurate calculation of the phase relations. As suggested by Carrier et al. [65] and Wentzcovitch et al. [92], the TC of certain solid phase may be effectively evaluated by detecting the inflection point of the α-T profile. We have followed this suggestion in this study.
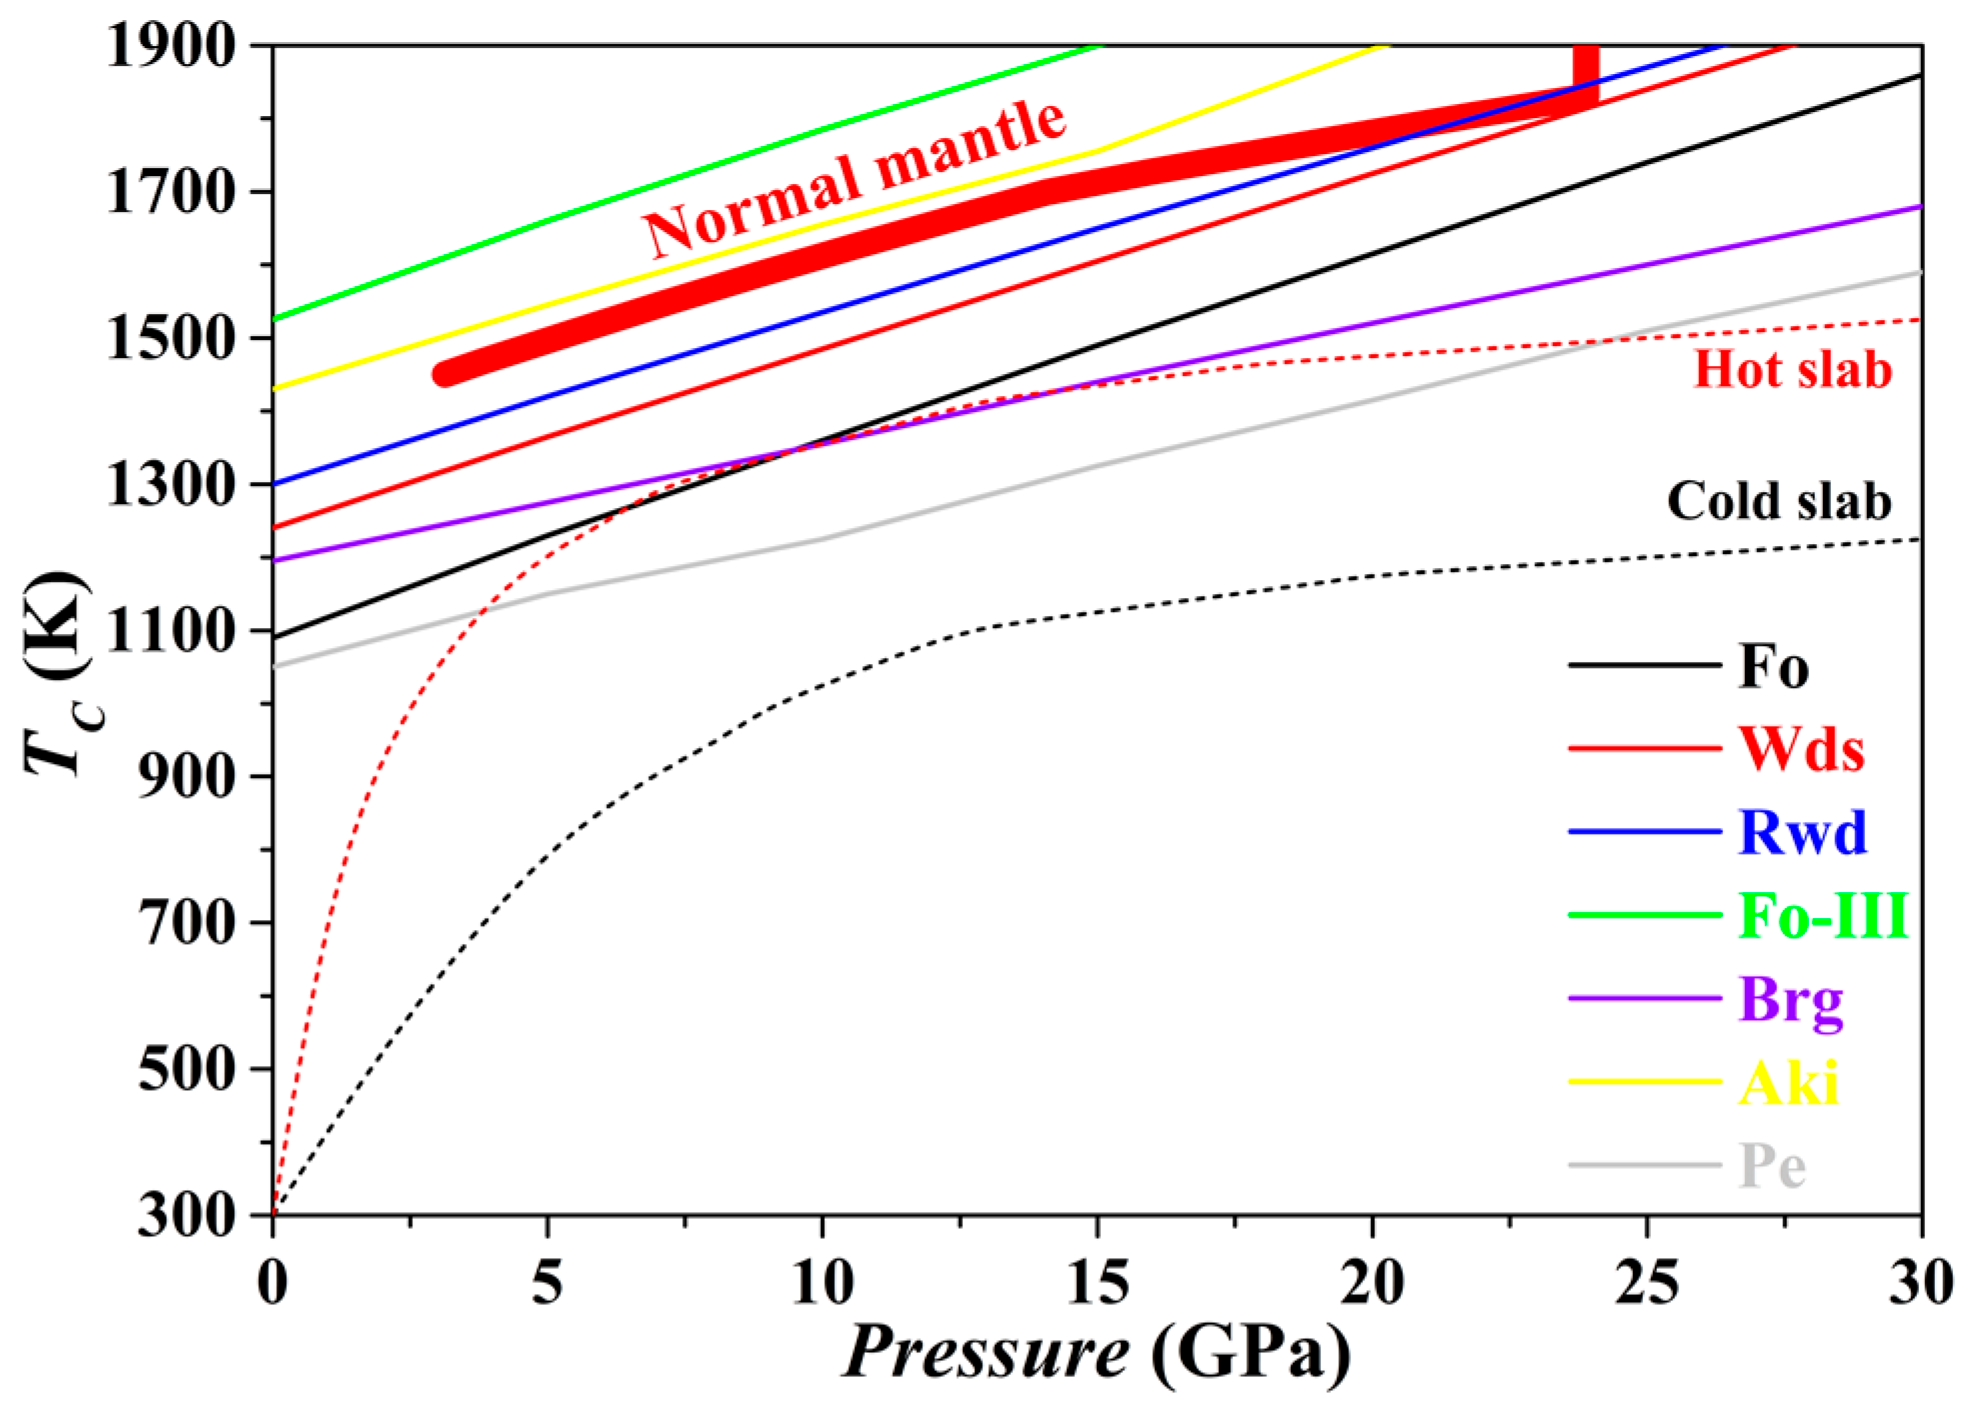
The TC for the Fo, Wds, Rwd, Aki, Brg, Pe and Fo-III phases has been evaluated from 0 to 30 GPa, with the result plotted in Figure 13. For every phase, the TC at 0 GPa is higher than 1000 K. The averaged slope dTC/dP is ~26 K/GPa for Fo, ~24 K/GPa for Wds, ~23 K/GPa for Rwd, ~23 K/GPa for Aki, ~16 K/GPa for Brg, ~18 K/GPa for Pe, and ~24 K/GPa for Fo-III. Further, Figure 13 suggests that with the exceptions of the Fo-III phase and the Aki, all other phases in normal mantle may show various degrees of anharmonicity. As a result, the relevant phase relations calculated with the thermodynamic properties obtained by the QHA method may bear relatively large uncertainty. In contrast, Figure 13 shows that similar phase relation calculation with identical techniques should be generally appropriate for the subducting slabs due to their much low T.
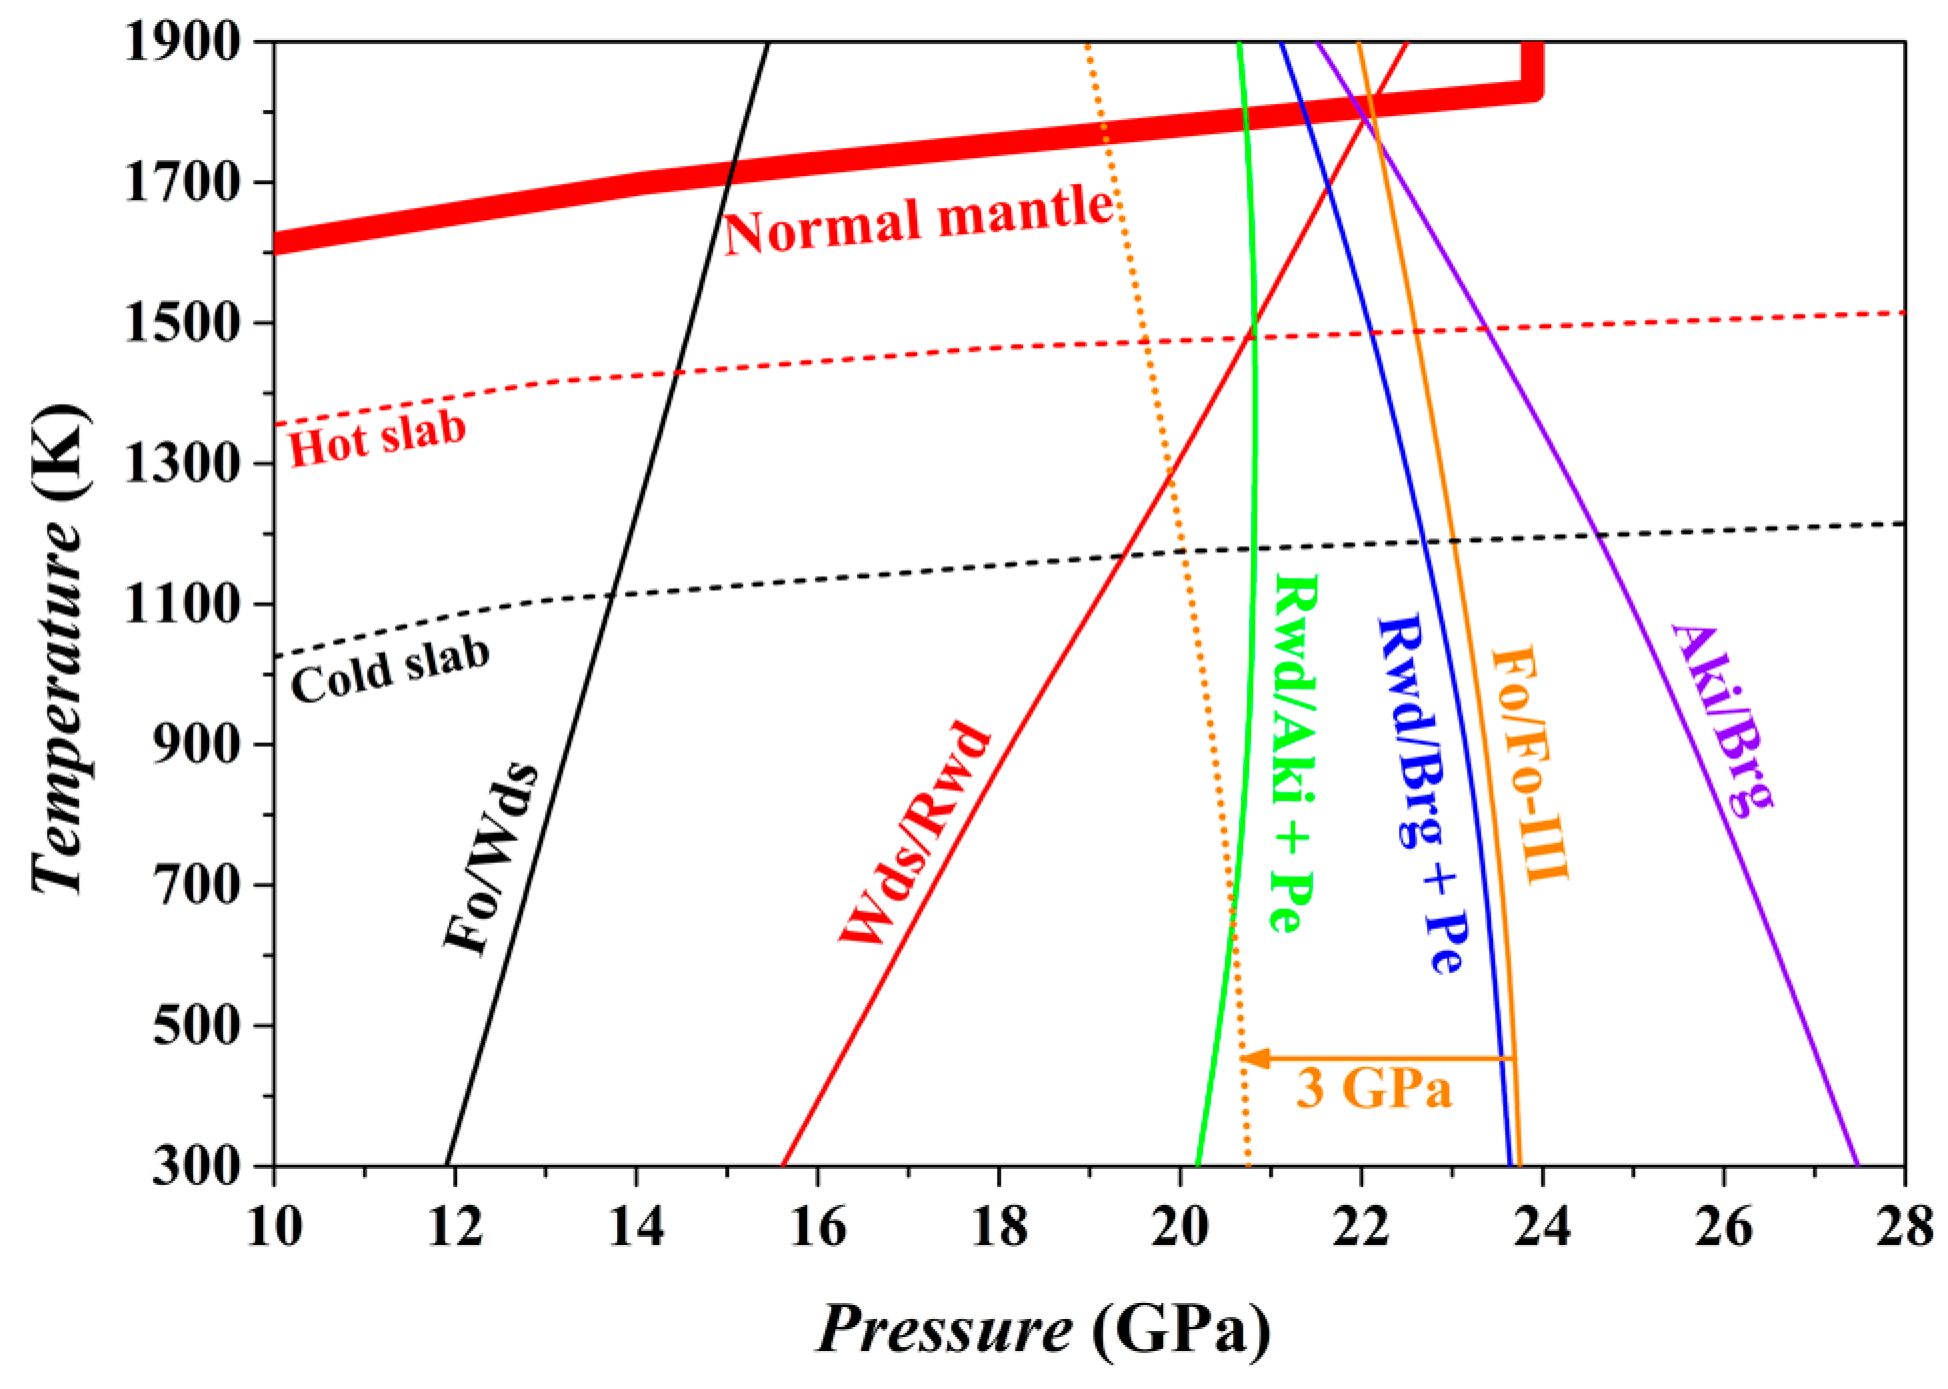
The phase relations of the bulk composition Mg2SiO4 at P conditions from the upper mantle to the uppermost part of the lower mantle have been calculated using the thermodynamic properties theoretically obtained for the Fo, Fo-III, Wds, Rwd, Aki, Brg, and Pe phase. The result is shown in Figure 14.
For the normal mantle temperatures [94], the Fo/Wds phase boundary has been located at ~15 GPa with an average Clapeyron slope (averaged value from 300 to 1800 K) of 2.2 MPa/K, in good agreement with previous experimental and theoretical results [66,95,96,97]. On the contrary, the Wds/Rwd phase boundary locates at ~22.2 GPa and 1800 K with an average Clapeyron slope of 4.2 MPa/K, and the Rwd/Brg + Pe phase boundary locates at ~21.4 GPa and 1800 K with an average Clapeyron slope of −1.5 MPa/K, which obviously contradicts the well-accepted phase transition sequence, Wds → Rwd → Brg + Pe, of the normal mantle in the depth range of ~410–660 km. Indeed, the thus-obtained high-T phase relations possess some uncertainty.
At 300 K, the Fo phase will transform into the Fo-III phase at ~23.75 GPa if other stable phase transition paths are kinetically inhibited (i.e., Fo/Wds, Wds/Rwd and Rwd/Brg + Pe). Since the GGA method often overestimates a phase boundary by ~3 GPa [66], the actual phase transition P between the Fo and Fo-III at 300 K is probably ~21 GPa, which is significantly lower than the Rwd/Brg + Pe phase transition P of the ambient mantle (~24 GPa). Further, the averaged Clapeyron slope for the Fo/Fo-III phase transition has been estimated as −1.1 MPa/K for the T range of 300–1800 K, so that the Fo/Fo-III phase transition P decreases as T increases: taking 900 K as an example, this phase transition P should be reduced by ~0.66 GPa. There are extra factors such as the iron content, stress state and water abundance, which may affect the phase transition P [38]. Additionally, it is worth to point out that this phase transition is endothermic (ΔV = −4.86 cm3/mol and ΔH = ~1.60 kJ/mol at 300 K), which may be beneficial for the slabs to maintain their low T.

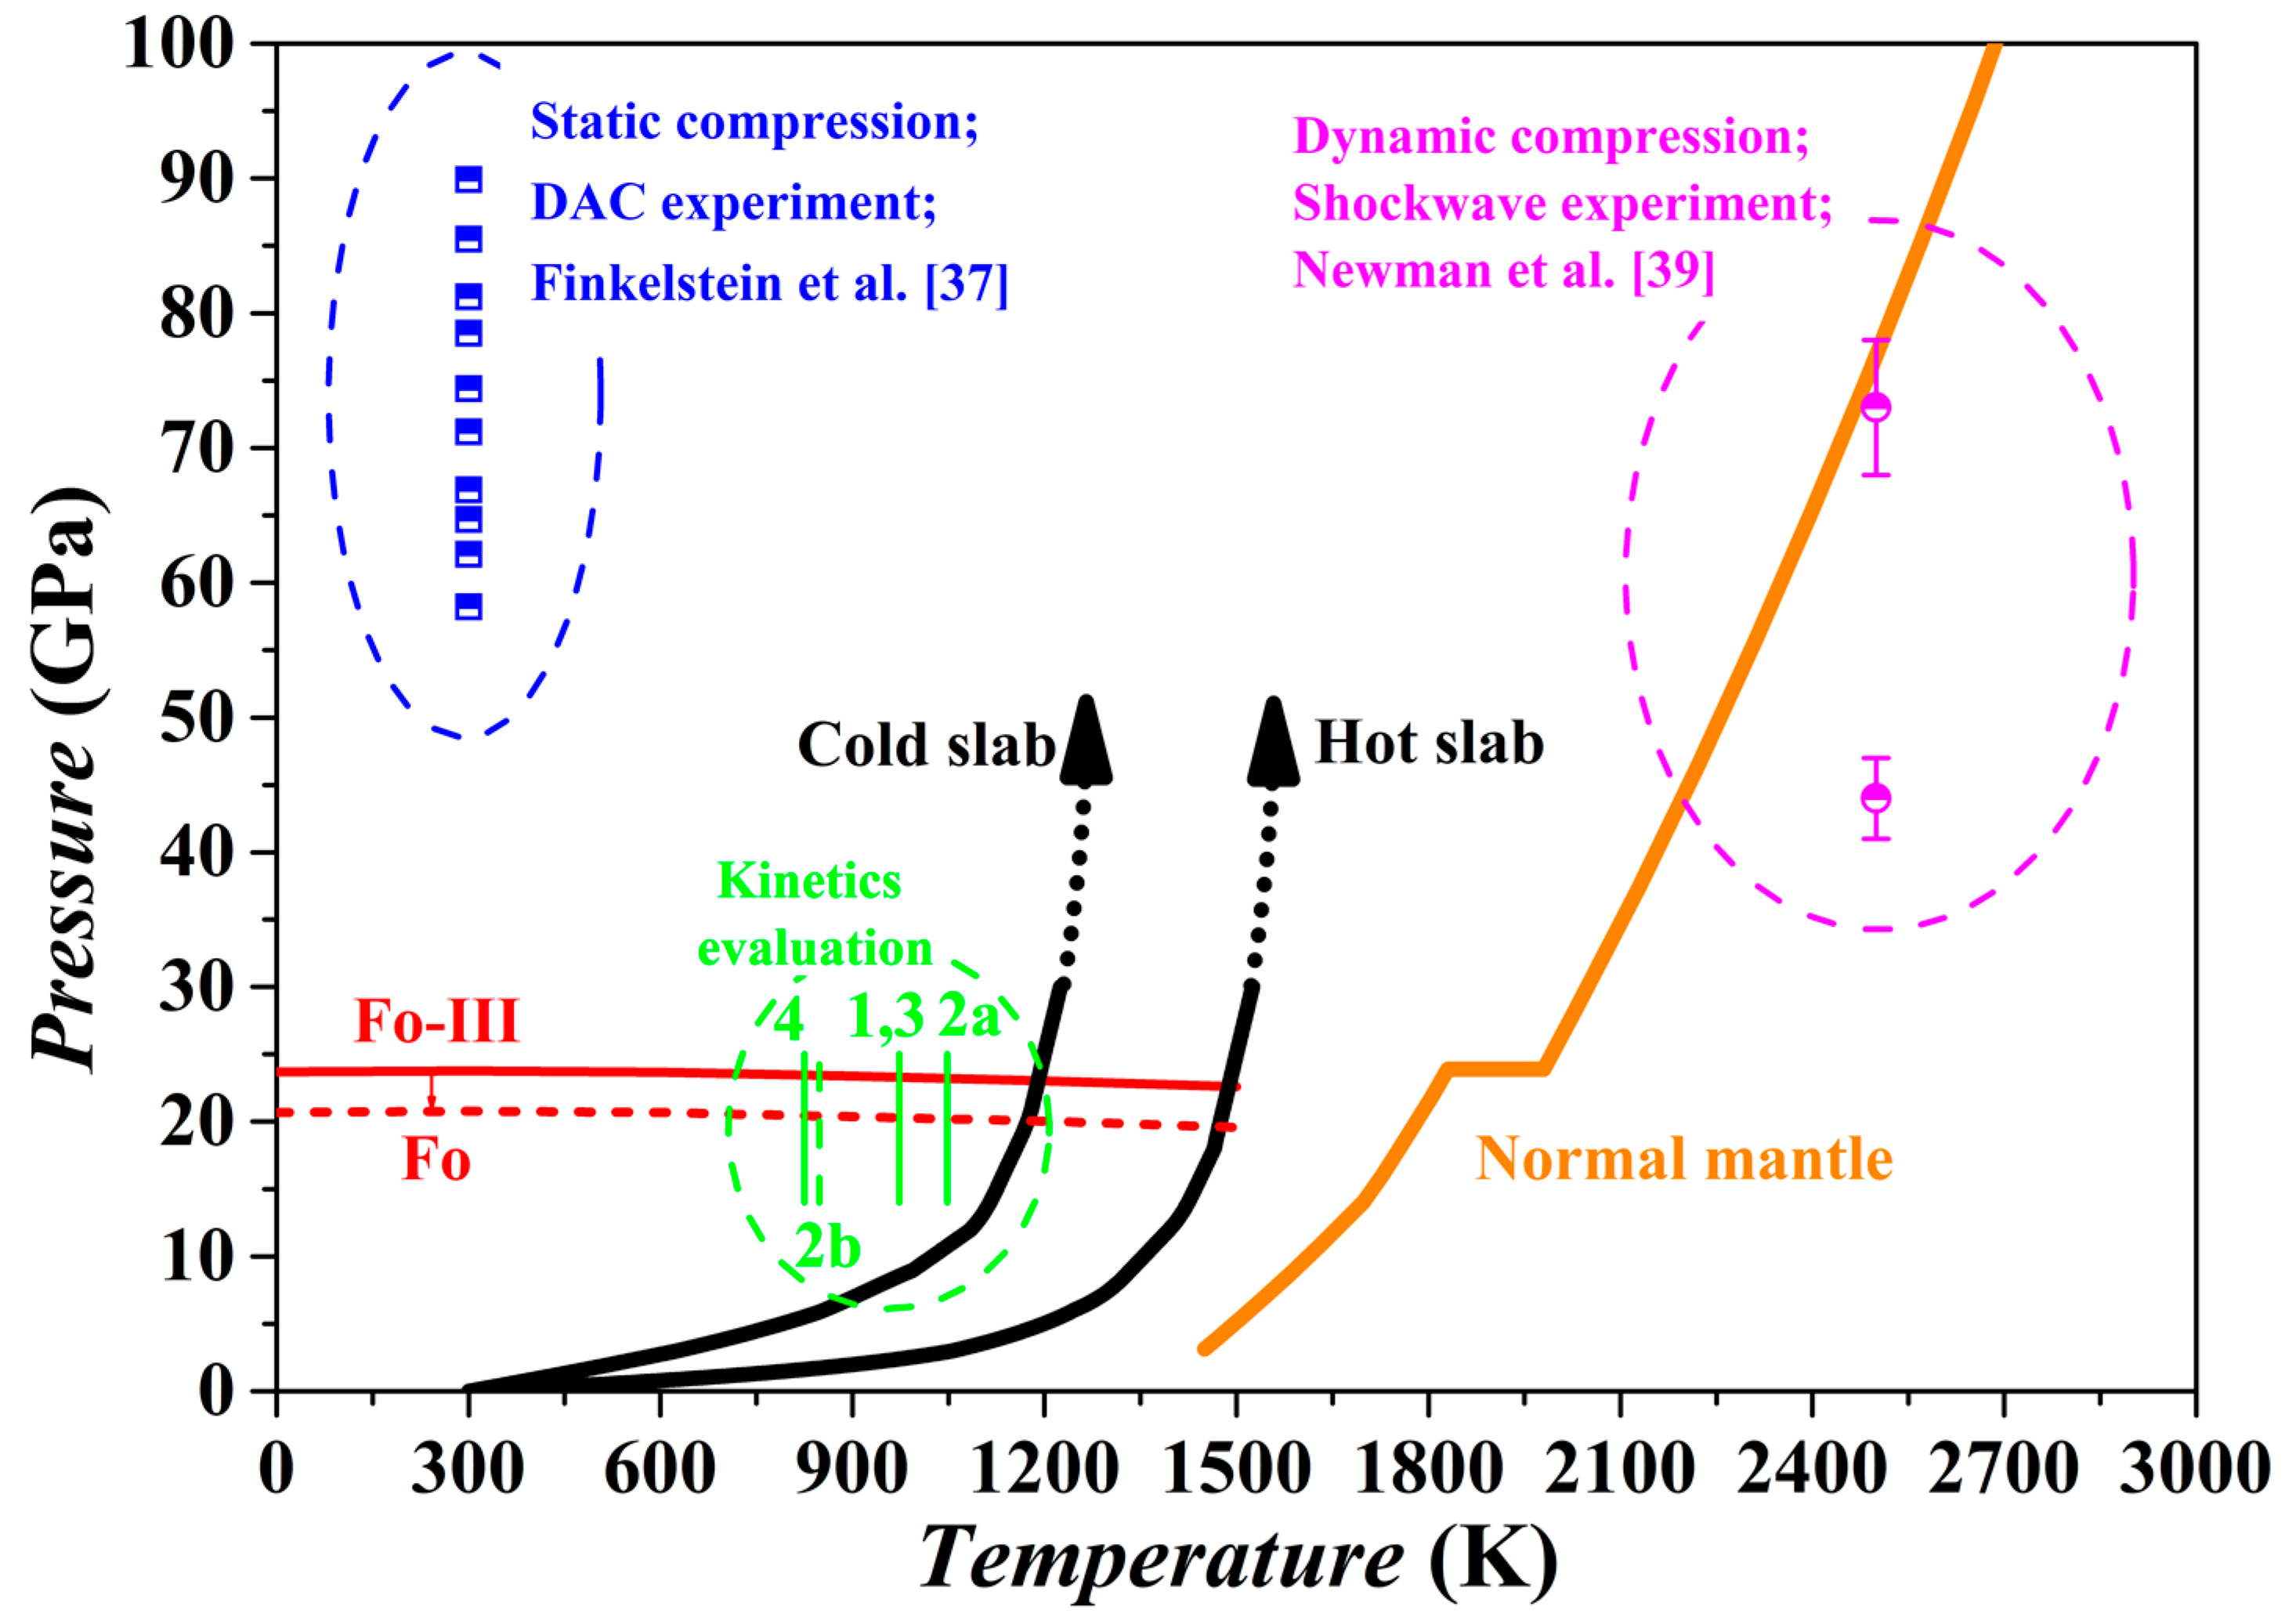
3.7. Fo-III in the Subduction Zone

Our theoretical investigation shows that the Fo-III phase has a dynamically stable structure with very low enthalpy and Gibbs free energy, and therefore might form as a metastable phase from the starting materials of Fo, Wds and Rwd under some special circumstances (Figure 7 and Figure 10). Indeed, it has been observed in two kinds of high-P experiments with the Fo staring material (Figure 15), long duration room-T hydrostatic diamond-anvil cell experiments at one end [37] and short duration high-T dynamic shockwave experiments at the other end [39]. Due to the long geological history and high T of the mantle material, the Fo-III phase should never exist in the normal mantle. In contrast, the Fo-III phase might metastably exist in the cold slabs subducted to the upper mantle-lower mantle boundary region and even beyond.
The existence of a metastable Fo-III wedge in the slabs is subject to several requirements. Firstly, the T of the slabs subducted beyond the 410 km depth should be low enough to inhibit the transformation from the Ol to the thermodynamically stable phase Wds and Rwd. According to some studies on the kinetics of the Fo/Wds and Fo/Rwd phase transitions [1,6,7,26], the highest T for negligible Fo/Wds and Fo/Rwd phase transitions lies in the range of ~800–1100 K, closely matching the T conditions in the cold slabs (Figure 15). This was the exact basis on which the metastable Ol hypothesis was proposed in the past. Secondly, the Fo-III phase should be able to form directly from the Ol. Our theoretical results have suggested that this could take place at ~20 GPa for a slab T of ~900 K while the static compression experiments have demonstrated the phase transition sequence Fo → Fo-II → Fo-III in the P range of ~50–90 GPa. As discussed earlier, the Fo-II phase is not a dynamically stable phase, so that the phase transition sequence Fo → Fo-III seems more appropriate. As to the phase transition pressure, the static compression experiments at room T might have severely overestimated it due to possible slow reaction rate. Usually, a large P overstepping is required in order to activate a polymorphic phase transformation at a low experimental T like 300 K. Further, the short experimental duration in the diamond-anvil cell compression experiments (~104 to 105 s), much longer than in the dynamic compression process (~10−3 s) but extremely short compared to the slab-subduction process (generally > 1012 s), should have led to severe overestimation of the phase transition pressure. It thus appears highly possible that in the cold slabs a direct metastable polymorphic phase transition from the Ol to the Fo-III phase happens at ~20 GPa, or in the lower part of the MTZ. Thirdly, the Fo-III phase should not be readily transform to other polymorphic phases or break down to other phase assemblages such as the Brg + Pe. Our theoretical results have suggested that among the metastable Fo-II, Fo-III and Fo-IV phases, the Fo-III phase is the best polymorphic candidate for the pressures out of the P stability field of the Fo. The diamond-anvil cell compression experiments have demonstrated a vast stable/metastable P range for the Fo-III phase indeed. On the other hand, it is presently unclear how fast the Fo-III phase may break down to the phase assemblages like the Brg + Pe (Figure 7). Considering all these factors, we propose that the metastable Fo-III phase, rather than the metastable Fo phase, may exist in the cold slabs subducted to the lower part of the MTZ (below the ~600 km depth).
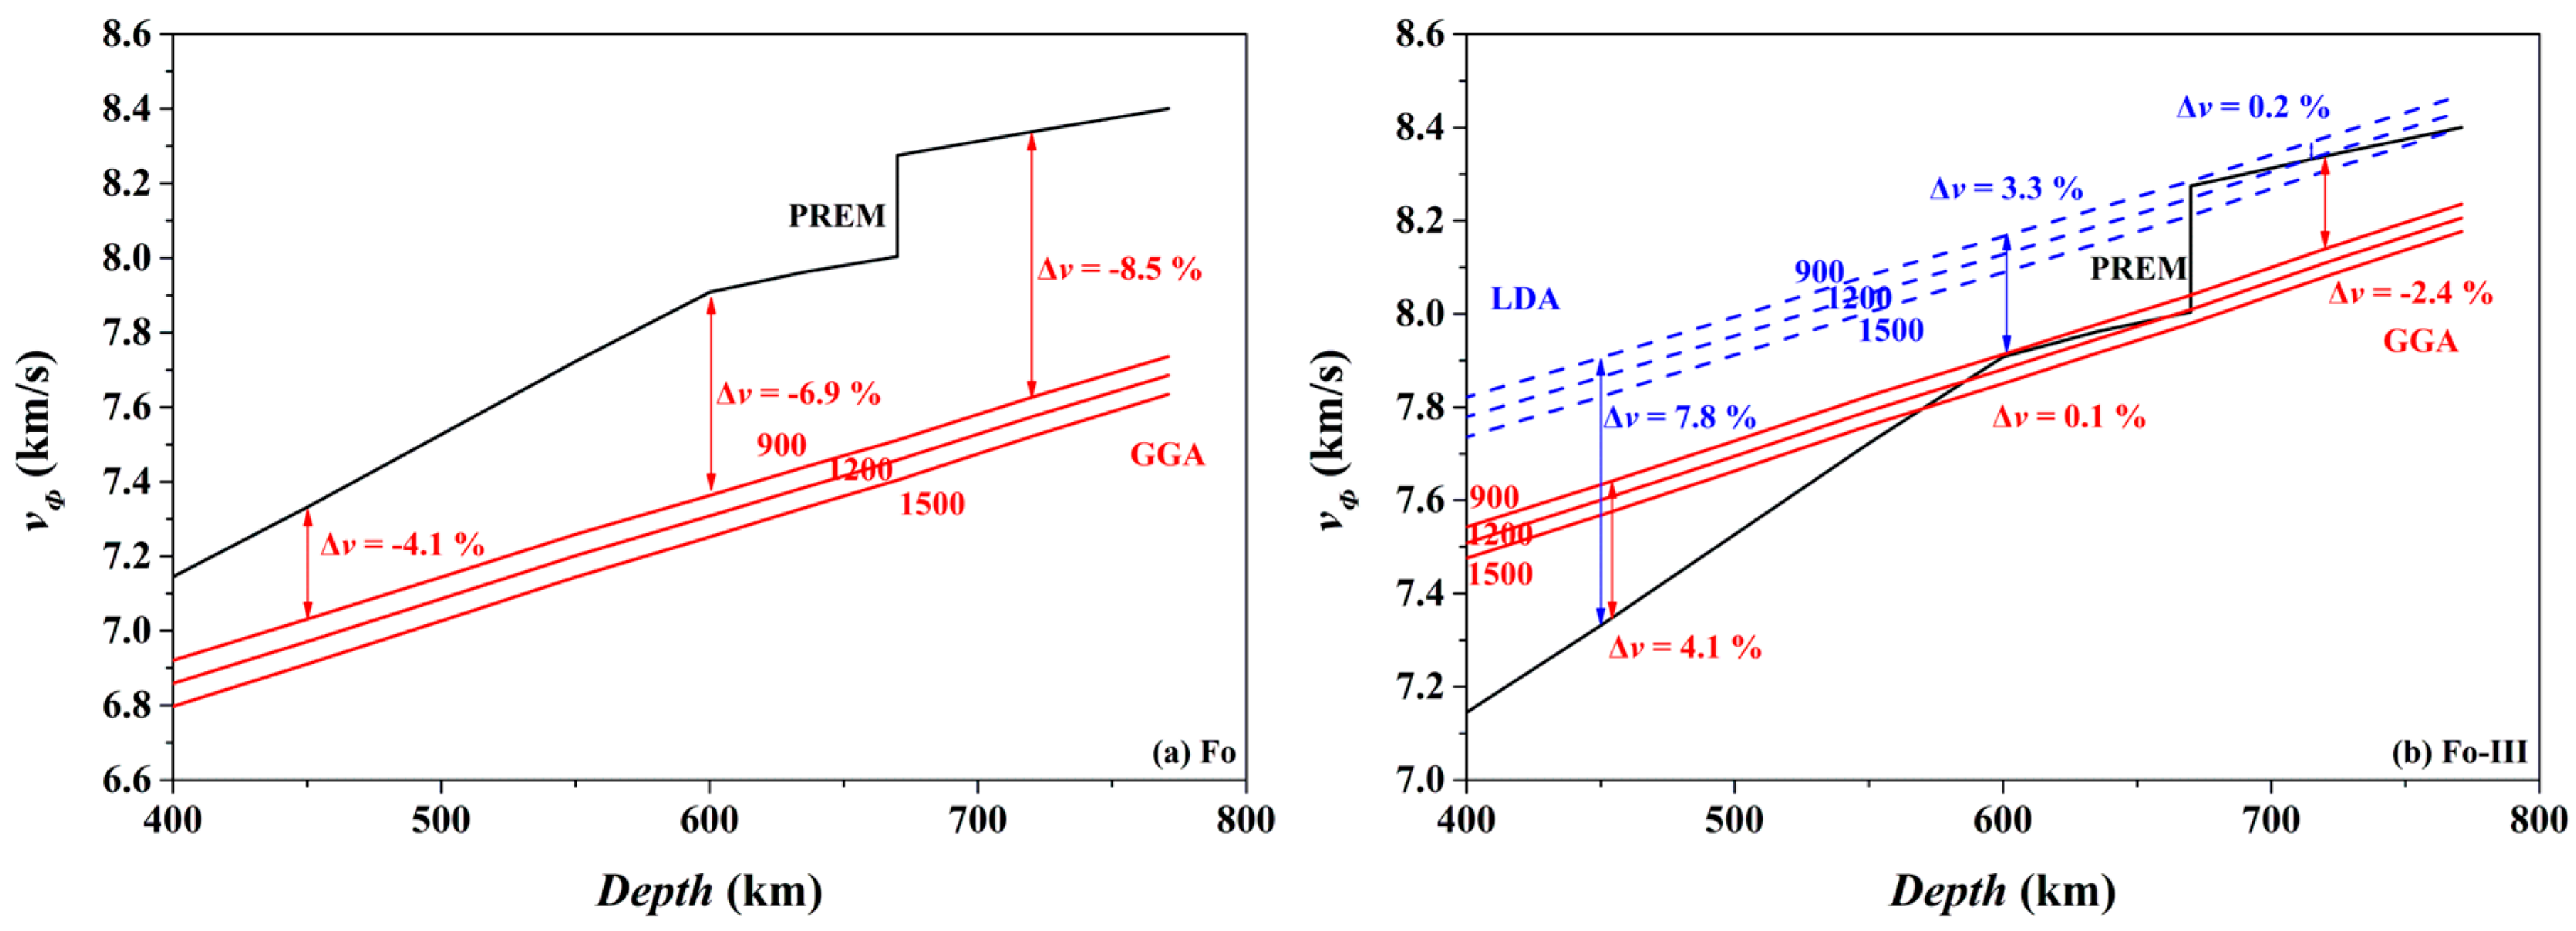
Consequently, we have calculated the bulk sound velocity (vΦ) of the Fo and Fo-III phases at 900, 1200 and 1500 K, using the following equation,
v Φ = K s ρ
The results are compared in Figure 16 to the preliminary reference Earth model (PREM) of the mantle [98]. Clearly, the vΦ of the Fo phase at all these temperatures is much slower than the vΦ of the ambient mantle (Figure 16a; the GGA result): taking the 900 K as an example, the difference between the bulk sound velocities vary from ~4.1% (450 km depth) to ~8.5% (720 km depth), which may be easily detected by seismic observations. Interestingly, the vΦ of the Fo-III phase at 900 K for the depth range of ~600–660 km is remarkably faster than the vΦ of the ambient mantle (Figure 16b): the difference between the bulk sound velocities is ~0.1% (GGA) or ~3.3% (LDA) at the 600 km depth, which should be similarly detected by the seismic methods. Indeed, fast seismic velocities are usually observed for the slabs subducted to the depth range of ~600–660 km, but are conventionally explained by resorting to low T, the termination of the metastable Ol wedge (i.e., phase transition from the metastable Ol to the Wds or Rwd), or both. Our result has clearly pointed out a potentially important role of the Fo-III phase in producing these fast seismic velocity signals. At the depths below the 660 km seismic discontinuity, the vΦ of the Fo-III phase at 900 K seems slower than the vΦ of the ambient mantle. The P-wave and S-wave velocities of the Fo-III phase are out of the scope of this study, and is currently under investigation.
In practical subducted slabs, other factors might blur the picture. In the case of the metastable Ol phase below the 410 km depth, its vΦ-depth profiles in Figure 16a should be shifted upwards by ~3% on the ground that the LDA method better predicts the mineral physical properties than the GGA method (like in the case of the Fo-III phase shown in Figure 16b), but they would be moved downwards by ~1.6% due to the incorporation of ~10% fayalite in the Ol phase [99]. In addition, water in the Ol might elevate the vΦ-depth profiles by ~0.8% [100]. Moreover, the unknown T in the real slabs might bring forth the presumably largest uncertainty in the vΦ-depth profiles. Considering all these variables, the vΦ-depth profiles for the metastable Ol phase may lie below the PREM model, and could be detected by the seismic methods with confidence [16,17]. In the case of our proposed metastable Fo-III wedge below the ~600 km depth, these issues should be carefully evaluated in future.
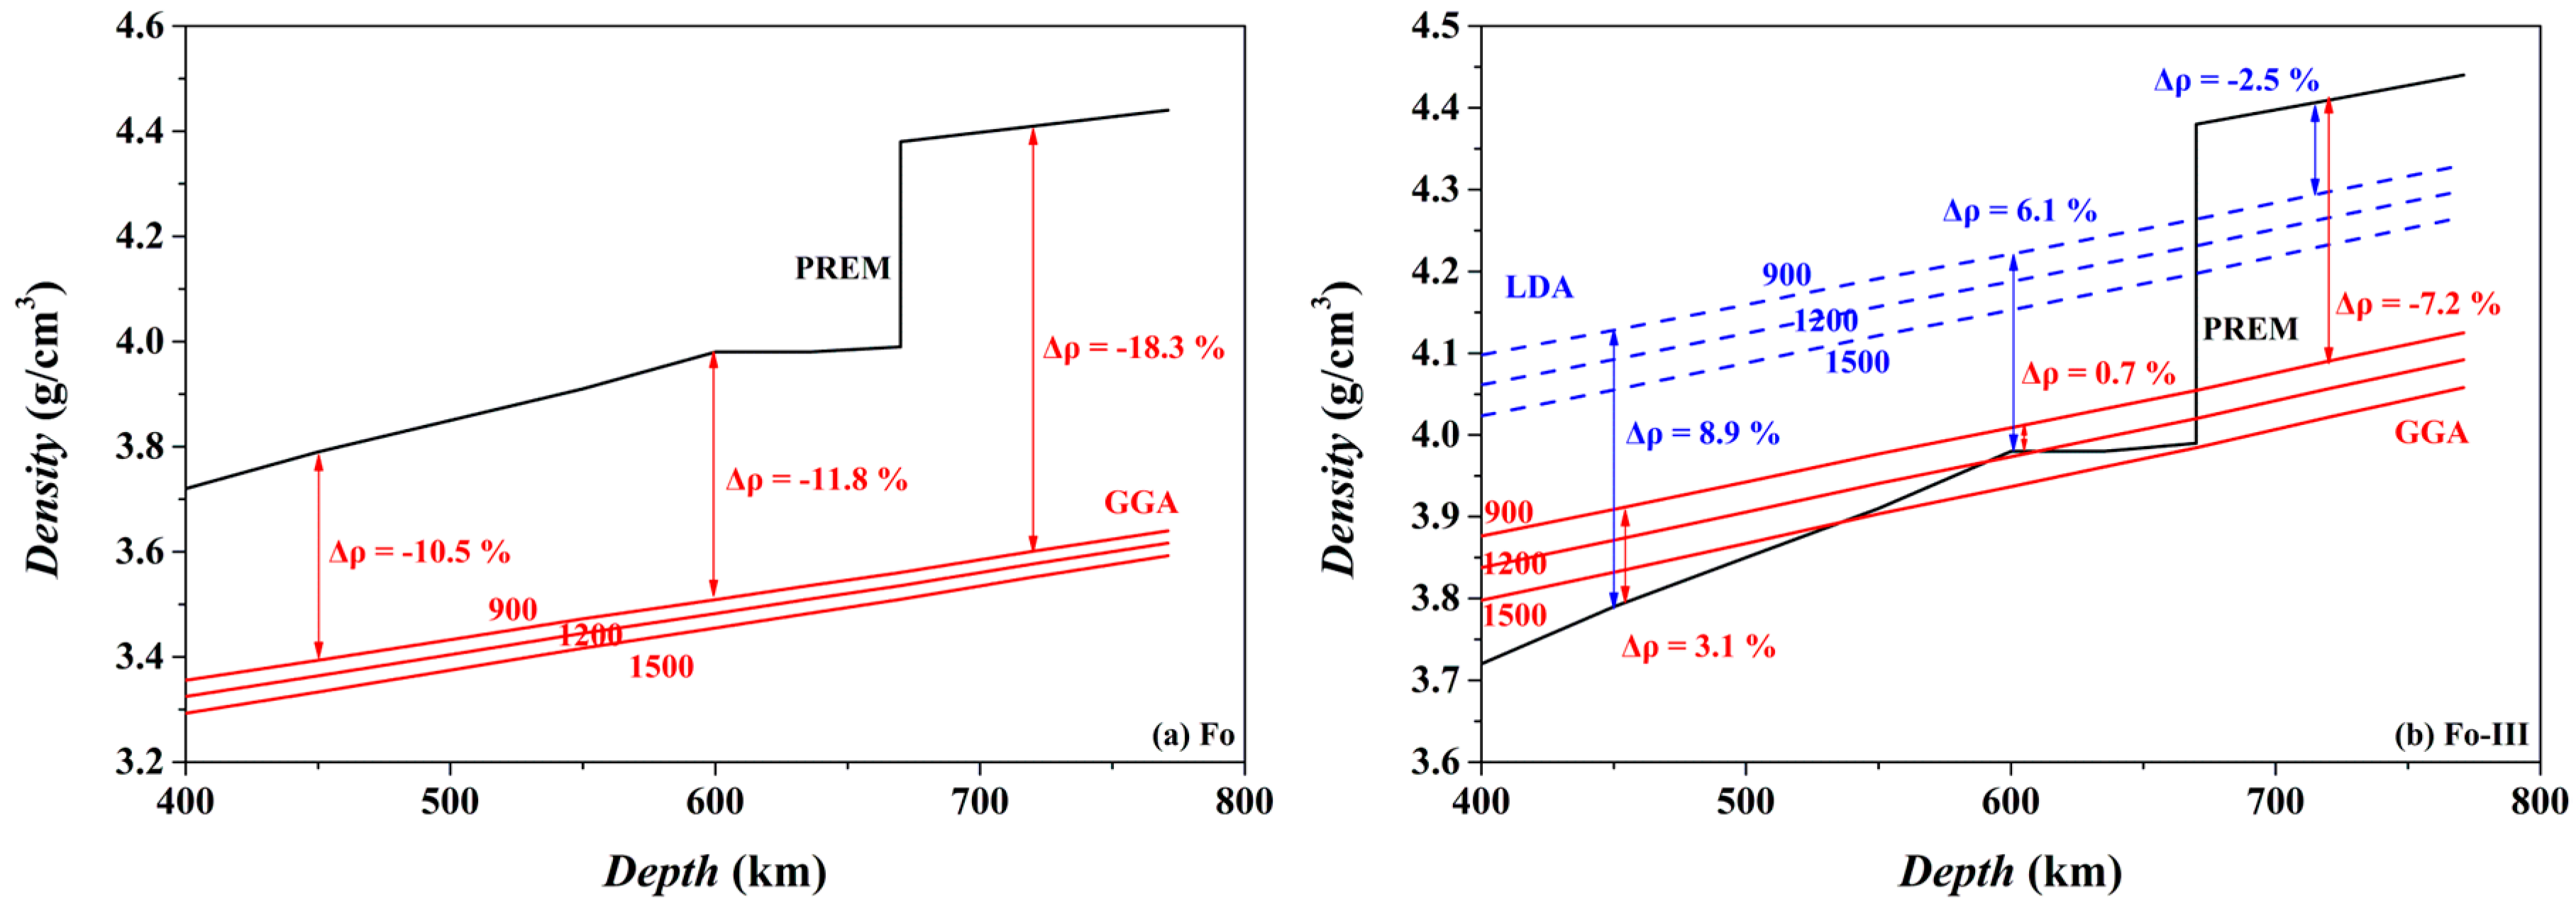
The isothermal density-depth profiles of Fo and Fo-III at 900, 1200 and 1500 K are compared in Figure 17 to the PREM density model of the mantle [98]. If Fo metastably exists in the cold oceanic slab at the depths > ~410 km, it should provide strong positive buoyancy force at least partially suppressing further subduction of the slab: its density at 900 K (the GGA result) is lower than the ambient mantle by ~10.5–18.3% in the depth range of ~450–720 km (Figure 17a). Both a lower T in the slab (an unlikely and extremely low T of 600 K for example) and some substitution of Fe for the Mg in the Fo phase (the typical upper mantle Ol of (Mg0.89Fe0.11)2SiO4 for example) elevate the density-depth profile somewhat, but never alter the density contrast between the metastable Fo (or Ol) and the warm ambient mantle [101]. This observation is therefore in agreement with all existing studies such as Schmeling et al. [102], Tetzlaff and Schmeling [8], and Zhang et al. [101].
The case of the Fo-III phase is somehow more complicated (Figure 17b). If it metastably forms from a direct polymorphic phase transition from the Ol at ~20 GPa (or the ~600 km depth), its density will not be smaller than the ambient mantle, and it will not be able to provide any positive buoyancy force to stop the sinking oceanic slabs, taking into account the density-increasing effect of the Fe substitution for the Mg in the practical mantle Ol (Figure 17b). But at P ≥ ~24 GPa and with the existence of Brg in the lower mantle, the role that the Fo-III plays is much similar to that of the metastable Fo, providing a positive buoyancy force to slow down the sinking process of the slabs.
Moreover, it is rather intriguing to probe any potential relation between the Fo/Fo-III phase transition and the deep earthquakes in the subduction zones [6]. Our results have suggested that this phase transition might take place at likely depths (~600 km) with a shear mechanism, result in large volume reductions (~12.6% at 20 GPa and 900 K for example), and thus bear the ingredients necessary for the generation of the deep earthquakes.

4. Conclusions

With extensive first-principles calculations, we have systematically examined the crystallographic characteristics, elastic properties and dynamic stabilities of the Fo phase and its three newly discovered polymorphs, namely the Fo-II, Fo-III and Fo-IV phases, and probed the phase relations of these Mg2SiO4 polymorphs with other common mantle minerals/mineral assemblages such as the Wds, Rwd, Brg + Pe and Aki + Pe. In addition, we have theoretically calculated the thermodynamic properties of the Fo-III phase.
The major conclusions that we have reached are:
(1)
Among the metastable polymorphs of the Fo, Fo-II, Fo-III and Fo-IV phase at P > ~22 GPa, the Fo-III phase is the best candidate which can directly form from the Fo phase at zero K, in good agreement with the observation in the hydrostatic compression experiments of Finkelstein et al. [37]. Both the Fo-II phase and the Fo-IV phase are dynamically instable for the P range of 0–100 GPa, and thus have negligible influence on the subduction process of the slabs;
(2)
The Fo phase directly transforms to the Fo-III phase at pressures immediately beyond its P stability field, in good agreement with the shockwave experiments of Newman et al. [39]. With a small temperature dependence (averagely −1.1 MPa/K for the T range of 300–1500 K), the transition P for the Fo/Fo-III phase transition at 300 K is estimated as ~23.75 GPa using the GGA method, which is presumably underestimated by ~3 GPa [66]. This polymorphic phase transition occurs by intracrystalline shear deformation of the Fo structure at low T [37];
(3)
The Fo-III phase likely forms in the cold slabs subducted to the lower part of the MTZ. As a result, the metastable Ol wedge hypothesis may be applicable to the upper part of the MTZ only while the metastable Fo-III phase should be important in the cold slabs in the lower part of the MTZ. Due to its high bulk seismic velocity, the Fo-III phase may make significant contribution to the fast seismic velocity signals usually detected for the cold slabs subducted into the MTZ, but conventionally assigned to low T, the termination of the metastable Ol wedge, or both;
(4)
In contrast to the role that the metastable Fo plays in governing the geodynamic process of the cold slabs subducted beyond the 410 km depth, the Fo-III phase is not able to provide a positive buoyance force to slow down the subduction process in the lower part of the MTZ, but is able to do so in the lower mantle.
Further, there are several limitations to our proposal of a significant role of the metastable Fo-III in the deep-subducted cold slabs, including the unknown effect of water and the absence of the kinetics data on the phase transition of the Fo-III phase to other phase assemblages such as the Brg + Pe. All these issues should be addressed in future.

Supplementary Materials

The following are available online at https://www.mdpi.com/2075-163X/9/3/186/s1, Figure S1: Calculated KT and KS of Fo-III at 0, 300, 600, 900, 1200, 1500 and 1800 K from 0 to 100 GPa using both GGA and LDA methods, Figure S2: Calculated α of Fo-III from 0 to 1800 K at 0, 10, 20, 30, 40, 50, 60, 70, 80, 90 and 100 GPa using both GGA and LDA method, Figure S3: Calculated γth of Fo-III from 0 to 1800 K at 0, 10, 20, 30, 40, 50, 60, 70, 80, 90 and 100 GPa using both GGA and LDA method, Figure S4: Calculated CV and CP of Fo-III from 0 to 1800 K at 0, 10, 20, 30, 40, 50, 60, 70, 80, 90 and 100 GPa using both GGA and LDA method, Table S1: Fo at 0 GPa (0 K; GGA), Table S2: Fo-II at 0 GPa (0 K; GGA), Table S3: Fo-II at 60 GPa (0 K; GGA), Table S4: Fo-III at 0 GPa (0 K; GGA), Table S5: Fo-III at 60 GPa (0 K; GGA), Table S6: Fo-IV at 0 GPa (0 K; GGA), Table S7: Fo-IV at 20 GPa (0 K; GGA), Table S8: Fo-IV at 40 GPa (0 K; GGA).

Author Contributions

Conceptualization, X.L.; Validation, X.L.; Investigation, Y.Z. (Yining Zhang), Y.Z. (Yanyao Zhang); Writing—Original Draft Preparation, Y.Z. (Yining Zhang); Writing—Review & Editing, X.L.; Supervision, X.L., Y.L.; Project Administration, X.L.; Funding Acquisition, X.L., Y.L. All authors discussed the results and commented on the manuscript.

Funding

This study was financially supported by the Strategic Priority Research Program (B) of Chinese Academy of Sciences (Grant No. XDB18000000), by the DREAM project of MOST, China (Grant No. 2016YFC0600408), and by the Program of the Data Integration and Standardization in the Geological Science and Technology from MOST, China (Grant No. 2013FY1109000-3).

Acknowledgments

We are grateful for the discussion from Jianshe Lei from Institute of Crustal Dynamics, China Earthquake Administration. We thank three anonymous reviewers for their insightful comments.

Conflicts of Interest

The authors declare no conflicts of interests.

References

  1. Sung, C.M.; Burns, R.G. Kinetics of high-pressure phase transformations: Implications to the evolution of the olivine → spinel transition in the downgoing lithosphere and its consequences on the dynamics of the mantle. Tectonophysics 1976, 31, 1–32. [Google Scholar]
  2. Iidaka, T.; Suetsugu, D. Seismological evidence for metastable olivine inside a subducting slab. Nature 1992, 356, 593–595. [Google Scholar]
  3. Rubie, D.C.; Ross, C.R., II. Kinetics of the olivine-spinel transformation in subducting lithosphere: Experimental constraints and implications for deep slab processes. Phys. Earth Planet. Inter. 1994, 86, 223–241. [Google Scholar] [CrossRef]
  4. Solomatov, V.; Stevenson, D.J. Can sharp seismic discontinuities be caused by non-equilibrium phase transformations? Earth Planet. Sci. Lett. 1994, 125, 267–279. [Google Scholar] [CrossRef]
  5. Däβler, R.; Yuen, D.A. The metastable olivine wedge in fast subducting slabs: Constraints from thermos-kinetic coupling. Earth Planet. Sci. Lett. 1996, 137, 109–118. [Google Scholar]
  6. Kirby, S.H.; Stein, S.; Okal, E.A.; Rubie, D.C. Metastable mantle phase transformations and deep earthquakes in subducting oceanic lithosphere. Rev. Geophys. 1996, 34, 261–306. [Google Scholar] [CrossRef]
  7. Devaux, J.P.; Schubert, G.; Anderson, C. Formation of a metastable olivine wedge in a descending slab. J. Geophys. Res. 1997, 102, 24627–24637. [Google Scholar] [CrossRef] [Green Version]
  8. Tetzlaff, M.; Schmeling, H. The influence of olivine metastability on deep subduction of oceanic lithosphere. Phys. Earth Planet. Inter. 2000, 120, 29–38. [Google Scholar] [CrossRef]
  9. Pankow, K.L.; Williams, Q.; Lay, T. Using shear wave amplitude patterns to detect metastable olivine in subducted slabs. J. Geophys. Res. 2002, 107, ESE 2-1–ESE 2-15. [Google Scholar] [CrossRef]
  10. Yoshioka, S.; Murakami, T. The effects of metastable olivine (α) wedge in subducted slabs on theoretical seismic waveforms of deep earthquakes. J. Geophys. Res. 2002, 107, ESE 16-1–ESE 16-18. [Google Scholar] [CrossRef]
  11. Kaneshima, S.; Okamoto, T.; Takenaka, H. Evidence for a metastable olivine wedge inside the subducted Mariana slab. Earth Planet. Sci. Lett. 2007, 258, 219–227. [Google Scholar] [CrossRef]
  12. Yoshioka, S.; Torii, Y.; Riedel, M.R. Impact of phase change kinetics on the Mariana slab within the framework of 2-D mantle convection. Phys. Earth Planet. Inter. 2015, 240, 70–81. [Google Scholar] [CrossRef] [Green Version]
  13. van der Hilst, R.; Engdahl, R.; Spakman, W.; Nolet, G. Tomographic imaging of subducted lithosphere below northwest Pacific island arcs. Nature 1991, 353, 37–43. [Google Scholar] [CrossRef] [Green Version]
  14. Guest, A.; Schubert, G.; Gable, C.W. Stresses along the metastable wedge of olivine in a subducting slab: Possible explanation for the Tonga double seismic layer. Phys. Earth Planet. Inter. 2004, 141, 253–267. [Google Scholar] [CrossRef]
  15. Iidaka, T.; Furukawa, Y. Double seismic zone for deep earthquakes in the Izu-Bonin subduction zone. Science 1994, 263, 1116–1118. [Google Scholar] [CrossRef] [PubMed]
  16. Jiang, G.M.; Zhao, D.P.; Zhang, G.B. Seismic evidence for a metastable olivine wedge in the subducting Pacific slab under Japan Sea. Earth Planet. Sci. Lett. 2008, 270, 300–307. [Google Scholar] [CrossRef]
  17. Kawakatsu, H.; Yoshioka, S. Metastable olivine wedge and deep dry cold slab beneath southwest Japan. Earth Planet. Sci. Lett. 2011, 303, 1–10. [Google Scholar] [CrossRef]
  18. Chen, W.P.; Brudzinski, M.R. Seismic anisotropy in the mantle transition zone beneath Fiji-Tonga. Geophys. Res. Lett. 2003, 30, 1682. [Google Scholar] [CrossRef]
  19. Liu, K.H.; Gao, S.S.; Gao, Y.; Wu, J. Shear wave splitting and mantle flow associated with the deflected Pacific slab beneath northeast Asia. J. Geophys. Res. 2008, 113, B01305. [Google Scholar] [CrossRef]
  20. Kubo, T.; Kaneshima, S.; Torii, Y.; Yoshioka, S. Seismological and experimental constraints on metastable phase transformations and rheology of the Mariana slab. Earth Planet. Sci. Lett. 2009, 287, 12–23. [Google Scholar] [CrossRef]
  21. Quinteros, J.; Sobolev, S.V. Constraining kinetics of metastable olivine in the Marianas slab from seismic observations and dynamic models. Tectonophysics 2012, 526–529, 48–55. [Google Scholar] [CrossRef]
  22. Mosenfelder, J.L.; Marton, F.C.; Ross, C.R., II; Kerschhofer, L.; Rubie, D.C. Experimental constraints on the depth of olivine metastability in subducting lithosphere. Phys. Earth Planet. Inter. 2001, 127, 165–180. [Google Scholar] [CrossRef]
  23. Jing, Z.-C.; Ning, J.-Y.; Wang, S.-G.; Zang, S.-X. Dynamic phase boundaries of olivine-wadsleyite in subduction zones in the western Pacific. Geophys. Res. Lett. 2002, 29, 2045. [Google Scholar] [CrossRef]
  24. Marton, F.C.; Shankland, T.J.; Rubie, D.C.; Xu, Y.S. Effects of variable thermal conductivity on the mineralogy of subducting slabs and implications for mechanisms of deep earthquakes. Phys. Earth Planet. Inter. 2005, 149, 53–64. [Google Scholar] [CrossRef]
  25. Mao, Z.; Fan, D.W.; Lin, J.F.; Yang, J.; Tkachev, S.N.; Zhuravlev, K.; Prakapenka, V.B. Elasticity of single-crystal olivine at high pressures and temperatures. Earth Planet. Sci. Lett. 2015, 426, 204–215. [Google Scholar] [CrossRef] [Green Version]
  26. Wu, T.C.; Bassett, W.A.; Burnley, P.C.; Weathers, M.S. Shear-promoted phase transitions in Fe2SiO4 and Mg2SiO4 and the mechanism of deep earthquakes. J. Geophys. Res. 1993, 98, 19767–19776. [Google Scholar] [CrossRef]
  27. Kubo, T.; Ohtani, E.; Kato, T.; Shinmei, T.; Fujino, K. Experimental investigation of the α-β transformation of San Carlos olivine single crystal. Phys. Chem. Miner. 1998, 26, 1–6. [Google Scholar] [CrossRef]
  28. Kubo, T.; Ohtani, E.; Funakoshi, K.-I. Nucleation and growth kinetics of the α-β transformation in Mg2SiO4 determined by in situ synchrotron powder X-ray diffraction. Am. Mineral. 2004, 89, 285–293. [Google Scholar] [CrossRef]
  29. Demouchy, S.; Mainprice, D.; Tommasi, A.; Couvy, H.; Barou, F.; Frost, D.J.; Cordier, P. Forsterite to wadsleyite phase transformation under shear stress and consequences for the Earth’s mantle transition zone. Phys. Earth Planet. Inter. 2011, 184, 91–104. [Google Scholar] [CrossRef]
  30. Kubo, T.; Ohtani, E.; Kato, T.; Shinmei, T.; Fujino, K. Effects of water on the α-β transformation kinetics in San Carlos olivine. Science 1998, 281, 85–87. [Google Scholar] [CrossRef]
  31. Hosoya, T.; Kubo, T.; Ohtani, E.; Sano, A.; Funakoshi, K. Water controls the fields of metastable olivine in cold subducting slabs. Geophys. Res. Lett. 2005, 32, L17305. [Google Scholar] [CrossRef]
  32. Diedrich, T.; Sharp, T.G.; Leinenweber, K.; Holloway, J.R. The effect of small amount of H2O on olivine to ringwoodite transformation growth rates and implications for subduction of metastable olivine. Chem. Geol. 2009, 262, 87–99. [Google Scholar] [CrossRef]
  33. Du Frane, W.L.; Sharp, T.G.; Mosenfelder, J.L.; Leinenweber, K. Ringwoodite growth rates from olivine with ~75 ppmw H2O: Metastable olivine must be nearly anhydrous to exist in the mantle transition zone. Phys. Earth Planet. Inter. 2013, 219, 1–10. [Google Scholar] [CrossRef]
  34. Wang, S.-G.; Liu, Y.-J.; Ning, J.-Y. Relationship between the growth rate of forsterite phase transformation and its water content and the existing depth of metastable olivine. Chin. J. Geophys. 2011, 54, 1758–1766. [Google Scholar]
  35. Van de Moortèle, B.; Reynard, B.; McMillan, P.F.; Wilson, M.; Beck, P.; Gillet, P.; Jahn, S. Shock-induced transformation of olivine to a new metastable (Mg,Fe)2SiO4 polymorph in Martian meteorites. Earth Planet. Sci. Lett. 2007, 261, 469–475. [Google Scholar] [CrossRef]
  36. Tomioka, N.; Okuchi, T. A new high-pressure form of Mg2SiO4 highlighting diffusionless phase transitions of olivine. Sci. Rep. 2017, 7, 17351. [Google Scholar] [CrossRef]
  37. Finkelstein, G.J.; Dera, P.K.; Jahn, S.; Oganov, A.R.; Holl, C.M.; Meng, Y.; Duffy, T.S. Phase transitions and equation of state of forsterite to 90 GPa from single-crystal X-ray diffraction and molecular modeling. Am. Mineral. 2014, 99, 35–43. [Google Scholar] [CrossRef]
  38. Santamaria-Perez, D.; Thomson, A.; Segura, A.; Pellicer-Torres, J.; Manjon, F.J.; Cora, F.; McColl, K.; Wilson, M.; Dobson, D.; McMillan, P.F. Metastable structural transformations and pressure-induced amorphization in natural (Mg,Fe)2SiO4 olivine under static compression: A Raman spectroscopic study. Am. Mineral. 2016, 101, 1642–1650. [Google Scholar] [CrossRef]
  39. Newman, M.G.; Kraus, R.G.; Akin, M.C.; Bernier, J.V.; Dillman, A.M.; Homel, M.A.; Lee, S.; Lind, J.; Mosenfelder, J.L.; Pagan, D.C.; et al. In situ observations of phase changes in shock compressed forsterite. Geophys. Res. Lett. 2018, 45, 8129–8135. [Google Scholar] [CrossRef]
  40. Zhou, P.; Wu, G.X.; Zuo, C.Y.; Zheng, Z.; Zhang, W.B.; Pan, G.B.; Wang, F. Study on electronic structures and mechanical properties of new predicted orthorhombic Mg2SiO4 under high pressure. J. Alloys Compd. 2015, 630, 11–22. [Google Scholar] [CrossRef]
  41. Rubie, D.C.; Brearley, A.J. Mechanism of the γ-β phase transformation of Mg2SiO4 at high temperature and pressure. Nature 1990, 348, 628–631. [Google Scholar] [CrossRef]
  42. Brearley, A.J.; Rubie, D.C.; Ito, E. Mechanism of the transformations between the α, β and γ polymorphs of Mg2SiO4 at 15 GPa. Phys. Chem. Miner. 1992, 18, 343–358. [Google Scholar] [CrossRef]
  43. Kubo, T.; Ohtani, E.; Kato, T.; Urakawa, S.; Suzuki, A.; Kanbe, Y.; Funakoshi, K.; Utsumi, W.; Fujino, K. Formation of metastable assemblages and mechanisms of the grain-size reduction in the postspinel transformation of Mg2SiO4. Geophys. Res. Lett. 2000, 27, 807–810. [Google Scholar] [CrossRef]
  44. Hernandez, E.R.; Brodholt, J.; Alfe, D. Structural, vibrational and thermodynamic properties of Mg2SiO4 and MgSiO3 minerals from first-principles simulations. Phys. Earth Planet. Inter. 2015, 240, 1–24. [Google Scholar] [CrossRef]
  45. Kresse, G.; Furthmüller, J. Efficient iterative schemes for ab initio total-energy calculations using a plane-wave basis set. Phys. Rev. B 1996, 54, 11169–11186. [Google Scholar] [CrossRef]
  46. Hohenberg, P.; Kohn, W. Inhomogeneous electron gas. Phys. Rev. B 1964, 136, 864–871. [Google Scholar] [CrossRef]
  47. Kohn, W.; Sham, L.J. Self-consistent equations exchange and correlation effects. Phys. Rev. 1965, 140, A1133–A1138. [Google Scholar] [CrossRef]
  48. Blöchl, P.E. Projector augmented-wave method. Phys. Rev. B 1994, 50, 17953–17979. [Google Scholar] [CrossRef] [Green Version]
  49. Perdew, J.P.; Burke, K.; Ernzerhof, M. Generalized gradient approximation made simple. Phys. Rev. Lett. 1996, 77, 3865–3868. [Google Scholar] [CrossRef]
  50. Perdew, J.P.; Wang, Y. Accurate and simple analytic representation of the electron-gas correlation energy. Phys. Rev. B 1992, 45, 13244–13249. [Google Scholar] [CrossRef]
  51. Ceperley, D.M.; Alder, B.J. Ground state of the electron gas by a stochastic method. Phys. Rev. Lett. 1980, 45, 566–569. [Google Scholar] [CrossRef]
  52. Perdew, J.P.; Zunger, A. Self-interaction correction to density-functional approximations for many electron systems. Phys. Rev. B 1981, 23, 5048–5079. [Google Scholar] [CrossRef]
  53. Teter, M.P.; Payne, M.C.; Allan, D.C. Solution of Schrödinger’s equation for large systems. Phys. Rev. B 1989, 40, 12255–12263. [Google Scholar] [CrossRef]
  54. Hazen, R.M. Effects of temperature and pressure on the crystal structure of forsterite. Am. Mineral. 1976, 61, 1280–1293. [Google Scholar]
  55. Horiuchi, H.; Sawamoto, H. β-Mg2SiO4: Single-crystal X-ray diffraction study. Am. Mineral. 1981, 66, 568–575. [Google Scholar]
  56. Hazen, R.M.; Downs, R.T.; Finger, L.W.; Ko, J.D. Crystal chemistry of ferromagnesian silicate spinels: Evidence for Mg-Si disorder. Am. Mineral. 1993, 78, 1320–1323. [Google Scholar]
  57. Horiuchi, H.; Ito, E.; Weidner, D.J. Perovskite-type MgSiO3: Sing-crystal X-ray diffraction study. Am. Mineral. 1987, 72, 357–360. [Google Scholar]
  58. Horiuchi, H.; Hirano, M.; Ito, E.; Matsui, Y. MgSiO3 (ilmenite-type): Single crystal X-ray diffraction study. Am. Mineral. 1982, 67, 788–793. [Google Scholar]
  59. Hazen, R.M. Effects of temperature and pressure on the cell dimension and X-ray temperature factors of periclase. Am. Mineral. 1976, 61, 266–271. [Google Scholar]
  60. Monkhorst, H.J.; Pack, J.D. Special points for Brillouin-zone integrations. Phys. Rev. B 1976, 13, 5188–5192. [Google Scholar] [CrossRef]
  61. Gonze, X.; Lee, C.Y. Dynamical matrices, Born effective charges, dielectric permittivity tensors, and interatomic force constants from density-functional perturbation theory. Phys. Rev. B 1997, 55, 10355–10368. [Google Scholar] [CrossRef]
  62. Baroni, S.; de Gironcoli, S.; Corso, A.D.; Giannozzi, P. Phonons and related crystal properties from density-functional perturbation theory. Rev. Mod. Phys. 2001, 73, 515–562. [Google Scholar] [CrossRef] [Green Version]
  63. Togo, A.; Tanaka, I. First pinciples phonon calculations in material science. Scr. Mater. 2015, 108, 1–5. [Google Scholar] [CrossRef]
  64. Born, K.; Huang, K. Dynamical Theory of Crystal Lattices; Oxford University: New York, NY, USA, 1956. [Google Scholar]
  65. Carrier, P.; Wentzcovitch, R.M.; Tsuchiya, J. First-principles prediction of crystal structures at high temperatures using the quasiharmonic approximation. Phys. Rev. B 2007, 76, 064116. [Google Scholar] [CrossRef]
  66. Wentzcovitch, R.M.; Yu, Y.G.; Wu, Z.Q. Thermodynamic properties and phase relations in mantle minerals investigated by first principles quasiharmonic theory. Rev. Mineral. Geochem. 2010, 71, 59–98. [Google Scholar] [CrossRef]
  67. Momma, K.; Izumi, F. VESTA 3 for three-dimensional visualization of crystal, volumetric and morphology data. J. Appl. Crystallogr. 2011, 44, 1272–1276. [Google Scholar] [CrossRef]
  68. Zhang, Y.; Liu, X.; Xiong, Z.; Zhang, Z. Compressional behavior of MgCr2O4 spinel from first-principles simulation. Sci. China-Earth Sci. 2016, 59, 989–996. [Google Scholar] [CrossRef]
  69. Hoppe, R. Effective coordination numbers (ECoN) and mean fictive ionic radii (MEFIR). Z. Kristallogr. 1979, 150, 23–52. [Google Scholar] [CrossRef]
  70. Birch, F. Finite elastic strain of cubic crystals. Phys. Rev. 1947, 71, 809–824. [Google Scholar] [CrossRef]
  71. Downs, R.T.; Zha, C.-S.; Duffy, T.S.; Finger, L.W. The equation of state of forsterite to 17.2 GPa and effects of pressure media. Am. Mineral. 1996, 81, 51–55. [Google Scholar] [CrossRef]
  72. Zhang, L. Single crystal hydrostatic compression of (Mg,Mn,Fe,Co)2SiO4 olivines. Phys. Chem. Miner. 1998, 25, 308–312. [Google Scholar] [CrossRef]
  73. Andrault, D.; Bouhifd, M.A.; Itié, J.P.; Richet, P. Compression and amorphization of (Mg,Fe)2SiO4 olivines: An X-ray diffraction study up to 70 GPa. Phys. Chem. Miner. 1995, 22, 99–107. [Google Scholar] [CrossRef]
  74. Zha, C.S.; Duffy, T.S.; Downs, R.T.; Mao, H.K.; Hemley, R.J. Sound velocity and elasticity of single-crystal forsterite to 16 GPa. J. Geophys. Res. 1996, 101, 17535–17545. [Google Scholar] [CrossRef]
  75. Li, L.; Wentzcovitch, R.M.; Weidner, D.J.; da Silva, C.R.S. Vibrational and thermodynamic properties of forsterite at mantle conditions. J. Geophys. Res. 2007, 112, B05206. [Google Scholar] [CrossRef]
  76. Ottonello, G.; Civalleri, B.; Ganguly, J.; Vetuschi Zuccolini, M.; Noel, Y. Thermophysical properties of the polymorphs of Mg2SiO4: A computational study. Phys. Chem. Miner. 2009, 36, 87–106. [Google Scholar] [CrossRef]
  77. Deng, L.; Liu, X.; Liu, H.; Zhang, Y. A first-principles study of the phase transition from Holl-I to Holl-II in the composition KAlSi3O8. Am. Mineral. 2011, 96, 974–982. [Google Scholar] [CrossRef]
  78. Klotz, S.; Chervin, J.C.; Munsch, P.; Le Marchand, G. Hydrostatic limits of 11 pressure transmitting media. Phys. D Appl. Phys. 2009, 42, 075413. [Google Scholar] [CrossRef]
  79. Liu, X.; Xiong, Z.; Chang, L.; He, Q.; Wang, F.; Shieh, S.R.; Wu, C.; Li, B.; Zhang, L. Anhydrous ringwoodites in the mantle transition zone: Their bulk modulus, solid solution behavior, compositional variation, and sound velocity feature. Solid Earth Sci. 2016, 1, 28–47. [Google Scholar] [CrossRef] [Green Version]
  80. Yu, Y.G.; Wentzcovitch, R.M. Density functional study of vibrational and thermodynamic properties of ringwoodite. J. Geophys. Res. 2006, 111, B12202. [Google Scholar] [CrossRef]
  81. Zhang, Y.; Liu, X.; Shieh, S.R.; Bao, X.; Xie, T.; Wang, F.; Zhang, Z.; Prescher, C.; Prakapenka, V.B. Spinel and post-spinel phase assemblages in Zn2TiO4: An experimental and theoretical study. Phys. Chem. Miner. 2017, 44, 109–123. [Google Scholar] [CrossRef]
  82. Zhang, Y.; Liu, X.; Shieh, S.R.; Zhang, Z.; Bao, X.; Xie, T.; Wang, F.; Prescher, C.; Prakapenka, V.B. Equations of state of Co2TiO4-Sp, Co2TiO4-CM, and Co2TiO4-CT, and their phase transitions: An experimental and theoretical study. Phys. Chem. Miner. 2019, 46. [Google Scholar] [CrossRef]
  83. Angel, R.J. Equation of state. Rev. Mineral. Geochem. 2000, 41, 35–60. [Google Scholar] [CrossRef]
  84. Kleppe, A.K.; Jephcoat, A.P.; Olijnyk, H.; Slesinger, A.E.; Kohn, S.C.; Wood, B.J. Raman spectroscopic study of hydrous wadsleyite (β-Mg2SiO4). Phys. Chem. Miner. 2001, 28, 232–241. [Google Scholar] [CrossRef]
  85. Kleppe, A.K.; Jephcoat, A.P.; Smyth, J.R. Raman spectroscopic study of hydrous γ-Mg2SiO4 to 56.5 GPa. Phys. Chem. Miner. 2002, 29, 473–476. [Google Scholar] [CrossRef]
  86. Pick, R.M.; Cohen, M.H.; Martin, R.M. Microscopic theory of force constants in the adiabatic approximation. Phys. Rev. B 1970, 1, 910–920. [Google Scholar] [CrossRef]
  87. Giannozzi, P.; de Gironcoli, S.; Pavone, P.; Baroni, S. Ab initio calculation of phonon dispersions in semiconductors. Phys. Rev. B 1991, 43, 7231–7242. [Google Scholar] [CrossRef]
  88. Setyawan, W.; Curtarolo, S. High-throughput electronic band structure calculations: Challenges and tools. Comput. Mater. Sci. 2010, 49, 299–312. [Google Scholar] [CrossRef] [Green Version]
  89. Dorogokupets, P.I.; Dymshits, A.M.; Sokolova, T.S.; Danilov, B.S.; Litasov, K.D. The equations of state of forsterite, wadsleyite, ringwoodite, akimotoite, MgSiO3-perovskite, and postperovskite and phase diagram for the Mg2SiO4 system at pressures of up to 130 GPa. Russ. Geol. Geophys. 2015, 56, 172–189. [Google Scholar] [CrossRef]
  90. Sokolova, T.S.; Dorogokupets, P.I.; Litasov, K.D. Self-consistent pressure scales based on the equations of state for ruby, diamond, MgO, B2-NaCl, as well as Au, Pt, and other metals to 4 Mbar and 3000 K. Russ. Geol. Geophys. 2013, 54, 181–199. [Google Scholar] [CrossRef]
  91. Xiong, Z.; Liu, X.; Shieh, S.R.; Wang, S.; Chang, L.; Tang, J.; Hong, X.; Zhang, Z.; Wang, H. Some thermodynamic properties of larnite (β-Ca2SiO4) constrained by high T/P experiment and/or theoretical simulation. Am. Mineral. 2016, 101, 277–288. [Google Scholar] [CrossRef]
  92. Wentzcovitch, R.M.; Karki, B.B.; Cococcioni, M.; de Gironcoli, S. Thermoelastic properties of MgSiO3-perovskite: Insights on the nature of the Earth’s lower mantle. Phys. Rev. Lett. 2004, 92, 018501. [Google Scholar] [CrossRef]
  93. Thompson, A.B. Water in the Earth’s upper mantle. Nature 1992, 358, 295–302. [Google Scholar] [CrossRef]
  94. Anderson, O.L. The Earth’s core and phase diagram of iron. Philos. Trans. R. Soc. Lond. Ser. A 1982, 306, 21–35. [Google Scholar] [CrossRef]
  95. Ringwood, A.E.; Major, A. Synthesis of Mg2SiO4-Fe2SiO4 solid solutions. Earth Planet. Sci. Lett. 1966, 1, 241–245. [Google Scholar] [CrossRef]
  96. Suito, K. Phase relations of pure Mg2SiO4 up to 200 kilobars. In High-Pressure Research-Applications in Geosciences; Manghnani, M.H., Akimoto, S.-I., Eds.; Academic Press: Cambridge, MA, USA, 1977; pp. 255–266. [Google Scholar]
  97. Frost, D.J. The upper mantle and transition zone. Elements 2008, 4, 171–176. [Google Scholar] [CrossRef]
  98. Dziewonski, A.M.; Anderson, D.L. Preliminary reference Earth model. Phys. Earth Planet. Inter. 1981, 25, 297–356. [Google Scholar] [CrossRef]
  99. Chung, D.H. Effects of iron/magnesium ratio on P- and S-wave velocities in olivine. J. Geophys. Res. 1970, 75, 7353–7361. [Google Scholar] [CrossRef]
  100. Mao, Z.; Jacobsen, S.D.; Jiang, F.; Smyth, J.R.; Holl, C.M.; Frost, D.J.; Duffy, T.S. Velocity crossover between hydrous and anhydrous forsterite at high pressures. Earth Planet. Sci. Lett. 2010, 293, 250–258. [Google Scholar] [CrossRef]
  101. Zhang, J.S.; Hu, Y.; Shelton, H.; Kung, J.; Dera, P. Single-crystal X-ray diffraction study of Fe2SiO4 fayalite up to 31 GPa. Phys. Chem. Miner. 2017, 44, 171–179. [Google Scholar] [CrossRef]
  102. Schmeling, H.; Monz, R.; Rubie, D.C. The influence of olivine metastability on the dynamics of subduction. Earth Planet. Sci. Lett. 1999, 165, 55–66. [Google Scholar] [CrossRef]
Figure 1. Optimized crystallographic structures of Fo at 0 GPa (a); Fo-II at 0 GPa (b) and 60 GPa (c); Fo-III at 0 GPa (d) and at 60 GPa (e); and Fo-IV at 0 GPa (f), at 20 GPa (g) and at 40 GPa (h). All structures were calculated at 0 K. The Si-O polyhedra are shown in light green and Mg-O polyhedra are shown in light grey. The Mg, Si and O atoms are represented by yellow balls, black balls and blue balls, respectively. Number in the parenthesis following the phase is pressure (GPa). Arrows in (b,d,f) indicate the moving directions of some particular O atoms, which lead to the formation of the corresponding structures at higher pressures. For the atomic labels and parameters see Supplementary Tables S1–S8.
Minerals 09 00186 g001
Figure 2. Evolution of the average bond length (dmean) and ECoN parameters of the polyhedra of the Fo phase as pressure increases from 0 to 100 GPa (0 K). For the information about the Mg(I) and Mg(II), see Supplementary Table S1.
Minerals 09 00186 g002
Figure 3. Evolution of the average bond length (dmean) and ECoN parameters of the polyhedra of the Fo-II phase as pressure increases from 0 to 100 GPa (0 K): (a) the [Si(I)O4] and [Si(II)O6] polyhedra; (b) the Mg-O polyhedra. For the information about the Si(I) and Si(II), and the Mg(I), Mg(II), Mg(III), Mg(IV) and Mg(V), see Supplementary Tables S2 and S3.
Minerals 09 00186 g003
Figure 4. Evolution of the average bond length (dmean) and ECoN parameters of the polyhedra of the Fo-III phase as pressure increases from 0 to 100 GPa (0 K). For the information about the Mg(I) and Mg(II), see Supplementary Tables S4 and S5.
Minerals 09 00186 g004
Figure 5. Evolution of the average bond length (dmean) and ECoN parameters of the polyhedra of the Fo-IV phase as pressure increases from 0 to 100 GPa (0 K). For the information about the Mg(I) and Mg(II), see Supplementary Tables S6–S8.
Minerals 09 00186 g005
Figure 6. V-P correlation of (a) Fo; (b) Fo-II; (c) Fo-III; and (d) Fo-IV. The black curve is drawn through our calculated result (0 K and GGA; Table 4) whereas the red curve is drawn through the experimental data points from Finkelstein et al. (ref. [37]; 300 K) or stands for the calculated result from Zhou et al. (ref. [40]; 0 K and LDA). The symbols in (ac) represent the experimental data from Finkelstein et al. (ref. [37]; 300 K).
Minerals 09 00186 g006
Figure 7. Calculated enthalpies at 0 K (H0: meV/atom) for the phase assemblages of Wds, Rwd, Aki + Pe, Brg + Pe, Fo-II, Fo-III and Fo-IV relative to the enthalpy of the Fo (0–100 GPa). Compared to the well-known high-T stable phase assemblage Brg + Pe, all the Mg2SiO4 polymorphs are metastable at P > ~24 GPa. Note that the phase transition P (~24.1 GPa) between Rwd and Brg + Pe at 0 K is in excellent agreement with the results from most experimental and theoretical studies in the literature (See Wentzcovitch et al. [66] for a summary).
Minerals 09 00186 g007
Figure 8. Calculated phonon dispersion curves for Fo from 0 to 100 GPa with a k-path Γ-X-S-Y-Γ-Z-U-R-T-Z|Y-T|U-X|S-R: (a) Fo at 0 GPa; (b) Fo at 10 GPa; (c) Fo at 20 GPa; (d) Fo at 30 GPa; (e) Fo at 40 GPa; (f) Fo at 50 GPa; (g) Fo at 60 GPa; (h) Fo at 70 GPa; (i) Fo at 80 GPa; (j) Fo at 90 GPa; (k) Fo at 100 GPa. The corresponding coordinates are Γ(0, 0, 0), X(0.5, 0, 0), S(0.5, 0.5, 0), Y(0, 0.5, 0), Z(0, 0, 0.5), U(0.5, 0, 0.5), R(0.5, 0.5, 0.5) and T(0, 0.5, 0.5).
Minerals 09 00186 g008
Figure 9. Calculated phonon dispersion curves for Fo-II from 0 to 100 GPa with a k-path X-Γ-Y|L-Γ-Z|N-Γ-M|R-Γ: (a) Fo-II at 0 GPa; (b) Fo-II at 10 GPa; (c) Fo-II at 20 GPa; (d) Fo-II at 30 GPa; (e) Fo-II at 40 GPa; (f) Fo-II at 50 GPa; (g) Fo-II at 60 GPa; (h) Fo-II at 70 GPa; (i) Fo-II at 80 GPa; (j) Fo-II at 90 GPa; (k) Fo-II at 100 GPa. The corresponding coordinates are X(0, −0.5, 0), Γ(0, 0, 0), Y(0.5, 0, 0), L(0.5, −0.5, 0), Z(−0.5, 0, 0.5), N(−0.5, −0.5, 0.5), M(0, 0, 0.5) and R(0, −0.5, 0.5).
Minerals 09 00186 g009
Figure 10. Calculated phonon dispersion curves for Fo-III from 0 to 100 GPa with a k-path Γ-X-S-R-A-Z-Γ-Y-X1-A1-T-Y|Z-T: (a) Fo-III at 0 GPa; (b) Fo-III at 10 GPa; (c) Fo-III at 20 GPa; (d) Fo-III at 30 GPa; (e) Fo-III at 40 GPa; (f) Fo-III at 50 GPa; (g) Fo-III at 60 GPa; (h) Fo-III at 70 GPa; (i) Fo-III at 80 GPa; (j) Fo-III at 90 GPa; (k) Fo-III at 100 GPa. The corresponding coordinates are Γ(0, 0, 0), X(0.27, 0.27, 0), S(0, 0.5, 0), R(0, 0.5, 0.5), A(0.27, 0.27, 0.5), Z(0, 0, 0.5), Y(−0.5, 0.5, 0), X1(−0.27, 0.73, 0), A1(−0.27, 0.73, 0.5) and T(−0.5, 0.5, 0.5).
Minerals 09 00186 g010
Figure 11. Calculated phonon dispersion curves for Fo-IV from 0 to 100 GPa with a k-path Γ-X-S-Y-Γ-Z-U-R-T-Z|Y-T|U-X|S-R: (a) Fo-IV at 0 GPa; (b) Fo-IV at 10 GPa; (c) Fo-IV at 20 GPa; (d) Fo-IV at 30 GPa; (e) Fo-IV at 40 GPa; (f) Fo-IV at 50 GPa; (g) Fo-IV at 60 GPa; (h) Fo-IV at 70 GPa; (i) Fo-IV at 80 GPa; (j) Fo-IV at 90 GPa; (k) Fo-IV at 100 GPa. The corresponding coordinates are Γ(0, 0, 0), X(0.5, 0, 0), S(0.5, 0.5, 0), Y(0, 0.5, 0), Z(0, 0, 0.5), U(0.5, 0, 0.5), R(0.5, 0.5, 0.5) and T(0, 0.5, 0.5).
Minerals 09 00186 g011
Figure 12. Calculated P-V curve for Fo-III at 300, 600, 900, 1200 and 1500 K from 0 to 100 GPa: (a) the GGA method (b) the LDA method. For comparison, the experimental results obtained by Finkelstein et al. [37] at 300 K are also shown.
Minerals 09 00186 g012
Figure 13. Calculated characteristic temperatures (TC) for Fo, Wds, Rwd, Aki, Brg, Pe and Fo-III from 0 to 30 GPa. The P-T profile of the cold slab or hot slab is sketched according to Thompson [93], while that of the normal mantle is from Anderson [94].
Minerals 09 00186 g013
Figure 14. Calculated P-T boundaries for the Fo/Wds, Wds/Rwd, Rwd/Aki + Pe, Rwd/Brg + Pe, Aki/Brg and Fo/Fo-III reactions at 10–28 GPa and 300–1900 K. The P-T profile of the cold slab or hot slab is sketched according to Thompson [93], while that of the normal mantle is from Anderson [94]. All data used in the calculation are from our theoretical simulation with the GGA method. According to Wentzcovitch et al. [66], all these phase boundaries at T < ~1500 K are potentially overestimated by ~3 GPa because of the used GGA method, as indicated for the Fo/Fo-III phase boundary by the arrow.
Minerals 09 00186 g014
Figure 15. Formation P-T conditions of metastable Fo-III. The P-T profile of the cold slab or hot slab is sketched according to Thompson [93], while that of the normal mantle is from Anderson [94]. The lowest temperatures for any possible phase transition from the Fo-rich Ol to its equilibrium phase or phase assemblage (from ~14 to ~24 GPa), as estimated in Sung and Burns [1], Wu et al. [26], Kirby et al. [6] and Devaux et al. [7], are shown as short lines 1, 2 (2a for hydrostatic condition and 2b for nonhydrostatic condition), 3 and 4, respectively. The potential P overestimate for the Fo/Fo-III phase boundary caused by the GGA method is indicated by the tiny red arrow.
Minerals 09 00186 g015
Figure 16. Calculated bulk sound velocity (vΦ)-depth profiles at 900, 1200 and 1500 K for Fo (a); and Fo-III (b). As a reference, the PREM bulk sound velocity model [98] is also sketched. The shown bulk sound velocity (vΦ) at 450 km depth, 600 km depth or 720 km depth and 900 K is calculated as ΔvΦ = 100 × (vΦ-FovΦ-PREM)/vΦ-PREM, where vΦ-Fo stands for vΦ-Fo in (a), and vΦ-Fo-III in (b). The GGA results at different T are shown as red lines while the LDA results as blue lines. For the purpose of illustration, the bulk sound velocity differences at certain depth obtained by the GGA method and the LDA method are slightly horizontally shifted.
Minerals 09 00186 g016
Figure 17. Calculated isothermal density-depth profiles at 900, 1200 and 1500 K for Fo (a); and Fo-III (b). As a reference, the PREM density model [98] is also sketched. The shown density difference (Δρ) at 450 km depth, 600 km or 720 km depth and 900 K is calculated as Δρ = 100 × (ρ-Foρ-PREM)/ρ-PREM, where ρ-Fo stands for ρ-Fo in (a), and ρ-Fo-III in (b). The GGA results at different T are shown as red lines while the LDA results as blue lines. For the purpose of illustration, the density differences at certain depth obtained by the GGA method and the LDA method are slightly horizontally shifted.
Minerals 09 00186 g017
Table 1. Selected setting parameters in static and quasiharmonic approximation calculations for Fo, Wds, Rwd, Aki, Brg, Pe, Fo-II, Fo-III and Fo-IV.
PhaseCompositionZk-Pointq-Point
FoMg2SiO443 × 3 × 324 × 24 × 24
WdsMg2SiO484 × 4 × 424 × 24 × 24
RwdMg2SiO483 × 3 × 324 × 24 × 24
AkiMgSiO364 × 4 × 424 × 24 × 24
BrgMgSiO344 × 4 × 424 × 24 × 24
PeMgO44 × 4 × 424 × 24 × 24
Fo-IIMg2SiO443 × 3 × 3-
Fo-IIIMg2SiO444 × 4 × 424 × 24 × 24
Fo-IVMg2SiO444 × 4 × 4-
Fo, forsterite; Wds, wadsleyite; Rwd, ringwoodite; Aki, akimotoite; Brg, bridgmanite; Pe, periclase; Fo-II, forsterite-II; Fo-III, forsterite-III; Fo-IV, forsterite-IV.
Table 2. Space groups and optimized unit-cell parameters of Fo, Fo-II, Fo-III and Fo-IV at 0 GPa (0 K).
PhaseFoFo-IIFo-IIIFo-IV
Space groupPbnmP1Cmc21P21212
a (Å)4.78665.08382.792310.0545
b (Å)10.273210.00379.46645.1286
c (Å)6.01885.76339.42665.0421
α (°)9092.0639090
β (°)90107.6499090
γ (°)9099.2169090
V3)295.96274.58249.17260.00
Table 3. Comparison of unit-cell parameters for Fo, Fo-II, Fo-III and Fo-IV.
PhaseFoFo-IIFo-IIIFo-IV
SourceThis StudyH1976This StudyF2014This StudyF2014This StudyZ2015
P (GPa)00.000152.452.458.258.200
T (K)02960298029800
a (Å)4.78664.752(3)4.71004.683(2)2.61302.640(2)10.05459.927
b (Å)10.273210.193(8)9.26179.21(3)8.75618.596(8)5.12865.063
c (Å)6.01885.977(5)5.33365.317(6)8.84569.04(4)5.04214.967
α (°)909093.14393.0(2)90909090
β (°)9090107.014106.94(5)90909090
γ (°)909097.90097.8(1)90909090
V3)295.96289.5(3)219.26216.4(7)202.38205(1)260.00249.64
H1976, Hazen [54]; F2014, Finkelstein et al. [37]; Z2015, Zhou et al. [40]. Data for 0 K are from theoretical simulation whereas those for 298 K are from compression experiments.
Table 4. Parameters of 3rd BM-EoS for Fo, Fo-II, Fo-III and Fo-IV at 0 K.
PhaseFoFo-IIFo-IIIFo-IV
volumeV03, fixed)295.96274.58249.17260.00
KT (GPa)127.3(5)155.9(7)184.9(8)163.4(8)
K T 3.96(3)3.75(4)4.11(5)3.94(4)
KT (GPa; K T = 4.0)126.6(1)151.5(2)186.7(1)162.3(1)
a-axisa0 (Å, fixed)4.78665.08382.792310.0545
KT (GPa)159(3)131.1(5)185.5(9)142.4(7)
K T 9.5(3)4.82(2)4.53(4)3.40(2)
b-axisb0 (Å, fixed)10.273210.00379.46645.1286
KT (GPa)97.2(7)155.4(5)151.5(15)275.5(20)
K T 3.13(2)3.33(2)4.17(6)7.00(11)
c-axisc0 (Å, fixed)6.01885.76339.42665.0421
KT (GPa)113(1)137.2(2)200.4(4)111.2(5)
K T 4.2(1)4.31(9)4.38(2)3.98(2)
Table 5. P range of the thermodynamically stable phase assemblage for the Mg2SiO4 composition and P for the polymorphic phase transition from Fo, Wds and Rwd to Fo-II, Fo-III and Fo-IV, based on our calculated enthalpies at 0 K (0–100 GPa; Figure 7).
Stable Phase AssemblageP Range (GPa)Phase TransitionTransition P (GPa)
Fo0~10.3Fo → Fo-III22.1
Wds10.3~12.9Fo → Fo-IV24.9
Rwd12.9~19.6Fo → Fo-II32.2
Aki + Pe19.6~26.3Wds → Fo-III30.6
Brg + Pe>26.3Wds → Fo-IV41.1
Rwd → Fo-III36.2
Rwd → Fo-IV55.5
Table 6. Calculated and/or experimental thermodynamic properties for Fo, Wds, Rwd, Aki, Brg, Pe and Fo-III at 1 atm and 300 K.
PhaseV aKT K T KSvΦαγthSCVCP
Å3GPa GPakm/s10−6/K J/(mol K)J/(mol K)J/(mol K)
Theoretical result (GGA; this study)
Fo301.85113.74.21115.356.1033.531.43103.15121.52123.26
Wds559.51152.14.22153.726.7825.571.3694.51120.26121.51
Rwd544.33169.34.24170.867.0522.781.3290.11119.33120.41
Aki273.94185.54.26187.177.1622.101.3759.0382.2282.97
Brg169.53221.84.02224.537.5624.721.6562.7484.8985.93
Pe77.48145.04.17147.636.5437.401.6430.0938.4839.19
Fo-III253.43171.34.27173.956.8731.671.65101.58125.28127.24
Fo-III b238.05202.44.26204.937.2326.161.5889.91119.96121.44
Experimental result
Fo c290.06127.44.30128.326.3122.601.0794.32117.95118.79
Wds c538.55169.04.14170.217.0020.301.1986.18117.34118.18
Rwd c524.73187.43.98188.687.2818.911.2181.92115.68116.47
Aki c262.53215.34.91218.847.5827.582.0052.1078.2579.53
Brg c162.40252.04.38254.897.8822.591.7057.6981.8982.83
Pe d74.71160.34.25162.486.7330.381.5026.9036.4536.95
Relative difference between the GGA result and the experimental result (%)
Fo4.1−10.8−2.1−10.1−3.348.433.69.43.03.8
Wds3.9−10.01.9−9.7−3.126.014.39.72.52.8
Rwd3.7−9.76.5−9.7−3.220.59.110.03.73.4
Aki4.3−13.8−13.2−14.5−5.5−19.9−31.513.35.14.3
Brg4.4−12.0−8.2−11.9−4.19.4−2.98.83.73.7
Pe3.7−9.5−1.9−9.1−2.823.19.311.95.66.1
a for unit cell. b simulated with the LDA method. c Dorogokupets et al. [89]. d Skolova et al. [90].
Table 7. Polynomial fitting results for α, γth, CV and CP from 300 to 1500 K at different P (GPa), calculated using the GGA method.
Pα = a0 + a1 × T + a2 × T−2 γth = a0 + a1 × T−0.5 + a2 × T−2 + a3 × T−3
105a0109a1a2AAD (%) a0a110−4a210−6a3AAD (%)
03.774(2)5.99(2)−0.734(3)0.10 1.5668(3)−1.63(1)2.34(1)−2.25(2)0.07
103.149(3)4.41(2)−0.741(4)0.17 1.5545(4)−2.00(2)2.21(2)−2.41(4)0.11
202.702(3)3.51(3)−0.728(4)0.24 1.5350(5)−2.23(2)2.08(2)−2.49(5)0.14
302.367(4)2.95(3)−0.706(4)0.30 1.5119(6)−2.38(2)1.98(2)−2.58(5)0.15
402.106(4)2.57(3)−0.681(5)0.36 1.4867(6)−2.48(3)1.91(2)−2.68(5)0.16
501.895(4)2.31(3)−0.656(5)0.41 1.4603(6)−2.54(3)1.86(2)−2.76(5)0.17
601.722(4)2.12(3)−0.632(5)0.47 1.4330(6)−2.57(3)1.80(3)−2.80(6)0.18
701.577(4)1.97(3)−0.608(5)0.52 1.4050(7)−2.59(3)1.73(3)−2.79(6)0.19
801.453(4)1.86(3)−0.586(5)0.58 1.3765(7)−2.58(3)1.64(3)−2.71(6)0.20
901.346(4)1.78(3)−0.565(5)0.64 1.3474(7)−2.56(3)1.52(3)−2.55(6)0.21
1001.252(4)1.71(3)−0.545(5)0.70 1.3179(7)−2.52(3)1.36(3)−2.31(6)0.22
PCV = a0 + a1 × T−0.5 + a2 × T−2 + a3 × T−3CP = a0 + a1 × T−0.5 + a2 × T−2 + a3 × T−3
a010−2a110−6a210−8a3AAD (%)a010−2a110−6a210−8a3AAD (%)
0186.6(2)−3.78(9)−4.77(9)3.5(2)0.56247.2(8)−21.6(3)4.2(3)−11.5(7)1.83
10171.9(0)1.07(1)−8.61(1)10.1(0)0.05218.7(4)−12.6(2)−1.9(2)−1.0(3)0.93
20169.5(1)1.90(3)−9.99(3)12.5(1)0.17208.2(2)−9.4(1)−4.6(1)3.4(2)0.62
30170.0(1)1.75(3)−10.77(3)13.8(1)0.20203.0(2)−7.86(8)−6.16(7)6.2(2)0.48
40171.1(1)1.41(3)−11.38(3)14.9(1)0.20199.8(2)−6.97(6)−7.39(6)8.3(1)0.40
50172.0(1)1.07(3)−11.96(3)16.0(1)0.21197.4(1)−6.33(5)−8.45(5)10.2(1)0.34
60172.8(1)0.79(3)−12.53(3)17.1(1)0.22195.5(1)−5.83(4)−9.40(4)11.9(1)0.28
70173.5(1)0.55(4)−13.09(4)18.2(1)0.25193.8(1)−5.41(4)−10.37(3)13.6(1)0.24
80173.9(1)0.36(4)−13.63(4)19.3(1)0.28192.4(1)−5.05(3)−11.08(3)15.1(1)0.20
90175.2(1)−0.01(4)−14.02(4)20.1(1)0.28192.0(1)−4.96(3)−11.68(3)16.2(1)0.22
100174.6(1)0.05(5)−14.65(5)21.4(1)0.35190.0(1)−4.48(3)−12.52(2)17.9(1)0.18
Table 8. Polynomial fitting results for α, γth, CV and CP from 300 to 1500 K at different P (GPa), calculated using the LDA method.
Pα = a0 + a1 × T + a2 × T−2 γth = a0 + a1 × T + a2 × T−1 + a3 × T−2
105a0109a1a2AAD (%) a0105a1a210−3a3AAD (%)
03.244(2)6.20(2)−0.763(3)0.13 1.4519(2)4.01(1)15.1(1)6.11(2)0.03
102.756(3)4.44(3)−0.749(4)0.21 1.4170(1)3.34(1)12.5(1)4.68(2)0.02
202.398(3)3.44(3)−0.726(4)0.29 1.3863(1)2.86(0)11.1(1)3.36(1)0.02
302.125(4)2.82(3)−0.701(5)0.36 1.3592(1)2.51(1)10.6(1)2.16(2)0.02
401.911(4)2.41(3)−0.676(5)0.42 1.3354(1)2.24(1)10.3(1)1.08(2)0.02
501.740(4)2.12(3)−0.653(5)0.49 1.3145(1)2.01(1)9.9(1)0.18(2)0.03
601.600(4)1.92(3)−0.632(5)0.55 1.2964(1)1.80(1)9.4(1)−0.53(2)0.02
701.484(4)1.77(3)−0.612(5)0.61 1.2809(1)1.61(0)8.5(1)−1.01(1)0.02
801.386(4)1.66(4)−0.594(5)0.67 1.2679(1)1.41(0)7.0(0)−1.23(1) 0.01
901.303(5)1.58(4)−0.578(6)0.73 1.2573(0)1.20(0)4.9(0)−1.17(0)0.00
1001.233(5)1.52(4)−0.563(6)0.79 1.2490(1)0.97(0)2.0(1)−0.78(1)0.02
PCV = a0 + a1 × T−0.5 + a2 × T−2 + a3 × T−3CP = a0 + a1 × T−0.5 + a2 × T−2 + a3 × T−3
a010−2a110−6a210−8a3AAD (%)a010−2a110−6a210−8a3AAD (%)
0163.0(2)4.20(8)−10.58(8)13.6(2)0.49215.2(3)−11.2(1)−2.9(1)0.7(2)0.72
10167.6(1)2.64(5)−10.56(4)13.4(1)0.29208.9(2)−9.5(1)−4.61(9)3.5(2)0.61
20169.8(1)1.88(3)−10.98(3)14.1(1)0.22203.8(2)−8.11(8)−6.15(8)6.1(2)0.51
30171.1(1)1.43(3)−11.54(3)15.1(1)0.20200.0(2)−7.05(7)−7.48(6)8.4(1)0.42
40171.9(1)1.11(3)−12.14(3)16.3(1)0.21197.2(1)−6.26(5)−8.64(5)10.5(1)0.34
50172.6(1)0.86(3)−12.74(3)17.4(1)0.22195.0(1)−5.69(4)−9.65(4)12.3(1)0.28
60173.2(1)0.63(4)−13.31(4)18.6(1)0.25193.4(1)−5.26(3)−10.55(3)14.0(1)0.23
70173.8(1)0.41(4)−13.87(4)19.7(1)0.28192.2(1)−4.96(3)−11.35(3)15.6(1)0.19
80174.3(1)0.20(5)−14.40(4)20.8(1)0.32191.3(1)−4.76(3)−12.09(2)17.0(1)0.17
90174.9(1)−0.02(5)−14.90(5)21.9(1)0.36190.6(1)−4.63(3)−12.76(2)18.4(1)0.18
100175.4(1)−0.23(6)−15.38(5)22.9(1)0.41190.2(1)−4.57(3)−13.38(3)19.7(1)0.21

