Article

In Situ Infrared Spectra for Hydrous Forsterite up to 1243 K: Hydration Effect on Thermodynamic Properties

1
State Key Laboratory of Geological Processes and Mineral Resources, China University of Geosciences, Wuhan 430074, China
2
Department of Geological Sciences, University of Colorado, Boulder, CO 80309, USA
3
School of Earth Sciences, China University of Geosciences, Wuhan 430074, China
*
Author to whom correspondence should be addressed.
Minerals 2019, 9(9), 512; https://doi.org/10.3390/min9090512
Submission received: 26 July 2019 / Revised: 19 August 2019 / Accepted: 21 August 2019 / Published: 25 August 2019

Abstract

:
Hydrogen substitution has significant effect on the physical properties of olivine, the most abundant mineral in the upper mantle. We collected high-temperature polarized Fourier Transform infrared (FTIR) spectra on hydrous forsterite (Mg-pure olivine) crystals, which were synthesized at 12 GPa, 1473–1673 K. The modes at 3612, 3578, 3566, 3551 cm−1 show comparable negative temperature dependence, and the magnitude of (∂vi/∂T)P decreases dramatically with frequency increasing. Whereas, the peak at 3477 cm−1, which is attributed to protonation along the O1...O2 edge on the Si tetrahedron, has a positive temperature dependence. The absorbance intensities of all these OH bands remained almost the same when quenched to room temperature. On the other hand, we also evaluate the hydration effect on the thermodynamic properties (heat capacities). For the anhydrous forsterite sample, the intrinsic anharmonicity could significantly increase the heat capacity by 5~6% when extrapolated to 2000 K. Hydration further increase such difference to ~9%, in both the cases of M-substitution or Si-substitution. Hence, hydration in olivine has significant impact on the anharmonic contribution to the thermodynamic properties, as well as Equations of State and equilibrium isotope fractionation β-factor at high-P,T conditions in the deep mantle.

1. Introduction

Water is incorporated into many nominally anhydrous minerals (NAMs) in the form of hydrogen (H) point defects inside the crystal structures, which is fundamental to our understanding of water cycling in the deep Earth. Olivine, which constitutes ~50–60 vol. % of the upper mantle above the 410-km discontinuity, can take up significant water (hydroxyl groups) inside the lattice, as much as a few thousand ppmw (e.g., [1,2,3,4,5,6,7]). On the other hand, the presence of water inside the crystal structure can dramatically affect the physical and chemical properties of olivine, such as thermal and electrical conductivity [8,9], deformantion [10], diffusivity [11,12,13,14,15]. elastic properties [16].
Many experimental and theoretical studies have been reported exploring the hydrogen substitution mechanisms: (1) Mg2+/Fe2+ vacancies [1,2,6,13,14,15,16,17,18,19,20,21,22,23,24,25,26], which is the most common substitution in many hydrous silicate minerals; (2) Si4+ vacancies [27,28,29,30,31,32,33,34,35]; (3) combinations of Mg2+, Si4+, Ti4+, with M3+ vacancies [28,29,31,36,37,38,39,40,41,42,43]. In addition, another hydration mechanism with F-substitution is also proposed in both Fe-free and Fe-bearing olivine [44].
It is clear that the pressure conditions for the formation of hydrous olivine will have significant impact on the H substitution mechanisms. Taking the composition of Mg2SiO4 (forsterite) for example, if the hydrous forsterite were synthesized at the pressure conditions below 3 GPa (less than 100 km depth in the deep Earth), some strong OH stretching modes were observed in the low frequency range of 3000–3450 cm−1 by FTIR measurements [4,20,28,36,45,46,47,48]. While for the samples synthesized at pressures greater than 12 GPa (~350 km depth), the OH bands were only detected in the frequency range above 3450 cm−1 [1,2,7,23,49].
On the other side, it should be noted that the intrinsic anharmonicity (which will be described in more details in the following discussion, Section 3.4) plays an important role in simulating the thermodynamic properties of minerals at the high-temperature conditions of the deep mantle, such as heat capacities [50,51], P-V-T Equations of State [52,53], equilibrium isotope fractionation at high-P,T condition [54,55], etc. Gillet et al. [50] revealed that the anharmonic contribution to the heat capacity of anhydrous forsterite could be as large as 5.5% at 2000 K, while Qin et al. [33] and Marcondes et al. [56] also pointed out the anharmonic effects might be even more important when weak bonds (such as H bond) are involved.
In this study, we carried out high-temperature unpolarized and polarized FTIR measurements on the hydrous forsterite samples from Smyth et al. [2] (CH2O = 3400~5000 ppmw), and have more tight constraints on the temperature-dependence of the OH vibrational bands. Combining with the previous high-pressure and high-temperature Raman experiments on the hydrous forsterite samples [24,57], we will provide a detailed analyses of hydration effect on the anharmonic correction to the thermodynamic properties (such as heat capacities) of forsterite, in both the cases of M-substitution and Si-substitution, which should be significant and important for modeling the thermodynamics in the upper mantle.

2. Materials and Methods

2.1. Sample Preparation

In this experiment, we selected three simple crystal samples of hydrous forsterite with double-sided polishing: an unoriented crystal called Fo-unoriented (SZ0409B, 40 × 100 × 13 μm3, d = 13μm), while two oriented samples named Fo001 (SZ0501B, 80 × 70 × 16 μm3) and Fo010 (SZ0410B, 70 × 90 × 11 μm3) in the directions of (001) and (010), respectively. These hydrous samples were synthesized at 12 GPa in the 5000-ton multi-anvil press apparatus at Bayerisches Geoinstitut [2], and the experimental temperatures are 1673 K and 1473 K for the oriented and unoriented ones, respectively. Based on the updated calibration from Withers et al. [58], the estimated water contents for these hydrous forsterite samples are about 3987 ± 171 ppmw for the unoriented piece, while 3451 ± 348 and 4665 ± 474 ppmw for the Fo001 and Fo010 samples, respectively.

2.2. FTIR at High Temperature

FTIR experiments were carried out on a Nicolet 5700 FTIR spectrometer at the State Key Laboratory of Geological Processes and Mineral Resources, China University of Geosciences (Wuhan). The spectrometer was equipped with a Continumm microscope, a KBr beam splitter and a liquid-nitrogen-cooled MCT-A detector. A wire grid IR polarizer was applied to obtain polarized spectra. For the high-temperature IR absorption experiments, an external Linkam FTIR1500 heating stage with windows of sapphire slices. The heating stage was placed on the sample stage of the microscope and the sample chamber inside was filled with N2 as a protecting gas at high temperatures. During the measurements, high temperatures were achieved by a resistance heater inside the heating stage and measured by an automatic temperature control unit (a Linkam TMS94) which could be programmed with the accuracy of 0.1 °C. Spectrum was recorded in the wavenumber range of 3000–4000 cm−1 by 256 scans, with a resolution of 4 cm−1.
We collected both unpolarized and polarized FTIR spectra on the two oriented crystal pieces, as well as unpolarized spectra on the Fo-unoriented, in the temperature range from 293 K to 1243 K with an increment of 50 K. At each target temperature, temperature was maintained for at least 5 min before measurement for thermal equilibrium inside the sample chamber. To analyze temperature dependence of each OH band in the samples, Peakfit v4.12 software was adopted [41,51].

3. Results and Discussion

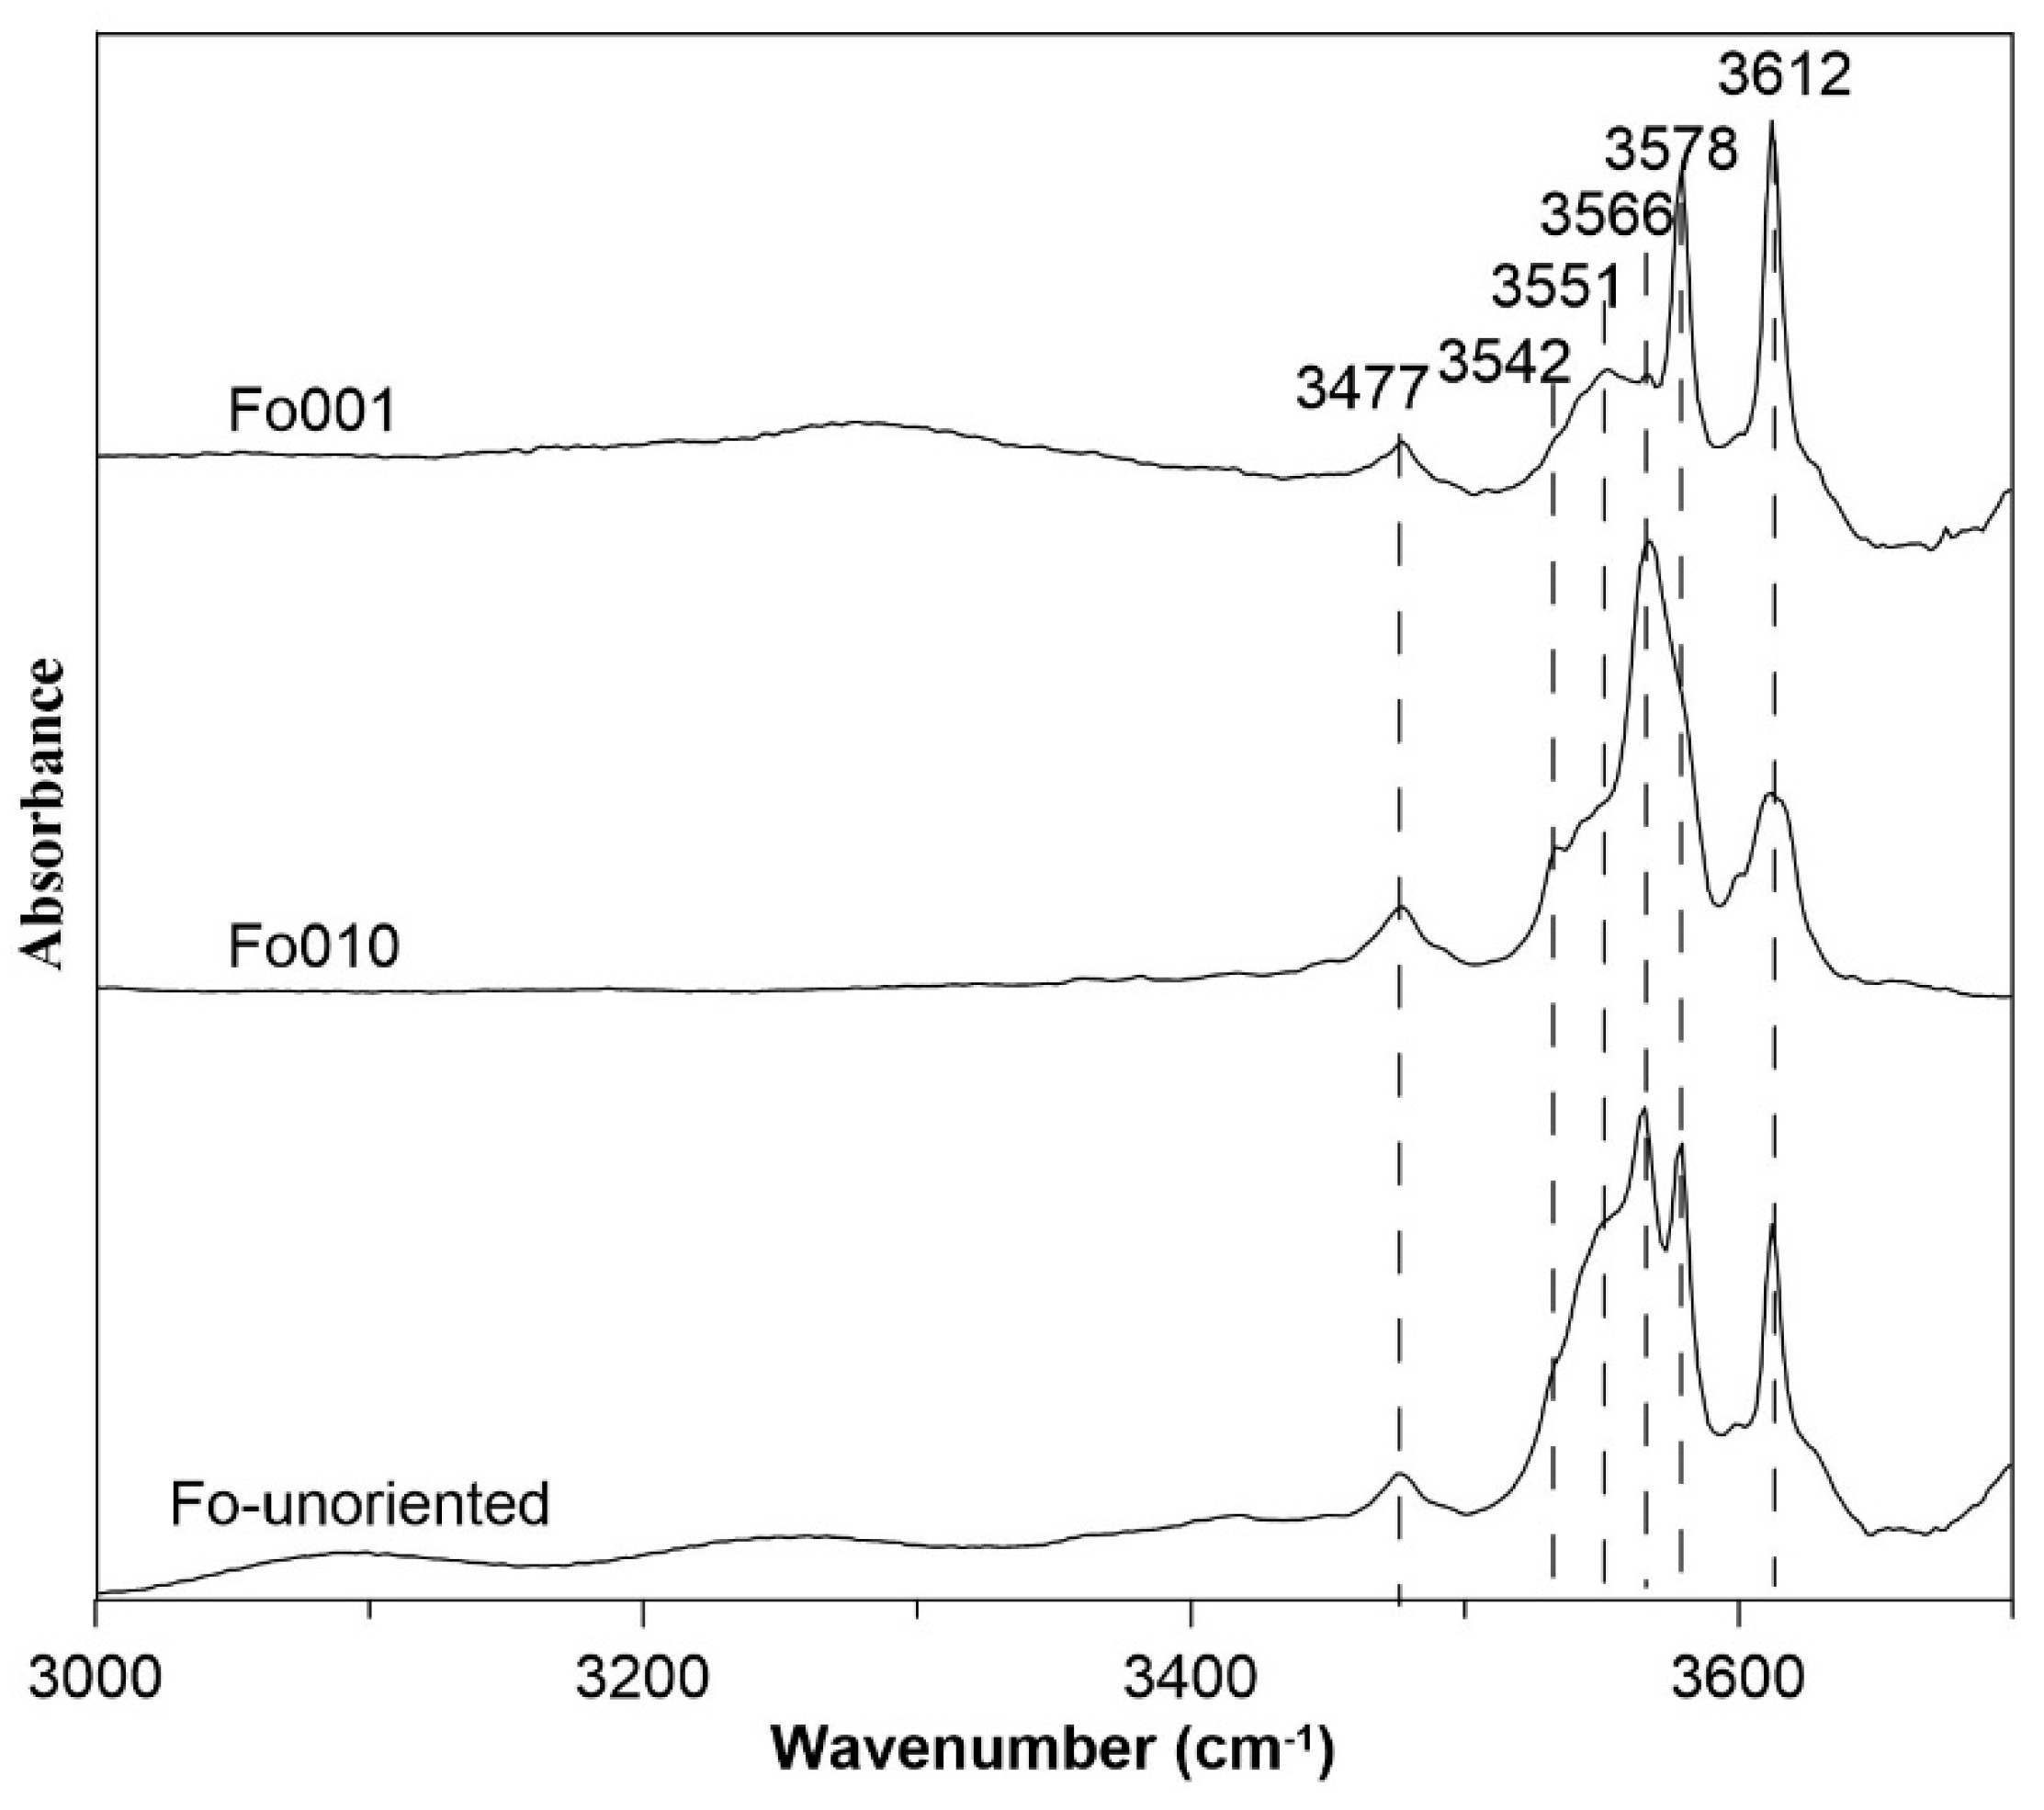
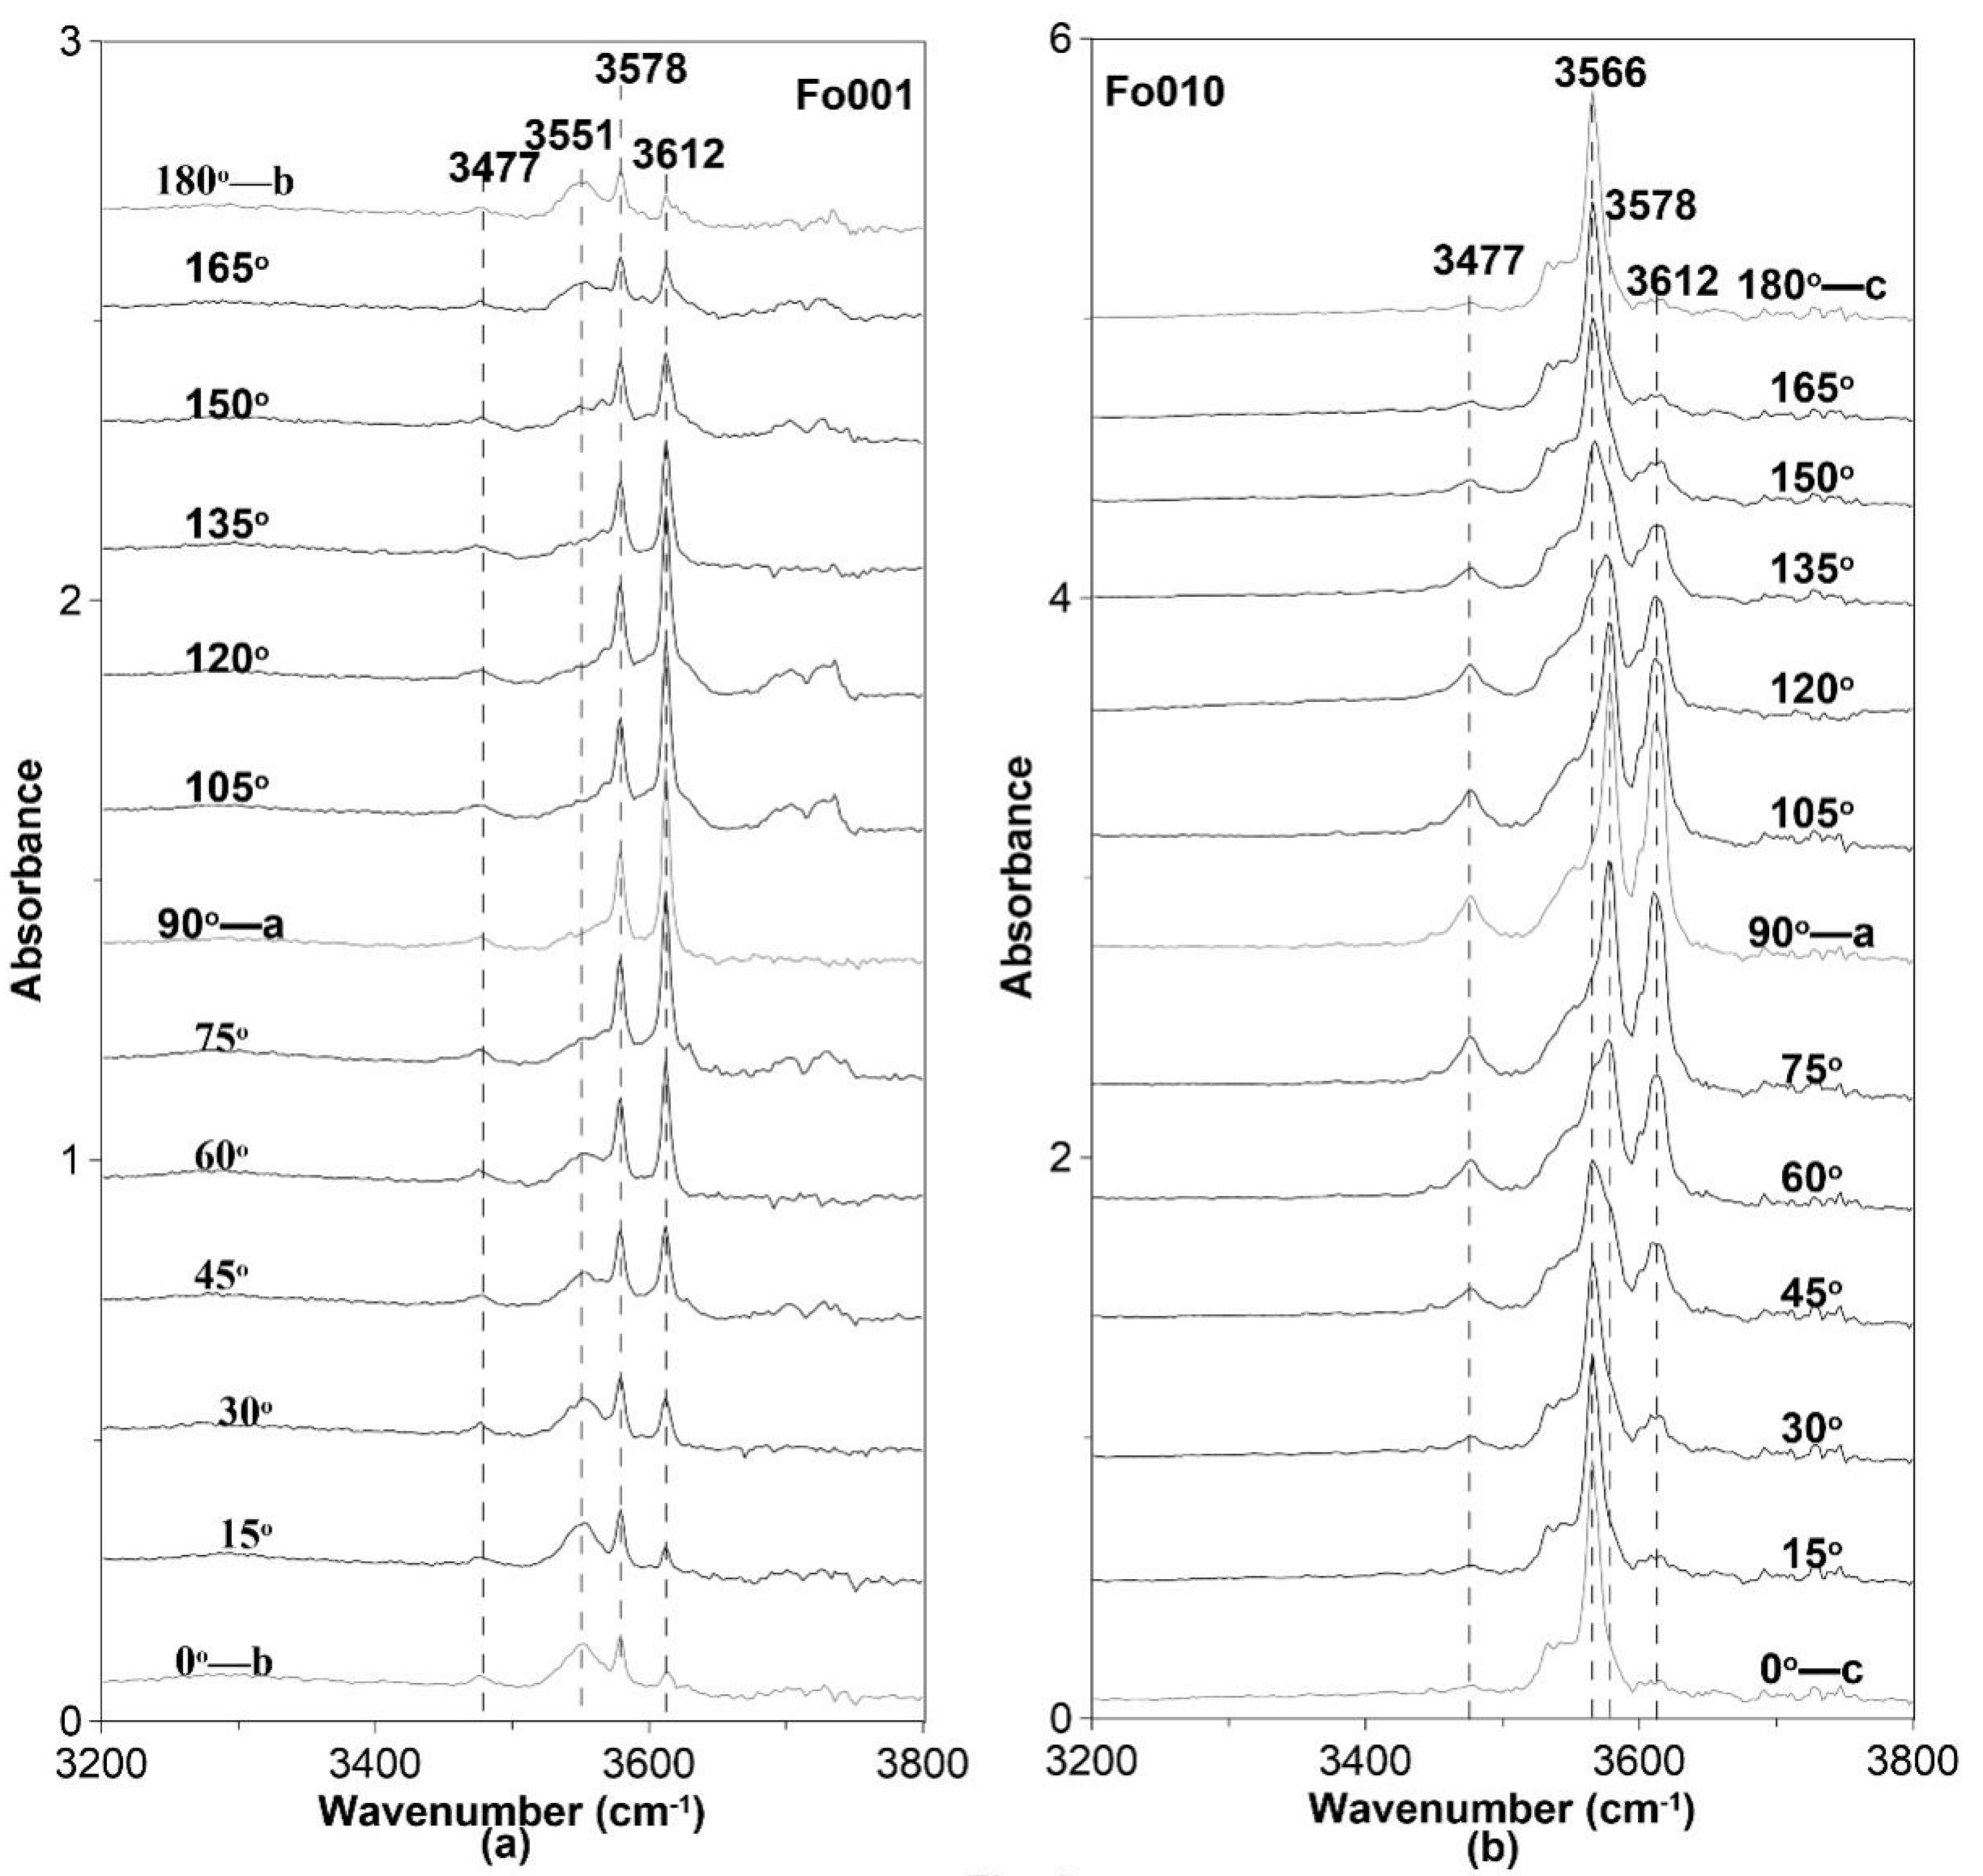
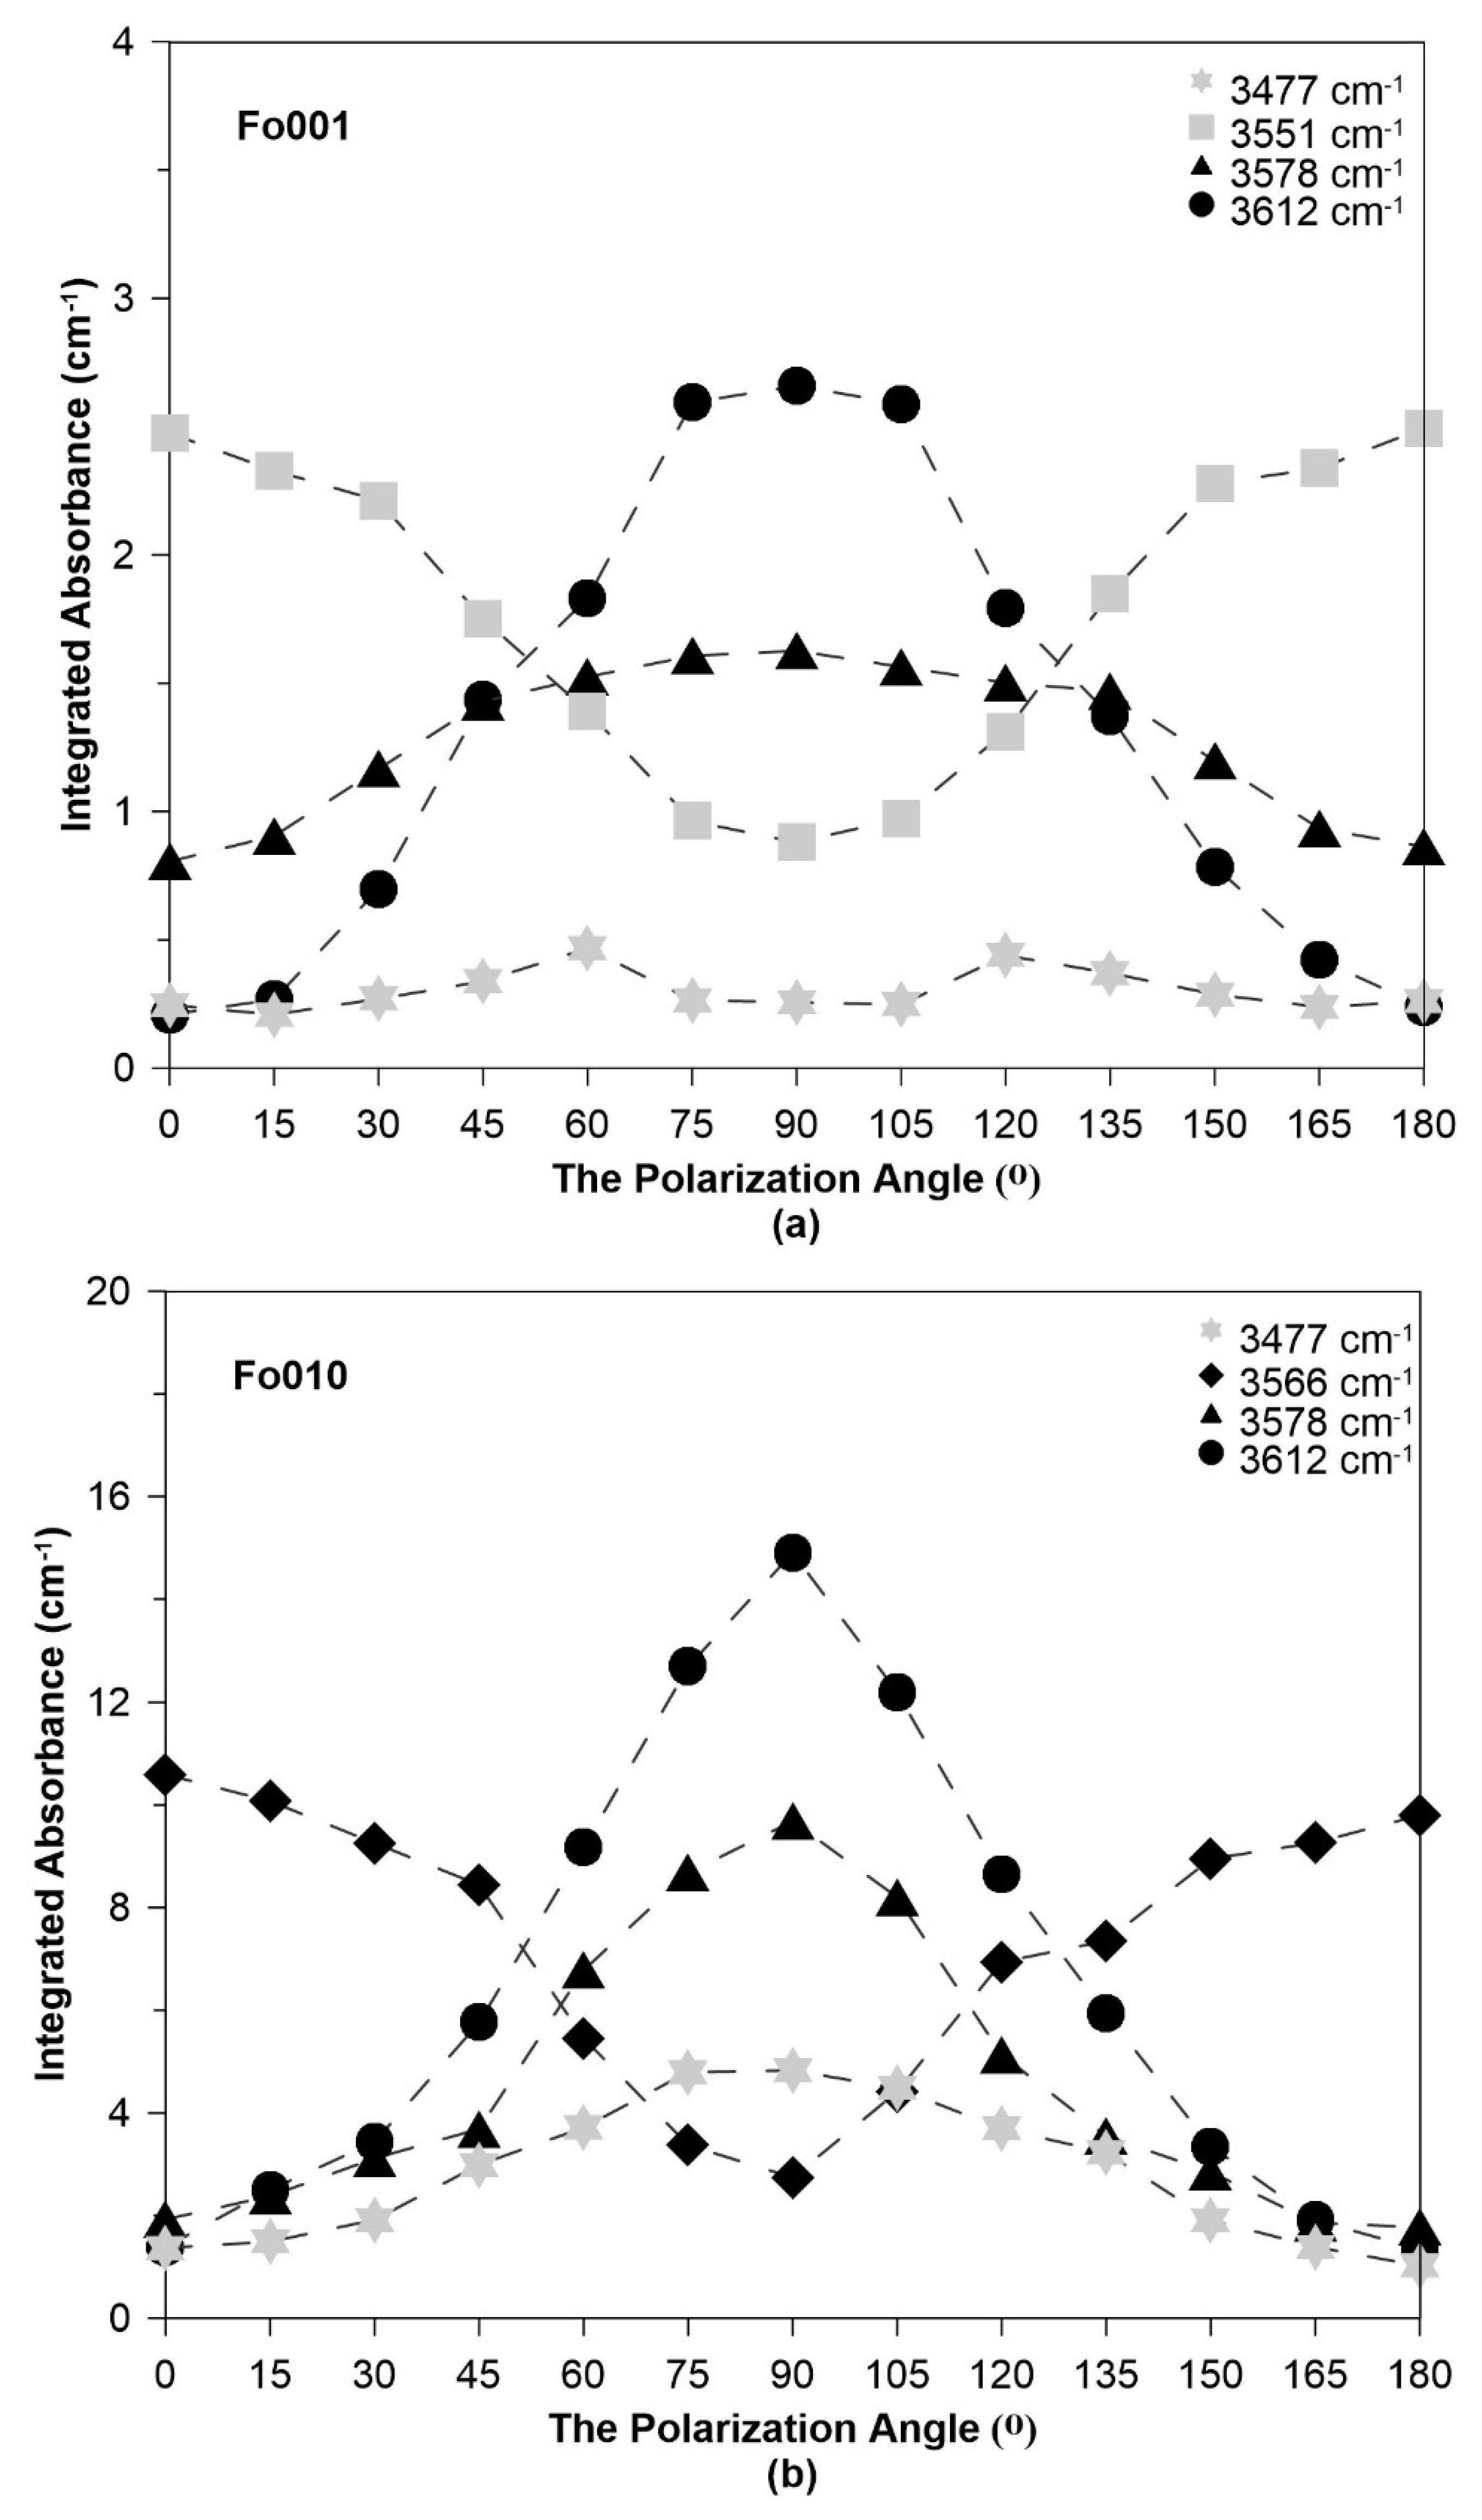
3.1. Polarized FTIR Spectra at Ambient Temperature

The unpolarized FTIR spectra of these hydrous forsterite samples at ambient condition are presented in Figure 1, with the OH bands distributed in the frequency range of 3450–3620 cm−1. Peaks at 3612, 3578, 3566, 3552, and 3477 cm−1 are well resolved for the Fo-unoriented sample, while the extra peak at 3542 cm−1 could be further identified in the Fo010. We also collected polarized FTIR spectra of oriented Fo001 and Fo010 samples at room temperature (Figure 2a,b), in a rotation range from 0 to 180° with an interval of 15°. We selected the a-axis as the polarization angle of 90°, and consequently the c and b axes were aligned in the direction of 0° (or 180°) for the Fo001 and Fo010 samples, respectively. Variation of the integrated absorbance for these OH bands with the rotation angle could be clearly resolved for the OH bands at 3612, 3578, 3566, 3551, and 3477 cm−1 (Figure 3a,b).
The E//a spectra show strong absorption for the OH bands at 3612 and 3578 cm−1 for Fo001 and Fo010 samples. The peaks at 3566 and 3551 cm−1 show minimum absorptions with E//a, while maximum absorptions with E//c (Figure 3a) and E//b (Figure 3b), respectively. The polarized spectra of Fo010 show the strongest absorption for band at 3477 cm−1 with E//a, with respect to E//c. These results are generally consistent with the earlier polarized FTIR measurements [2,4,23,36]. Hence, the polarization phenomena for the OH bands are nearly independent with the water concentration inside the crystal structure.

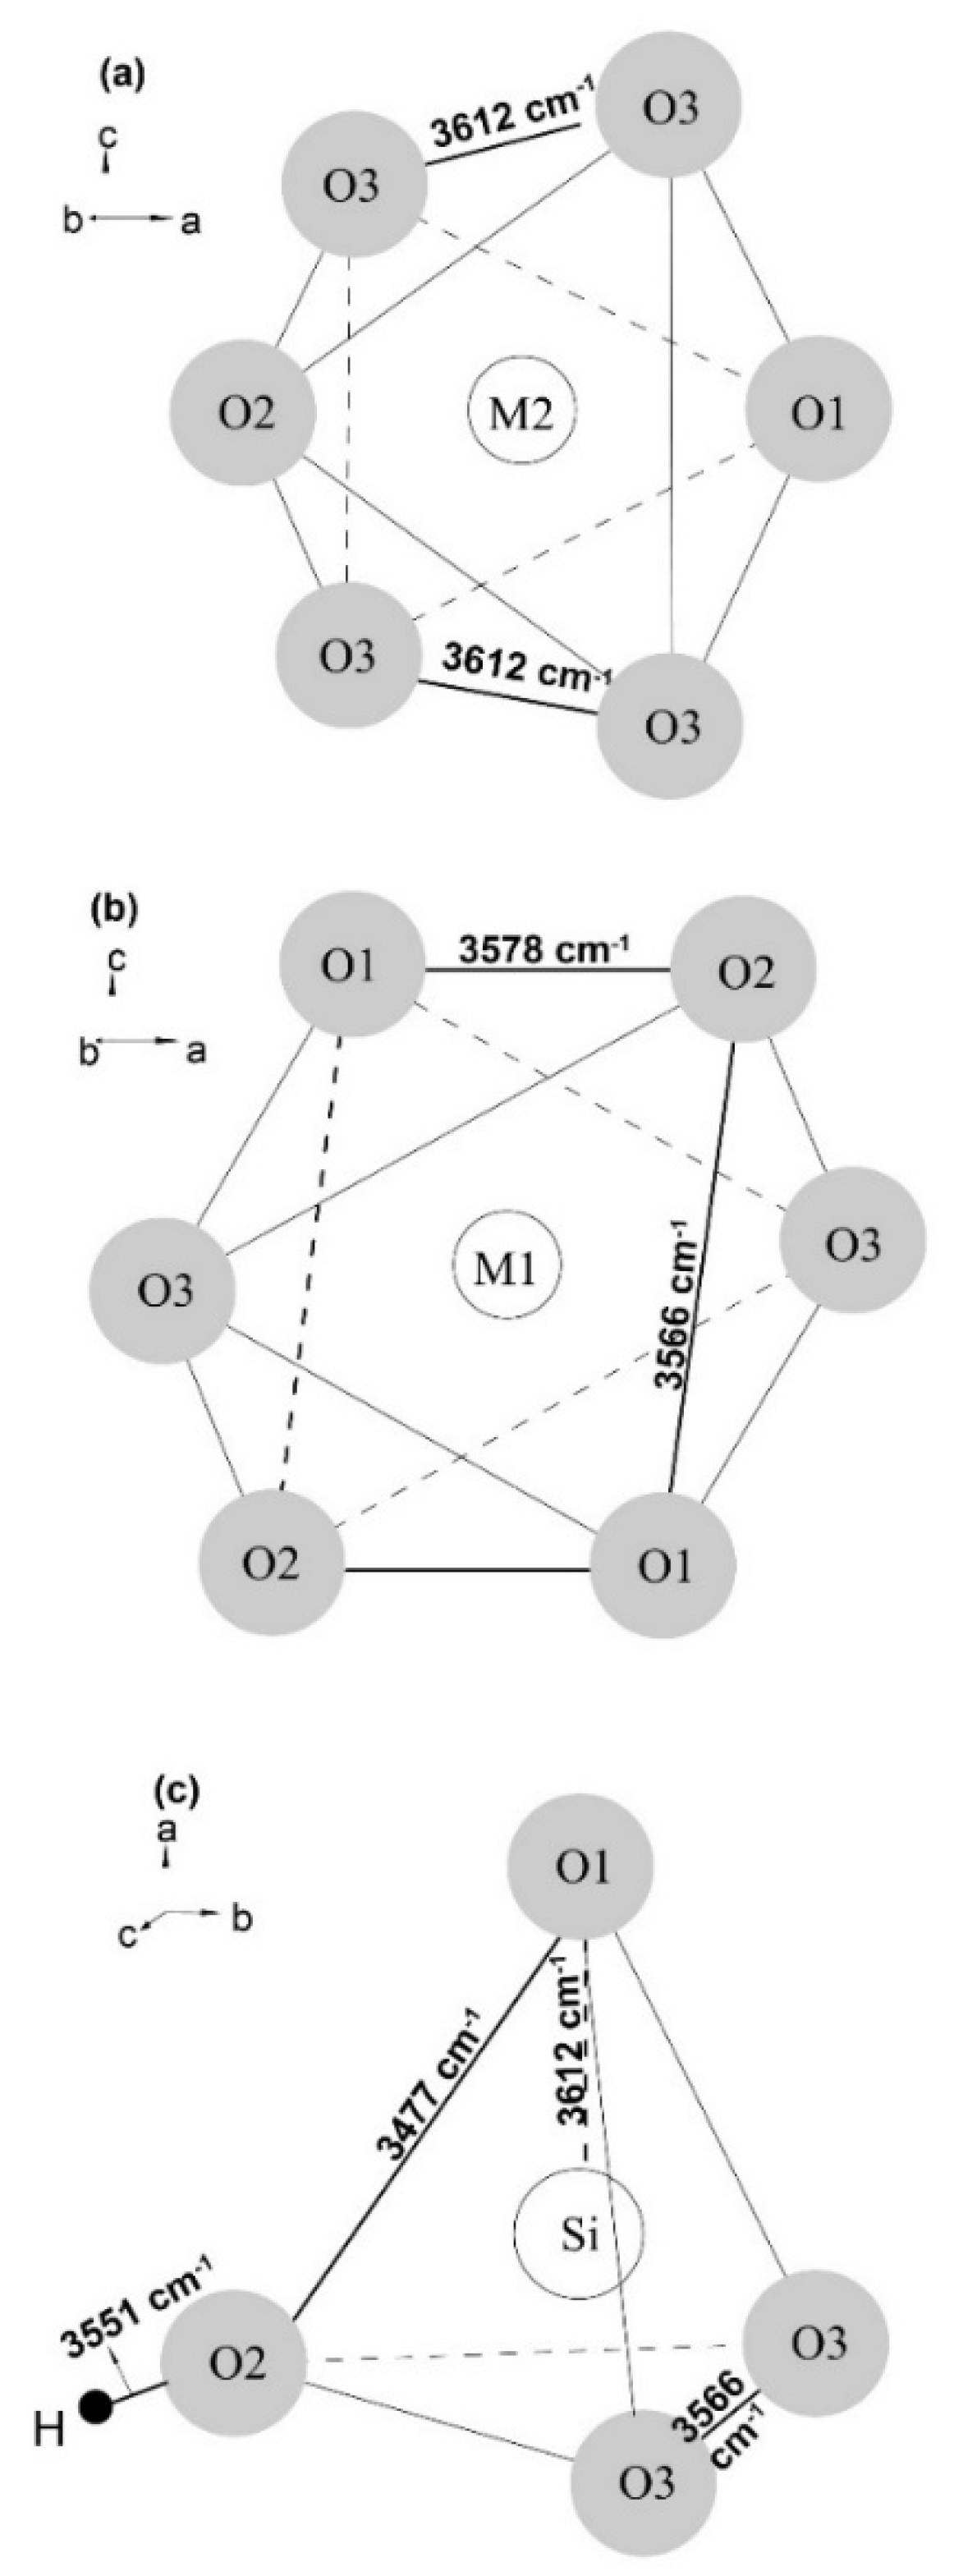
3.2. Hydrogen Substitution Mechanism

There has been a long debate on the hydration mechanism in Mg-pure forsterite and Fe-bearing olivine: M-substitution (Mg2+ = 2H+) [1,2,6,13,14,15,17,18,19,20,21,22,23,24], and Si-substitution (Si4+ = 4H+) [27,28,29,30,31,32,33,34,36,41]. The polarized FTIR spectra in this study could provide an experimental check for the hydration positions inside the crystal structure for either case of M-substitution or Si-substitution.
The OH stretching vibrations at 3612 cm−1, with a calculated O...O bond length (dO...O) of 3.05 Å [59], is strongly polarized along a axis. Mg substitution mechanism has proposed that the most likely attribution of this OH band is the O3...O3 edge (dO3…O3 = 2.99 Å as refined from Hushur et al., [24]) in the M2 octahedron [2] (Figure 4a). While others [24,49] attribute it to the O1...O2 edge shared between M1 octahedra but with a short length of 2.85 Å, our polarized FTIR spectra support such site should be more proper for the band at 3578 cm−1 in the following discussion. On the other side, Lemaire et al. [36] associated this band with a O–H bond toward Si vacancy along O1–VSi (Figure 4c) perfectly in the a direction. Meanwhile, the theoretical calculations [30,31,32,33] attribute it to protonation along the O1...O2 edge in SiO4 tetrahedron, which deflects away from the a axis with an intersection angle ~ 31°.
The OH band at 3578 cm−1 is also polarized along the a axis at a lower frequency (a shorter O…O edge) as compared with the one at 3612 cm−1. The peak of 3578 cm−1 used to be attributed to H located along the unshared O1–O2 (2.85 Å) edge of the M1 octahedron [2,16] (Figure 4b). The studies supporting Si-substitution assign this band to protonation along the O1...O2 edge (2.75 Å) [36] or along the O1...O3 edge (2.76 Å) of Si tetrahedron [30,31,32,33]. However, the orientations of these edges mismatch with the a axis with intersection angles of more than 30°.
The OH band at 3566 cm−1 shows strong polarization along c axis with a calculated dO...O of 3.06 Å [60]. It has been attributed to the unshared O1–O2 edge with a measured dO...O of 3.02 Å on the M1 octahedron (Figure 4b) [2] and the protonation along the O3...O3 edge of the Si tetrahedron [36], with a little shorter O...O bond length (2.59 Å) (Figure 4c). Both of these assignments are in agreement with the polarization observed in this study. While the theoretical calculations [30,31,32,33] prefer to ascribe this OH band to another O1...O3 edge on the Si tetrahedron (dO1...O3 = 2.85 Å), which show an intersection angle as large as 62°with respect to the c axis.
The OH band at 3551 cm−1 is polarized along b axis and proposed as one of the protons around the O2 anion, pointing away from the Si tetrahedral center and located in an adjacent interstitial site (Figure 4c) [19,32,33,47]. In addition, Balan et al. [61] proposed that the broad band around 3551 cm−1 may be due to a (charged) interstitial OH group next to a five-coordinated Si, which was later contested by Xue et al. [32], since such 29Si NMR peak was not observed. While Yang et al. [34] ascribed this OH-stretching mode to the O1...O3 edge on the Si tetrahedron on the basis of its temperature dependence, this needs further checking considering its polarization.
Finally, the peak at 3477 cm−1 shows most absorption with an intersection angle of ~ 30° to a axis (or 60° to b axis) in (001) plane (Figure 3a), while least absorption along c axis in (010) plane (Figure 3b). Such polarization matches very well with the orientation of the O1...O2 edge on the Si tetrahedron [24], which is perpendicular to c axis, and with an intersection angle of 32.5° to a axis, which is also supported by Yang et al. [34]. Hence, from this polarized FTIR measurement, we proposed the OH band at 3477 cm−1 should be a more proper candidate for the protonation along O1...O2 edge on the SiO4 tetrahedron, compared with the ones at 3578 and 3612 cm−1.

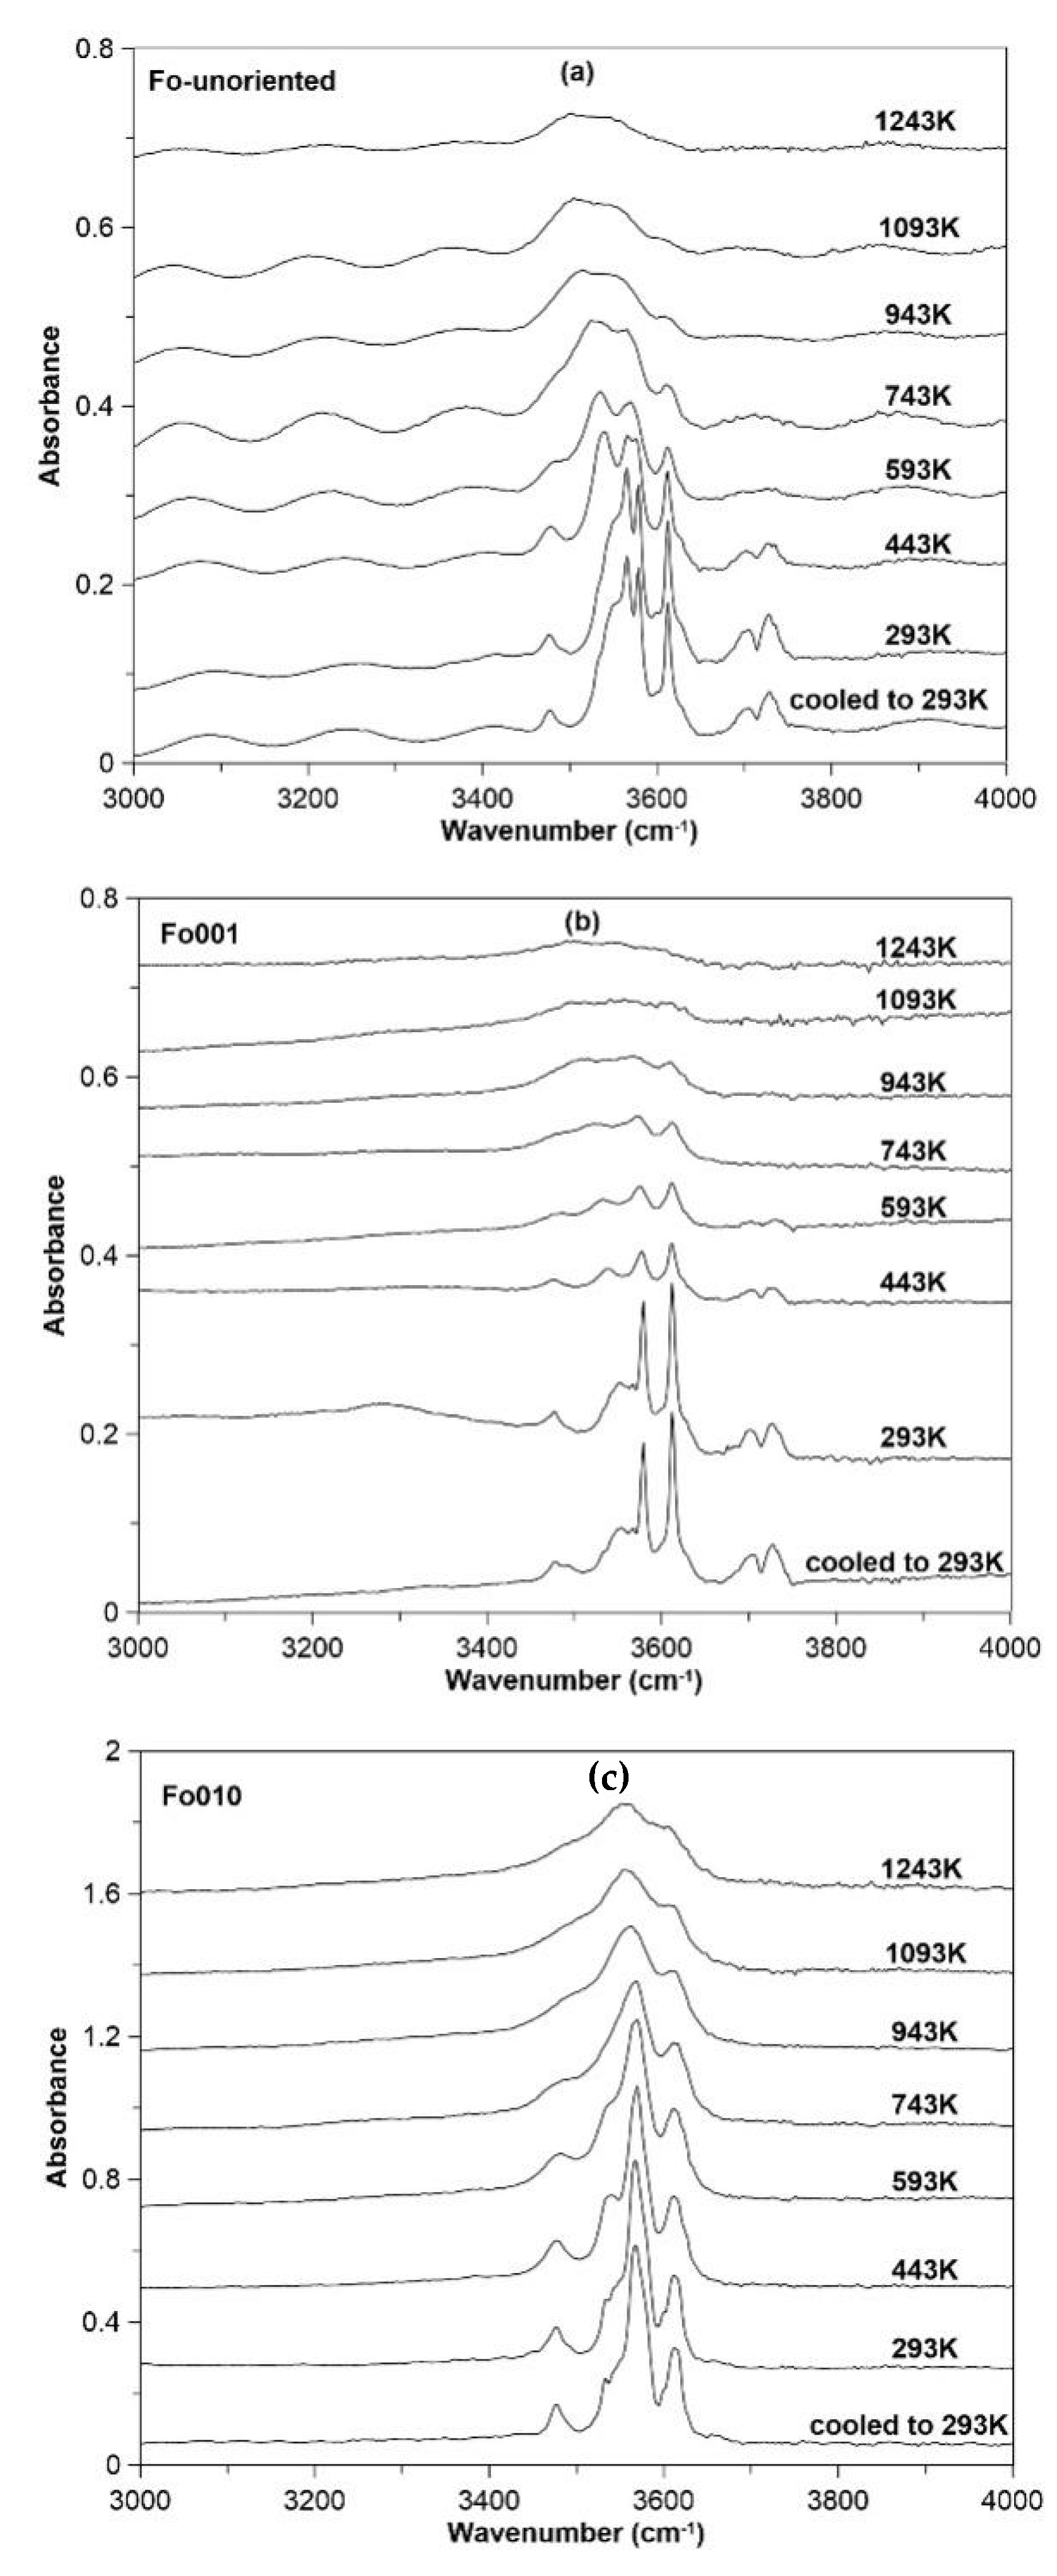
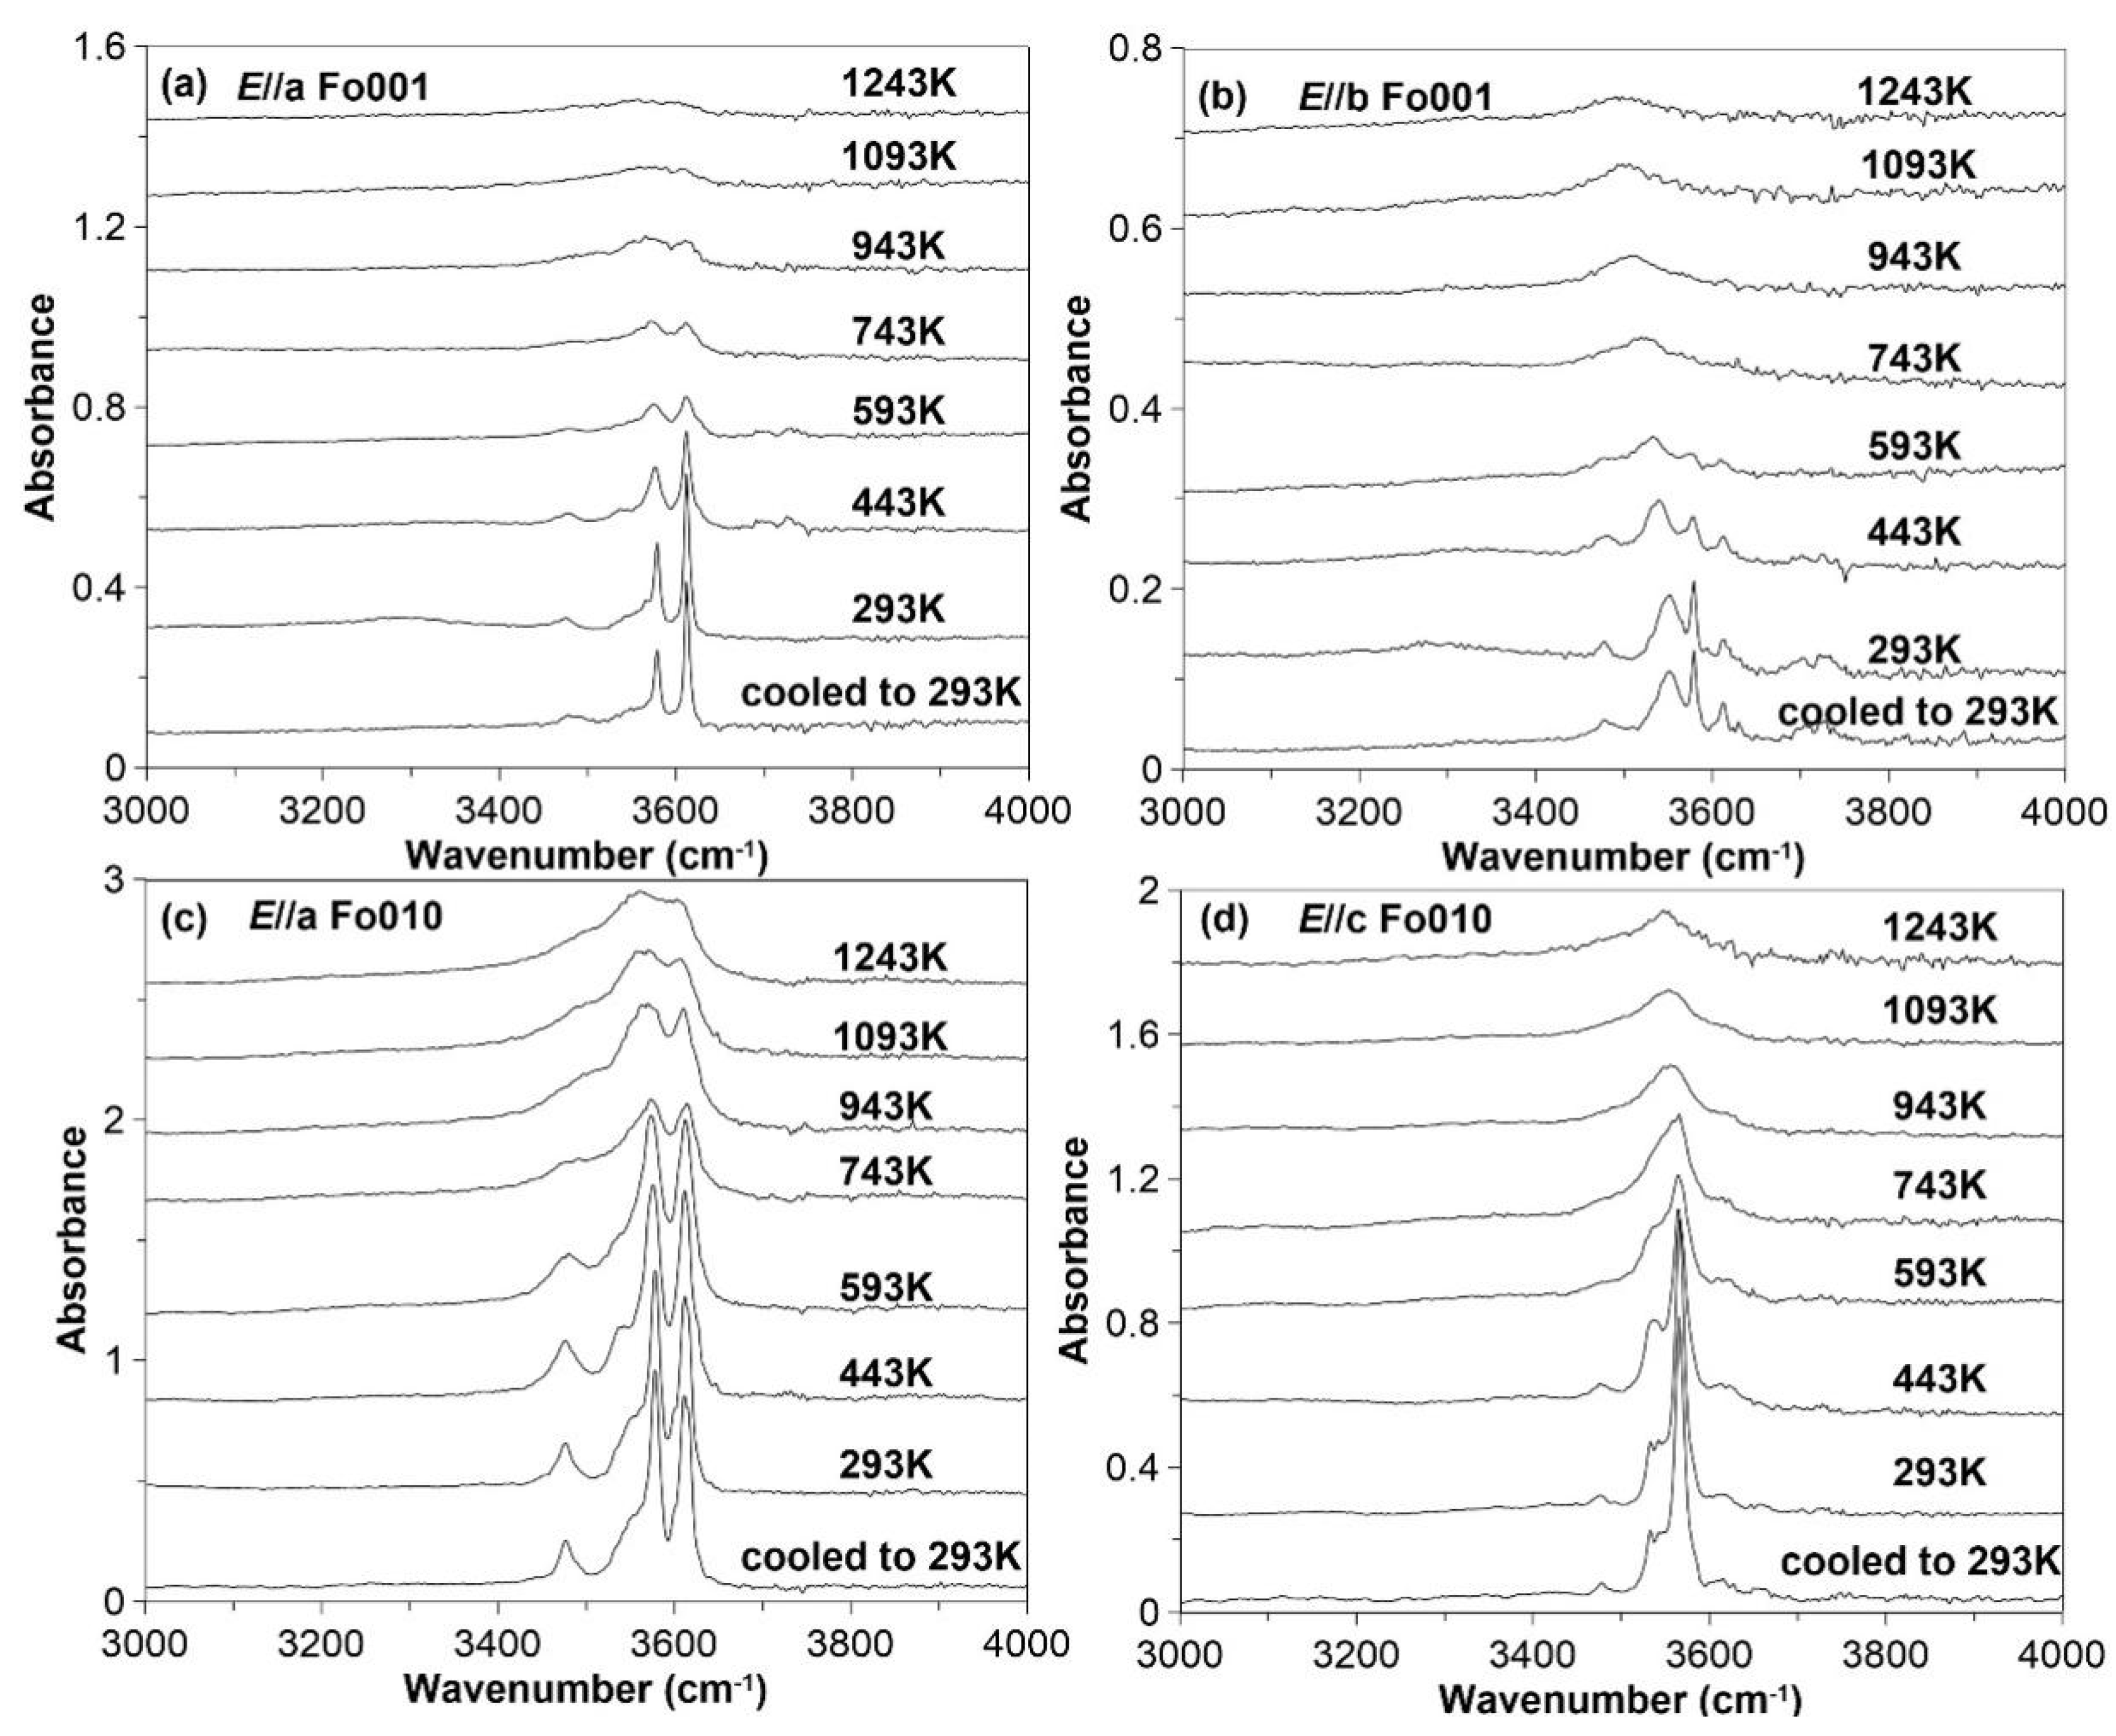
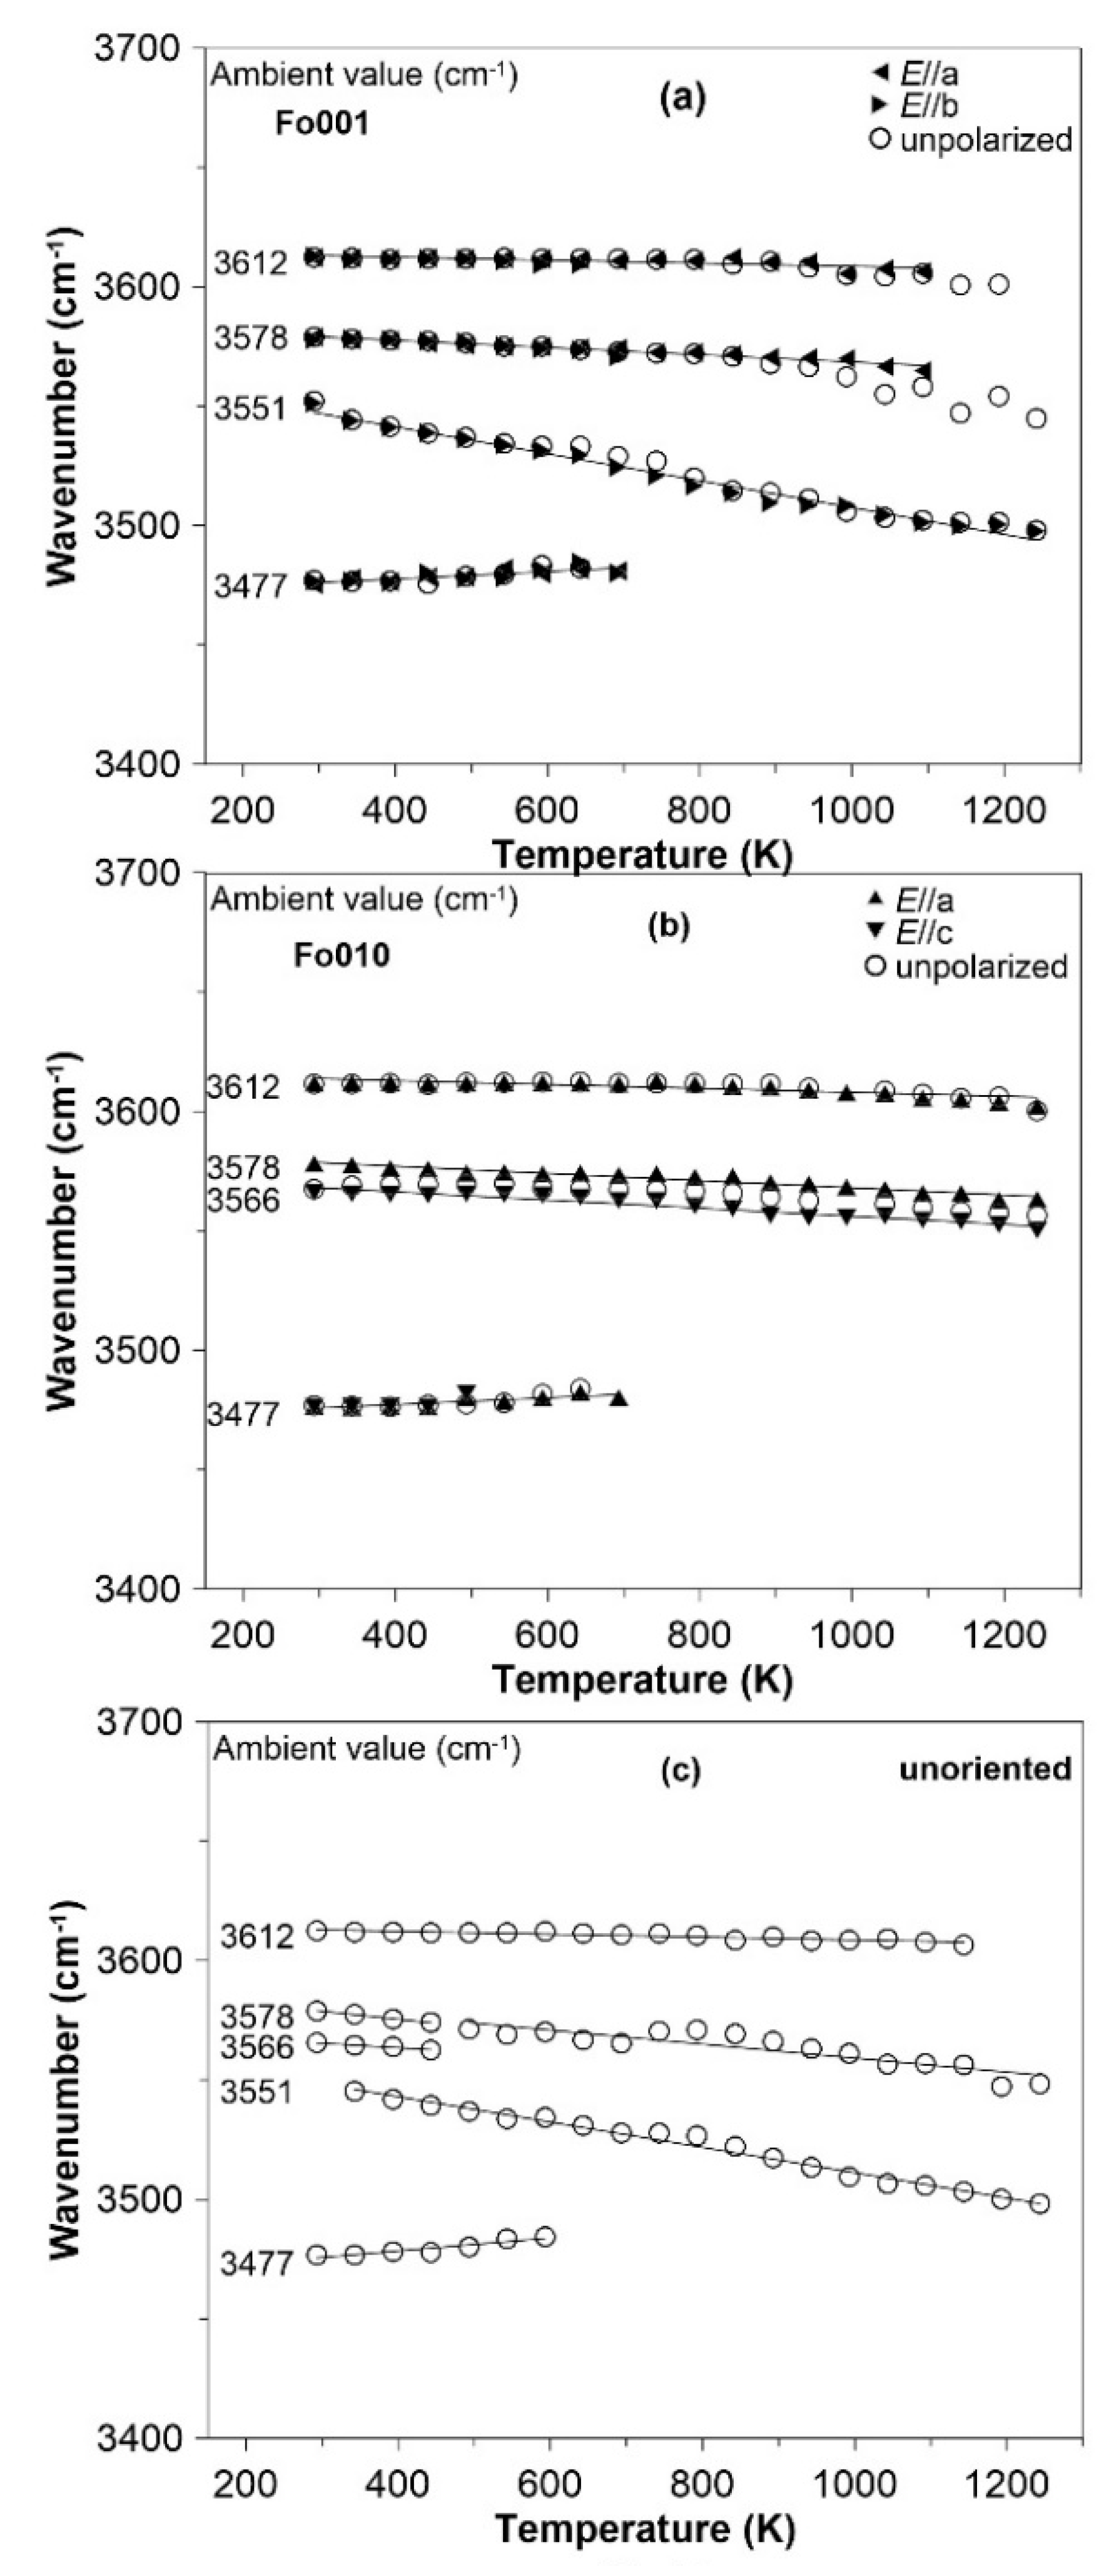
3.3. FTIR Spectroscopy at High Temperature

We collected in situ unpolarized FTIR spectra from 293 K up to 1243 K for both the unoriented (Figure 5a) and oriented crystals Fo001 (Figure 5b) and Fo010 (Figure 5c) directions, as well as polarized FTIR spectra at elevated temperatures for the oriented pieces Fo001 (Figure 6a,b) and Fo010 (Figure 6c,d). When each sample was quenched to room temperature from the highest temperature, additional FTIR spectra were also measured, and compared in these figures. There are no significant differences for the absorbances of these OH bands before and after heating, indicating little dehydration for hydrous forsterite in the heating process up to ~1300 K, which was also observed by Yang et al. [34,57]. Generally, the peaks become weaker and boarder at higher temperatures in FTIR spectra. In our measurement, the OH bands at 3612, 3578, 3566, 3551 cm−1 were always observed up to 1243 K, while the one at 3477 cm−1 could only be detected up to ~700 K due to small intensities in FTIR (Figure 5a,c; Figure 6c,d). All these OH bands turned back with similar intensities when quenched to room temperature from the high temperature of 1243 K (Figure 5a,c; Figure 6c,d). It should be noted that our whole heating procedure was fulfilled within 1.5 h, and little dehydration occurred due to the relatively low H diffusion rate blow 1373 K in hydrous forsterite [35]. On the other hand, Koch-Müller et al. [62] reported significant dehydration in hydrous forsterite with the heating duration as long as 240 h, although the experimental temperatures were still limited below 1273 K.
The positions of these OH bands at elevated temperatures were fitted from both the oriented and unoriented FTIR spectra, and the variation of the frequencies with temperature is plotted for the oriented pieces in the directions of (001) (Figure 7a) and (010) (Figure 7b), as well as the unoriented one (Figure 7c). The neighboring peaks at 3578 and 3566 cm−1 overlap severely in the unpolarized FTIR spectra, especially at temperatures above 450 K, but could be well resolved in the polarized spectra, since these two bands are polarized in different directions along a and c axes, respectively. Linear regressions between frequencies and temperature are fitted to all these OH bands, and the slopes of (∂vi/∂T)P are summarized in Table 1. The OH bands at 3612, 3578, 3566, and 3551 cm−1 have negative temperature-dependences (Figure 8), which is consistent with the general trend from the previous studies [34,41]. Yang et al. [34] conducted the high-T measurement on one unoriented crystal piece, while Yang et al. [41] measured the high-T polarized FTIR on a Fe-bearing San Carlos olivine sample with a water content less than 300 ppmw. The magnitudes of dvi/dT decrease from 0.056 (cm·K)−1 at 3551 cm−1 to less than 0.01 (cm·K)−1 at 3612 cm−1, and weaker OH bands (at higher frequencies) are less sensitive to temperature variation. Besides, the peak at 3477 cm−1 shows a positive temperature-dependence of +0.016~+0.027 (cm·K) −1, and the previous measurements [34,41] also reported a temperature-dependence range of −0.0043~+0.024 (cm·K)−1 for the OH bands in the range of 3400~3500 cm−1. In addition, our high-T FTIR experiment is also consistent with the low-T results from Ingrin et al. [47]: The band at 3566 cm1 (measured at 79 K, which shifted to 3551 cm−1 at room temperature) shows a negative temperature-dependence in larger magnitude as compared with the ones at higher frequencies, and this mode is also attributed to the interstitial H position by [47]. As temperature increases, the covalent bond between O2 and the interstitial H becomes weaker, and the OH band at 3551 cm1 shifts to lower frequency quickly. Consequently, the neighboring OH bond along the O1–O2 edge of the Si tetrahdron gets strengthened, as indicated by ‘blue-shift’ of the mode at 3477 cm1 at elevated temperatures.

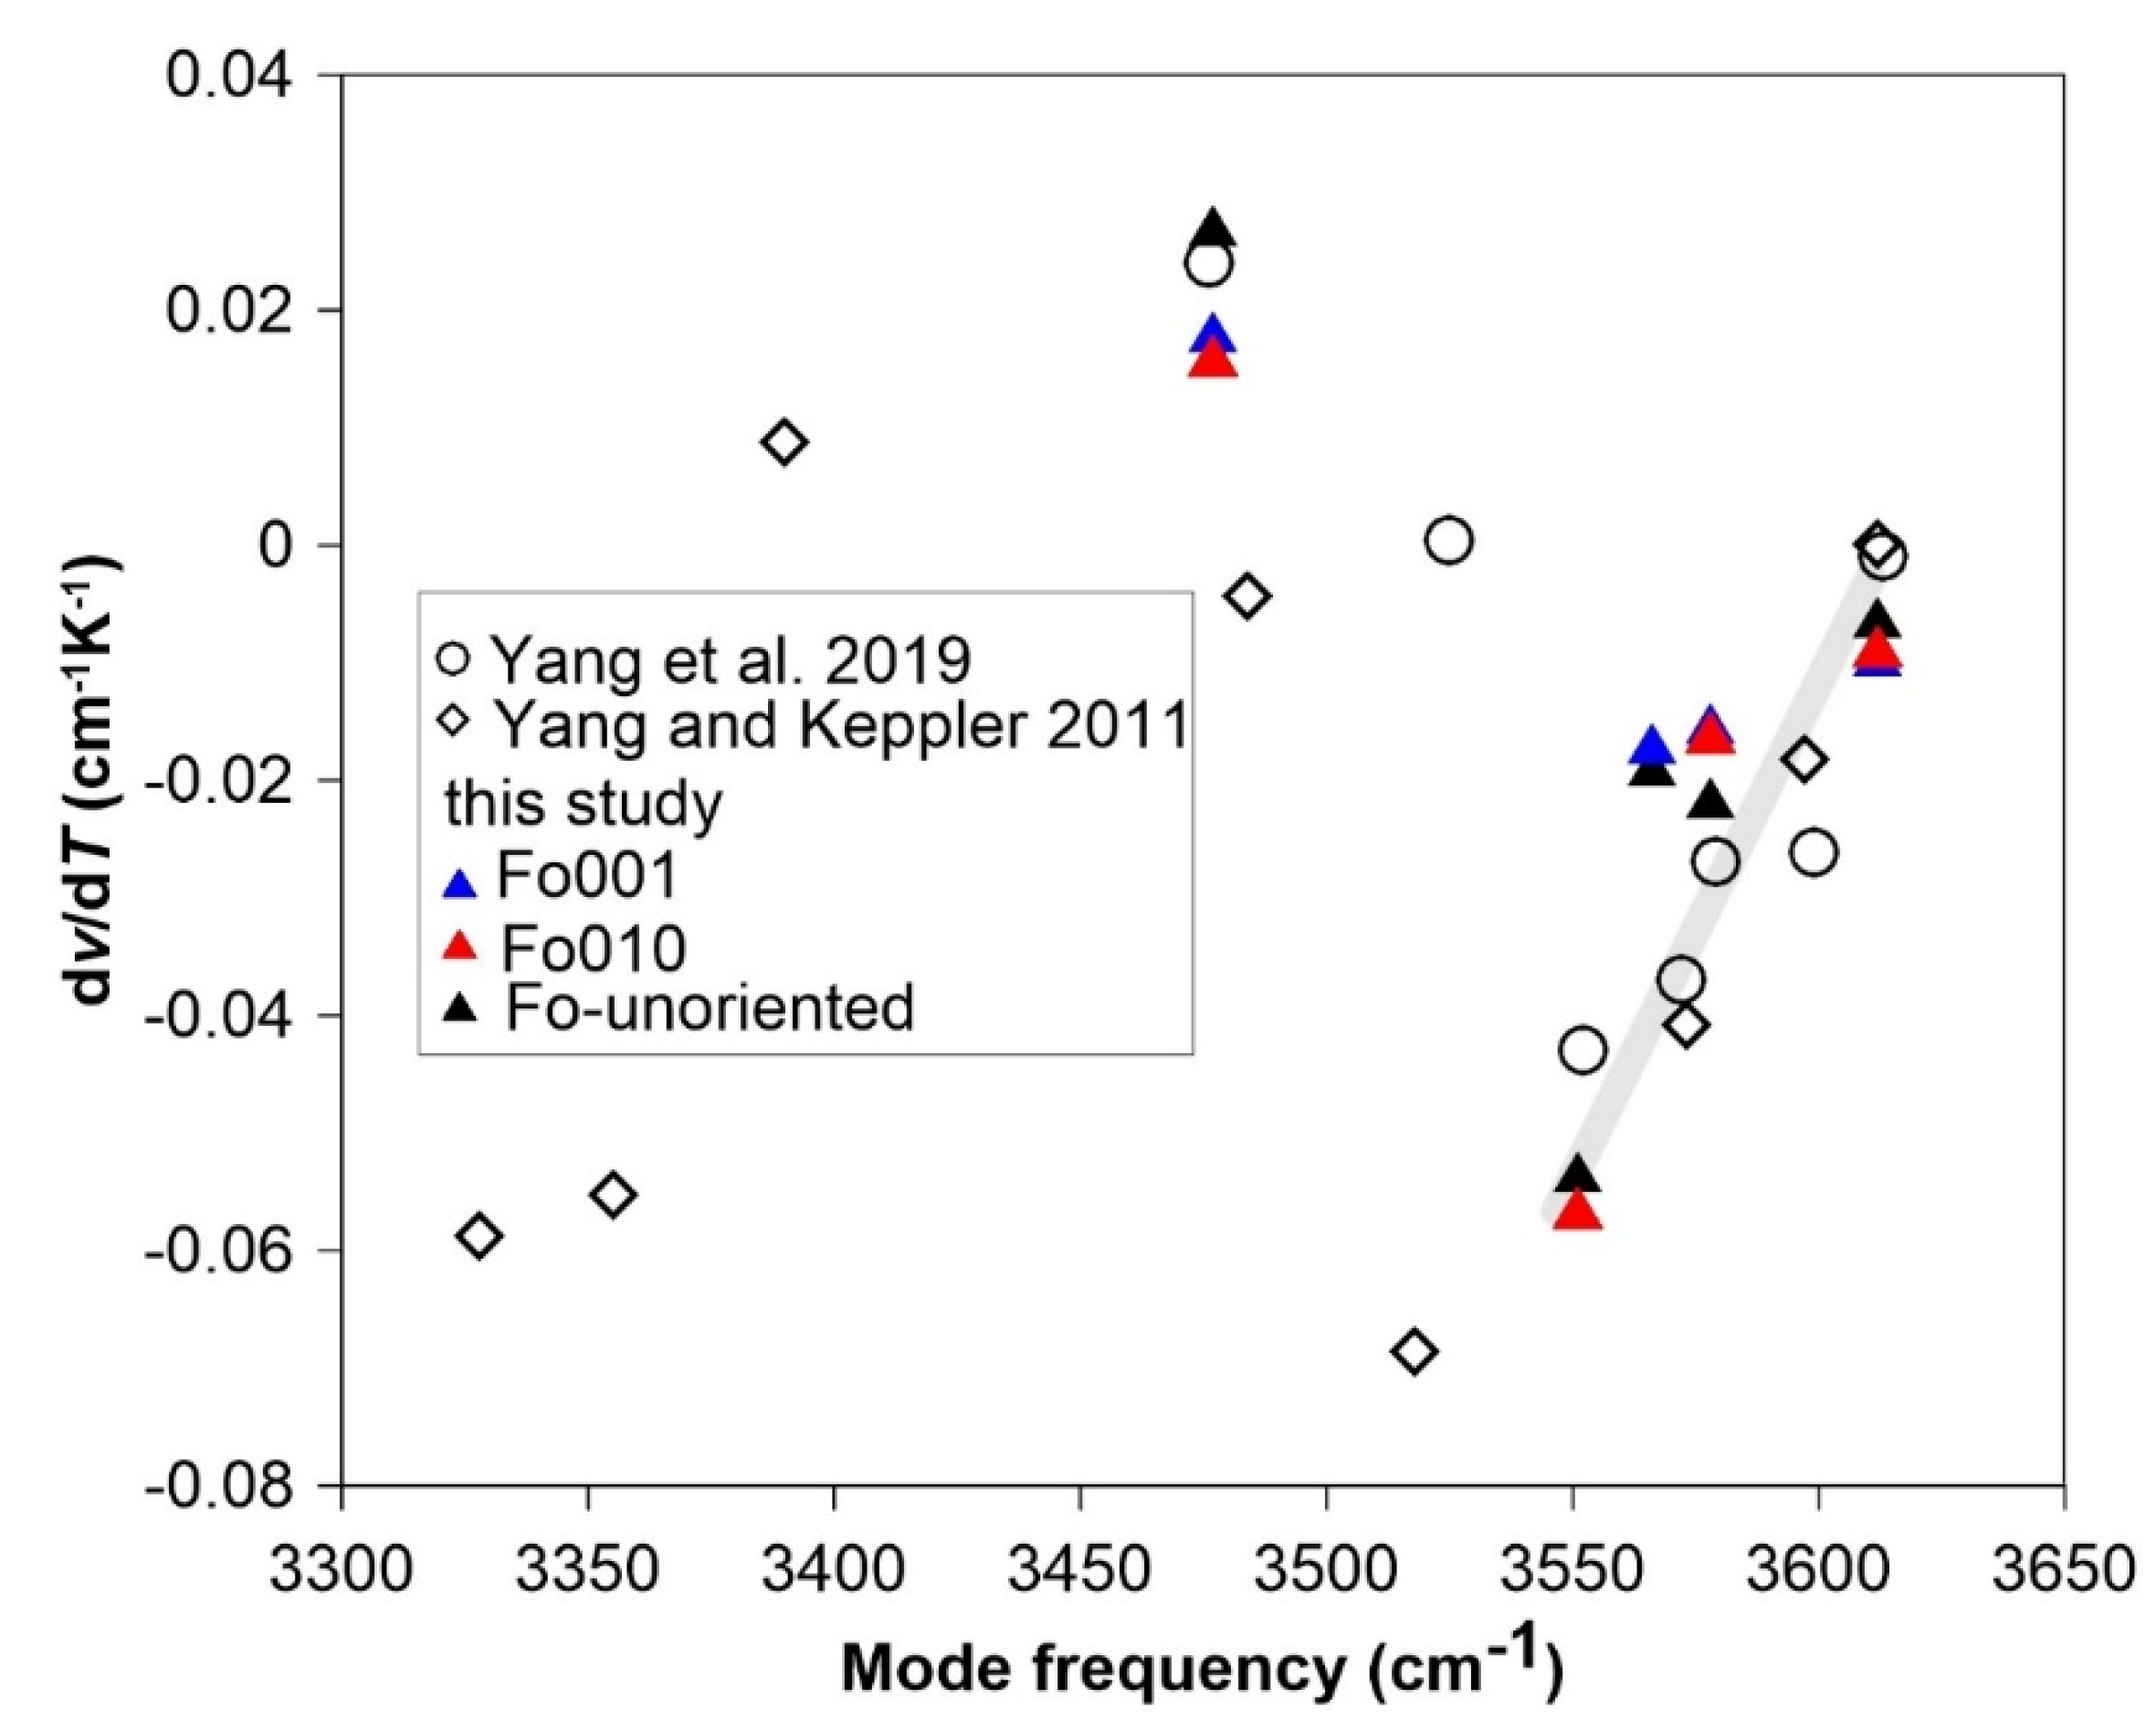
3.4. Hydration Effect on the Intrinsic Anharmonicity

In this section, we will take a further step to check hydration effect on the thermodynamic properties (heat capacities), on the basis of this high-T FTIR measurement for the OH bands, together with the Raman experiments on the lattice vibrations of hydrous forsterite samples at high-P and high-T conditions [24,57]. The thermodynamic properties (such as internal energy, heat capacities, as well as isotope fractionation) of silicate minerals at high-P, T conditions generally simulated with the Debye model, which only considers the harmonic lattice vibrations (e.g., [63,64]). On the other hand, the anharmonic contribution become severe at mantle temperatures, and cannot be ignored [33]. For example, the volume of materials should have been independent from temperature if the atoms inside the crystal structures only behave harmonic vibration. In fact, the general behavior of thermal expansion at high temperatures is one aspect of anharmonicity (external anharmonicity). Additionally, Gillet et al. [50] revealed that the intrinsic anharmonic contribution to the modeled isochoric heat capacity (CV) could be as large as 5.5% for anhydrous forsterite. In this study, we would take a further step to evaluate the hydration effect on the contribution of intrinsic anharmonicity to the thermodyanmics in forsterite.
The contribution of the temperature- and pressure-factors to the vibrational frequency (vi) can be divided into two parts: pure volume variation at high P,T conditions (external anharmonicity) and pure P-T contribution from intrinsic anharmonicity [50,57,65]. The Grüneisen parameters in isobaric (γiP) and isothermal (γiT) modes, as well as the intrinsic anharmonicity (ai), are derived in Equations (1)–(3):
Υ i P = ( ln ν i ρ ) P = 1 α ν 0 i ( ν i T ) P
Υ i T = ( ln ν i ρ ) Τ = Κ Τ ν 0 i ( ν i P ) Τ
a i = ( ln ν i T ) V = α ( Υ i P Υ i T )
where υ0i are the mode frequency at ambient environment, while (∂vi/∂T)P and (∂vi/∂P)T are the temperature and pressure derivatives of the frequency (υi), respectively. α is the mean thermal expansion coefficient (38.1 × 10⁻⁵ K−1 from Ye et al. [5]), and KT is the isothermal bulk modulus (121.6 GPa from Manghnani et al. [16]) at ambient condition. Hushur et al. [24] and Yang et al. [57] conducted high-pressure and high-temperature Raman measurements on this hydrous forsterite sample, while we carried out high-temperature FTIR measurement in this study. Calculated isobaric (γiP) and isothermal (γiT) Grüneisen paramters, as well as the intrinsic anharmonic paramters for the hydrous forsterite (Supplementary Table S1), as compared with those for anhydrous forsterite [50], are shown on the Figure 9a–c. The magnitudes of the Grüneisen paramters (γiP and γiT) for OH-stretching modes (typically less than 0.15) are significantly smaller than those for the lattice vibrations. Then, the corresponding ai parameters for OH-stretching bands are in the value range of −1~0 (10−5 K−1), which are comparable to those for the internal vibrational modes in SiO4 tetrahedron (400~1000 cm−1, including both bending and stretching), while the external lattice vibrations (below 400 cm−1) yield negative ai parameters with significantly larger magnitudes.
The space group of olivine is Pbnm, and in the unit cell (Mg2SiO4, Z = 4), there are 8 Mg atoms (in two different octahedral sites M1 and M2), 4 Si (in a single tetrahedral site), as well 16 O atoms (classified as O1, O2, O3). In total, there are totally 84 vibrational modes in the crystal structure, with 3 acoustic ones, as well as 81 optical ones, which could be detected by Raman or IR spectrum. Different modes have been proposed to classify these optical (lattice) modes in different frequency ranges, such as Model 1 [67] and Model 2 [50] shown in Figure 10a,b, respectively. In Model 1, the transitions of SiO4 tetrahedron T(Si) (external modes) is classified in a separated continuum (105–227 cm−1) away from the external modes of T(M) (transitions of MO6 octahedra) and R(Si) (Rotations of SiO4), as well as v2 (symmetric bending modes inside SiO4); while all these modes are combined in the same continuum (105–482 cm−1) in Model 2. The asymmetric bending mode v4 is denoted in the continuum of 505–644 cm−1, and the internal stretching modes inside SiO4 of v1 (symmetric) and v3 (asymmetric) are distributed in another continuum with higher frequency (825–964 cm−1). Although it is impossible to detect all these optical modes in the high-P,T Raman and FTIR measurements, we adopted the measured mean intrinsic anharmonic parameters (ai) as the average value for the whole set of spectroscopic modes in a continua, and the averaged ai parameters in different continua are compared between both the hydrous and anhydrous samples.
In this discussion, we firstly considered either M-substitution (Mg2+ = 2H+) or Si-substitution (Si4+ = 4H+), in the extreme condition of OH-saturation in forsterite (CH2O = 8900 ppmw.) [2,5]. For the case of M-substitution, the chemical formula for this hydrous forsterite can be expressed as Mg1.931H0.138SiO4, by assuming all OH with M-substitution (x = 0.0686 in Figure 10a,b. The number of OH-stretching modes in the continuum (3551–3612 cm−1) is 2x. On the other side, there are 24 modes associated with the transitions of MO6 octahedra, and hence, the number of 12x should be subtracted for the T(M) modes. While in the case of Si-substitution, the formula would be changed to Mg2Si0.965H0.138O4, with a vacancy of 3.45% in Si sites (y = 0.0345 as in Figure 10a,b. To simplify the calculation, we assume that Si-substitution only affects the internal Si–O stretching modes, and then the number of v1 + v3 modes is decreased to 16·(1−y), with a number of 4y for the OH-stretching modes.
According to the models from Kieffer [68] and Gillet et al. [50], the contribution to isochoric heat capacity (CV) from a set of m optic continua from various types of spectroscopic modes is given as:
C v = 3 n R i = 1 m n i N v l i v u i z 2 exp ( z )     d z ( v u i     v l i ) [ exp ( z ) 1 ] 2 = 3 n R i = 1 m C v i h
where z = (hi/kBT) inside the integration, n is the number of atoms in the mineral’s structural formular; R is the gas contant, ni is the number of modes in the continuum, N is the total number of vibrational modes, and ui and li are the lower and upper cutoff frequencies of continuum, respectively. When the intrinsic anharmonicity is taken into consideration, the isochoric heat capacity (CV) could be revised as (e.g., [50]):
C v = 3 n R i = 1 m C v i h ( 1 2 a i T )
where C v i h is the harmonic part of the heat capacity.
The molar isochoric heat capacities (CV) are calculated as a function temperature for both anhydrous and hydrous forsterite samples in Models 1 (Figure 10c) and 2 (Figure 10d). For each sample, the heat capacities are calculated in both harmonic and anharmonic cases, on the basis of Equations (4) and (5), respectively. Both M-substitution (red color) and Si-substitution (blue color) are considered for the hydrous sample. There is no significant difference between the anhydrous and hydrous samples in the harmonic approximation. Nevertheless, the anharmonic contribution increases the heat capacity (CV) of anhydrous forsterite by 5.1% (in model 1) or 5.7% (in Model 2), when extrapolated to 2000 K [50], while hydration further increases such difference up to 9% (in Model 1) or 9.5% (in Model 2) for both the cases of M-substitution and Si-substitution. Hence, hydration could significantly increase the anharmonic contribution to the thermodynamic properties of forsterite, which is independent of M-substitution or Si-substitution.
Next, we evaluate the isobaric heat capacity (CP) for both the anhydrous and hydrous samples (in Model 1), on basis of Equation (6), and select M-substitution as representative for the hydrous case (Figure 11). The anharmonic contribution to isobaric heat capacity is 4.7% and 8.1% for anhydrous and hydrous forsterite, respectively, at 2000 K.
C P = C v + T · V · α 2 · K T
On the other hand, we simulate the CV profile for hydrous forsterite sample with 4500 ppmw. H2O. In this case, x = 0.0343 and y = 0.0172, and we select Model 1 as representative for both M-substitution and Si-substitution. The anharmonic contribution to CV (difference between the calculations with anharmonic correction and in harmonic approximation) is plotted as a function of temperature in Figure 12. In the case of Si-substitution, the anharmonic correction to the heat capacity is 8.7% and 9.0% for the forsterite samples with 4500 ppmw and 8900 ppmw H2O at 2000 K; while there is little difference between these hydrous samples for the case of M-substitution.
The contribution to the heat capacity from the OH-stretching modes themselves are tiny, due to the very few numbers for mode density of state and high frequencies. However, previous Raman studies at high-P,T conditions [24,57] revealed that hydration substitution significantly affects the intrinsic anharmonic parameters (ai) of the lattice vibrations (<1000 cm−1), especially the external modes (<450 cm−1), such as T(M), T(Si) and R(Si). Moreover, the modes at lower frequencies have larger weights in determining the heat capacity as a whole.
On the other hand, the modes at lower frequencies also play more important role in simulating the equilibrium traditional isotope fractionation (e.g., [54,55,69]). A widely accepted correlation between the pressure- and temperature-dependence of the reduced isotopic partition function ratio (β-factor) has been established as (e.g., [70]):
[ ln P ] T = γ · T K T · [ ln T ] V
The Grüneisen parameter, is expressed in the cases of quasi-harmonic approximation (Equation (8)) and with intrinsic anharmonic correction (Equation (9)):
γ = i γ i ( u i · coth ( u i / 2 )     u i * · coth ( u i * / 2 ) ) i ( u i · coth ( u i / 2 )     u i * · coth ( u i * / 2 ) )
γ = i γ i ( 1     a i · T ) · ( u i · coth ( u i / 2 ) u i * · coth ( u i * / 2 ) ) i ( 1 a i · T ) · ( u i · coth ( u i / 2 ) u i * · coth ( u i * / 2 ) )
where the dimensionless frequency ui = h·vi/(kB·T), while i and ai are the isothermal Grüneisen parameter and the intrinsic anharmonic parameter, respectively. * denotes for the heavier isotopes, which could be 26Mg, 30Si or 18O in forsterite, and the frequency shifts of the vibrational modes (vi or ui*) can be calculated according to the isotopic mass effect (e.g., [71]). As shown in Figure 9, hydration in forsterite could significantly affect the ai parameters, as well as the i parameters (no matter it is M-substitution or Si-substitution). Hence, hydration could have further impact on modeling the-factors for the traditional isotopes (Mg, Si and O) in olivine at the high-P,T conditions (Equation (8)), and the anharmonic correction is necessary for evaluating the pressure effect on the equilibrium isotope fractionations between minerals (Equation (9)) [70].

4. Conclusions

Polarized FTIR measurements were carried out on hydrous forsterite crystals. The polarizations of the OH bands at 3612, 3578, 3566, 3551, 3477 cm−1 are well constrained. In the case of M-substitution, the polarizations of the modes at 3612, 3578 and 3566 cm−1 match well with the protonation along the O3...O3 edge in M2 site, the unshared (E // a) and shared (E // c) O1...O2 edges in M1 site, respectively. In the case of Si-substitution, the polarizations of the OH bands at 3612 and 3551 cm−1 are in agreement with the orientations of O1–VSi and O2–H pointing away from Si, while the ones at 3566 and 3477 cm−1 could be properly attributed to the O3...O3 and O1...O2 edges in SiO4 tetrahedron, considering their polarizations.
High-temperature polarized FTIR experiment provides robust constraint on the temperature-dependence of the OH-stretching modes. In the frequency range above 3550 cm−1, the frequency have negative temperature-dependence, with their magnitudes decrease rapidly with frequency increasing. While the OH bands in the range 3400–3500 cm−1 typically show positive temperature-dependence but with the magnitudes no more than 0.02 cm−1/K−1. Then the mode at 3477 cm−1 might be in a quite different crystal environment, compared with the other OH bands at higher frequencies in forsterite.
We simulate the heat capacities of hydrous forsterite, as a function of temperature. Hydration dramatically increases the intrinsic anharmonic contribution to the heat capacities for both M- and Si-substitutions, no matter which substitution mechanism is considered. This is consistent with the high-temperature X-ray diffraction that hydration also increase the thermal expansivity (external anharmonicity) for forsterite, as well as its high-pressure polymorphs of wadseleyite and ringwoodie in the mantle transition zone (410–660 km) [5]. Although the contribution from the OH-stretching vibrations themselves is very small, by affecting the anharmonic parameters (ai) of the lattice vibrations, especially the external modes in the frequency range below 500 cm−1, hydration could make important impact on the thermodynamic properties of olivine, such as internal energy, entropy, heat capacities, as well as isotope fractionation (Mg, O, or Si) at the high-P,T conditions in the upper mantle.

Supplementary Materials

The following are available online at https://www.mdpi.com/2075-163X/9/9/512/s1, Table S1: The Raman shifts and OH bands by FTIR (vi), temperature dependence of vi (∂vi/∂T)P, isobaric mode Grüneisen parameters, as well as intrinsic anharmonic parameters (ai) for hydrous forsterite.

Author Contributions

Conceptualization, Y.Y.; methodology, D.L., S.W., X.Z.; investigation, D.L., X.W.; writing—original draft preparation, D.L.; writing—review and editing, Y.Y., J.R.S., J.Z.; visualization, D.L.; supervision, Y.Y.; project administration, Y.Y.; funding acquisition, Y.Y., J.R.S., D.L. All authors discussed the results and commented on the manuscript.

Funding

This research was funded by the National Key Research and Development Program of China (Grant No. 2016YFC0600204), the National Natural Science Foundation of China (Grant Nos. 41590621 and 41672041), the Fundamental Research Funds for National Universities, China University of Geosciences (Wuhan), and the US National Science Foudation (Grant No. EAR14-16979 to JRS).

Acknowledgments

We are grateful for the discussion from Xiang Wu and Xinzhuan Guo.

Conflicts of Interest

The authors declare no conflict of interest.

References

  1. Kohlstedt, D.L.; Keppler, H.; Rubie, D.C. Solubility of water in the α, β and γ phases of (Mg,Fe)2SiO4. Contrib. Mineral. Petrol. 1996, 123, 345–357. [Google Scholar] [CrossRef]
  2. Smyth, J.R.; Frost, D.J.; Nestola, F.; Holl, C.M.; Bromiley, G.; Frost, D. Olivine hydration in the deep upper mantle: Effects of temperature and silica activity. Geophys. Res. Lett. 2006, 33, 311–324. [Google Scholar] [CrossRef]
  3. Litasov, K.D.; Ohtani, E.; Kagi, H.; Jacobsen, S.; Ghosh, S. Temperature dependence and mechanism of hydrogen incorporation in olivine at 12.5–14.0 GPa. Geophys. Res. Lett. 2007, 34, 16314. [Google Scholar] [CrossRef]
  4. Bali, E.; Bolfan-Casanova, N.; Koga, K.T. Pressure and temperature dependence of H solubility in forsterite: An implication to water activity in the Earth interior. Earth Planet. Sci. Lett. 2008, 268, 354–363. [Google Scholar] [CrossRef]
  5. Ye, Y.; Schwering, R.A.; Smyth, J.R. Effects of Hydration on Thermal Expansion of Forsterite, Wadsleyite, and Ringwoodite. Am. Mineral. 2009, 94, 899–904. [Google Scholar] [CrossRef]
  6. Otsuka, K.; Karato, S.-I. Control of the water fugacity at high pressures and temperatures: Applications to the incorporation mechanisms of water in olivine. Phys. Earth Planet. Inter. 2011, 189, 27–33. [Google Scholar] [CrossRef]
  7. Férot, A.; Bolfan-Casanova, N. Water storage capacity in olivine and pyroxene to 14 GPa: Implications for the water content of the Earth’s upper mantle and nature of seismic discontinuities. Earth Planet. Sci. Lett. 2012, 349–350, 218–230. [Google Scholar] [CrossRef]
  8. Chang, Y.-Y.; Hsieh, W.-P.; Tan, E.; Chen, J. Hydration-reduced lattice thermal conductivity of olivine in Earth’s upper mantle. Proc. Natl. Acad. Sci. USA 2017, 114, 4078–4081. [Google Scholar] [CrossRef]
  9. Wang, D.; Mookherjee, M.; Xu, Y.; Karato, S.-I. The effect of water on the electrical conductivity of olivine. Nature 2006, 443, 977–980. [Google Scholar] [CrossRef]
  10. Mei, S.; Kohlstedt, D.L. Influence of water on plastic deformation of olivine aggregates: 1. Diffusion creep regime. J. Geophys. Res. Space Phys. 2000, 105, 21457–21469. [Google Scholar] [CrossRef]
  11. Costa, F.; Chakraborty, S. The effect of water on Si and O diffusion rates in olivine and implications for transport properties and processes in the upper mantle. Phys. Earth Planet. Inter. 2008, 166, 11–29. [Google Scholar] [CrossRef] [Green Version]
  12. Hier-Majumder, S.; Anderson, I.M.; Kohlstedt, D.L. Influence of protons on Fe-Mg interdiffusion in olivine. J. Geophys. Res. Space Phys. 2005, 110, 110. [Google Scholar] [CrossRef]
  13. Fei, H.; Wiedenbeck, M.; Yamazaki, D.; Katsura, T. Small effect of water on upper-mantle rheology based on silicon self-diffusion coefficients. Nature 2013, 498, 213–215. [Google Scholar] [CrossRef] [PubMed]
  14. Fei, H.; Wiedenbeck, M.; Yamazaki, D.; Katsura, T. No effect of water on oxygen self-diffusion rate in forsterite. J. Geophys. Res. Solid Earth 2014, 119, 7598–7606. [Google Scholar] [CrossRef] [Green Version]
  15. Fei, H.; Koizumi, S.; Sakamoto, N.; Hashiguchi, M.; Yurimoto, H.; Marquardt, K.; Miyajima, N.; Katsura, T. Mg lattice diffusion in iron-free olivine and implications to conductivity anomaly in the oceanic asthenosphere. Earth Planet. Sci. Lett. 2018, 484, 204–212. [Google Scholar] [CrossRef]
  16. Manghnani, M.H.; Hushur, A.; Smyth, J.R.; Nestola, F.; Dera, P.; Sekar, M.; Amulele, G.; Frost, D.J. Compressibility and structural stability of two variably hydrated olivine samples (Fo97Fa3) to 34 GPa by X-ray diffraction and Raman spectroscopy. Am. Miner. 2013, 98, 1972–1979. [Google Scholar] [CrossRef]
  17. Beran, A.; Putnis, A. A model of the OH positions in olivine, derived from infrared-spectroscopic investigations. Phys. Chem. Miner. 1983, 9, 57–60. [Google Scholar] [CrossRef]
  18. Bai, Q.; Kohlstedt, D.L. Substantial hydrogen solubility in olivine and implications for water storage in the mantle. Nature 1992, 357, 672–674. [Google Scholar] [CrossRef]
  19. Bai, Q.; Kohlstedt, D. Effects of chemical environment on the solubility and incorporation mechanism for hydrogen in olivine. Phys. Chem. Miner. 1993, 19, 460–471. [Google Scholar] [CrossRef]
  20. Demouchy, S.; Mackwell, S. Water diffusion in synthetic iron-free forsterite. Phys. Chem. Miner. 2003, 30, 486–494. [Google Scholar] [CrossRef]
  21. Zhao, Y.-H.; Ginsberg, S.B.; Kohlstedt, D.L. Solubility of hydrogen in olivine: Dependence on temperature and iron content. Contrib. Mineral. Petrol. 2004, 147, 155–161. [Google Scholar] [CrossRef]
  22. Kohlstedt, D.L. The Role of Water in High-Temperature Rock Deformation. Rev. Mineral. Geochem. 2006, 62, 377–396. [Google Scholar] [CrossRef]
  23. Deligne, N.I.; Mosenfelder, J.L.; Asimow, P.D.; Rossman, G.R. Hydrogen incorporation in olivine from 2-12 GPa. Am. Miner. 2006, 91, 285–294. [Google Scholar]
  24. Hushur, A.; Manghnani, M.H.; Smyth, J.R.; Nestola, F.; Frost, D.J. Crystal chemistry of hydrous forsterite and its vibrational properties up to 41 GPa. Am. Miner. 2009, 94, 751–760. [Google Scholar] [CrossRef]
  25. Karato, S.-I. Theory of isotope diffusion in a material with multiple species and its implications for hydrogen-enhanced electrical conductivity in olivine. Phys. Earth Planet. Inter. 2013, 219, 49–54. [Google Scholar] [CrossRef]
  26. Karato, S.-I. Some notes on hydrogen-related point defects and their role in the isotope exchange and electrical conductivity in olivine. Phys. Earth Planet. Inter. 2015, 248, 94–98. [Google Scholar] [CrossRef] [Green Version]
  27. O’Neill, H.S.C.; Matveev, S.; Ballhaus, C.; Taylor, W.R.; Green, D.H. Effect of Silica Activity on OH IR Spectra of Olivine: Implications for Low-aSiO2 Mantle Metasomatism. J. Petrol. 2001, 42, 721–729. [Google Scholar]
  28. Berry, A.J.; Hermann, J.; O’Neill, H.S.; Foran, G.J.; Hermann, J. Fingerprinting the water site in mantle olivine. Geology 2005, 33, 869. [Google Scholar] [CrossRef]
  29. O’Neill, H.S.; Hermann, J.; Hauri, E.H.; Kovács, I.; O’Neill, H.S. Site-specific infrared O-H absorption coefficients for water substitution into olivine. Am. Miner. 2010, 95, 292–299. [Google Scholar]
  30. Umemoto, K.; Wentzcovitch, R.M.; Hirschmann, M.M.; Kohlstedt, D.L.; Withers, A.C. A first-principles investigation of hydrous defects and IR frequencies in forsterite: The case for Si vacancies. Am. Miner. 2011, 96, 1475–1479. [Google Scholar] [CrossRef]
  31. Balan, E.; Ingrin, J.; Delattre, S.; Kovács, I.; Blanchard, M. Theoretical infrared spectrum of OH-defects in forsterite. Eur. J. Mineral. 2011, 23, 285–292. [Google Scholar] [CrossRef]
  32. Xue, X.; Turner, D.; Loroch, D.; Kanzaki, M. Hydrogen incorporation mechanisms in forsterite: New insights from 1 H and 29 Si NMR spectroscopy and first-principles calculation. Am. Miner. 2017, 102, 519–536. [Google Scholar] [CrossRef]
  33. Qin, T.; Wentzcovitch, R.; Umemoto, K. Ab initio study of water speciation in forsterite. Am. Miner. 2018, 103, 692–699. [Google Scholar] [CrossRef]
  34. Yang, Y.; Liu, W.; Qi, Z.; Wang, Z.; Smyth, J.R.; Xia, Q. Re-configuration and interaction of hydrogen sites in olivine at high temperature and high pressure. Am. Mineral. 2019, 104, 878–889. [Google Scholar] [CrossRef]
  35. Padrón-Navarta, J.A.; Hermann, J.; O’Neill, H.S.C. Site-specific hydrogen diffusion rates in forsterite. Earth Planet. Sci. Lett. 2014, 392, 100–112. [Google Scholar] [CrossRef]
  36. Kohn, S.C.; Brooker, R.A.; Lemaire, C. The effect of silica activity on the incorporation mechanisms of water in synthetic forsterite: A polarised infrared spectroscopic study. Contrib. Mineral. Petrol. 2004, 147, 48–57. [Google Scholar] [CrossRef]
  37. Berry, A.J.; O’Neill, H.S.; Hermann, J.; Scott, D.R.; Hermann, J. The infrared signature of water associated with trivalent cations in olivine. Earth Planet. Sci. Lett. 2007, 261, 134–142. [Google Scholar] [CrossRef]
  38. Berry, A.J.; Walker, A.M.; Hermann, J.; O’Neill, H.S.; Foran, G.J.; Gale, J.D.; Hermann, J. Titanium substitution mechanisms in forsterite. Chem. Geol. 2007, 242, 176–186. [Google Scholar] [CrossRef]
  39. Grant, K.; Brooker, R.; Kohn, S.; Wood, B.; Kohn, S. The effect of oxygen fugacity on hydroxyl concentrations and speciation in olivine: Implications for water solubility in the upper mantle. Earth Planet. Sci. Lett. 2007, 261, 217–229. [Google Scholar] [CrossRef]
  40. Walker, A.M.; Hermann, J.; Berry, A.J.; O’Neill, H.S.C.; Walker, A.; Berry, A. Three water sites in upper mantle olivine and the role of titanium in the water weakening mechanism. J. Geophys. Res. Space Phys. 2007, 112, 05211. [Google Scholar] [CrossRef]
  41. Yang, X.-Z.; Keppler, H. In-situ infrared spectra of OH in olivine to 1100 °C. Am. Miner. 2011, 96, 451–454. [Google Scholar] [CrossRef]
  42. Ingrin, J.; Kovács, I.; Deloule, E.; Balan, E.; Blanchard, M.; Kohn, S.C.; Hermann, J. Identification of hydrogen defects linked to boronsubstitution in synthetic forsterite and natural olivine. Am. Miner. 2014, 99, 2138–2141. [Google Scholar] [CrossRef]
  43. Padrón Navarta, J.A.; Hermann, J. A subsolidus olivine water solubility equation for the Earth’s upper mantle. JGR Solid Earth 2017, 122, 9862–9880. [Google Scholar] [CrossRef]
  44. Crépisson, C.; Blanchard, M.; Bureau, H.; Sanloup, C.; Withers, A.C.; Khodja, H.; Surblé, S.; Raepsaet, C.; Béneut, K.; Leroy, C.; et al. Clumped fluoride-hydroxyl defects in forsterite: Implications for the upper-mantle. Earth Planet. Sci. Lett. 2014, 390, 287–295. [Google Scholar] [CrossRef] [Green Version]
  45. Grant, K.J.; Kohn, S.C.; Brooker, R.A. Solubility and partitioning of water in synthetic forsterite and enstatite in the system MgO–SiO2–H2O ± Al2O3. Contrib. Mineral. Petrol. 2006, 151, 651–664. [Google Scholar] [CrossRef]
  46. Withers, A.; Hirschmann, M.; Tenner, T. The effect of Fe on olivine H2O storage capacity: Consequences for H2O in the martian mantle. Am. Miner. 2011, 96, 1039–1053. [Google Scholar] [CrossRef]
  47. Ingrin, J.; Liu, J.; Depecker, C.; Kohn, S.C.; Balan, E.; Grant, K.J. Low-temperature evolution of OH bands in synthetic forsterite, implication for the nature of H defects at high pressure. Phys. Chem. Miner. 2013, 40, 499–510. [Google Scholar] [CrossRef]
  48. Kudoh, Y.; Kuribayashi, T.; Kagi, H.; Inoue, T. Cation vacancy and possible hydrogen positions in hydrous forsterite, Mg1.985Si0.993H0.06O4, synthesized at 13.5 GPa and 1300 °C. J. Mineral. Petrol. Sci. 2006, 101, 265–269. [Google Scholar] [CrossRef]
  49. Tollan, P.M.E.; Smith, R.; O’Neill, H.S.; Hermann, J. The responses of the four main substitution mechanisms of H in olivine to H2O activity at 1050 °C and 3 GPa. Prog. Earth Planet. Sci. 2017, 4, 200. [Google Scholar] [CrossRef]
  50. Gillet, P.; Richet, P.; Guyot, F.; Fiquet, G. High-temperature thermodynamic properties of forsterite. J. Geophys. Res. Space Phys. 1991, 96, 11805. [Google Scholar] [CrossRef]
  51. Liu, D.; Pang, Y.; Ye, Y.; Jin, Z.; Smyth, J.R.; Yang, Y.; Zhang, Z.; Wang, Z. In-situ high-temperature vibrational spectra for synthetic and natural clinohumite: Implications for dense hydrous magnesium silicates in subduction zones. Am. Miner. 2019, 104, 53–63. [Google Scholar] [CrossRef]
  52. Dorogokupets, P.I.; Oganov, A.R. Ruby, metals, and MgO as alternative pressure scales: A semiempirical description of shock-wave, ultrasonic, x-ray, and thermochemical data at high temperatures and pressures. Phys. Rev. B. 2007, 75, 024115. [Google Scholar] [CrossRef]
  53. Dorogokupets, P.; Dymshits, A.; Sokolova, T.; Danilov, B.; Litasov, K. The equations of state of forsterite, wadsleyite, ringwoodite, akimotoite, MgSiO3-perovskite, and postperovskite and phase diagram for the Mg2SiO4 system at pressures of up to 130GPa. Russ. Geol. Geophys. 2015, 56, 172–189. [Google Scholar] [CrossRef]
  54. Reynard, B.; Caracas, R. D/H isotopic fractionation between brucite Mg(OH)2 and water from first-principles vibrational modeling. Chem. Geol. 2009, 262, 159–168. [Google Scholar] [CrossRef]
  55. Liu, Q.; Tossell, J.A.; Liu, Y. On the proper use of the Bigeleisen–Mayer equation and corrections to it in the calculation of isotopic fractionation equilibrium constants. Geochim. Cosmochim. Acta 2010, 74, 6965–6983. [Google Scholar] [CrossRef]
  56. Marcondes, M.L.; Wentzcovitch, R.M.; Assali, L.V. Importance of van der Waals interaction on structural, vibrational, and thermodynamic properties of NaCl. Solid State Commun. 2018, 273, 11–16. [Google Scholar] [CrossRef] [Green Version]
  57. Yang, Y.; Wang, Z.; Smyth, J.R.; Liu, J.; Xia, Q. Water effects on the anharmonic properties of forsterite. Am. Miner. 2015, 100, 2185–2190. [Google Scholar] [CrossRef]
  58. Withers, A.C.; Bureau, H.; Raepsaet, C.; Hirschmann, M.M. Calibration of infrared spectroscopy by elastic recoil detection analysis of H in synthetic olivine. Chem. Geol. 2012, 334, 92–98. [Google Scholar] [CrossRef]
  59. Nakamoto, K.; Margoshes, M.; Rundle, R.E. Stretching Frequencies as a Function of Distances in Hydrogen Bonds. J. Am. Chem. Soc. 1955, 77, 6480–6486. [Google Scholar] [CrossRef]
  60. Libowitzky, E. Correlation of O-H stretching frequencies and O–H…O hydrogen bond lengths in minerals. Monatshefte. Fiir. Chemie. 1999, 130, 1047–1059. [Google Scholar]
  61. Balan, E.; Blanchard, M.; Lazzeri, M.; Ingrin, J. Contribution of interstitial OH groups to the incorporation of water in forsterite. Phys. Chem. Miner. 2014, 41, 105–114. [Google Scholar] [CrossRef]
  62. Koch-Müller, M.; Matsyuk, S.S.; Rhede, D.; Wirth, R.; Khisina, N. Hydroxyl in mantle olivine xenocrysts from the Udachnaya kimberlite pipe. Phys. Chem. Miner. 2006, 33, 276–287. [Google Scholar] [CrossRef]
  63. Cynn, H.; Hofmeister, A.M.; Burnley, P.C.; Navrotsky, A. Thermodynamic properties and hydrogen bonding speciation from vibrational spectra of dense hydrous magnesium silicates. Phys. Chem. Miner. 1996, 23, 361–376. [Google Scholar] [CrossRef]
  64. Holland, T.J.B.; Powell, R. An internally consistent thermodynamic data set for phases of petrological interest. J. Metamorph. Geol. 1998, 163, 309–343. [Google Scholar]
  65. Okada, T.; Narita, T.; Nagai, T.; Yamanaka, T. Comparative Raman spectroscopic study on ilmenite-type MgSiO3 (akimotoite), MgGeO3, and MgTiO3 (geikielite) at high temperatures and high pressures. Am. Miner. 2008, 93, 39–47. [Google Scholar] [CrossRef]
  66. Chopelas, A. Single crystal Raman spectra of forsterite, fayalite, and monticellite. Am. Mineral. 1991, 76, 1101–1109. [Google Scholar]
  67. Hofmeister, A.M. Single-crystal absorption and reflection infrared spectroscopy of forsterite and fayalite. Phys. Chem. Miner. 1987, 14, 499–513. [Google Scholar] [CrossRef]
  68. Kieffer, S.W. Thermodynamics and lattice vibrations of minerals: 3. Lattice dynamics and an approximation for minerals with application to simple substances and framework silicates. Rev. Geophys. 1979, 17, 35. [Google Scholar] [CrossRef]
  69. Polyakov, V.B. On anharmonic and pressure corrections to the equilibrium isoto bnpic constants for minerals. Geochim. Cosmochim. Acta. 1988, 62(18), 3077–3085. [Google Scholar] [CrossRef]
  70. Polyakov, V.; Horita, J.; Cole, D.; Polyakov, V. Pressure effects on the reduced partition function ratio for hydrogen isotopes in water. Geochim. Cosmochim. Acta 2006, 70, 1904–1913. [Google Scholar] [CrossRef]
  71. Wu, Z.; Huang, F.; Huang, S. Isotope fractionation induced by phase transformation: First-principles investigation for Mg2SiO4. Earth Planet. Sci. Lett. 2015, 409, 339–347. [Google Scholar] [CrossRef]
Figure 1. The unpolarized Fourier Transform infrared (FTIR) spectra measured for the hydrous forsterite samples at ambient condition, with the peak positions labeled.
Minerals 09 00512 g001
Figure 2. The polarized transmission FTIR spectra for the oriented Fo001 (a) and Fo010 (b) samples with an interval of 15° for the measurements. The angle of 90° is selected along a axis, and consequently the direction for 0° (180°) is aligned along b and c axes for the pieces of (001) and (010), respectively.
Minerals 09 00512 g002
Figure 3. Variation of the integrated absorbances of the OH bands with the polarization angle for the oriented Fo001 (a) and Fo010 (b) samples. The angle of 90° is selected along a axis.
Minerals 09 00512 g003
Figure 4. Sketch of (a) M2 octahedron, (b) M1 octahedron and (c) Si tetrahedron for forstertie, based on the single-crystal structure refinement from Hushur et al. [24]. The potential attributions for the OH bands in both the cases of M-substitution and Si-substitution are marked, which are in agreement with this polarized FTIR measurement.
Minerals 09 00512 g004
Figure 5. Selected unpolarized IR spectra for the Fo-unoriented (a), oriented Fo001 (b) and Fo010 (c) samples at elevated temperatures.
Minerals 09 00512 g005
Figure 6. Polarized IR spectra for the oriented Fo001 (a for E//a and b for E//b) and Fo010 (c for E//a and d for E//c) directions, at high temperatures.
Minerals 09 00512 g006
Figure 7. Variation of the frequencies for the OH bands with temperature for the oriented Fo001 (a) and Fo010 (b) samples, as well as the Fo-unoriented (c). Linear regressions (solid lines) are fitted for the datasets and the frequencies of at room temperatures are also listed in the figures.
Minerals 09 00512 g007
Figure 8. Comparison of the temperature-dependence for the frequencies of OH bands of hydrous olivine ([34,41]; this study).
Minerals 09 00512 g008
Figure 9. The isobaric (a), isothermal (b) mode Grüneisen parameters and intrinsic anharmonic parameters (c) for the anhydrous [50,66] and hydrous foresterite, calculated from the Raman measurements at high temperature (this study and Yang et al. [57]) and high pressure [24].
Minerals 09 00512 g009
Figure 10. Modes of density of states for anhydrous and hydrous forsterite from (a) Model 1 [67] and (b) Model 2 [50]. The formula is Mg2−xH0.138SiO4 (x = 0.0686) and Mg2H0.138Si1−yO4 (y = 0.0345) assuming all OH with M-substitution and Si-substitution, respectively. The values x = 0.0686 and y = 0.0345. The boxes denote the continua for different groups of optical modes. The upper and lower cutoff frequencies for each continuum are also labeled below the box. The numbers inside and above each box represent the number of modes and the mean (ai) parameter for the vibrational modes in each continuum (Figure 9 and Supplementary Table S1), respectively. Comparisons for the isochoric heat capacities, CV, for anhydrous and hydrous forsterite samples are made in (c) (Model 1) and (d) (Model 2).
Minerals 09 00512 g010
Figure 11. Comparison of the isobaric heat capacities for both the anhydrous and hydrous forsterite samples.
Minerals 09 00512 g011
Figure 12. Comparison of the difference of isobaric heat capacities between the cases for harmonic approximation and with intrinsic anharmonic contribution for anhydrous and hydrous forsterite.
Minerals 09 00512 g012
Table 1. The main OH bands with the temperature dependence (∂vi/∂T)P for the oriented and unoriented pieces of hydrous forsterite.
OH-Band (cm−1)(∂vi/∂T)P (cm·K)−1
Fo001Fo010Fo-Unoriented
3612−0.008(6)−0.009(4)−0.006(1)
3578−0.016(2)−0.015(2)−0.021(5)
3566 −0.016(8)−0.018(8)
3551−0.056(4) −0.053(7)
34770.016(1)0.018(2)0.027(2)

