Trace Element and Stable Isotope Geochemistry of Lwamondo and Zebediela Kaolins, Limpopo Province, South Africa: Implication for Paleoenvironmental Reconstruction

Abstract
:1. Introduction
2. Materials and Methods
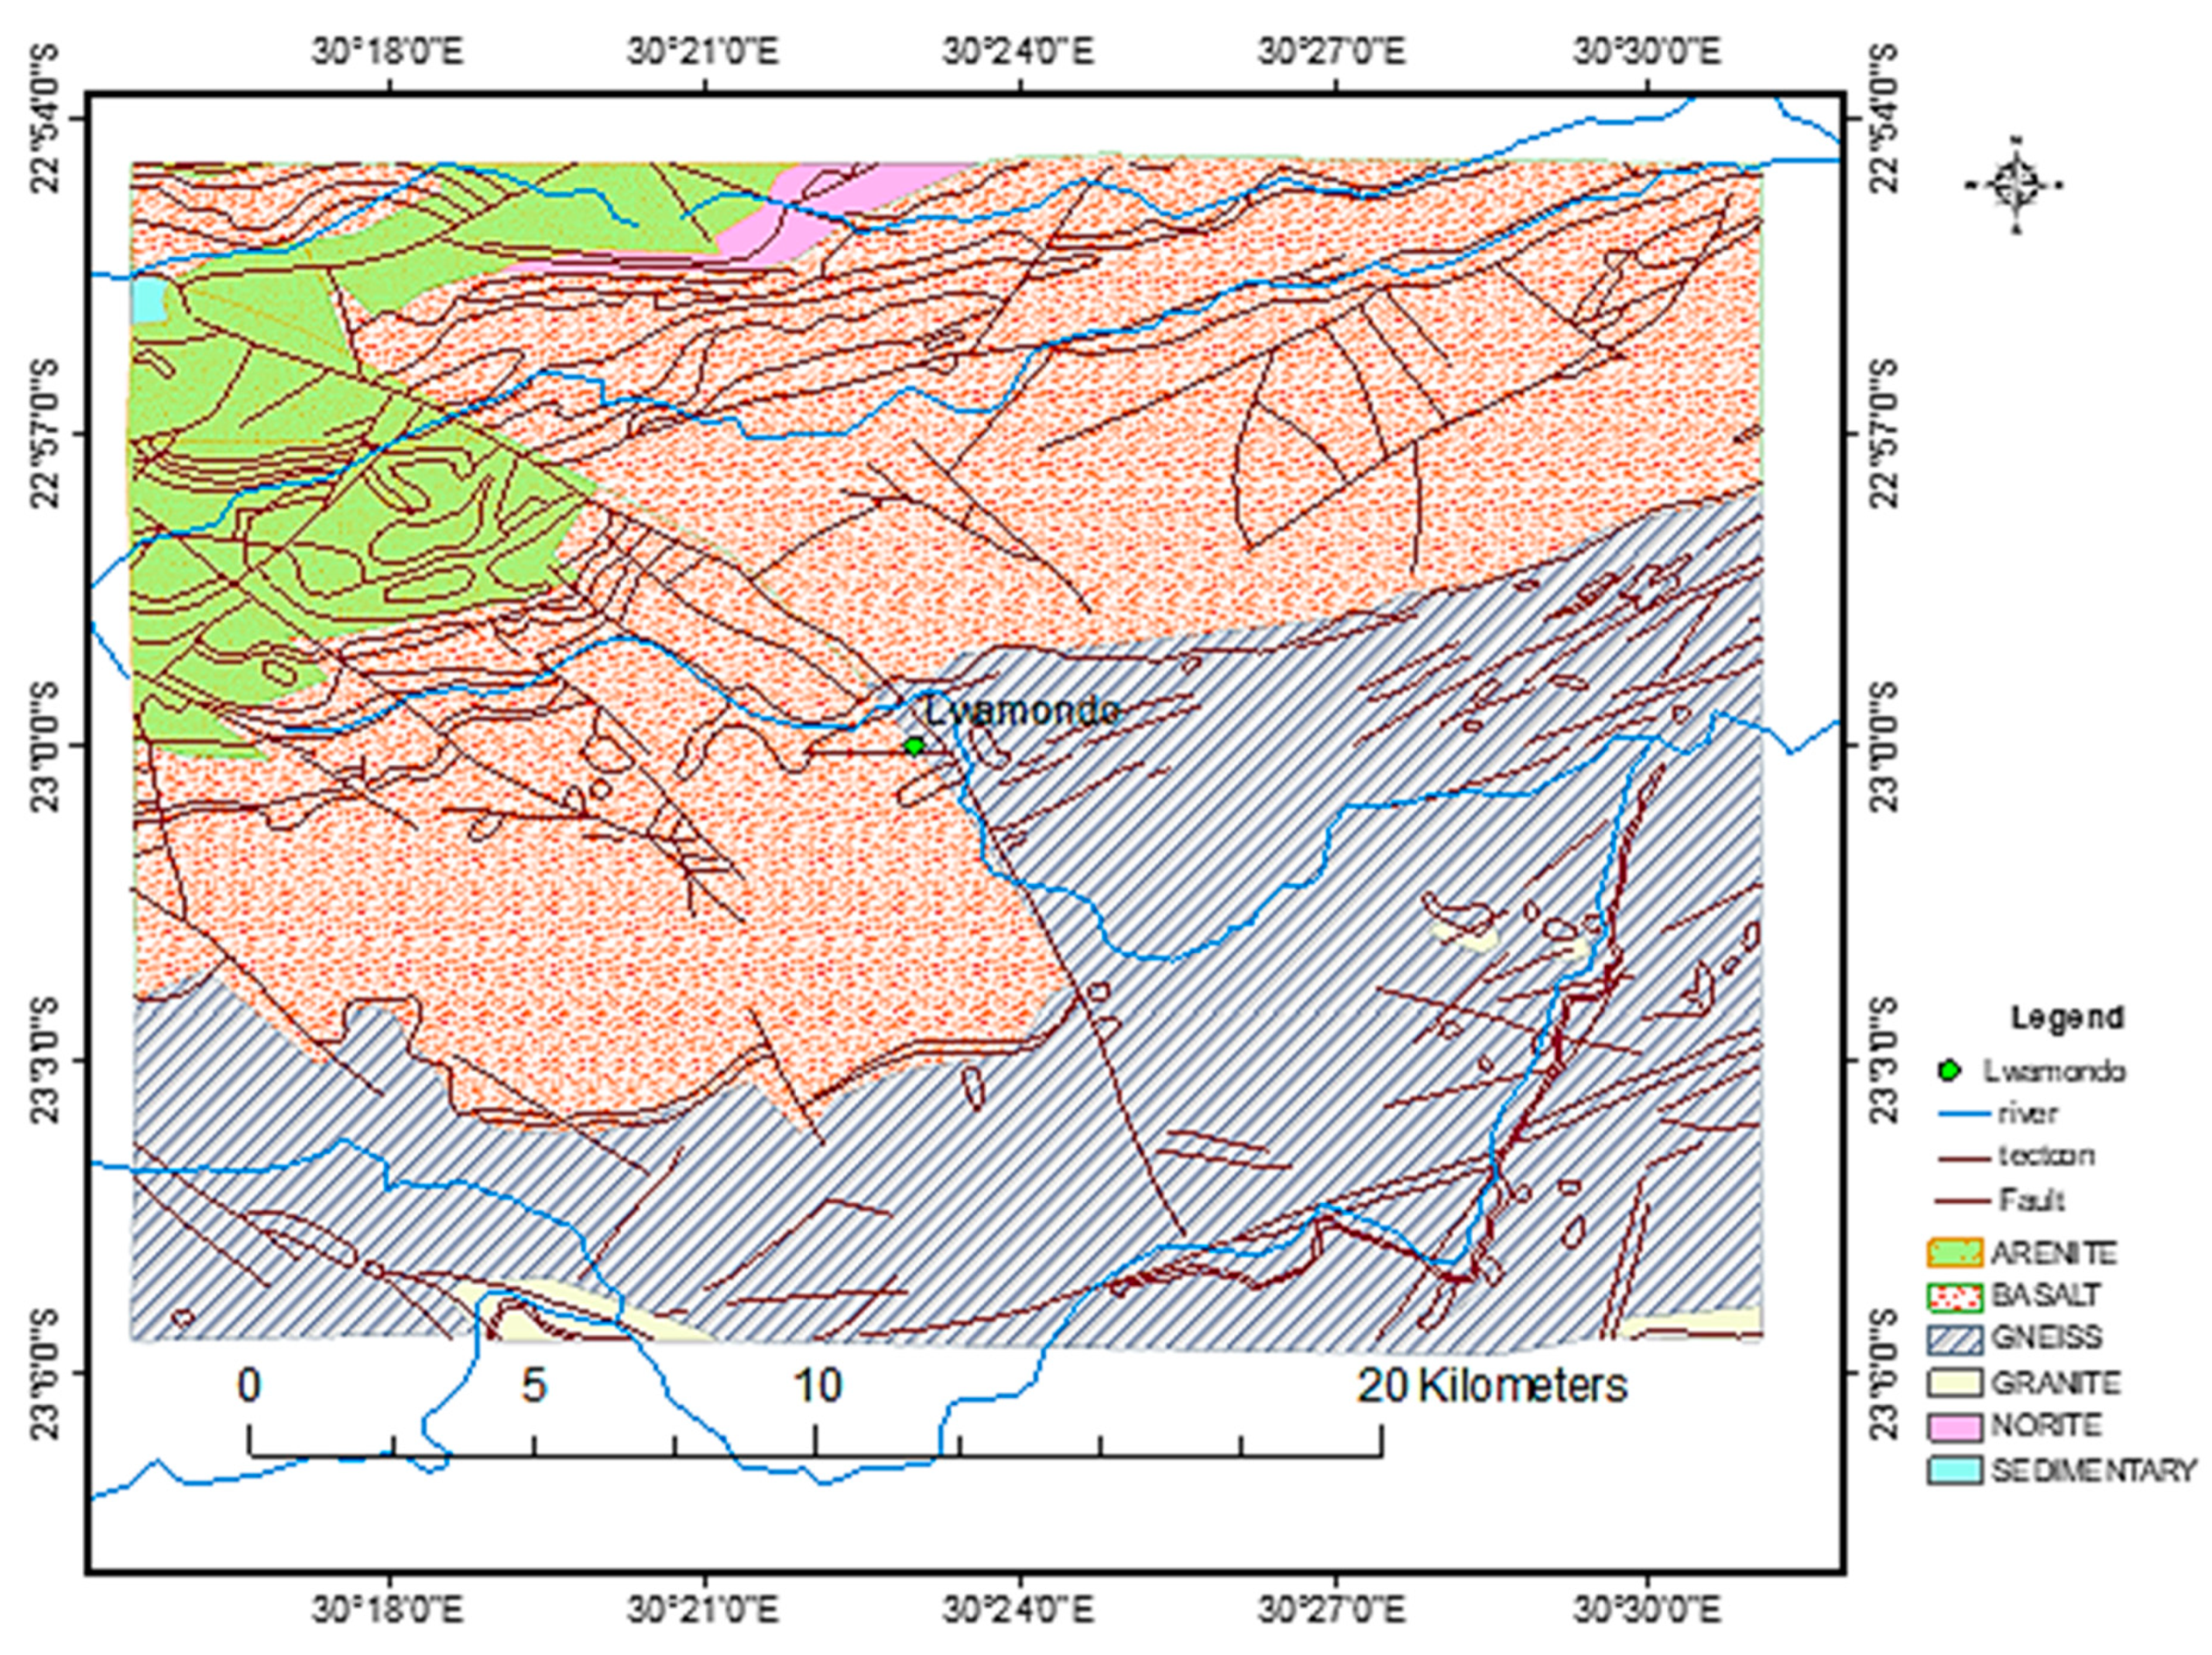
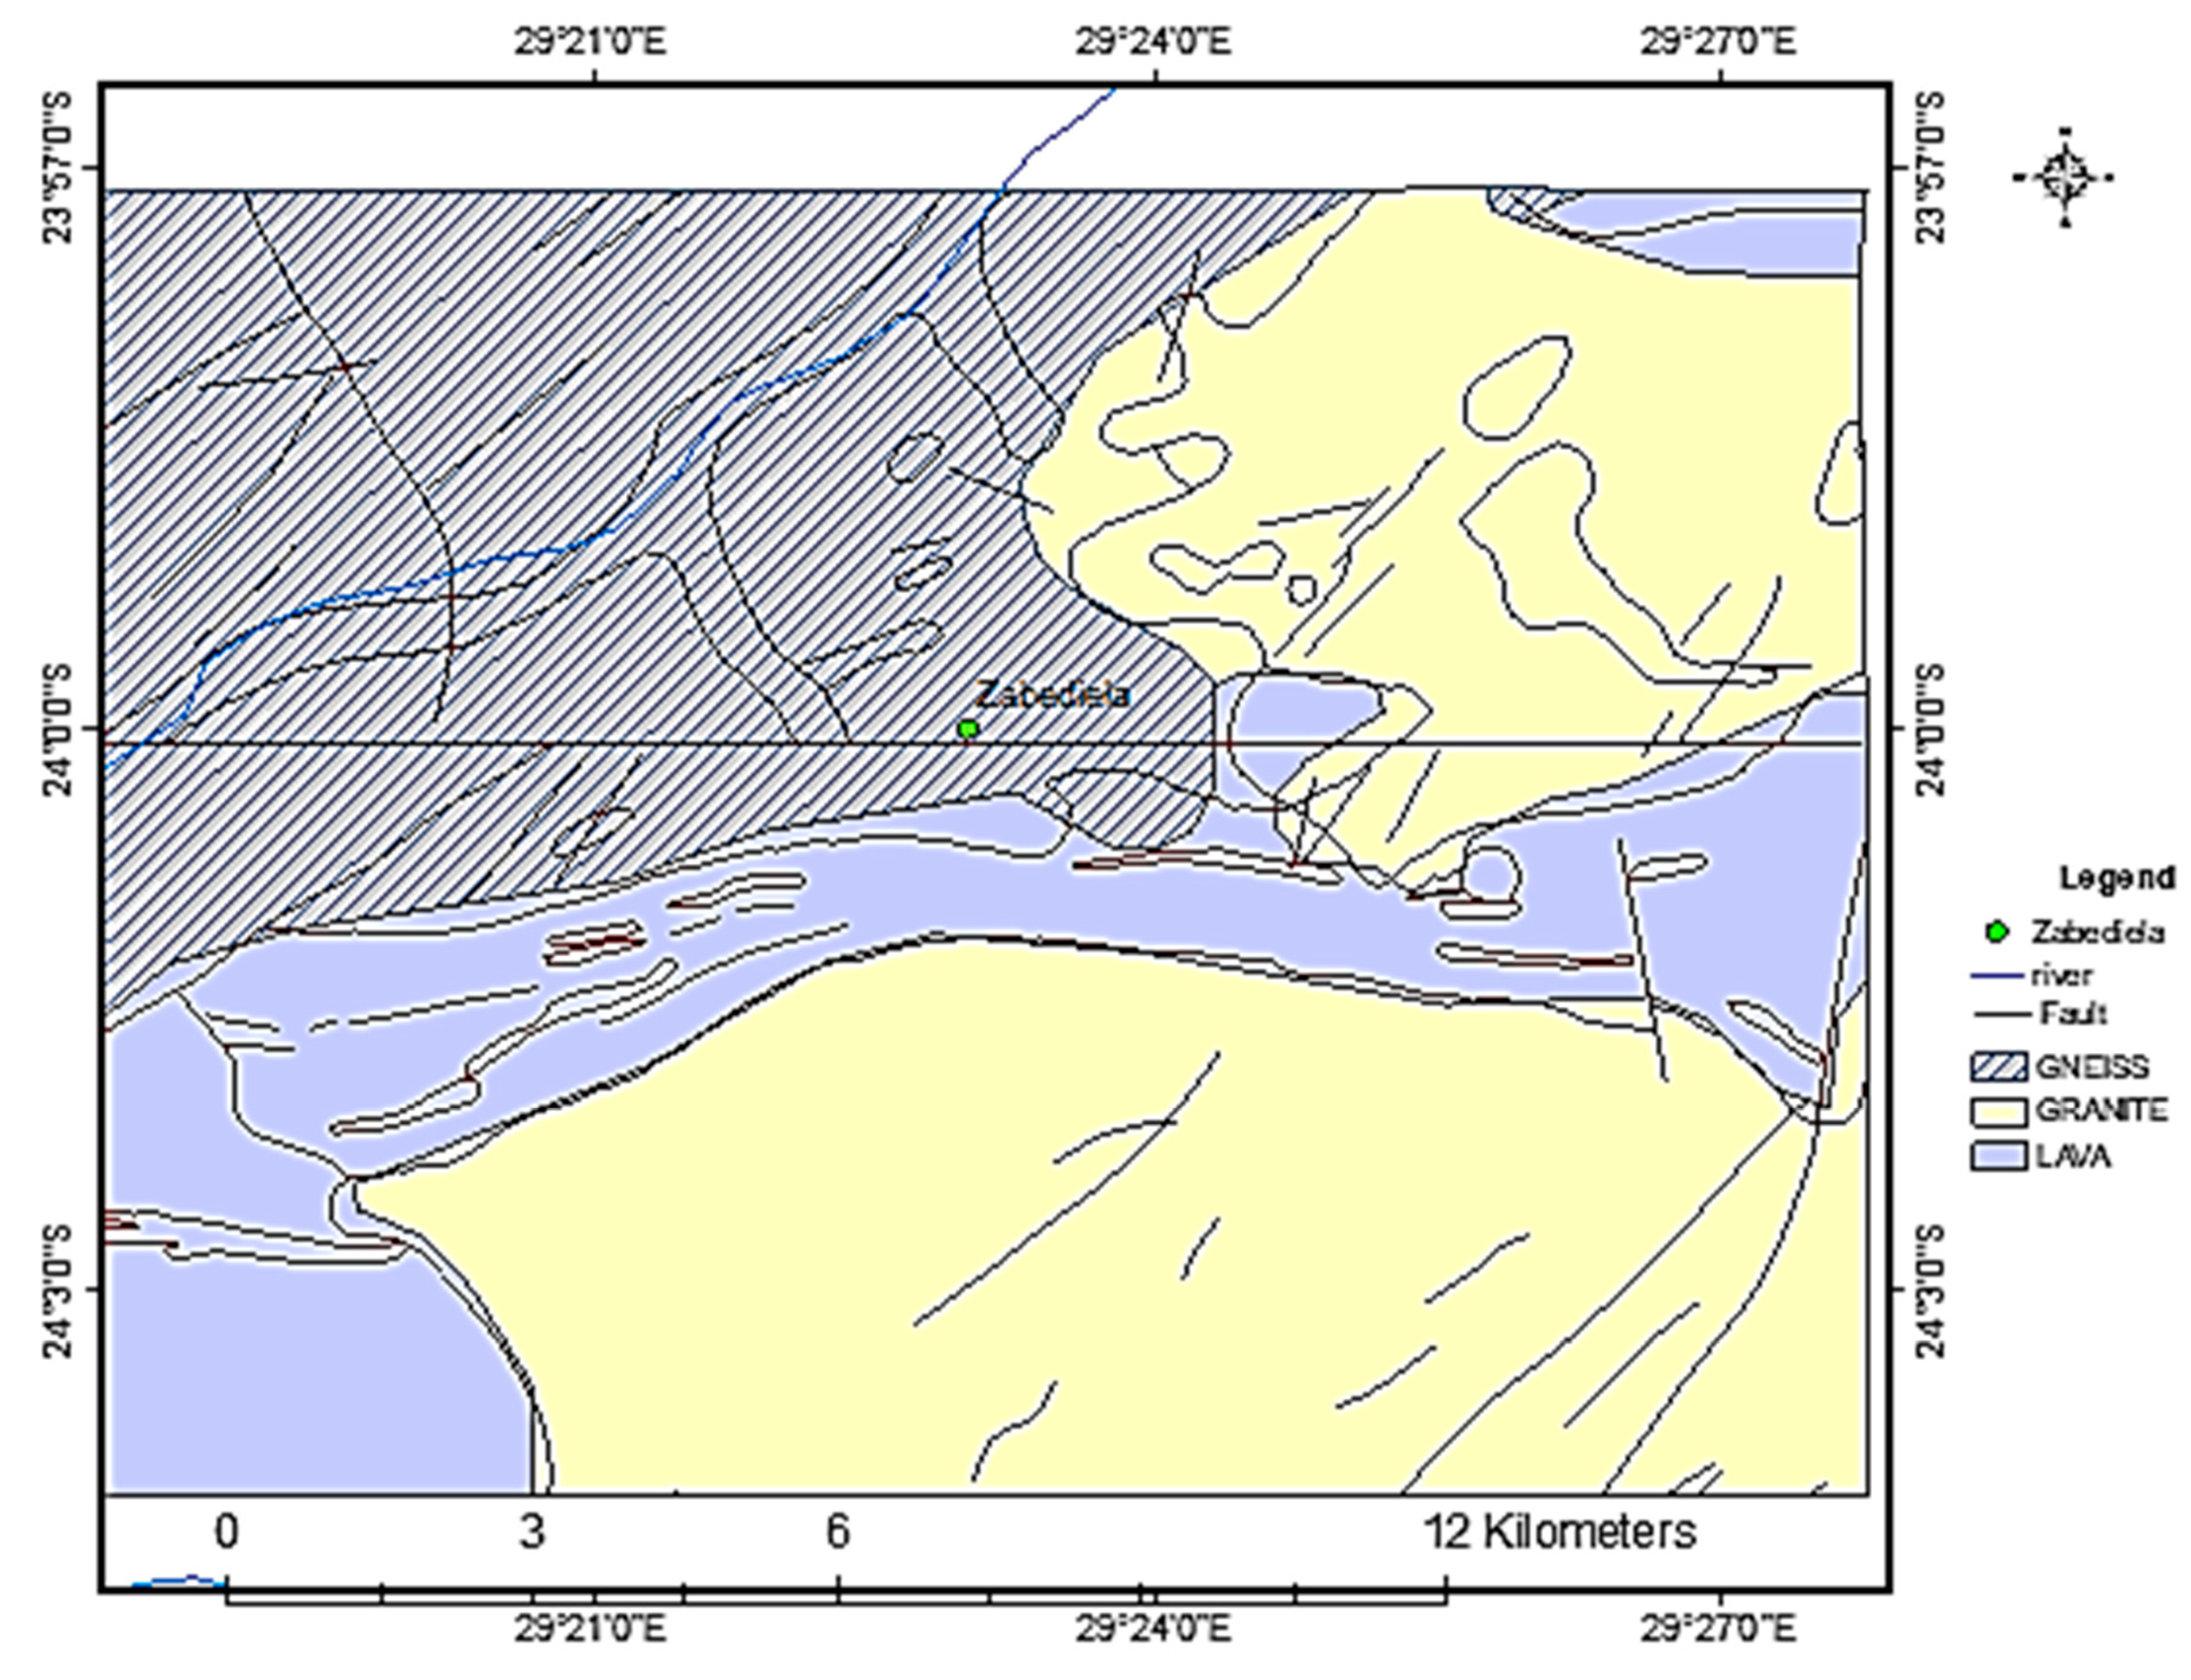
2.1. Geologic Setting
2.2. Sampling and Samples
2.3. Laboratory Analyses
3. Results
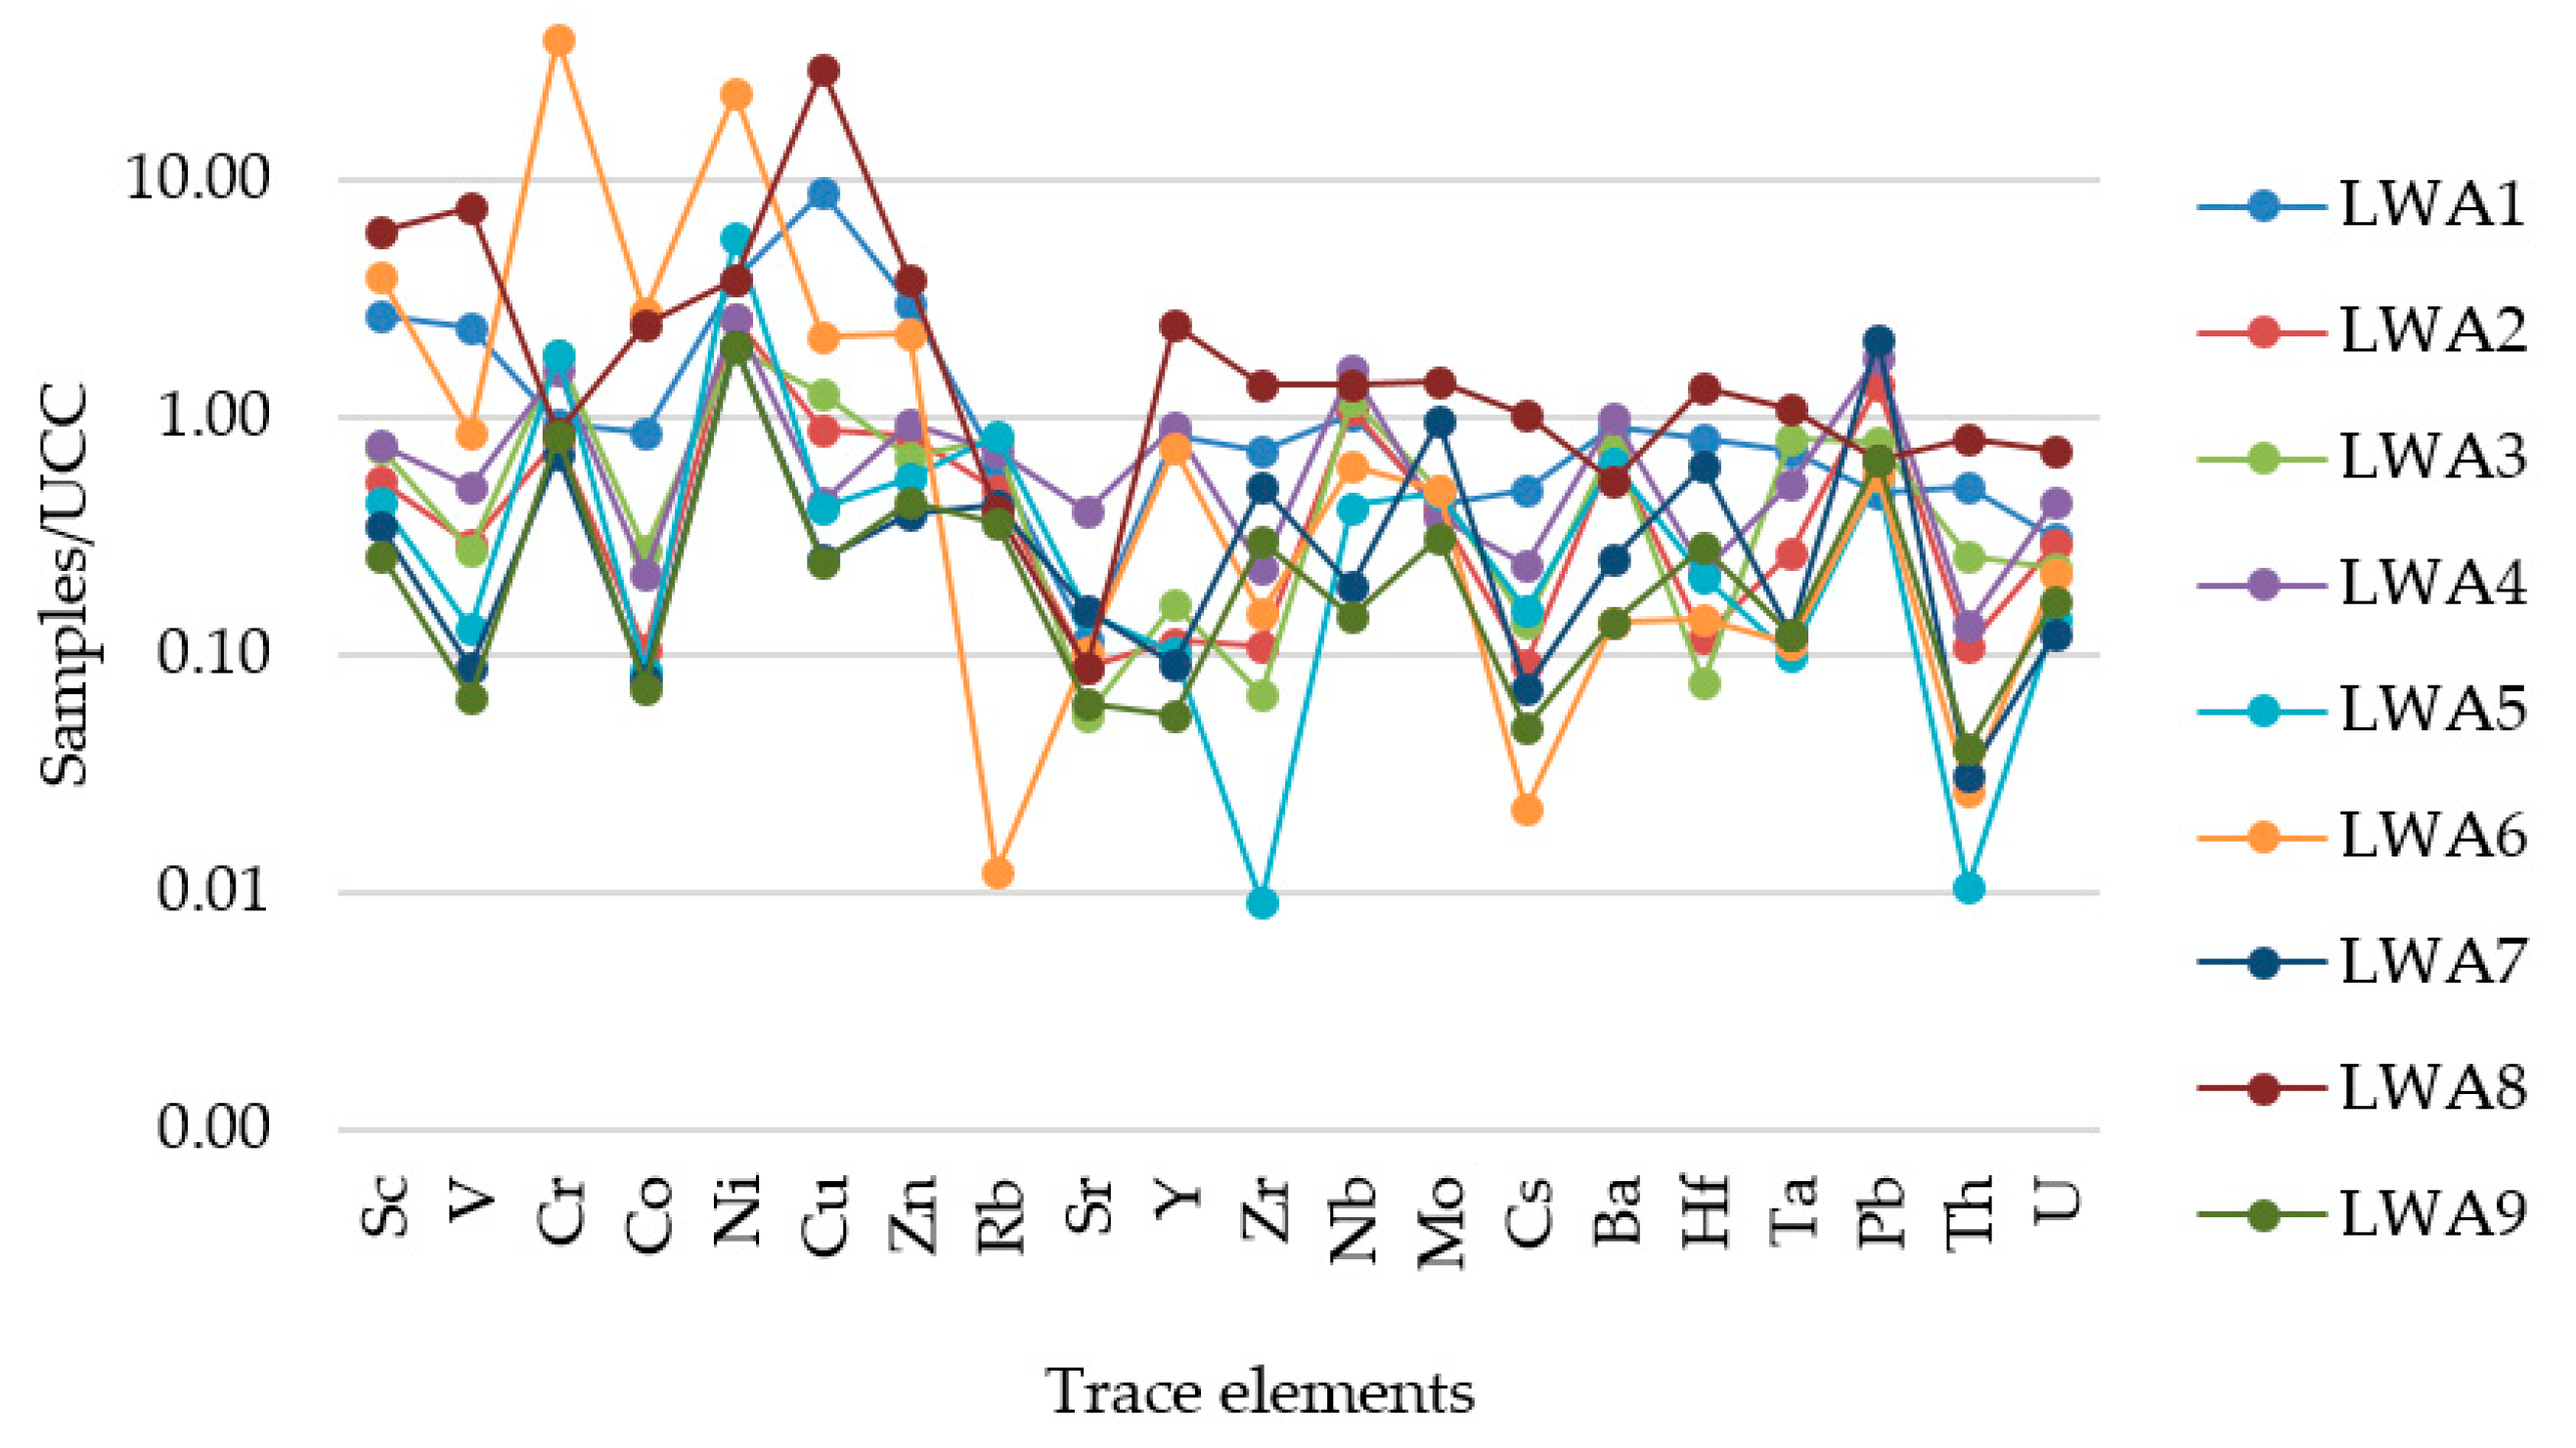
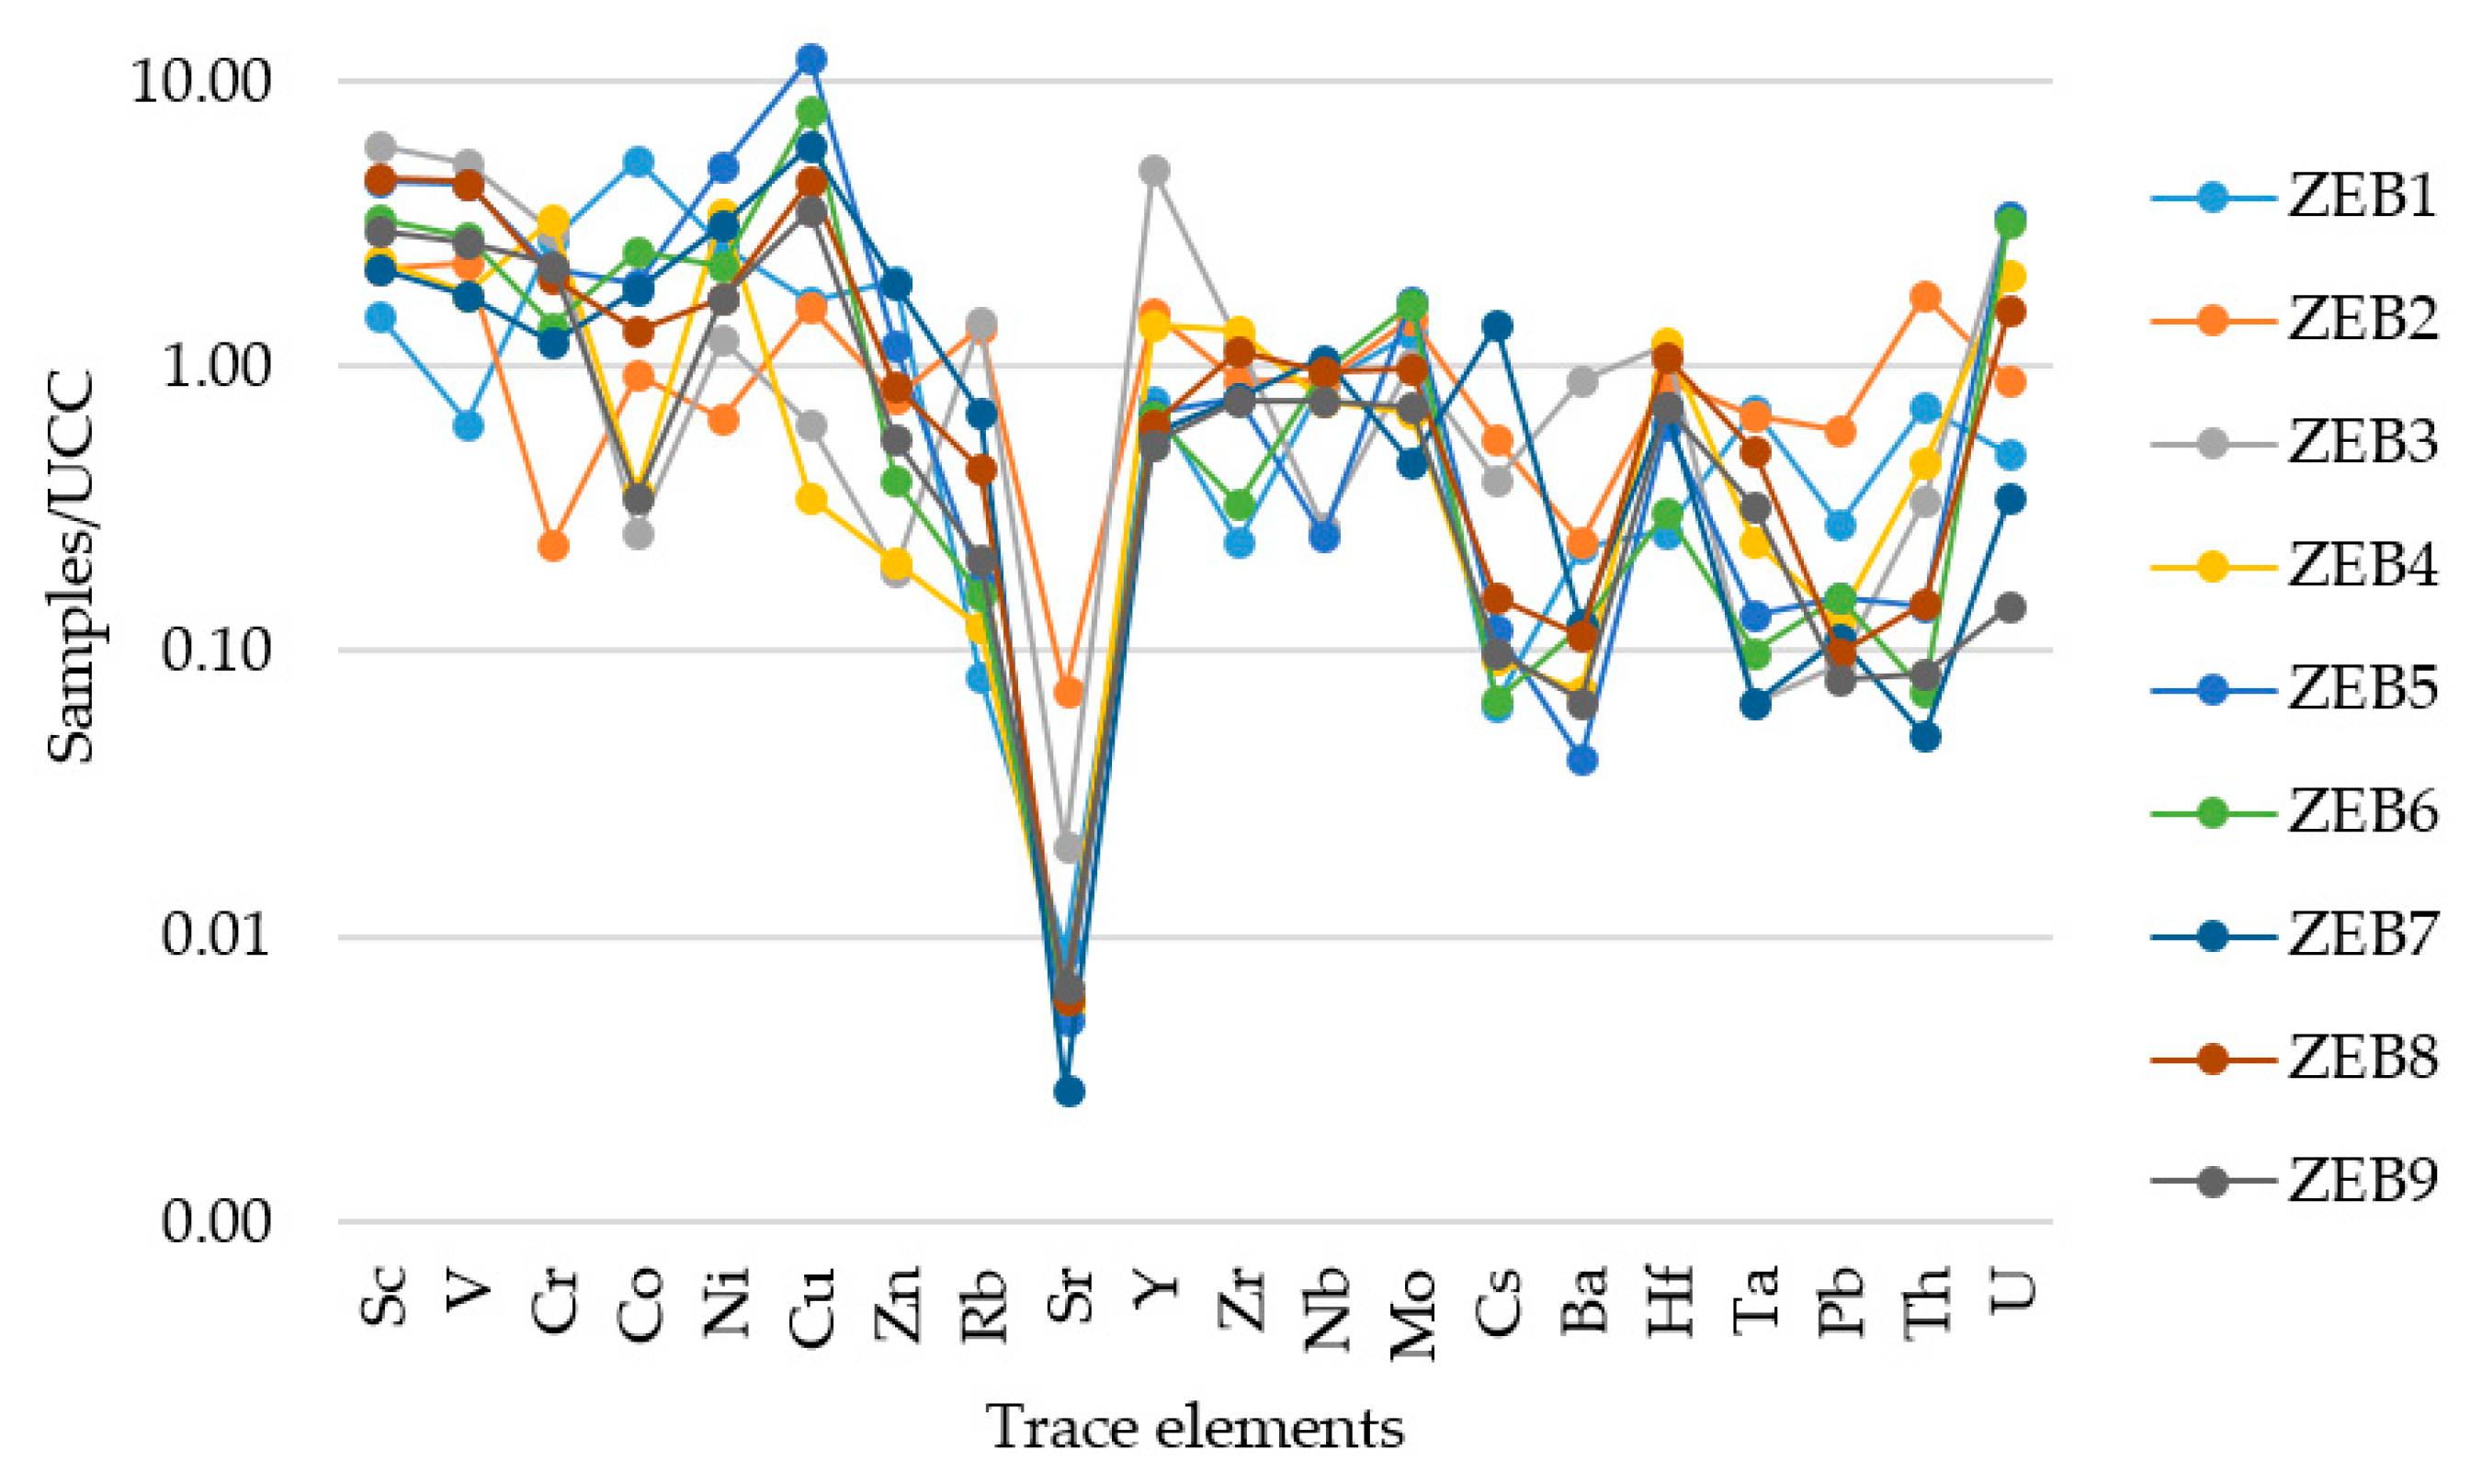
3.1. Trace Elements
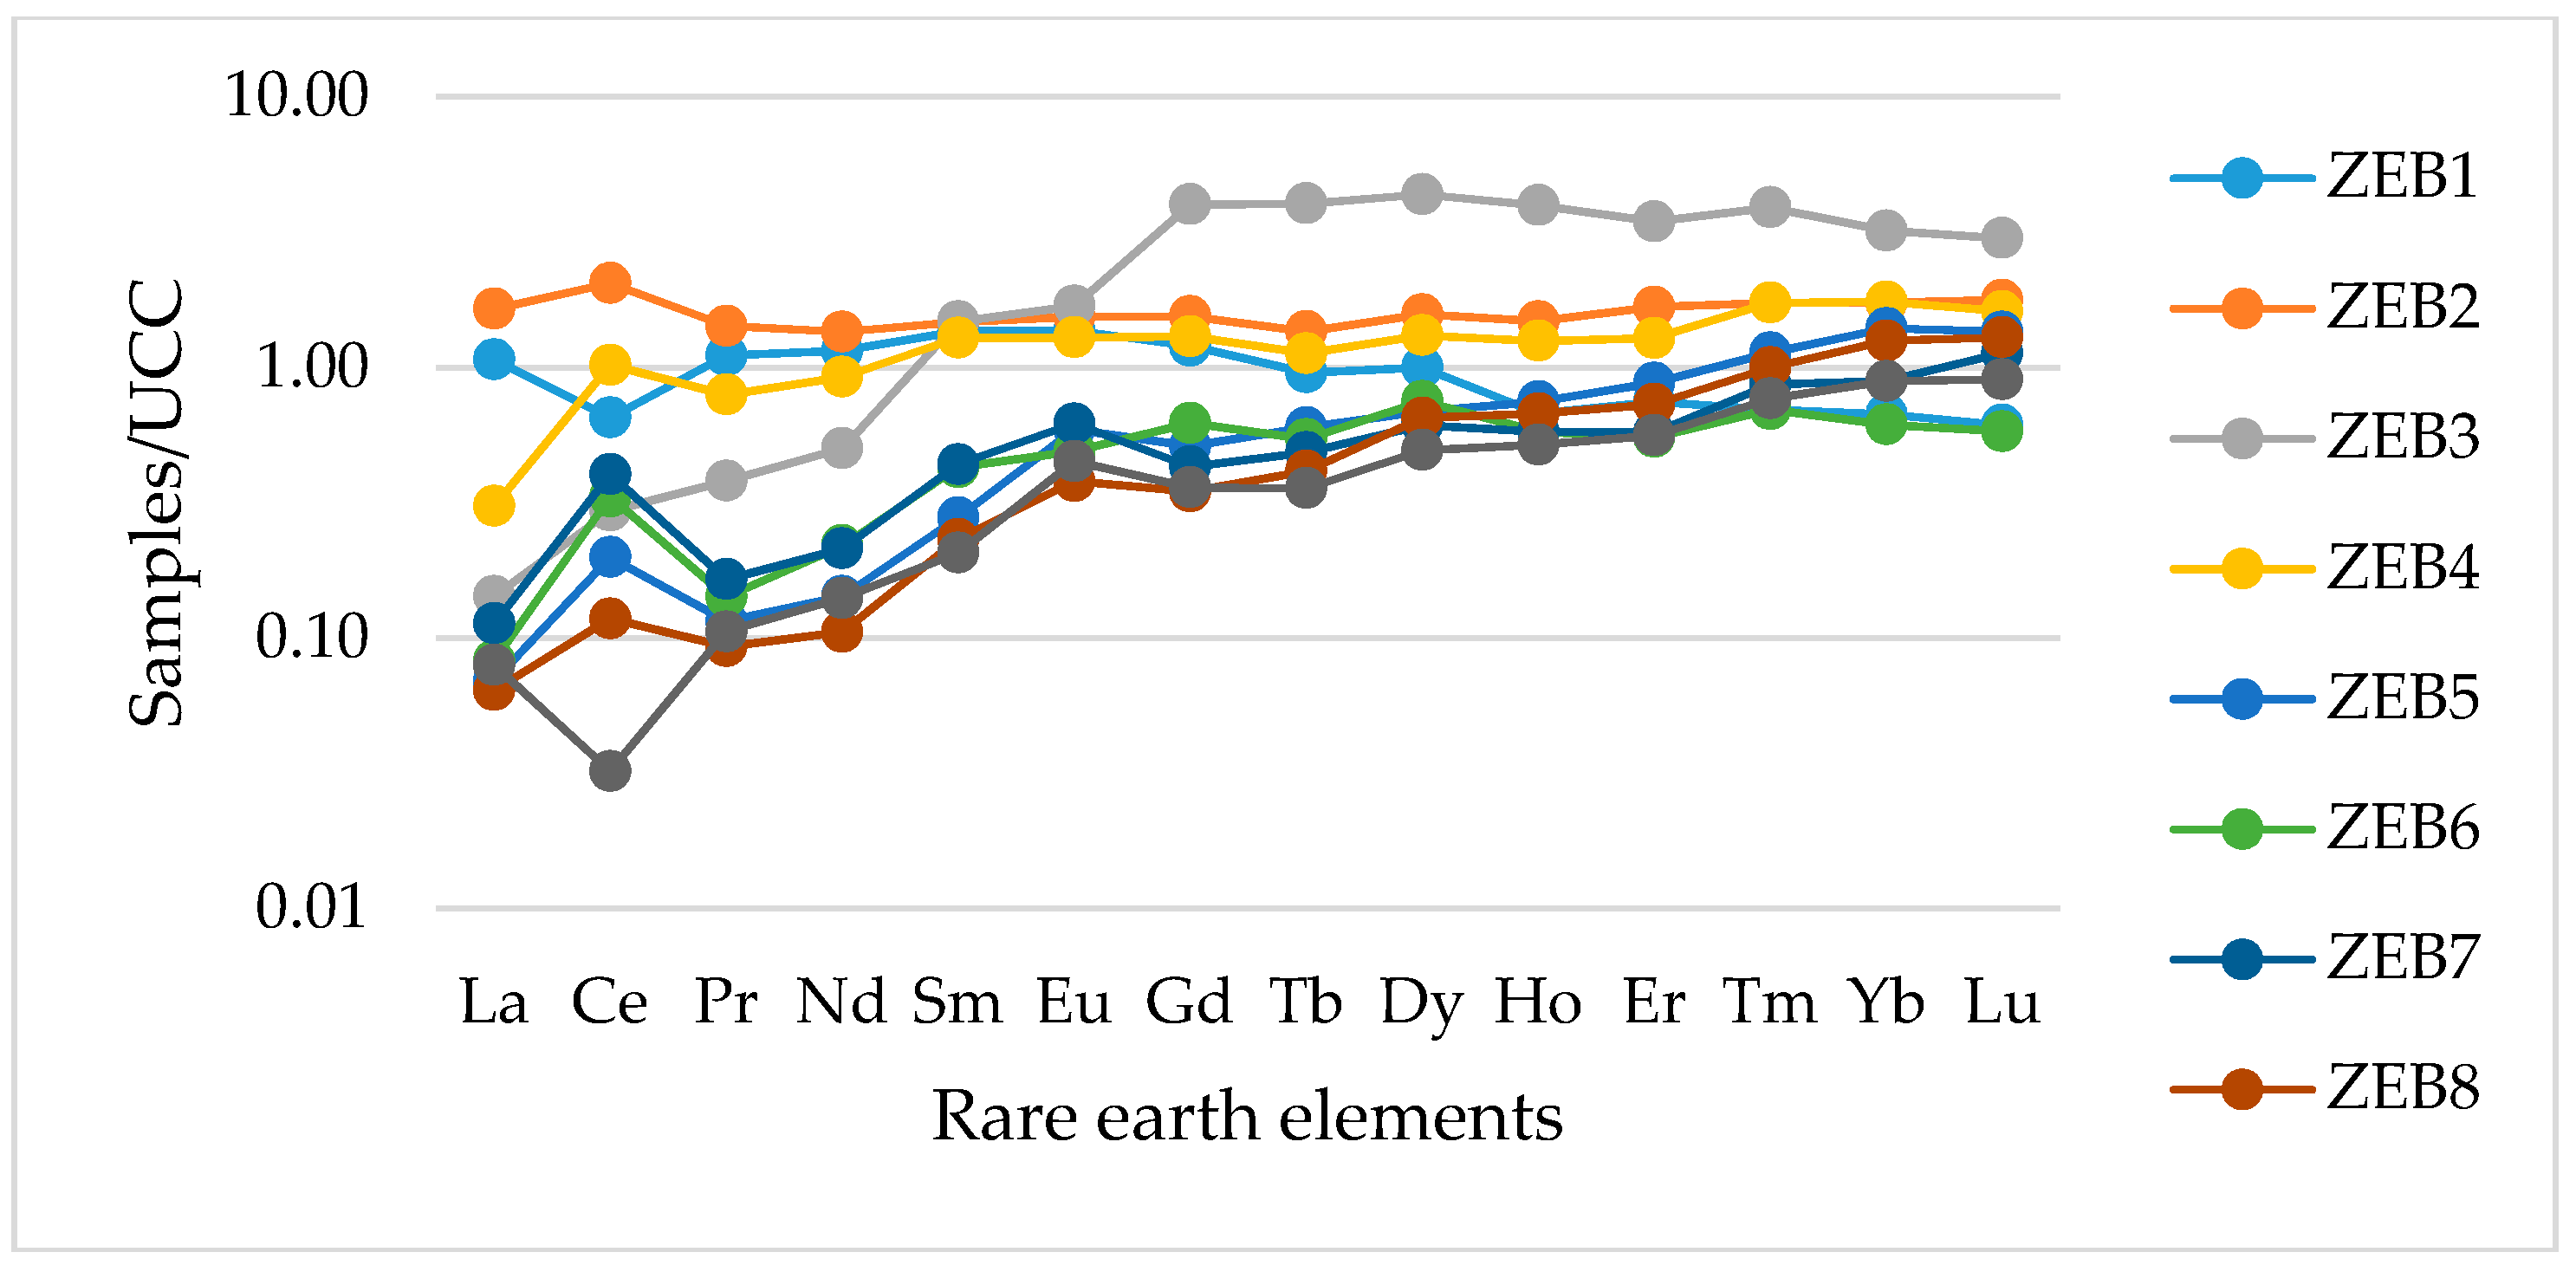
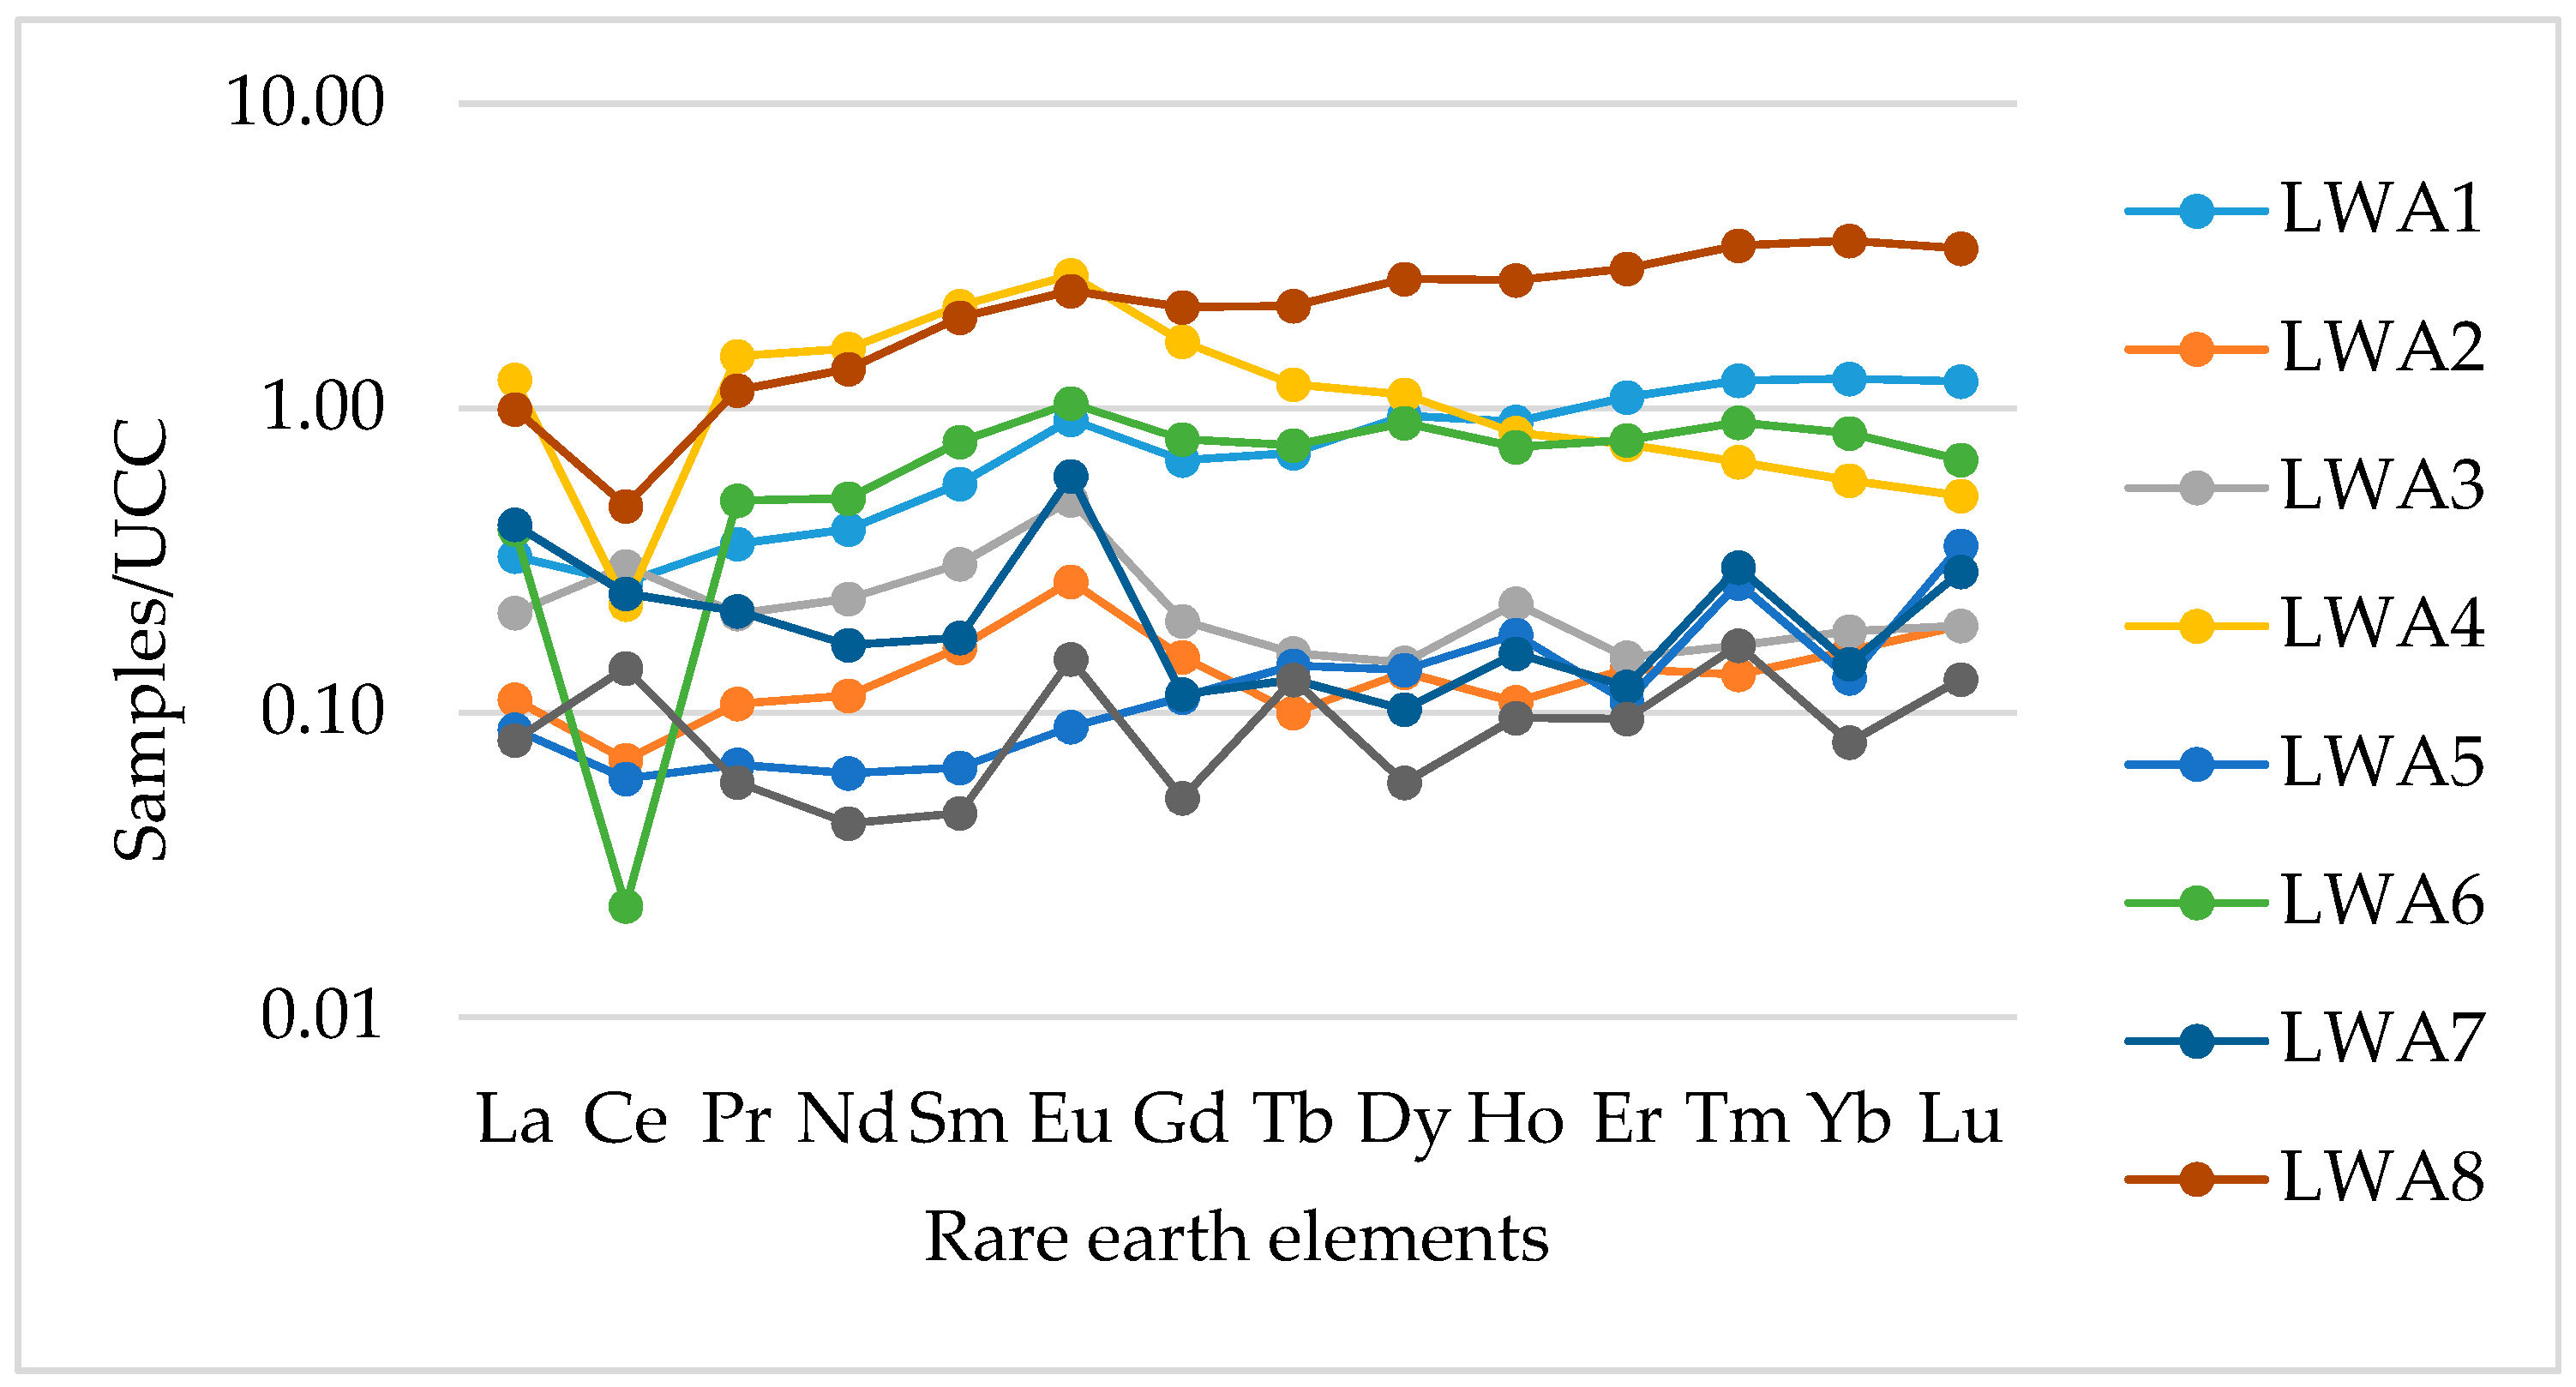
3.2. Rare Earth Elements (REEs)
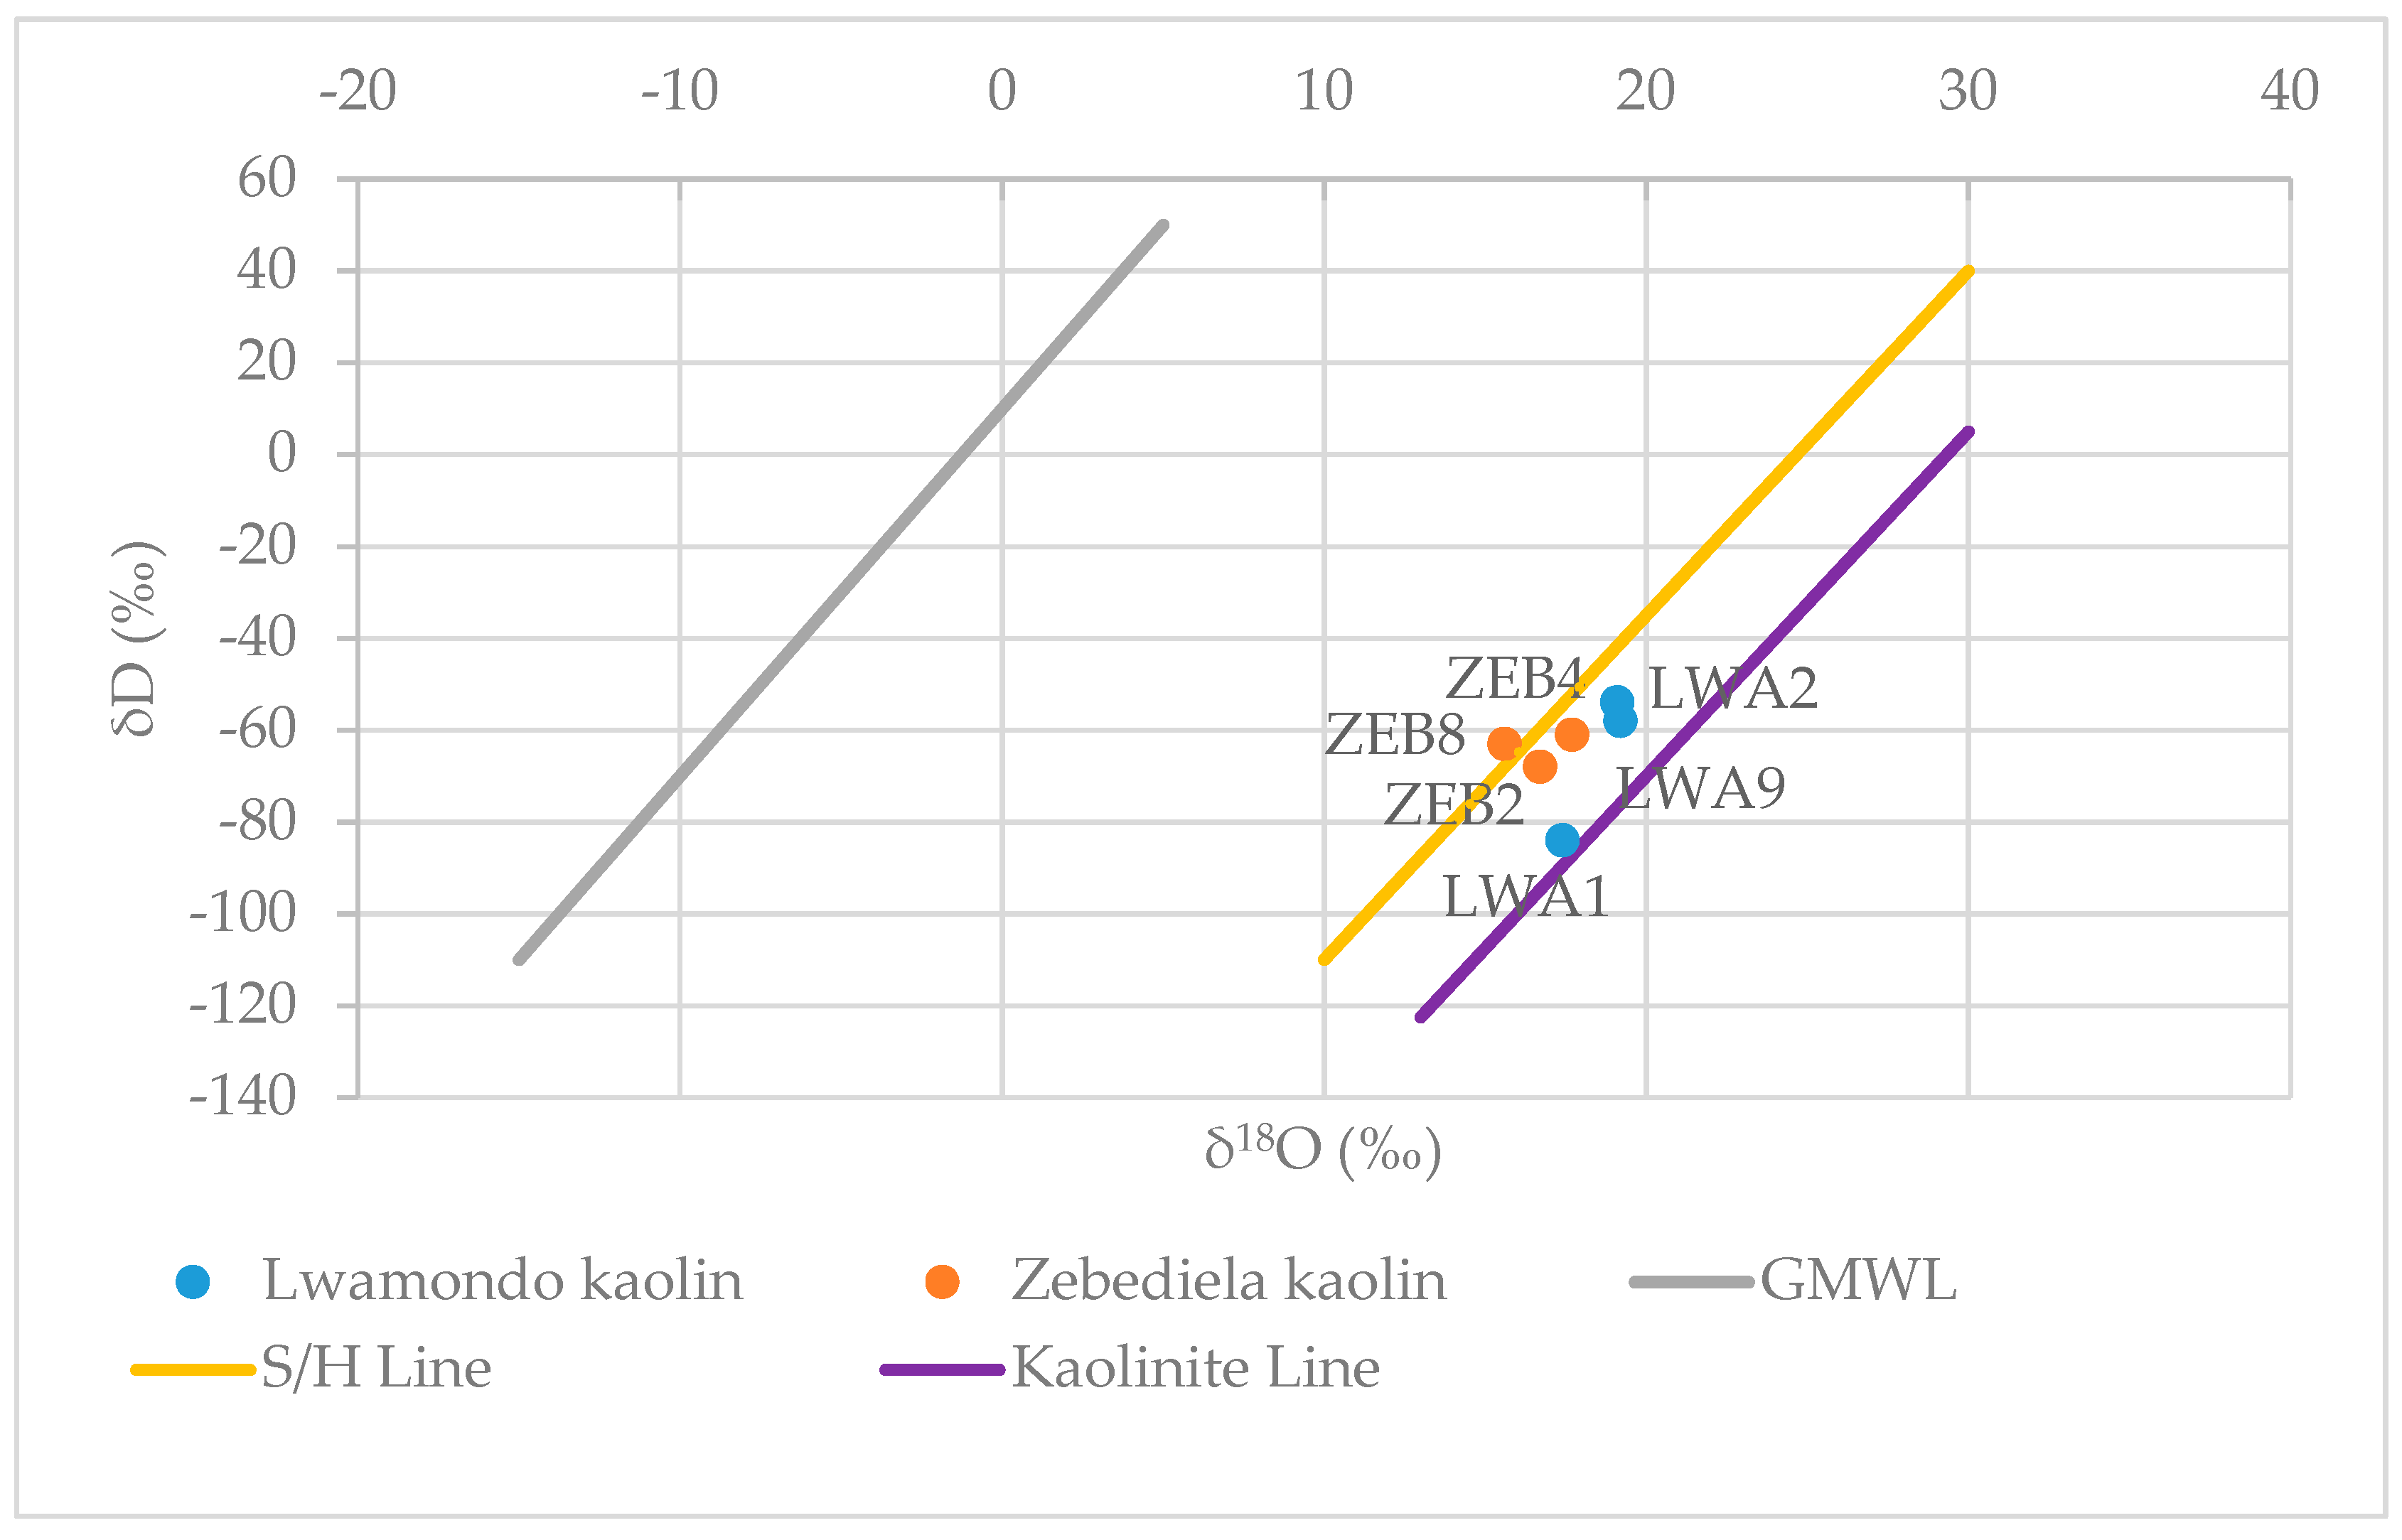
3.3. Hydrogen and Oxygen Isotopes
4. Discussion
4.1. Paleoweathering
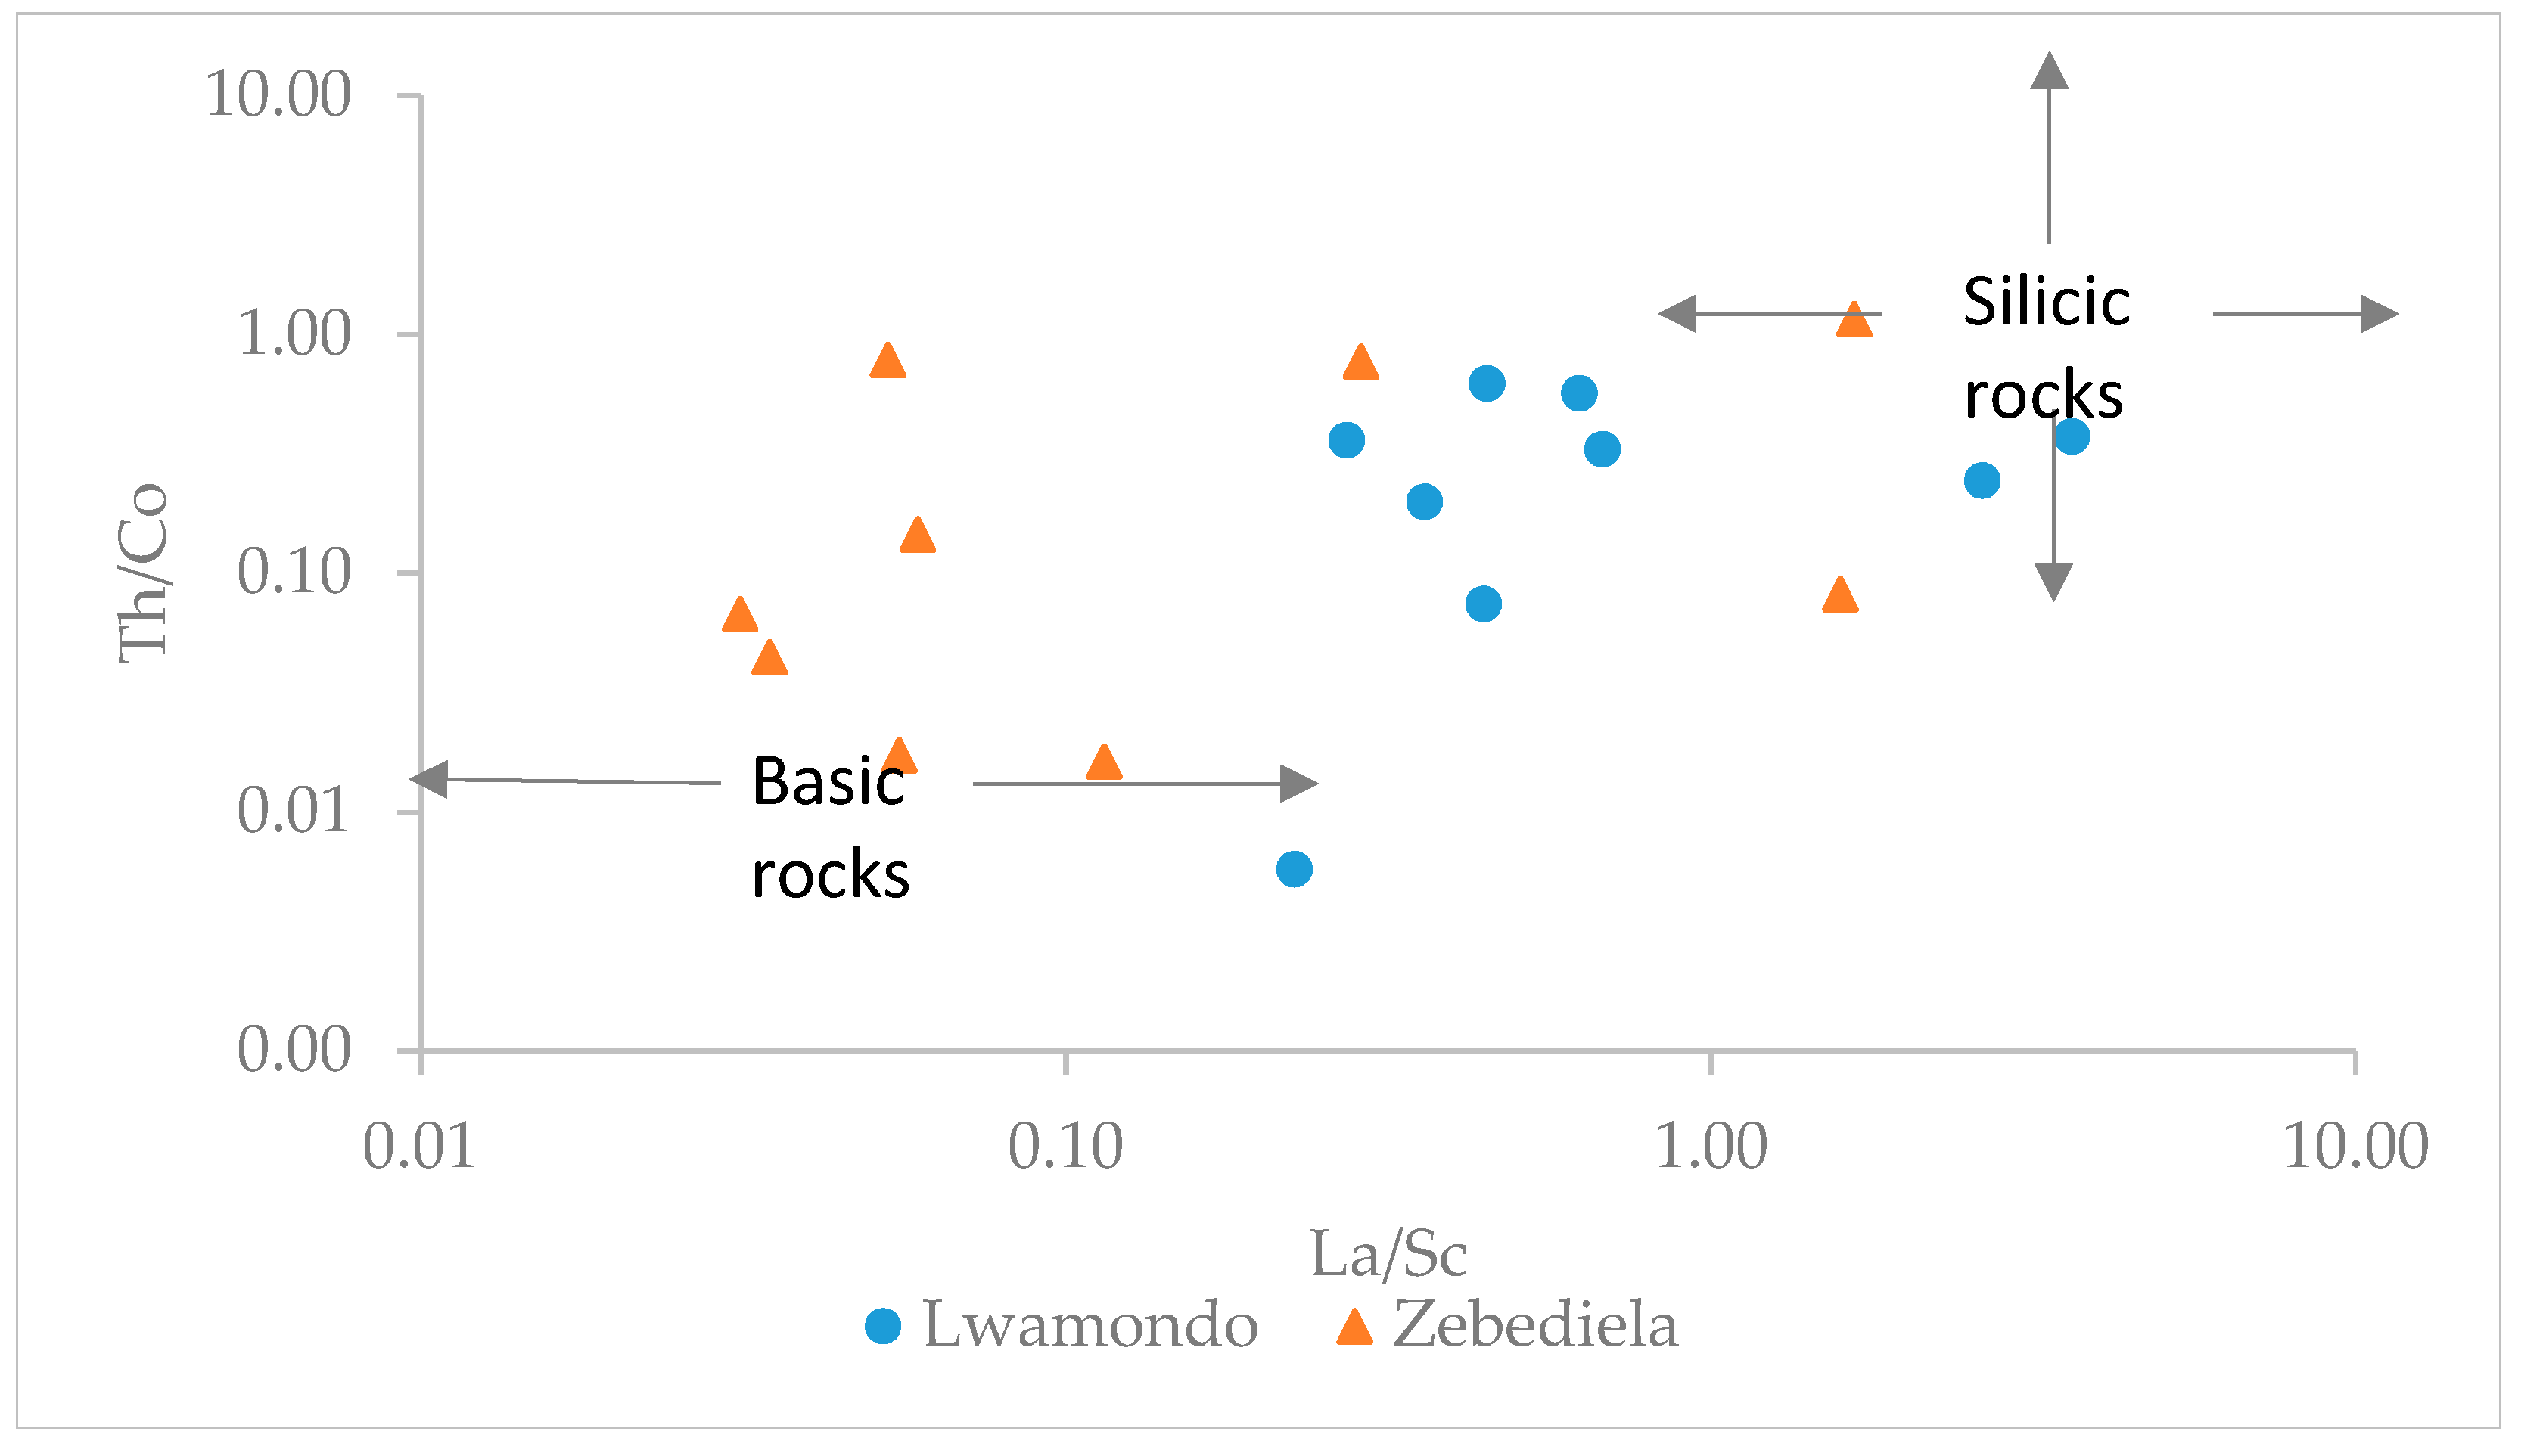
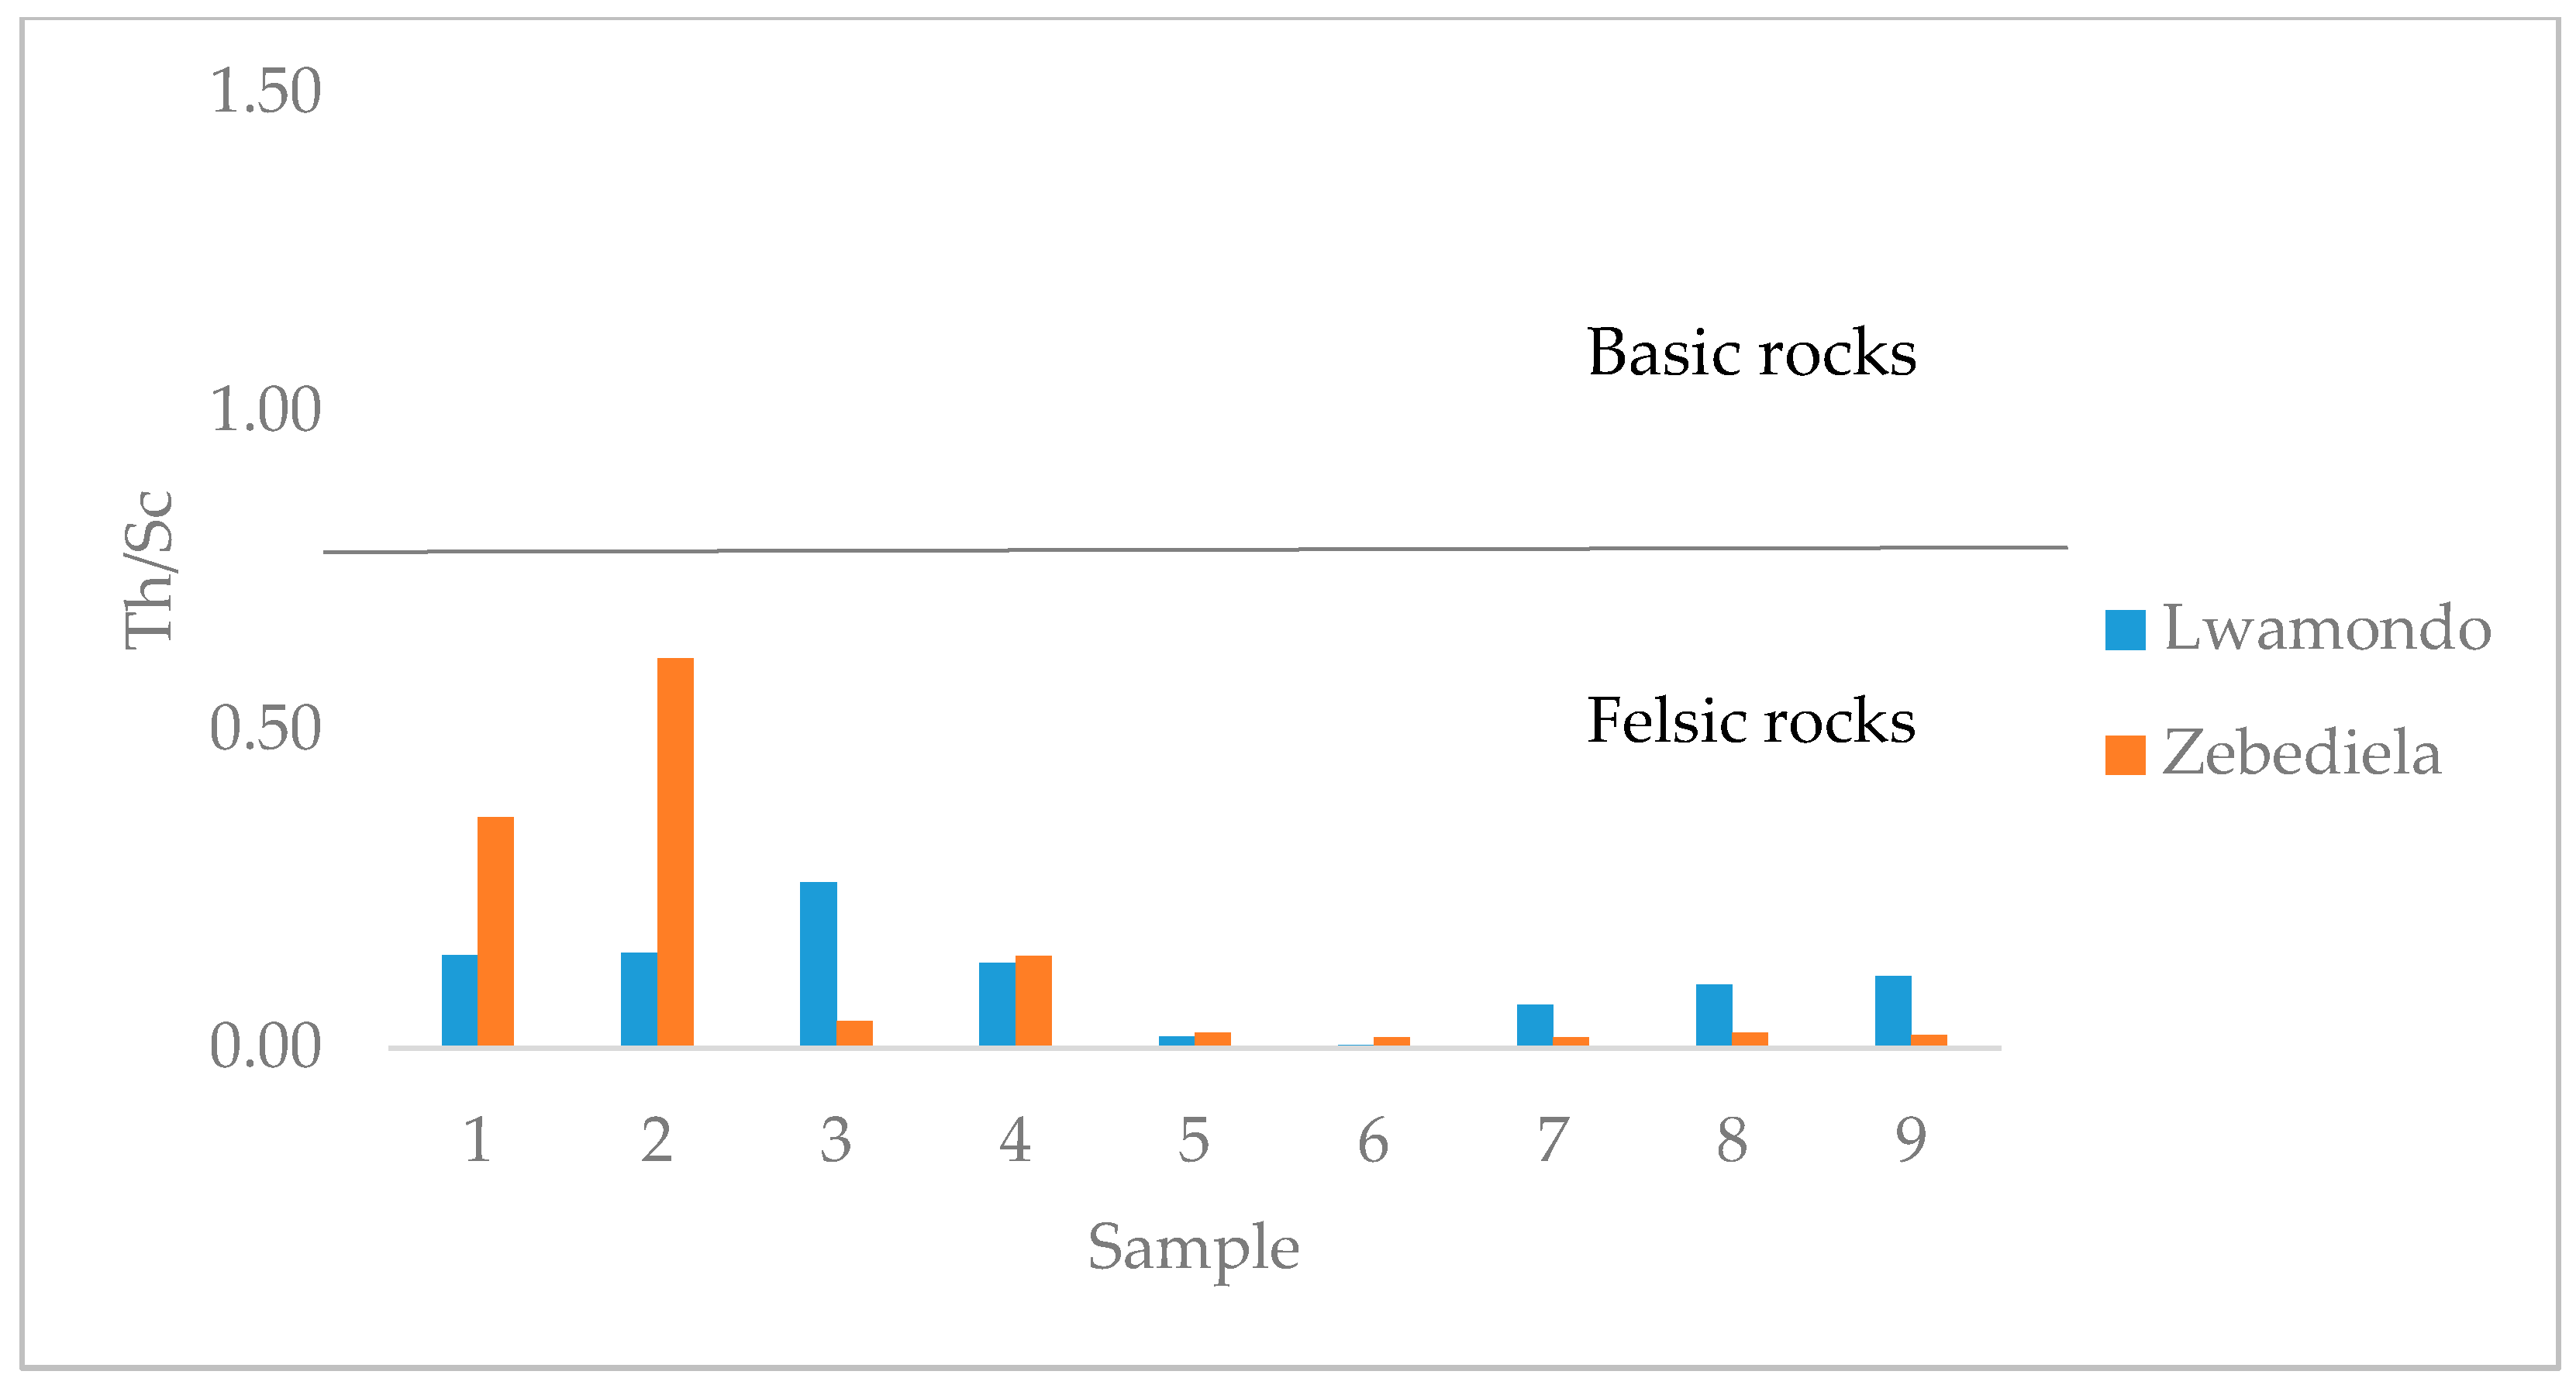
4.2. Sedimentary Provenance and Tectonic Setting
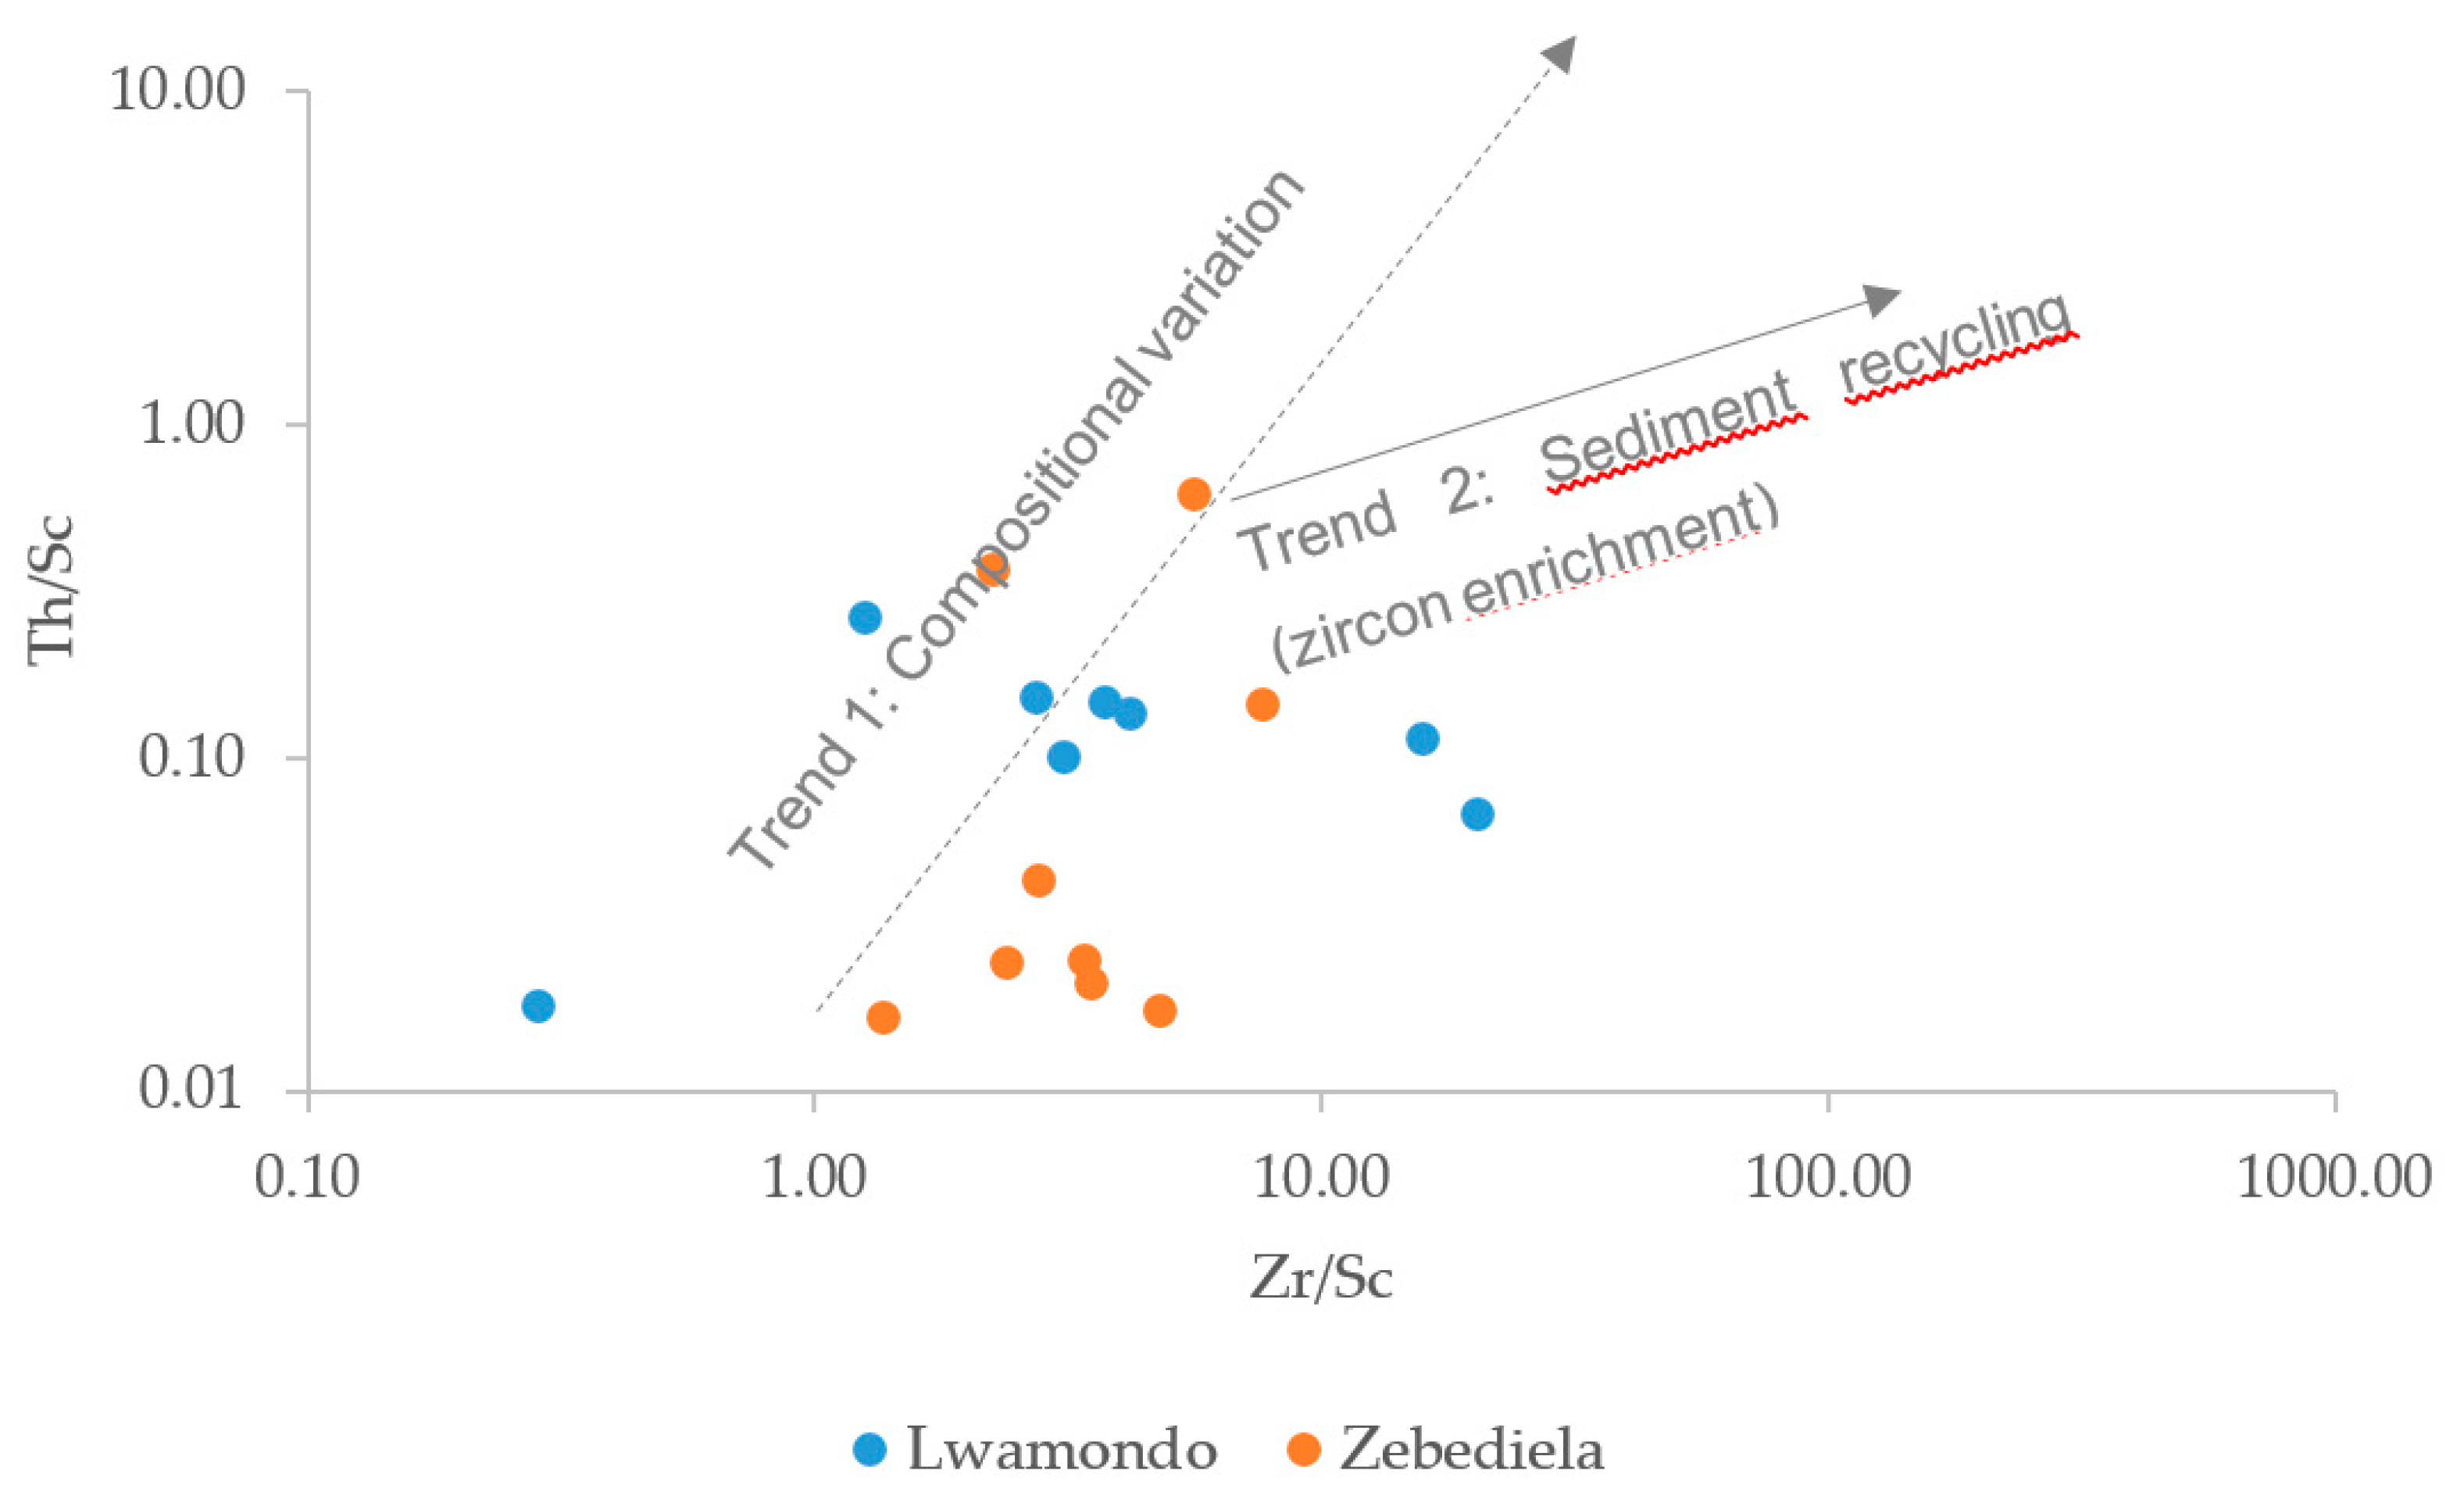
4.3. Hydraulic Sorting and Sediment Recycling
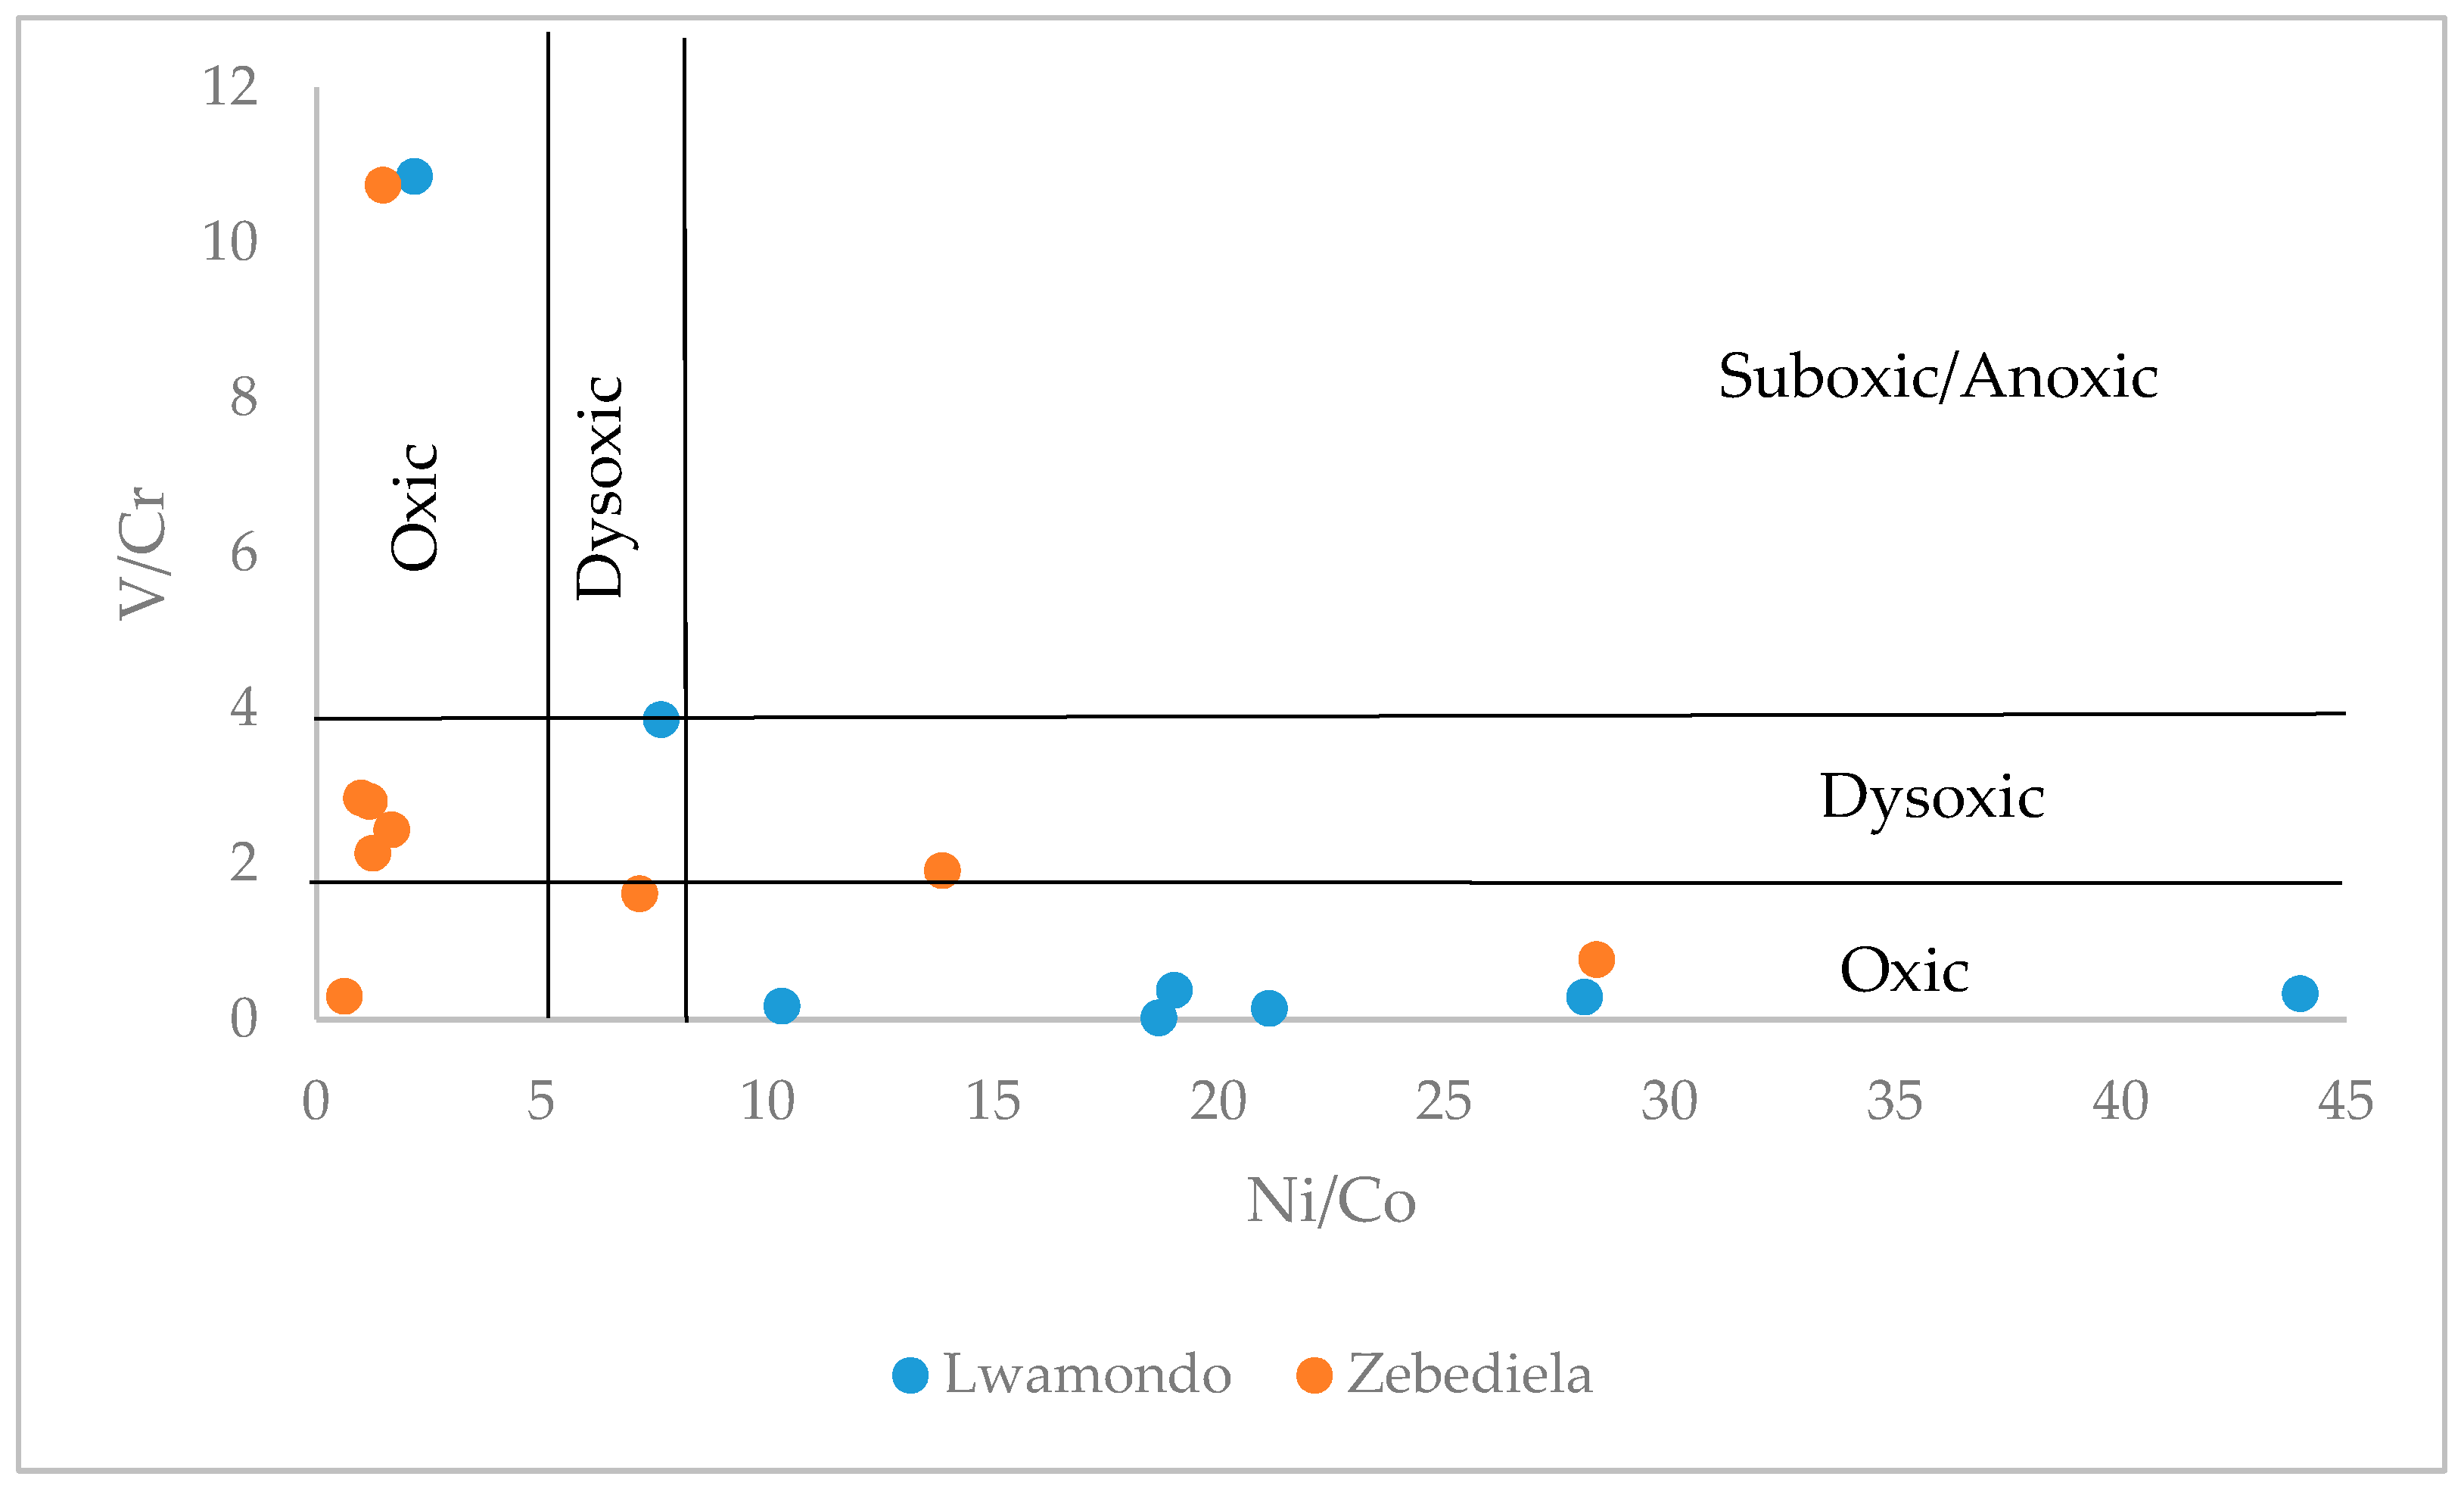
4.4. Paleo-Redox Conditions
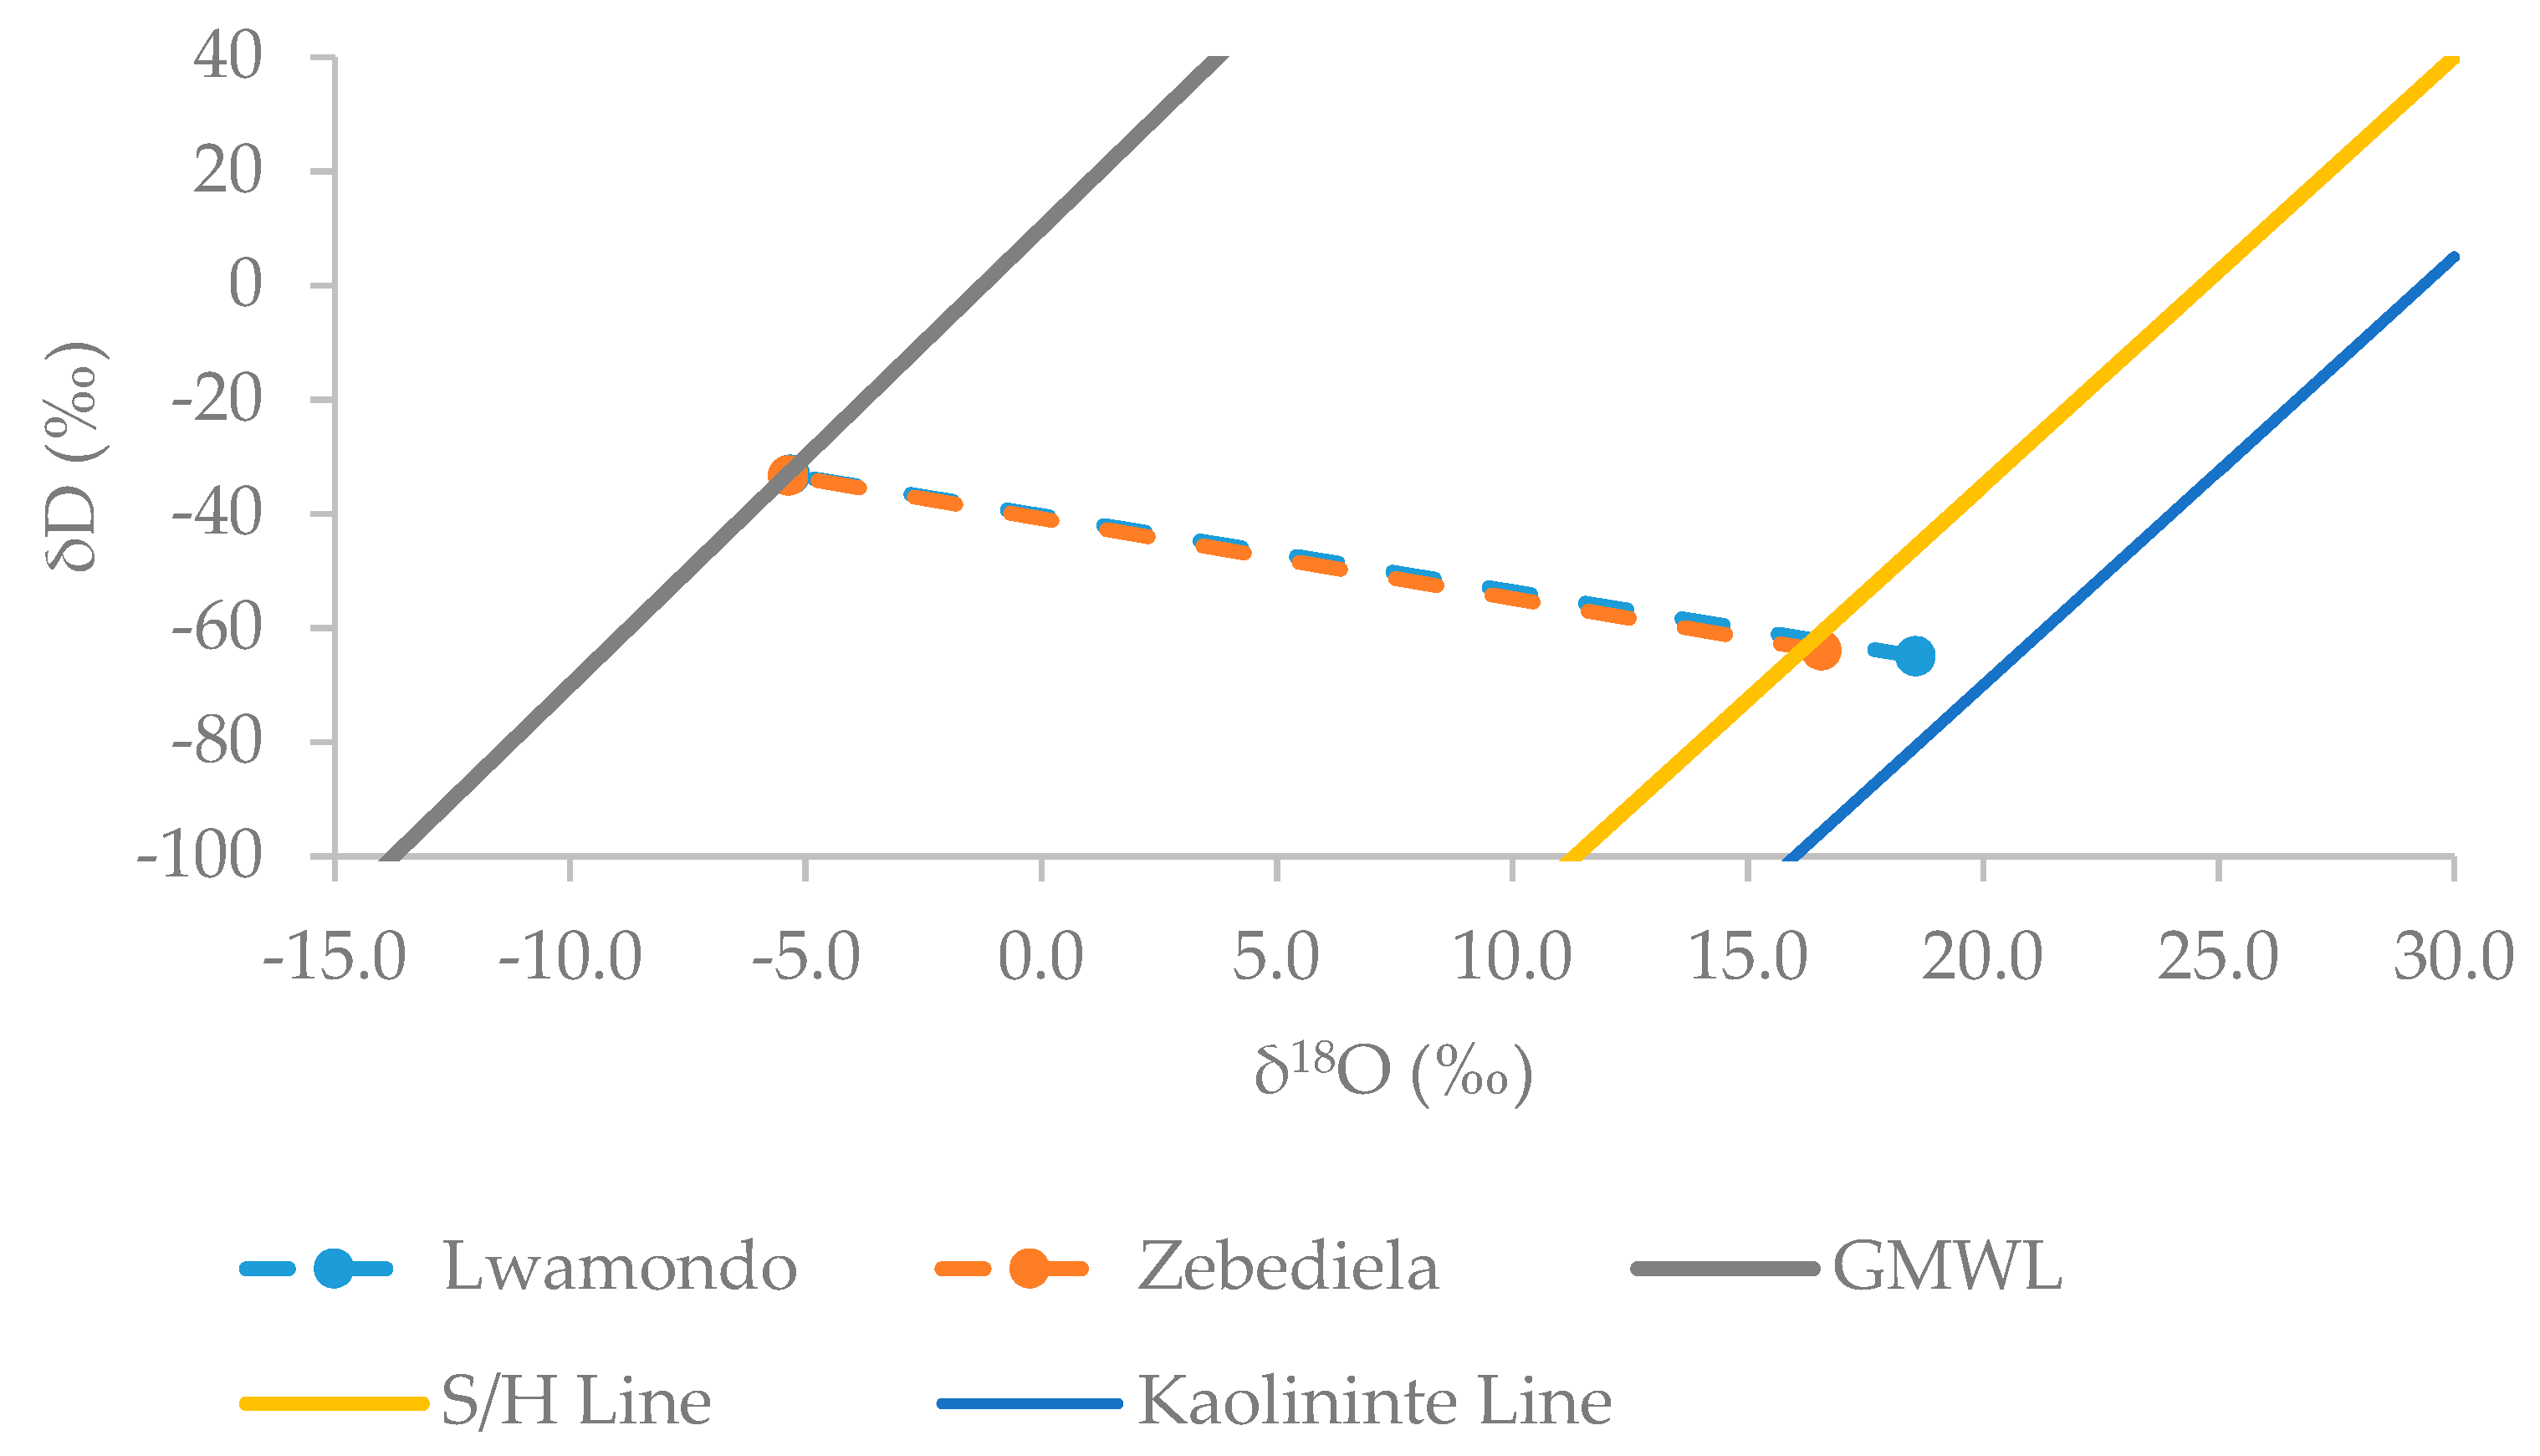
4.5. Paleotemperatures
5. Conclusions
Author Contributions
Funding
Acknowledgments
Conflicts of Interest
References
- Murray, H.H. Applied Clay Mineralogy. Occurrences, processing and application of kaolins, bentonites, palygorskite-sepiolite and common clays. In Developments in Clay Science; Elsevier: Amsterdam, The Netherlands, 2007; Volume 2, p. 179. [Google Scholar]
- Murray, H.H. Industrial Clays Case Study; No. 64; Mining, Minerals and Sustainable Development: London, UK, 2002. [Google Scholar]
- Ekosse, G.E. Fourier transform infrared spectrophotometry and X-ray powder diffractometry as complementary techniques in characterizing clay size fraction of kaolin. J. Appl. Sci. Environ. Manag. 2005, 9, 43–48. [Google Scholar] [CrossRef]
- López, J.M.G.; Bauluz, B.; Fernández-Nieto, C.; Oliete, A.Y. Factors controlling the trace-element distribution in fine-grained rocks: The Albian kaolinite-rich deposits of the Oliete Basin (NE Spain). Chem. Geol. 2005, 214, 1–19. [Google Scholar] [CrossRef]
- McLennan, S.M.; Hemming, S.; McDaniel, D.K.; Hanson, G.N. Geochemical approaches to sedimentation, provenance, and tectonics. Geol. Soc. Am. 1993, 284, 21–40. [Google Scholar]
- Jones, B.; Manning, D.A.C. Comparison of geochemical indices used for the interpretation of paleoredox condiions in ancient mudstones. Chem. Geol. 1984, 111, 111–129. [Google Scholar] [CrossRef]
- Cullers, R.L. The controls on the major- and trace-element evolution of shales, siltstones and sandstones of Ordovician to Tertiary age in the Wet Mountains regions, Colorado, USA. Chem. Geol. 1995, 123, 107–131. [Google Scholar] [CrossRef]
- Cullers, R.L. The geochemistry of shales, siltstones and sandstones of Pennsylvanian-Permian age, Colorado, USA: Implications for provenance and metamorphic studies. Lithos 2000, 51, 181–203. [Google Scholar] [CrossRef]
- Armstrong-Altrin, J.S.; Nagarajan, R.; Madhavaraju, J.; Rosalez-Hoz, L.; Lee, Y.I.; Balaram, V.; Cruz-Martínez, A.; Avila-Ramírez, G. Geochemistry of the Jurassic and Upper Cretaceous shales from the Molango Region, Hidalgo, eastern Mexico: Implications for source-area weathering, provenance, and tectonic setting. C. R. Geosci. 2013, 345, 185–202. [Google Scholar] [CrossRef]
- Nagarajan, R.; Armstrong-Altrin, J.S.; Kessler, F.L.; Hidalgo-Moral, E.L.; Dodge-Wan, D.; Taib, N.I. Provenance and tectonic setting of Miocene siliciclastic sediments, Sibuti formation, northwestern Borneo. Arab. J. Geosci. 2015, 8, 8549–8656. [Google Scholar] [CrossRef]
- Sheldon, N.D.; Tabor, N.J. Quantitative paleoenvironmental and paleoclimatic reconstruction using paleosols. Earth-Sci. Rev. 2009, 95, 1–52. [Google Scholar] [CrossRef]
- Sheppard, S.M.F.; Gilg, H.A. Stable isotope geochemistry of clay minerals. Clay Miner. 1996, 31, 1–24. [Google Scholar] [CrossRef]
- Ekosse, G.E. Thermoanalytical characterization, stable isotopes and paleoenvironmental considerations of kaolinite from two genetic sources. Fresenius Environ. Bull. 2008, 17, 29–42. [Google Scholar]
- Lee, Y.I. Geochemistry of shales of the Upper Cretaceous Hayang Group, SE Korea: Implications for provenance and source weathering at an active continental margin. Sediment. Geol. 2009, 215, 1–12. [Google Scholar] [CrossRef]
- Fernández-Caliani, J.C.; Gálan, E.; Aparicio, P.; Miras, A.; Márquez, M.G. Origin and geochemical evolution of the Nuevo Montecastelo kaolin deposit (Galicia, NW Spain). Appl. Clay Sci. 2010, 49, 91–97. [Google Scholar] [CrossRef]
- Clauer, N.; Fallick, A.E.; Gálan, E.; Aparicio, P.; Miras, A.; Fernández-Caliani, J.C.; Aubert, A. Stable isotope contraints on the origin of kaolin deposits from Variscan granitoids of Galicia (NW Spain). Chem. Geol. 2015, 417, 90–101. [Google Scholar] [CrossRef]
- Gilg, H.A.; Hülmeyer, S.; Miller, H.; Sheppard, S.M.F. Supergene origin of the lastarria kaolin deposit, South-Central Chile, and paleoclimatic implications. Clays Clay Miner. 1999, 47, 201–211. [Google Scholar] [CrossRef]
- Diko, M.L. Genesis and Ceramic Applications of Selected Kaolin Occurrences from Limpopo Province, South Africa and South West Region. Ph.D. Thesis, University of Limpopo, Polokwane, South Africa, 2011, unpublished. [Google Scholar]
- Brandl, G.; Soutpansberg Group. Catalogue of South African Lithostratigraphic Units; SA Committee for Stratigraphy, Council Geoscience: Pretoria, South Africa, 2000; pp. 6-39–6-41. [Google Scholar]
- Council for Geosciences. 1:250,000 Geological Series; Sheet 2228 Alldays; Council for Geosciences: Pretoria, South Africa, 2002. [Google Scholar]
- Catuneanu, O.; Eriksson, P.J. The sequence stratigraphic concept and the Precambrian rock record: An example from the 2.7–2.1 Ga Transvaal Supergroup, Kaapvaal Craton. Precambrian Res. 1999, 97, 215–251. [Google Scholar] [CrossRef]
- Eriksson, P.G.; Reczko, B.F.F. The sedimentary and tectonic setting of the Transvaal Supergroup floor rocks to the Bushveld Complex. J. Afr. Earth Sci. 1995, 21, 487–504. [Google Scholar] [CrossRef]
- Ekosse, G. The Makoro kaolin deposit, southeastern Botswana: Its genesis and possible industrial applications. Appl. Clay Sci. 2000, 16, 301–320. [Google Scholar] [CrossRef]
- Ekosse, G.E. Provenance of the Kgwakgwe kaolin deposit in southeastern Botswana and its possible utilization. Appl. Clay Sci. 2001, 20, 137–152. [Google Scholar] [CrossRef]
- Jackson, M.L. (Ed.) Soil Chemical Analysis—Advanced Course, 2nd ed.; University of Wisconsin: Madison, WI, USA, 1979; p. 497. [Google Scholar]
- Van Reeuwijk, L.P. Procedures for Soil Analysis; Technical Paper 9; International Soil Reference and Information Centre: Wageningen, The Netherlands, 2002; p. 100. [Google Scholar]
- Jochum, K.P.; Nohl, U.; Herwig, K.; Lammel, E.; Stoll, B.; Hofmann, A.W. GeoReM: A New Geochemical Database for Reference Materials and Isotopic Standards. Geostand. Geoanal. Res. 2005, 29, 333–338. [Google Scholar] [CrossRef]
- Jochum, K.P.; Weis, U.; Schwager, B.; Stoll, B.; Wilson, S.A.; Haug, G.H.; Andreae, M.O.; Enzweiler, J. Reference Values Following ISO Guidelines for Frequently Requested Rock Reference Materials. Geostand. Geoanal. Res. 2016. [Google Scholar] [CrossRef]
- Borthwick, J.; Harmon, R.S. A note regarding ClF3 as an alternative to BrF5 for oxygen isotope nalysis. Geochim. Cosmochim. Acta 1982, 46, 1666–1668. [Google Scholar] [CrossRef]
- Diamond, R.E.; Harris, C. Oxygen and hydrogen isotope composition of Western Cape meteoric water. S. Afr. J. Sci. 1997, 93, 371–374. [Google Scholar]
- Bigeleisen, J.; Perlman, M.L.; Prosser, H.C. Conversion of hydrogenic materials to hydrogen for isotopic analysis. Anal. Chem. 1952, 24, 1356–1357. [Google Scholar] [CrossRef]
- Raphalalani, A. Paleoenvironmental Conditions Underpinning Kaolinitisation of Lwamondo and Zebediela Kaolin Deposits. Master’s Thesis, University of Venda, Thohoyandou, South Africa, 2017, unpublished. [Google Scholar]
- Rudnick, R.L.; Gao, S. Composition of the continental crust. Treatise Geochem. 2003, 3, 1–64. [Google Scholar]
- Nesbitt, H.W.; Markovics, G. Chemical processes affecting alkalis and alkaline earths during continental weathering. Geochim. Cosmochim. Acta 1980, 44, 1659–1666. [Google Scholar] [CrossRef]
- Wronkiewicz, D.J.; Condie, K.C. Geochemistry of Archean shales from the Witwatersrand Supergroup, South Africa: Source-area weathering and provenance. Geochim. Cosmochim. Acta 1987, 51, 2401–2416. [Google Scholar] [CrossRef]
- Vidal, P. Geochimie; Serie Geoscience 1998; Dunod: Paris, France, 1990. [Google Scholar]
- Nyakairu, G.W.A.; Koebel, C.; Kurzweil, H. The Buwambo kaolin deposit in central Uganda: Mineralogical and chemical composition. Geochem. J. 2001, 35, 245–256. [Google Scholar] [CrossRef]
- Mahjoor, A.S.; Karimi, M.; Rastegarlari, A. Mineralogical and Geochemical Characterisation of Clay Deposits from Soouth Abarkouh District of Clay Deposit (Central Iran) and their Applications. J. Appl. Sci. 2009, 9, 601–614. [Google Scholar] [CrossRef]
- Zuoping, Z.; Chuanxian, L. The behaviour of rare-earth elements (REE) during weathering of granites in Southern Guangxi, China. Chin. J. Geochem. 1995, 15, 344–352. [Google Scholar] [CrossRef]
- Garver, J.I.; Royce, P.R.; Smick, T.A. Chromium and nickel in shale of the Taconic foreland: A case study for the provenance of fine-grained sediments with an ultramafic source. J. Sediment. Res. 1996, 66, 100–106. [Google Scholar]
- Ekosse, G.E. Kaolin deposits and occurrences in Africa: Geology, mineralogy and utilization. Appl. Clay Sci. 2010, 50, 212–236. [Google Scholar] [CrossRef]
- Savin, S.M.; Epstein, S. Oxygen and hydrogen isotope geochemistry of clay minerals. Geochim. Cosmochim. Acta 1970, 4, 25–42. [Google Scholar] [CrossRef]
- Lawrence, J.R.; Taylor, H.P., Jr. Deuterium and oxygen-18 correlation: Clay minerals and hydroxides in Quaternary soils compared to meteoric waters. Geochim. Cosmochim. Acta 1971, 35, 993–1003. [Google Scholar] [CrossRef]
- Gilg, H.A.; Sheppard, S.M.F. Hydrogen isotope fractionation between kaolinite and water revised. Geochim. Cosmochim. Acta 1996, 60, 529–533. [Google Scholar] [CrossRef]
- Gálan, E.; Aparicio, P.; Fernández-Caliani, J.C.; Miras, A.; Márquez, M.G.; Fallick, A.E.; Clauer, N. New insights on mineralogy and genesis of kaolin deposits: The Burela kaolin deposit (Northwestern Spain). Appl. Clay Sci. 2016, 131, 14–26. [Google Scholar] [CrossRef]
- Dominguez, E.A.; Iglesias, C.; Dondi, M.; Murray, H. Genesis of the La Espingarda kaolin deposit in Patagonia. Appl. Clay Sci. 2010, 47, 290–302. [Google Scholar] [CrossRef]
- Buhmann, C.; Buhmann, D. Hydrogen-isotope geochemistry of diagenetic clay minerals from Cretaceous Sandstones, Alberta, Canada: Evidence for exchange. Appl. Geochem. 1990, 5, 657–668. [Google Scholar]
- Keller, W.D. Classification of kaolins exemplified by their textures in scan electron micrographs. Clays Clay Miner. 1978, 26, 1–20. [Google Scholar] [CrossRef]
- Eberl, D.D. Clay minerals formation and transformation in rocks and soils. Philos. Trans. R. Soc. Lond. 1984, 311, 241–257. [Google Scholar] [CrossRef]


| Sample | Sand (wt %) | Silt (wt %) | Clay (wt %) |
|---|---|---|---|
| LWA1 | 46 | 32 | 22 |
| LWA2 | 38 | 40 | 22 |
| LWA3 | 46 | 24 | 30 |
| LWA4 | 20 | 62 | 18 |
| LWA5 | 30 | 44 | 26 |
| LWA6 | 30 | 34 | 36 |
| LWA7 | 40 | 48 | 12 |
| LWA8 | 22 | 54 | 24 |
| LWA9 | 32 | 36 | 32 |
| ZEB1 | 24 | 32 | 44 |
| ZEB2 | 46 | 30 | 24 |
| ZEB3 | 10 | 48 | 42 |
| ZEB4 | 18 | 50 | 32 |
| ZEB5 | 34 | 36 | 30 |
| ZEB6 | 18 | 72 | 10 |
| ZEB7 | 20 | 58 | 22 |
| ZEB8 | 30 | 24 | 46 |
| ZEB9 | 40 | 28 | 32 |
| Trace Element | DL (ppm) | Trace Element | DL (ppm) |
|---|---|---|---|
| Sc | 0.022 | Pr | 0.002 |
| V | 0.018 | Nd | 0.007 |
| Cr | 0.166 | Sm | 0.010 |
| Co | 0.008 | Eu | 0.002 |
| Ni | 0.144 | Gd | 0.007 |
| Cu | 0.020 | Tb | 0.001 |
| Zn | 0.130 | Dy | 0.004 |
| Rb | 0.008 | Ho | 0.001 |
| Sr | 0.003 | Er | 0.003 |
| Y | 0.002 | Tm | 0.001 |
| Zr | 0.005 | Yb | 0.007 |
| Nb | 0.001 | Lu | 0.001 |
| Mo | 0.009 | Hf | 0.004 |
| Cs | 0.003 | Ta | 0.001 |
| Ba | 0.020 | Pb | 0.005 |
| La | 0.001 | Th | 0.002 |
| Ce | 0.002 | U | 0.002 |
| Trace Elements and Selected Ratios | LWA1 | LWA2 | LWA3 | LWA4 | LWA5 | LWA6 | LWA7 | LWA8 | LWA9 | UCC 1 |
|---|---|---|---|---|---|---|---|---|---|---|
| Sc | 37.2 | 7.6 | 10.6 | 10.6 | 6.1 | 55.0 | 4. 9 | 85.5 | 3.7 | 14.0 |
| V | 230.4 | 28.1 | 26.6 | 49.6 | 12.7 | 82.7 | 8.6 | 738.0 | 6.5 | 97.0 |
| Cr | 85.6 | 75.0 | 171.6 | 145.5 | 168.9 | 3604.0 | 64.2 | 79.6 | 76.1 | 92.0 |
| Co | 15.1 | 1.8 | 4.9 | 3.8 | 1.5 | 48.6 | 1.4 | 42.7 | 1.3 | 17.3 |
| Ni | 178.8 | 123.3 | 93.0 | 122.0 | 269.0 | 1082.5 | 94.6 | 178.6 | 94.0 | 47.0 |
| Cu | 247.0 | 24.6 | 35.4.0 | 12.4 | 11.8 | 62.1 | 7.1 | 828.0 | 6.9 | 28.0 |
| Zn | 200.6 | 55.9 | 46 | 63.1 | 37.2 | 151.7 | 26.7 | 253.0 | 29.8 | 67.0 |
| Rb | 53.7 | 41.9 | 68.7 | 61.6 | 70.5 | 1.0 | 35.9 | 33.5 | 30.3 | 84.0 |
| Sr | 37.2 | 28.3 | 18.0 | 128.7 | 48.0 | 33.2 | 49.0 | 28.5 | 20.0 | 320.0 |
| Y | 17.4 | 2.4 | 3.4 | 19.4 | 2.2 | 15.5 | 1.9 | 52.4 | 1.2 | 21.0 |
| Zr | 140.1 | 21.1 | 13.3 | 45.0 | 1.8 | 29.0 | 99.5 | 266.4 | 59.0 | 193.0 |
| Nb | 12. 5 | 13.0 | 14.2 | 18.9 | 5.1 | 7.5 | 2.4 | 16.3 | 1.7 | 12.0 |
| Mo | 0.5 | 0.4 | 0.5 | 0.4 | 0.5 | 0.6 | 1.1 | 1.6 | 0.3 | 1.1 |
| Cs | 2.4 | 0.5 | 0.7 | 1.2 | 0.8 | 0.1 | 0.4 | 5.0 | 0.2 | 4.9 |
| Ba | 562.5 | 450.0 | 484.5 | 626.0 | 404.5 | 86.6 | 157.0 | 340.5 | 85.8 | 624.0 |
| Hf | 4.3 | 0.6 | 0.4 | 1.2 | 1.2 | 0.8 | 3.4 | 7.1 | 1.5 | 5.3 |
| Ta | 0.7 | 0.2 | 0.7 | 0.5 | 0.1 | 0.1 | 0.1 | 1.0 | 0.1 | 0.9 |
| Pb | 8.3 | 23.4 | 13. 5 | 30.1 | 9.4 | 9.8 | 35.8 | 11.2 | 11.4 | 17 |
| Th | 5.4 | 1.1 | 2.8 | 1.4 | 0.1 | 0.3 | 0.3 | 8.5 | 0.4 | 10.5 |
| U | 0.8 | 0.8 | 0.6 | 1.2 | 0.4 | 0.6 | 0.3 | 2.0 | 0.5 | 2.7 |
| U/Th | 0.2 | 0.7 | 0.2 | 0.8 | 3. 5 | 2.1 | 1.0 | 0.2 | 1.1 | |
| Ni/Co | 11.9 | 67.4 | 19.2 | 32.1 | 181.8 | 22.3 | 70.1 | 4.2 | 74.0 | |
| V/Cr | 2.7 | 0.4 | 0.2 | 0.3 | 0.1 | 0.0 | 0.1 | 9.3 | 0.1 |
| Trace Elements and Selected Ratios | ZEB1 | ZEB2 | ZEB3 | ZEB4 | ZEB5 | ZEB6 | ZEB7 | ZEB8 | ZEB9 | UCC 1 |
|---|---|---|---|---|---|---|---|---|---|---|
| Sc | 20.9 | 30.6 | 83.6 | 33.3 | 62.3 | 46.4 | 30.6 | 63.7 | 41.8 | 14 |
| V | 61. 5 | 223.0 | 504.0 | 174.2 | 425.9 | 273.6 | 172.6 | 428.0 | 263.6 | 97 |
| Cr | 253.6 | 21.7 | 272.8 | 299.0 | 203.9 | 127.2 | 110.9 | 188.1 | 209.4 | 92 |
| Co | 92.3 | 16.1 | 4.5 | 6.2 | 33.8 | 43.8 | 32.4 | 22. 9 | 6.0 | 17.3 |
| Ni | 124.8 | 30.8 | 57.9 | 163.3 | 237.9 | 106.8 | 147.2 | 81.9 | 82.2 | 47 |
| Cu | 47.2 | 45.1 | 17.7 | 9.8 | 335.5 | 219.2 | 165.0 | 125.3 | 98. 5 | 28 |
| Zn | 133.4 | 51.7 | 12.9 | 13.9 | 80.2 | 26.8 | 130.8 | 57.3 | 37.0 | 67 |
| Rb | 6.8 | 115.2 | 120.1 | 10.3 | 14.6 | 13.3 | 57.3 | 37.2 | 17.8 | 84 |
| Sr | 2.9 | 23.5 | 6.6 | 1.8 | 1.7 | 2.0 | 0.9 | 2.0 | 2.2 | 320 |
| Y | 15.9 | 32.3 | 103.2 | 29. 5 | 14.5 | 14.1 | 12.2 | 13.2 | 11.3 | 21 |
| Zr | 47.4 | 172.2 | 232.9 | 257.0 | 150.2 | 63.8 | 148.4 | 217.6 | 147.6 | 193 |
| Nb | 10.5 | 10.8 | 3.3 | 9.1 | 3.08 | 11. 6 | 12.8 | 11.4 | 9.2 | 12 |
| Mo | 1.4 | 1.6 | 1.1 | 0.8 | 1.9 | 1.8 | 0.5 | 1.1 | 0.8 | 1.1 |
| Cs | 0.3 | 2.7 | 2.0 | 0.5 | 0.6 | 0.3 | 6.8 | 0.8 | 0.5 | 4.9 |
| Ba | 143.6 | 150.7 | 554.0 | 45.2 | 26.6 | 75.8 | 78.3 | 70.4 | 41.7 | 624 |
| Hf | 1.4 | 4.7 | 6.3 | 6.5 | 3.3 | 1.6 | 3.8 | 5.7 | 3.8 | 5.3 |
| Ta | 0.6 | 0.6 | 0.1 | 0.2 | 0.11 | 0.1 | 0.1 | 0.5 | 0.3 | 0.9 |
| Pb | 4.7 | 10.1 | 1.5 | 2.2 | 2.6 | 2.7 | 1.9 | 1.7 | 1.4 | 17 |
| Th | 7.6 | 18.7 | 3.5 | 4.8 | 1.5 | 0.8 | 0.5 | 1.6 | 0.9 | 10.5 |
| U | 1.3 | 2.4 | 9.0 | 5. 7 | 9.0 | 8.8 | 0.9 | 4.3 | 0.4 | 2.7 |
| U/Th | 0.2 | 0.1 | 2.6 | 1.18 | 6.0 | 11.5 | 1.8 | 2.8 | 0. 5 | |
| Ni/Co | 1.4 | 1.9 | 12.9 | 26.21 | 7.0 | 2.4 | 4.5 | 3.6 | 13.8 | |
| V/Cr | 0.2 | 10.3 | 1.9 | 0.58 | 2.1 | 2.2 | 1. 6 | 2.3 | 1.3 |
| Rare Earth Elements | LWA1 | LWA2 | LWA3 | LWA4 | LWA5 | LWA6 | LWA7 | LWA8 | LWA9 | UCC 1 |
|---|---|---|---|---|---|---|---|---|---|---|
| La | 10.1 | 3.4 | 6.6 | 38.6 | 2.7 | 12.4 | 12.9 | 30.8 | 2.5 | 31 |
| Ce | 16.9 | 4.4 | 19.1 | 14.3 | 3.8 | 1.5 | 15.5 | 30.3 | 8.8 | 63 |
| Pr | 2.6 | 0.8 | 1.5 | 10.6 | 0.5 | 3.5 | 1.5 | 8.4 | 0.4 | 7.1 |
| Nd | 10.8 | 3.1 | 6.4 | 42.4 | 1.7 | 13.7 | 4.5 | 36.4 | 1.2 | 27 |
| Sm | 2.7 | 0.8 | 1.5 | 10.2 | 0.3 | 3.7 | 0.8 | 9.4 | 0.2 | 4.7 |
| Eu | 0.9 | 0.3 | 0.5 | 2.7 | 0.1 | 1.0 | 0.6 | 2.4 | 0.2 | 1 |
| Gd | 2.7 | 0.6 | 0.8 | 6.6 | 0.5 | 3.2 | 0.5 | 8.6 | 0.2 | 4 |
| Tb | 0.5 | 0.1 | 0.1 | 0.8 | 0.1 | 0.5 | 0.1 | 1.5 | 0.1 | 0.7 |
| Dy | 3.7 | 0.5 | 0.6 | 4.3 | 0.5 | 3.5 | 0.4 | 10.4 | 0.2 | 3.9 |
| Ho | 0.8 | 0.1 | 0.2 | 0.7 | 0.2 | 0.6 | 0.1 | 2.2 | 0.1 | 83 |
| Er | 2.5 | 0.3 | 0.4 | 1.8 | 0.3 | 1.8 | 0.3 | 6.6 | 0.2 | 2.3 |
| Tm | 0.4 | 0 | 0.1 | 0.2 | 0.1 | 0.3 | 0.1 | 1.0 | 0.1 | 0.3 |
| Yb | 2.5 | 0.3 | 0.4 | 1.2 | 0.3 | 1.7 | 0.3 | 7.1 | 0.2 | 2 |
| Lu | 0.4 | 0.1 | 0.1 | 0.2 | 0.1 | 0.2 | 0.1 | 1.0 | 0 | 0.3 |
| ΣLREE | 46.7 | 13.4 | 36.4 | 125.4 | 9.6 | 39 | 36.3 | 126.3 | 13.5 | 137.8 |
| ΣHREE | 10.8 | 1.4 | 1.8 | 9.2 | 1.6 | 8.6 | 1.4 | 29.8 | 0.9 | 92.5 |
| ΣREE | 57.5 | 14.8 | 38.3 | 134.6 | 11.2 | 47.6 | 37.8 | 156.1 | 14.4 | 230.3 |
| Rare Earth Elements | ZEB1 | ZEB2 | ZEB3 | ZEB4 | ZEB5 | ZEB6 | ZEB7 | ZEB8 | ZEB9 | UCC 1 |
|---|---|---|---|---|---|---|---|---|---|---|
| La | 33.1 | 51.0 | 4.4 | 9.6 | 2.2 | 2.6 | 3.5 | 2 | 2.5 | 31 |
| Ce | 41.1 | 129 | 18.6 | 64.3 | 12.5 | 21 | 25.4 | 7.4 | 2 | 63 |
| Pr | 7.9 | 10.1 | 2.7 | 5.6 | 0.8 | 1 | 1.2 | 0.7 | 0.8 | 7.1 |
| Nd | 31.1 | 36.6 | 13.6 | 24.9 | 3.9 | 5.9 | 5.8 | 2.8 | 3.8 | 27 |
| Sm | 6.4 | 6.9 | 7 | 6.1 | 1.3 | 2.0 | 2.1 | 1.1 | 1 | 4.7 |
| Eu | 1.4 | 1.5 | 1.7 | 1.3 | 0.6 | 0.5 | 0.6 | 0.4 | 0.5 | 1 |
| Gd | 4.8 | 6.2 | 16 | 5.2 | 2.1 | 2.5 | 1.7 | 1.4 | 1.4 | 4 |
| Tb | 0.7 | 1 | 2.8 | 0.8 | 0.4 | 0.4 | 0.3 | 0.3 | 0.3 | 0.7 |
| Dy | 3.9 | 6.1 | 17 | 5.1 | 2.7 | 2.9 | 2.4 | 2.5 | 1.9 | 3.9 |
| Ho | 0.6 | 1.2 | 3.3 | 1 | 0.6 | 0.5 | 0.5 | 0.6 | 0.4 | 0.8 |
| Er | 1.7 | 3.9 | 8 | 3 | 2 | 1.3 | 1.3 | 1.7 | 1.3 | 2.3 |
| Tm | 0.2 | 0.5 | 1.2 | 0.5 | 0.3 | 0.2 | 0.3 | 0.3 | 0.2 | 0.3 |
| Yb | 1.3 | 3.5 | 6.4 | 3.5 | 2.8 | 1.2 | 1.8 | 2.5 | 1.8 | 2 |
| Lu | 0.2 | 0.6 | 0.9 | 0.5 | 0.4 | 0.2 | 0.4 | 0.4 | 0.3 | 0.3 |
| ΣLREE | 125.8 | 241.3 | 64 | 117 | 23.4 | 35.5 | 40.3 | 15.8 | 12 | 137.8 |
| ΣHREE | 8.6 | 16.8 | 39.6 | 14.4 | 9.2 | 6.7 | 7 | 8.3 | 6.2 | 10.3 |
| ΣREE | 134.4 | 258.1 | 103.6 | 131.4 | 32.6 | 42.2 | 47.3 | 24.1 | 18.2 | 148.1 |
| Sample | δ18O (‰) | δD (‰) | H2O (%) |
|---|---|---|---|
| LWA1 | 17.4 | −84 | 8.48 |
| LWA2 | 19.2 | −58 | 12.05 |
| LWA9 | 19.1 | −54 | 11.37 |
| Mean | 18.6 | −65 | 10.63 |
| ZEB2 | 16.7 | −68 | 10.16 |
| ZEB4 | 17.7 | −61 | 11.67 |
| ZEB8 | 15.6 | −63 | 10.74 |
| Mean | 16.7 | −64 | 10.86 |
| Samples | δ18O (‰) | Δd (‰) | T (°C) |
|---|---|---|---|
| LWA1 | 17.4 | −84 | 21.8 |
| LWA2 | 19.2 | −58 | 28.1 |
| LWA9 | 19.1 | −54 | 30.9 |
| MEAN | 18.6 | −65 | 26.9 ± 3.6 |
| ZEB2 | 16.7 | −68 | 33.9 |
| ZEB4 | 17.7 | −61 | 33.3 |
| ZEB8 | 15.6 | −63 | 42.5 |
| MEAN | 16.7 | −64 | 36.6 ± 4.2 |
| Samples | δ18OK (‰) | δDK (‰) | T (°K) | δ18OW (‰) | δDW (‰) | αK-W18O | αK-W D |
|---|---|---|---|---|---|---|---|
| Lwamondo | 18.6 | −65 | 300.1 | −5.3 | −33.2 | 1.024 | 0.97 |
| Zebediela | 16.7 | −64 | 309.7 | −5.4 | −33.4 | 1.022 | 0.97 |
© 2019 by the authors. Licensee MDPI, Basel, Switzerland. This article is an open access article distributed under the terms and conditions of the Creative Commons Attribution (CC BY) license (http://creativecommons.org/licenses/by/4.0/).
Share and Cite
Raphalalani, A.; Ekosse, G.-I.; Odiyo, J.; Ogola, J.; Bukalo, N. Trace Element and Stable Isotope Geochemistry of Lwamondo and Zebediela Kaolins, Limpopo Province, South Africa: Implication for Paleoenvironmental Reconstruction. Minerals 2019, 9, 93. https://doi.org/10.3390/min9020093
Raphalalani A, Ekosse G-I, Odiyo J, Ogola J, Bukalo N. Trace Element and Stable Isotope Geochemistry of Lwamondo and Zebediela Kaolins, Limpopo Province, South Africa: Implication for Paleoenvironmental Reconstruction. Minerals. 2019; 9(2):93. https://doi.org/10.3390/min9020093
Chicago/Turabian StyleRaphalalani, Avhatakali, Georges-Ivo Ekosse, John Odiyo, Jason Ogola, and Nenita Bukalo. 2019. "Trace Element and Stable Isotope Geochemistry of Lwamondo and Zebediela Kaolins, Limpopo Province, South Africa: Implication for Paleoenvironmental Reconstruction" Minerals 9, no. 2: 93. https://doi.org/10.3390/min9020093
APA StyleRaphalalani, A., Ekosse, G.-I., Odiyo, J., Ogola, J., & Bukalo, N. (2019). Trace Element and Stable Isotope Geochemistry of Lwamondo and Zebediela Kaolins, Limpopo Province, South Africa: Implication for Paleoenvironmental Reconstruction. Minerals, 9(2), 93. https://doi.org/10.3390/min9020093