Article

Gem-Quality Zircon Megacrysts from Placer Deposits in the Central Highlands, Vietnam—Potential Source and Links to Cenozoic Alkali Basalts

1
Graduate School of Integrated Sciences for Global Society, Kyushu University, 744 Motooka, Nishi-ku, Fukuoka 819-0395, Japan
2
Division of Earth Sciences, Faculty of Social and Cultural Studies, Kyushu University, 744 Motooka, Nishi-ku, Fukuoka 819-0395, Japan
3
Institut für Mineralogie und Kristallographie, Universität Wien, 1090 Wien, Austria
4
Australian Research Council (ARC) Centre of Excellence for Core to Crust Fluid Systems (CCFS) and National Key Centre for Geochemical Evolution and Metallogeny of Continents (GEMOC), Department of Earth and Planetary Sciences, Macquarie University, Sydney, NSW 2109, Australia
*
Author to whom correspondence should be addressed.
Minerals 2019, 9(2), 89; https://doi.org/10.3390/min9020089
Submission received: 30 December 2018 / Revised: 28 January 2019 / Accepted: 29 January 2019 / Published: 1 February 2019
(This article belongs to the Special Issue Mineralogy and Geochemistry of Gems)

Abstract

:
Gem-quality zircon megacrysts occur in placer deposits in the Central Highlands, Vietnam, and have euhedral to anhedral crystal shapes with dimensions of ~3 cm in length. These zircons have primary inclusions of calcite, olivine, and corundum. Secondary quartz, baddeleyite, hematite, and CO2 fluid inclusions were found in close proximity to cracks and tubular channels. LA-ICP-MS U-Pb ages of analyzed zircon samples yielded two age populations of ca. 1.0 Ma and ca. 6.5 Ma, that were consistent with the ages of alkali basalt eruptions in the Central Highlands at Buon Ma Thuot (5.80–1.67 Ma), Pleiku (4.30–0.80 Ma), and Xuan Loc (0.83–0.44 Ma). The zircon geochemical signatures and primary inclusions suggested a genesis from carbonatite-dominant melts as a result of partial melting of a metasomatized lithospheric mantle source, but not from the host alkali basalt. Chondrite-normalized rare earth element patterns showed a pronounced positive Ce, but negligible Eu anomalies. Detailed hyperspectral Dy3+ photoluminescence images of zircon megacrysts revealed resorption and re-growth processes.

1. Introduction

Zircon (ZrSiO4, tetragonal, I41/amd) is an accessory mineral in most types of igneous and metamorphic rocks [1]. Zircon megacrysts are often found in placer deposits derived from intraplate basaltic fields as xenocrysts or xenolith debris in alkali basaltic rocks [2]. Alkali basalt fields in South-East Asia commonly contain mantle xenoliths that include garnet lherzolites, spinel lherzolites, and harzburgite, as well as mantle- and/or crust-derived megacrysts of pyroxene, olivine, plagioclase, garnet, zircon, and corundum [3]. Therefore, zircon placers that are related to basaltic magmatism are often associated with megacrysts of other important gem materials (e.g., sapphire, garnet, and spinel), as reported from various localities, including Australia, Vietnam, Cambodia, Thailand, China, Myanmar, Sri Lanka, and Tanzania [4,5,6,7,8,9,10,11]. Zircon material from the Central Highlands, Vietnam, shows brownish-red colors and blue, upon heat-treatment under reducing conditions [12]. This color effect is similar to zircon found in placers in the Ratanakiri district, Cambodia [13]. The Vietnamese zircon deposits are known since the late 1980s, and sporadic mining activities are conducted by local people at numerous small sites. These deposits are exploited by digging to a depth of approximately 1–2 m, then picking the gems by hand after washing the alluvial material. The exploration of placer deposits of gem-quality zircons and other gem megacrysts is of high economic importance in many South-East Asian countries that supply the global gem market [14]. The source characteristics and forming processes of placer zircon play an important role for further exploration of this kind of gem deposits in geologically related regions.
The genesis of zircon megacrysts associated with alkali basalt has been addressed previously, but it is still vigorously debated [2,15,16,17,18]. Some authors agree that large zircon and corundum crystals represent xenocrysts that are transported by alkaline-basalt magmas and do not crystallize primarily from them (e.g., Hinton and Upton [2]), while others consider crystallization directly from basaltic magma [19,20]. Various hypotheses have been reported for the origin of zircon megacrysts from various sites in different geological contexts: (1) crystallization from melts derived from a metasomatized upper mantle, as supported by O-isotope studies [15,17,18,21]; (2) formation within a late-stage fractional crystallization process of oceanic island basalt magma [16,19]; and (3) crystallization from a primitive alkaline mafic magma, which later evolved to a less alkaline host magma [20]. According to Cong et al. [10], zircon megacrysts from Cenozoic basalts in northeastern Cambodia crystallized in the mantle during metasomatic events caused by phosphate-rich fluids and/or silicate melts enriched in zirconium. Piilonen et al. [22] recently reported findings of megacrystic zircons as single crystals enclosed in the alkali basalt from Ratanakiri, Cambodia, and suggested a single stage growth in a carbonate-influenced environment.
In the Central Highlands of Vietnam, gem quality zircon is commonly accompanied by corundum (sapphire) in alluvial deposits that are considered eroded from Cenozoic alkali basalt fields in close proximity (e.g., Garnier et al. [17]). In this study, zircon megacrysts from various alluvial deposits in the Central Highlands were systematically studied to investigate their origin and potential links to Cenozoic basalt eruptions. In addition to trace element data and U-Pb geochronological data, photoluminescence (PL) imaging methods were applied to reveal internal growth and potential secondary alteration textures. In this paper, we used mineral abbreviations as given by Whitney and Evans [23].

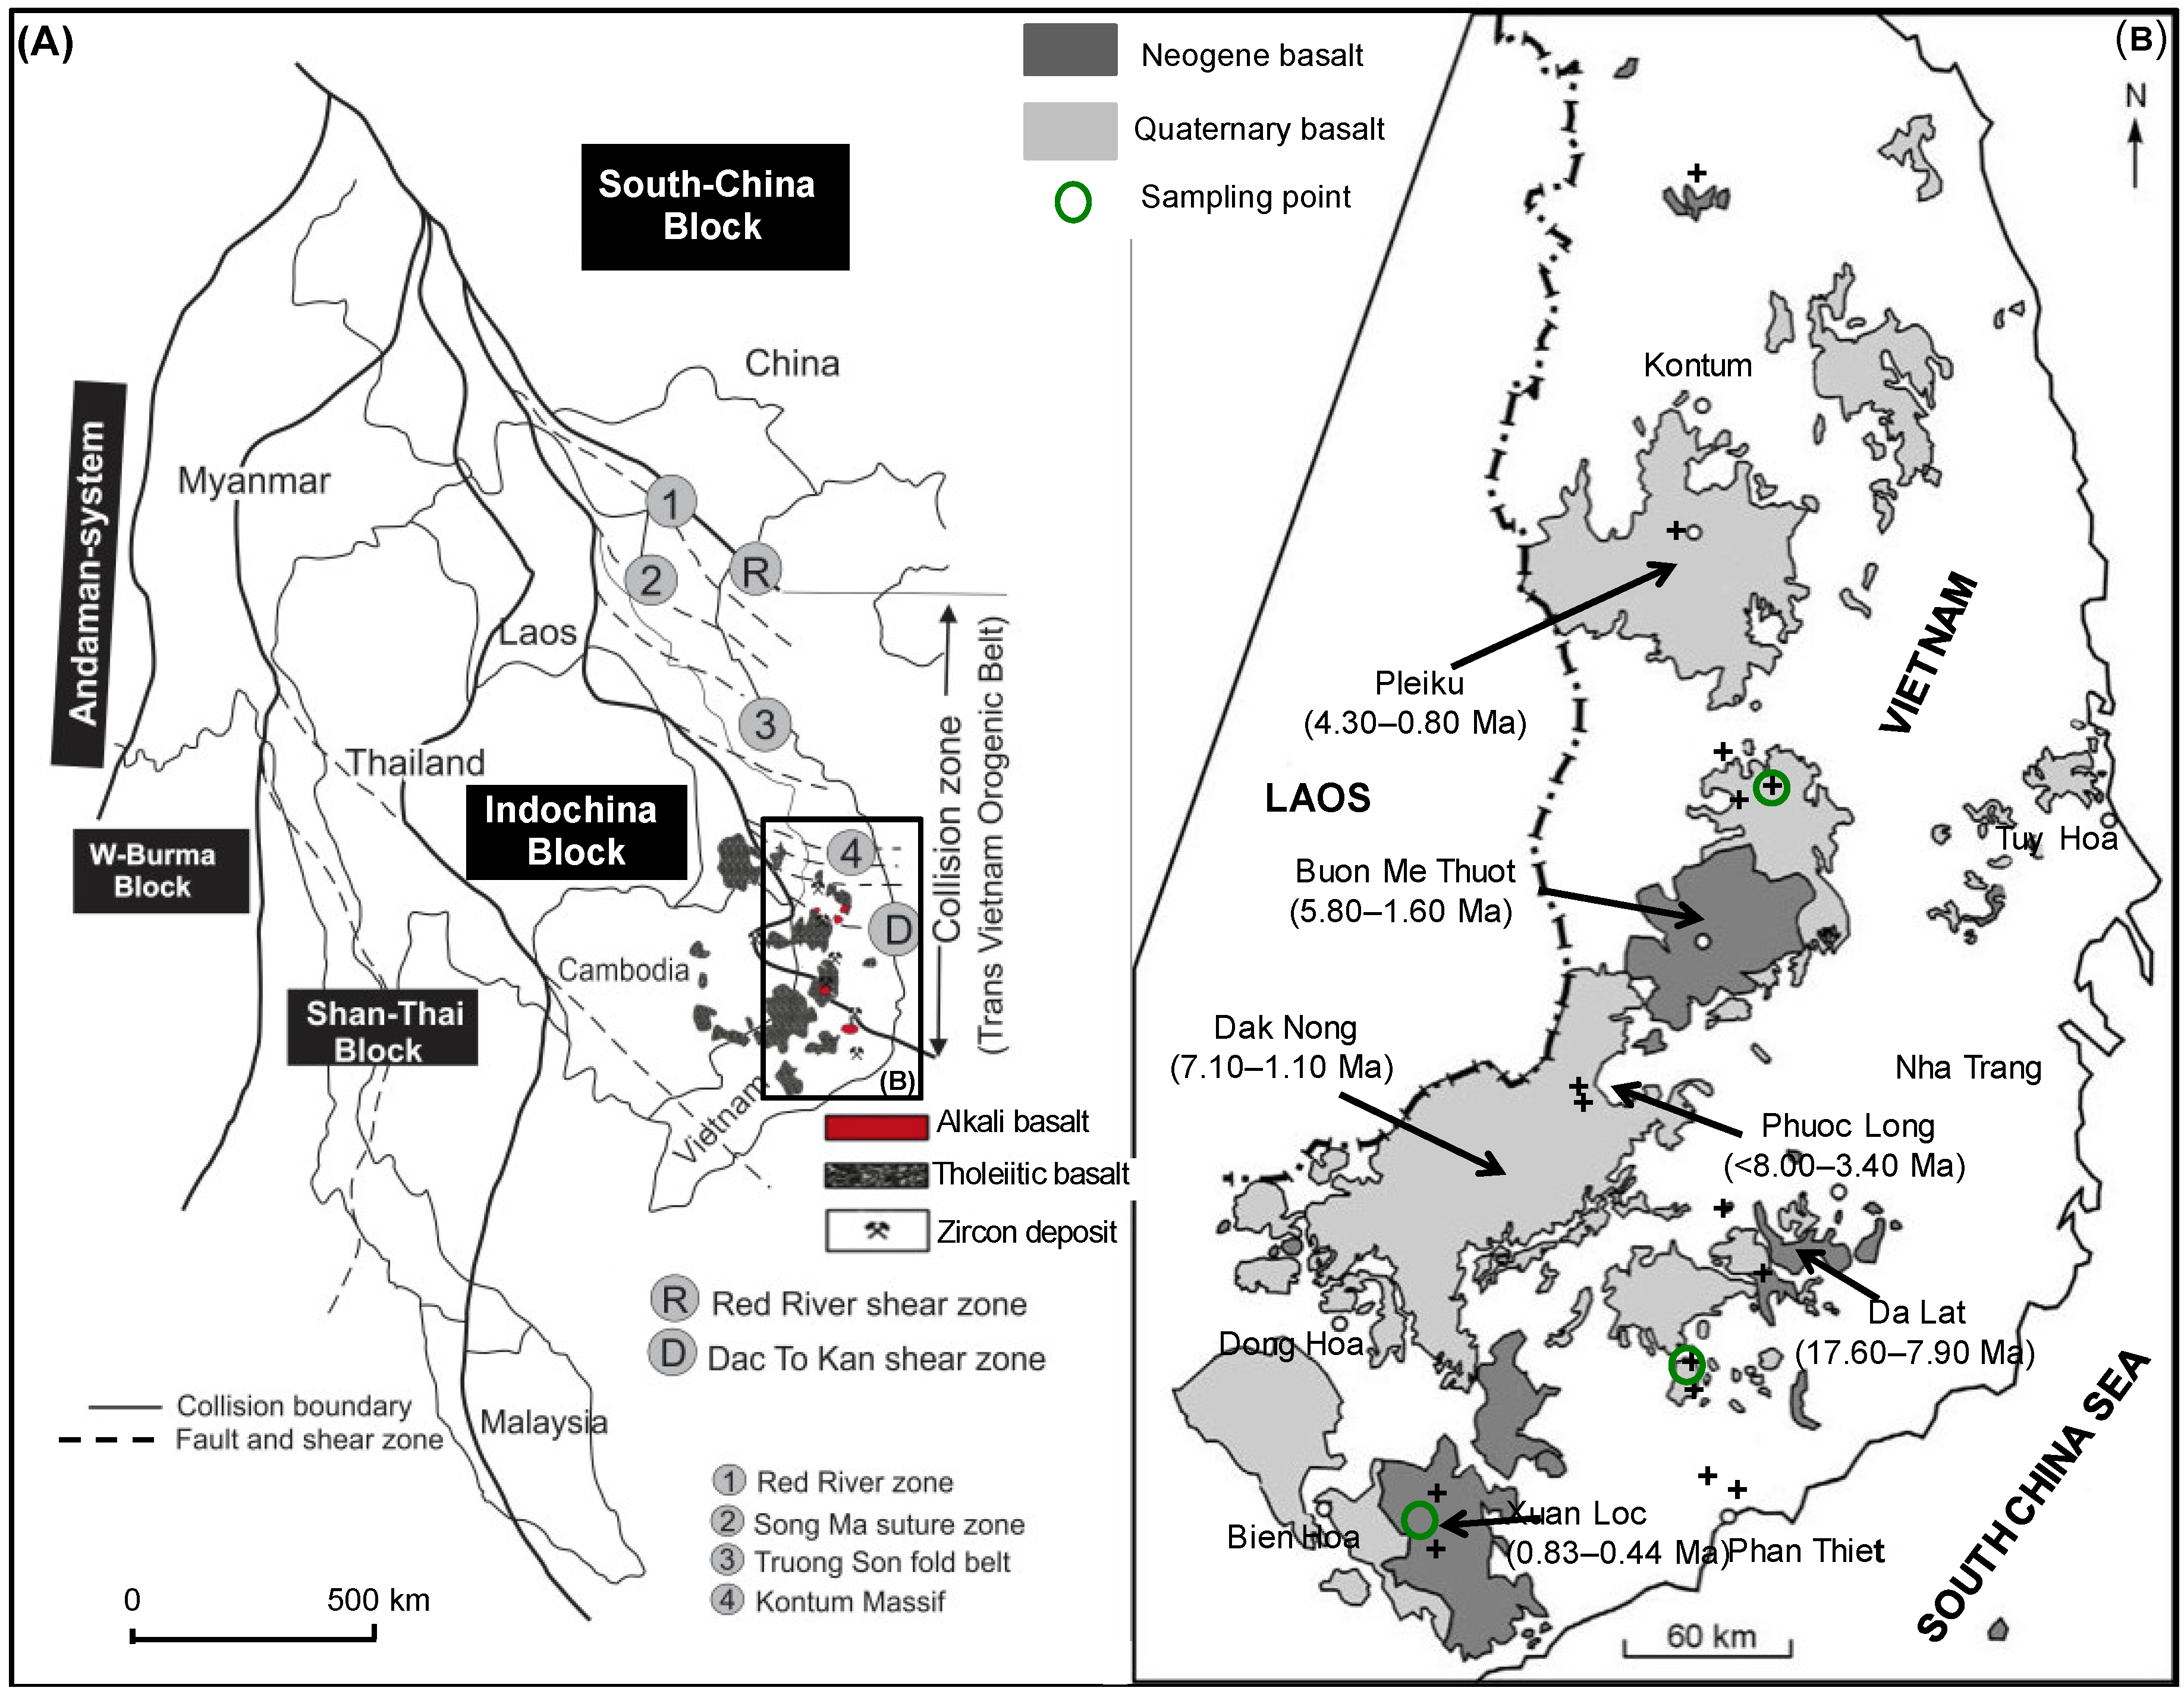
2. Geological Setting

South-East Asia was formed by an amalgamation of several crustal blocks, including South China, Indochina, Siumasu, Inthanon, the West Burma block, and the Trans Vietnam Orogenic Belt (TVOB) (Figure 1A) [24]. The TVOB was first proposed by Osanai et al. [24] as a zone of Permo-Triassic metamorphic rocks in Vietnam, which were formed by continent-continent collision between South China and Indochina blocks. This orogenic belt is characterized by numerous shear zones with strong deformation, such as the Red River shear zone, Song Ma suture zone, Tam Ky-Phuoc Son shear zone, and the Dak To Kan shear zone (Kontum Massif). The northern extension of these shear zones reaches the Yuan Nan Province through Ailaoshan in China. The Central Highlands lies entirely within the Indochina block and are located in the southern part of the TVOB, partly extending into eastern Vietnam and Laos (e.g., Hutchison [25]) (Figure 1A).
Miocene-Pliocene alkaline and subalkaline basalts are exposed over a vast region of Thailand, Laos, and Vietnam [26]. In southern and central Vietnam, this province stretches across an area of approximately 23,000 km² with a thickness up to several hundred meters [3] (Figure 1A). The basalt plateau is accompanied by pull-apart structures composed of short extensional rifts bounded by strike-slip faults [27]. At least two eruptive episodes (“early” and “late”) have been reported by Hoang et al. [28]. Tholeiitic, and rarely, alkali basaltic flows represent the “early” episode at Dalat (17.60–7.90 Ma), whereas in the “late” episodes, olivine tholeiite, alkali basalt, basanite, and (rarely) nephelinite erupted at Phuoc Long (<8.00–3.40 Ma), Buon Ma Thuot (5.80–1.67 Ma), Pleiku (4.30–0.80 Ma), Xuan Loc (0.83–0.44 Ma), and the Re Island centers (0.80–0 Ma) [27] (Figure 1B). Hoang et al. [28] proposed that tholeiitic basalts are the most common basalt type in the region and build up much more volumetric mass in comparison to the alkali basalts and the rarely occurring nephelinites which erupted from small volcanoes.
Erosion of these Cenozoic (Neogene-Quaternary) basalts formed placer deposits that represent a major source of gem-quality corundum, zircon, olivine, garnet, pyroxene, and plagioclase [4,14,26]. In South-Central Vietnam, gem-quality zircons have been found in alluvial deposits from six provinces, including Kontum, Gia Lai, Dak Lak, Dak Nong, Lam Dong, and Binh Thuan [12] (Figure 1A,B).

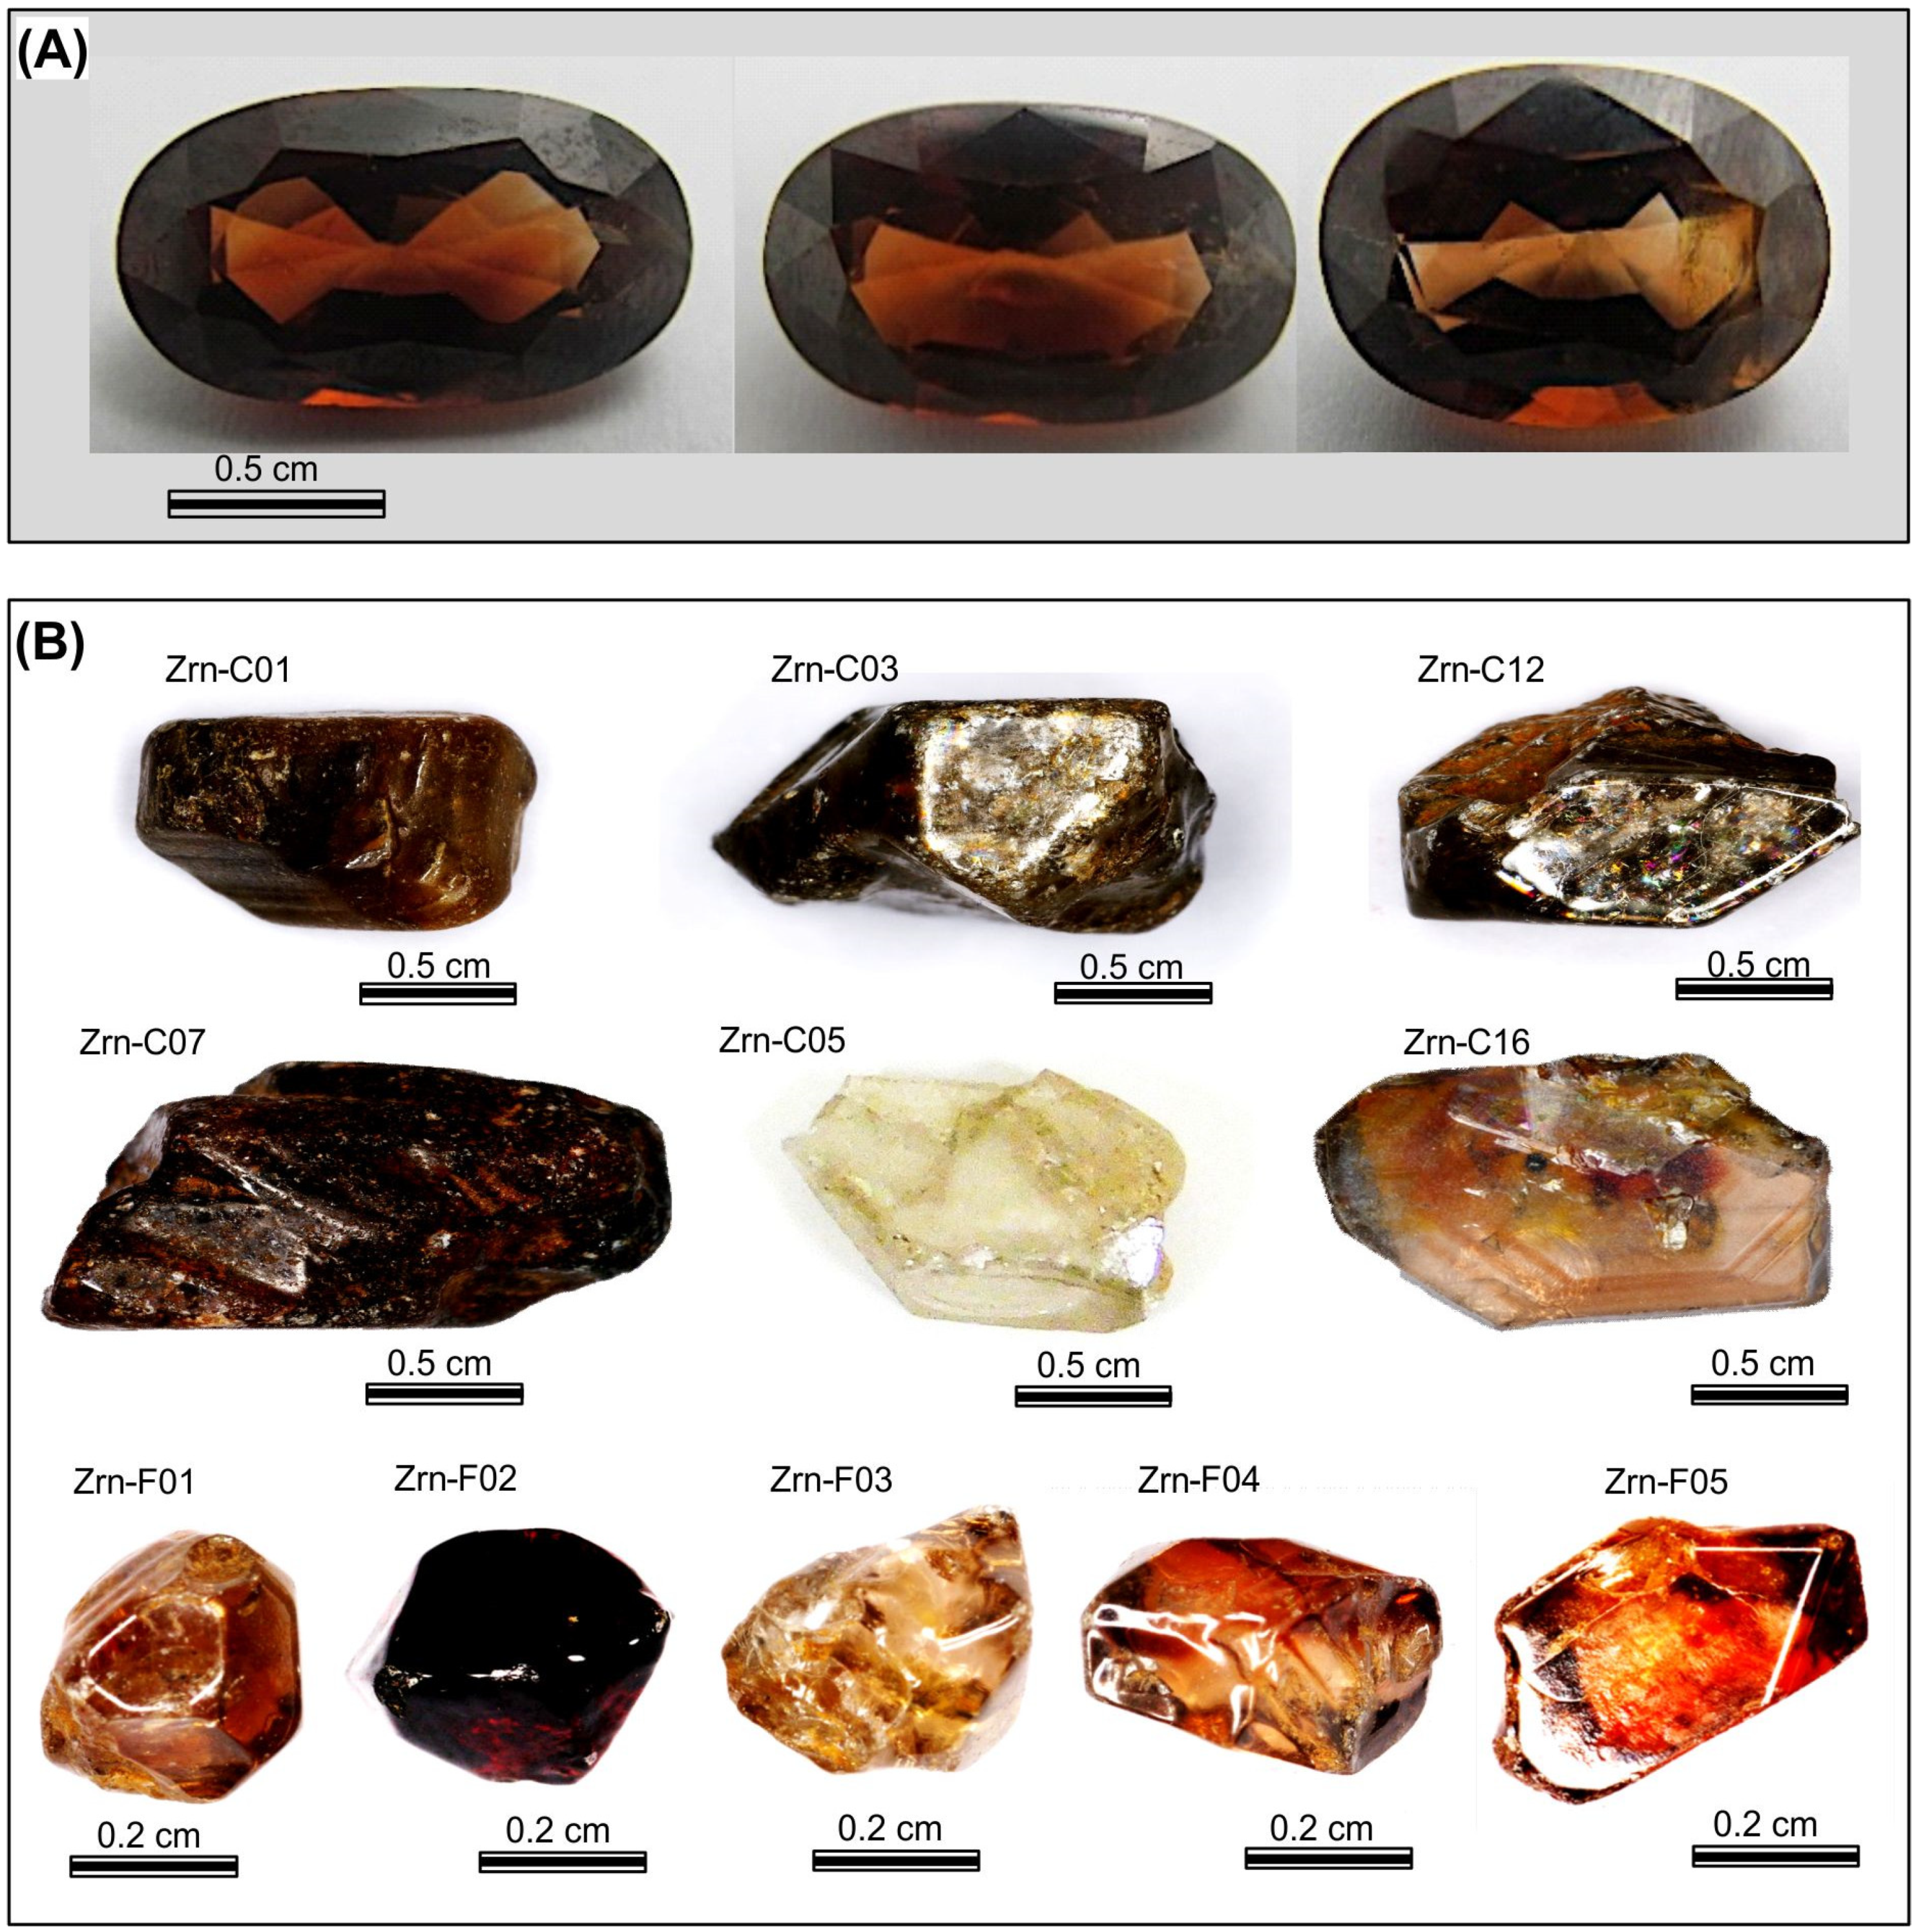
3. Sample Description and Methods

In this study, representative samples of zircon megacrysts collected from several alluvial deposits in the Central Highlands, Vietnam, were investigated in more detail. A representative zircon sample (Rata) from the Ratanakiri district, Cambodia was included for comparison. Large, gem-quality zircon specimens have dimensions up to several centimeters (Figure 2). Their color varies from colorless, orange, brownish-orange to dark brown and dark red (Figure 2). Some crystals have anhedral to subhedral shapes with rounded termination, while most grains are euhedral crystals with a typical combination of bipyramid and tetragonal prism (Figure 2B). Occasionally, internal colored zones that comprise an oscillatory change of orange and brown bands are visible to the naked eye (Figure 2B, sample C16).
Selected samples were cut along their long axis for petrographic analyses. Inclusions in zircon samples were observed and identified using an optical microscope attached to a confocal laser Raman spectrometer system (JASCO NSR-3100, JASCO (USA)) at Kyushu University. A 100× objective (with a numerical aperture NA = 0.90) and a green, continuous 532 nm frequency-doubled YAG:Nd laser (with an energy output of approx. 10 mW at the sample surface) was used to perform the Raman spot analyses. Note that potential bias of Raman spectra from the photoluminescence (PL) of Er3+ in zircon has been reported when using this laser wavelength [29]. A very minor PL contribution of Er3+ was identified in most recorded Raman spectra, but did not hamper the identification of typical Raman bands as obtained from various inclusion phases. Inclusions that were accessible via the polished sample surface were further identified qualitatively using a JEOL JSM-5310S-JED2140 scanning electron microprobe (SEM, JEOL, Ltd., Tokyo, Japan) equipped with an energy-dispersive X-Ray (EDX) detector (Li- doped Si semiconductor) at Kyushu University.
The internal texture of the prepared zircon crystals was investigated using a back-scattered electron (BSE) detector system and a GATAN MiniCL panchromatic cathodoluminescence (CL) detector attached to the above-mentioned SEM system at Kyushu University. In addition, we applied laser-induced photoluminescence spectroscopy using a HORIBA LabRam HR800 Evolution spectrometer equipped with a Peltier-cooled Si detector and a grating of 600 lines per millimeter (Horiba, Ltd., Kyoto, Japan). Confocal PL spot measurements were performed using an Olympus BX80 microscope (manufactured by Olympus Corporation, Tokyo, Japan) with a solid-state continuous laser, operating at 473 nm, to excite the most prominent REE3+ photoluminescence emissions in zircon (e.g., Dy3+; Lenz et al. [29]). Hyperspectral images of polished, large zircon single-crystals were produced by measuring a multitude of spots in a point-by-point raster with a step-width of 10–20 µm using a software-controlled Maerzhauser mechanical x-y table. A software-based, automated data treatment procedure for each single spectrum was applied, and the plotted spectral parameters of interest were color-coded. With respect to the large size of investigated zircon crystals, and the comparatively large mapping step-widths, we used a 50× objective (NA = 0.5) and a confocal hole of 200 µm to adjust the lateral spatial resolution to be approximately 8–10 µm. However, we note that a diffraction-limited maximum spatial resolution of ~1 µm (planar) and 2–3 µm in depth may be achieved using the combination of a small confocal hole and a 100× objective.
Zircon U-Pb dating of samples C05, C07, and C16 was carried out by applying laser-ablation inductively coupled plasma mass-spectrometry (LA-ICP-MS) using an Agilent 7500cx quadrupole ICP-MS with a New Wave Research UP-213 YAG:Nd laser at the Kyushu University, that produced a laser-ablation spot of 100 µm. Details of the analytical procedure are presented by Adachi et al. [30]. The zircon standards Temora (417 Ma; [31]) and FC-1 (1099 Ma; [32]) were used for calibration and accuracy checks, respectively. The NIST SRM-611 glass standard was applied to determine the Th/U ratios. Raw data were treated using GLITTER software (Version 4.4.2, Glitter sold through Access Macquarie Ltd., Sydney, Australia) [33] and plotted in concordia diagrams using the Isoplot/Ex 3.7 software (Berkeley Geochronology Center, Berkeley, CA, USA) [34]. Trace element concentrations were obtained from similar zones in close proximity to spots used for U-Pb dating. Details of the analytical procedure are given in Nakano et al. [35] using the theoretical Si concentration in zircon as an internal standard.
Dating of zircon samples DL1, DL2, and DL3 was carried out using an Agilent 7700 quadrupole ICP-MS instrument attached to a Photon Machines Excimer 193 nm laser system at GEMOC, Macquarie University, using a beam diameter of ca. 50 µm with a 5 Hz repetition rate, and energy of around 0.06 J/cm2 to 8 J/cm2. Ablation was carried out in He gas to improve the sample transport efficiency, and to provide stable signals with reproducible Pb/U fractionation. Sample analyses were run along with analyses of the GEMOC GJ-1 zircon standard [36]. This standard is slightly discordant, and has a TIMS 207Pb/206Pb age of 608.5 Ma [37]. The other well-characterized zircon standard 91500 and Mud Tank were analysed within the run as an independent control on reproducibility and instrument stability. Individual time-resolved data analysis provides isotopically homogeneous segments of the signal to be selected for integration. We corrected the integrated ratios for ablation related fractionation and instrumental mass bias by the calibration of each selected time segment against the identical time segments for the standard zircon analyses. Furthermore, we employed the common-Pb correction procedure described by Andersen [38]. The analyses presented here were corrected assuming recent lead-loss with a common-lead composition corresponding to the present-day average orogenic lead, as given by the second-stage growth curve of Stacey and Kramers [39] for 238U/204Pb = 9.74. No correction was applied to the analyses that were concordant within a 2σ analytical error in 206Pb/238U and 207Pb/235U, or which had less than 0.2% common lead. Trace element concentrations of samples DL1, DL2, and DL3 were obtained using the same LA-ICP-MS system. Calibration of the relative element sensitivities were done using the NIST-610 standard glass as external calibration. Zircon BCR-2g and GJ-1 reference material were analyzed along the measurement runs as an independent control on reproducibility and instrument stability. Theoretical Zr content of the zircon was used for internal calibration of unknown zircon samples. The precision and accuracy of the NIST-610 analyses were 1–2% for REE, Y, Nb, Hf, Ta, Th, and U at the ppm concentration level, and at 5–10% for Ti (further details see in Belousova et al. [16]).

4. Results

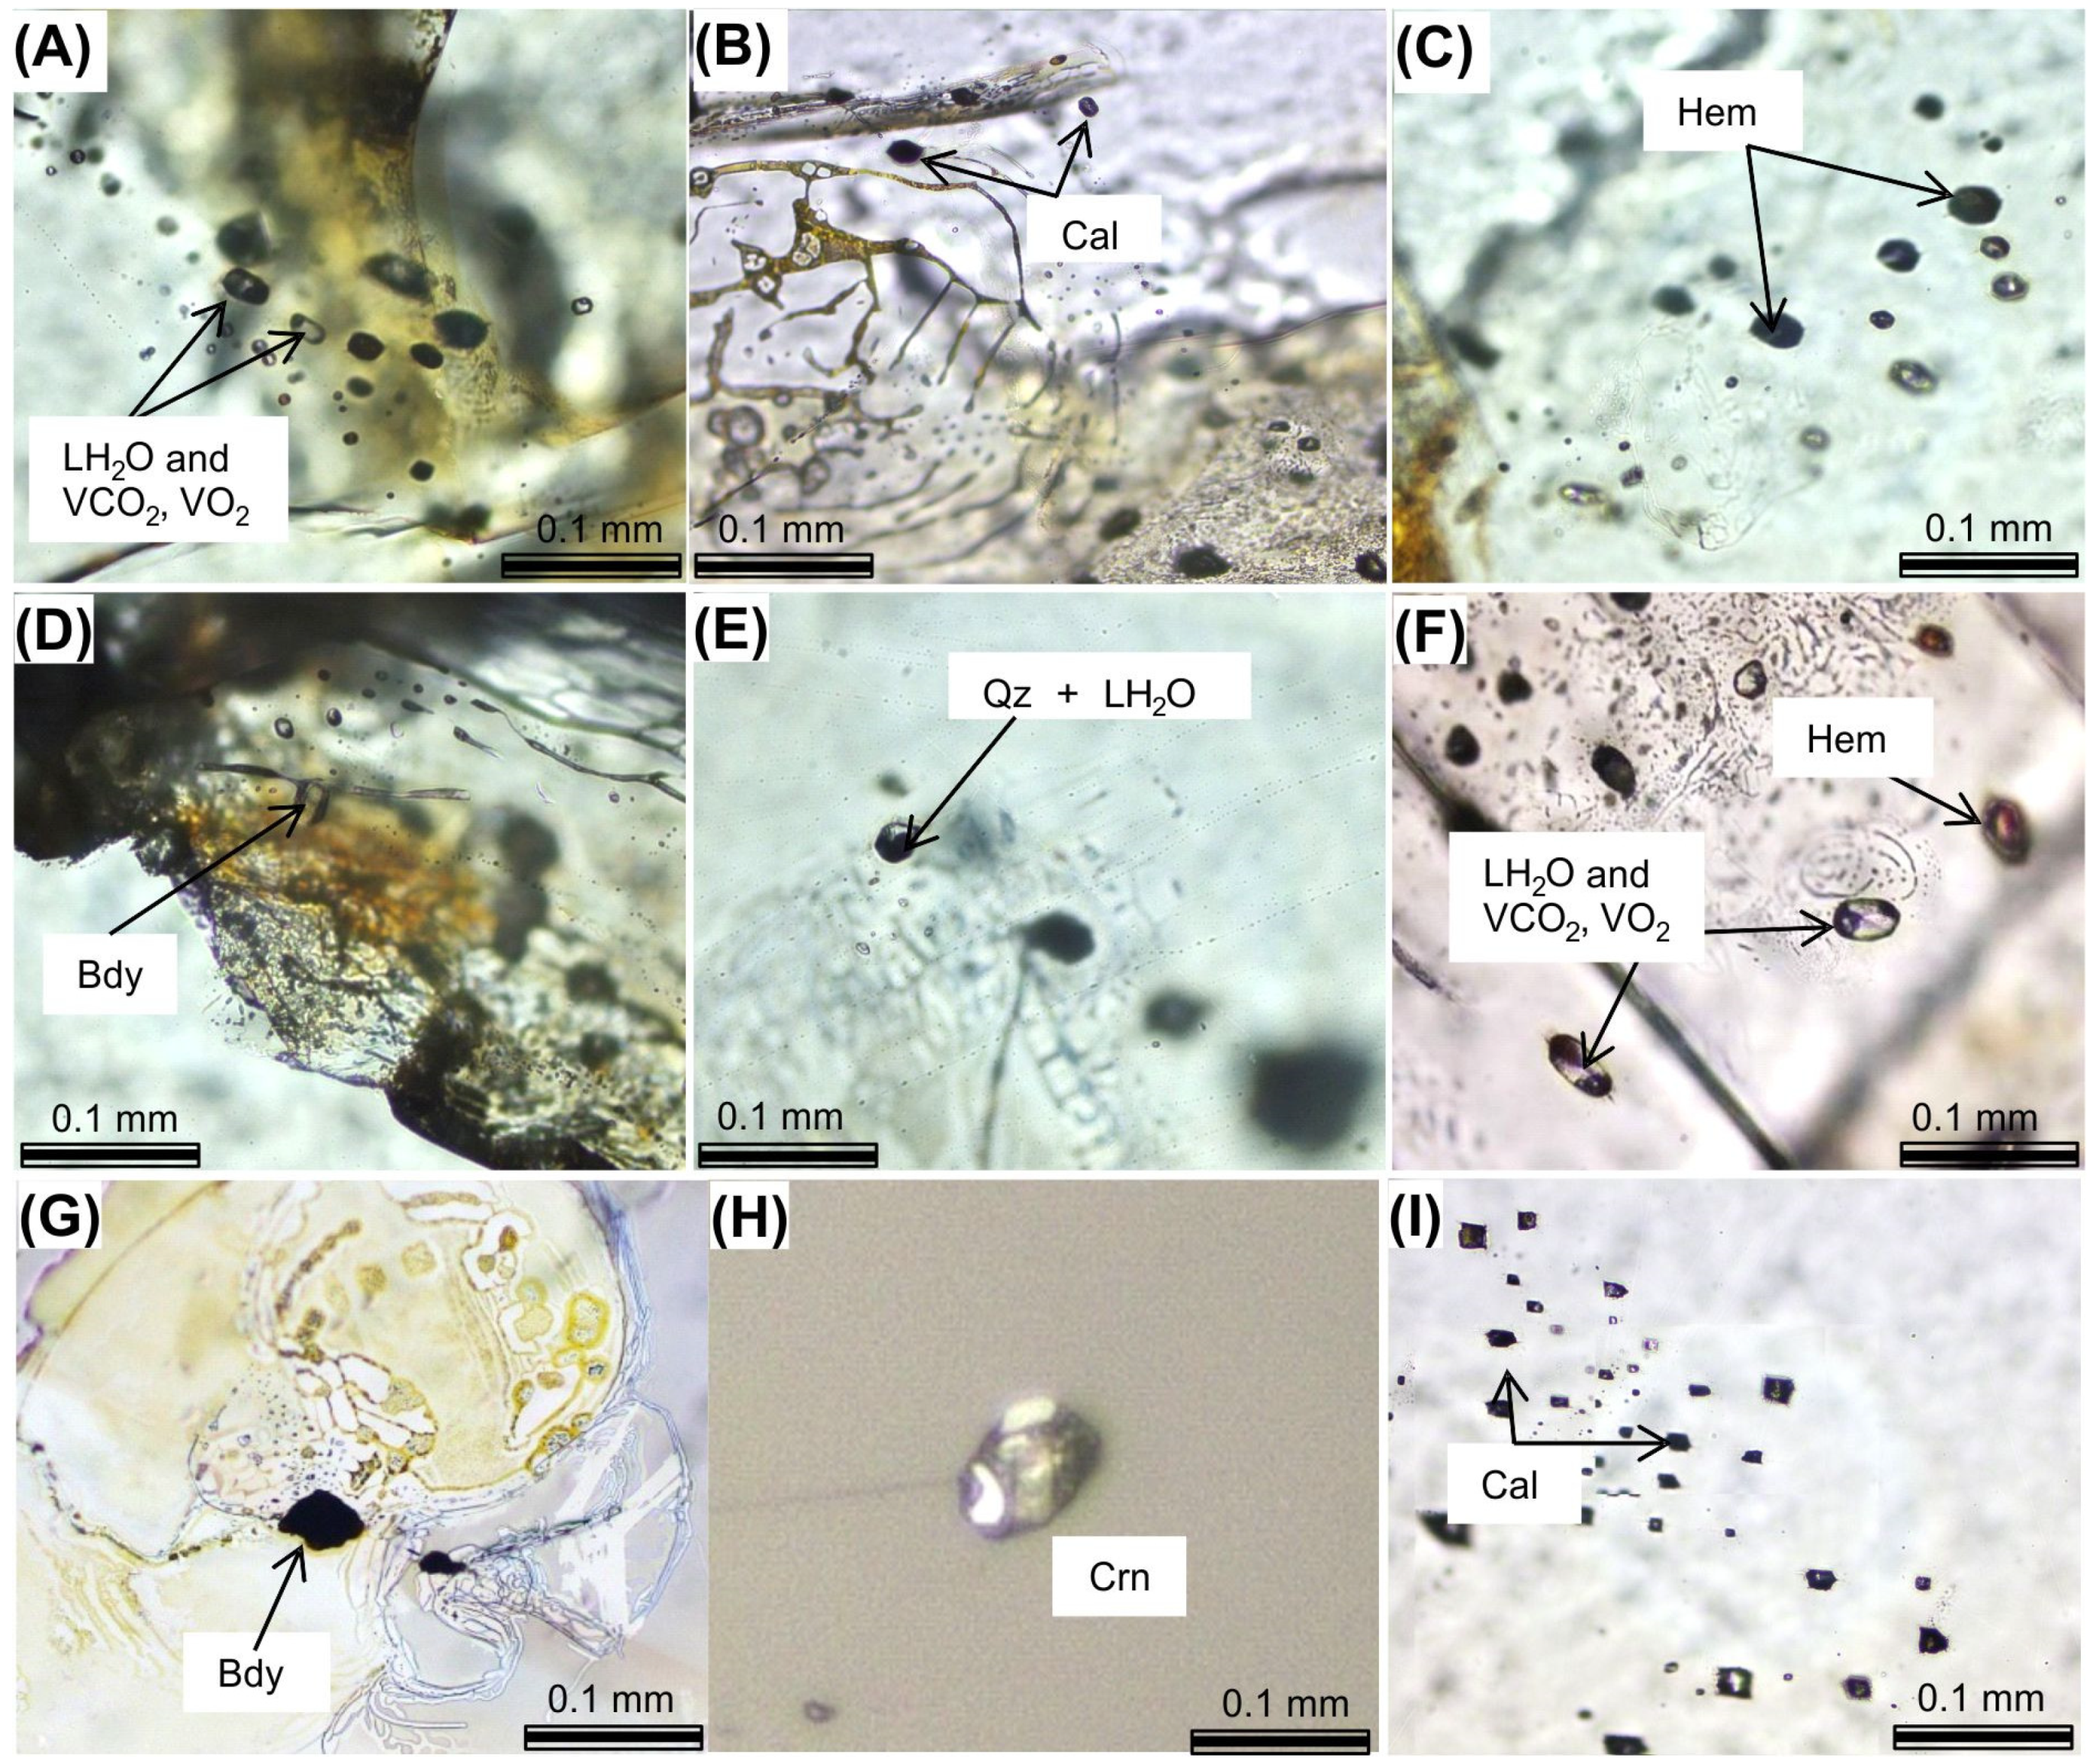
4.1. Inclusion Features

Zircon crystals investigated in this study contained various fluid and mineral inclusions throughout the grains, especially along the cracks (Figure 3A–G). Tubular channels, bifurcating cavities, and vesicles in association with fluid inclusions were observed along the 2-dimensional planes (Figure 3A–G). Typical fluid inclusions along the fractures or fissures consisted of two phases, liquid (H2O) with CO2 or O2 bubbles. Mineral inclusions were identified as calcite, hematite, corundum, olivine, baddeleyite, quartz, and feldspar. We identified two different paragenetic types of mineral inclusions: (1) the inclusions that were distributed throughout the grains without fluid inclusions in close proximity; and (2) others that were distributed along the cracks or were associated with tubular channels, bifurcating cavities, and vesicles with fluid inclusions nearby. Calcite inclusions were found in both areas: ovoid and droplet shaped ones sat inside the tubular channels or were associated with fluid inclusions (Figure 3B); whilst square or rectangular shaped calcite inclusions were accumulated along the chains or in groups that did not occur next to the fluid inclusions or within the tubular channels (Figure 3I). We rarely found corundum (Figure 3H) and olivine inclusions. They were of an euhedral and subhedral shape, and appeared in areas where no cracks, fluid inclusions, or tubular channels were present. Quartz, baddeleyite, hematite, and feldspar were found with irregular or ovoid shapes with rounded termination. They were located along the fissures, within tubular channels, cavities or associated with fluid inclusions (Figure 3C–G).

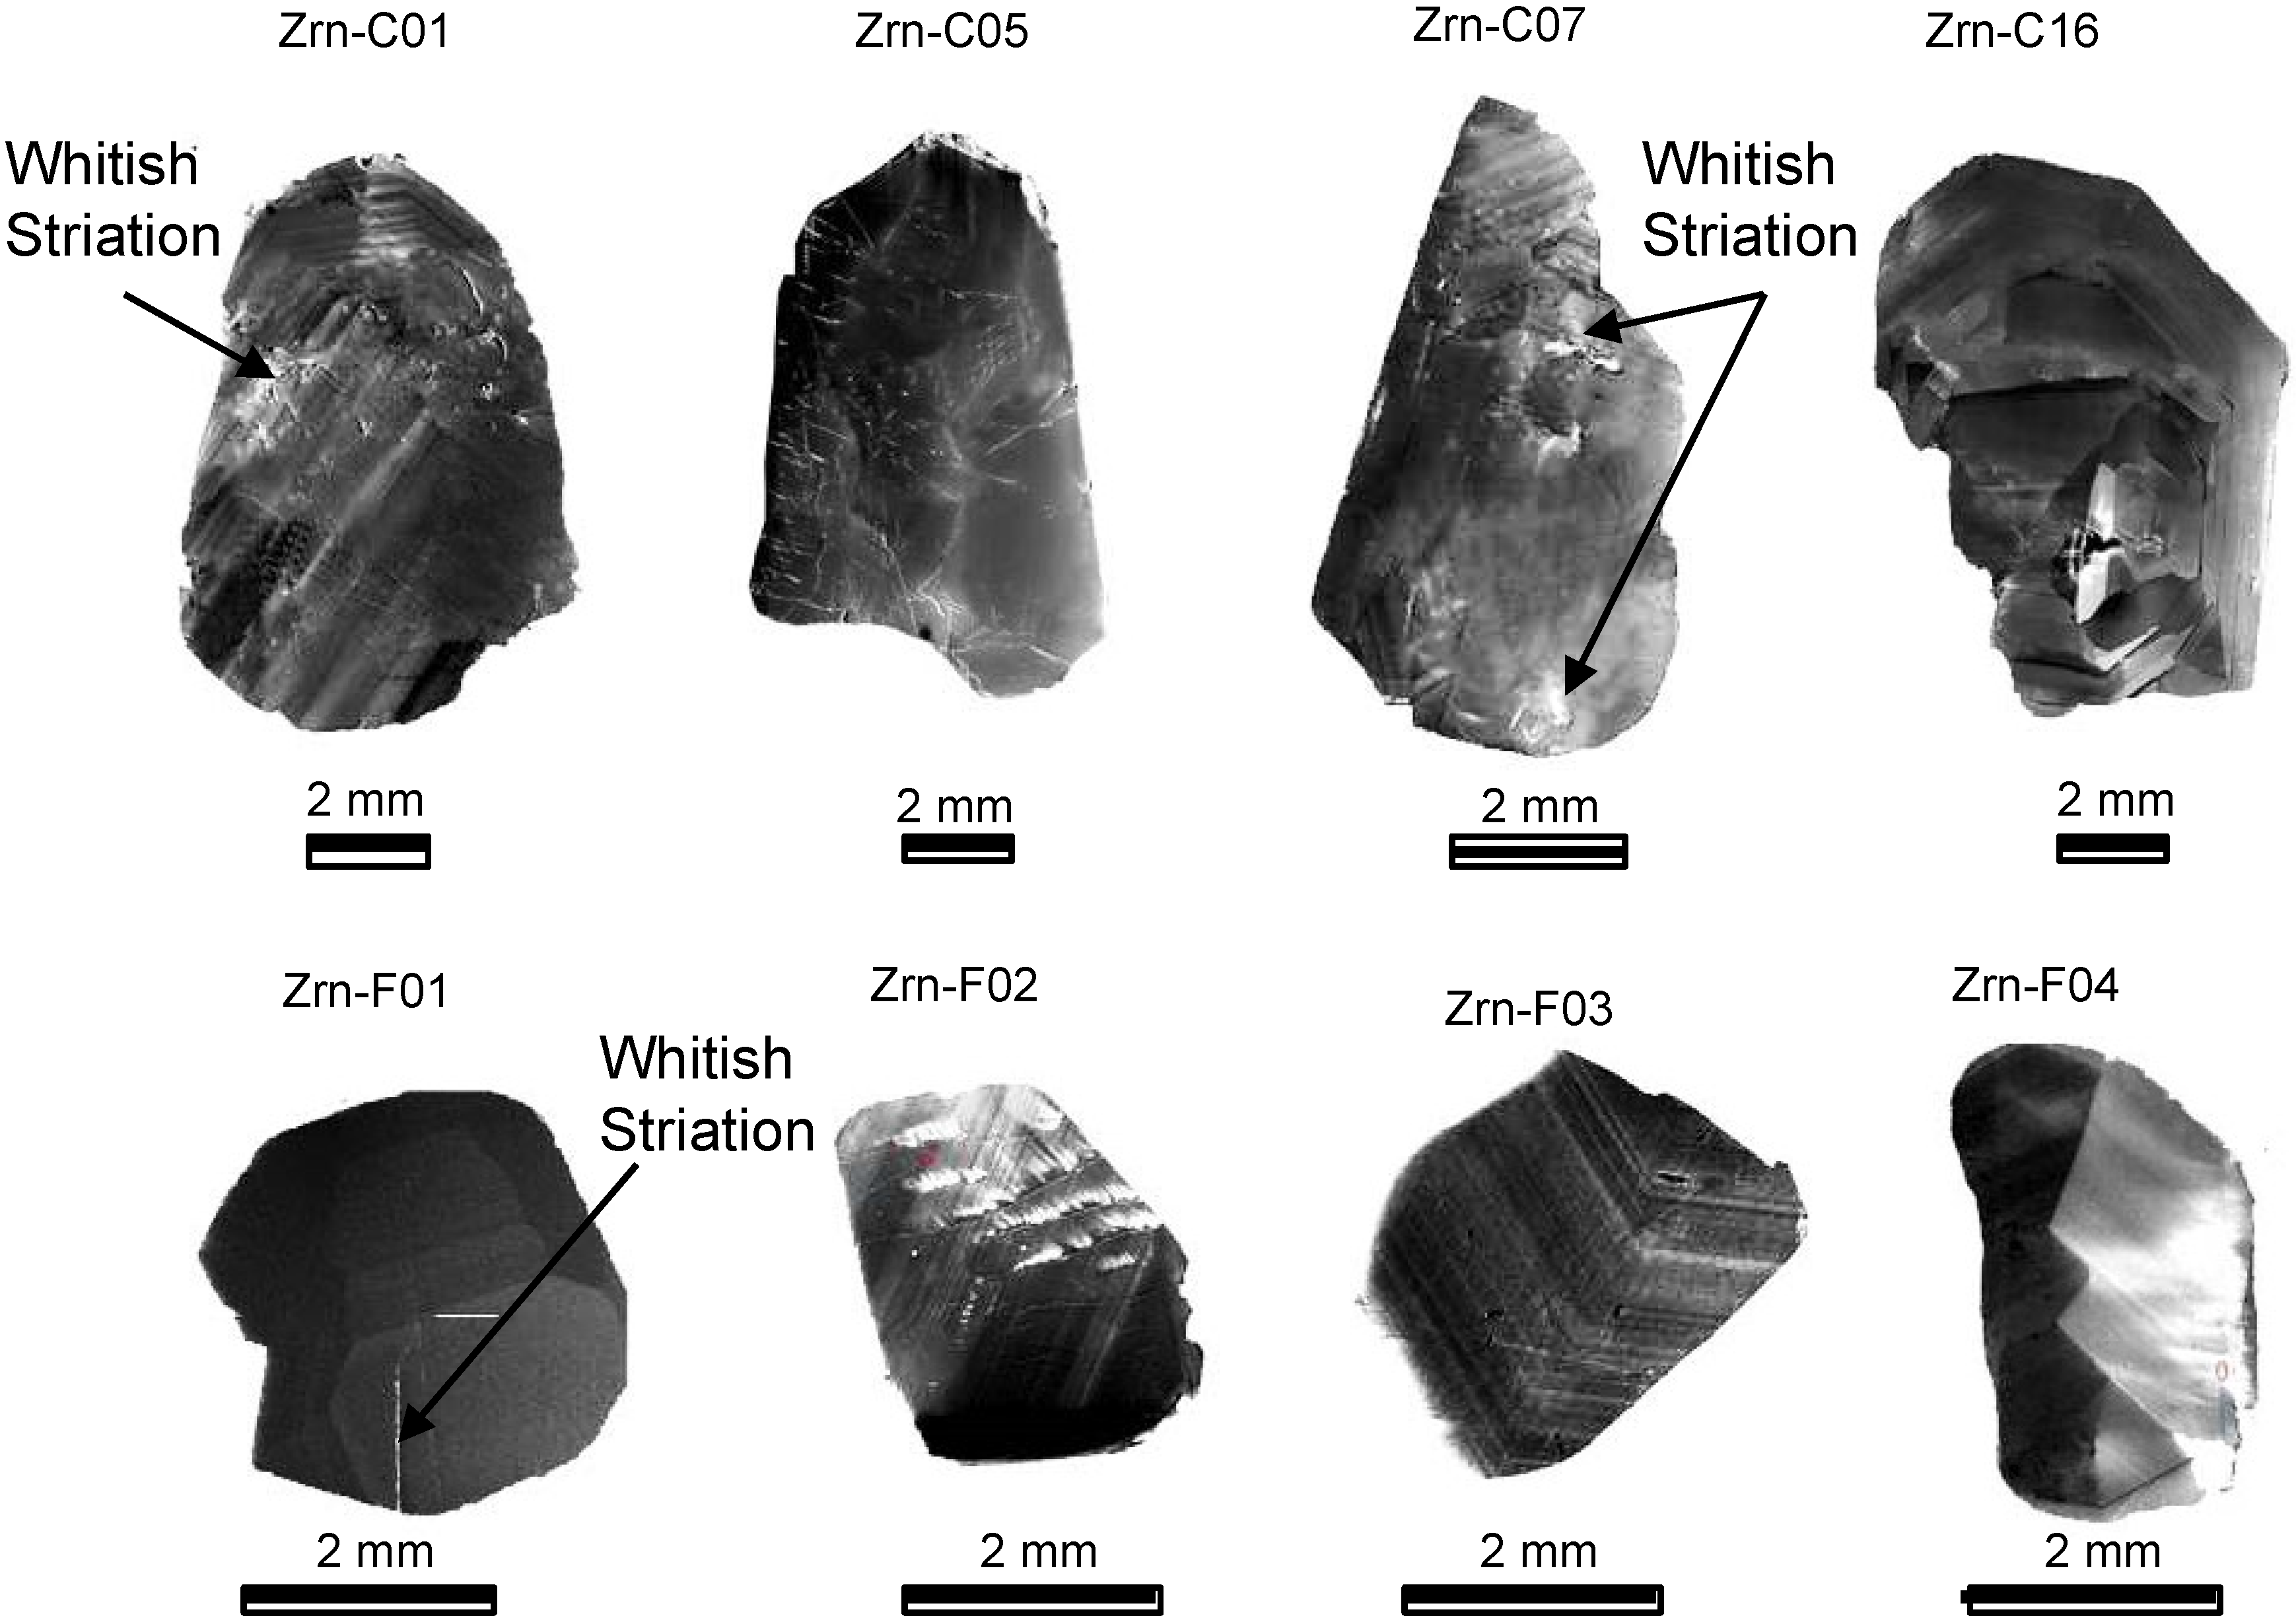
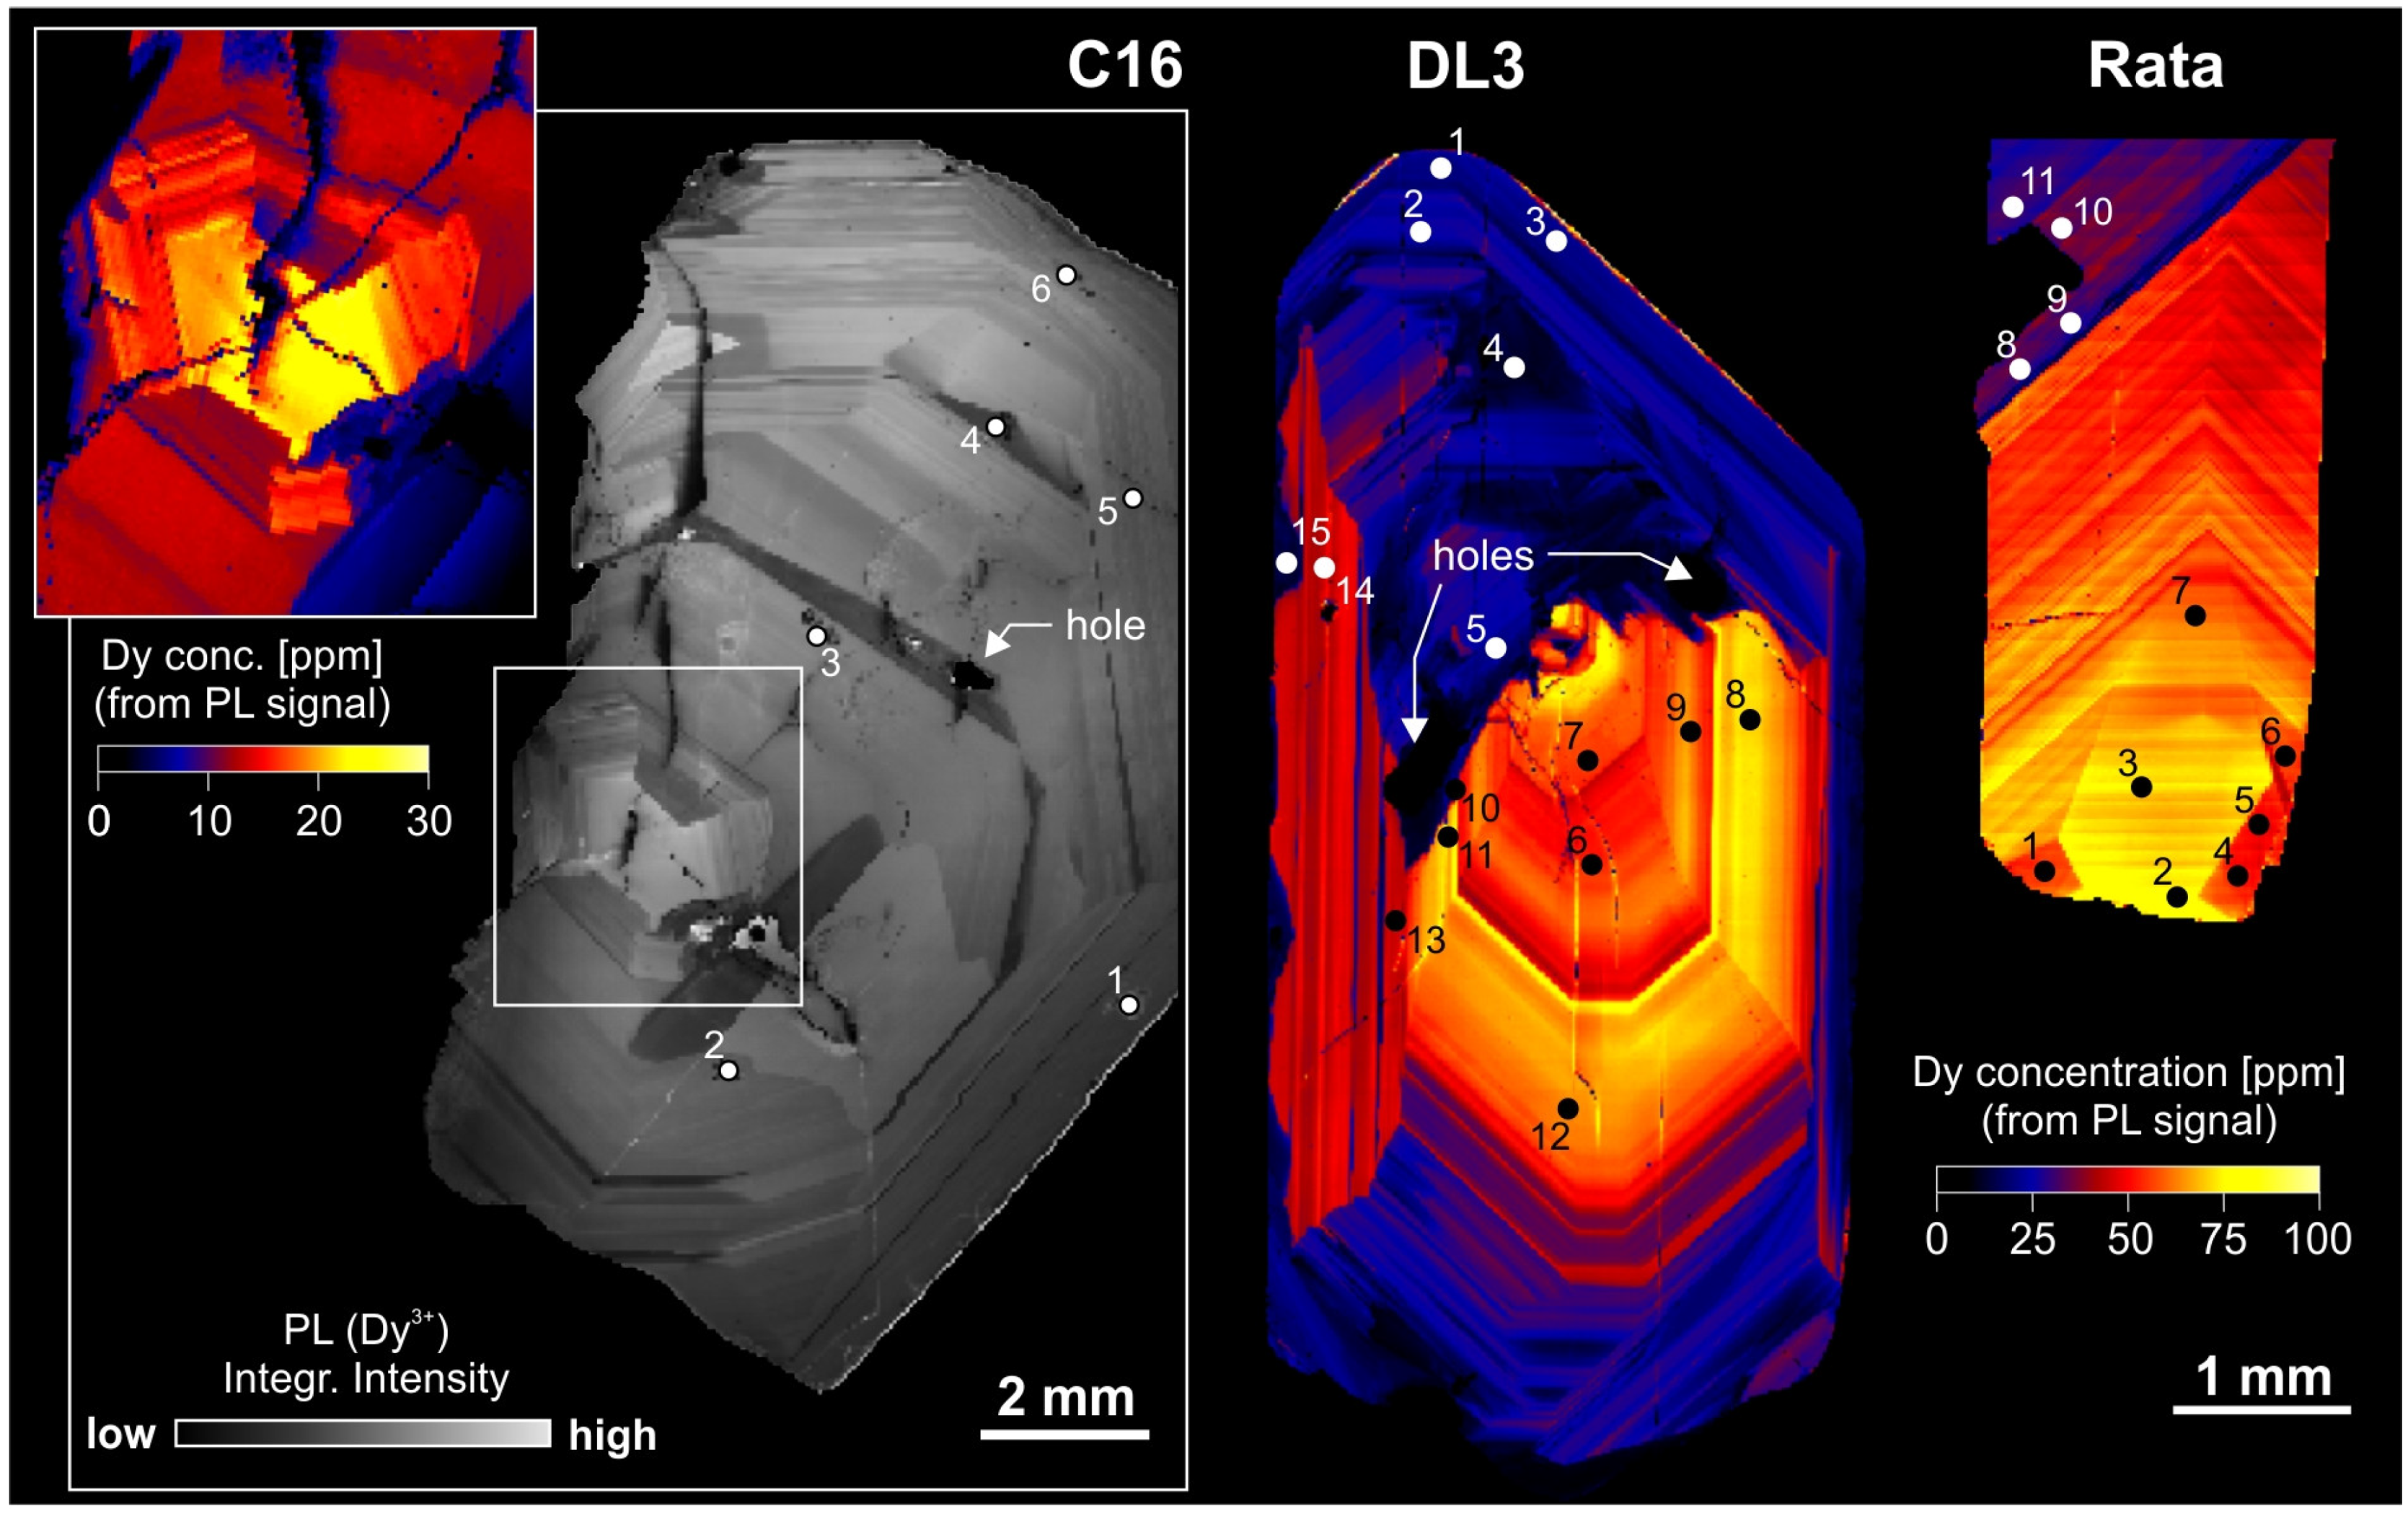
4.2. Internal Texture of Zircon Megacrysts

Backscattered-electron images obtained from the analysis of polished sections revealed no internal textural features although high contrast levels were applied (not shown). The latter indicated a homogeneous distribution and/or low concentration levels of trace elements. In contrast, cathodoluminescence images shown in Figure 4, revealed complex internal textures comprised of oscillatory zoning and sector zoning, although overall CL intensities were comparably low, except for the colorless zircon (Zrn-C05, see Figure 4). Anhedral grains were found to be split or broken into sections of former even larger grains (e.g., F03, F04), whereas the euhedral grains were characterized by multiple CL growth bands that retraced multiple distinct growth stages within a single crystal (e.g., C16 in Figure 4). To obtain minor differences in the CL zonation, high intensity contrast-levels were applied. This caused white stripes to be present in the CL images of some samples that did not correlate with the crystal’s internal zonation (Sample C01, C07, and F01). They were most prominent along cracks and break-outs of fine material that produced mechanically-induced defects on the sample surface during polishing. Those structural defect centers mostly caused broad and intense CL signals in the UV spectral region, which were detected efficiently using panchromatic CL detectors.
We applied laser-induced PL hyperspectral mapping to the large euhedral crystal grains with the aim of visualizing the internal luminescence distribution patterns as specifically caused by the emissions of REEs (Figure 5). The advantage of applying the latter technique is that the PL of specific REE species may be excited effectively using the appropriate laser sources in the visible spectral range without being obscured by intensive broad-band luminescence features as observed by CL spectroscopy and imaging [29]. Figure 5 shows hyperspectral images of the zircon samples from the Central Highlands (C16, DL2) and from Ratanakiri, Cambodia (Rata). The integrated intensity of the most prominent PL emission of Dy3+ (4F9/26H13/2) was used as a plotted spectral parameter (see Figure 6A; and Figure 1 in Lenz et al. [29]). Note that the Dy sub-level bands of Vietnamese and Cambodian (Rata) zircon samples were characterized by exceptionally narrow band-widths (sublevel at 581 nm had a band-width of 11.0 cm−1; see Figure 6A), which indicated a high degree of crystallinity and the absence of structural radiation-damage that might be caused by decay of radioactive U and Th. This was in accordance to findings by Lenz and Nasdala [40] and Zeug et al. [13] who reported very low PL and Raman band widths for zircon from Ratanakiri, Cambodia (Raman ν3 [SiO4] ~1.8 cm−1). This has been interpreted to be the result of very low α-doses due to low U and Th concentrations in combination with a very young age (ca. 1 Ma).
In this study, we found a systematic linear correlation of the integrated PL intensity of Dy with its concentration as obtained from multiple LA-ICP-MS measurement spots (Figure 6B and Table S1). Furthermore, the latter laser-ablation reference spots of Dy concentrations and their correlation with PL intensity were used as an external calibration for the PL hyperspectral images to infer Dy concentrations from the PL signal in regions of unknown trace-element chemistry (see color-coded scales in Figure 5). Especially in the euhedral crystals (e.g., C16 and DL3), we identified several growth stages that were characterized by abrupt changes in concentrations of trace Dy (REE). Typically, the crystal’s cores were found to be enriched in Dy, followed by a decreasing oscillatory REE substitutional budget (see inset of sample C16 in Figure 5). PL patterns further revealed episodical resorption of pre-existent crystals and fast re-growth. Growth zones that were characterized by low REE concentrations cross-cut former zonation patterns and occurred along with large holes and cavities (see arrows in Figure 5, samples C16 and DL3).

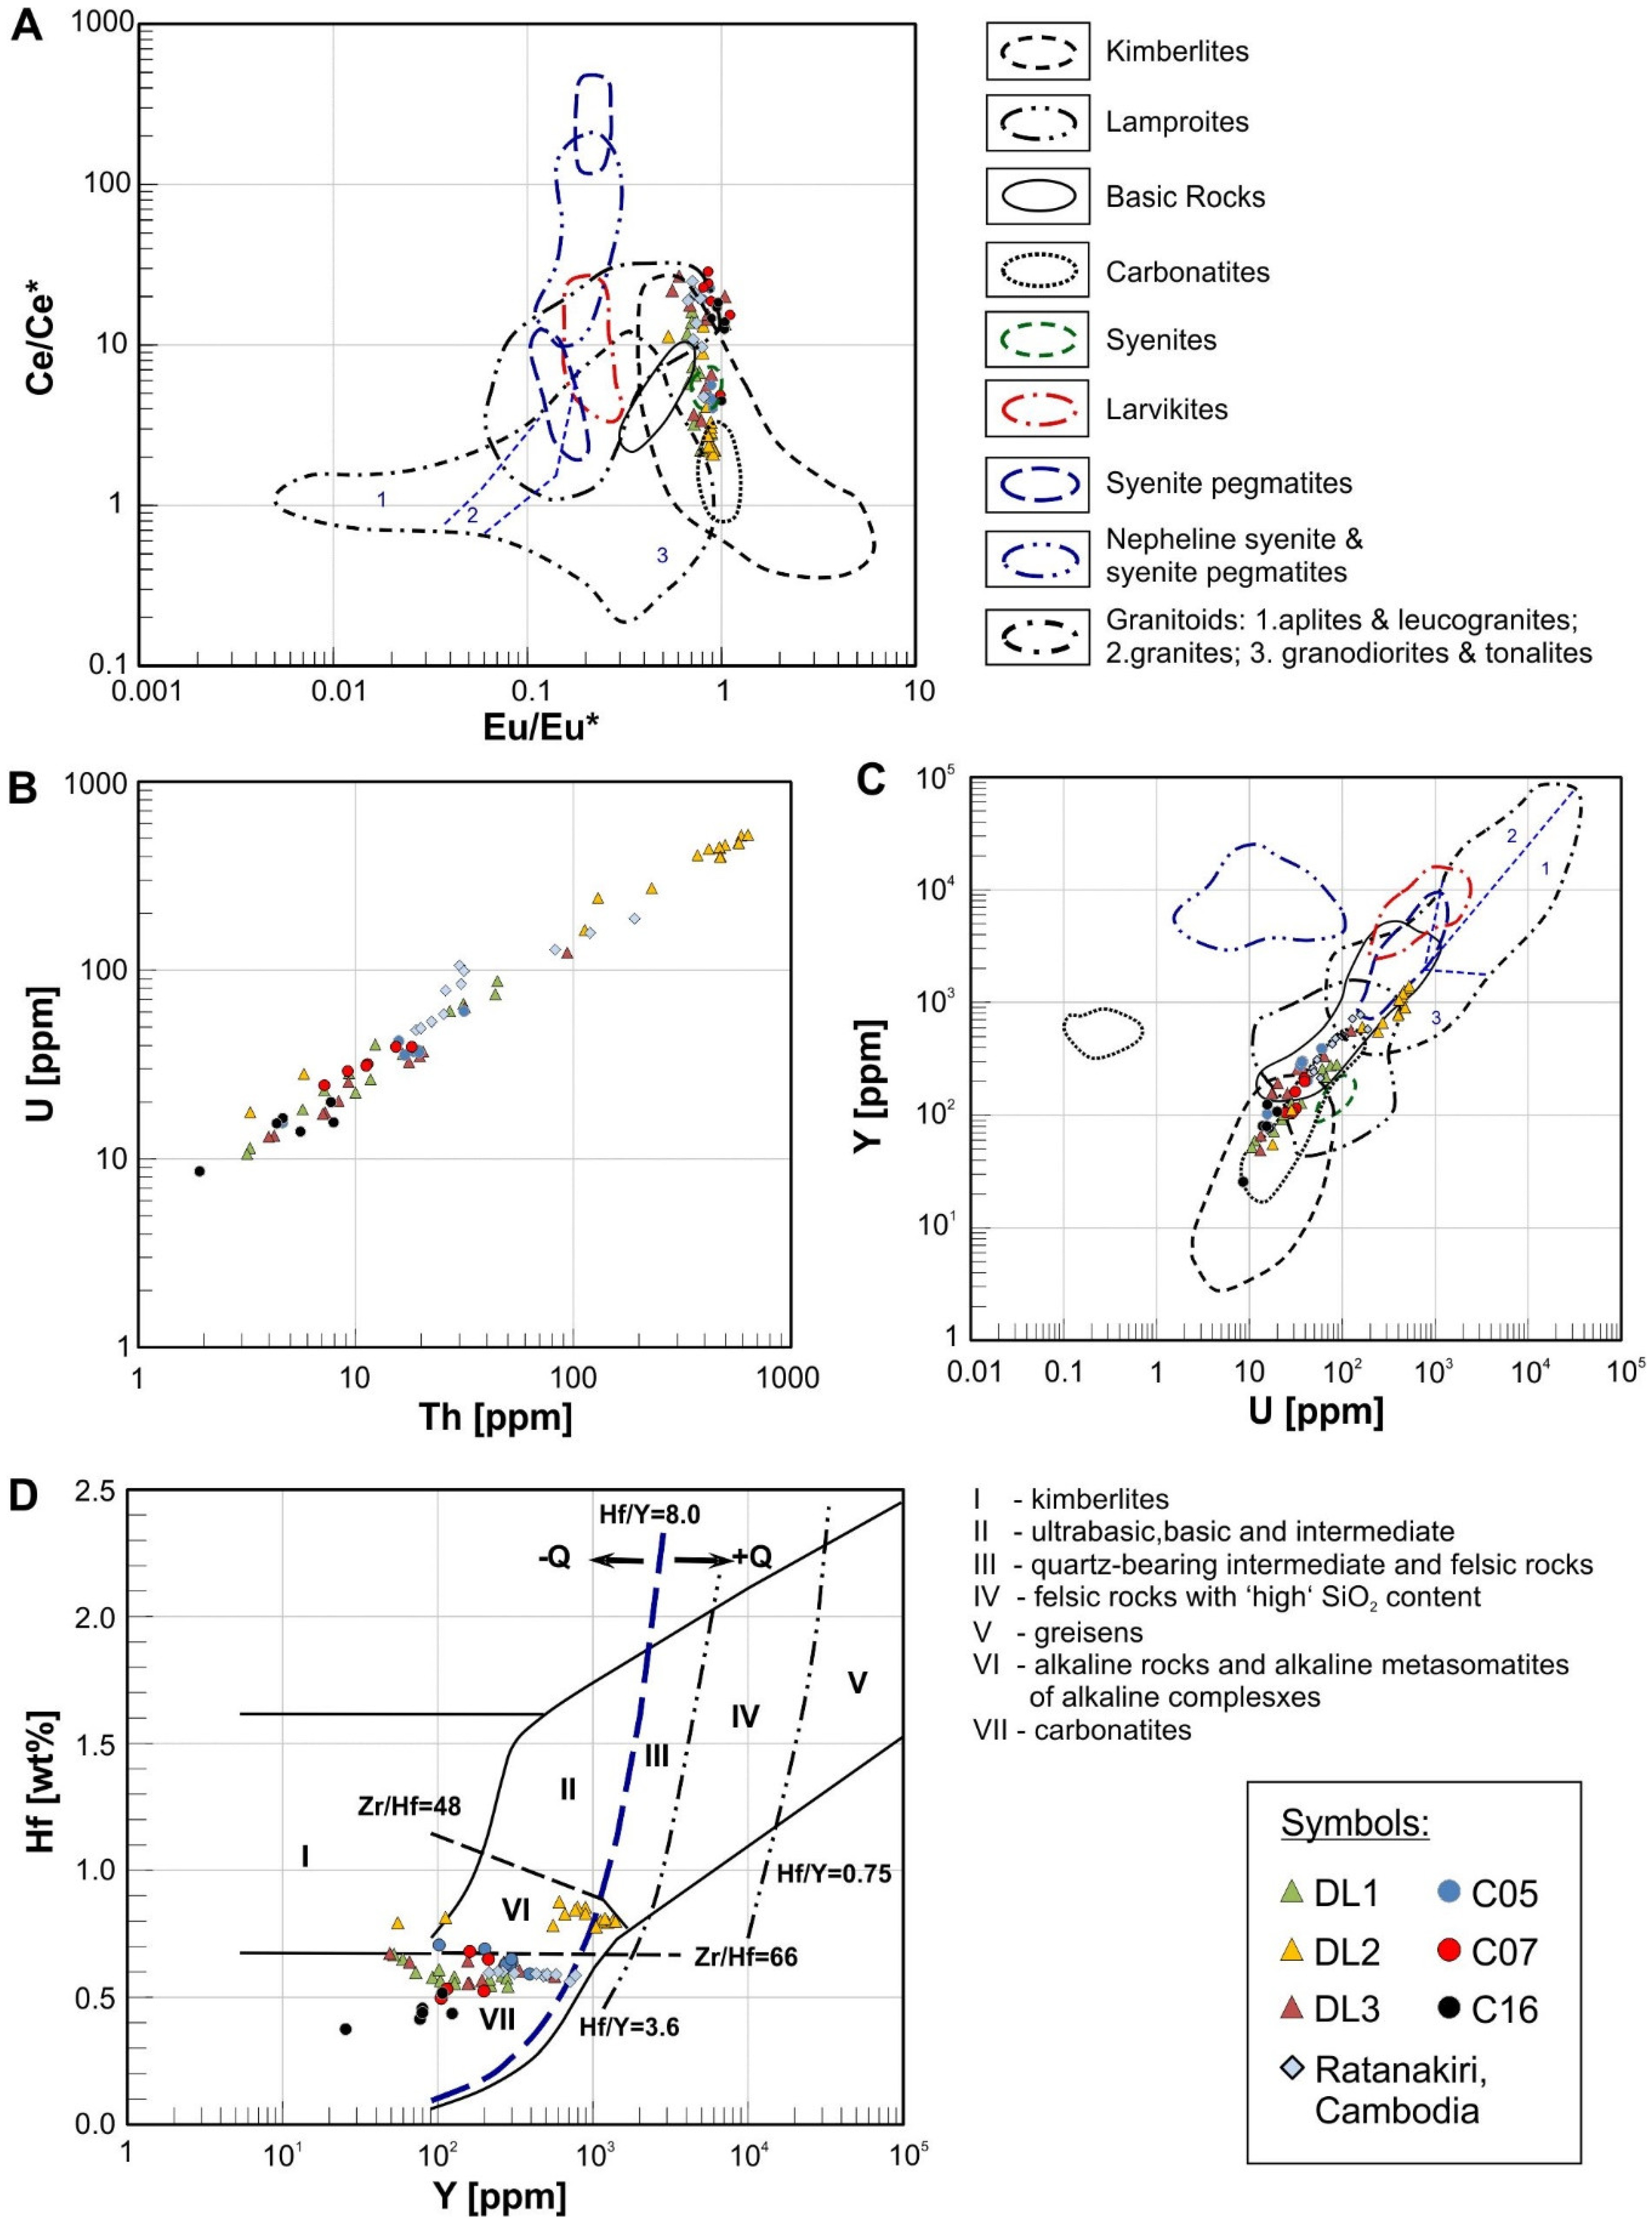
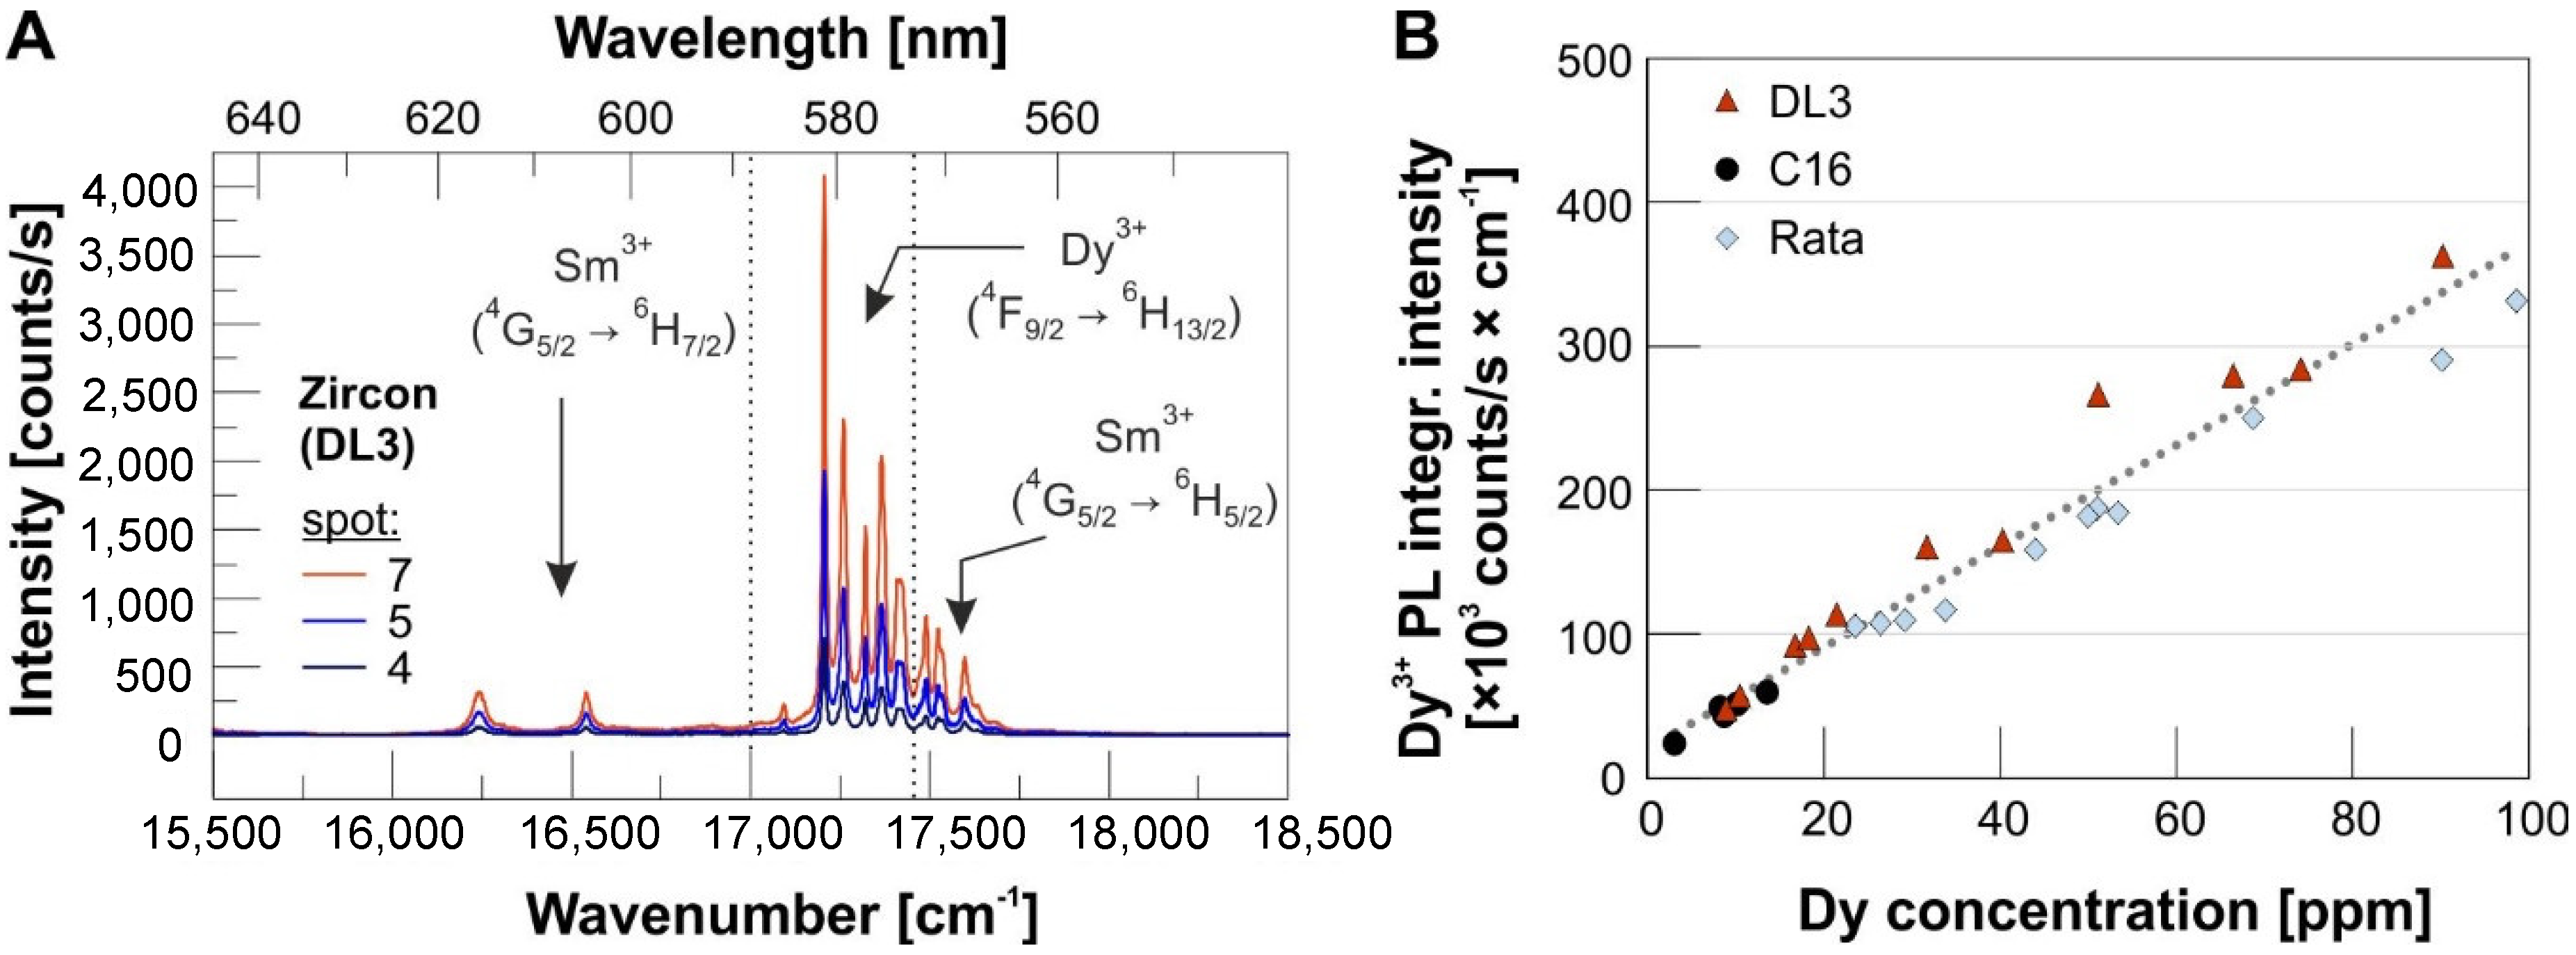
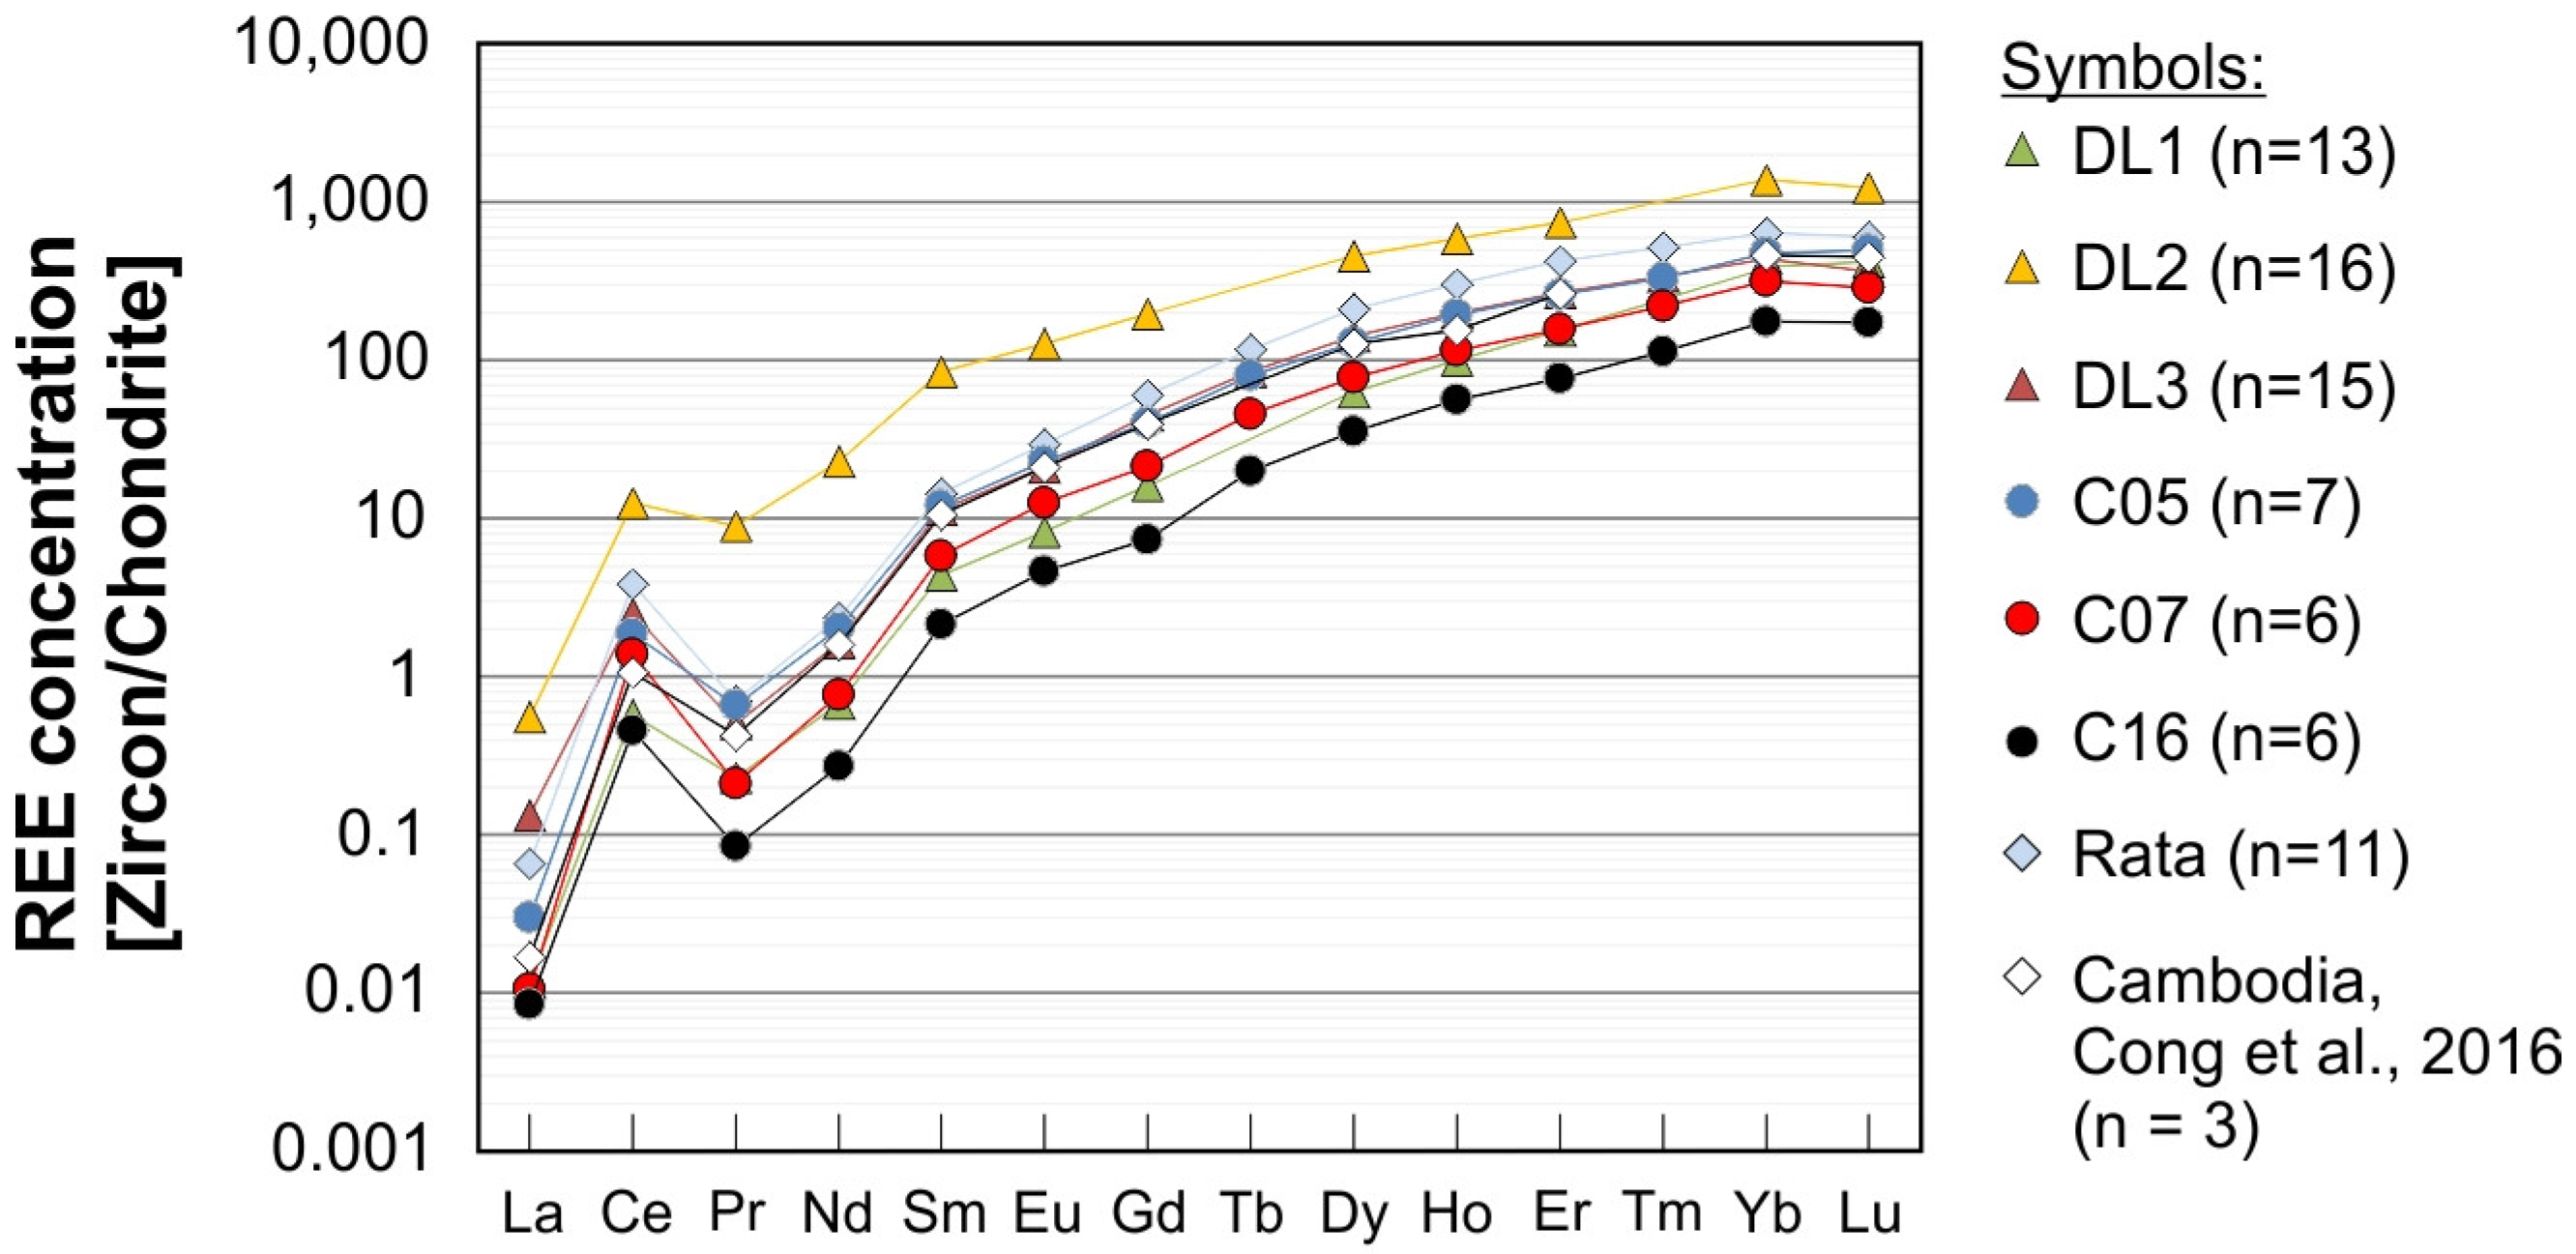
4.3. Geochemical Characteristics
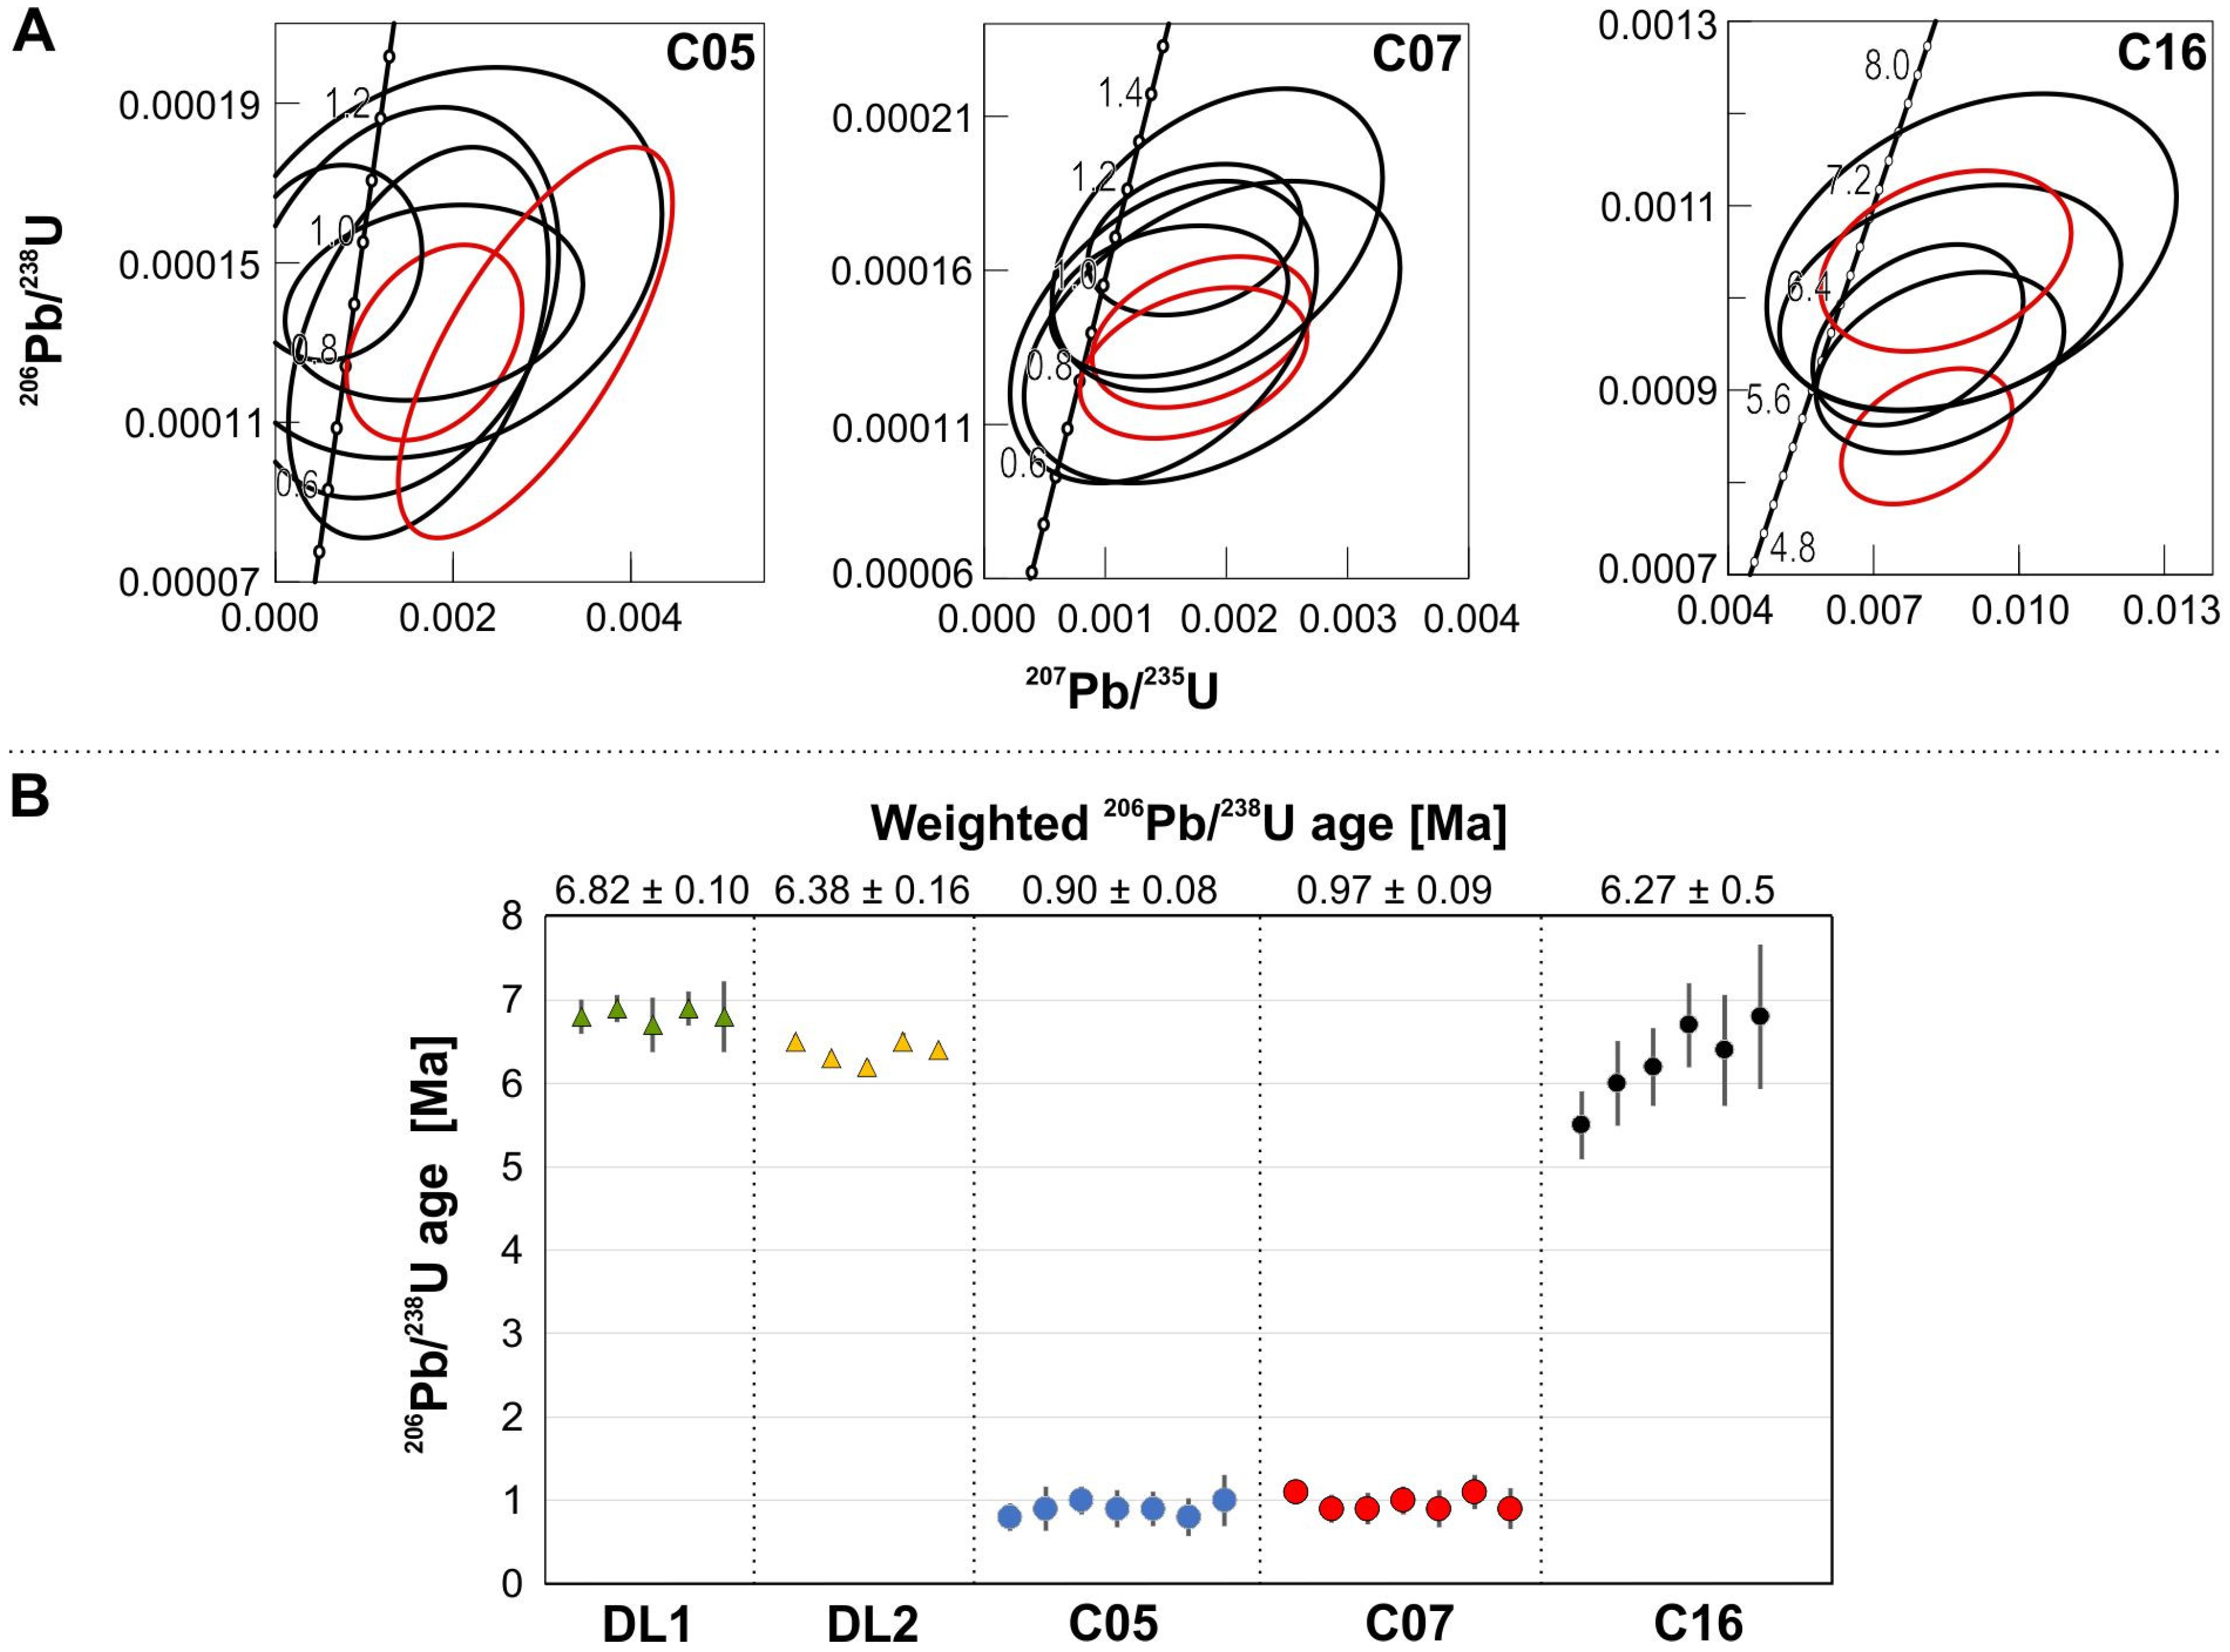
Results from trace-element analyses of Vietnamese zircon samples, in addition to a Cambodian sample from Ratanakiri (Rata) are summarized in Table S1. Representative samples that comprised a colorless (C05), a dark-red (C07), an orange (C16), and three heavily zoned samples (DL1, DL2, DL3), were selected for detailed analyses. All zircon megacrysts had low total Y + REE concentrations typically within a 50–550 ppm range. Somewhat higher concentrations were detected at measurement spots placed in the core region of the heavily zoned samples DL2 and DL3 that were up to 2300 ppm Y + REE (see Table S1). The chondrite-normalized REE concentrations revealed a steep slope from La to Lu (Figure 7). Note that the REE geochemical characteristics of samples from the Central Highlands closely coincided with those of the samples from Ratanakiri (see samples Rata and data from Cong et al. [10]). All samples were characterized by a pronounced positive Ce-anomaly and a lack of Eu-anomaly, which is typical of magmatic zircon crystallized from more evolved magma sources with co-crystallization of feldspars that substitute Eu2+ on Ca-sites. The average Eu/Eu* ratio, that reflects the deviation of the measured Eu concentration from a theoretical Eu* concentration—extrapolated from chondrite-normalized Sm and Gd abundance (Eu* = EuN / [SmN + GdN]0.5)—was found to be close to 1 (Figure 8A). The obtained REE compositional characteristics excluded crustal derived rocks or granitoids as a potential source of the zircon samples studied, and were more typical of the zircon of kimberlitic and/or carbonatitic origin (Figure 8A). Similar to REEs, the overall U and Th concentrations were found to be comparably low, with typical variability at 10–60 ppm and 3–30 ppm, respectively. Core regions of samples DL2 and 3 were found to be more enriched in U and Th with concentrations up to 500 ppm. Despite the pronounced variation in U and Th concentrations among the different growth zones within the samples, their U/Th ratios showed a clear correlation (Figure 8B). Likewise, the Y and U data pairs in a Y vs. U discrimination diagram scattered appreciably amongst the different growth zones within and among the samples, but coincided well with the compositional fields that were reported for basic, kimberlitic, and carbonatitic rocks (Figure 8C; Belousova et al. [16]). A source rock discrimination based on the Hf composition as proposed by Shnukov et al. [41], is presented in Figure 8D. The samples’ Hf composition was found to be very low and shared compositional similarities with zircon from carbonatitic rocks, which had the lowest reported Hf concentrations (<0.7 wt %).

4.4. Geochronology

Results of the measured U-Th-Pb isotopic ratios and calculated ages of samples DL1, DL2, C05, C07, C16 are summarized in Tables S2 and S3 (see Supplementary Materials) and Figure 9. Vietnamese zircon samples from the Central Highlands were found to have Cenozoic, fairly concordant (~50% of discordance in average), and U-Pb ages (Figure 9A). Detailed comparison of the more robust 206Pb/238U ages indicated two distinct events of zircon megacrysts formation. Samples DL1, DL2, and C16 had a U-Pb age of around ca. 6.5 Ma, whereas samples C05 and C07 were even younger with an age of ca. 1 Ma. Note that the LA-ICP-MS measurement spots of individual single crystals were from different growth zones among the entire grains, which were clearly discernable in CL imaging, as well as PL hyperspectral mapping, and they had significant differences in trace-element concentrations (results above). We, however, found no systematic difference in U-Pb ages between the growth zones of individual samples within the standard errors.

5. Discussion

Zircon megacrysts from the Central Highlands that were investigated in this study had various colors, ranging from colorless, orange, brownish-orange, and dark brown to dark red. Some were characterized by colored zonation visible to the naked eye. Most of the selected grains showed a euhedral crystal shape with typical combinations of bipyramid and tetragonal prisms. Other grains had a subhedral to anhedral shape with rounded termination (Figure 2B). The latter might result from magmatic resorption on crystal faces and/or erosion during weathering and transportation into the placer. The internal texture of single crystals revealed by CL imaging and PL hyperspectral mapping was characterized by wide to narrow oscillatory and/or sector zoning (Figure 4 and Figure 5). Typical crystal shape and textural features were conclusive hints that the megacrysts had a magmatic origin [1]. In heavily zoned samples (DL1−3, C16), dark-brownish colored zones correlated with the elevated concentrations of REE, U, and Th. On the other hand, a colorless zircon sample (C05, Figure 2B) was found to be more enriched in REEs, Th, and U, than the non-transparent dark-red sample C07 (Figure 2B, Figure 7 and Table S2). Hence, any rigorous interpretation based on color information should be avoided. For example, we found no corroboration for the interpretation that dark-brownish coloration of zircon was related to the presence of structural radiation damage. Multiple zircon samples obtained from placer deposits in Vietnam, including samples from Ratanakiri, Cambodia, had various colors ranging from transparent to non-transparent dark-brown, but all were characterized by very low Raman and PL spectral band-widths that indicated no radiation damage to be present [13].
We used PL hyperspectral imaging of the Dy3+ emission as an effective tool to visualize the distribution of REEs across the zircon samples (Figure 5). The latter technique was more reliable with respect to specifically exciting and detecting the emissions of REEs, because the panchromatic CL imaging is often strongly affected by other luminescence emissions that are caused by defects that are not coupled to the substitution of REEs (see mechanically induced bright CL striations caused by polishing; Figure 4). We further found that PL integrated intensities of Dy3+ used for PL hyperspectral imaging, correlated well with the Dy concentrations determined using spot LA-ICP-MS analyses (Figure 6). We, therefore, used PL hyperspectral images to quantitatively visualize Dy concentrations in regions of unknown chemical compositions as extrapolated from Dy3+ integrated emission intensities. Note, however, that the correlation of Dy concentrations with their PL response may be strongly hampered in other zircon samples that show a much higher accumulation of structural radiation damage, e.g., Lenz and Nasdala [40] reported that the presence of radiation damage resulted in substantial quenching of the PL intensities.
In this study, we identified multiple growth stages that included the resorption and re-growth of large volumes of the zircon megacrysts (Figure 5, samples C16 and DL3). Outer growth zones irregularly cut the former zones repeatedly and were characterized by lower REE concentrations, which indicated that the growth condition of megacrysts may have changed spontaneously to a more REE undersaturated growth environment that resulted in re-growth of the zones with depleted REE concentrations. Although absolute REE concentrations changed considerably across the different growth zones, their general chondrite-normalized concentration patterns were qualitatively similar. Chondrite-normalized REE patterns in the core and overgrowth regions had a steep slope from light REE (LREE) to heavy REE (HREE), with pronounced positive Ce-, but with a lack of an Eu-anomaly (Figure 7). The positive Ce anomaly is typically caused by the significant difference between Ce4+ and LREE3+ to fit into the zircon’s structure, as Ce4+ has the same charge and similar ionic radius compared to Zr4+. The Eu anomaly of zircon in REE patterns is generally explained by Eu2+ fractionation in the plagioclase and/or alkali feldspar that crystallizes before or during zircon formation from the magma [1,43,44]. Therefore, a pronounced negative Eu anomaly is commonly found in zircons from crustal-derived felsic rocks [16,44], whereas no Eu anomaly is found in zircon from feldspar free rocks, such as little to non-fractionated or mantle-derived rocks [45]. Note also that zircons of mantle origin usually have low REE and Y concentrations (zircon in kimberlite from southern Africa with TREE = 5–39 ppm and Y = 11–74 ppm [46]; zircon from Jwaneng kimberlite TREE up to 12 ppm and Y up to 23 ppm [47]), whereas zircons in crustal rocks are more enriched in REEs ranging from 250 ppm to 5000 ppm, with a 1500–2000 ppm average [1,16,48]. Trace-element concentrations of zircon crystals investigated in this study (TREE = 25–309 ppm, Y = 26–392 ppm) shared chemical characteristics comparable to mantle-derived zircon, and had no Eu anomaly (Figure 7). Moreover, the provenance discrimination plots proposed by Belousova et al. [16] and Shnukov et al. [41] revealed that the trace-element composition of Vietnamese zircon megacrysts were consistent with zircon typically found in kimberlite, syenite, carbonatites (Figure 8A–C), or alkaline rocks and alkaline metasomatites of alkaline complexes (Figure 8D). As the observed trace-element chemical characteristics ambiguously meet with those of several discrimination fields, it is hard to define an exact source composition. In fact, zircon samples from carbonatites often fall into various discrimination fields [49,50]. For example, Saava et al. [49] reported that only 45 out of 100 analyzed zircon grains extracted from a carbonatite body meet the trace-element signatures that indicate a carbonatitic source, while all others suggest an alkaline or ultramafic source. This compositional variation has been interpreted to result from the interaction between carbonatitic melt and co-magmatic silicate sources that broaden the chemical variation of carbonatitic zircon. In this study, total REE contents of zircon typically varied in the range of 25 to 309 ppm. These concentrations were slightly higher than those found in the kimberlitic zircon that had typically less than 50 ppm [46,47], but had a much lower concentration than the one from zircon of corundum bearing syenites (up to 3500 ppm [2]). Low concentrations of U and Th (Figure 8B), and low Nb and Ta concentrations are also typical of the zircon that originates from very little, to non-fractionated, Si-poor melts [16]. Trace-element chemical signatures of the zircon megacrysts of south-central Vietnam were found to be very comparable to those of zircon from Ratanakiri, Northeast Cambodia (Figure 7 in Cong et al. [10]; Figure 7 in this study) and other places such as New Zealand [11], East Australia [18], eastern and northeast China [5,8]. Results of a detailed study by Cong et al. [10] and Piilonen et al. [22] using δ18O and 176Hf/177Hf isotopes clearly demonstrated that zircon from Ratanakiri, Cambodia, had a mantle origin and may be derived from metasomatized, partially melted lithospheric mantle material (such as peridotite, harzburgite), with strong carbonatitic geochemical fingerprint. In fact, experimental studies by Foley et al. [51], have demonstrated that mantle metasomatism, as induced by the presence of CO2 and H2O, lowers the solidus temperature at upper mantle conditions and promotes partial melting of the peridotites that results in melts with carbonatitic compositions at low degree, and carbonated silicate melts with higher degrees of melting. Early carbonate-dominant melts were characterized by a low Hf compatibility, that is consistent with low Hf concentrations obtained from zircon in this study (Figure 8D) [5,8,10,11]. With increasing degrees of partial melting, Hf is more compatible in the carbonated silicate melt [51].
Owing to the close geographical, geochemical, and geochronological relation of Cambodian zircon from Ratanakiri with material from the Central Highlands in Vietnam, studied here, we considered a very similar genetic origin for the latter. This was further supported by the presence of primary inclusions. Euhedral inclusions of calcite and corundum, and subhedral olivine are present in the zircon host, that is free of fluid inclusions, tubular channels, which shows no indication of visible cracks or alteration (Figure 3). These findings were in accordance to those of Le Bas [52], who interpreted the presence of abundant primary carbonate and olivine inclusions in the zircon megacrysts to be indicative of the growth in a silica-undersaturated, carbonatite-like melt. The experimental work of Baldwin [53] demonstrates that corundum and olivine likely crystallize from carbonatitic melts during early phases. However, no carbonatite bodies were reported from the studied area in the Central Highlands, Vietnam. In fact, the only known occurrence of carbonatites in Vietnam has been found in South Nam Xe, Northwestern Vietnam. Those rift-related carbonatites have reported ages of 28–44 Ma (biotite K-Ar ages) and 30–32 Ma U-Th-Pb isochron ages [54,55], and hence, may not be considered as a potential source. Instead, we found U-Pb zircon ages that were consistent with periods of basaltic volcanic activities in southern Vietnam. Two distinct zircon populations with U-Pb ages of ca. 6.5 Ma and ca. 1.0 Ma were identified. Although zircon megacrysts may be potentially derived from carbonatitic, metasomatized mantle material and do not primarily relate to alkali basalts, the zircon ages obtained were consistent with bi-episodal eruptive events at Buon Ma Thuot, Dak Lak (5.8–1.67 Ma), Pleiku (4.3–0.8 Ma), and the younger basalt eruptions exposed at Xuan Loc (0.83–0.44 Ma) (Figure 1B) [4]. Zircon megacrysts from North-East Cambodia not only occur geographically close to the megacrysts found in the present study, but also share a similar U-Pb age connected to the younger period of volcanic activity in the region (0.98 ± 0.04 Ma, Cong et al. [10]; 0.88 ± 0.22 Ma to 1.56 ± 0.21 Ma, Piilonen et al. [22]). Obtained zircon U-Pb ages were just slightly older than the eruption events that were dated based on the K-Ar ages for the whole rock [4]. This might be due to the difference in closure temperatures for U-Pb ages of zircon and K-Ar ages from the basalt, that indicated rapid extraction of zircon from its formation source, and the comparably fast uplift by the alkali-basalt eruption events [17,22]. Note, however, that the rim zones of resorption and re-growth (visualized by PL images in Figure 5) gave the very same ages as the zircon core regions within statistical errors. We excluded a potential alteration process to explain this texture. Late-stage, fluid-driven dissolution-reprecipitation typically results in geochronological resetting [56], and geochemical signatures typically indicate a progressive REE fractionation, e.g., a more pronounced negative Eu-anomaly. As both criteria are not verified for the overgrowth zones found in the zircon megacrysts, in this study, we assumed that multiple resorption and re-growth processes took place in the deep sub-crustal “carbonatitic” source magma chambers at temperatures higher than U-Pb closure (>900 °C; Cherniak et al. [57]). Multiple, late-Cenozoic, relatively fast uplifts of basaltic melts induced by tectonic weakening along shear-zones in the tectonically active region, may have either caught up with xenolithic zircon megacrysts from and/or mixed with pre-existent carbonatite-dominated melts generated by CO2 and/or H2O metasomatization of the upper mantle material. Inclusions of hematite, baddeleyite, quartz, and feldspar, as well as some ovoid or droplet carbonate inclusions along fractures or along channels, that are associated with fluid inclusions of liquid H2O and vapor bubbles of CO2, are considered to be of secondary origin (Figure 3). These phases are well known to occur upon zircon alteration. Particularly, the formation of baddeleyite due to the metasomatic alteration of zircon induced by Ca-bearing fluids has been proven by the experimental works of Lewerentz [58]. Therefore, the occurrences of these phases along fluid inclusions in close proximity to fractures, within tubular channels and/or vesicles are interpreted to result from late stage circulation of oxidative fluids in the ascending alkali-basaltic magma. Finally, weathering processes eroded zircon megacrysts from the alkali-basalt hosts in the Central Highlands and resulted in the deposition and enrichment of the nearby alluvial zircon placers found today.

6. Conclusions

Crystal morphology and internal texture of gem-quality, placer zircon megacrysts of the Central Highlands, Vietnam, are indicative of magmatic origin. The geochemical signatures and primary inclusions of calcite, olivine, and corundum indicate that zircon megacrysts might have crystallized from a carbonatite-dominant melt caused by the low-grade partial melting of metasomatized lithospheric mantle. Zircon resorption and re-growth textural features, observed with PL imaging, indicate an extended residence time in the sub-crustal magma chambers at variable REE-saturation levels, but at temperatures higher than closure of the U-Pb system (>900 °C). Zircon megacrysts were subsequently incorporated into ascending alkali basalts as xenocrysts. Two distinct populations with U-Pb ages at ca. 6.5 Ma and ca. 1.0 Ma that correlate with the eruption of alkali basalt fields in the Central Highlands, were identified. Recent reports of the direct findings of megacrystic zircon in the geographically and genetically related basalts of Ratanakiri, Cambodia [22] strongly supports this close relationship of placer zircon with Cenozoic alkali basalts as a potential host. The basalt magma and/or late stage circulation of carbonate-rich fluids must have resulted in the entrapment of further secondary inclusions like CO2-H2O fluids, baddeleyite, quartz, hematite, and feldspar along the cracks and tubular channels.

Supplementary Materials

The following are available online at https://www.mdpi.com/2075-163X/9/2/89/s1, Table S1: Results of LA-ICP-MS trace-element analyses of multiple measurement spots on zircon samples from Central Highlands, Vietnam (DL1, DL2, DL3, C05, C07, and C16) and from Ratanakiri, Cambodia (Rata), Table S2: U-Pb isotopic ratios and ages obtained from LA-ICP-MS analyses of zircon samples from Central Highlands, Vietnam, Table S3: U-Th-Pb isotopic ratios and ages obtained from LA-ICP-MS analyses of zircon samples from Dak Lak, Central Highlands, Vietnam.

Author Contributions

Concept of study, V.B.T.S.; methodology data acquisition and treatment, V.B.T.S., C.L., N.N., T.A. and E.B.; formal investigation, V.B.T.S., Y.O, C.L., N.N., and I.K.; compilation and writing of the manuscript, V.B.T.S.; review and editing of manuscript, C.L., Y.O., N.N., I.K., T.A., and E.B.

Funding

This study was funded by the Monbukagakusho/Ministry of Education, Culture, Sports, Science and a Technology-Japan (MEXT) scholarship at Kyushu University. Y.O. is funded by JSPS KAKENHI grants No. 16H02743, 22244063, and 21253008. C.L. and E.B. gratefully acknowledge the use of instrumentation funded through an honorary-associate agreement with the ARC CFSS/GEMOC at Macquarie University, Sydney. Financial support to C.L. was provided by the Austrian Science Fund (FWF), through project J3662-N19. N.N. is funded by JSPS KAKENHI grants No. 15K05345 and 18H01316.

Acknowledgments

The authors thank Le Thi Thu Huong from Senckenberg museum in Frankfurt, Germany, and Nguyen Thi Minh Thuyet from Hanoi University of Science, Vietnam for their help during fieldwork and sample collection in Vietnam. Special thanks to the local zircon miners in Central Highlands, Vietnam for providing insights into their mining operations. We are indebted to three anonymous reviewers for their critical comments on the manuscript.

Conflicts of Interest

The authors declare no conflict of interest. The funders had no role in the design of the study; in the collection, analyses, or interpretation of data; in the writing the manuscript; or in the decision to publish the results.

References

  1. Hoskin, P.W.O.; Schaltegger, J.M. The composition of zircon and igneous and metamorphic petrogenesis. Rev. Mineral. Geochem. 2003, 53, 27–62. [Google Scholar] [CrossRef]
  2. Hinton, R.W.; Upton, B.G.J. The chemistry of zircon: Variation within and between large crystals from syenite and alkali basalt xenoliths. Geochim. Cosmochim. Acta 1991, 55, 3287–3302. [Google Scholar] [CrossRef]
  3. Hoang, N.; Han, N.X. Petrochemistry of Quaternary basalts of Xuan Loc area (South Vietnam). In Geology of Cambodia, Laos, Vietnam; Geological Survey of Vietnam: Hanoi, Vietnam, 1990; Volume 2, pp. 77–88. [Google Scholar]
  4. Hoang, N.; Flower, M. Petrogenesis of Cenozoic basalts from Vietnam: Implication for origins of a ‘Diffuse igneous province’. J. Petrol. 1998, 39, 369–395. [Google Scholar] [CrossRef]
  5. Qiu, Z.; Yang, J.; Yang, Y.; Yang, S.; Li, C.; Wang, Y.; Lin, W.; Yang, X. Trace element and Hafnium isotopes of Cenozoic basalt-related zircon megacrysts at Muling, Heilongjiang province. Northeast China. Acta Pet. Sin. 2007, 23, 481–492. [Google Scholar]
  6. Izokh, A.E.; Smirnov, S.Z.; Egorova, V.V.; Anh, T.T.; Kovyazin, S.V.; Phuong, N.T.; Kalinina, V.V. The condition of formation of sapphire and zircon in the areas of alkali-basaltoid volcanism in Central Vietnam. Russ. Geol. Geophys. 2010, 51, 719–733. [Google Scholar] [CrossRef]
  7. Shigley, J.E.; Laurs, B.M.; Janse, A.J.A.; Elen, S.; Dirlam, D.M. Gem localities of the 2000s. Gems Gemol. 2010, 46, 188–216. [Google Scholar] [CrossRef]
  8. Yu, Y.; Xu, X.; Chen, X. Genesis of zircon megacrysts in Cenozoic alkali basalts and the heterogeneity of subcontinetal lithospheirc mantle, eastern China. Mineral. Petrol. 2010, 1000, 75–94. [Google Scholar] [CrossRef]
  9. Chen, T.; Ai, H.; Yang, M.; Zheng, S.; Liu, Y. Brownish red zircon from Muling, China. Gems Gemol. 2011, 47, 36–41. [Google Scholar] [CrossRef]
  10. Cong, F.; Li, S.Q.; Lin, F.C.; Shi, M.F.; Zhu, H.P.; Siebel, W.; Chen, F. Origin of Zircon Megacrysts from Cenozoic Basalts in Northeastern Cambodia: Evidence from U-Pb Age, Hf-O Isotopes, and Inclusions. J. Geol. 2016, 124, 221–234. [Google Scholar] [CrossRef]
  11. Sutherland, L.; Graham, I.; Yaxley, G.; Armstrong, R.; Giuliani, G.; Hoskin, P.; Nechaev, V.; Woodhead, J. Major zircon megacryst suites of the Indo-Pacific lithospheric margin (ZIP) and their petrogenetic and regional implications. Mineral. Petrol. 2016, 110, 399–420. [Google Scholar] [CrossRef]
  12. Zeug, M.; Nasdala, L.; Wanthanachaisaeng, B.; Balmer, W.A.; Corfu, F.; Wildner, M. Blue Zircon from Ratanakiri, Cambodia. J. Gemmol. 2018, 36, 112–132. [Google Scholar] [CrossRef]
  13. Huong, L.T.T.; Vuong, B.T.S.; Thuyet, N.T.M.; Khoi, N.N.; Somruedee, S.; Bhuwado, W.; Hofmeister, W.; Tobias, H.; Hauzenbeger, C. Geology, gemological properties and preliminary heat treatment of gem-quality zircon from the Central Highlands of Vietnam. J. Gemmol. 2016, 35, 308–318. [Google Scholar] [CrossRef]
  14. Sutherland, F.L.; Bosshart, G.; Fanning, C.M.; Hoskin, P.W.O.; Coenraads, R.R. Sapphire crystallization, age and origin, Ban Huai Sai, Laos: Age based on zircon inclusions. J. Asian Earth Sci. 2002, 20, 841–849. [Google Scholar] [CrossRef]
  15. Sutherland, F.L. Alkaline rocks and gemstones, Australia: A review and synthesis. Aust. J. Earth Sci. 1996, 43, 323–343. [Google Scholar] [CrossRef]
  16. Belousova, E.A.; Griffin, W.L.; O’Reilly, S.Y.; Fisher, N.I. Igneous zircon: Trace element composition as an indicator of source rock type. Contrib. Mineral. Petrol. 2002, 143, 602–622. [Google Scholar] [CrossRef]
  17. Garnier, V.; Ohnenstetter, D.; Giuliani, G.; Fallick, A.E.; Phan Trong, T.; Quang, V.H.; Van, L.P.; Schwarz, D. Basalt petrology, zircon ages and sapphire genesis from Dak Nong, southern Vietnam. Mineral. Mag. 2005, 69, 21–38. [Google Scholar] [CrossRef]
  18. Sutherland, F.L.; Meffre, S. Zircon megacryst ages and chemistry, from a placer, Dunedin volcanic area, eastern Otago, New Zealand. N. Z. J. Geol. Geophys. 2009, 52, 185–194. [Google Scholar] [CrossRef]
  19. Griffin, W.L.; Pearson, N.J.; Belousova, E.; Jackson, S.E.; Van Achterbergh, E.; O’Reilly, S.R.; Shee, S.Y. The Hf isotope composition of cratonic mantle: LAM-MC-ICPMS analysis of zircon megacrysts in kimberlites. Geochim. Cosmochim. Acta 2000, 64, 133–147. [Google Scholar] [CrossRef]
  20. Visonà, D.; Caironi, V.; Carraro, A.; Dallai, L.; Fioretti, A.M.; Fanning, M. Zircon megacrysts from basalts of the Venetian Volcanic Province (NE Italy): U-Pb ages, oxygen isotopes and REE data. Lithos 2007, 94, 168–180. [Google Scholar] [CrossRef]
  21. Upton, B.G.J.; Hinton, R.W.; Aspen, P.; Finch, A.; Valley, J.W. Megacrysts and associated xenoliths: Evidence for migration of geochemically enriched melts in the upper mantle beneath Scotland. J. Petrol. 1999, 40, 935–956. [Google Scholar] [CrossRef]
  22. Piilonen, P.C.; Sutherland, F.L.; Danisik, M.; Poirier, G.; Valley, J.W.; Rowe, R. Zircon xenocryst from Cenozoic Alkaline Basalts of the Ratanakiri Volcanic Province (Cambodia), Southeast Asia—Trace Element Geochemistry, O-Hf Isotopic Composition, U-Pb and (U-Th)/He Geochronology—Revelations into the Underlyi Lithospheric Mantle. Minerals 2018, 8, 556. [Google Scholar] [CrossRef]
  23. Whitney, D.L.; Evans, B.W. Abbreviations for names of rock-forming minerals. Am. Mineral. 2010, 95, 185–187. [Google Scholar] [CrossRef]
  24. Osanai, Y.; Nakano, N.; Owada, M.; Nam, T.N.; Miyamoto, T.; Minh, N.T.; Nam, N.V.; Tri, T.V. Collision zone metamorphism in Vietnam and adjacent South-eastern Asia: Proposition for Trans Vietnam Orogenic Belt. J. Mineral. Petrol. Sci. 2008, 103, 226–241. [Google Scholar] [CrossRef]
  25. Hutchison, C.S. Geological Evolution of Southeast Asia. Oxf. Monogr. Geol. Geophys. 1989, 13, 368. [Google Scholar]
  26. Barr, S.M.; Macdonald, A.S. Geochemistry and geochronology of late Cenozoic basalts of Southeast Asia. Bull. Geol. Soc. Am. 1981, 92, 1069–1142. [Google Scholar] [CrossRef]
  27. Rangin, C.; Huchon, P.; Le Pichon, X.; Bellon, H.; Lepvrier, C.; Roques, D.; Hoe, N.D.; Quynh, P.V. Cenozoic deformation of central and south. Tectonophysics 1995, 251, 179–196. [Google Scholar] [CrossRef]
  28. Hoang, N.; Flower, M.F.J.; Carlson, R.W. Major, trace element, and isotopic compositions of Vietnamese basalts: Interaction of enriched mobile asthenosphere with the continental lithosphere. Geochim. Cosmochim. Acta 1996, 60, 4329–4351. [Google Scholar] [CrossRef]
  29. Lenz, C.; Nasdala, L.; Talla, D.; Hauzenberger, C.; Seitz, R.; Kolitsch, U. Laser-induced REE3+ photoluminescence of selected accessory minerals—An “advantageous artefact” in Raman spectroscopy. Chem. Geol. 2015, 415, 1–16. [Google Scholar] [CrossRef]
  30. Adachi, T.; Osanai, Y.; Nakano, N.; Owada, M. La-ICP-MS U-Pb zircon and FE-EPMA U-Th-Pb monazite dating of pelitic granulites from the Mt. Ukidake area, Sefuri Mountains, northern Kyushu. J. Geol. Soc. Jpn. 2012, 118, 29–52. [Google Scholar]
  31. Black, L.P.; Kamo, S.L.; Allen, C.M.; Aleinikoff, J.N.; Davis, D.W.; Korsh, R.J.; Foudoulis, C. TEMORA1: A new zircon standard for Phanerozoic U-Pb geochronology. Chem. Geol. 2003, 200, 155–170. [Google Scholar] [CrossRef]
  32. Paces, J.P.; Miller, J.D.J. U-Pb ages of Duluth Complex and related mafic intrusions, northeastern Minnesota: Geochronological insights to physical, petrogenetic, paleomagnetic, and tectonomagmatic processes associated with the 1.1 Ga midcontinent rift system. J. Geophys. Res. 1993, 98, 13997–14013. [Google Scholar] [CrossRef]
  33. Griffin, W.L.; Powell, W.J.; Pearson, N.J.; O’Reilly, S.Y. GLITTER: Data reduction software for laser ablation ICP-MS. Mineral. Assoc. Can. Short Course 2008, 40, 308–311. [Google Scholar]
  34. Ludwig, K.R. User’s Mnual for Isoplot 3.70: A geochronological toolkit for Microsoft Excel. Berkeley Geochronl. Cent. Spec. Publ. 2008, 4, 1–77. [Google Scholar]
  35. Nakano, N.; Osanai, Y.; Adachi, T. Major and trace element zoning of euhedral garnet in high-grade (>900 °C) mafic granulite from the Song Ma Suture zone, northern Vietnam. J. Mineral. Petrol. Sci. 2010, 105, 268–273. [Google Scholar] [CrossRef]
  36. Elhlou, S.; Belousova, E.; Griffin, W.L.; Pearson, N.J.; O’Reilly, S.Y. Trace element and isotopic composition of GJ-red zircon standard by laser ablation. Geochim. Cosmochim. Acta Suppl. 2006, 70, A158. [Google Scholar] [CrossRef]
  37. Jackson, S.E.; Longerich, H.P.; Dunning, G.R.; Freyer, B.J. The application of laser-ablation microprobe; inductively coupled plasma-mass spectrometry (LAM-ICP-MS) to in situ trace-element determinations in minerals. Can. Mineral. 1992, 30, 1049–1064. [Google Scholar]
  38. Andersen, T. Correction of common lead in U-Pb analyses that do not report 204Pb. Chem. Geol. 2002, 192, 59–76. [Google Scholar] [CrossRef]
  39. Stacey, J.S.; Kramers, J.D. Approximation of terrestrial lead isotope evolution by a two-stage model. Earth Planet. Sci. Lett. 1975, 26, 207–221. [Google Scholar] [CrossRef]
  40. Lenz, C.; Nasdala, L. A photoluminescence study of REE3+ emissions in radiation-damaged zircon. Am. Mineral. 2015, 100, 1123–1133. [Google Scholar] [CrossRef]
  41. Shnukov, S.E.; Andreev, A.V.; Savenok, S.P. Admixture Elements in Zircons and Apatites: A Tool for Provenance Studies of Terrigenous Sedimentary Rocks; European Union of Geosciences (EUG 9): Strasbourg, France, 1997; Volume 65. [Google Scholar]
  42. Sun, S.S.; McDonough, W.F. Chemical and isotopic systematics of oceanic basalts: Implications for mantle composition and processes. Geol. Soc. Lond. 1989, 42, 313–345. [Google Scholar] [CrossRef]
  43. Snyder, G.A.; Taylor, L.A.; Crozaz, G. Rare earth element selenochemistry of immiscible liquids and zircon at Apollo 14: An iron probe study of evolved rocks on the Moon. Geochim. Cosmochim. Acta 1993, 57, 1143–1149. [Google Scholar] [CrossRef]
  44. Li, X.H.; Liang, X.R.; Sun, M.; Liu, Y.; Tu, X.L. Geochronology and geochemistry of single-grain zircons: Simultaneous in-situ analysis of U-Pb age and trace elements by LAM-ICP-MS. Eur. J. Mineral. 2000, 12, 1015–1024. [Google Scholar] [CrossRef]
  45. Borghini, G.; Fumagalli, P.; Rampone, E. The stability of plagioclase in the upper mantle: Subsolidus experiments on fertile and depleted lherzolite. J. Petrol. 2010, 51, 229–254. [Google Scholar] [CrossRef]
  46. Belousova, E.A.; Griffin, W.L.; Pearson, N.J. Trace element composition and cathodoluminescence properties of southern African kimberlitic zircon. Mineral. Mag. 1998, 62, 355–366. [Google Scholar] [CrossRef]
  47. Hoskin, P.W.O. Minor and trace element analysis of natural zircon (ZrSiO4) by SIMS and laser ablation ICPMS: A consideration and comparison of two broadly competitive techniques. J. Trace Microprobe Tech. 1998, 16, 301–326. [Google Scholar]
  48. Pupin, J.P. Granite genesis related to geodynamics from Hf-Y in zircon. Trans. R. Soc. Edinb. Earth Sci. 2000, 91, 245–256. [Google Scholar] [CrossRef]
  49. Saava, E.V.; Belyatsky, B.V.; Antonov, A.B. Carbonatitic Zircon-Myth or Reality: Mineralogical-Geochemical Analyses. Available online: http://alkaline09.narod.ru/abstracts/Savva_Belyatsky.htm (accessed on 30 December 2018).
  50. Campbell, L.S.; Compston, W.; Sircombe, K.N.; Wilkinson, C.C. Zircon from the East Orebody of the Bayan Obo Fe-Nb-REE deposit, China, and SHRIMP ages for carbonatite-related magmatism and REE mineralization events. Contrib. Mineral. Petrol. 2014, 168, 1041. [Google Scholar] [CrossRef]
  51. Foley, S.F.; Yaxley, G.M.; Rosenthal, A.; Buhre, S.; Kiseeva, E.S.; Rapp, R.P.; Jacob, D.E. The composition of near-solidus melts of peridotite in the presence of CO2 and H2O between 40 and 60 kbar. Lithos 2009, 112, 274–283. [Google Scholar] [CrossRef]
  52. Le Bas, M.J. Carbonatite magmas. Mineral. Mag. 1981, 44, 133–140. [Google Scholar] [CrossRef]
  53. Baldwin, L.C.; Tomaschek, F.; Ballhaus, C.; Gerdes, A.; Fonseca, R.O.C.; Wirth, R.; Geisler, T.; Nagel, T. Petrogeneis of alkaline basalt-hosted sapphires megacrysts. Petrological and geochemical investigations of in situ sapphire occurrences from the Siebengebirge volcanic field Western Germany. Contrib. Mineral. Petrol. 2017, 172, 43. [Google Scholar] [CrossRef]
  54. Chi, N.T.; Flower Martin, J.F.; Hung, D.T. Carbonatites in Phong Tho, Lai Chau Province, north–west Vietnam: Their petrogenesis and relationship with Cenozoic potassic alkaline magmatism. In Proceedings of the 33rd International Geological Congress, Oslo, Norway, 6–14 August 2008; pp. 1–45. [Google Scholar]
  55. Thi, T.N.; Wada, H.; Ishikawa, T.; Shimano, T. Geochemistry and petrogenesis of carbonatites from South Nam Xe, Lai Chau area, northwest Vietnam. Mineral. Petrol. 2014, 108, 371–390. [Google Scholar]
  56. Geisler, T.; Schaltegger, U.; Tomaschek, F. Re-equilibration of zircon in aqueous fluids and melts. Elements 2007, 3, 43–50. [Google Scholar] [CrossRef]
  57. Cherniak, D.J.; Watson, E.B. Pb diffusion in zircon. Chem. Geol. 2000, 172, 5–24. [Google Scholar] [CrossRef]
  58. Lewerentz, A. Experimental Zircon Alteration and Baddeleyite Formation in Silica Saturated Systems: Implications for Dating Hydrothermal Events. Master’s Thesis, Lund University, Lund, Sweden, 2011. [Google Scholar]
Figure 1. (A) Location of various alluvial zircon deposits in Cambodia and Vietnam within South-East Asia [12,24]. (B) Distribution of Neogene and Quaternary basalts with their K-Ar and Ar-Ar ages (after [4,6]). Reproduced with permission from all authors. Green circles indicate the sampling localities.
Minerals 09 00089 g001
Figure 2. (A) Typical large, gem-quality, cut zircon samples from the Central Highlands are available on the gem market. (B) Selected zircon megacrysts used in this study from the same region. Samples C05, C07, and C16 are from the Buon Ma Thuot and Xuan Loc alkali-basaltic field. Samples DL1, DL2, and DL3 (not shown) are from deposits in the Dak Lak alkali-basaltic field (Figure 1B).
Minerals 09 00089 g002
Figure 3. Representative inclusions found in placer zircon megacrysts: (A) fluid inclusions (LH2O: aqueous H2O VCO2 and VO2: vapor CO2 and O2, respectively); (B) Calcite (Cal); (C) hematite (Hem); (D) baddeleyite (Bdy) within tubular channels; (E) quartz (Qz) within tubular channels; (F) hematite and fluid (Hem + Fld) within bifurcating cavities and vesicles; (G) baddeleyite (Bdy) in tubular channels, bifurcating cavities, and vesicles; (H) corundum (Crn); and (I) calcite (cal) inclusion groups and along chains.
Minerals 09 00089 g003
Figure 4. Cathodoluminescence images of the selected zircon samples from the Central Highlands, resemble zircon internal textural features that are typical for zircon of magmatic growth, e.g., oscillatory, sector, and growth zoning. Note, however, that whitish striations (indicated by black arrows) in CL contrasts obtained in the images of samples C01, C07, and F01 are due to mechanically-induced structural defect centers emanating from cracks and break-outs during polishing.
Minerals 09 00089 g004
Figure 5. Laser-induced photoluminescence hyperspectral images of zircon samples from the Central Highlands (C16 and DL3) and from Ratanakiri, Cambodia (Rata). The integrated intensity of the Dy3+ (4F9/26H13/2) emission (compare Figure 6) is the plotted spectral parameter (grey-scale). Trace-element concentrations of Dy from multiple LA-ICP-MS spots on the grains, were used for external calibration to correlate the Dy concentrations with its PL response. Concentrations given color-coded were back-calculated using the latter correlation (see Figure 6) to extrapolate the Dy distribution in regions of unknown trace-element chemistry. Besides oscillatory and sector zoning, several growth zones may be distinguished that were interpreted to result from resorption and re-growth events, as indicated by the cross-cut zonation patterns, abruptly changing (decreasing) Dy concentrations, and the appearance of large holes and cavities (see arrows).
Minerals 09 00089 g005
Figure 6. (A) Laser-induced PL spectra (laser-excitation wavelength λexc = 473 nm) obtained from three different measurement spots on the zircon sample DL3 (spots 4, 5, and 7; Figure 5). (B) The integrated intensity of the most intensive emission of Dy3+ in the spectral range 17,000–17,450 cm−1 (see dotted lines in sub-image (A)) from multiple spots on samples DL3, C16, and Rata plotted against the Dy trace-element concentration as obtained from LA-ICP-MS (Table S1). Linear regression from the data pairs PL vs. Dy conc. (R2 = 0.95) was used to calibrate hyperspectral maps presented in Figure 5.
Minerals 09 00089 g006
Figure 7. Chondrite-normalized plot of REE concentrations of zircon samples from the Central Highlands compared to samples from Ratanakiri, Cambodia. REE composition of C1 chondrite is described by Sun and McDonough [42]. All samples showed a steep slope rise from La to Lu, towards heavy REEs. A positive pronounced Ce-anomaly, but no Eu-anomaly was detected.
Minerals 09 00089 g007
Figure 8. Compositional discrimination diagrams using trace-element concentrations of the studied samples obtained by LA-ICP-MS [16]: Ce/Ce* vs. Eu/Eu* (A); U vs. Th (B); Y vs. U (C); and Hf vs. Y (D) [41].
Minerals 09 00089 g008
Figure 9. Summary of U-Pb geochronology data obtained by LA-ICP-MS (see details in Tables S2 and S3). (A) Representative concordia plots of samples C05, C07, and C16. Ellipses give a 2σ error, and red ellipses correspond to measurement spots placed in the core region of single crystals. (B) 206Pb/238U ages of the samples analyzed with the mean weighted age given for each sample. Error bars represent 2σ. Note that the ages obtained do not differ systematically amongst the measurement spots placed in the different growth zones within the individual samples. Two distinct sample populations were clearly differentiated (ca. 6.5 Ma and ca. 1 Ma).
Minerals 09 00089 g009

