Abstract
In this study, heavy mineral analysis was carried out in different size fractions of the Yellow River sediment to extract its end-members. It shows that heavy mineral contents, species, and compositions vary in different grain sizes. Distribution curve of heavy mineral concentration (HMC) and particle size frequency curve are in normal distribution. In most samples, the size fraction of 4.5–5.0 Φ contains the maximum HMC (18% on average). Heavy mineral assemblages of the Yellow River are featured by amphibole + epidote + limonite + garnet. Amphibole content is high in coarse fraction of >3.0 Φ and reaches its peak value in 3.5–4.5 Φ. Epidote is rich in a size fraction of >3.5 Φ, and increase as the particle size becomes fine. Micas content is high in coarse subsamples of <3.0 Φ, but almost absent in fine grains of >4.0 Φ. Metallic minerals (magnetite, ilmenite, hematite, and limonite) increase as the sediment particle size become fine, and reach the peak in silt (>4.0 Φ). Other minerals such as zircon, rutile, tourmaline, garnet, and apatite account for about 15%, and mainly concentrate in fine sediment. Further analysis reveals that similarity value between the most abundant grain size group and wide window grain size group is high (0.978 on average). The grain size of 4.0–5.0 Φ ± 0.5 Φ is suitable to carry out detrital mineral analysis in the Yellow River sediments. Our study helps to eliminate cognitive bias due to narrow grain size strategy, and to provide heavy mineral end-members of the Yellow River sediment for provenance discrimination in the marginal seas of East China.
1. Introduction
The Yellow River, characterized by high suspended sediment concentration (SSC), significantly influences the sedimentary process in the East China Margin Sea, especially the Bohai Sea and the Yellow Sea [1,2]. Hydrologic observation data shows that the Yellow River brings 160 million tons of sediments into the East China Sea every year, constructing the mega delta system [3,4]. Serving as ideal archives, the deltaic area and the marginal seas of East China preserve valuable geographical information on tectonic movement, river evolution, climate change, and earth surface recycling, which are research hotspots of sediment source-to-sink studies in recent years [5,6,7,8,9,10]. However, this study area has extensive sediment sources, not only from the Yellow River and Yangtze River, but also from other rivers including the Liaohe River, Haihe River, Yalujiang River, Huaihe River, Taedong River, Han River, and Qiantangjiang River. These multi-member sediment sources mix by coastal currents and tides, and deposit in the boundary zone of the Yellow Sea and the East China Sea. In order to understand the sediment dispersal patterns, sea level change, stratigraphic correlation, and the Yellow Sea basin evolution, it is important to identify the Yellow River sediment end-members [11,12,13,14].
In order to carry out source identification effectively, it is necessary to analyze the distribution of detrital heavy minerals in different grain sizes of the Yellow River sediments. These analyses help to fully understand the mineralogical characteristics of modern Yellow River sediments, and to establish end-member minerals. As a traditional provenance study method, heavy mineral analysis is widely used to extract natural signals of rock structure, parent rock types, weathering condition, transportation process, and secondary alteration [15,16,17,18,19,20]. In this traditional method, very fine sand (0.125–0.063 mm or 3.0–4.0 Φ) is selected to carry out mineral identification. If the sediment is coarse, the grain size of 0.25–0.125 mm (2.0–3.0 Φ) is substituted. There are two reasons why size fractions of 0.25–0.063 mm are commonly used. Firstly, these two fractions are the basic composition of most terrestrial sediments. Secondly, these fractions are rich in heavy minerals and are easy to be observed. In coarse grains (>0.25 mm), minerals are difficult to distinguish because transparency of sediment grains decreases by the mixture of rock debris. For small grains (<0.063 mm), minerals are also difficult to identify as they are susceptible to static electricity, humidity, adhesion, etc. [21]. This traditional method is available for sediment samples whose main composition is very fine sand. However, the result based on this narrow size stratagem may cause biased explanations on sediment dynamics, provenance characteristics, and weathering conditions [21,22,23,24]. In recent years, more and more heavy mineral analysis is carried out by “multiple-window stratagem” to extract more provenance information [24,25].
For the Yellow River sediments, they are dominated by silt [26,27]. Traditional heavy mineral analysis on very fine fraction cannot represent its mineral characteristics. So, for these fine sediments, the question is how to establish its end-member minerals? It is necessary to conduct systematical analysis on typical samples. In this study, we first use multi-window stratagem to analyze detrital heavy mineral characteristics of the Yellow River sediment. Then, we analyze intrasample and intersample variability of heavy minerals in different grain sizes. Finally, the end-member minerals of the Yellow River sediment are revealed by similarity analysis.
2. Regional Setting on Yellow River Sediment
Well known for the maximum SSC in the world, the Yellow River originates from the northern slope of the Bayan Har Mountains in Qinghai, and flows through Qinghai-Tibet Plateau, Chinese Loess Plateau, North China Plain, and finally flows into the Bohai Sea (Figure 1). With a length of about 5464 km, its drainage area is about 75.2 × 10⁴ km2.
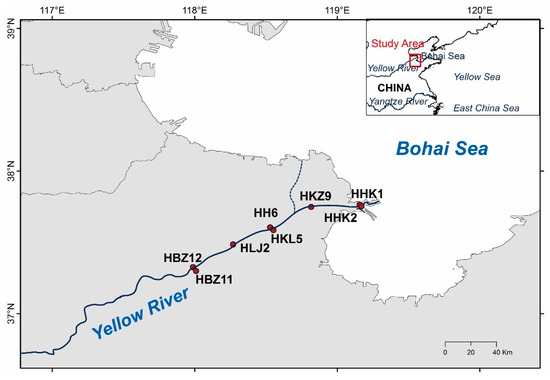
Figure 1.
Sediment sampling locations of the Yellow River estuary.
The upper reaches of the Yellow River are lake basins with mountains and valleys. The Carboniferous, Permian, Triassic sedimentary, and sporadic Cretaceous sedimentary rocks, metamorphic rocks, and granite exist in these areas. The middle reaches account for two thirds of the total area of the Yellow River basin, and are characterized by 100–200 m thick loess and a few Triassic and Cretaceous sandy clastic rocks [27,28]. Due to its loose soil and scarce vegetation, the loess is highly vulnerable to erosion. In this area, serious soil erosion causes high SSC (>34 kg/m3). Statistics show that these areas yield more than 90% of sediment of the Yellow River. The lower reaches extend in the North China Plain and only have a drainage area of 2.3 × 10⁴ km2. Due to sediment increase and river gradient decrease, sediment accumulation is obvious in the watercourse [29].
Sediment sources of the Yellow River are mainly derived from loess, sedimentary rocks, and few from magmatic and metamorphic rock [30]. Specifically, the Yellow River sediments are mainly from the Malan loess with young age, and only a few from the old loess and the underlying rock debris [31,32,33]. Under different hydrodynamics, all of these sediment sources mix and deposit into different particle sizes [34,35]. Previous studies found that the loess mainly consists of sandy silt (with fine sand), in which clay minerals account for 20–30% [27]. In the size fraction of 0.25–0.01 mm, heavy mineral content takes up 5–9%, and clastic minerals are dominated by quartz and feldspar (quartz, feldspar, micas, amphibole, pyroxene, tourmaline, and epidote is about 70%) [36,37,38].
3. Materials and Methods
The Yellow River sediment samples were collected from the floodplains at Binzhou, Lijin, and Kenli (Figure 1). The river sediments were sampled from the point bar, riverbed, floodplain of the watercourse, and marsh of the outside of watercourse. Every surface sample was collected from the surface layer after removing the top mud, and each sampling window was 20 cm × 20 cm and about 10 cm deep. Surficial sediment samples included different grain sizes, from silty sand to muddy silt. Bioclastic and organic content was low in every sample. Specific sampling locations are labeled in Figure 1.
For each sample, 300–500 g dry sediments were put into 10% sodium hexametaphosphate solution, and stirred evenly. For some fine sediment samples whose clay content was high, the ultrasonic dispersion was used to completely separate the detrital minerals from the clay [39]. After soaking for 24–36 h, the detrital fraction of different grain sizes was obtained by wet-sieving. Firstly, sediment samples were divided into two parts by sieve of 0.031 mm (5.0 Φ). Then, the coarse fraction part of >0.031 mm was separated through wet-sieving again to obtain multiple subsamples of 5.0–4.5, 4.5–4.0, 4.0–3.5, 3.5–3.0, 3.0–2.5, 2.5–2.0 and <2.0 Φ by using different sieves. The fine size part of silt and clay was separated by sedimentation method and was divided into six subsamples of 5.0–6.0, 6.0–7.0, 7.0–8.0, 8.0–9.0, 9.0–10.0 and >10.0 Φ, respectively (at 1.0 Φ interval). After wet-sieving, all subsamples were dried and weighed to calculate particle size parameters. When finished grain size analysis, about a 2 g sub-sample was put into bromoform (CHBr3, 2.89 g/cm3) to conduct light and heavy mineral separation.
A total of 8 × 8 subsamples were carried by heavy mineral identification. The heavy mineral separation was carried out by gravity, but the subsamples of 4.5–5.0 and 5.0–6.0 Φ were separated by centrifugal machine. Separation of the fraction of >6.0 Φ was not carried out, because these fine grains were difficult to identify by artificial identification. After separation, the heavy and light minerals were weighed separately, and their contents were calculated. Mineral crystal morphology, surface characteristics, color, striation, and magnetism were analyzed under a stereoscopic microscope, and refractive index, interference color, and optic angle, etc. were observed by oil immersion method under a polarizing microscope. Based on the above optical properties and parameters, mineral classification was determined. As a few transparent minerals were difficult to identify, micro chemical analysis of energy disperse spectroscopy and scanning electron microscopy assisted identification. For a coarse fraction of >0.063 mm, 300–400 grains were counted; 500–800 grains for fine size of <0.063 mm. Concentration of every heavy mineral was presented as grain percentage in total heavy mineral fraction [40].
4. Results
4.1. Sediment Particle Size Characteristics
Grain size analysis shows that sediments of the Yellow River estuarine were mainly fine silt and clay. The mean grain size of most samples ranged from 3.5 to 5.5 Φ. Size frequency curve of these samples presented a positive-skewed distribution [41]; most kurtosis curves were single peak with a moderate to sharp shape; standard deviation ranged from 0.3 to 1.3 (Table 1). A few samples, which were located near the river mouth, were exceptions (Figure 2). These sediments were clayed silt and their size frequency curves were double peak (Table 1).

Table 1.
Grain size parameter of the Yellow River sediments.
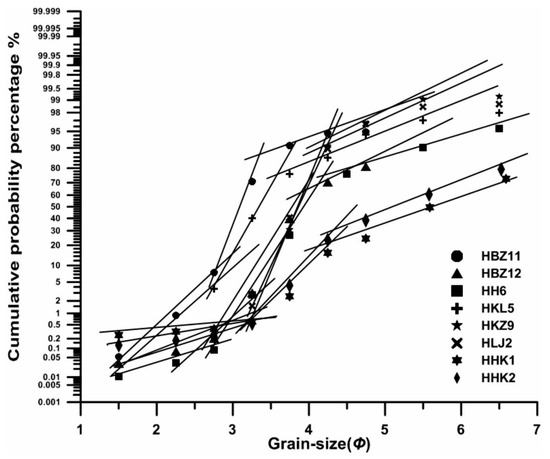
Figure 2.
Grain-size probability cumulative curve of the Yellow River sediment.
Grain-size probability cumulative curve showed trilinear distribution reflecting hydraulic balance (Figure 2). Further analysis suggests that these sediments mainly consisted of saltation load fraction, with an average proportion of about 72%. Moreover, suspended load accounted for 27%, and bed load was only approximately 1%. Grains size boundary of most of the suspended load and saltation load was at about 4.5 Φ. In these samples, the wide grain size window (<6.0 Φ) took up 99.05–63.67% of the total sediment (89.11% on average); however, the frequently-used fraction of 3.0–4.0 Φ accounted for 83.46–2.14% (39.22% on average).
4.2. Heavy Mineral Concentration of Different Grain Sizes
At 0.5 Φ interval, every Yellow River sediment sample was divided into seven to eight subsamples with different grain sizes, for which the finest size was 6.0 Φ (0.016 mm). The results show that heavy mineral parameters had both intrasample similarity and difference in subsamples (Table 2, Figure 3). Heavy mineral concentration (HMC), species, and composition varied in different grain sizes. HMC of the Yellow River sediments was moderately rich. In the very fine sand fraction (3.0–4.0 Φ), HMC ranged from 0.4% to 5%; in the mode particle group (the most abundant), HMC was between 0.3% and 6%; in the multiple-window grain size (1.5–6.0 Φ), HMC was from 0.2% to 7%.
Table 2.
Variability of heavy mineral composition in typical grain sizes of Yellow River sediments (%). GSC—grain size composition; WG—wide-window grain size group; MG—mode particle group (the most abundant); SG—secondary grain fraction; CG—commonly-used grain size; HMC—heavy mineral concentration; HMS—heavy mineral species; Amp—hornblende + tremolite + actinolite; Ep—epidote + zoisite + clinozoisite; Micas—muscovite + biotite + hydrobiotite; SM—zircon + tourmaline + rutile + garnet + apatite; FeM—ilmenite + magnetite + limonite + hematite; two values are given in the wide-window grain size group (WG): content in the bulk sample and content in heavy minerals.
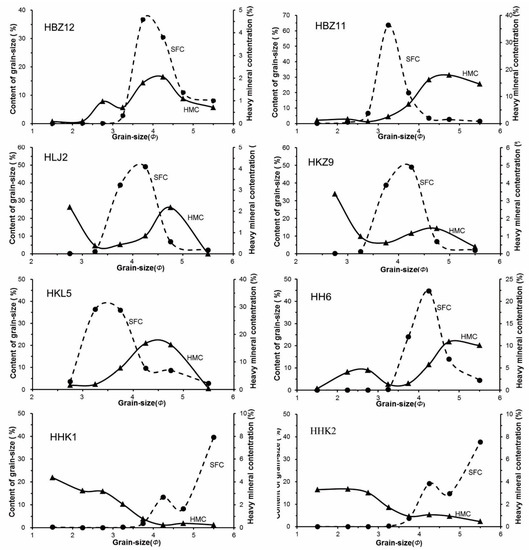
Figure 3.
Variability of heavy mineral concentration in different grain sizes of the Yellow River sediment. SFC—particle size frequency curve; HMC—heavy mineral concentration.
Generally speaking, samples whose mean grain size was coarse and the mode particle group was 3.0–4.0 Φ (e.g, HZB11, HKL5), were enriched in HMC (Table 2, Figure 3). In the wide grain size, HMC of these coarse samples (e.g., HZB11, HKL5) ranged from 4% to 7%, 3–30 times higher than the other six samples whose mode particle group was silt. According to HMC of the same grain size in different Yellow River sediments, HMC was the highest in the fraction of coarse silt (Figure 3).
For different grain size classes, the HMC distribution curve and particle size frequency curve were similar in normal distribution (Figure 2), but these two curves had a phase difference. In most samples, the fraction of 4.5–5.0 Φ (e.g., high up to 18% in HBZ11) contained the maximum HMC; 4.0–4.5 Φ was in secondary place and accounted for 17%. The difference in HMC appeared obvious in both the coarse fraction (3.0 Φ) and fine grains of <5.0 Φ; and the fractions of 3.0–5.0 Φ were rich in HMC.
4.3. Heavy Mineral Species Distribution in Different Grain Sizes
The heavy mineral analysis shows that more than 20 types of heavy minerals were present in different size fractions of the Yellow River sediment. In the same sample, wide grain size fractions contained more heavy mineral types than the single grain size fraction; the coarse size classes had fewer types than the fine one (Table 2). About 30 different minerals were found in most Yellow River sediments, including hornblende, micas, tremolite, actinolite, epidote, zoisite, clinozoisite, muscovite, chlorite, garnet, sphene, apatite, tourmaline, zircon, fluorite, rutile, augite, diopside, hypersthene, sillimanite, magnesite, ilmenite, magnetite, limonite, hematite, etc.
Micas content was high in coarse fraction of <3.0 Φ (Figure 4). However, it was almost absent in fine grains of >4.0 Φ, which caused micas content to be low in the wide 0.016–0.35 mm size window (Table 2).
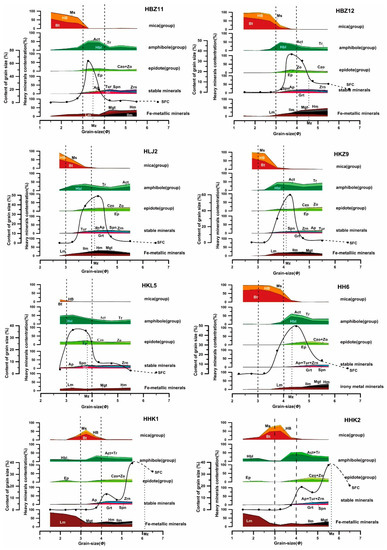
Figure 4.
Sediment-size frequency distribution of the Yellow River and its heavy mineral distribution in different grain sizes. SFC—particle size frequency curve; Amp—hornblende; Tr—tremolite; Act—actinolite; Ep—epidote; Zo—zoisite; Czo—clinozoisite; Ms—muscovite; Bt—biotite; HB—hydrobiotite; Zrn—zircon; Tur—tourmaline; Grt—garnet; Ap—apatite; Spn—sphene; Ilm—ilmenite; Mag—magnetite; Lm—limonite; Hem—hematite.
The amphibole group (hornblende, tremolite, actinolite) and epidote group (epidote, zoisite, clinozoisite) distributed widely in most grain size fractions (Figure 4). Amphibole content was high in the coarse fraction (>3.0 Φ), and reached its peak value in 3.5–4.5 Φ. Epidote was rich in content in the fine fraction of >3.5 Φ, and its content increased as the particle size became fine.
Metallic minerals (magnetite, ilmenite, hematite, and limonite) content increased as the particle size became small, and reached the peak in the silt fraction (>4.0 Φ). However, limonite had a little difference, and its content was high when the sediment samples were fine (mean grain size >5 Φ).
Other minerals of zircon, rutile, tourmaline, garnet, apatite, etc. accounted for around 15%, and increased slowly as the particle size became fine (Figure 4). Garnet content was obviously higher in 3.5–4.0 Φ than that of the grain size of 3.0–3.5 Φ. Zircon was most abundant in the 4.0–4.5Φ fraction.
Heavy mineral differentiation in diverse grain size fractions brought different mineral assemblages in the same sample (Figure 4). Heavy mineral assemblages of coarse grains (<4.0 Φ) were micas + amphibole, and the diagnostic mineral was limonite. In fine sediment samples (>4.0 Φ), the assemblages were amphibole + limonite + epidote, and the diagnostic mineral was garnet.
4.4. Heavy Mineral Indices in Different Grain Size Fractions
Heavy mineral indices, such as ZTR (zircon% + tourmaline% + rutile%) and GZi, (garnet%/(garnet% + zircon%) × 100) are widely used in the study of ancient sandstones. They are useful as most heavy minerals are strongly depleted and commonly limited to a few durable species only [19,42,43]. GZi can be used to identify parent rock composition and also to reveal the stability of garnet in ancient sediment [44]. ZTR represents the maturity of heavy minerals, and the larger the index, the higher the maturity. In order to promote provenance research of the Yellow River, ZTR, SM/UM (stable minerals/unstable minerals), and GZi, of the modern sediment, is listed in Table 3.
Table 3.
Heavy mineral index of the Yellow River sample in different grain size fractions. Note: SM (stable minerals): zircon, rutile, tourmaline, apatite, and garnet; UM (unstable minerals): amphibole, pyroxene and biotite.
Table 3 shows that the SM/UM and ZTR increased as the grain size became fine in the same sample. On the contrary, GZi increased as grain size became coarse. For different sediment samples, these indices exhibited similar variation tendency.
4.5. Similarity Analysis of Heavy Mineral Characteristics in the Yellow River Sediments
As a crucial mean of data analysis and excavation, the similarity plays an important role in confirming relationships between complex samples. Common-used computing methods of similarity include Euclidean distance, correlation coefficient, and cosine of the angle [45]. In our study, we used cosine of the angle of each vector (cosθ) to calculate sample similarity.
The calculation equation is as follows:
where the cosθ is the similarity value of sample i and sample j; Xik is the measured value of index k in sample i; Xjk is the measured value of index k in sample j; n is the index number.
The cosine of the angle treats multiple indicators of each sample as vectors in a multi-dimensional space. The similarity of the two samples is; therefore, transformed into the similarity of the two vectors in the multi-dimensional space. Similarity values range between 0–1. The closer the cosθ value gets to 1, the more similar the two vectors become. The calculation results of this study are shown in Table 4.
Table 4.
Heavy mineral similarity of the Yellow River samples between different grain size fractions. WG—wide-window grain size group; MG—mode particle group (the most abundant); SG—secondary grain fraction; CG—commonly-used grain size.
In the Yellow River sediment, the heavy mineral similarity values between the mode particle group and the wide-window grain size group was generally high and ranged from 0.898 to 0.995 (0.959 on average). Analogously, the similarity value between the secondary grain fraction and the wide-window grain size group ranged from 0.895 to 0.986 (0.957 on average).
In order to investigate the intersample relevance, we also made similarity analysis among different samples of the Yellow River. As per the results listed in Table 5, heavy mineral similarity values of all samples were high, ranging from 0.852 to 0.978. This reflects that the heavy mineral characteristics of different Yellow River samples were similar. The similarity between HBZ11 and HH6 was as high as 0.978, although these two samples differed in sediment size, mineral composition, etc. (Figure 2 and Figure 3). By comparison, coarse samples and fine samples showed less similarity. For example, the similarity between HBZ11 and HHK1 was only 0.852.
Table 5.
The intersample similarity of heavy mineral features in the Yellow River sediments.
5. Discussions
5.1. Heavy Mineral Distribution in the Yellow River Sediments
Heavy mineral distribution of the Yellow River sediment ranged from 0.2% to 7% (2% on average). It was similar with other world-famous rivers such as the Brahmaputra River, Indus, Yangtze, Irrawaddy, Amazon etc. [46,47,48,49], which reflects a common feature of river sediment sources from terrigenous detritus.
The heavy mineral assemblages of the Yellow River were amphibole, epidote, limonite, and garnet (Figure 3). Amphibole dominated, and accounted for about 30% in the wide-window grain size group. However, for the commonly-used grain size of 3.0–4.0 Φ, its content reached up to >40% in most samples (Figure 3). Therefore, amphibole content of 3.0–4.0 Φ could not reflect the characteristics of the bulk sample. Garnet was one of the diagnostic minerals in the Yellow River sediments, and accounted for 7% on average. Its wide distribution in different grain sizes reflects its parent rocks. A previous study showed that more than 90% of the sediments of the Yellow River were from its middle reaches [50]. In the middle reaches, garnet was in abundance and its maximum content reached up to 60%, which indicates its parent rocks are from the Mesozoic clastic deposits [27,32]. Besides, limonite was widely distributed and its content ranged from 11% to 16%. Due to its high content, the iron stain caused the sediment to turn yellow.
Micas were common heavy minerals in the Yellow River sediment. The previous studies suggested that mica was one kind of diagnostic heavy mineral with a high content of >40% [28,51]. However, our results showed that micas of the wide-window grain size group (>0.016 mm) were in low average concentration of 3%, ranging from 1% to 7%. This is because micas in fine sediment of >4.0 Φ were less than 5% (Table 2, Figure 3). But coarse sediment of >4.0 Φ contained more micas (ca. 30%). Thus, it may be a mistake to conclude that the micas content in the bulk sample was high based on the data of the common-used grain size (3.0–4.0 Φ). The reason why micas content was high in the coarse fraction of <3.0 Φ but almost absent in fine grains of >4.0 Φ is discussed below.
5.2. Variation of Heavy Mineral Distribution in Multiple-Window Grains
Heavy mineral distribution in detrital sediment is determined by several factors including parent rock types, primary mineral crystal size, mineral fragmentation, mineral density, and hydraulic sorting, etc. [28,52,53]. The dynamic differentiation of mineral particles is affected by settling velocity of particles, which is generally related to particle size, specific gravity, shape, and the properties of the water medium [24,25]. The relationship between these factors can be expressed by the Stokes’ equation, which is modified by Komar and Reimers [54]:
where V is the settling velocity of particles (mm/s), K is the correction coefficient of particle morphology, γ1 is the density of the particle grain, γ2 is the density of the medium, D is the particle diameter, g is the gravitational acceleration (mm/s2), and µ is the viscosity of the medium (g/mm·s).
In this equation, particle size (D) is the main variable, and D2 is proportional to the settling velocity (V). Therefore, the grain size is the primary factor to determine the settling velocity of mineral grains. To be specific, the particle size changes with hydrodynamic intensity, and the movement of non-spherical mineral particles is related to its volume, specific gravity, and shape. And this leads to what is called the “settling-equivalence effect” [49].
The previous studies show settling velocity of the spherical particle is the fastest compared with other shapes, while the plate particle is the lowest [23,24]. So, flaky minerals, like micas, can be carried very far distances because they are able to suspend for a long time. Besides, its ratio of thickness to diameter is small (1/10–1/30), and its volume is only 1/2–1/3 of the cubic mineral with the same particle size and density. Moreover, the density of micas (biotite, 3.02–3.12 g/cm3; muscovite, 2.7–3.1 g/cm3) spans from the density boundary of heavy mineral and light mineral. Because the particle’s deposition rate is proportional to its density, heavy minerals, which have large volume and small density, deposit together with minerals which have small volume and large density [24]. For these reasons, large micas grains are widespread in sand. They also deposit together with tiny quartz grains (2.65–2.8 g/cm3) in clay.
With regard to rock-forming heavy minerals, such as amphibole and epidote, their crystals can be larger particles in parent rocks. After weathering, these minerals are broken into different sizes. Therefore, their contents in different grain sizes do not have a large difference. Epidote is slightly denser than amphibole. Under the same weight, an epidote grain is a little bit smaller than amphibole, and thus concentrated in the fine fraction of silt [22,23].
Micas also can be crystallized to a large sheet shape in the parent rock [55]. When micas are broken into fine grains, the crushing mode is changed. Fine micas seldom break along the vertical crystal face direction, for it is easier to break together with thin grains along the cleavage direction. Thus, micas have little content in the fine grains, and its finest grains are about 4.0 Φ. Moreover, muscovite density (2.7–3.1 g/cm3) spans bromoform (2.89 g/cm3); biotite density is close to the heavy liquid. As the gap between micas crystal layers becomes larger after weathering, thus its density decreases. This is why both muscovite and biotite can either sink as heavy minerals, or float up as light minerals, during heavy liquid separation. Actually, there are more muscovites and hydrobiotite in light minerals, and their total amount is more than that of heavy minerals. Therefore, micas content of the heavy mineral fractions cannot reflect its real characteristic in the bulk sediment.
Other minerals such as zircons, rutile, tourmaline, garnet, and apatite exist as accessory minerals in the parent rock. They tend to crystallize into very small particles and are mostly concentrated in fine sediment grains [23,55]. For this reason, ZTR become larger as the grain size becomes finer. However, ZTR shows intrasample variability in the same size fraction and intersample variability in different grain sizes (Table 2).
As for metallic minerals of magnetite, ilmenite, and hematite, they are relatively concentrated at the fine grain fraction due to their ultradensity [23,53]. Limonite is actually a mixed particle of Goethite (FeO-OH), lepidocrocite (FeO-OH), goethite (FeO-OH·nH2O), silicon hydroxide, and argillaceous material. It is transformed from colloidal ferric hydroxide Fe(OH)3 by dehydration. As a mixture, limonite density ranges from 3.0 to 4.0, and is widely distributed in different size fractions. In particular, a large amount of limonite deposits in coarse grains (Figure 3). In our samples, limonite grains were characterized by a yellowish-brown color, crusty structure, low hardness, angular roundness, and weak magnetism, which reflect they are formed by chemical deposition and not by mechanical sedimentary differentiation. As all river samples are near the sea, charge neutralization happens easily when colloidal ferric hydroxide in the river contacts the sea water; by this process limonite is flocculated [56].
Triangular plots further reveal that as grain size became fine, mineral composition of subsamples (different grain sizes) changed regularly (Figure 5). In all sediment samples, unstable minerals were predominant in the coarse grain fraction. As the grain size decreased, heavy mineral composition changed from the richness of unstable minerals to the concentration of stable minerals and Fe-metallic minerals.
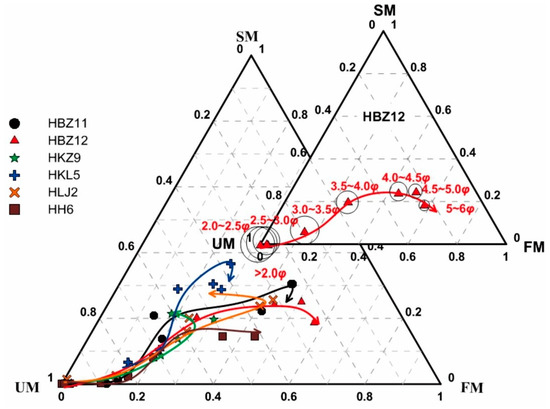
Figure 5.
Triangular chart to reflect variation trend of different heavy minerals in different grain sizes. Note: Stable minerals include zircon, rutile, tourmaline, garnet, and apatite; unstable minerals include common amphibole, actinite, pyroxene, biotite, and hydrobiotite; Fe-metallic minerals include ilmenite, magnetite, hematite, and lignite; small triangular chart takes the HBZ12 as an example; the circle size represents the particle size.
5.3. Heavy Mineral End-Members of Different Grain Sizes of the Yellow River
The traditional heavy mineral analysis adopts a “narrow-window strategy”, which only analyzes one or two restricted, homogeneous grain-size ranges, and uses this result to reflect the characteristics of the bulk sample (e.g., [36,51,52]). This method is questionable because each size fraction only can reflect a part feature of the bulk sample. In order to capture intrasample modal variability and better reveal sediment provenance, all grain-size fractions in each sample (“multiple-window strategy”) should be analyzed [24,25]. However, heavy mineral analysis by the “wide-window strategy” is difficult in large-scale marine geological surveys. Not only is identification difficult, but also time and cost will be increased significantly. Therefore, it is necessary to find partial size fractions which can represent the characteristics of the bulk sediment.
In order to accurately reflect heavy mineral characteristics of the Yellow River, we made similarity analysis between different grain sizes. The result shows that the representative grain size varied with the sample. For coarse sediment samples (e.g., HBZ11 and HKL5), they were mainly composed of silt and fine sand. The main composition of HBZ11 and HKL5 was the 3.0–4.0 Φ size fraction. Similarity values of these two samples between 3.0–4.0 Φ fraction and wide-window sizes were high, up to 0.988 and 0.968, respectively (Table 4). Hence, 3.0–4.0 Φ was suitable to represent the bulk sample. In HBZ12, HLJ2, HH6, and HKZ9, they were sandy silt with a small amount of clay. Size of 4.0–4.5 Φ was the mode particle group or secondary fraction. This size fraction shows high similarity (0.914–0.995) with wide grain size. Although the traditional method of 3.0–4.0 Φ had high similarity (0.946 on average) with wide-window grain size group, it was lower than the 3.5–4.5 Φ size fraction (0.955 on average).
For fine sediment samples (e.g., HHKI and HHK2), they were mainly muddy silt and contained little fine sand. The main size fraction was 5.0–6.0 Φ; the secondary fraction was 4.0–4.5 Φ. Although similarity between 5.0–6.0 Φ and wide sizes (>6.0 Φ) was high, only 64–76% of the bulk sediment was included by wide sizes. In other words, fine sediment (24–36%) was not calculated. Heavy mineral identification of fine grains <6.0 Φ requires Raman spectrum analysis, x-ray diffraction analysis or electron probe microanalysis [57,58].
In fine sediment, if the detrital mineral analysis is still done with coarse fraction (very fine sand), the result is questionable because of the grain size representation problem. In this case, sediment provenance information including heavy mineral distribution, composition, and index should be concluded by combination of grain size analysis. Coarse-grained fraction of the muddy sediment should definitely be used as research material, for it is an indispensable information carrier of the sediment source and sedimentary environment. Grain size analysis is also vital. Moreover, for source research on fine sediments, single mineral analysis may be complementary to traditional mineral assemblage analysis
In summary, the main grain size fractions (the mode particle group and secondary grains) can be selected as a substitute for wide-window grain size group to represent the characteristics of the bulk sediment. This is because the heavy mineral characteristics of these fractions has great similarity with the wide window grain size (Table 2 and Table 4). The commonly used grain size (3.0–4.0 Φ) shows variability: when this size fraction does not cover the main grain size fractions, it only reflects mineral properties of a narrow grain size range. Thus, it cannot reflect the characteristics of the bulk sample. The Yellow River sediments mainly consisted of silt; and the grain size of 4.0–5.0 Φ (coarse silt) was mostly the mode particle group or secondary grains. Coarse silt can reflect mineral properties of bulk samples; thus, it is suitable to be used in heavy mineral analysis.
6. Conclusions
(1) Although intrasample and intersample variability of heavy mineral characteristics is ubiquitous in the Yellow River sediment, its heavy mineral assemblages are featured by amphibole + epidote + limonite + garnet.
(2) Micas content of the wide grain size is low (3% on average) ranging from 0.7% to 7%. Micas is not suitable to be listed as one kind of diagnostic heavy mineral, for its enrichment in the coarse fraction of <3.0 Φ but low content in fine grains of >4.0 Φ is controlled by hydraulic-sorting.
(3) For different subsamples of the same Yellow River sediments, as grain size becomes fine, heavy mineral species and the content of Fe-metallic minerals increase, while the content of unstable minerals decrease.
(4) Heavy mineral analysis should be carried out with combination of grain size analysis. The grain size of 4.0–5.0 Φ ± 0.5 Φ is recommended to be used for detrital mineral analysis in the Yellow River sediments.
Author Contributions
Writing—Original Draft Preparation by, B.J., Writing—Review and Editing by W.Y., Data analysis and Figures by M.W., Sampling and Experiments by L.Z. and Y.W.
Funding
This work was financially supported by the National Science Foundation of China (Grant No. 41576057; No. 41706048).
Acknowledgments
We would like to give thanks Xuefa Shi and Sugandha Panwar for their revision comments on this manuscript.
Conflicts of Interest
The authors declare no conflict of interest.
References
- Ren, M.E.; Shi, Y.L. Sediment discharge of the Yellow River (China) and its effect on the sedimentation of the Bohai and the Yellow Sea. Cont. Shelf Res. 1986, 6, 785–810. [Google Scholar] [CrossRef]
- Bianchi, T.S.; Allison, M.A. Large-river delta-front estuaries as natural “recorders” of global environmental change. Proc. Natl. Acad. Sci. USA 2009, 106, 8085–8092. [Google Scholar] [CrossRef] [PubMed]
- Milliman, J.D.; Beardsley, R.C.; Yang, Z.S.; Limeburner, R. Modern Huanghe derived muds on the outer shelf of the East China Sea: Identification and potential transport mechanisms. Cont. Shelf Res. 1985, 4, 175–188. [Google Scholar] [CrossRef]
- Yellow River Conservancy Commission, Ministry of Water Resources. Yellow River Sediment Bulletin; Yellow River Conservancy Commission, Ministry of Water Resources: Zhengzhou, China, 2017. (In Chinese)
- Hori, K.; Saito, Y.; Zhao, Q.; Cheng, X.; Wang, P.; Sato, Y.; Li, C. Sedimentary facies and Holocene progradation rates of the Changjiang (Yangtze) delta, China. Geomorphology 2001, 41, 233–248. [Google Scholar] [CrossRef]
- Yang, S.Y.; Youn, J.S. Geochemical compositions and provenance discrimination of the central south Yellow Sea sediments. Mar. Geol. 2007, 243, 229–241. [Google Scholar] [CrossRef]
- Liu, J.; Saito, Y.; Kong, X.; Wang, H.; Xiang, L.H.; Wen, C.; Nakashima, R. Sedimentary record of environmental evolution off the Yangtze River estuary, East China Sea, during the last ~13,000 years, with special reference to the influence of the Yellow River on the Yangtze River delta during the last 600 years. Quat. Sci. Rev. 2010, 29, 2424–2438. [Google Scholar] [CrossRef]
- Xing, F.; Wang, Y.P.; Wang, H.V. Tidal hydrodynamics and fine-grained sediment transport on the radial sand ridge system in the southern Yellow Sea. Mar. Geol. 2012, 291, 192–210. [Google Scholar] [CrossRef]
- Milliman, J.D.; Yang, Z.S. Chinese-U.S. sediment source-to-sink research in the east China and Yellow Seas: A brief history. Cont. Shelf Res. 2014, 90, 2–4. [Google Scholar] [CrossRef]
- Zhou, X.; Li, A.; Jiang, F.; Lu, J. Effects of grain size distribution on mineralogical and chemical compositions: A case study from size-fractional sediments of the Huanghe (Yellow River) and Changjiang (Yangtze River). Geol. J. 2015, 50, 414–433. [Google Scholar] [CrossRef]
- Yang, S.Y.; Jung, H.S.; Lim, D.; Li, C.X. A review on the provenance discrimination of sediments. Earth-Sci. Rev. 2003, 63, 93–120. [Google Scholar] [CrossRef]
- Bian, C.W.; Jiang, W.S.; Quan, Q.; Wang, T.; Greatbatch, R.J.; Li, W. Distributions of suspended sediment concentration in the Yellow Sea and the East China Sea based on field surveys during the four seasons of 2011. J. Mar. Syst. 2013, 121–122, 24–35. [Google Scholar] [CrossRef]
- Zhang, L.; Chen, S.; Pan, S.; Yi, L.; Jiang, C. Sediment variability and transport in the littoral area of the abandoned Yellow River Delta, northern Jiangsu. J. Geogr. Sci. 2014, 24, 717–730. [Google Scholar] [CrossRef]
- Li, G.X.; Qiao, L.L.; Dong, P.; Ma, Y.Y.; Xu, J.S.; Liu, S.D.; Liu, Y.; Li, J.C.; Li, P.; Ding, D.; et al. Hydrodynamic condition and suspended sediment diffusion in the Yellow Sea and East China Sea. J. Geophys. Res. Oceans 2016, 121, 6204–6222. [Google Scholar] [CrossRef]
- Morton, A.C. Heavy minerals in provenance studies. In Provenance of Arenites; Zuffa, G.G., Ed.; NATO Science Series C; Reidel: Dordrecht, The Netherlands, 1985; pp. 249–277. [Google Scholar]
- Foucault, A.; Stanley, D.J. Late Quaternary palaeoclimatic oscillations in East Africa recorded by heavy minerals in the Nile delta. Nature 1989, 339, 44–46. [Google Scholar] [CrossRef]
- Vezzoli, G.; Garzanti, E.; Limonta, M.; Andò, S.; Yang, S. Erosion patterns in the Changjiang (Yangtze River) catchment revealed by bulk-sample versus single-mineral provenance budgets. Geomorphology 2016, 261, 177–192. [Google Scholar] [CrossRef]
- Andò, S.; Garzanti, E.; Padoan, M.; Limonta, M. Corrosion of heavy minerals during weathering and diagenesis: A catalogue for optical analysis. Sediment. Geol. 2012, 280, 165–178. [Google Scholar] [CrossRef]
- Garzanti, E. The maturity myth in sedimentology and provenance analysis. J. Sediment. Res. 2017, 87, 353–365. [Google Scholar] [CrossRef]
- Yue, W.; Jin, B.F.; Zhao, B.C. Transparent heavy minerals and magnetite geochemical composition of the Yangtze River sediments: Implication for provenance evolution of the Yangtze Delta. Sediment. Geol. 2018, 364, 42–52. [Google Scholar] [CrossRef]
- Chen, L.R. Sedimentary Mineralogy of the China Sea; Maritime Press: Beijing, China, 2008; pp. 12–17, (In Chinese with English Abstract). [Google Scholar]
- Schuiling, R.D.; De Meijer, R.J.; Riezebos, H.J.; Scholten, M.J. Grain size distribution of different minerals in a sediment as a function of their specific density. Geol. Mijnb. 1985, 64, 199–203. [Google Scholar]
- Garzanti, E.; Andò, S.; Vezzoli, G. Settling equivalence of detrital minerals and grain-size dependence of sediment composition. Earth Planet. Sci. Lett. 2008, 273, 138–151. [Google Scholar] [CrossRef]
- Garzanti, E.; Andò, S.; Vezzoli, G. Grain-size dependence of sediment compositionand environmental bias in provenance studies. Earth Planet. Sci. Lett. 2009, 277, 422–432. [Google Scholar] [CrossRef]
- Krippner, A.; Meinhold, G.; Morton, A.C.; Russell, E.; von Eynatten, H. Grain-size dependence of garnet composition revealed by provenance signatures of modern stream sediments from the Western Hohe Tauern (Austria). Sediment. Geol. 2015, 321, 25–38. [Google Scholar] [CrossRef]
- Lim, D.; Jung, H.S.; Choi, J.Y. REE partitioning in riverine sediments around the Yellow Sea and its importance in shelf sediment provenance. Mar. Geol. 2014, 357, 12–24. [Google Scholar] [CrossRef]
- Pan, B.T.; Pang, H.L.; Gao, H.S.; Garzanti, E.; Zou, Y.; Liu, X.P.; Li, F.Q.; Jia, Y.X. Heavy-mineral analysis and provenance of Yellow River sediments around the China Loess Plateau. J. Asian Earth Sci. 2016, 127, 1–11. [Google Scholar] [CrossRef]
- Lin, X.T.; Li, W.R.; Shi, Z.B. Characteristics of mineralogy in the clastic sediments from the Yellow River provenance, China. Mar. Geol. Quat. Geol. 2003, 23, 17–21, (In Chinese with English Abstract). [Google Scholar]
- Ye, Q.C.; Lu, Z.C.; Yang, Y.F. River Topography in the Lower Yellow River; Science Press: Beijing, China, 1990; (In Chinese with English Abstract). [Google Scholar]
- Jin, B.F.; Yue, W.; Wang, K.S. Chemical composition of detrital amphibole in the sedimenta of the Huanghe River, Liao River and Yalu River, and its implication for sediment provenance. Acta Oceanol. Sin. 2014, 36, 11–21, (In Chinese with English Abstract). [Google Scholar]
- Bird, A.; Stevens, T.; Rittner, M.; Vermeesch, P.; Carter, A.; Andò, S.; Garzanti, E.; Lu, H.Y.; Nie, J.S.; Zeng, L.; et al. Quaternary dust source variation across the Chinese Loess Plateau. Palaeogeogr. Palaeoclimatol. Palaeoecol. 2015, 435, 254–264. [Google Scholar] [CrossRef]
- Nie, J.; Stevens, T.; Rittner, M.; Stockli, D.; Garzanti, E.; Limonta, M.; Lu, H. Loess plateau storage of northeastern Tibetan plateau-derived Yellow River sediment. Nat. Commun. 2015, 6, 8511. [Google Scholar] [CrossRef]
- Peng, W.B.; Nie, J.S.; Wang, Z.; Stevens, T. A major change in precipitation gradient on the Chinese Loess Plateau at the Pliocene-Quaternary boundary. J. Asian Earth Sci. 2018, 155, 134–138. [Google Scholar] [CrossRef]
- Bloemsma, M.R.; Zabel, M.; Stuut, J.B.W.; Tjallingii, R.; Collins, J.A.; Weltje, G.J. Modelling the joint variability of grain size and chemical composition in sediments. Sediment. Geol. 2012, 280, 135–148. [Google Scholar] [CrossRef]
- Von Eynatten, H.; Tolosana-Delgado, R.; Karius, V.; Bachmann, K.; Caracciolo, L. Sediment generation in humid Mediterranean setting: Grain-size and source-rock control on sediment geochemistry and mineralogy (Sila Massif, Calabria). Sediment. Geol. 2016, 336, 68–80. [Google Scholar] [CrossRef]
- Wang, Z.B.; Yang, S.Y.; Li, R.H.; Zhang, Z.X.; Li, J.; Bai, F.L.; Li, C. Detrital mineral composition of the sediments from Huanghe and its hydrodynamic environmental constrains. Mar. Geol. Quat. Geol. 2010, 30, 73–85, (In Chinese with English Abstract). [Google Scholar] [CrossRef]
- Gao, W.H.; Gao, S.; Wang, D.D.; Zhao, Y.Y.; Zhu, D.; Xu, Z. Sediment Source Information of Different Catchments in the Sedimentary Records of the Abandoned Yellow River: Heavy Mineral and Geochemical Analyses. Sci. Geogr. Sin. 2015, 12, 18. [Google Scholar]
- Pang, H.L.; Pan, B.T.; Garzanti, E.; Gao, H.S.; Zhao, X.; Chen, D.B. Mineralogy and geochemistry of modern Yellow River sediments: Implications for weathering and provenance. Chem. Geol. 2018, 488, 76–86. [Google Scholar] [CrossRef]
- Garzanti, E.; Vezzoli, G. A classification of metamorphic grains in sands based on their composition and grade. J. Sediment. Res. 2003, 73, 830–837. [Google Scholar] [CrossRef]
- Mange, M.A.; Maurer, H.F.W. Heavy Minerals in Colour; Chapman and Hall: London, UK, 1992. [Google Scholar]
- Jin, B.F. Influencing Factors and Significance of the Skewness Coefficient in Grain Size Analysis. Mar. Sci. 2012, 36, 129–135, (In Chinese with English Abstract). [Google Scholar]
- Morton, A.; Hurst, A. Correlation of sandstones using heavy minerals: An example from the Statfjord Formation of the Snorre Field, northern North Sea. Geol. Soc. Lond. Spec. Publ. 1995, 89, 3–22. [Google Scholar] [CrossRef]
- Garzanti, E.; Andò, S. Heavy mineral concentration in modern sands: Implications for provenance interpretation. Dev. Sedimentol. 2007, 58, 517–545. [Google Scholar]
- Morton, A.C.; Hallsworth, C.R. Processes controlling the composition of heavy mineral assemblages in the sandstones. Sediment. Geol. 1999, 121, 3–29. [Google Scholar] [CrossRef]
- Deng, G.N. The similarity measure in clustering. J. Northeast Dianli Univ. 2013, 33, 156–161, (In Chinese with English Abstract). [Google Scholar]
- Yang, S.Y.; Li, C.X.; Jung, H.S.; Lee, H.J. Discrimination of geochemical compositions between the Changjiang and the Huanghe sediments and its application for the identification of sediment source in the Jiangsu coastal plain, China. Mar. Geol. 2002, 186, 229–241. [Google Scholar] [CrossRef]
- Garzanti, E.; Vezzoli, G.; Andò, S.; France-Lanord, C.; Singh, S.K.; Foster, G. Sand petrology and focused erosion in collision orogens: The Brahmaputra case. Earth Planet. Sci. Lett. 2004, 220, 157–174. [Google Scholar] [CrossRef]
- Garzanti, E.; Vezzoli, G.; Ando, S.; Paparella, P.; Clift, P.D. Petrology of Indus River sands: A key to interpret erosion history of the Western Himalayan Syntaxis. Earth Planet. Sci. Lett. 2005, 229, 287–302. [Google Scholar] [CrossRef]
- Garzanti, E.; Resentini, A.; Andò, S.; Vezzoli, G.; Pereira, A.; Vermeesch, P. Physical controls on sand composition and relative durability of detrital minerals during long-distance littoral and eolian transport (coastal Namibia). Sedimentology 2015, 62, 971–996. [Google Scholar] [CrossRef]
- Wang, H.; Yang, Z.; Saito, Y.; Liu, J.P.; Sun, X.; Wang, Y. Stepwise decreases of the Huanghe (Yellow River) sediment load (1950–2005): Impacts of climate change and human activities. Glob. Planet. Chang. 2007, 57, 331–354. [Google Scholar] [CrossRef]
- Sun, B.Y. Detrital mineral assemblages in the Huanghe, Changjiang and Zhujiang River delta sediments. Mar. Geol. Quat. Geol. 1990, 10, 23–34, (In Chinese with English Abstract). [Google Scholar]
- Bateman, R.M.; Catt, J.A. Provenance and palaeoenvironmental interpretation of superficial deposits, with particular reference to post-depositional modification of heavy mineral assemblages. Dev. Sedimentol. 2007, 58, 151–188. [Google Scholar]
- Malusà, M.G.; Resentin, A.; Garzanti, E. Hydraulic sorting and mineral fertility bias in detrital geochronology. Gondwana Res. 2016, 31, 1–19. [Google Scholar] [CrossRef]
- Komar, P.D.; Reimers, C.E. Grain shape effects on settling rates. J. Geol. 1978, 86, 193–209. [Google Scholar] [CrossRef]
- Krippner, A.; Meinhold, G.; Morton, A.C.; Schönig, J.; von Eynatten, H. Heavy minerals and garnet geochemistry of stream sediments andbedrocks from the Almklovdalen area, Western Gneiss Region, SW Norway: Implications for provenance analysis. Sediment. Geol. 2016, 336, 96–105. [Google Scholar] [CrossRef]
- Jin, B.F.; Zhang, Y.J.; Song, J. Characteristics of Mineral Chemistry and Formation of the Micro-nodules in the First Stiff Clay Layer in the Yangtze River Delta. Mar. Geol. Quat. Geol. 2007, 27, 9–15, (In Chinese with English Abstract). [Google Scholar]
- Andò, S.; Vignola, P.; Garzanti, E. Raman counting: A new method to determine provenance of silt. Rendiconti Lincei 2011, 22, 327–347. [Google Scholar] [CrossRef]
- Fielding, L.; Najman, Y.; Millar, I.; Butterworth, P.; Garzanti, E.; Vezzoli, G.; Kneller, B. The initiation and evolution of the River Nile. Earth Planet. Sci. Lett. 2018, 489, 166–178. [Google Scholar] [CrossRef]


© 2019 by the authors. Licensee MDPI, Basel, Switzerland. This article is an open access article distributed under the terms and conditions of the Creative Commons Attribution (CC BY) license (http://creativecommons.org/licenses/by/4.0/).