The High-Pressure Structural Evolution of Olivine along the Forsterite–Fayalite Join

 ,
,  ,
,  ,
, 
Abstract
1. Introduction
2. Materials and Methods
- Fo80 (sample BO 321): M1 (Mg0.80, Fe0.20); M2 (Mg0.81, Fe0.19);
- Fo62 (sample BO 335): M1 (Mg0.59, Fe0.40); M2 (Mg0.61, Fe0.38).
3. Results
- Fo100: β = −0.0079(5) and −0.0066(4) GPa−1,
- Fo80: β = −0.0073(5) and −0.0065(4) GPa−1,
- Fo62: β = −0.0072(5) and −0.0056(4) GPa−1.
4. Discussion
Supplementary Materials
Author Contributions
Funding
Acknowledgments
Conflicts of Interest
References
- Bass, J.D.; Parise, J.B. Deep-Earth and recent developments in mineral physics. Element 2008, 4, 157–163. [Google Scholar] [CrossRef]
- Ringwood, A.E. Composition of the core and implications for origin of earth. Geochem. J. 1977, 11, 111–135. [Google Scholar] [CrossRef]
- Agee, C.B. Phase transformations and seismic structure in the upper mantle and transition zone. In Ultrahigh-Pressure Mineralogy: Physics and Chemistry of the Earth’s Deep Interior; Hemley, R.J., Ed.; Mineralogical Society of America: Chantilly, VA, USA, 1998; Volume 37, pp. 165–203. [Google Scholar]
- Frost, D.J. Fe2+–Mg partitioning between garnet, magnesiowustite, and (Mg,Fe)2SiO4 phases of the transition zone. Am. Mineral. 2003, 88, 387–397. [Google Scholar] [CrossRef]
- Bragg, W.L.; Brown, G.B. Die struktur des olivins. Z. Krist.-Cryst. Mater. 1926, 63, 538–556. [Google Scholar] [CrossRef]
- Smyth, J.R.; Jacobsen, S.D.; Hazen, R.M. Comparative crystal chemistry of orthosilicate minerals. In High-Temperature and High-Pressure Crystal Chemistry; Hazen, R.M., Downs, R.T., Eds.; Mineralogical Society of America: Chantilly, VA, USA, 2000; Volume 41, pp. 187–209. [Google Scholar]
- Hazen, R.M. Effects of temperature and pressure on the crystal structure of ferromagnesian olivine. Am. Mineral. 1977, 62, 286–295. [Google Scholar]
- Suzuki, I.; Anderson, O.L.; Sumino, Y. Elastic properties of a single crystal forsterite Mg2SiO4, up to 1200 K. Phys. Chem. Miner. 1983, 10, 38–46. [Google Scholar] [CrossRef]
- Kudoh, Y.; Takeuchi, Y. The crystal structure of forsterite Mg2SiO4 under high pressure up to 149 kb. Z. Krist.-Cryst. Mater. 1985, 171, 291–302. [Google Scholar]
- Graham, E.K.; Schwab, J.A.; Sopkin, S.M.; Takei, H. The pressure and temperature dependence of the elastic properties of single crystal fayalite Fe2SiO4. Phys. Chem. Miner. 1988, 16, 186–198. [Google Scholar] [CrossRef]
- Webb, S.L. The elasticity of the upper mantle orthosilicates olivine and garnet to 3 GPa. Phys. Chem. Miner. 1989, 16, 684–692. [Google Scholar] [CrossRef]
- Andrault, D.; Bouhifd, M.A.; Itié, J.P.; Richet, P. Compression and amorphization of (Mg,Fe)2SiO4 olivines: An X-ray diffraction study up to 70 GPa. Phys. Chem. Miner. 1995, 22, 99–107. [Google Scholar] [CrossRef]
- Downs, R.T.; Zha, C.S.; Duffy, T.S.; Finger, L.W. The equation of state of forsterite to 17.2 GPa and effects of pressure media. Am. Mineral. 1996, 81, 51–55. [Google Scholar] [CrossRef]
- Zha, C.S.; Duffy, T.S.; Downs, R.T.; Mao, H.K.; Hemley, R.J. Sound velocity and elasticity of single-crystal forsterite to 16 GPa. J. Geophys. Res. 1996, 101, 17535–17545. [Google Scholar] [CrossRef]
- Zha, C.S.; Duffy, T.S.; Downs, R.T.; Mao, H.K.; Hemley, R.J. Brillouin scattering and X-ray diffraction of San Carlos olivine: Direct pressure determination to 32 GPa. Earth Planet. Sci. Lett. 1998, 159, 25–33. [Google Scholar] [CrossRef]
- Speziale, S.; Duffy, T.S.; Angel, R.J. Single-crystal elasticity of fayalite to 12 GPa. J. Geophys. Res. 2004, 109, B12202. [Google Scholar] [CrossRef]
- Liu, W.; Kung, J.; Li, B. Elasticity of San Carlos olivine to 8 GPa and 1073 K. Geophys. Res. Lett. 2005, 32, L16301. [Google Scholar] [CrossRef]
- Nestola, F.; Pasqual, D.; Smyth, J.R.; Novella, D.; Secco, L.; Manghnani, M.H.; Dal Negro, A.D. New accurate elastic parameters for the forsterite–fayalite solid solution. Am. Mineral. 2011, 96, 1742–1747. [Google Scholar] [CrossRef]
- Finkelstein, G.J.; Dera, P.K.; Jahn, S.; Oganov, A.R.; Holl, C.M.; Meng, Y.; Duffy, T.S. Phase transitions and equation of state of forsterite to 90 GPa from single-crystal X-ray diffraction and molecular modelling. Am. Mineral. 2014, 99, 35–43. [Google Scholar] [CrossRef]
- Zhang, J.S.; Hu, Y.; Shelton, H.; Kung, J.; Dera, P. Single-crystal X-ray diffraction study of Fe2SiO4 fayalite up to 31 GPa. Phys. Chem. Miner. 2017, 44, 171–179. [Google Scholar] [CrossRef]
- Angel, R.J.; Alvaro, M.; Nestola, F. 40 years of mineral elasticity: A critical review and a new parameterisation of equations of state for mantle olivines and diamond inclusions. Phys. Chem. Miner. 2018, 45, 95–113. [Google Scholar] [CrossRef]
- Béjina, F.; Bystricky, M.; Tercé, N.; Whitaker, M.L.; Chen, H. Bulk modulus of Fe-rich olivines corrected for non-hydrostaticity. C. R. Geosci. 2019, 351, 86–94. [Google Scholar] [CrossRef]
- Smyth, J.R.; Frost, D.J.; Nestola, F.; Holl, C.M.; Bromiley, G. Olivine hydration in the deep upper mantle: Effects of temperature and silica activity. Geophys. Res. Lett. 2006, 33, L15301. [Google Scholar] [CrossRef]
- Princivalle, F.; Secco, L. Crystal structure refinement of 13 olivines in the forsterite–fayalite series from volcanic rocks and ultramafic nodules. Tschermaks Mineral. Petrogr. Mitt. 1985, 34, 105–115. [Google Scholar] [CrossRef]
- Angel, R.J.; Bujak, M.; Zhao, J.; Gatta, G.D.; Jacobsen, S.D. Effective hydrostatic limits of pressure media for high-pressure crystallographic studies. J. Appl. Crystallogr. 2007, 40, 26–32. [Google Scholar] [CrossRef]
- Klotz, S.; Chervin, J.-C.; Munsch, P.; Le Marchand, G. Hydrostatic limits of 11 pressure transmitting media. J. Phys. D Appl. Phys. 2009, 42, 075413. [Google Scholar] [CrossRef]
- Mao, H.K.; Xu, J.; Bell, P.M. Calibration of the ruby pressure gauge to 800 kbar under quasi-hydrostatic conditions. J. Geophys. Res. 1986, 91, 4673–4676. [Google Scholar] [CrossRef]
- Angel, R.J. Absorption corrections for diamond-anvil cell implemented in the software package Absorb 6.0. J. Appl. Crystallogr. 2004, 37, 486–492. [Google Scholar] [CrossRef]
- STOE & Cie. X-SHAPE, Version 1.06; Stoe & Cie: Darmstadt, Germany, 1999. [Google Scholar]
- Sheldrick, G.M. SHELXS97 and SHELXL97. Program for Crystal Structure Solution and Refinement; University of Göttingen: Göttingen, Germany, 1997. [Google Scholar]
- Fujino, K.; Sasaki, S.; Takéuchi, Y.; Sadanaga, R. X-ray determination of electron distributions in forsterite, fayalite and tephroite. Acta Crystallogr. 1981, B37, 513–518. [Google Scholar] [CrossRef]
- Balic-Zunic, T.; Vickovic, I. IVTON: A program for the calculation of geometrical aspects of crystal structures and some crystal chemical applications. J. Appl. Crystallogr. 1996, 29, 305–306. [Google Scholar] [CrossRef]


| Fo100Fa0 | |||||||||
| P (GPa) | 0 | 1.22(5) | 2.04(5) | 2.67(5) | 3.28(5) | 4.82(5) | 6.29(5) | 7.23(5) | 7.98(5) |
| a (Å) | 4.758(4) | 4.750(3) | 4.741(3) | 4.734(4) | 4.734(2) | 4.725(4) | 4.714(3) | 4.704(2) | 4.700(3) |
| b (Å) | 10.190(7) | 10.162(6) | 10.148(7) | 10.112(7) | 10.112(5) | 10.054(7) | 10.017(7) | 9.993(5) | 9.959(5) |
| c (Å) | 5.982(6) | 5.962(4) | 5.946(4) | 5.950(4) | 5.924(3) | 5.909(6) | 5.889(5) | 5.872(4) | 5.866(4) |
| V (Å3) | 290.0(4) | 287.8(3) | 286.1(3) | 284.8(4) | 283.6(2) | 280.7(4) | 278.1(4) | 276.0(3) | 274.6(3) |
| S.G. | Pbnm | Pbnm | Pbnm | Pbnm | Pbnm | Pbnm | Pbnm | Pbnm | Pbnm |
| Radiation | Mo Kα | Mo Kα | Mo Kα | Mo Kα | Mo Kα | Mo Kα | Mo Kα | Mo Kα | Mo Kα |
| Unique Reflections | 238 | 235 | 222 | 212 | 220 | 214 | 219 | 218 | 219 |
| R4σ (%) | 3.87 | 4.35 | 3.42 | 4.11 | 4.07 | 3.69 | 5.03 | 3.80 | 4.07 |
| N° parameters | 21 | 21 | 21 | 21 | 21 | 21 | 21 | 21 | 21 |
| Bulk modulus, KT0 = 124.4 GPa | |||||||||
| First pressure derivative, K′ = 4.9 | |||||||||
| Fo80Fa20 | |||||||||
| P (GPa) | 0 | 1.06(5) | 1.69(5) | 3.00(5) | 3.71(5) | 5.78(5) | 7.66(5) | ||
| a (Å) | 4.766(3) | 4.765(2) | 4.760(2) | 4.750(3) | 4.744(2) | 4.733(4) | 4.724(2) | ||
| b (Å) | 10.251(7) | 10.213(5) | 10.188(5) | 10.151(6) | 10.134(6) | 10.066(8) | 10.027(5) | ||
| c (Å) | 6.022(7) | 6.005(2) | 5.997(4) | 5.979(4) | 5.971(3) | 5.938(5) | 5.906(4) | ||
| V (Å3) | 294.2(4) | 292.2(2) | 290.8(3) | 288.3(3) | 287.1(3) | 282.9(4) | 279.8(3) | ||
| S.G. | Pbnm | Pbnm | Pbnm | Pbnm | Pbnm | Pbnm | Pbnm | ||
| Radiation | Mo Kα | Mo Kα | Mo Kα | Mo Kα | Mo Kα | Mo Kα | Mo Kα | ||
| Unique Reflections | 277 | 256 | 251 | 249 | 248 | 251 | 239 | ||
| R4σ (%) | 6.08 | 4.05 | 3.95 | 3.97 | 4.55 | 5.51 | 4.35 | ||
| N° parameters | 21 | 21 | 21 | 21 | 21 | 21 | 21 | ||
| Bulk modulus, KT0 = 124.7(3) GPa | |||||||||
| First pressure derivative, K′ = 5.4(2) | |||||||||
| Fo62Fa38 | |||||||||
| P (GPa) | 0 | 0.76(5) | 1.93(5) | 2.86(5) | 5.07(5) | 7.46(5) | 8.34(5) | ||
| a (Å) | 4.797(2) | 4.796(2) | 4.785(3) | 4.776(2) | 4.761(2) | 4.745(2) | 4.741(2) | ||
| b (Å) | 10.330(4) | 10.296(4) | 10.283(4) | 10.248(4) | 10.183(4) | 10.100(4) | 10.079(4) | ||
| c (Å) | 6.041(2) | 6.040(1) | 6.019(1) | 6.008(1) | 5.981(1) | 5.949(1) | 5.939(1) | ||
| V (Å3) | 299.3(2) | 298.25(18) | 296.2(2) | 294.06(18) | 289.97(17) | 285.10(17) | 283.79(17) | ||
| S.G. | Pbnm | Pbnm | Pbnm | Pbnm | Pbnm | Pbnm | Pbnm | ||
| Radiation | Mo Kα | Mo Kα | Mo Kα | Mo Kα | Mo Kα | Mo Kα | Mo Kα | ||
| Unique Reflections | 207 | 206 | 205 | 177 | 195 | 190 | 189 | ||
| R4σ (%) | 6.84 | 5.95 | 5.59 | 8.23 | 7.28 | 4.41 | 5.25 | ||
| N° parameters | 21 | 21 | 21 | 21 | 21 | 21 | 21 | ||
| Bulk modulus, KT0 = 126.6(4) GPa | |||||||||
| First pressure derivative, K′ = 5.2(1) | |||||||||
| Fo100 | Fo80 | Fo62 | Fo0 | |
|---|---|---|---|---|
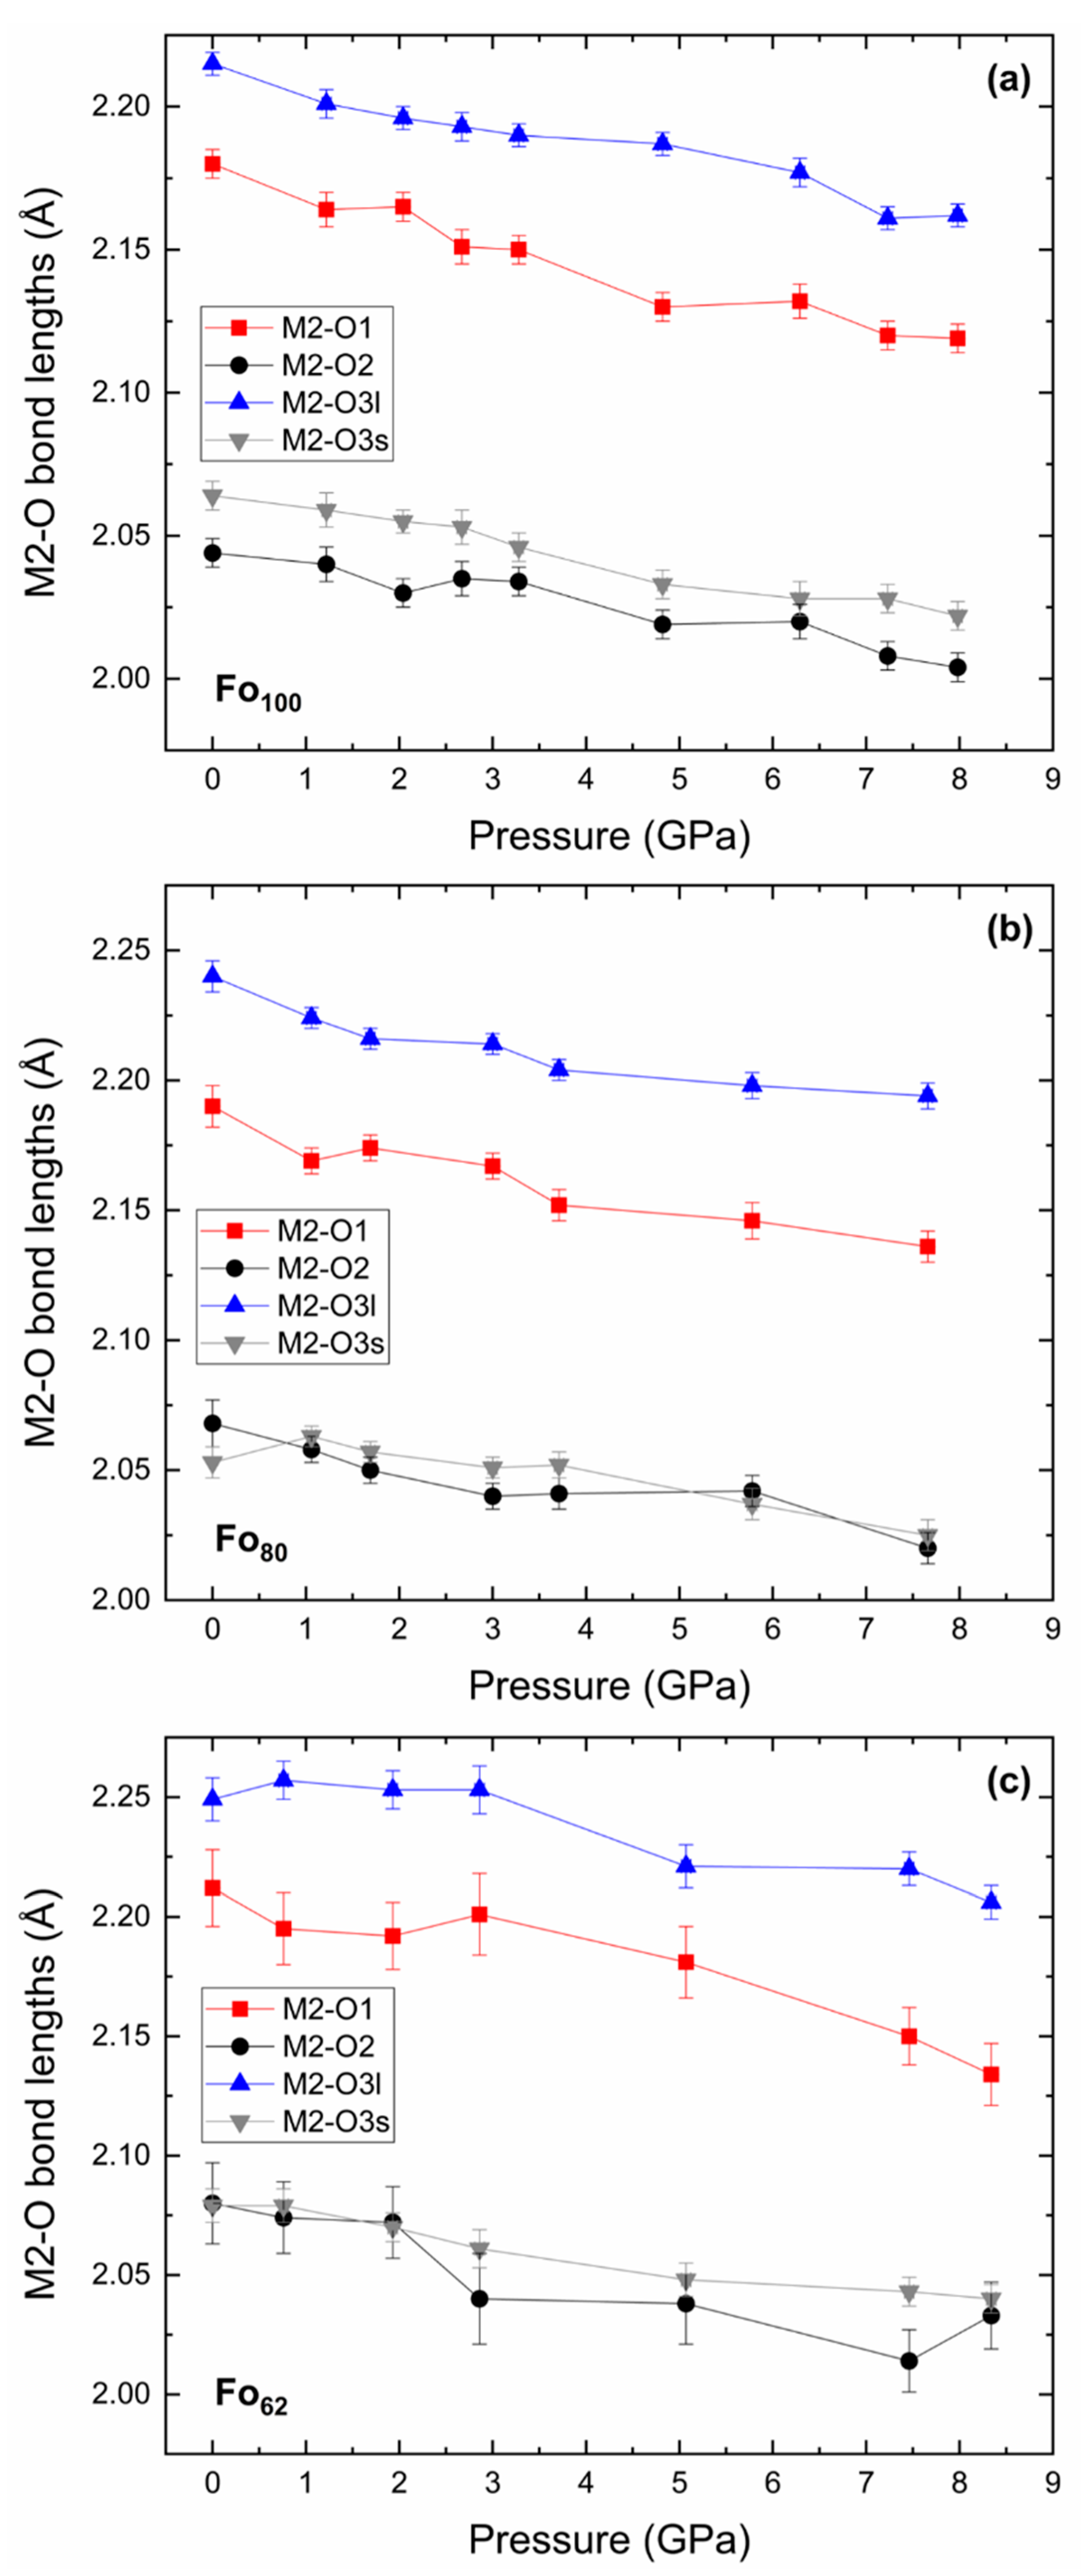
| M2–O1 | 0.008 | 0.007 | 0.009 | 0.009 |
| M2–O2 | 0.005 | 0.006 | 0.006 | 0.007 |
| M2–O3l × 2 | 0.013 | 0.012 | 0.010 | 0.008 |
| M2–O3s × 2 | 0.011 | 0.007 | 0.009 | 0.012 |
| Mean compression rate (Å/GPa) | 0.006 | 0.005 | 0.006 | 0.006 |
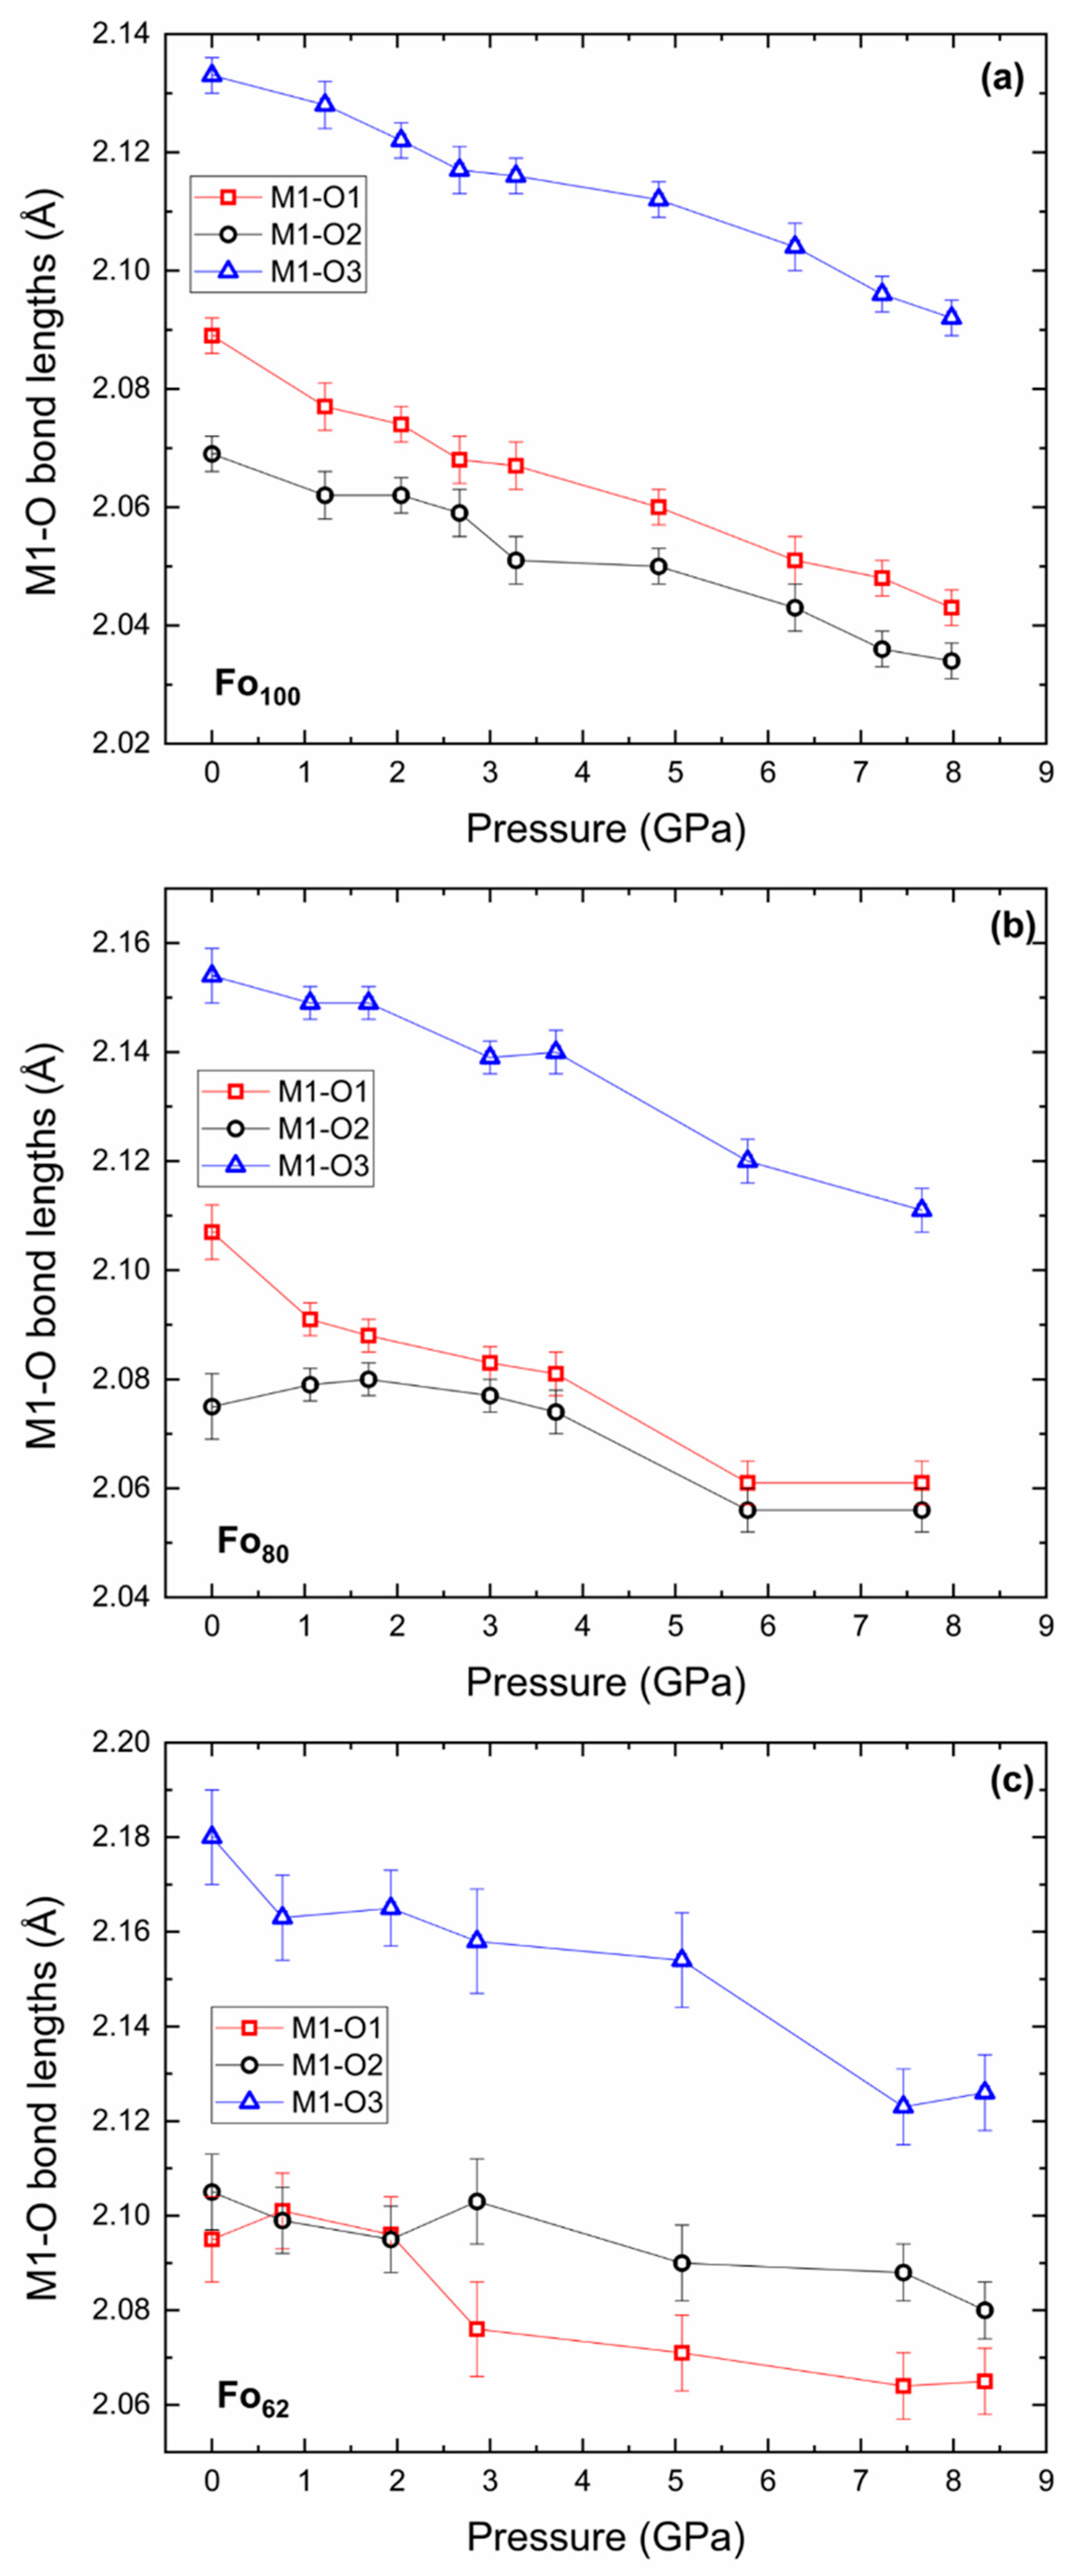
| M1–O1 × 2 | 0.012 | 0.012 | 0.007 | 0.012 |
| M1–O2 × 2 | 0.008 | 0.005 | 0.006 | 0.004 |
| M1–O3 × 2 | 0.010 | 0.011 | 0.013 | 0.008 |
| Mean compression rate (Å/GPa) | 0.005 | 0.005 | 0.004 | 0.004 |
© 2019 by the authors. Licensee MDPI, Basel, Switzerland. This article is an open access article distributed under the terms and conditions of the Creative Commons Attribution (CC BY) license (http://creativecommons.org/licenses/by/4.0/).
Share and Cite
Pamato, M.G.; Nestola, F.; Novella, D.; Smyth, J.R.; Pasqual, D.; Gatta, G.D.; Alvaro, M.; Secco, L. The High-Pressure Structural Evolution of Olivine along the Forsterite–Fayalite Join. Minerals 2019, 9, 790. https://doi.org/10.3390/min9120790
Pamato MG, Nestola F, Novella D, Smyth JR, Pasqual D, Gatta GD, Alvaro M, Secco L. The High-Pressure Structural Evolution of Olivine along the Forsterite–Fayalite Join. Minerals. 2019; 9(12):790. https://doi.org/10.3390/min9120790
Chicago/Turabian StylePamato, Martha G., Fabrizio Nestola, Davide Novella, Joseph R. Smyth, Daria Pasqual, G. Diego Gatta, Matteo Alvaro, and Luciano Secco. 2019. "The High-Pressure Structural Evolution of Olivine along the Forsterite–Fayalite Join" Minerals 9, no. 12: 790. https://doi.org/10.3390/min9120790
APA StylePamato, M. G., Nestola, F., Novella, D., Smyth, J. R., Pasqual, D., Gatta, G. D., Alvaro, M., & Secco, L. (2019). The High-Pressure Structural Evolution of Olivine along the Forsterite–Fayalite Join. Minerals, 9(12), 790. https://doi.org/10.3390/min9120790