Article

Ultimate Mechanical Properties of Forsterite

1
Univ. Lille, CNRS, INRA, ENSCL, UMR 8207-UMET-Unité Matériaux et Transformations, F-59000 Lille, France
2
Institut Universitaire de France, 1 rue Descartes, F-75005 Paris, France
*
Author to whom correspondence should be addressed.
Minerals 2019, 9(12), 787; https://doi.org/10.3390/min9120787
Submission received: 21 November 2019 / Revised: 11 December 2019 / Accepted: 12 December 2019 / Published: 14 December 2019
(This article belongs to the Special Issue Mineral Physics—In Memory of Orson Anderson)

Abstract

:
The ultimate mechanical properties, as characterized here by the ideal strengths of Mg2SiO4 forsterite, have been calculated using first-principles calculations and generalized gradient approximation under tensile and shear loading. The ideal tensile strengths (ITS) and ideal shear strengths (ISS) are computed by applying homogeneous strain increments along high-symmetry directions ([100], [010], and [001]) and low index shear plane ((100), (010), and (001)) of the orthorhombic lattice. We show that the ultimate mechanical properties of forsterite are highly anisotropic, with ITS ranging from 12.1 GPa along [010] to 29.3 GPa along [100], and ISS ranging from 5.6 GPa for simple shear deformation along (100) to 11.5 GPa for shear along (010).

1. Introduction

Olivine (Mg,Fe)2SiO4 is a mineral of prominent importance since it is a major component of the diffuse interstellar medium and of protoplanetary disks around young stars [1]. Olivine dust in the interstellar medium appears to be almost entirely amorphous, whereas the spectra of protoplanetary disks also show evidence of crystallinity. In the solar system, olivine is found in comets [2], chondritic and nonchondritic meteorites [3,4], and in the mantle of terrestrial planets. On Earth, olivine is the main constituent of the upper mantle [5] and its transformation under pressure to wadsleyite and ringwoodite is the main cause of the observed seismic discontinuities at 410 and 520 km depths. Olivine glass is very difficult to obtain from the melt and requires extreme cooling rates [6]. The first report of olivine glass in 1977 by [7] was related to shock experiments of a single crystal of San Carlos olivine. A few years later, [8] reported evidence of fayalite olivine glass formed after heating in a diamond anvil cell. In 1990, [9,10] presented evidence of amorphization of fayalite pressurized above 39 GPa and 35 GPa respectively. Occurrence of pressure induced amorphization of Mg-rich olivines was further documented by [11,12,13]. Although the role of pressure was generally put forward as the cause for amorphization, the influence of non-hydrostatic stresses was highlighted by [12,14]. Pressure-induced amorphization is usually described as a kinetically preferred transformation resulting from frustration in reaching the high-pressure equilibrium crystalline state. This transformation questions the mechanical stability of crystalline solids.
Here, we propose a first investigation of the mechanical stability of olivine based on elasticity. The elastic properties of solids do not just address their response to small strains. In pure hydrostatic compression, a solid is not prone to failure, and elastic properties deviate significantly from a linear response. The equation of state which describes the evolution of the volume in response to a hydrostatic compression is a fundamental parameter for the minerals of the interior of the Earth. For any other solicitation, the elastic response of solids is difficult to assess to large stresses since the presence of defects leads to failure and plastic deformation. The recent advances in theoretical methods and computation make it possible to calculate the elastic behavior of solids submitted to homogeneous deformation at large strains, until the point of instability (the ideal strength) is reached [15,16,17,18]. Ideal strength is thus the critical stress above which a defect-free crystal reaches its mechanical instability and undergoes a spontaneous structural transformation (to another phase possibly amorphous). The method consists therefore in the computation of the crystal energy and stresses under the application of successive deformation increments in order to access to the corresponding stress–strain curves. The instability corresponds to the maximum of stress which also corresponds to an inflection point in the free energy curve as the Cauchy stress is related to the derivative of the free energy as a function of strain [19].
In this study, we focus on the elastic properties and mechanical stability of pure, iron-free Mg2SiO4 forsterite. The ideal tensile strengths (ITS) and ideal shear strengths (ISS) are computed from a first-principles method along high-symmetry directions [100], [010], and [001] and for homogenous shear of (100), (010), and (001) planes (here given with respect to the Pbnm space group of forsterite).

2. Materials and Methods

In this work, the derivation of the anisotropic ideal strength is performed according to the recent ADAIS (version 1.0.0, Beihang University, China) free open source software written by Zhang and co-workers [20], which allows for an automatic implementation of homogenous deformation to standard first-principles VASP calculations [21]. Thus, all simulations correspond to calculations based on the density functional theory (DFT) using a plane wave basis set and the projector augmented wave method (PAW) [22]. Exchange–correlation energy is accounted by employing the Perdew-Wang (PW91), gradient-corrected functional (GGA) [23]. For all the calculations, plane-wave basis set expansion was limited using a kinetic energy cutoff of 520 eV, known to ensure an adequately atomic force convergence in forsterite [24]. Regarding the k-point sampling, throughout this study, we use a single grid of 6 × 4 × 6 according to a Monkhorst and Pack scheme [25] corresponding to 18 k-points per forsterite unit cell.
As mentioned in the introduction, once a Mg2SiO4 unit cell has been fully relaxed, tensile or shear tests are performed by applying incremental homogeneous strain, i.e., atomic layers of the crystal are uniformly displaced along the tensile or shear direction (Figure 1). At each deformation state, a relaxation of both the cell shape and the atomic positions is performed until all the components of the stress tensor are brought to zero, except for one corresponding to the applied stress condition. In practice, we verify that structural relaxation allows for residual stresses of the order of a few MPa at the most.

3. Results

3.1. Ground State Properties

Before calculating the ultimate mechanical properties of Mg2SiO4, we optimized the equilibrium structure. A unit cell has been built and relaxed for the Pbnm configuration, giving rise to the equilibrium lattice parameters a, b, and c. The results are displayed in Table 1, where they are compared with available data (both theoretical and experimental). It is shown that the calculations predict the correct Mg2SiO4 ground state structure.

3.2. Ideal Strength in Tension and in Shear

From the optimized unit cell containing 28 atoms, the ideal strengths are determined from an incremental application of strain of 0.005. Three tensile directions have been tested and for the shear deformation, we investigated both simple and pure shear modes.

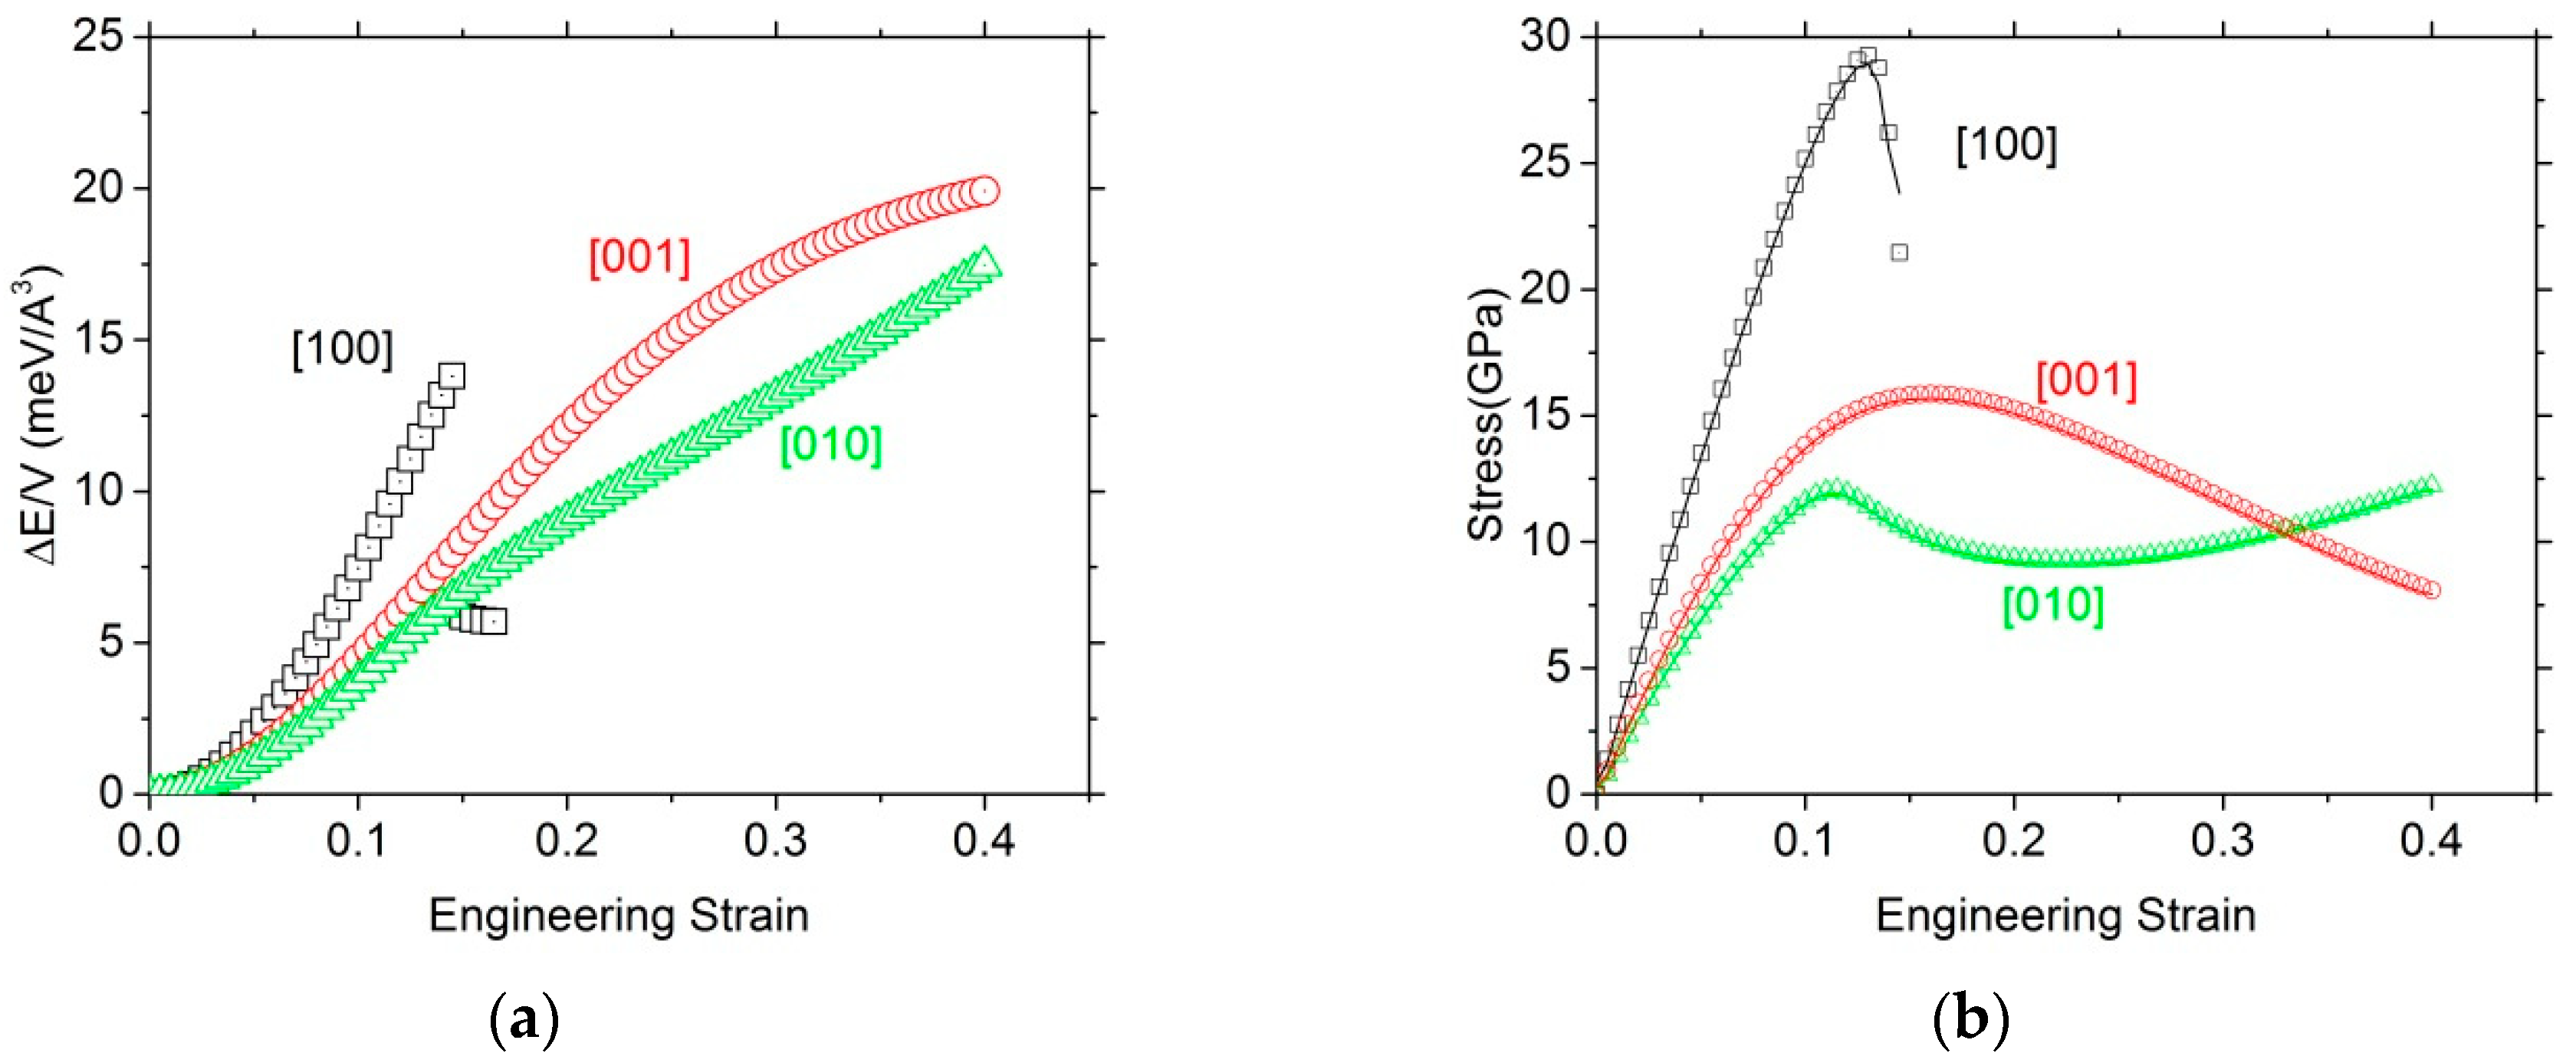
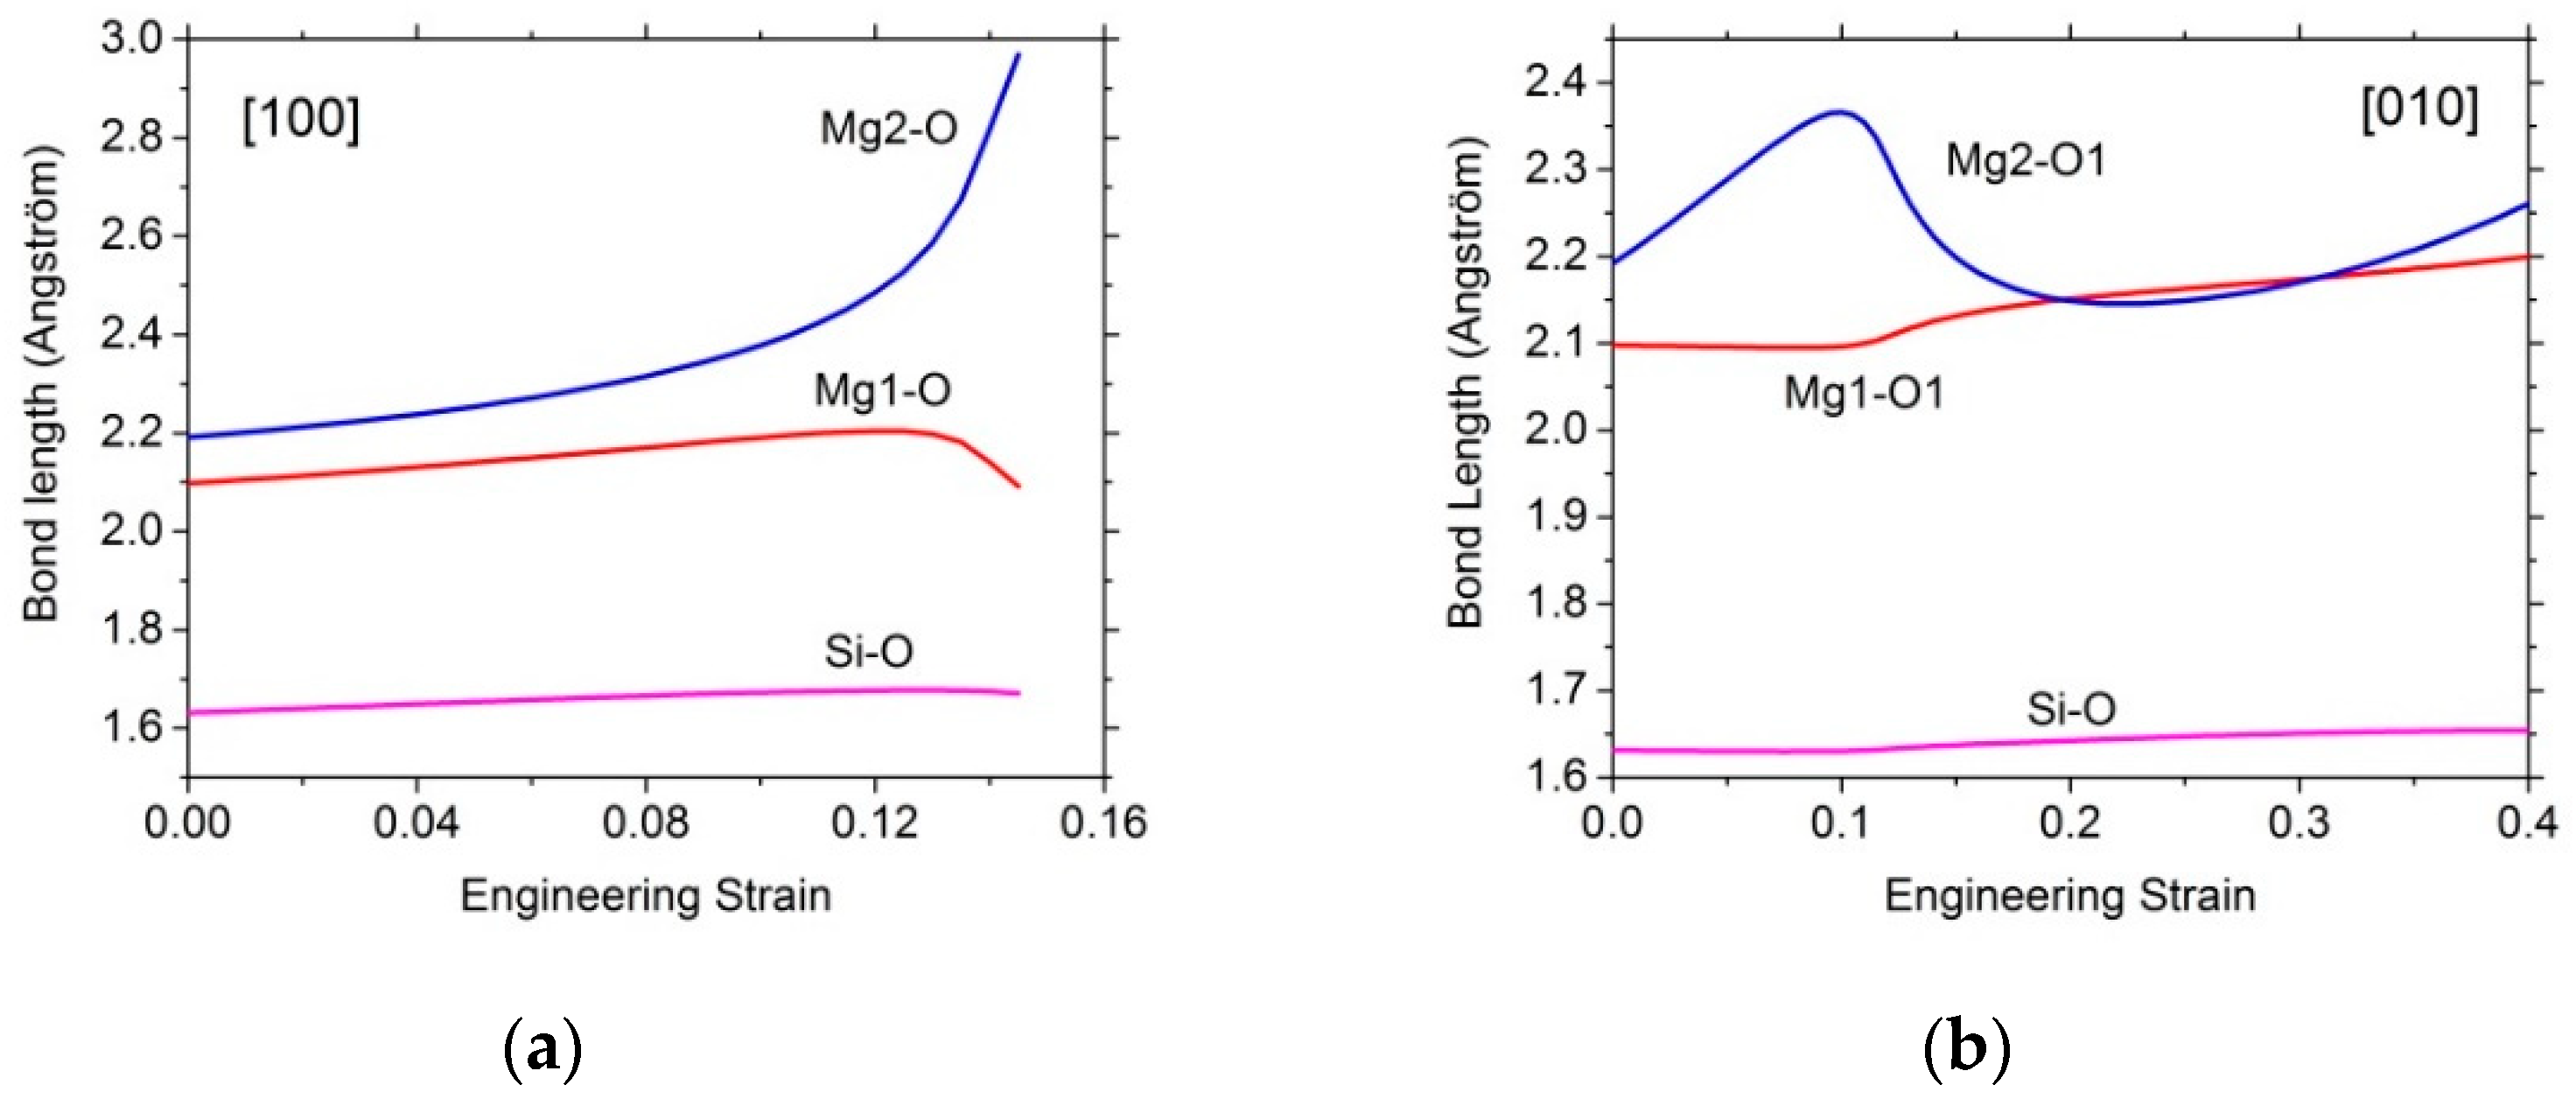
3.2.1. Tensile Tests
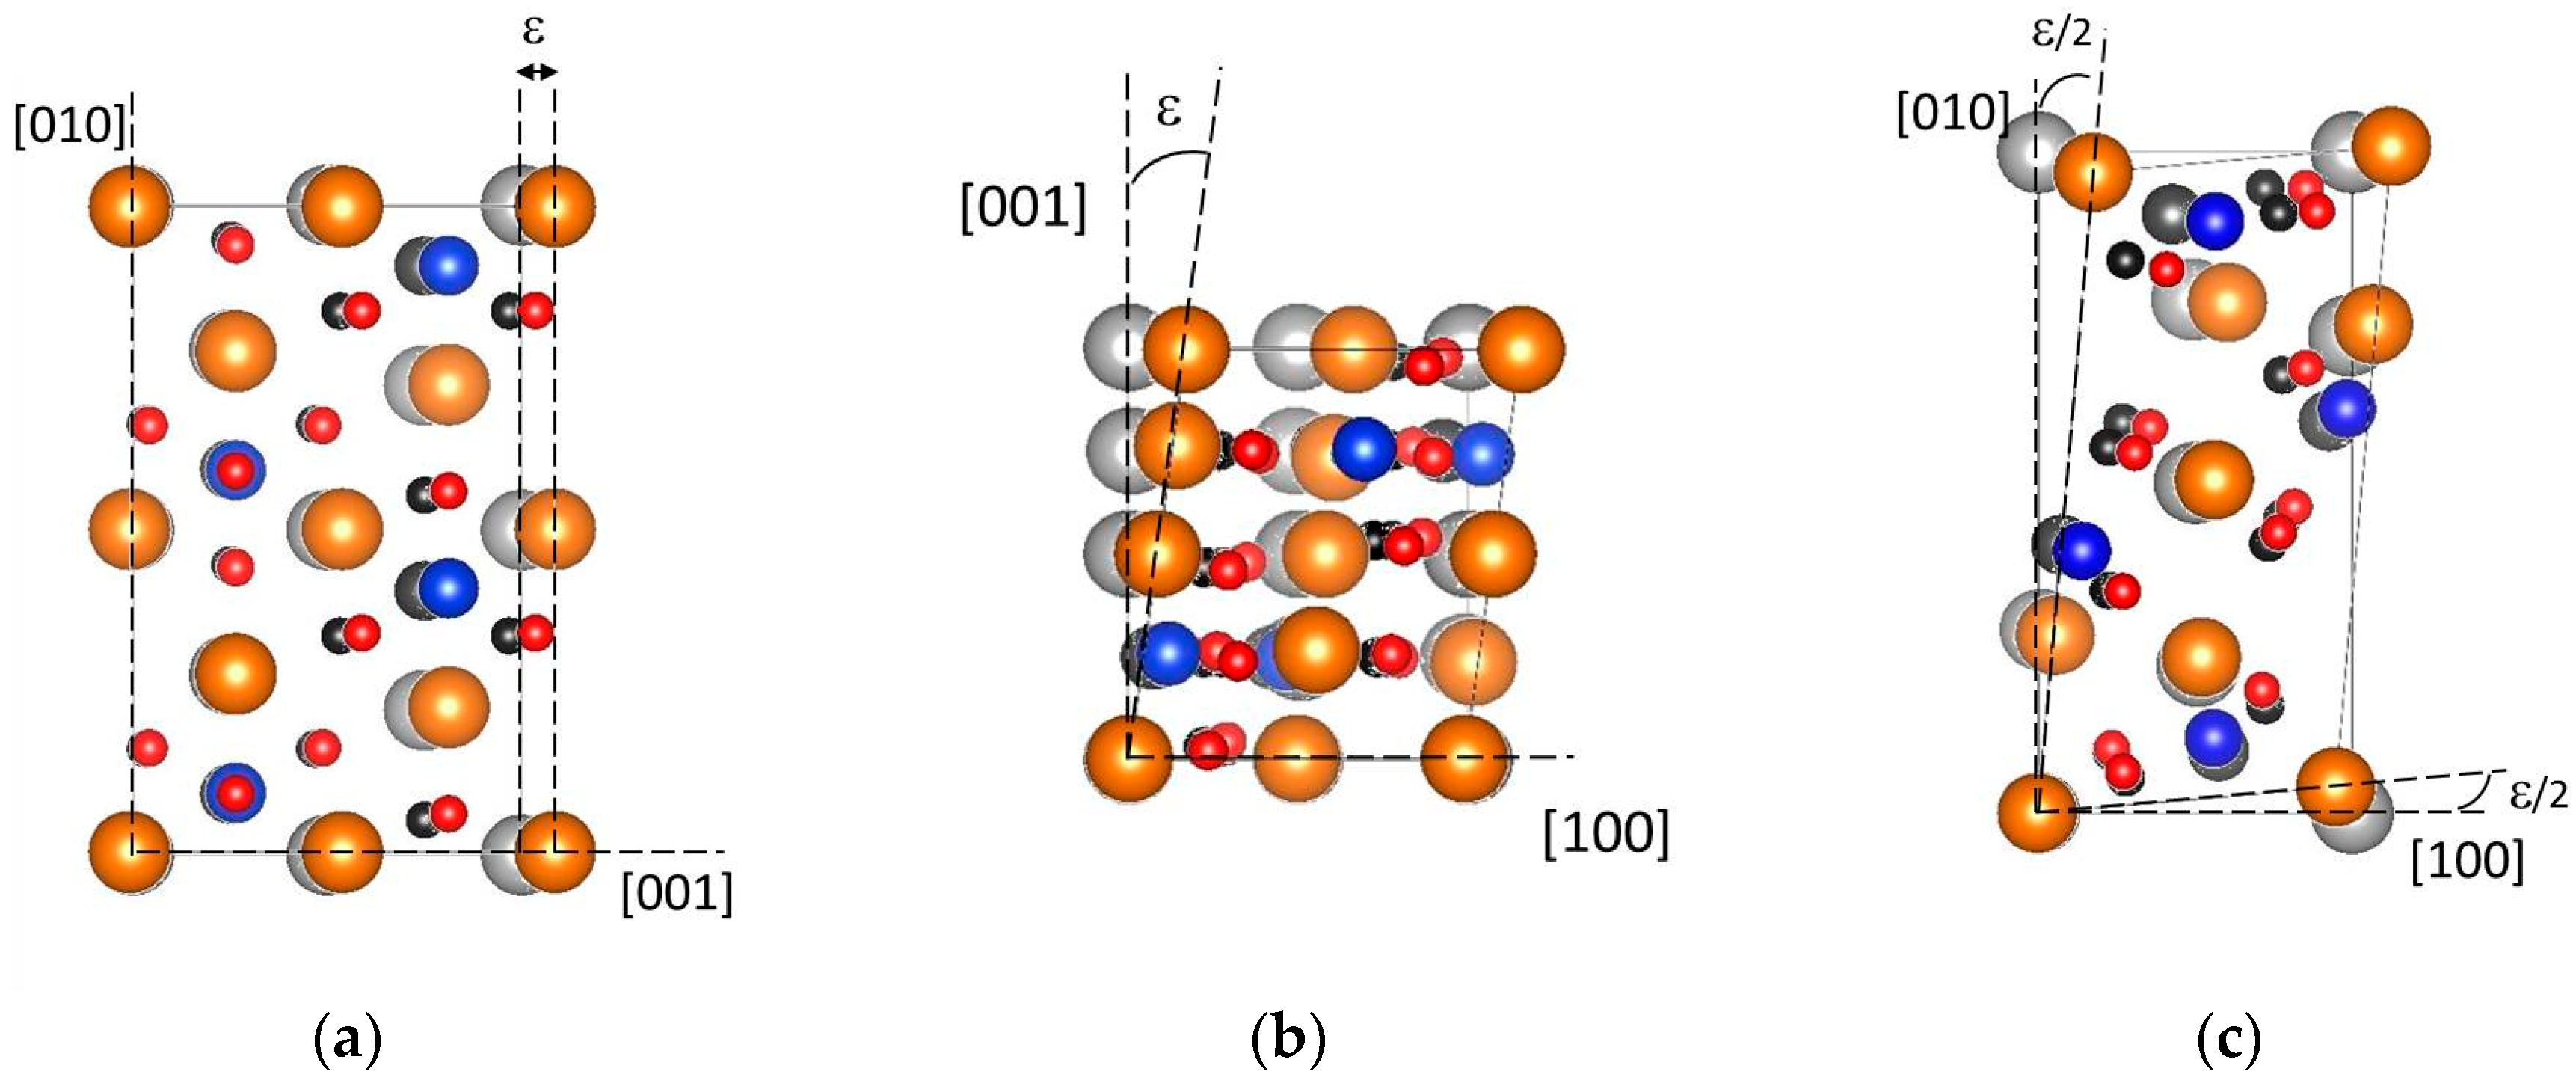
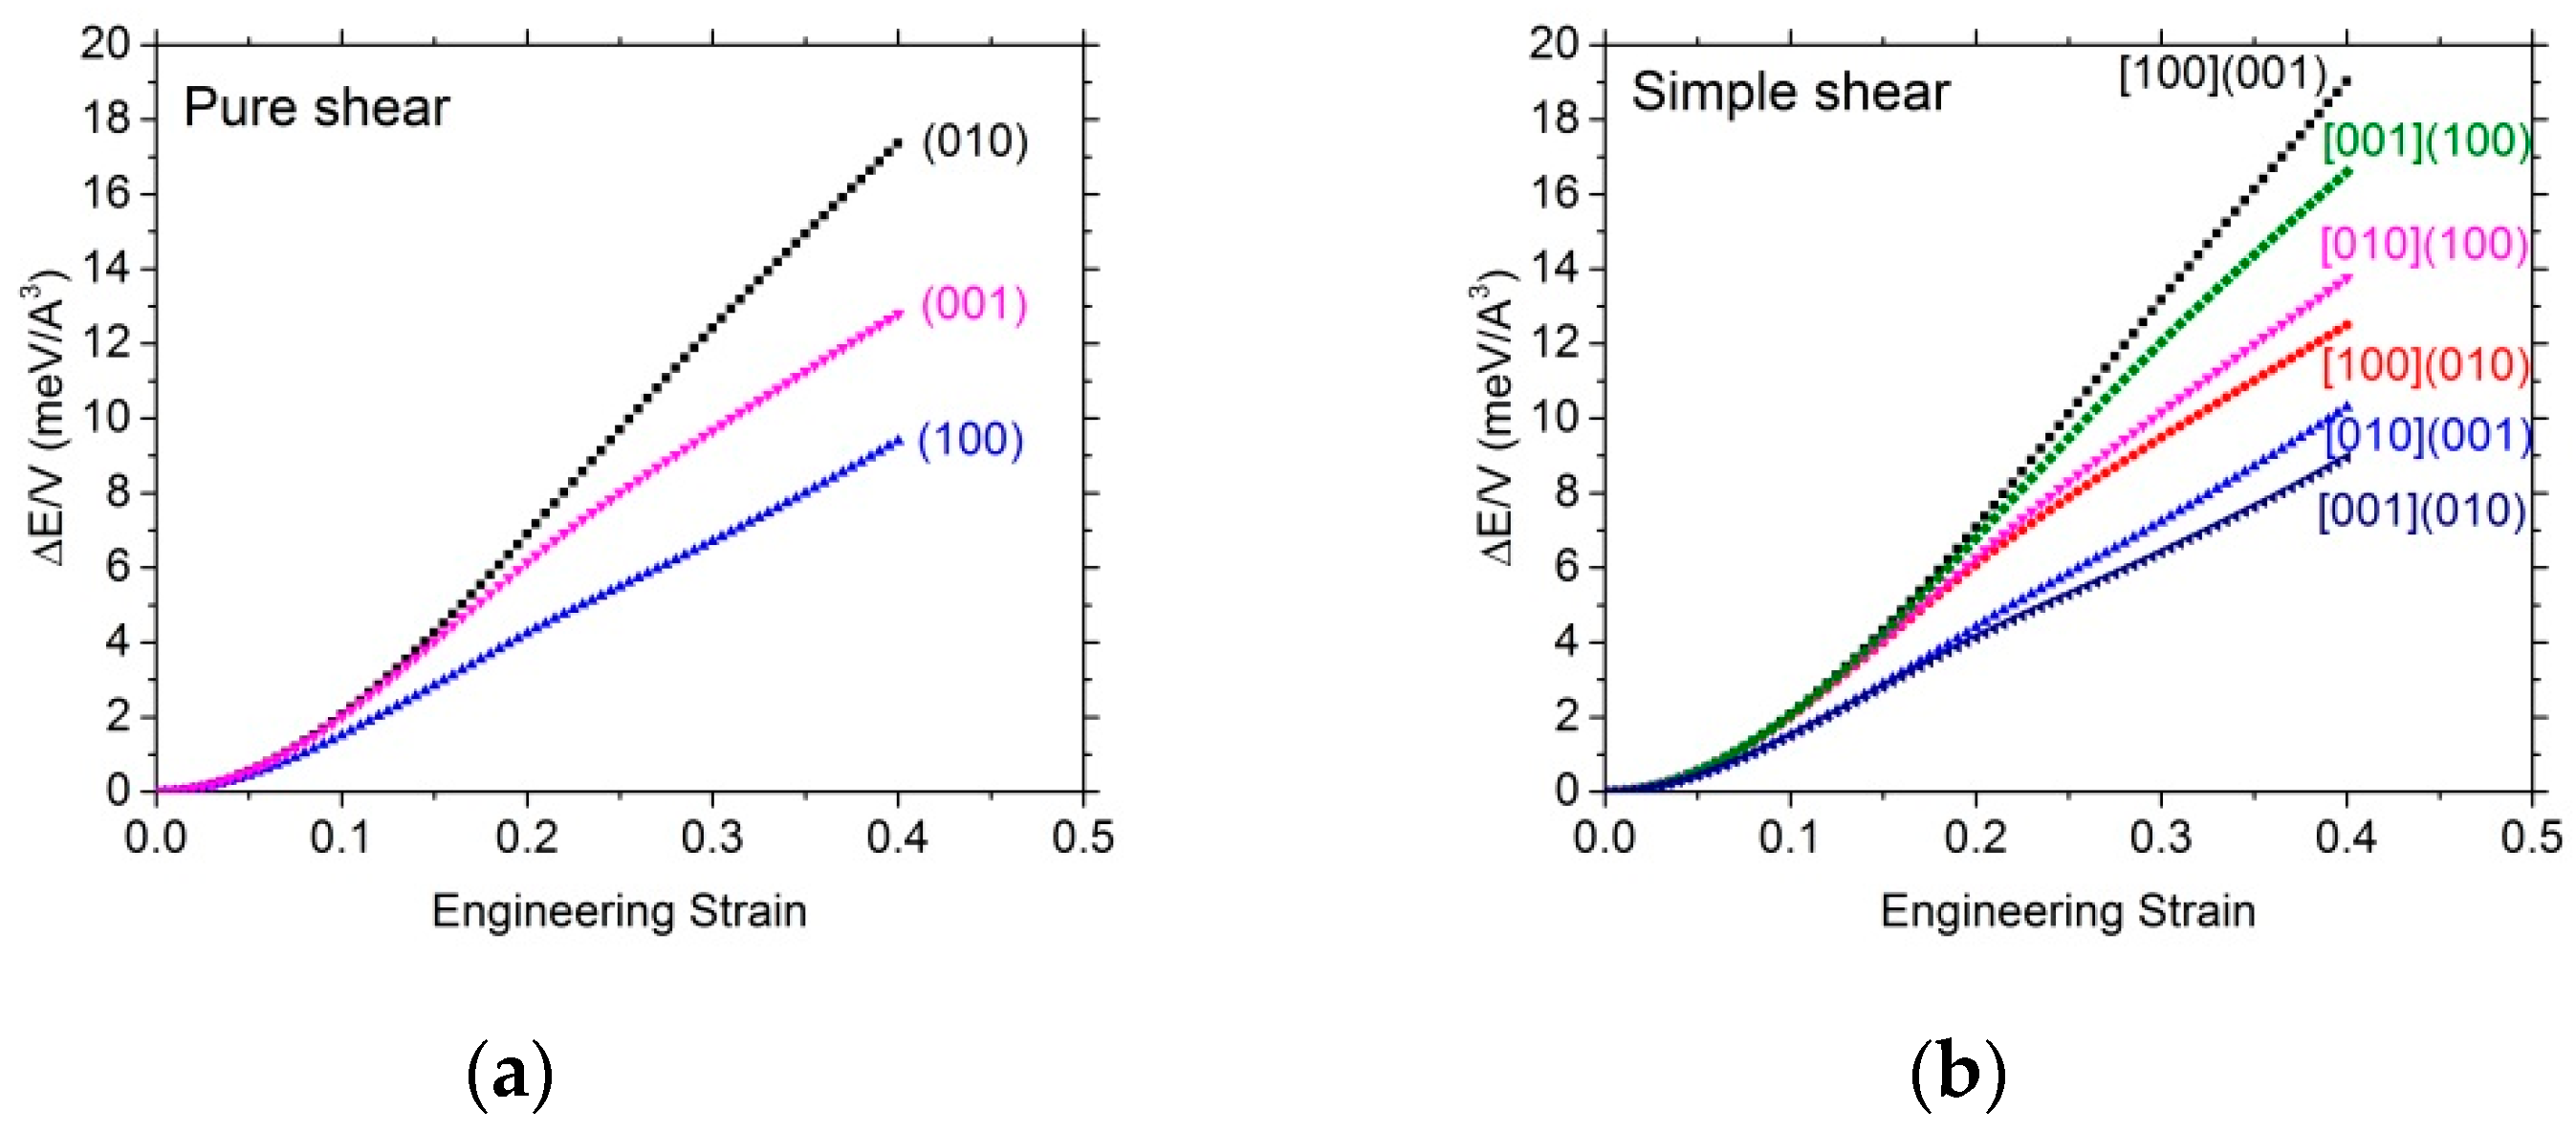
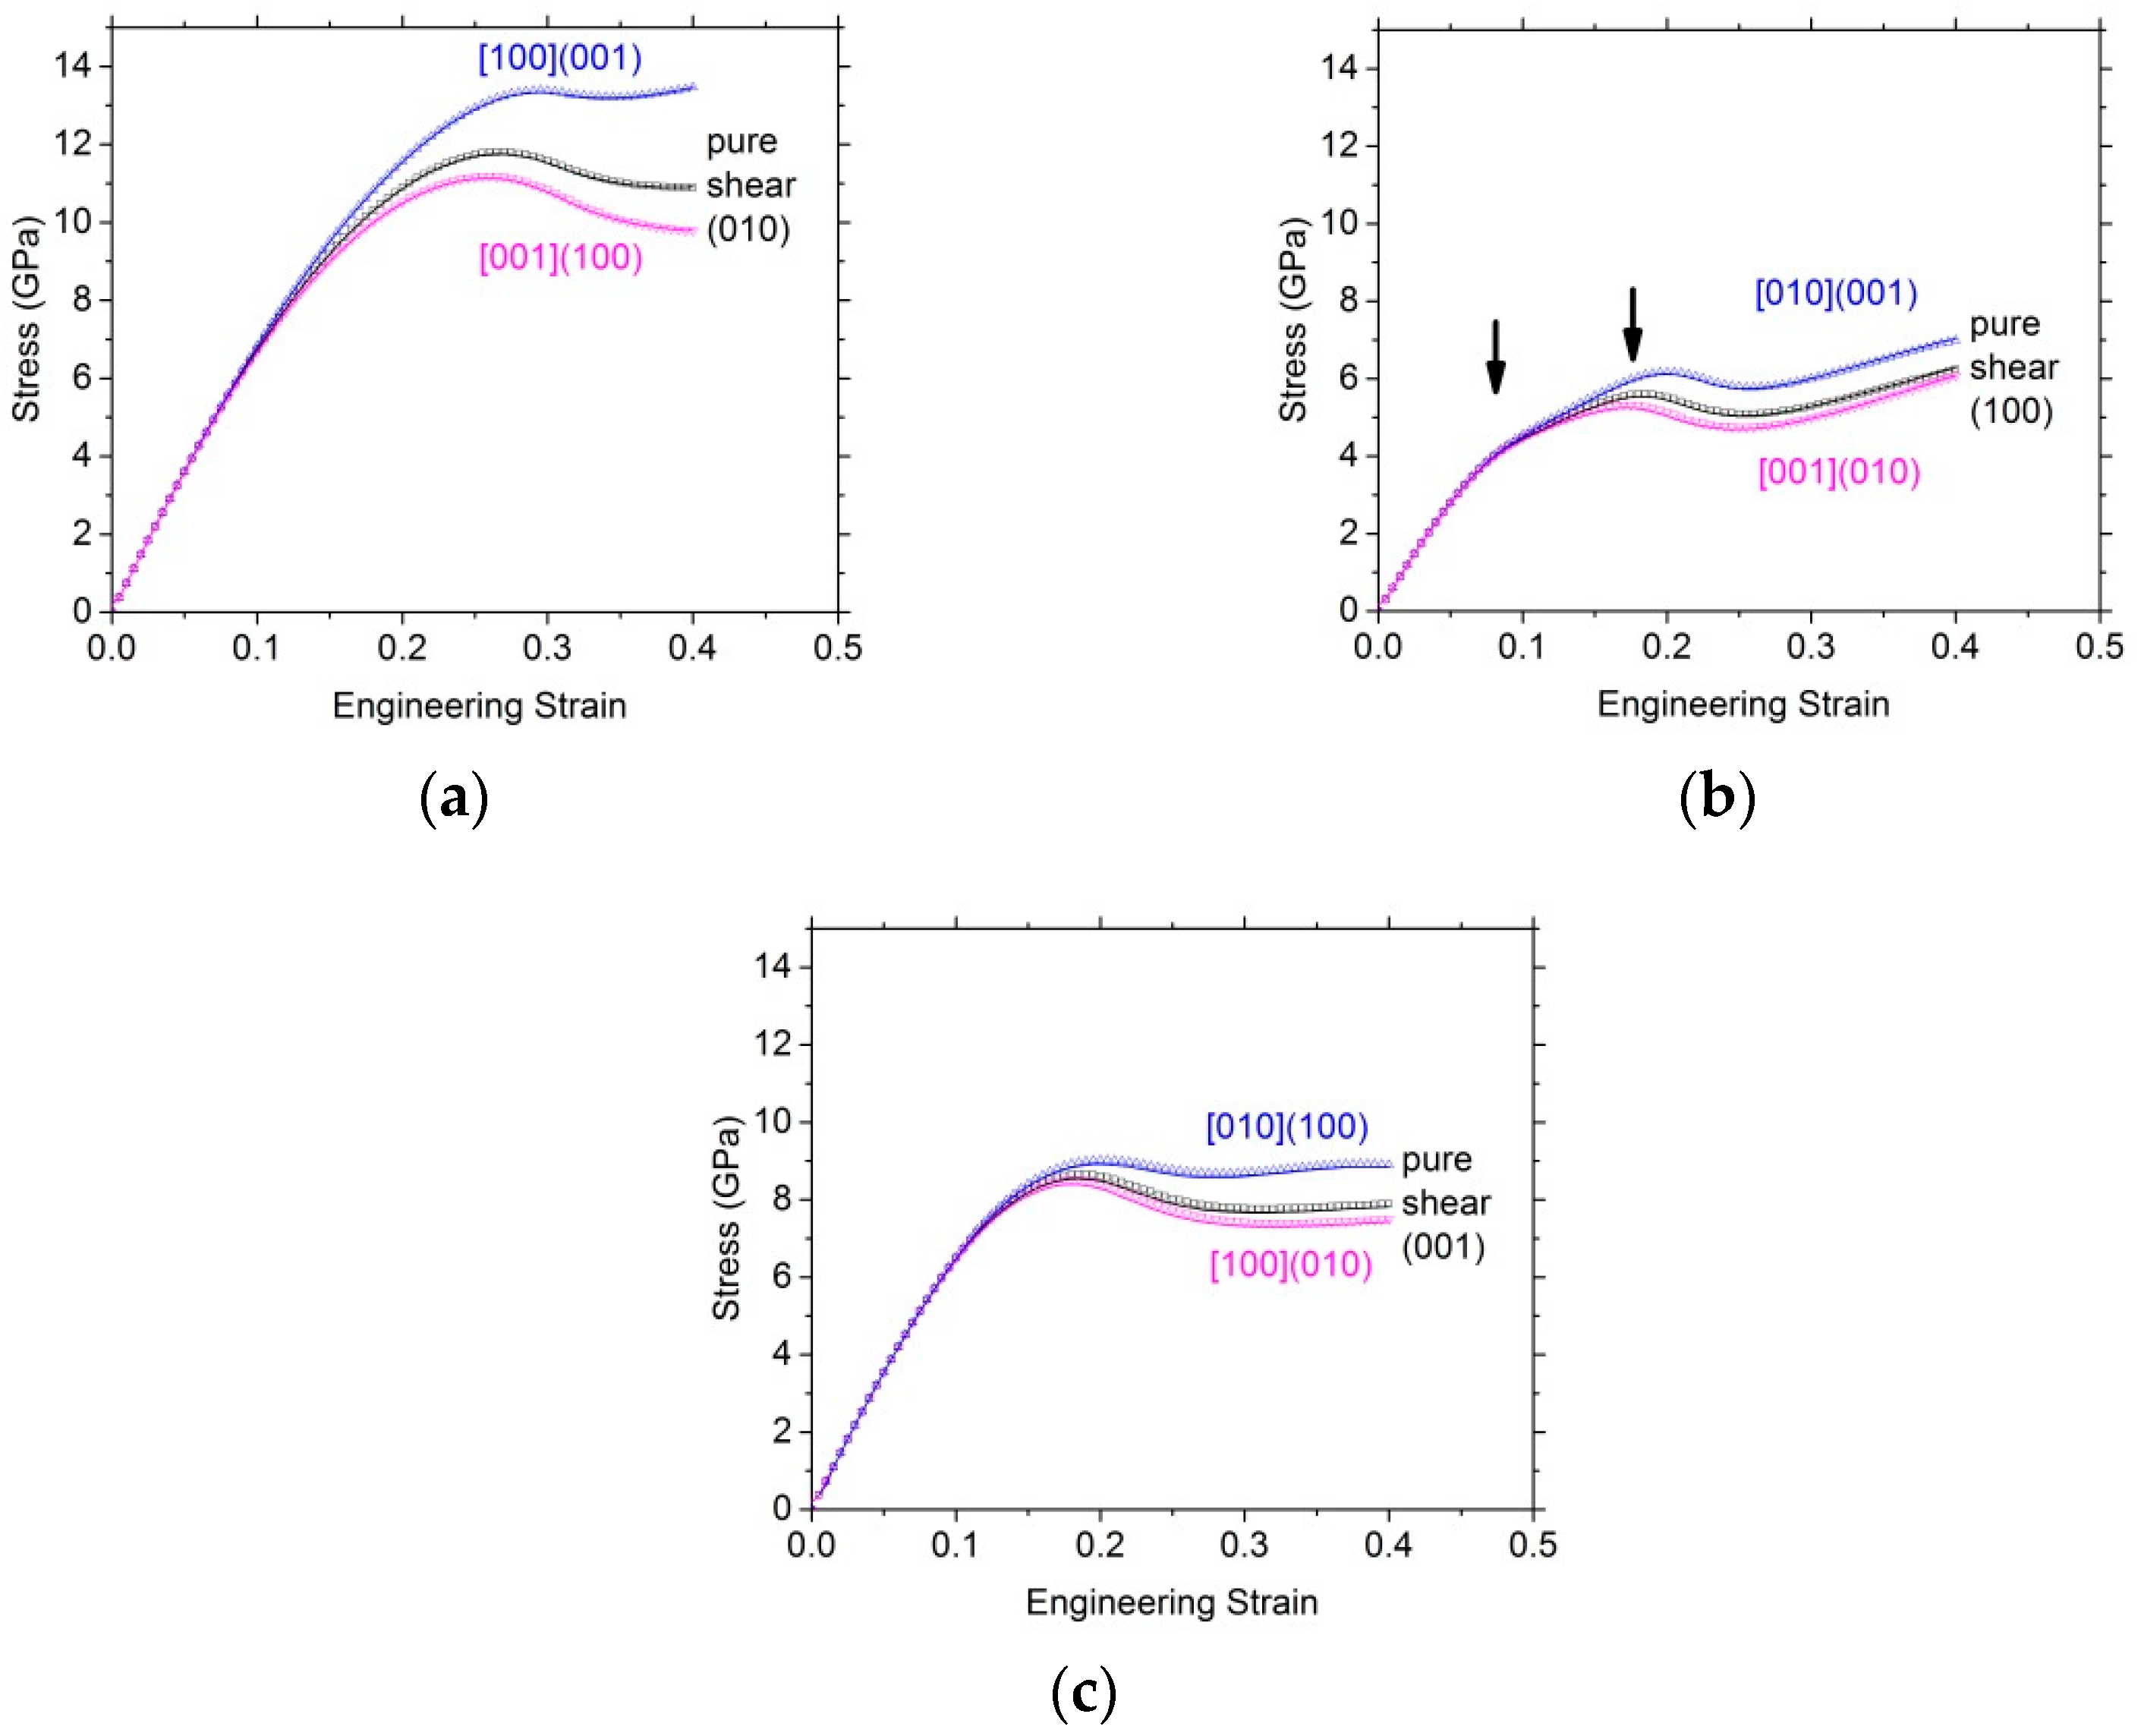
The evolutions of the total energy as a function of strain are reported in Figure 2a for tensile experiments performed along [100], [010] and [001]. As expected, one observes first, for the three tensile tests, a parabolic evolution corresponding to elastic energy storing which corresponds to the initial linear portion of the stress–strain curves (Figure 2b). The elastic anisotropy of the structure is readily visible from the slope of the stress–strain curves. Pulling along the [100] axis leads to the largest Young’s modulus (Table 2). The same conclusion arises from the computation of the Poisson ratios. Indeed, since during tensile tests, transverse directions are fully relaxed, we are able to determine the corresponding Poisson ratios (summarized in Table 3) according to the variation of the transverse lattice parameters. Except for the [100] tensile experiment, the computed Poisson ratio are close to 0.25, i.e., in agreement with what can be deduced from Voigt–Reuss averaging. Thus, the [100] direction exhibits a peculiar behavior in tension which may be related to the distorted hexagonal closed packing of the oxygen sublattice as pointed out by [30].
For the three tests, we observe an inflection point on the energy curve which corresponds, by convention, to the maximum (or ideal) tensile strength (ITS). With the corresponding stress–strain curves shown in Figure 2b, one may notice the remarkable agreement between the Cauchy stress derivation (solid line) obtained by derivation of the energy and the stress state (according to the Hellmann–Feynman theorem) of the strained volume (symbols). Whatever the investigated pulling directions, the instability in tension is reached for rather comparable strains (11–16%). However, the magnitudes of the ideal stresses are strongly dependent on the crystallographic direction showing, again, the anisotropy of the forsterite crystal structure. Pulled along the [100] axis, forsterite can indeed sustain the highest stress, i.e., 29.3 GPa and 13% of strain, whereas the instability is reached for a stress equal to 12.1 GPa, at a critical strain of 11% along [010] and for 15.9 GPa at 16% along the [001] axis. The behavior just after the stability limit is also contrasted. For [100] tensile loading, stress drops rapidly above the critical strain. For loading along [001], stress decreases progressively after the maximum. The case of [010] loading attracts attention since after the critical strain, one observes a first softening stage followed by a strain stiffening which allows the structure to sustain the stress and reach further strains.

3.2.2. Shear Tests

Nine ideal shear deformation tests have been performed within this study. Six experiments correspond to simple shear and three to pure shear. The evolutions of the energy as a function of the engineering strain are shown Figure 3, and the corresponding stress–strain curves are shown Figure 4. The initial slopes of the stress–strain curves give the shear moduli Cii (with i = 4, 5, or 6 in Voigt notations). In Figure 4, the results are presented in three groups, each corresponding to a pure shear deformation test associated with the two related simple shear experiments. The three groups naturally emerge from Figure 3. A first set, involving [100](001), [001](100) simple shear deformation and pure shear in (010), corresponds to the highest energy curves. On the opposite side, applying [010](001) or [001](010) simple shear deformation or pure shear in (100) corresponds to the smallest energy increase. In between, the last set of experiments corresponds to simple shear [100](010) and [010](100), and pure shear in (001).
The correspondence between the different configurations tested within each group appears clearly on the stress–strain curves (Figure 4). Within each group, all curves superimpose within the elastic regime. According to the slopes of the stress–strain curves, we find C44 = 58.7 GPa, C55 = 73.7 GPa and C66 = 73 GPa in agreement with the elastic properties of olivine found experimentally [31,32] or numerically [26]. Moreover, in each group, the pure shear stress–strain curve lies in between the simple shear stress–strain curves until the instability is reached. At the ISS, the stress differences between simple or pure shear tests are within a few GPa. Critical strains and ISS are summarized in Table 1.
The largest ISS (Figure 4a) corresponds to the first group of experiments reported above, with [100](001) and [001](100) simple shears and pure shear in (010) with ISS between 11.2 and 13.4 GPa. For the other shear deformation experiments, the instability of the structure occurs at lower stress and lower strain. The softest group (shown Figure 4b), corresponds to [010](001) and [001](010) simple shear deformations, and pure shear in (100) with ISS between 5.3 and 6.2 GPa. It is worth noting that this shear mode exhibits a more complex behavior with the instability preceded by an inflection in the stress–strain curves, followed by significant strain stiffening.

4. Discussion and Conclusions

The main objective of this work is to investigate the mechanical response of forsterite to applied strains until it becomes mechanically unstable. Before reaching this point, the crystal is strained in the linear elastic regime and all energy–strain curves first exhibit a parabolic regime. This allows us to determine elastic moduli which, with the calculated lattice parameters, validate our calculations.
The ITS, defined as the first maximum of the stress–strain curve, are 29.3, 12.1, and 15.9 GPa along the [100], [010], and [001] directions respectively. With a 2.4 ratio between the extreme values, the ITS illustrate the anisotropy of orthorhombic forsterite which follows quite well the elastic behavior since, normalized by the Young’s modulus, all ITS values are of the order of 0.1 (Table 2). It is striking however, that loading along different directions leads to contrasted behaviors at the instability. To understand the origin of the differences of the stress–strain curves, we follow the evolution of the bond lengths as a function of strain. The tensile direction which corresponds to the higher stiffness is [100]. The stress drops abruptly after the maximum. Figure 5a shows how the Mg–O bond lengths evolve for the two magnesium sites in forsterite, called Mg1 and Mg2. It appears that the stress maximum corresponds to a divergence of the Mg2–O bond. The authors of [33] show that the strength of metallic bond in oxides correlate with their lengths. Above 2.5 Å, the Pauli strength decreases drastically, and the bond loses its strength. This is what occurs at the inflection point of the energy curve when forsterite is strained along [100]. Loading forsterite in tension along [010] and [100] leads to different behaviors. The case of tension along [010] is interesting since after the maximum, the stress first decreases before stabilizing and progressively stiffening up to an engineering strain of 0.4. Again, the origin of this behavior is found in the bond distances as shown in Figure 5b. After a first increase from 2.2 to ca. 2.35 Å, the Mg2–O bond length decreases to recover its original value in the strain interval 0.2–0.3 before increasing again. On both Figure 5a,b, one can see that the SiO4 tetrahedra are not affected by the loading since the Si–O distances remain almost constant. This is a general observation for all solicitations investigated here which illustrates the stiffness of the ionocovalent Si–O bond.
It must be noted that care is needed when discussing the behavior beyond the instability since the system may evolve with structural modifications which may be constrained by the choice of the system size [34], especially when bonds are broken, leading to structural reconstruction [35] like in the [100] tensile test.
In shear we observe, as in tension, that the ISS follow quite well the elastic anisotropy with normalized values (Table 2) in between 0.1 and 0.18. The authors of [18] have compiled the ISS of several simple metals and ceramics. Most metals exhibit normalized ISS above 0.005 and below 0.15 when oxides (MgO, CaO) are slightly above 0.15. Normalized ISS of covalent materials (C, SiC, Si3N4) are around 0.2. Our results on forsterite are consistent with this general pattern since the resistance of the structure depends on the Mg–O bonds mostly.
For all tests, we observe that the pure shear is bracketed by the two related simple shears. The shear tests presented in Figure 4b present several interesting features. They correspond to the weakest shear directions with ISS of the order of 6 GPa. Also the stress–strain curves exhibit a change of slope (at ca. 10%, marked by the left arrow on Figure 4b) before the instability (marked by the right arrow) followed by a significant stiffening after the instability. To analyze these features, we compute the Mg–O bond lengths. Results corresponding to the [010](001) shear test are presented on Figure 6. At the first change of slope (just before 10% strain), one observes (Figure 6b) that one Mg2 shows a bond divergence (with O9). A second similar feature (bond breakage between Mg2 and O1) is responsible for the instability. However, in parallel, several Mg–O bonds show their distances decrease significantly (below 2Å) which result in the significant stiffening observed. Such features, with new bond formation or reorganization under large strain, has also been reported in various crystalline solids (for instance in cementite Fe3C) leading to a strong strain-stiffening effect [36] as observed here in forsterite.
Olivine is not stable at high pressure. At mantle temperatures, (Mg0.9, Fe0.1)2SiO4 olivine transforms into wadsleyite at ca. 13 GPa and then to ringwoodite at ca. 18 GPa. At room temperature, these reconstructive phase transformations are kinetically hindered and the olivine structure can be further compressed until it collapses to an amorphous phase above ca. 40 GPa [9,14]. The onset of pressure induced amorphization varies depending on the composition, the type of loading (static, dynamic), but also, although this is less constrained, on non-hydrostaticity as pointed out by [12] and [37]. Here, we characterize the limit of mechanical stability of forsterite without confining pressure and under tensile and shear loading. We show that the onset of instability can be as low as 5–6 GPa for some shear conditions (Table 2). Such deviatoric stress conditions can be reached in nanoindentation, which can significantly facilitate high pressure phase transitions and lower the pressure threshold. Evidence for amorphization has been reported under contact loading in silicon [38] and in boron carbide [39]. Nanoindentation has been performed recently on olivine by [40,41], however, no microstructural investigation was conducted to show a possible amorphization. Such characterizations should provide a test for our theoretical predictions.

Author Contributions

Conceptualization, P.C. (Patrick Cordier); methodology, P.C. (Philippe Carrez); validation, P.C. (Philippe Carrez); investigation, K.G.; writing—original draft preparation, K.G.; writing—review and editing, P.C. (Philippe Carrez) and P.C. (Patrick Cordier); funding acquisition, P.C. (Patrick Cordier).

Funding

This research was funded by European Research Council (ERC) under the European Union’s Horizon 2020 Research and Innovation Programme under grant agreement No 787198—TimeMan.

Conflicts of Interest

The authors declare no conflict of interest.

References

  1. Fogerty, S.; Forrest, W.; Watson, D.M.; Sargent, B.A.; Koch, I. Silicate Composition of the Interstellar Medium. Astrophys. J. 2016, 830, 71. [Google Scholar] [CrossRef]
  2. Zolensky, M.E.; Zega, T.J.; Yano, H.; Wirick, S.; Westphal, A.J.; Weisberg, M.K.; Weber, I.; Warren, J.L.; Velbel, M.A.; Tsuchiyama, A. Mineralogy and petrology of comet 81P/Wild 2 nucleus samples. Science 2006, 314, 1735–1739. [Google Scholar] [CrossRef] [PubMed] [Green Version]
  3. Brearley, A.J.; Jones, R.H.; Papike, J.J. (Eds.) Chondritic meteorites. Planetary Materials. In Review in Mineralogy; Mineralogical Society of America: Chantilly, VA, USA, 1998; Volume 36, p. C1. [Google Scholar]
  4. Mittlefehldt, D.W.; McCoy Timothy, J.; Goodrich, C.A.; Kracher, A. Non-chondritic meteorites from asteroidal bodies. Rev. Miner. Geochem. 1998, 36, 4.1–4.195. [Google Scholar]
  5. Ringwood, A.E. Phase transformations and their bearing on the constitution and dynamics of the mantle. Geochim. Cosmochim. Acta 1991, 55, 2083–2110. [Google Scholar] [CrossRef]
  6. Richet, P.; Leclerc, F.; Benoist, L. Melting of forsterite and spinel, with implications for the glass transition of Mg2SiO4 liquid. Geophys. Res. Lett. 1993, 20, 1675–1678. [Google Scholar] [CrossRef]
  7. Jeanloz, R.; Ahrens, T.; Lally, J.S.; Nord, G.L.; Christie, J.M.; Heuer, A.H. Shock-Produced Olivine Glass: First Observation. Science 1977, 197, 457–459. [Google Scholar] [CrossRef]
  8. Lacam, A.; Madon, M.; Poirier, J.P. Olivine glass and spinel formed in a diamond anvil high-pressure cell. Nature 1980, 288, 155–157. [Google Scholar] [CrossRef]
  9. Williams, Q.; Knittle, E.; Reichlin, R.; Martin, S.; Jeanloz, R. Structural and electronic properties of Fe2SiO4-fayalite at ultrahigh pressures: Amorphization and gap closure. J. Geophys. Res. 1990, 95, 21549–21563. [Google Scholar] [CrossRef]
  10. Richard, G.; Richet, P. Room-temperature amorphization of fayalite and high-pressure properties of Fe2SiO4 liquid. Geophys. Res. Lett. 1990, 17, 2093–2096. [Google Scholar] [CrossRef]
  11. Guyot, F.; Reynard, B. Pressure-induced structural modifications and amorphization in olivine compounds. Chem. Geol. 1992, 96, 411–420. [Google Scholar] [CrossRef]
  12. Andrault, D.; Bouhifd, M.A.; Itie, J.P.; Richet, P. Compression and amorphization of (Mg,Fe)2SiO4 olivines: An X-ray diffraction study up to 70 GPa. Phys. Chem. Min. 1995, 22, 99–107. [Google Scholar] [CrossRef]
  13. Finkelstein, G.J.; Dera, P.K.; Jahn, S.; Oganov, A.R.; Holl, C.M.; Meng, Y.; Duffy, T.S. Phase transitions and equation of state of forsterite to 90 GPa from single-crystal X-ray diffraction and molecular modeling. Am. Miner. 2014, 99, 35–43. [Google Scholar] [CrossRef]
  14. Santamaria-Perez, D.; Thomson, A.; Segura, A.; Pellicer-Torres, J.; Manjon, F.J.; Corà, F.; McColl, K.; Wilson, M.; Dobson, D.; McMillan, P.F. Metastable structural transformations and pressure-induced amorphization in natural (Mg,Fe)2SiO4 olivine under static compression: A Raman spectroscopic study. Am. Miner. 2016, 101, 1642–1650. [Google Scholar] [CrossRef] [Green Version]
  15. Li, W.; Wang, T. Ab initio investigation of the elasticity and stability of aluminium. J. Phys. Condens. Matter. 1998, 10, 9889–9904. [Google Scholar] [CrossRef] [Green Version]
  16. Roundy, D.; Krenn, C.R.; Cohen Marvin, L.; Morris, J.W., Jr. Ideal Shear Strengths of fcc Aluminum and Copper. Phys. Rev. Lett. 1999, 82, 2713–2716. [Google Scholar] [CrossRef]
  17. Ogata, S.; Kitagawa, H. Ab initio tensile testing simulation of aluminum and aluminum nitride ceramics based on density functional theory. Comput. Mater. Sci. 1999, 15, 435–440. [Google Scholar] [CrossRef]
  18. Ogata, S.; Li, J.; Hirosaki, N.; Shibutani, Y.; Yip, S. Ideal shear strain of metals and ceramics. Phys. Rev. B 2004, B70, 104404. [Google Scholar] [CrossRef] [Green Version]
  19. Yip, S.; Li, J.; Tang, M.; Wang, J. Mechanistic aspects and atomic-level consequences of elastic instabilities in homogeneous crystals. Mater. Sci. Eng. 2001, A317, 236–240. [Google Scholar] [CrossRef]
  20. Zhang, S.H.; Fu, Z.H.; Zhang, R.F. ADAIS: Automatic Derivation of Anisotropic Ideal Strength via high-throughput first-principles computations. Comput. Phys. Commun. 2019, 238, 244–253. [Google Scholar] [CrossRef] [Green Version]
  21. Kresse, G.; Furthmüller, J. Efficient iterative schemes for ab initio total-energy calculations using a plane-wave basis set. Phys. Rev. 1996, B54, 11169. [Google Scholar] [CrossRef]
  22. Perdew, J.P.; Wang, Y. Accurate and simple analytic representation of the electron-gas correlation energy. Phys. Rev. 1992, B45, 13244–13249. [Google Scholar] [CrossRef] [PubMed]
  23. Wang, Y.; Perdew, J.P. Correlation hole of the spin-polarised electron-gas, with exact small-wave-vector and high-density scaling. Phys. Rev. 1991, B44, 13298–13307. [Google Scholar] [CrossRef] [PubMed]
  24. Hernandez, E.R.; Brodholt, J.; Alfe, D. Structural, vibrational and thermodynamic properties of Mg2 SiO4 and MgSiO3 minerals from first-principles simulations. Phys. Earth Planet. Inter. 2015, 240, 1–24. [Google Scholar] [CrossRef]
  25. Monkhorst, H.J.; Pack, J.D. Special points for Brillouin-zone integrations. Phys. Rev. 1976, B13, 5188–5192. [Google Scholar] [CrossRef]
  26. Durinck, J.; Legris, A.; Cordier, P. Influence of crystal chemistry on ideal plastic shear anisotropy in forsterite: First principle calculations. Am. Miner. 2005, 90, 1072–1077. [Google Scholar] [CrossRef]
  27. Brodholt, J. Ab initio calculations on point defects in forsterite (Mg2SiO4) and implications for diffusion and creep. Am. Miner. 1997, 82, 1049–1053. [Google Scholar] [CrossRef]
  28. Brodholt, J.; Patel, A.; Refson, K. An ab initio study of the compressional behavior of forsterite. Am. Miner. 1996, 81, 257–260. [Google Scholar] [CrossRef]
  29. Fujino, K.; Sasaki, S.; Takeuchi, Y.; Sadanaga, R. X-ray determination of electron distributions in forsterite, fayalite, and tephroite. Acta Cryst. 1981, B37, 513–518. [Google Scholar] [CrossRef]
  30. Poirier, J.-P. On the slip systems of olivine. J. Geophys. Res. 1975, 80, 4059–4061. [Google Scholar] [CrossRef]
  31. Webb, S.L. The elasticity of the upper mantle orthosilicates olivine and garnet to 3 GPa. Phys. Chem. Miner. 1989, 16, 684–692. [Google Scholar] [CrossRef]
  32. Zha, C.-S.; Duffy, T.S.; Downs, R.T.; Mao, H.-K.; Hemley, R.J.; Weidner, D.J. Single-Crystal Elasticity of the α and β of Mg2SiO4 Polymorphs at High Pressure. In Properties of Earth and Planetary Materials at High Pressure and Temperature; Manghnani, M.H., Yagi, T., Eds.; American Geophysical Union: Washington, DC, USA, 1998; Geophysical Monograph; Volume 101, pp. 9–16. [Google Scholar]
  33. Gibbs, G.V.; Hill, F.C.; Boisen, M.B.; Downs, R.T. Power law relationships between bond length, bond strength and electron density distributions. Phys. Chem. Min. 1998, 25, 585–590. [Google Scholar] [CrossRef]
  34. Jahnátek, M.; Hafner, J.; Krajčí, M. Shear deformation, ideal strength, and stacking fault formation of fcc metals: A density-functional study of Al and Cu. Phys. Rev. B 2009, B79, 224103. [Google Scholar] [CrossRef]
  35. Garvik, N.; Carrez, P.; Cordier, P. First-principles study of the ideal strength of Fe3C cementite. Mater. Sci. Eng. 2013, A572, 25–29. [Google Scholar] [CrossRef]
  36. Jiang, C.; Srinivasan, S.G. Unexpected strain-stiffening in crystalline solids. Nature 2013, 496, 339–342. [Google Scholar] [CrossRef] [PubMed]
  37. Machon, D.; Meersman, F.; Wilding, M.C.; Wilson, M.; McMillan, P.F. Pressure-induced amorphization and polyamorphism: Inorganic and biochemical systems. Prog. Mater. Sci. 2014, 61, 216–282. [Google Scholar] [CrossRef]
  38. Saka, H.; Shimatani, A.; Suganuma, M.S. Transmission electron microscopy of amorphization and phase transformation beneath indents in Si. Philos. Mag. A 2002, 82, 1971–1981. [Google Scholar] [CrossRef]
  39. Ge, D.; Domnich, V.; Juliano, T.; Stach, E.A.; Gogotsi, Y. Structural damage in boron carbide under contact loading. Acta Mater. 2004, 52, 3921–3927. [Google Scholar] [CrossRef]
  40. Kranjc, K.; Rouse, Z.; Flores, K.M.; Skemer, P. Low temperature plastic rheology of olivine determined by nanoindentation. Geophys. Res. Lett. 2015, 43, 176–184. [Google Scholar] [CrossRef]
  41. Kumamoto, K.M.; Thom, C.A.; Wallis, D.; Hansen, L.N.; Armstrong, D.E.J.; Warren, J.M.; Goldsby, D.L.; Wilkinson, A.J. Size effects resolve discrepancies in 40 years of work on low-temperature plasticity in olivine. Sci. Adv. 2017, 3, e1701338. [Google Scholar] [CrossRef] [Green Version]
Figure 1. Illustration of the various loading conditions applied in this study (a) tensile deformation along [001] where εzz = ε, (b) simple shear [001](100) where εxz = ε/2 and εzx = 0 , or (c) pure shear deformation in (001), where εxy = εyx = ε/2. The colored image represents a deformed state compared with the undeformed, reference structure in grey. Mg is in orange, Si in blue, O in red.
Minerals 09 00787 g001
Figure 2. (a) Evolution of the strain energy as a function of the engineering strain; (b) Stress as a function of the engineering strain. The tensile directions are [100] (black empty square), [001] (red empty circle), and [010] (green empty triangle). The instability occurs at the inflection point of the strain energy–strain curves, or the maximum of the stress–strain curves. In (b), the lines correspond to the Cauchy stress evaluations from the derivative of the energy curves shown in (a).
Minerals 09 00787 g002
Figure 3. Variation of the total energy as a function of the engineering strain calculated using a unit cell of forsterite (a) under pure shear deformation (b) under simple shear deformation, for the [100](001) (square), [100](010) (circle), [010](001) (up triangle), [010](100) (down triangle), [001](100) (diamond) and [001](010) (left triangle) shear deformations.
Minerals 09 00787 g003
Figure 4. Stress as a function of the engineering strain calculated using a unit cell of forsterite under shear deformation for (a) simple shear along [100](001) and [001](100) and pure shear in (010), (b) simple shear along [010](001) and [001](010) and pure shear in (100), and (c) simple shear along [100](010) and [010](100) and pure shear in (001). Arrows in (b) mark the occurrence of Mg–O bonds breaking as described in the discussion section.
Minerals 09 00787 g004
Figure 5. Typical bond lengths evolution as a function of strain for tensile deformation along (a) [100] and (b) [010]. Mainly because of the ionocovalency of the bond, Si–O bonds are rather unaffected by strain, whereas one may notice the differential behavior between Mg1 and Mg2 sites.
Minerals 09 00787 g005
Figure 6. Mg–O bond lengths for both (a) Mg1 and (b) Mg2 sites, as a function of the applied strain for [010](001) simple shear deformation. In (b), the two arrows highlight the breaking of Mg–O bonds at, respectively, first inflexion of the stress–strain curve and the instability as quoted in Figure 4b. The oxygen numbering refers to the labeled atoms shown in (c) and (d) within the unit cell of forsterite.
Minerals 09 00787 g006
Table 1. Crystallographic data for forsterite at 0 K and 0 GPa compared with calculated data.
a (Å)b (Å)c (Å)V3)
This study4.7910.276.03296.63
Calculated GGA [24]4.79 10.286.02296.43
Calculated GGA [26]4.79 10.286.04297.68
Calculated GGA [27]4.71 10.155.96284.92
Calculated LDA [28]4.649.996.07281.67
Experimental [29]4.7510.195.98289.58
Table 2. Ideal stresses (and associated engineering strains) determined in this study under tensile, pure and simple shear loading. For tensile and simple shear tests, we report also the Young’s modulus and Poisson ratio. The normalized stresses are the ideal stresses divided by the elastic modulus (Young’s modulus in tension and shear modulus in shear).
Tensile Tests[100][010][001]
ITS (GPa)29.312.115.9
Corresponding strain (%)13.011.516
Young’s modulus (GPa)274.4153.2170.9
Normalized stress0.100.080.09
Pure shear tests(100)(010)(001)
ISS (GPa)5.611.88.7
Corresponding strain (%)18.526.518.5
Simple shear tests[010](001)[001](010)[100](001)[001](100)[010](100)[100](010)
ISS (GPa)6.25.313.411.29.08.5
Corresponding strain (%)201829.5262018
Shear modulus (GPa)58.7
(i.e., C44)
58.7
(i.e., C44)
73.7
(i.e., C55)
73.7
(i.e., C55)
73.0
(i.e., C66)
73.0
(i.e., C66)
Normalized stress0.100.090.180.150.120.11
Table 3. Poisson ratio determined in this study under tensile tests for strains below 5%.
Tensile Tests[100][010][001]
υ[100]-0.130.14
υ[010]0.23-0.29
υ[001]0.200.24-

