Article

Effect of a Small Amount of Iron Impurity in Sphalerite on Xanthate Adsorption and Flotation Behavior

1
Beijing General Research Institute of Mining and Metallurgy, Beijing 100160, China
2
State Key Laboratory of Mineral Processing, BGRIMM Technology Group, Beijing 100160, China
*
Author to whom correspondence should be addressed.
Minerals 2019, 9(11), 687; https://doi.org/10.3390/min9110687
Submission received: 9 October 2019 / Revised: 31 October 2019 / Accepted: 4 November 2019 / Published: 6 November 2019
(This article belongs to the Special Issue Hydrometallurgical Processing of Base Metal Sulphides)

Abstract

:
Through industrial testing at the Huize lead-zinc mine, it was found that the floatability of sphalerite varied greatly with the iron impurity content. Three kinds of Huize sphalerites with iron contents of 2.30 wt.%, 3.20 wt.% and 4.66 wt.%, were used to study the influence of small amounts of iron impurity in the sphalerite on xanthate adsorption and flotation behavior. The flotation experiments showed that the flotation recovery increased with the increase in iron impurity content. Fourier Transform infrared spectroscopy (FTIR) and Ultraviolet–visible (UV-VIS) spectra showed that the adsorbed products of xanthate on the surface of three kinds of sphalerite were metal xanthate. The adsorption capacity measurements showed that the saturation absorption of xanthate on sphalerite increased with the increase in iron impurity content. The cyclic voltammetry curve and Tafel curve showed that with the increase in iron impurity content, sphalerite was more easily oxidized and the adsorption rate of xanthate on the surface of sphalerite increased obviously. To summarize, a small amount of iron impurity was beneficial to the recovery of sphalerite.

1. Introduction

Sphalerite (ZnS) is the world’s primary source of Zn. Due to the impurities that replace Zn in the sphalerite lattice, natural sphalerite has different chemical compositions, depending on the deposit [1]. The temperature and chemical properties of the crystallisation environment determine the type and quantity of impurity in sphalerite crystal [2]. Sphalerite is commonly formed with impurities such as iron, copper, cadmium and manganese [3,4]. Iron is the most common impurity in the lattice, which is generally present at levels of up to 26 mol.% [5]. Sphalerite forms the variety referred to as marmatite (ZnxFe1−xS), when the iron content in the lattice exceeds 6% [6]. Large amounts of sphalerite and marmatite have been discovered in China, the United States, Australia and other countries [7,8].
It has generally been accepted that the oxidation of sulfide minerals is very important in the flotation process [9,10]. The process is accompanied by the adsorption of xanthate. Researchers have generally agreed that metal xanthate and dixanthogen are two typical compounds formed for rendering the mineral particles hydrophobic and the production of dixanthogen is among the important factors that affect the flotation process [11,12,13]. Perfect sphalerite has a low conductivity due to its wide band gap, which limits the adsorption of oxygen on a perfect sphalerite [14]. Therefore, perfect sphalerite is not conducive to the adsorption of xanthate. When the iron content changes, the processing of sphalerite ores is also changed [15]. Impurities can change the electronic properties of sphalerite, including the band gap and Fermi energy level [16]. Harmer et al. have reported that iron decreased the band gap of sphalerite and changed its reactivity [15]. Chen and Chen reported that Fe impurity had a great influence on the sphalerite electronic structure and semiconduction properties, including electron density, band gap, Fermi level and the surface properties in the simulation of sphalerite (110) surfaces bearing Fe impurities [17]. Iron impurity induces obvious electron rearrangement and the electrical conductivity of the sphalerite increases with the increase in iron impurity [18]. The influence on the macroscopic phenomena was shown in relation to surface reactivity, copper activation, collector adsorption and flotation [19]. Generally, the iron impurity decreased the floatability of sphalerite. However, many previous studies have been contradictory. For example, Solecki [20] reported that as iron content in synthetic sphalerites increased, the attachment of xanthate on the sphalerite surface decreased. By contrast, Gigowski [21], for natural sphalerite with a different iron content, reported that xanthate was easily adsorbed on the surface of sphalerite with a high iron content. Clearly, sphalerite with different iron content has different properties.
Through industrial testing at the Huize lead–zinc mine, it was found that the floatability of sphalerite was quite variable. The floatability of some sphalerite samples was the same as galena and the floatability of some sphalerite samples was low. According to the analyses from process mineralogy, the contents of iron impurity in these sphalerites were different. In order to study the phenomenon, the research in this study was carried out. Flotation experiments, adsorption measurement, Fourier transform infrared spectroscopy (FTIR) analyses, cyclic voltammetry and Tafel curves were used to study the influence of the different contents of iron impurities on the flotation behavior of sphalerite, xanthate adsorption and its electrochemical mechanism.

2. Materials and Methods

2.1. Materials

The minerals used in this study were three kinds of natural sphalerite with different iron impurity contents. These all came from the same middle section of Huize mine No. 10 ore body in Yunnan Province, China. The three sphalerites’ colors were dark yellow, light red and dark red, respectively. Mineral lumps were hammered into small particles and sphalerite particles were handpicked. Then, sphalerite particles were ground in a ceramic ball mill and screened. Fractions with sizes of 74–38 μm were used in the flotation experiments, adsorption measurements, inductively coupled plasma massspectrometry (ICP) (Thermo PQ ExCell) and specific surface area determination (NOVA-2200E) (Quantachrome, Boynton beach, FL, USA). Samples further ground to −5 μm were used in X-ray diffraction (XRD) (Rigaku Ultima VI) and FTIR. The chemical composition of the three kinds of sphalerites are shown in Table 1. For convenience, the sphalerite with 2.30 wt.% iron is referred to as sample 1, the sphalerite with 3.20 wt.% iron content is referred to as sample 2, and the sphalerite with 4.66 wt.% iron content is referred to as sample 3.
From Table 1, sample 1 contained 65.15 wt.% Zn, 62.31 wt.% S and 2.30 wt.% Fe. Sample 2 contained 63.13 wt.% Zn, 32.60 wt.% S and 3.20 wt.% Fe. Sample 3 contained 61.59 wt.% Zn, 33.78 wt.% S and 4.66 wt.% Fe. ICP results for other elements are shown in Table 2. The results show that except Zn, Fe and S, the total contents of other impurities were less than 1 wt.%. In addition, XRD was used to analyze the purity of the samples and the results are shown in Figure 1. These data confirm that each sphalerite sample has a cubic structure and that there are no other detectable minerals. The purities of sample 1, sample 2, and sample 3 were 98.48%, 98.93% and 98.88%, respectively. The specific surface areas of sample 1, sample 2 and sample 3 were 0.41 m2/g, 0.38 m2/g and 0.37 m2/g, respectively.

2.2. Electrodes

Five types of electrode were used in this study. A graphite rod was used as a counter electrode and an Ag/AgCl electrode served as the reference electrode. The working electrode was a carbon paste type [22] and consisted of 7.5 wt.% graphite powder, 7.5 wt.% paraffin and 85 wt.% sample particles. The three working electrodes were composed of each different sample added at the same ratio. The graphite power was spectrum grade. To ensure a clean and smooth surface, the working electrodes were carefully polished with 7000 mesh silicon carbide sandpaper and then rinsed with high purity water before each measurement. The experimental device used was a PAR 273A (potentiostat/galvanostat) from the EG&G Princeton Applied Research Company.

2.3. Flotation Process

Samples (2 g) were ultrasonically cleaned for 5 min and then the supernatant liquid was removed before adding the sample into a 30 mL flotation cell (FXC-76). Firstly, a mineral suspension was made by agitating for 2 min. The pH value was adjusted after agitation. Then, ethyl xanthate was added, the suspension was agitated for 3 min before the addition of pine oil and conditioning for a further 2 min. Finally, the air was introduced into the pulp and a 3 min flotation cycle was completed. Samples of froth products and tailings were collected, dried and weighed. During the whole flotation test, the impeller speed was kept at 1500 RPM.

2.4. Analysis Methods

Xanthate adsorption was analyzed quantitatively using ultraviolet–visible (UV–VIS) spectrophotometer. The following formula was used to calculate the adsorption:
T = V(C0 − C)/W,
where T is the adsorption amount (mol/g), V is the volume of the solution (L), C0 and C are the xanthate concentrations before adsorption and after adsorption, respectively, and W is the sample weight. In order to determine values for measure and the concentration values, the following procedure was used. The absorbance of the characteristic peak in residual solution was determined first. Then, the functional relationship between the concentration of xanthate and the characteristic peak absorbance was obtained by measuring a standard solution of xanthate. Finally, the residual concentration was calculated by substituting the characteristic peak absorbance into the equation.
Extracts were also collected from rinsing the sample surface with ethanol and were measured by using a UV–VIS (Agilent Cary60) spectrophotometer and absorbance data were recorded.
The FTIR measurements were measured by a Nicolet iS20 (Thermo Fisher Scientific, Waltham, MA, USA) FTIR Spectrometer. Samples were treated by the standard KBr pellet method.

3. Results and Discussion

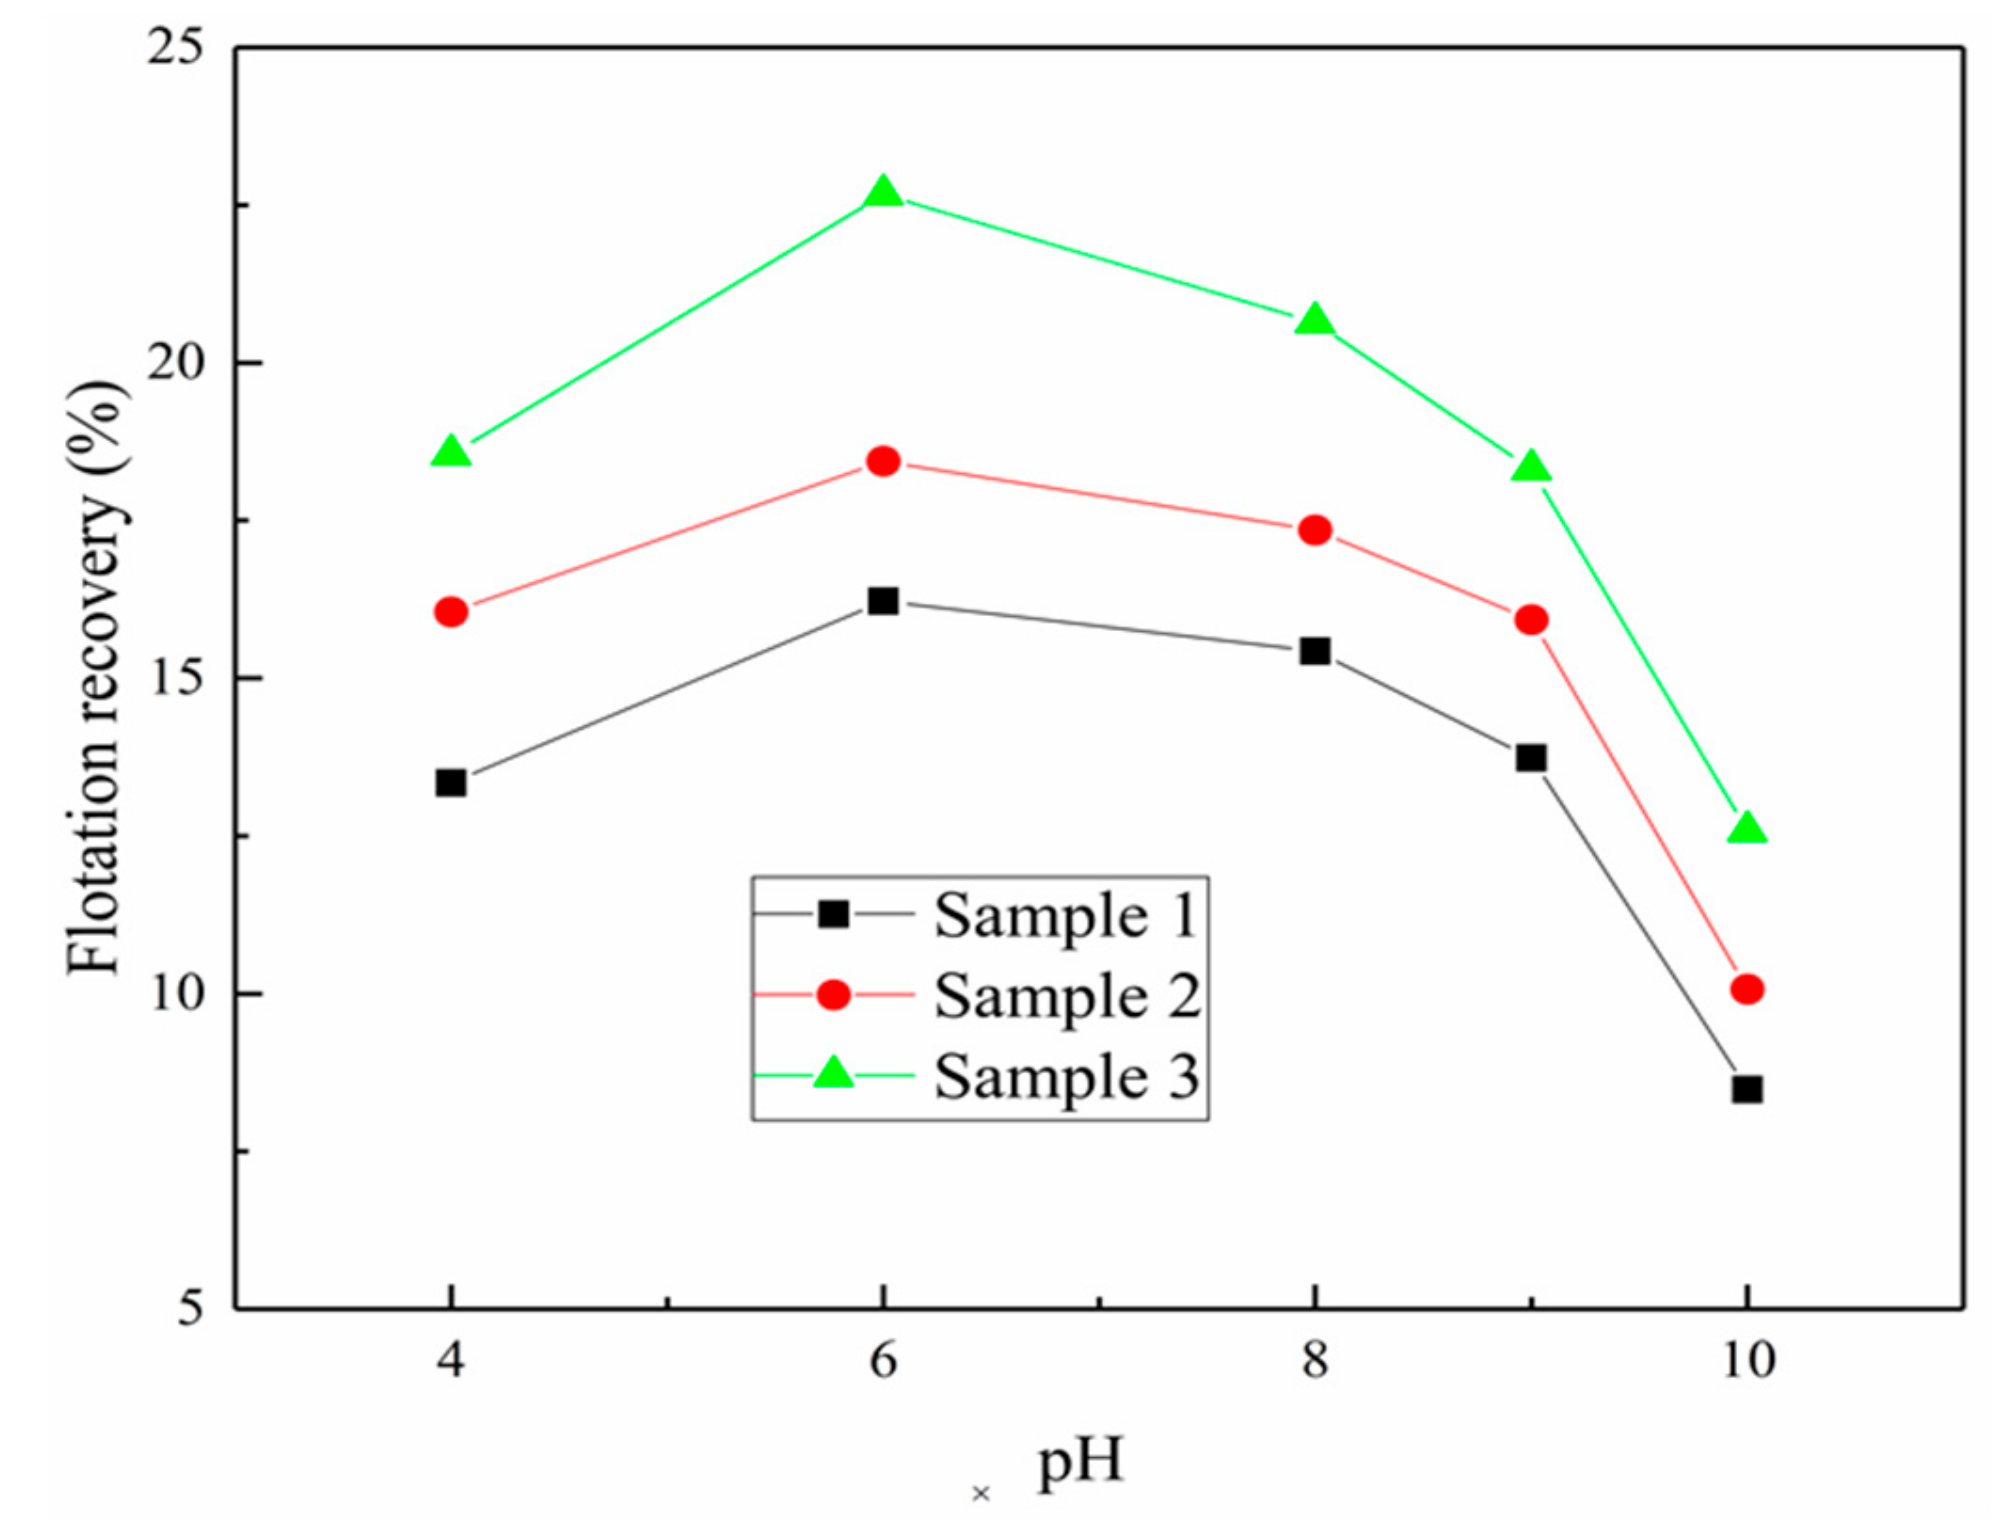
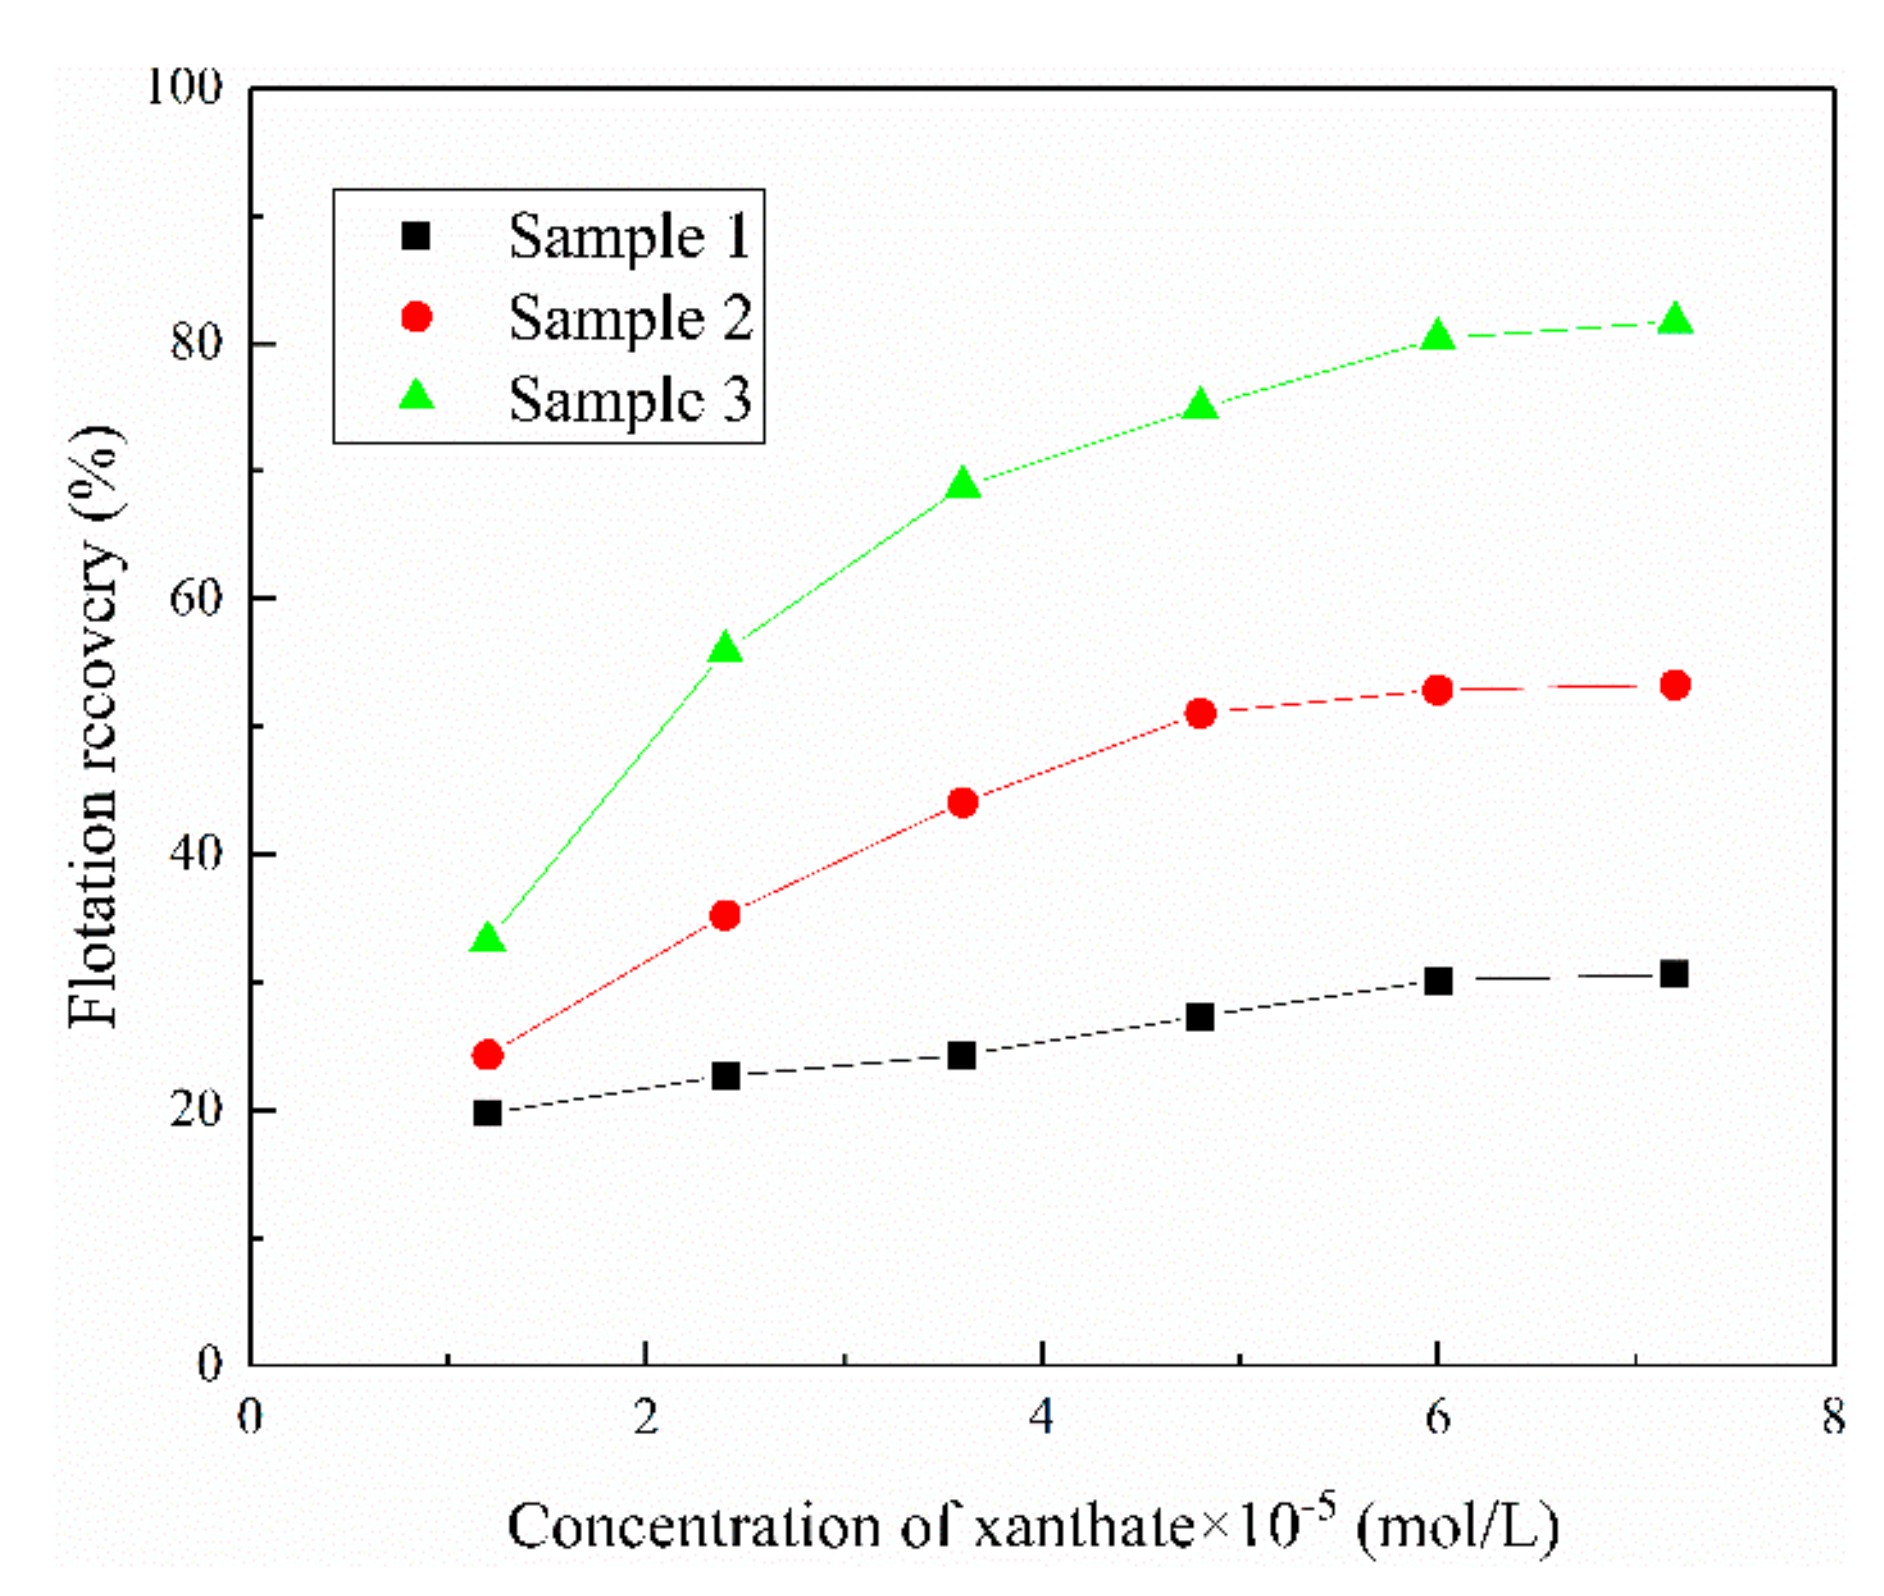
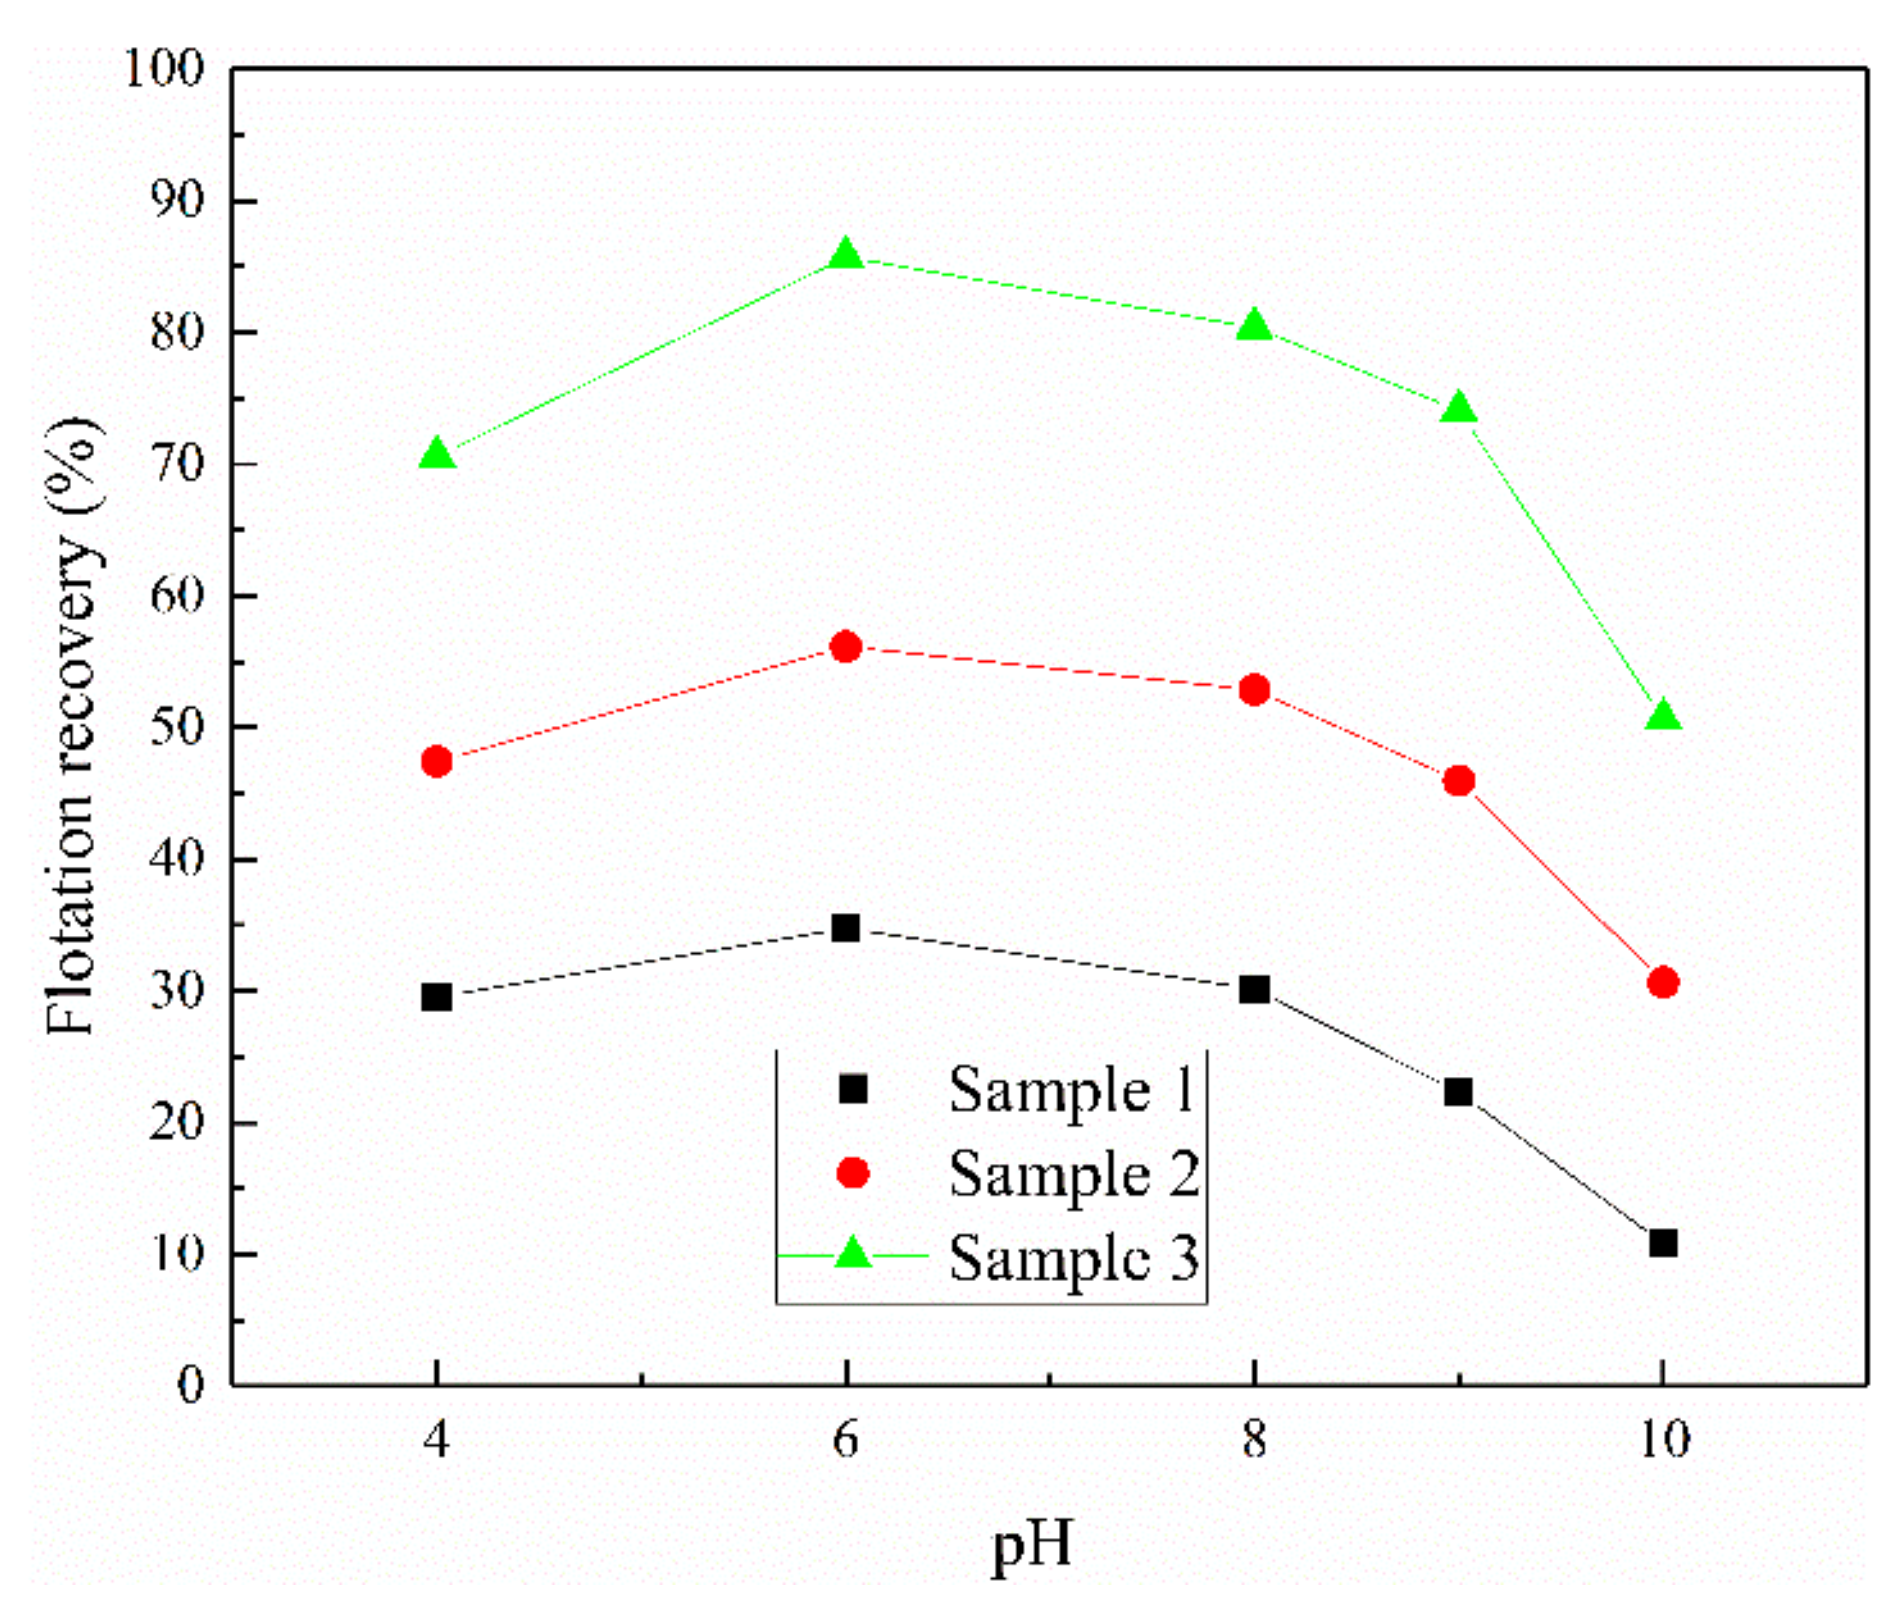
3.1. The Effect of Iron Impurity Content on the Flotation of Sphalerite

A natural hydrophobicity test was carried out on the three sphalerite samples, and the results are shown in Figure 2. The trend of flotation recovery for the three samples was basically the same, showing an uptrend first and then a downtrend after the pH value reached 6. The recovery of sample 1 (2.30 wt.% Fe) was the lowest. With the increase in iron content, the recovery of sphalerite increased slightly.
Figure 3 shows the relationship between three sphalerite samples and the collector concentration at a pH of 8. The recovery of sample 1 was again the lowest. At xanthate concentrations of 1.2 × 10⁻⁵ mol/L and 7.2 × 10⁻⁵ mol/L, the recoveries were only 20% and 25%, respectively. The recovery of sample 2 (3.20 wt.% Fe) and sample 3 (4.66 wt.% Fe) showed a rising trend with the increase of the xanthate concentration and reached 50% and 80%, respectively. It was observed that the xanthate concentration had little influence on sample 1 and the greatest influence on sample 3. The trend of flotation recovery was similar in the three samples, showing an uptrend first and remaining basically unchanged after the concentration of xanthate reached 6 × 10⁻⁵ mol/L.
Figure 4 shows the relationship between the three sphalerite samples and the pH value for a xanthate concentration of 6 × 10⁻⁵ mol/L. The trend shown in Figure 4 is basically the same as that shown in Figure 2. In order to study the characteristics of sphalerite under the best conditions and similar to the fact that the pulp was in an alkaline environment in actual production, the subsequent work in this study was carried out under the condition of the weak base of pH 8.
A macroscopic conclusion was drawn from these experimental results. When the iron impurity content in sphalerite was less than 5%, the flotation recovery of sphalerite using xanthate increased while the trend of increased recovery was even more pronounced with the increase in the iron impurity content.

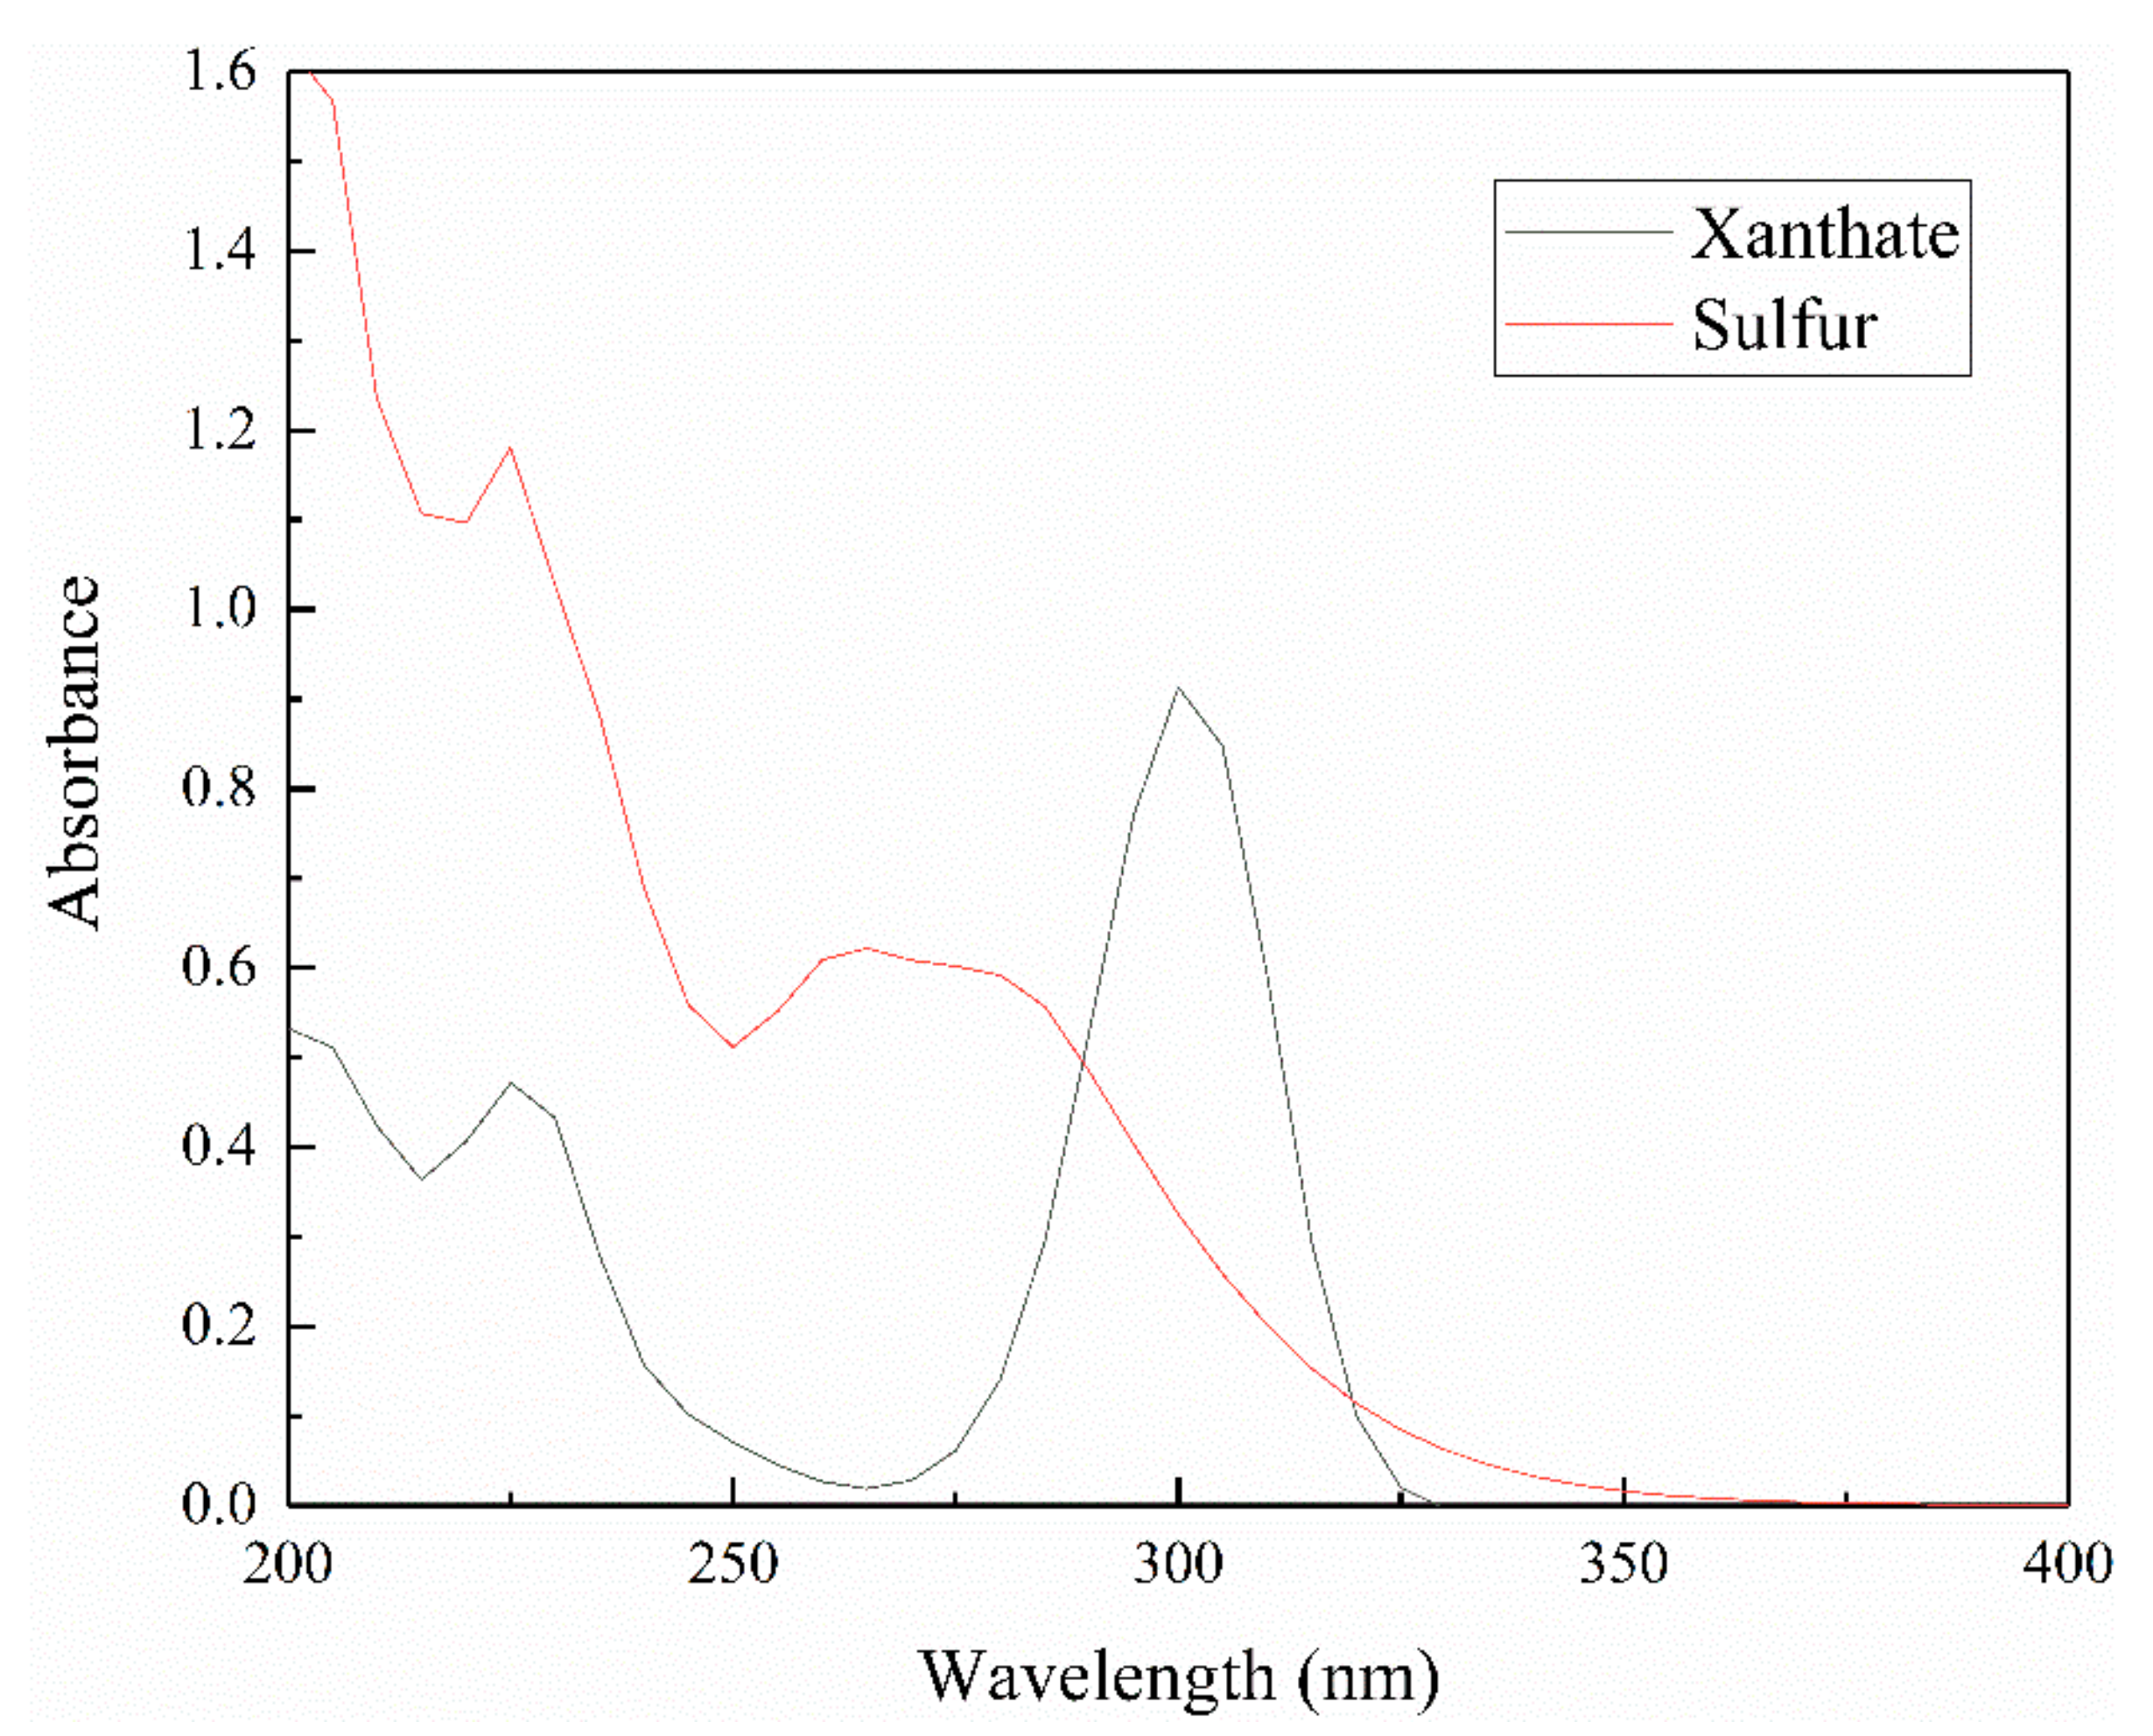
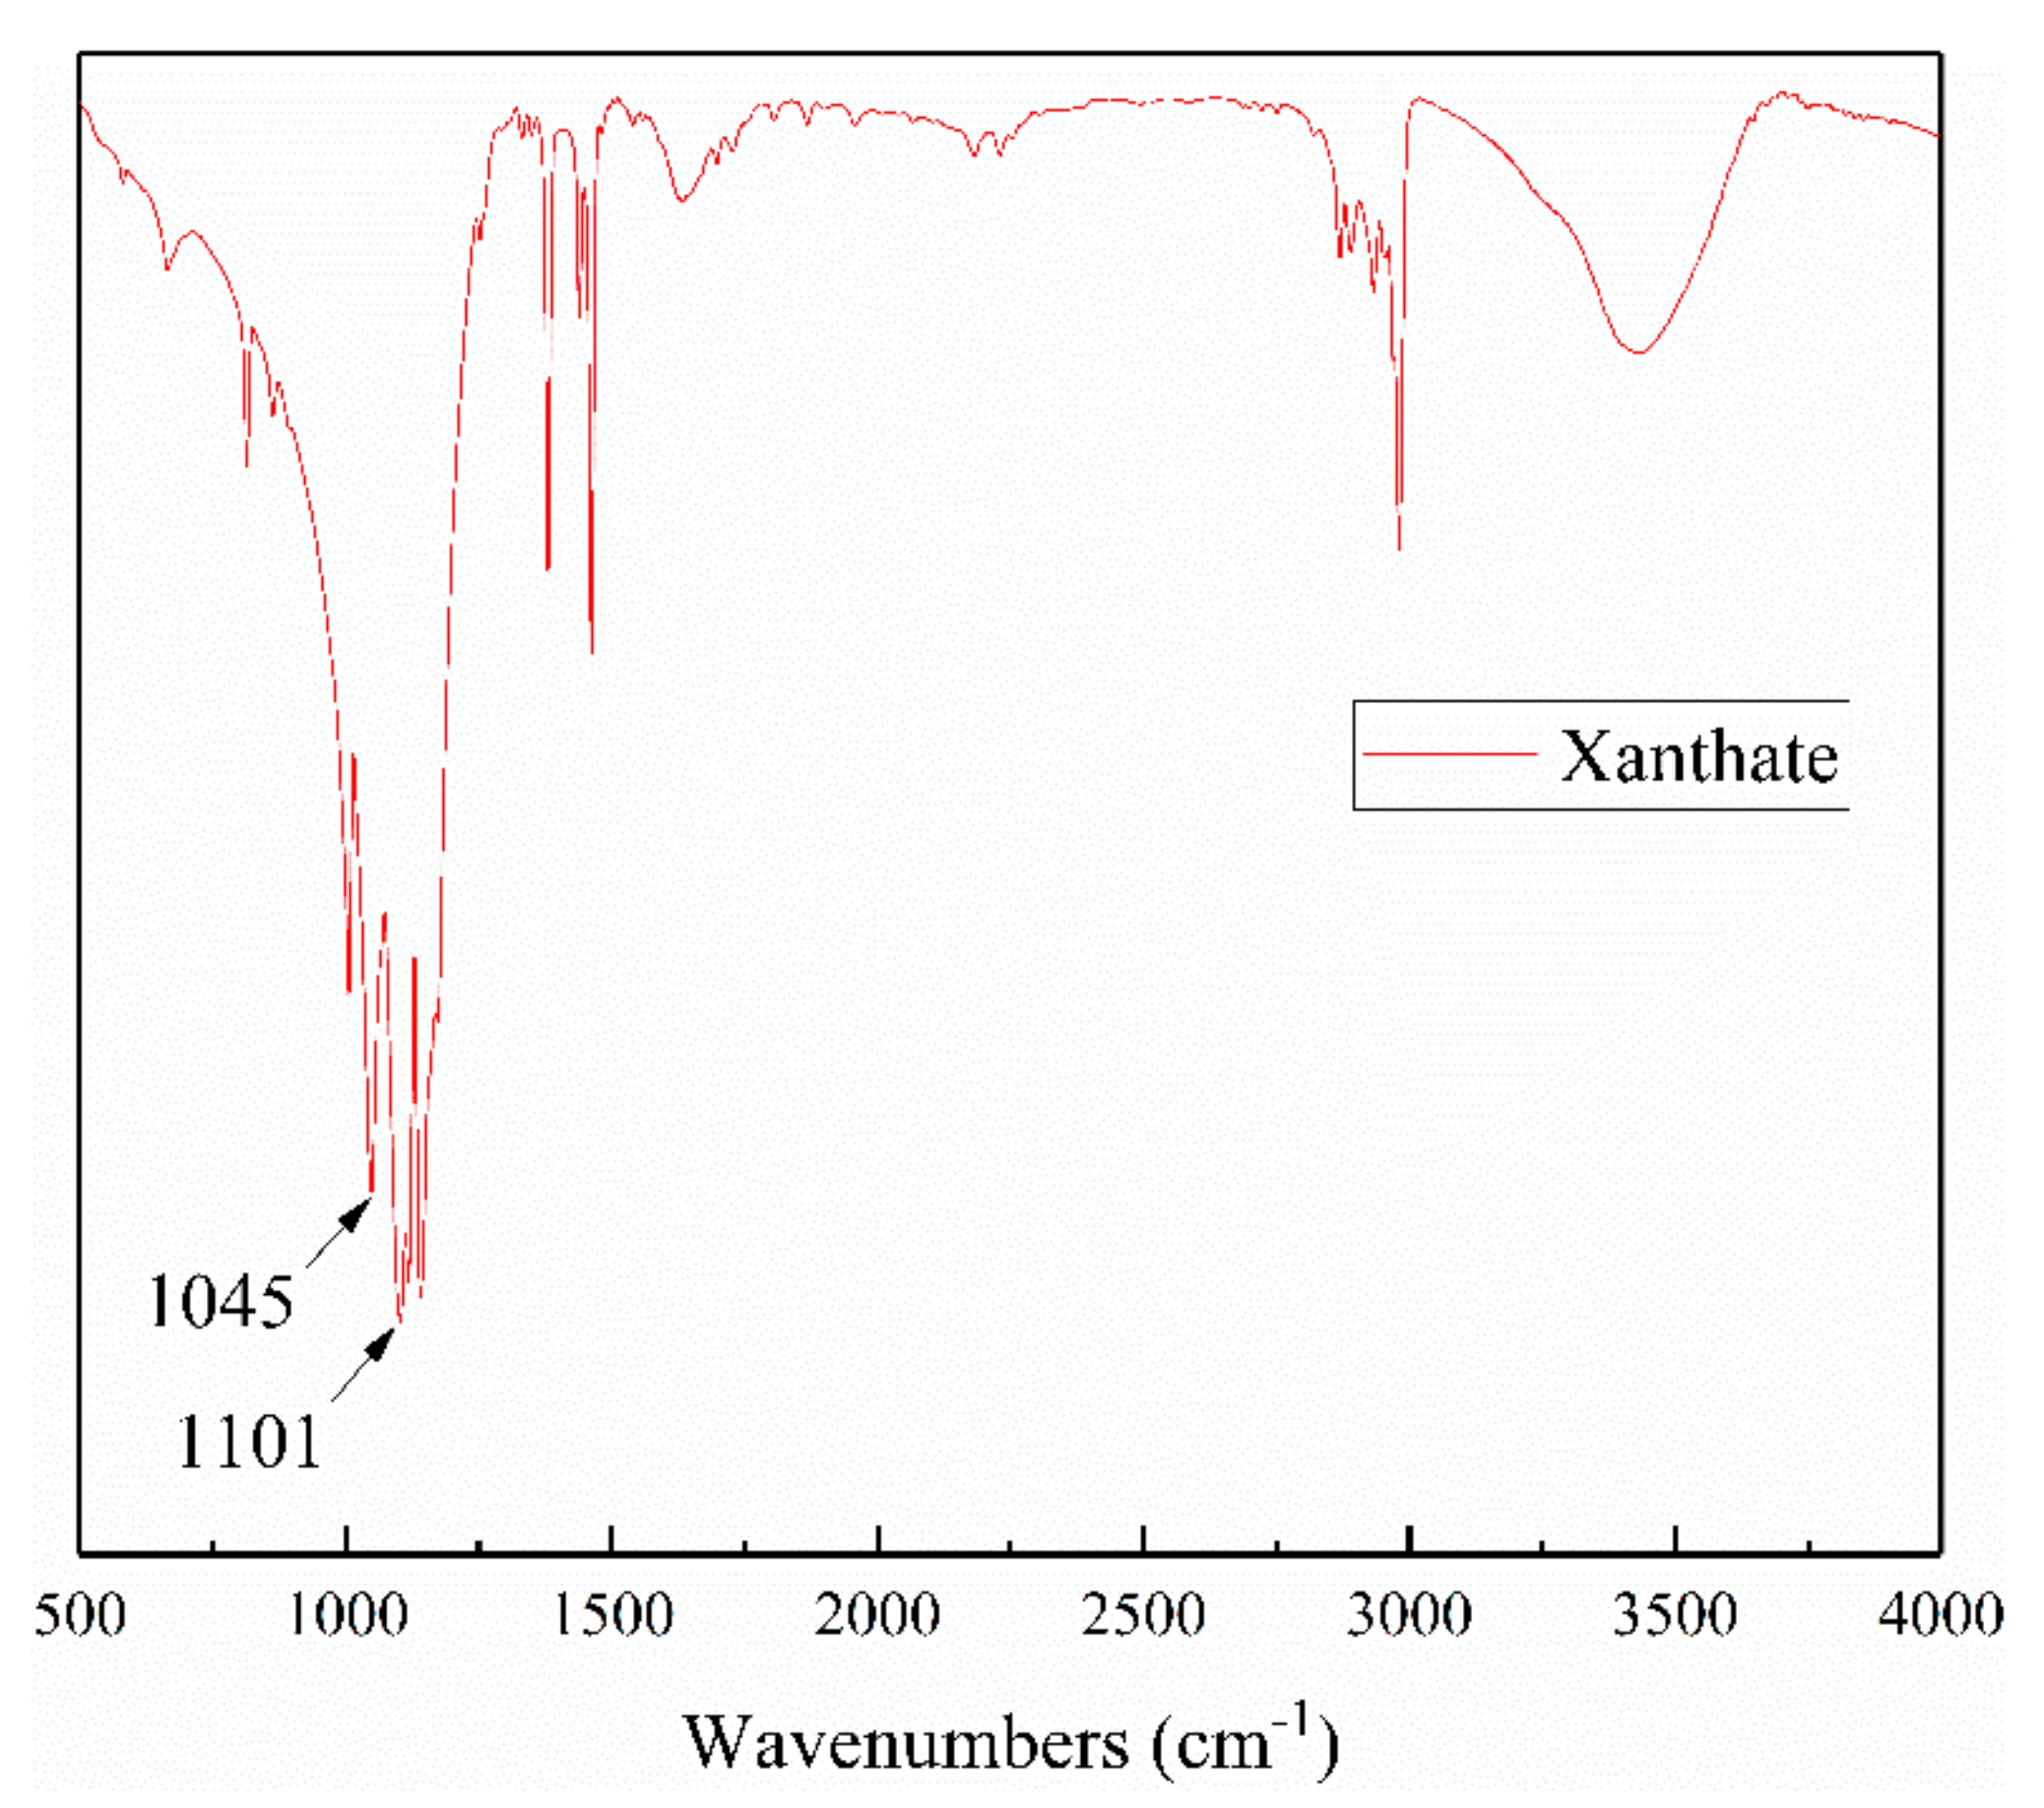
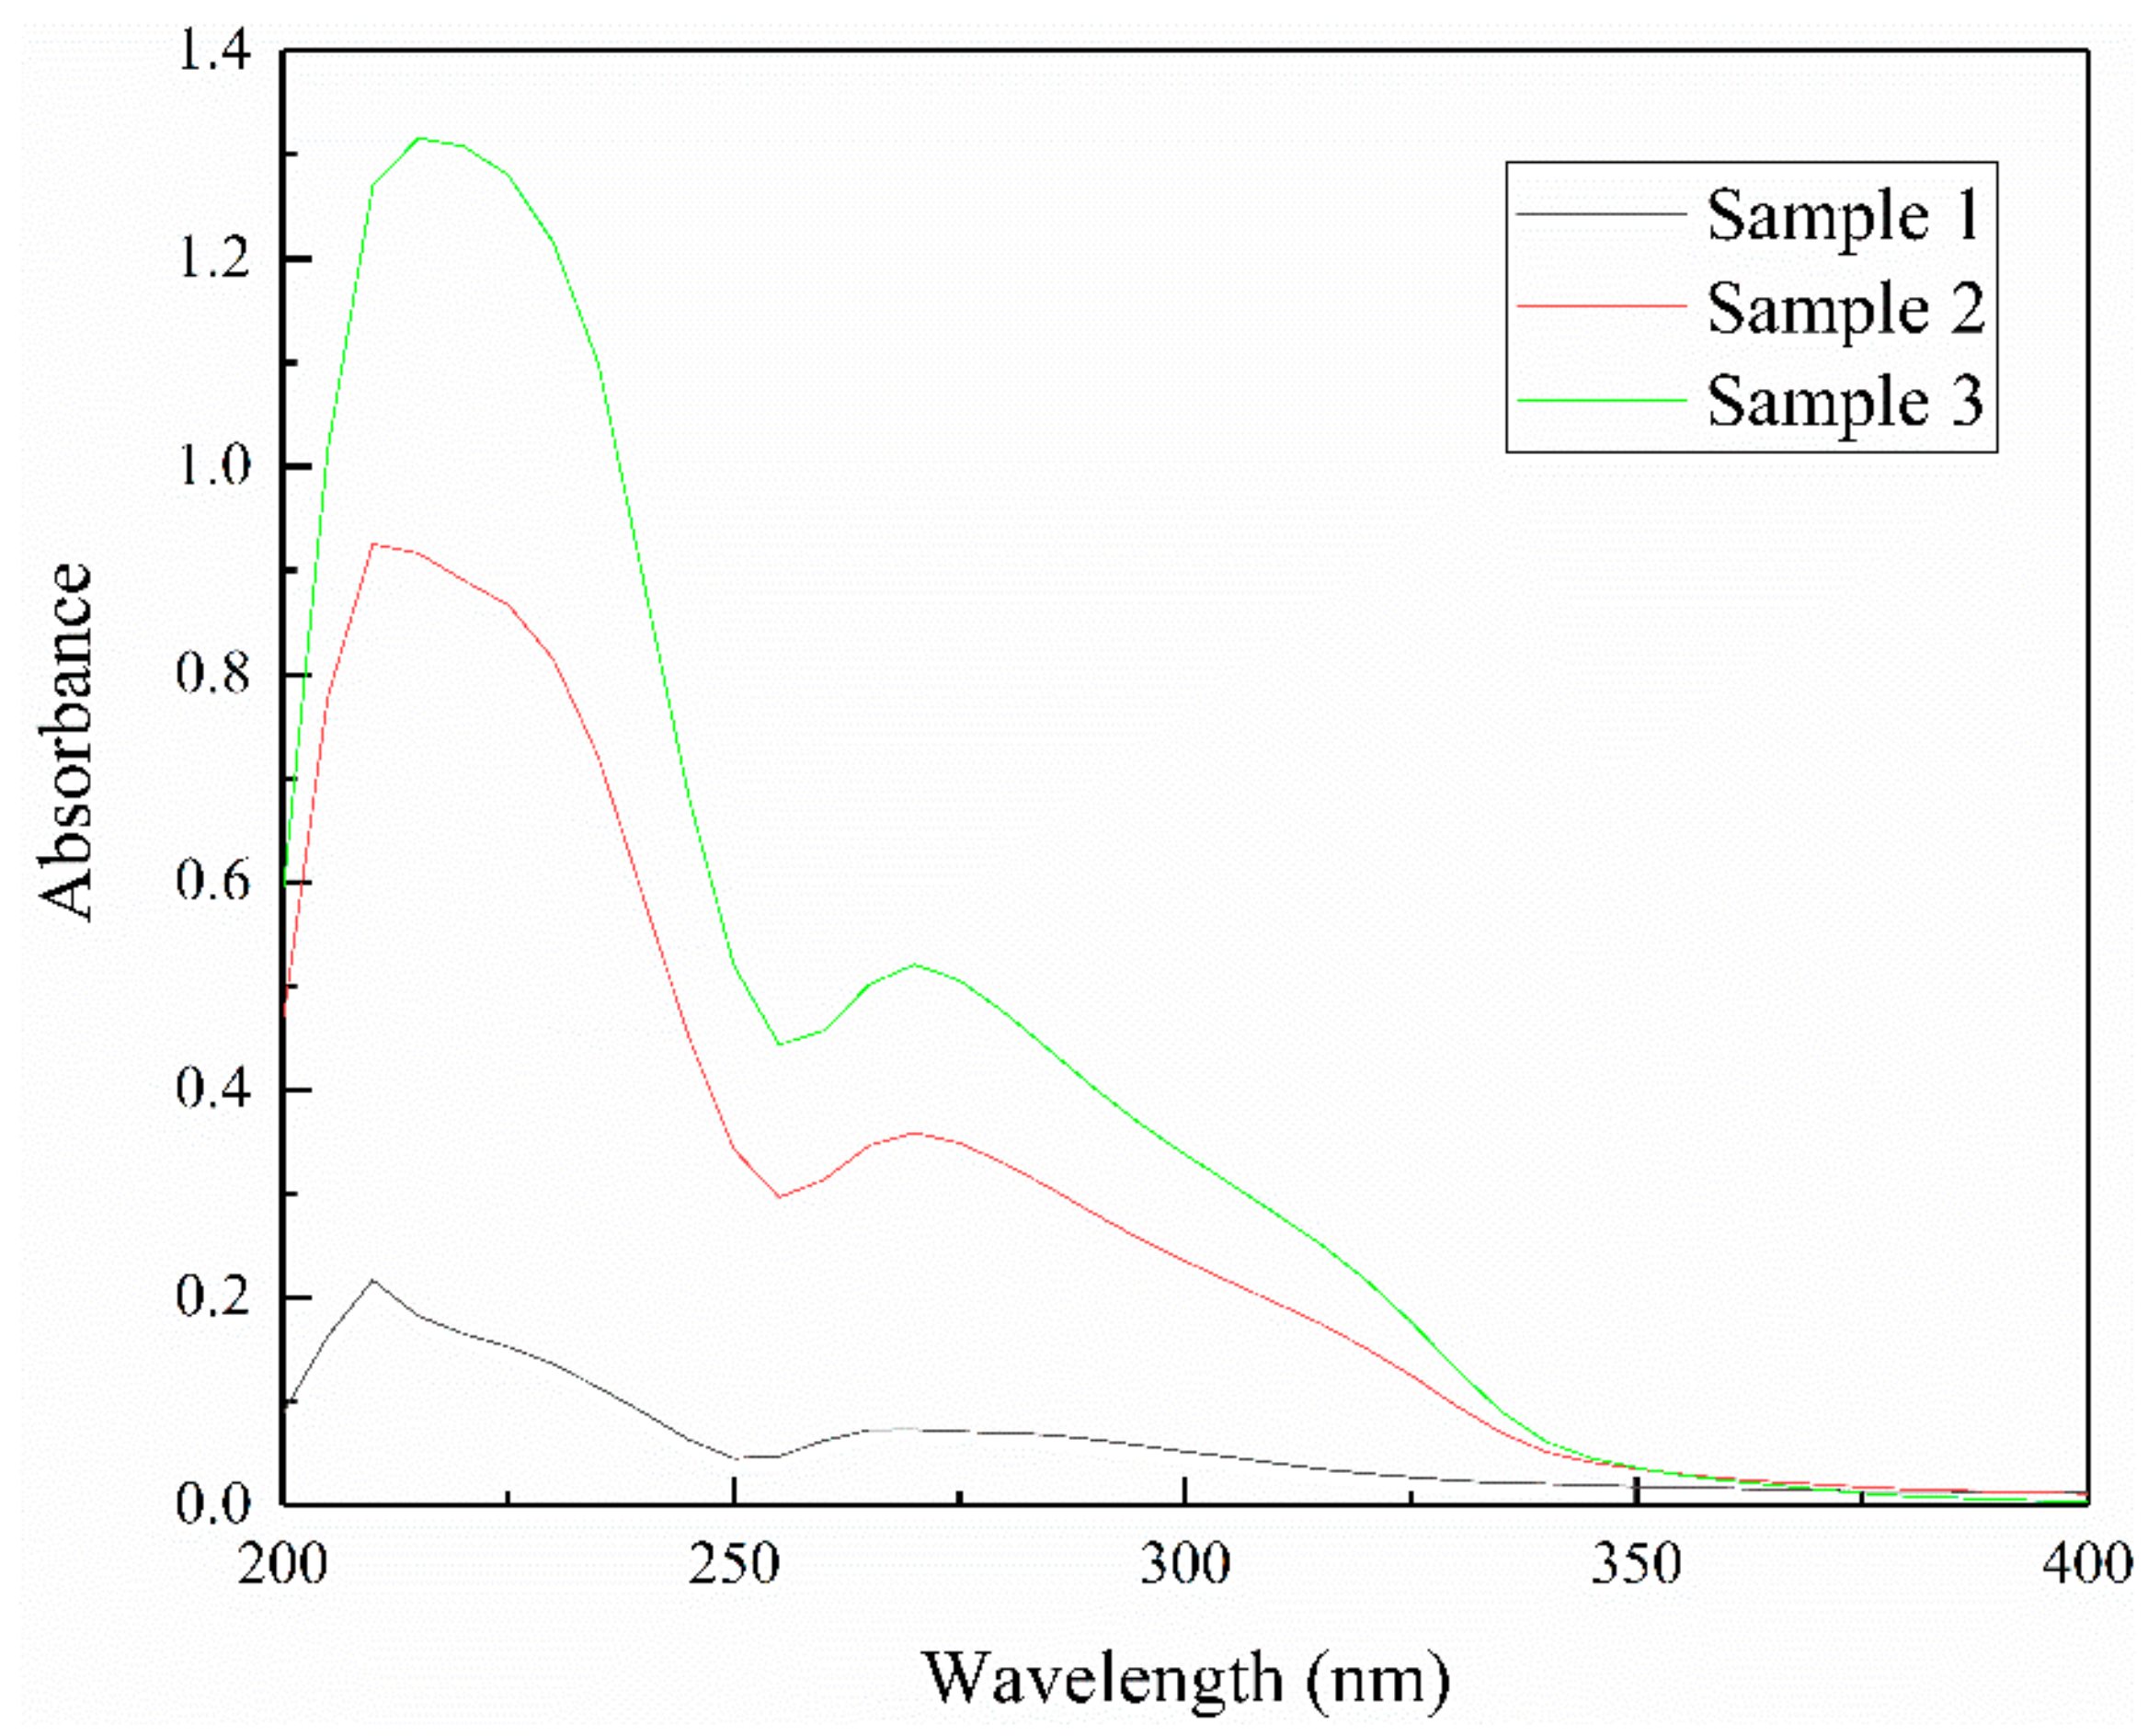
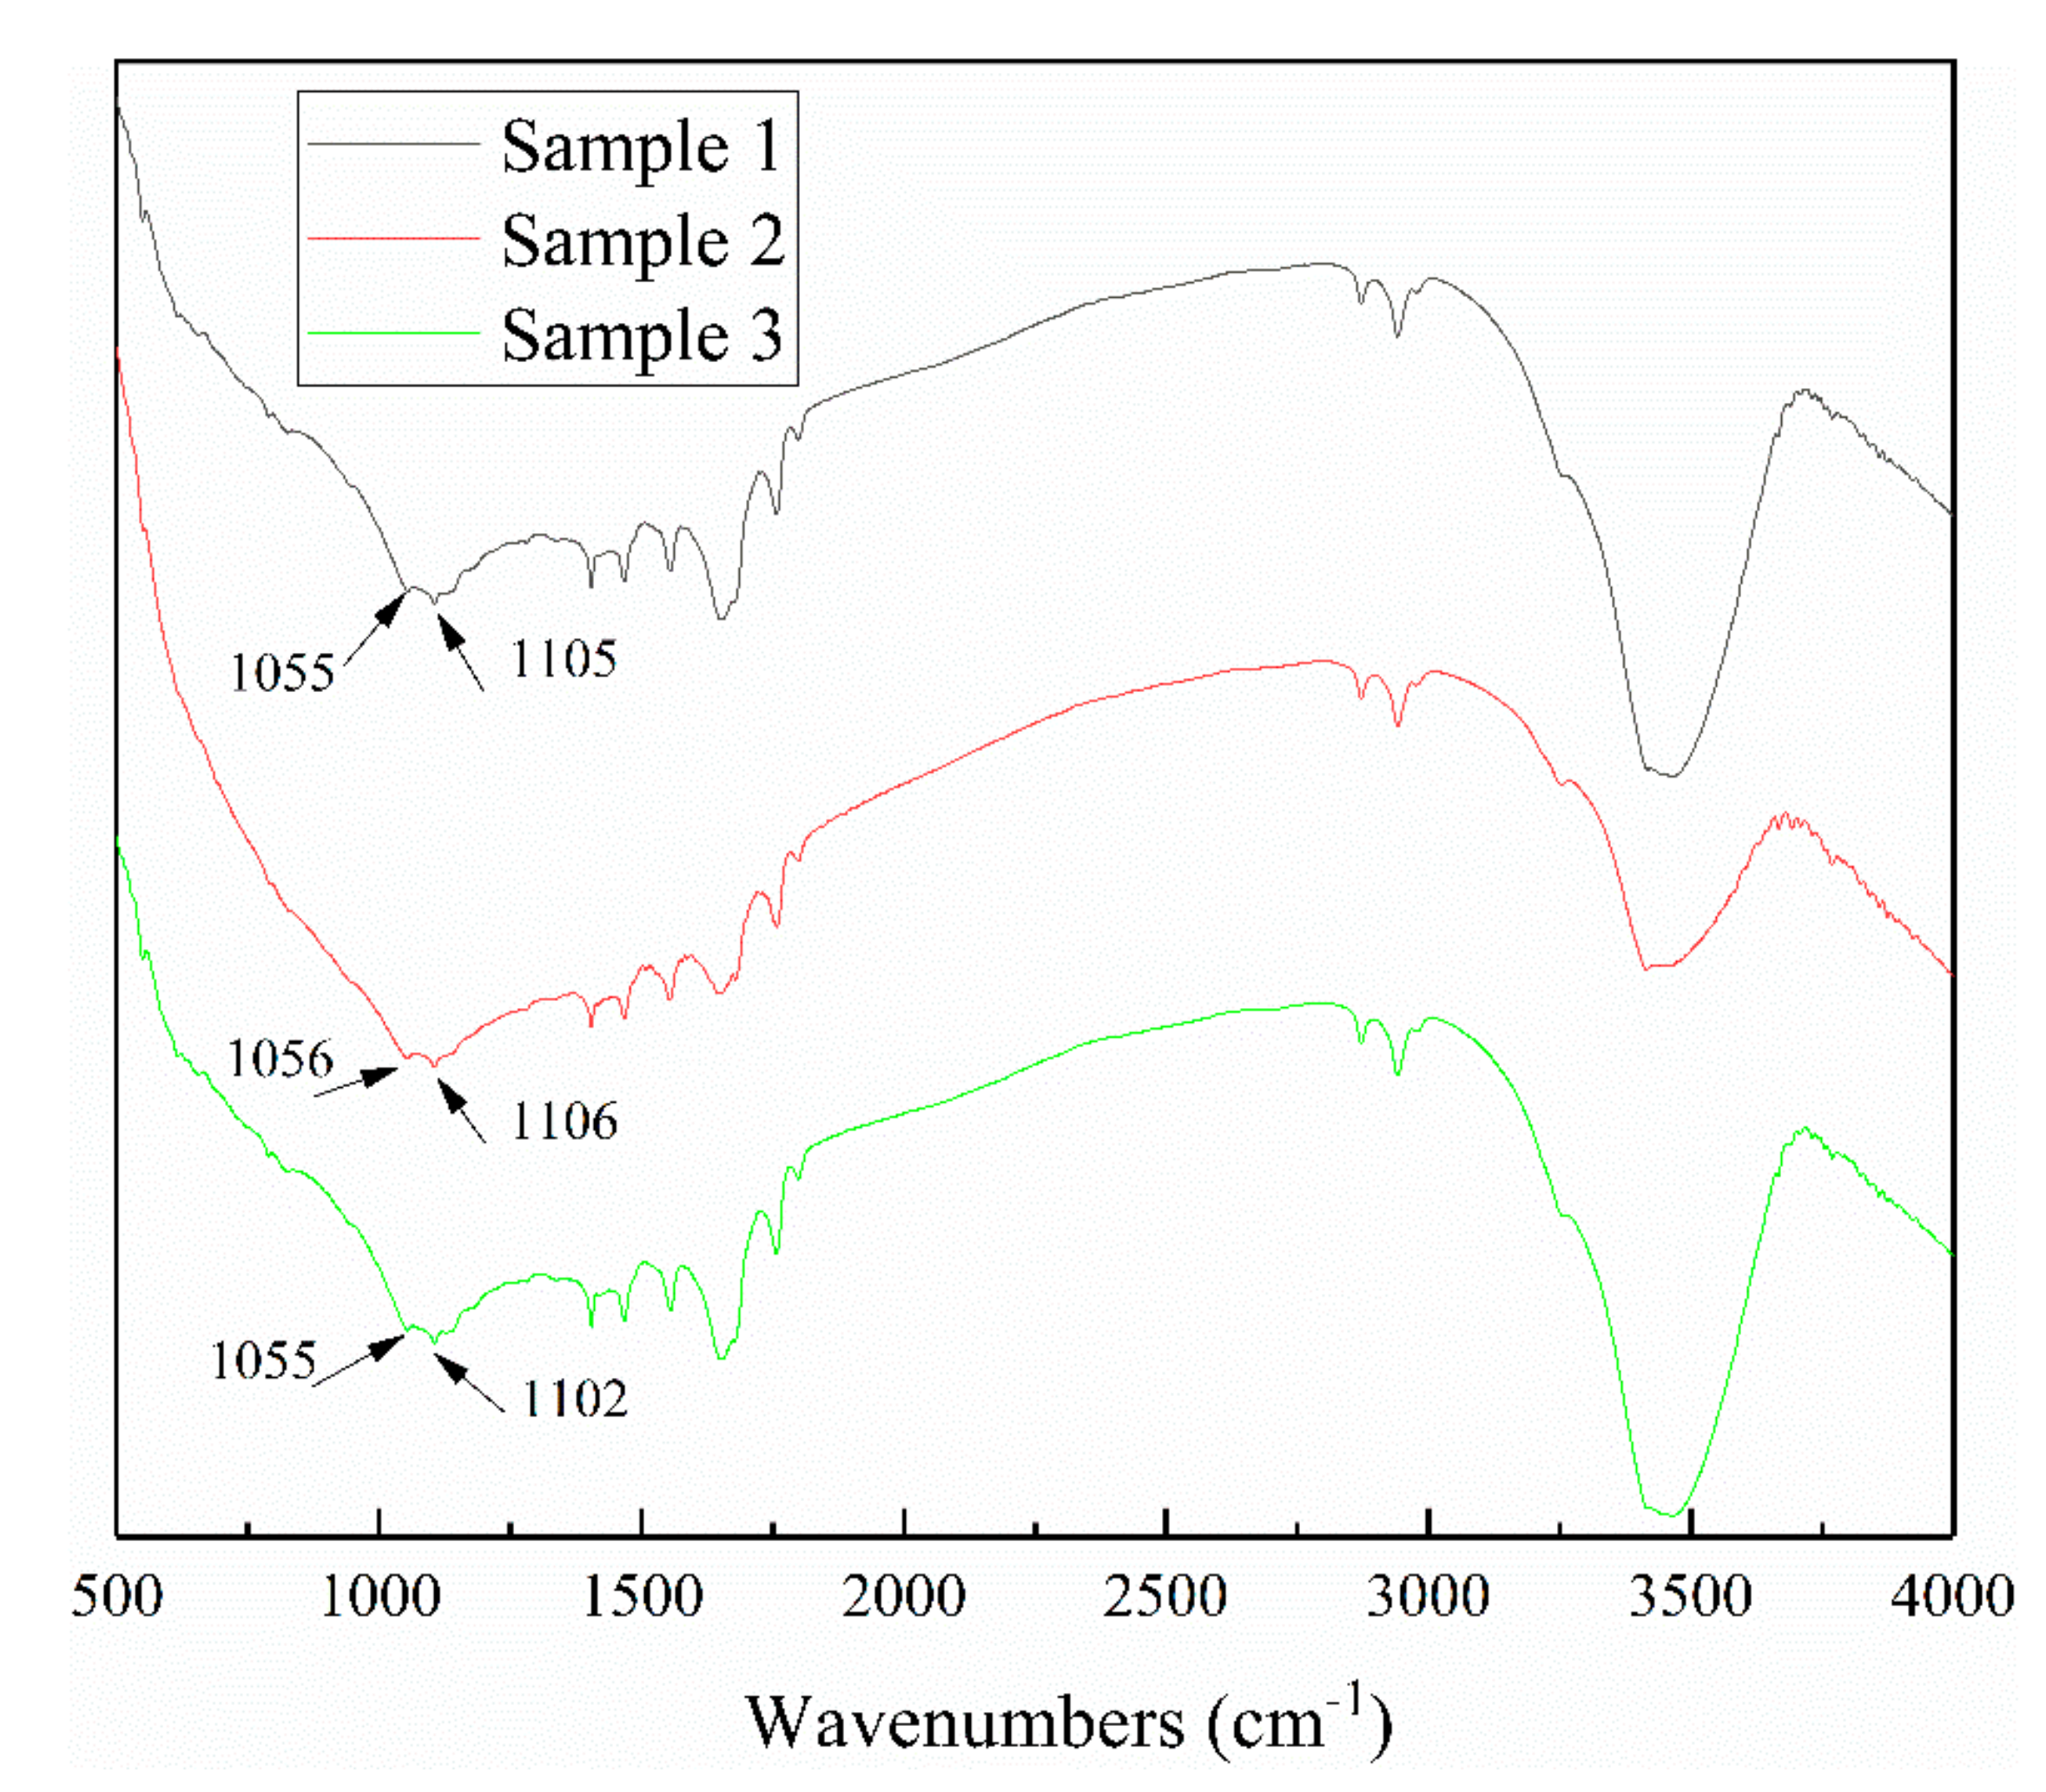
3.2. The Effect of Iron Impurity Content on Adsorption Capacity and Production of Xanthate

The three samples were immersed in 30 mL xanthate solutions with a concentration of 6 × 10⁻⁵ mol/L and stirred for 3 min. The results of xanthate adsorption are shown in Table 3. Clearly, sample 3 adsorbed the most xanthate, while sample 1 adsorbed the least. This was consistent with the results of previous flotation experiments. This confirmed that the amount of xanthate adsorbed was among the important factors affecting the flotation recovery of sphalerite containing iron impurities. To further understand whether it was primarily the change of saturation adsorption amount or the change of adsorption rate, the three samples were treated with 1.8 × 10⁻⁴ mol/L xanthate solution in the same way for 5 min and measured; the results are shown in Table 4. Compared with the results in Table 3 and Table 4, it was obvious that the adsorption capacity of the same sample was basically the same. Although the concentration of xanthate and the adsorption time increased, the amount of xanthate adsorbed at the higher concentration only slightly increased. The results demonstrate that the recovery of the three samples was only slightly increased when the xanthate concentration exceeded 6 × 10⁻⁵ mol/L. The above experimental results show that the saturated adsorption capacity of xanthate increased with the increase in the iron impurity content, as the iron impurity content in sphalerite was less than 5 wt.%.
In order to study whether the products of xanthate adsorption on the surface of sphalerite changed with the increase in iron content, the surface extracts for the three samples after interaction with xanthate were measured by UV–VIS and the spectra of the products are shown in Figure 5. Based on Figure 5, the UV–VIS spectra of the three samples were basically similar, with an obvious characteristic peak at 270 nm and a shoulder peak at 301 nm. Figure 6 shows the absorption peaks of xanthate and sulfur in the ethanol solution. It appears that the peak at 270 nm was due to the sulfur, a result of the oxidation of the sphalerite surface. The shoulder peak at 301 nm was similar to that of xanthate, which can be explained by a trace of chemisorbed xanthate remaining on the surface of sphalerite. This is because ethanol can only extract physisorbed xanthate [23]. Guo [24] reported that the peak of dixanthogen was measured at 281 nm. There is no obvious peak shown at this position in Figure 5, suggesting little or no dixanthogen. The results show that all the adsorbed products on the surface of the three samples were xanthates rather than dixanthogen, while sphalerite was oxidized at the surface to produce sulfur during flotation.
To further prove the adsorption products of xanthate, the three samples after interaction with xanthate were measured by FTIR. The results are shown in Figure 7. The FTIR of xanthate is shown in Figure 8. The absorption peaks for the main functional groups of xanthate and dixanthogen are shown in Table 5. The infrared spectra of the three samples were basically consistent and the stretching vibration peak for the C–O–C bond of xanthate appeared at 1105 cm−1, 1106 cm−1 and 1102 cm−1. No characteristic absorption peak for the C–O bond of dixanthogen was found at 1240–1265 cm−1 [25,26], indicating that dixanthogen was not generated. This result is consistent with previous UV–VIS spectra. In Figure 7, a faint peak appeared in the infrared spectra of the three samples at 1055 cm−1, 1056 cm−1 and 1055 cm−1, respectively. These are similar to the stretching vibration peak for the C=S bond of xanthate which occurs at 1045 cm−1. This is due to the chemisorption of xanthate on the surface of sphalerite to form zinc xanthate, leading to the drift of the characteristic peak [26,27].
Thus, it can be concluded that when the iron impurity content in sphalerite was less than 5 wt.%, the adsorbed product of xanthate on the surface of sphalerite was metal xanthate, and there was no dixanthogen.

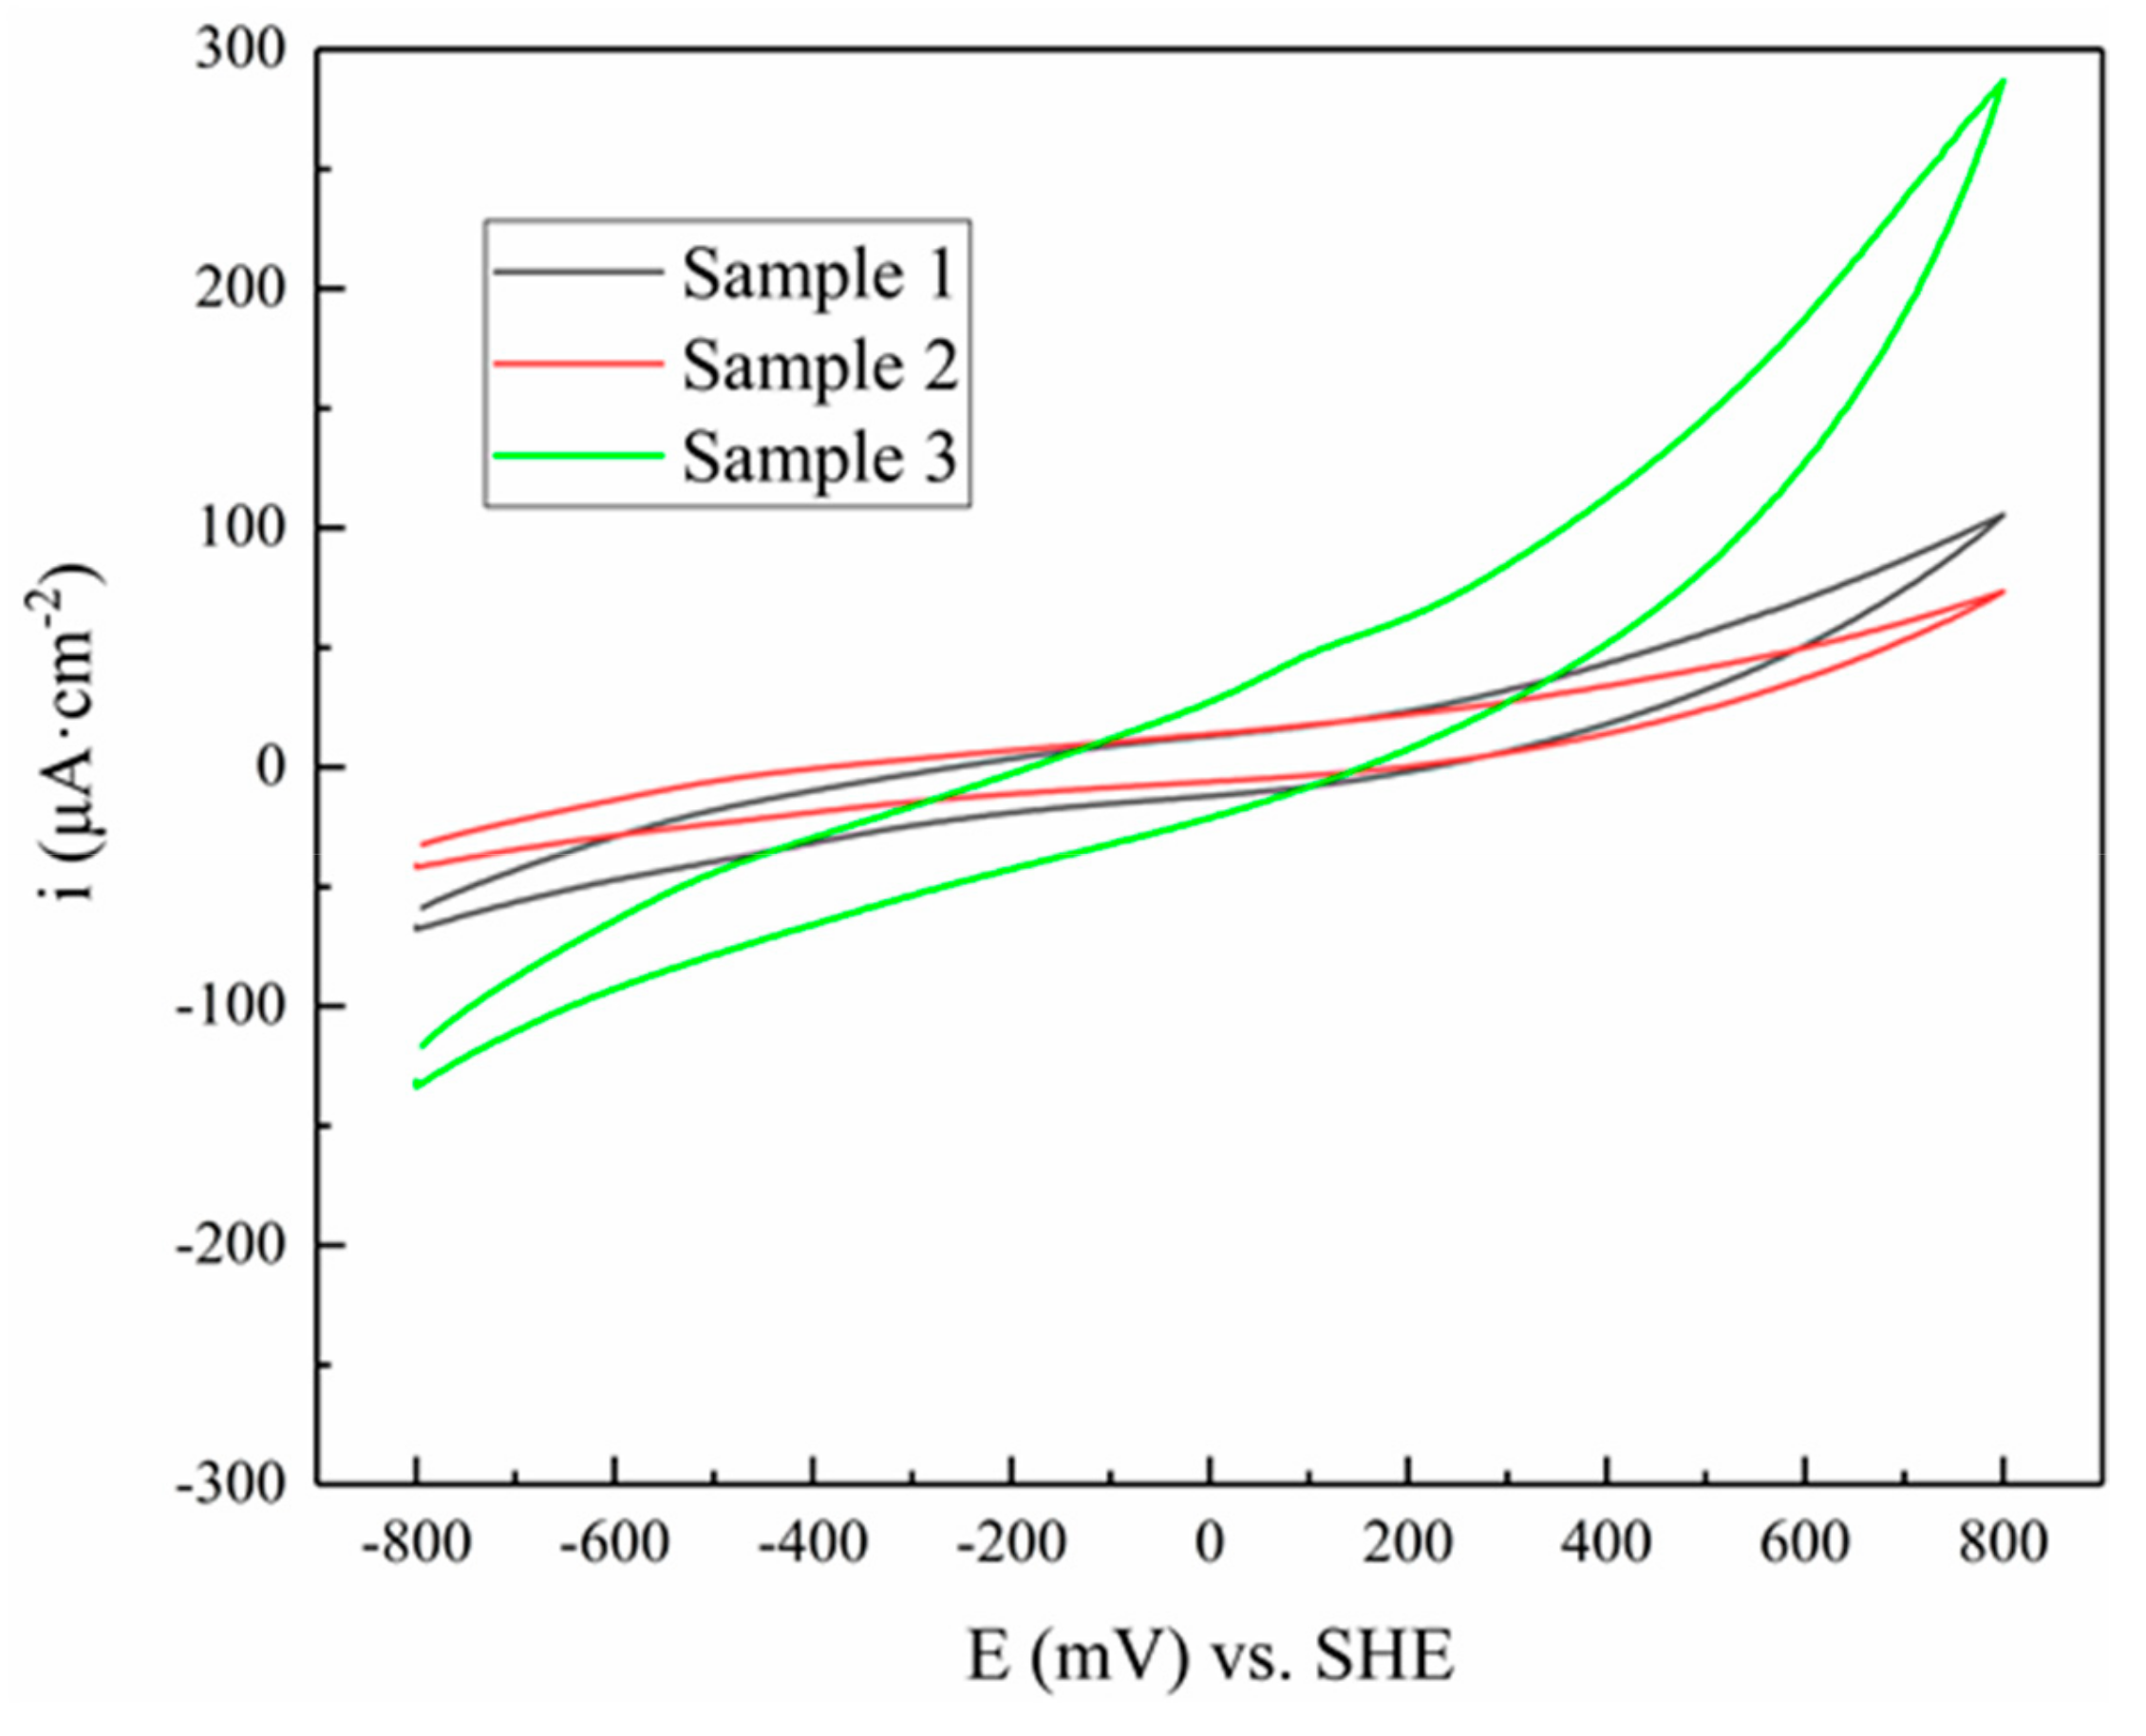
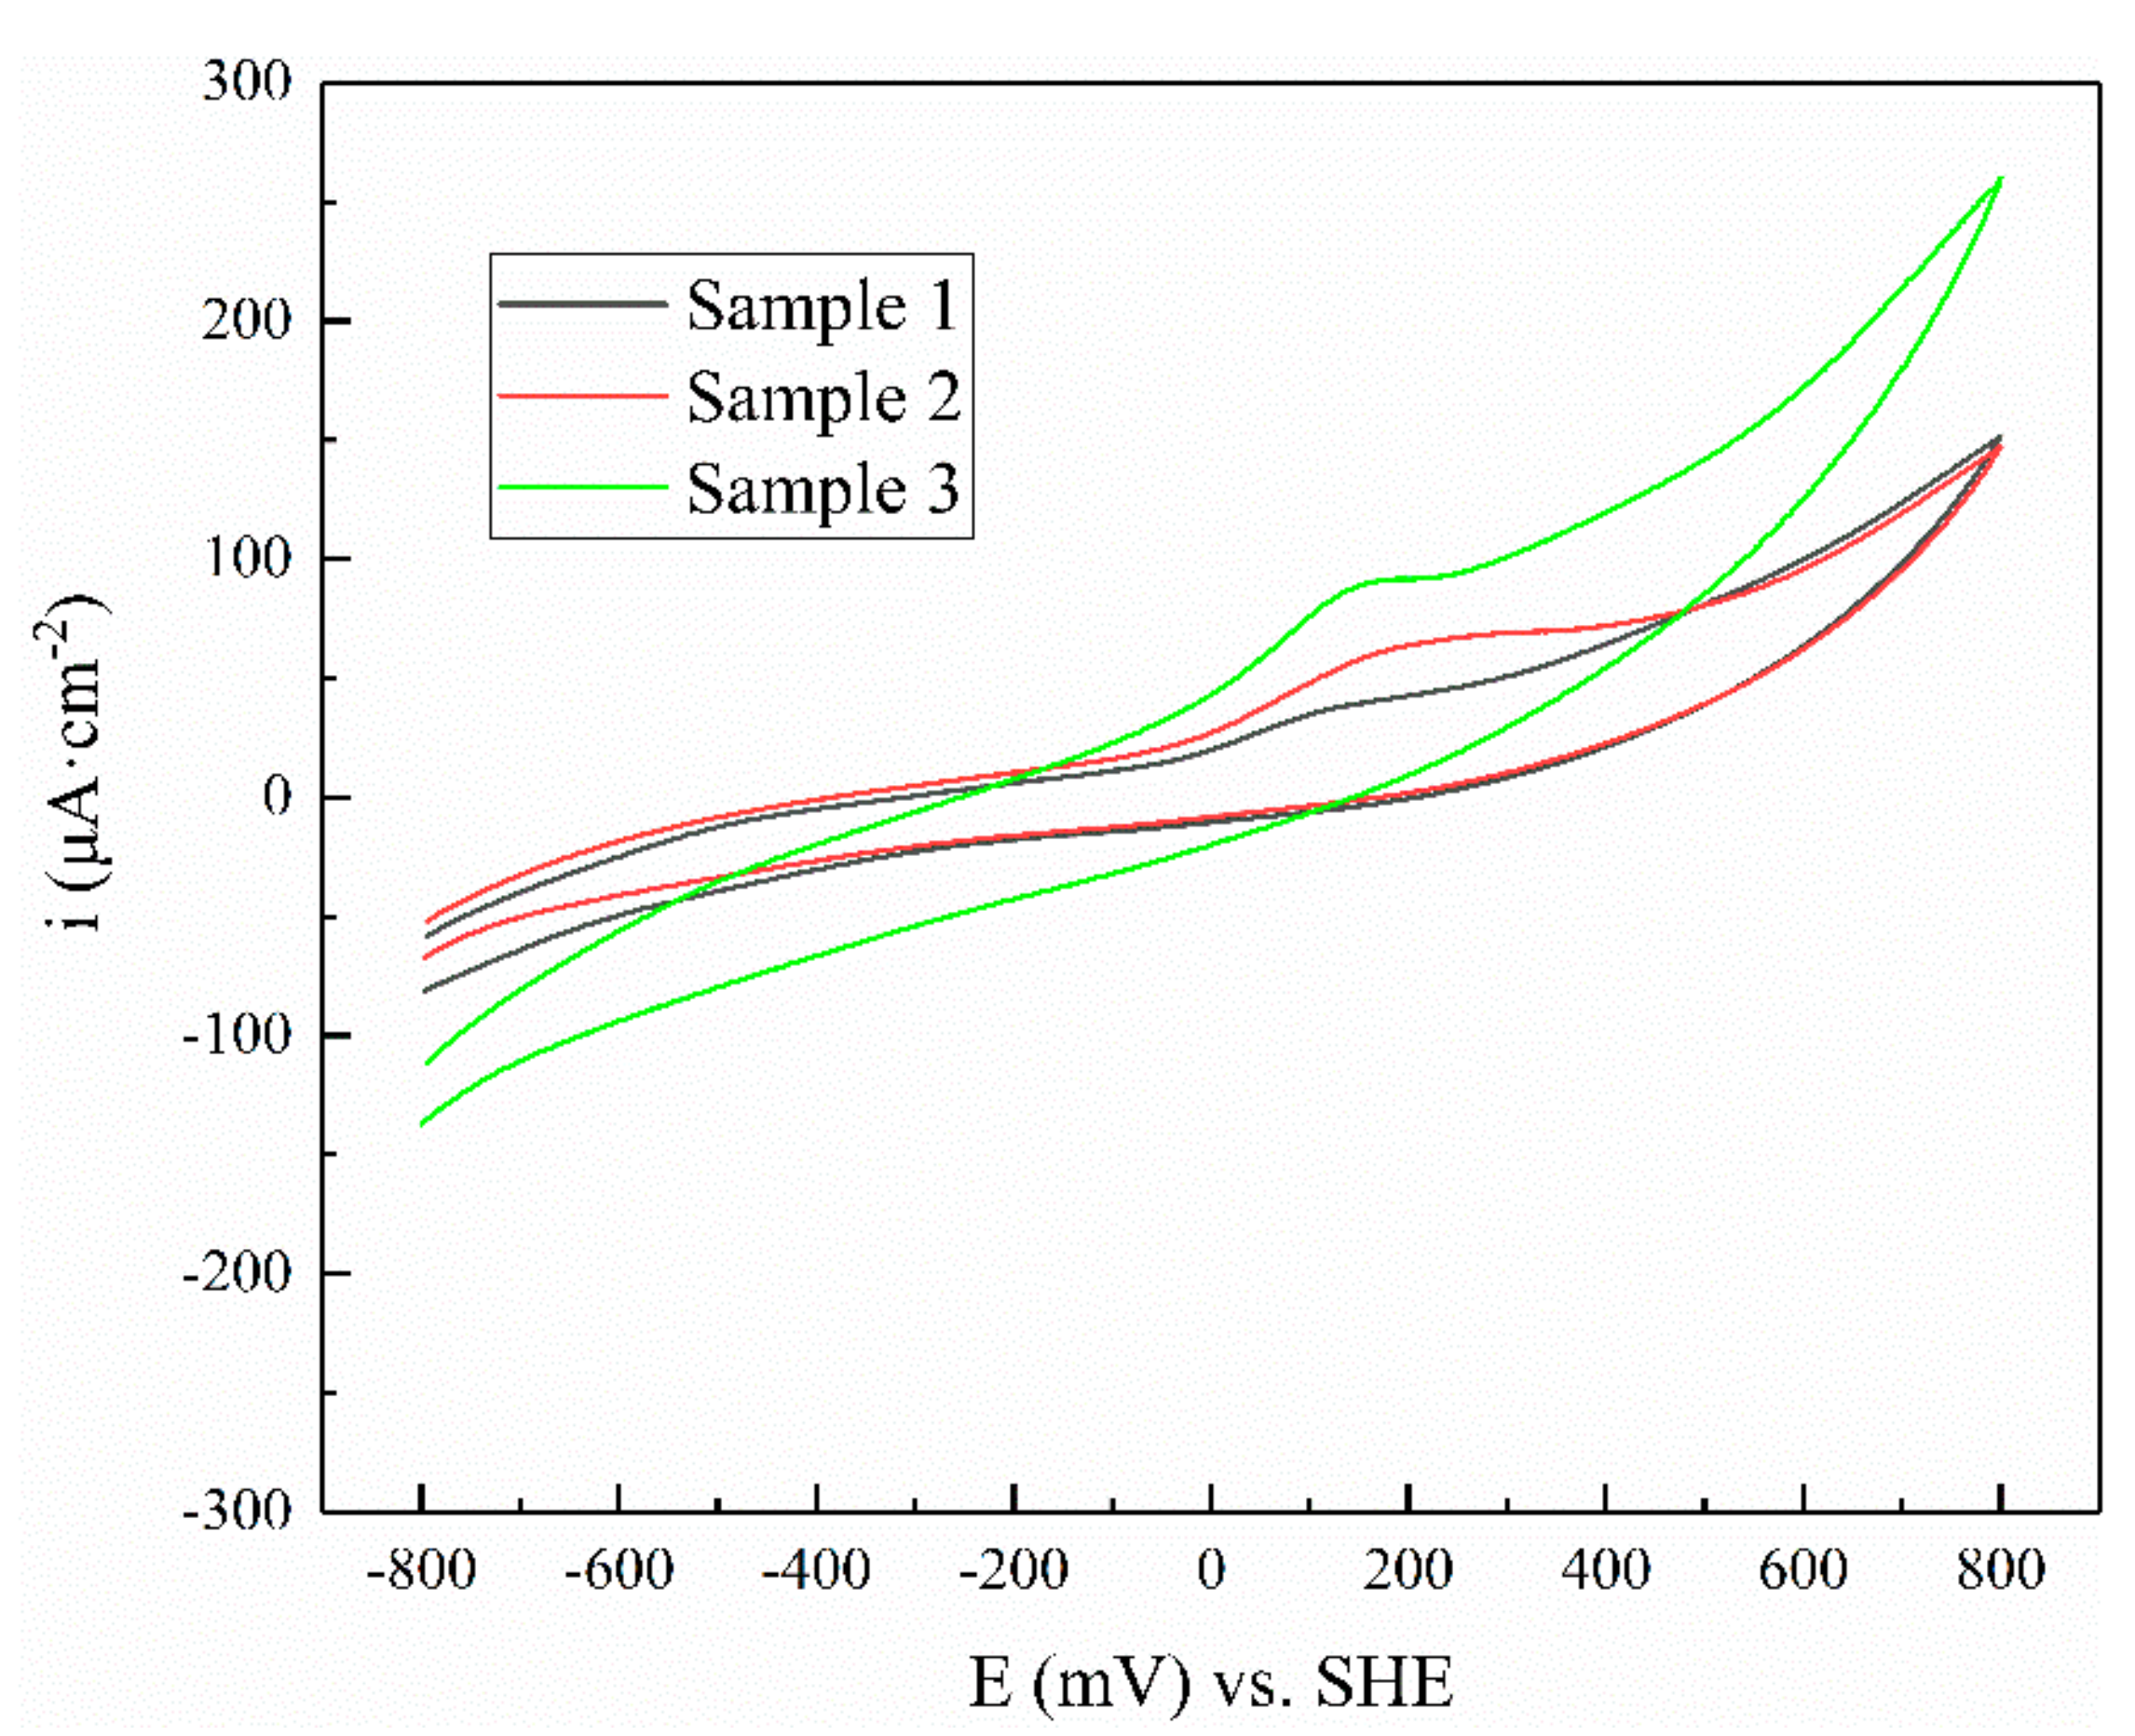
3.3. Cyclic Voltammogram
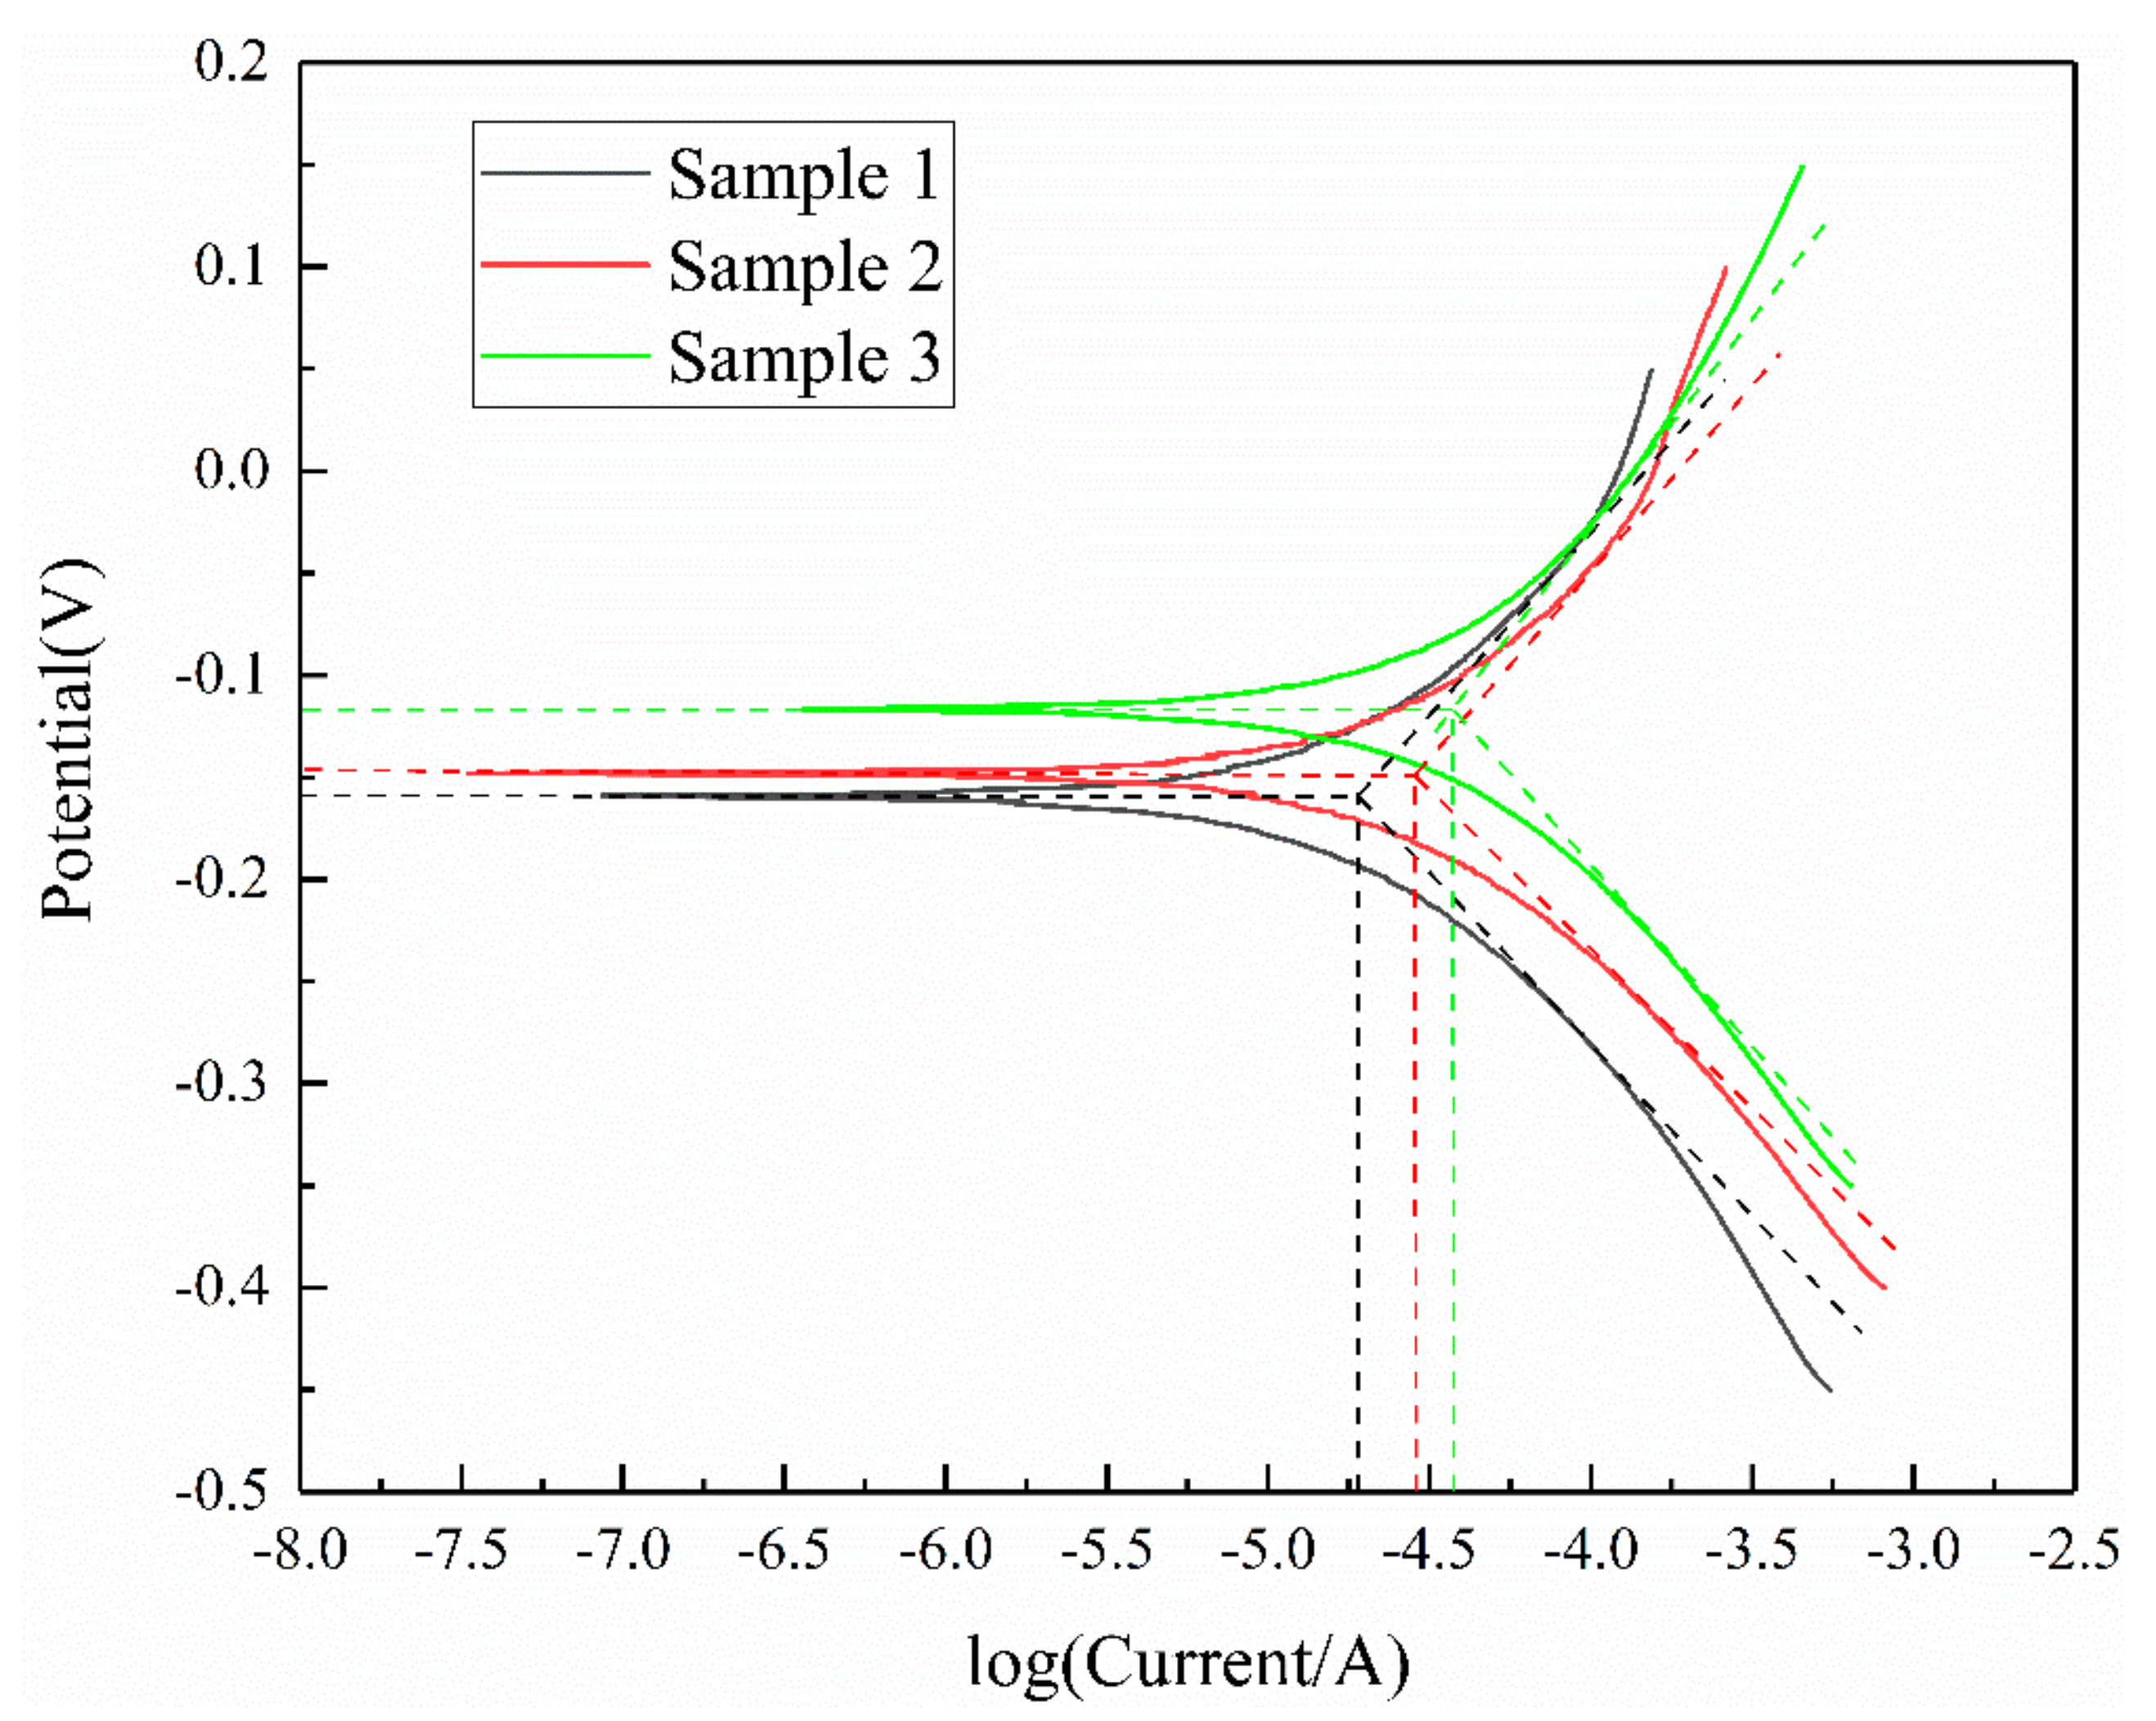
The cyclic voltammetry curves for the three working electrodes were measured in a solution with a xanthate concentration of 6 × 10⁻⁵ mol/L, and the results are shown in Figure 9. From Figure 9, sample 3 shows a poorly defined anodic oxidation peak at a potential of 0 V, while sample 1 and sample 2 do not show a similar anodic oxidation peak. In order to prove whether this was because sample 1 and sample 2 did not have the same reaction or because xanthate concentration was insufficient to cause this phenomenon, the same tests were performed in a solution with a xanthate concentration of 1.8 × 10⁻⁴ mol/L and the results are shown in Figure 10.
From Figure 10, an obvious anodic oxidation peak for all three working electrodes within the interval of −20–220 mV potential was clearly observed. This result shows that insufficient xanthate concentration resulted in the anodic oxidation current not being clearly indicated in Figure 9. From the two figures, the anodic oxidation current of sample 3 was much larger than that of sample 2 and sample 1, which indicates that the oxidation reaction of sample 3 was the most intense. As the anodic oxidation current of sample 1 was weak, it was difficult to observe, and the corresponding oxidation reaction was also weak. An obvious upward trend of anodic oxidation current was observed with the increase in iron impurity content in the working electrode.
Generally, it is acknowledged that there are three adsorption modes for xanthate on the surface of sulfide ore [12,13,28]:
X → X(ad) + e,
MS + 2 X MX 2 + S 0 + 2 e or MS + 2 X + 4 H 2 O MX 2 + SO 4 2 + 8 H + + 2 e ,
2X → X2 + 2e.
Since both the electrochemical adsorption of xanthate and the production of dixanthogen are reversible reactions, the anodic oxidation peak must also correspond to the cathode reduction peak [29,30,31,32]. However, a cathode reduction peak corresponding to the anodic oxidation peak is not observed in either figure, which indicates that the redox reaction was irreversible. Therefore, the product of the anode reaction was concluded to be metal xanthate, which is consistent with the previous research results. S0 had been confirmed by UV–VIS, so it can be inferred that the oxidation reaction corresponded to the following reaction:
MS + 2X → MX2 + S0 + 2e.
The overall redox reaction that occurs corresponded to the following reaction:
MS   +   2 X   + 1 2 O 2   +   H 2 O   =   MX 2   +   S 0   +   2 OH .
From the cyclic voltammetry curve, it can be concluded that when the iron impurity content was less than 5 wt.%, with the increase in iron content, the reaction between sphalerite and xanthate increased. The products were metal xanthate.

3.4. Tafel Curves

Tafel curves for the three samples were conducted in the solution with pH = 8 and xanthate concentration of 1.8 × 10⁻⁴ mol/L. The Tafel curves and galvanic corrosion parameters for the three samples in the xanthate solution are presented in Figure 11 and Table 6, respectively. Different corrosion potentials for the three samples are clearly observed in Figure 11 and the corrosion potential increased with the increase in iron impurity content. The lower the corrosion potential, the more likely it is to react. This means that with the increase in iron impurity content, reaction 6 becomes more difficult.
The zinc content in sphalerite decreases with the increase in iron impurity content. The same amount of sphalerite was oxidized, and the sphalerite with greater iron impurity content was the least exposed to the zinc ions. To form zinc xanthate, the sphalerite with a high iron content required more extensive oxidation. And this led to the increase in corrosion potential. During flotation, the pulp potential was higher than −0.119 V, thus the reaction could occur normally and the change of corrosion potential had no effect on the reaction.
The corrosion current for the three samples was also different, and the corrosion current increased with the increase in iron impurity content. The corrosion current reflects the corrosion rate of the working electrode and the magnitude of the corrosion current is proportionate to the corrosion rate. The corrosion currents for sample 1 and sample 3 were 1.90 × 10⁻⁵ A and 3.81 × 10⁻⁵ A, respectively. The corrosion reaction for the three samples is given by Equation (5), for which the corrosion rate of sample 3 was twice that of sample 1. Combined with the corrosion currents of the three samples, the adsorption rate of xanthate on the surface of the three samples was calculated accurately. The adsorption rate for sample 3 was 2 and 1.5 times that of sample 1 and sample 2, respectively, and the adsorption rate for sample 2 was 1.3 times that of sample 1. This indicated that the adsorption rate of xanthate on the surface of the sphalerite increased significantly with the increase in iron impurity content. This is because the high iron content sphalerite was more easily oxidized, which leads to the accelerated adsorption rate of the xanthate. The macroscopic manifestation was the enhancement of corrosion current that Harmer et al. [15] and Chen and Chen [17] have previously demonstrated, in studies where sphalerite with a high iron impurity had better conductivity and was more easily oxidized.

4. Conclusions

The results of this study showed that sphalerite containing a small amount of iron impurity was beneficial to improving the flotation recovery of sphalerite. The flotation recovery increased with the increase in the iron impurity content, when the iron impurity content was less than 5 wt.%. The adsorption measurements, UV–VIS and FTIR confirmed that the adsorbed products of xanthate on the surface of sphalerite containing iron impurity were metal xanthate and the saturated adsorption of xanthate increased with the increase in iron impurity content.
By analyzing the cyclic voltammetry curve and Tafel curve, the results obtained show that the adsorption rate of xanthate onto the surface of sphalerite with an iron impurity content of 4.66 wt.% was twice as fast as that onto the surface of sphalerite with an iron impurity content of 2.30 wt.% and 1.5 times as fast as that onto the surface of sphalerite with iron impurity content of 3.20 wt.%. It was concluded that sphalerite was more easily oxidized and the adsorption rate of xanthate onto the surface of sphalerite increased significantly with the increase in the iron impurity content. To summarize, a small amount of iron impurity was beneficial to the recovery of the sphalerite. However, it must be noted that the samples used in this test were from the same middle section of Huize mine No. 10 ore body in Yunnan Province, China, and therefore, the application range of the test results may be limited.

Author Contributions

Conceptualization, J.Y. and X.W.; Data curation, Z.Z.; Formal analysis, J.Y. and Y.Z.; Investigation, X.W.; Methodology, J.Y., Y.Z. and S.L.; Project administration, X.W.; Resources, X.W. and S.L.; Validation, J.Y. and Z.Z.; Writing—original draft, J.Y.; Writing—review & editing, J.Y.

Funding

This project was financially supported by the National Key R&D Program of China (Grant No.2017YFE0133100).

Conflicts of Interest

The authors declare no conflict of interest.

References

  1. Osadchii, V.O.; Fedkin, M.V.; Osadchii, E.G. Electrochemical determination of the thermodynamic parameters of sphalerite, ZnS. J. Alloys Compd. 2015, 636, 368–374. [Google Scholar] [CrossRef]
  2. Chandra, A.P.; Gerson, A.R. A review of the fundamental studies of the copper activation mechanisms for selective flotation of the sulfide minerals, sphalerite and pyrite. Adv. Colloid Interface Sci. 2009, 145, 97–110. [Google Scholar] [CrossRef]
  3. Lepetit, P.; Bente, K.; Doering, T.; Luckhaus, S. Crystal chemistry of Fe-containing sphalerites. Phys. Chem. Miner. 2003, 30, 185–191. [Google Scholar] [CrossRef]
  4. Cook, N.J.; Ciobanu, C.L.; Pring, A.; Skinner, W.; Shimizu, M.; Danyushevsky, L. Trace and minor elements in sphalerite: A LA-ICPMS study. Geochim. Cosmochim. Acta 2009, 73, 4761–4791. [Google Scholar] [CrossRef]
  5. Wright, K.; Gale, J.D. A first principles study of the distribution of iron in sphalerite. Geochim. Cosmochim. Acta 2010, 74, 3514–3520. [Google Scholar] [CrossRef]
  6. Xiong, T.; Jian, H.E.; Feng, R.; Si-Qing, L.; Qing-Hua, Z. Experimental Study on Activation of High Iron-bearing Marmatite. Min. Metall. Eng. 2006, 26, 19–22. (In China) [Google Scholar]
  7. Quast, K.; Hobart, G. Marmatite depression in galena flotation. Miner. Eng. 2006, 19, 860–869. [Google Scholar] [CrossRef]
  8. Tong, X.; Song, S.; He, J.; Rao, F.; Lopez-Valdivieso, A. Activation of high-iron marmatite in froth flotation by ammoniacal copper(II) solution. Miner. Eng. 2007, 20, 259–263. [Google Scholar] [CrossRef]
  9. Szczypa, J.; Solecki, J.; Komosa, A. Effect of surface oxidation and iron contents on xanthate ions adsorption of synthetic sphalerites. Int. J. Miner. Process. 1980, 7, 151–157. [Google Scholar] [CrossRef]
  10. Barzyk, W.; Malysa, K.; Pomianowski, A. The influence of surface oxidation of chalcocite on its floatability and ethyl xanthate sorption. Int. J. Miner. Process. 1981, 8, 17–29. [Google Scholar] [CrossRef]
  11. Buckley, A.N.; Woods, R. Chemisorption—The thermodynamically favoured process in the interaction of thiol collectors with sulphide minerals. Int. J. Miner. Process. 1997, 51, 15–26. [Google Scholar] [CrossRef]
  12. Janetski, N.D.; Woodburn, S.I.; Woods, R. An electrochemical investigation of pyrite flotation and depression. Int. J. Miner. Process. 1977, 4, 227–239. [Google Scholar] [CrossRef]
  13. Haung, H.H.; Miller, J.D. Kinetics and thermochemistry of amyl xanthate adsorption by pyrite and marcasite. Int. J. Miner. Process. 1978, 5, 241–266. [Google Scholar] [CrossRef]
  14. Chen, Y.; Chen, J.; Guo, J. A DFT study on the effect of lattice impurities on the electronic structures and floatability of sphalerite. Miner. Eng. 2010, 23, 1120–1130. [Google Scholar] [CrossRef]
  15. Harmer, S.L.; Mierczynska-Vasilev, A.; Beattie, D.A.; Shapter, J.G. The effect of bulk iron concentration and heterogeneities on the copper activation of sphalerite. Miner. Eng. 2008, 21, 1005–1012. [Google Scholar] [CrossRef]
  16. Yang, P.; Lü, M.; Xu, D.; Yuan, D.; Song, C. Photoluminescence characteristics of ZnS nanocrystallites co-doped with Cu2+ and Cd2+. J. Phys. Chem. Solids 2003, 64, 155–158. [Google Scholar] [CrossRef]
  17. Chen, J.; Chen, Y. A first-principle study of the effect of vacancy defects and impurities on the adsorption of O2 on sphalerite surfaces. Colloids Surf. A Physicochem. Eng. Asp. 2010, 363, 56–63. [Google Scholar] [CrossRef]
  18. Deng, J.S.; Lai, H.; Chen, M.; Glen, M.; Wen, S.M.; Zhao, B.; Liu, Z.L.; Yang, H.; Liu, M.S.; Huang, L.Y.; et al. Effect of iron concentration on the crystallization and electronic structure of sphalerite/marmatite: A DFT study. Miner. Eng. 2019, 136, 168–174. [Google Scholar] [CrossRef]
  19. Chen, Y.; Chen, J.; Lan, L.; Yang, M. The influence of the impurities on the flotation behaviors of synthetic ZnS. Miner. Eng. 2012, 27–28, 65–71. [Google Scholar] [CrossRef]
  20. Solecki, J.; Komosa, A.; Szczypa, J. Copper ion activation of synthetic sphalerites with various iron contents. Int. J. Miner. Process. 1979, 6, 221–228. [Google Scholar] [CrossRef]
  21. Gigowski, B.; Vogg, A.; Wierer, K.; Dobias, B. Effect of Fe-lattice ions on adsorption, electrokinetic, calorimetric and flotation properties of sphalerite. Int. J. Miner. Process. 1991, 33, 103–120. [Google Scholar] [CrossRef]
  22. Ahlberg, E.; Asbjornsson, J. Carbon paste electrodes in mineral processing: An electrochemical study of sphalerite. Hydrometallurgy 1994, 36, 19–37. [Google Scholar] [CrossRef]
  23. Donaldson, E.M. Chloroform extraction of metal ethyl xanthates from hydrochloric acid media. Talanta 1976, 23, 411–416. [Google Scholar] [CrossRef]
  24. Guo, H.; Yen, W.T. Surface potential and dixanthogen stability on chalcopyrite surface. Int. J. Miner. Process. 2005, 76, 205–213. [Google Scholar] [CrossRef]
  25. Wang, X.H. Interfacial Electrochemistry of Pyrite Oxidation and Flotation: II. FTIR Studies of Xanthate Adsorption on Pyrite Surfaces in Neutral pH Solutions. J. Colloid Interface Sci. 1995, 171, 413–428. [Google Scholar] [CrossRef]
  26. Zhang, Y.; Cao, Z.; Cao, Y.; Sun, C. FTIR studies of xanthate adsorption on chalcopyrite, pentlandite and pyrite surface. J. Mol. Struct. 2013, 1048, 434–440. [Google Scholar] [CrossRef]
  27. Fuerstenau, M.C.; Clifford, K.L.; Kuhn, M.C. The role of zinc-xanthate precipitation in sphalerite flotation. Int. J. Miner. Process. 1974, 1, 307–318. [Google Scholar] [CrossRef]
  28. Tadie, M.; Corin, K.C.; Wiese, J.G.; Nicol, M.; O’Connor, C.T. An investigation into electrochemical interactions between platinum group minerals and xanthate: Voltammetric study. Miner. Eng. 2015, 70, 148–155. [Google Scholar] [CrossRef]
  29. Iwasaki, I.; Cooke, S.R.B. The Decomposition of Xanthate in Acid Solution. J. Am. Chem. Soc. 1958, 80, 285–288. [Google Scholar] [CrossRef]
  30. Jones, M.H.; Woodcock, J.T. Decomposition of alkyl dixanthogens in aqueous solutions. Int. J. Miner. Process. 1983, 10, 1–24. [Google Scholar] [CrossRef]
  31. Valdivieso, A.L.; López, A.S.; Song, S. On the cathodic reaction coupled with the oxidation of xanthates at the pyrite/aqueous solution interface. Int. J. Miner. Process. 2005, 77, 154–164. [Google Scholar] [CrossRef]
  32. Wei-Zhong, L.; Wen-Qing, Q.; Wei, S. Electrodeposition of dixanthogen(TETD) on pyrite surface. Trans. Nonferr. Metal. Soc. China 2007, 17, 154–158. [Google Scholar]
Figure 1. X-ray diffraction patterns of the sphalerite samples: (a) Sample 1; (b) Sample 2; (c) Sample 3.
Minerals 09 00687 g001
Figure 2. Flotation recovery of the three samples as a function of the pH.
Minerals 09 00687 g002
Figure 3. Flotation recovery of three samples as a function of the xanthate concentration (pH = 8).
Minerals 09 00687 g003
Figure 4. Flotation recovery of three samples as a function of the pH (xanthate = 6 × 10⁻⁵ mol/L).
Minerals 09 00687 g004
Figure 5. UV absorbance spectra of the three samples after reaction with xanthate.
Minerals 09 00687 g005
Figure 6. UV absorbance spectra of xanthate and sulfur.
Minerals 09 00687 g006
Figure 7. FTIR of the three samples after reaction with xanthate.
Minerals 09 00687 g007
Figure 8. FTIR of xanthate.
Minerals 09 00687 g008
Figure 9. Cyclic voltammogram curves of the three samples in a solution with a xanthate concentration of 6 × 10⁻⁵ mol/L at a scan rate of 20 mV/s.
Minerals 09 00687 g009
Figure 10. Cyclic voltammogram curves of the three samples in a solution with a xanthate concentration of 1.8 × 10⁻⁴ mol/L at scan rate of 20 mV/s.
Minerals 09 00687 g010
Figure 11. Tafel curves for the three samples in a solution at pH = 8 with xanthate concentration of 1.8 × 10⁻⁴ mol/L at scan rate of 5 mV/s.
Minerals 09 00687 g011
Table 1. Chemical composition of the sphalerite samples.
MineralZn/(wt.%)S/(wt.%)Fe/(wt.%)
Sample 165.1532.312.30
Sample 263.1332.603.2
Sample 361.5933.784.66
Table 2. Inductively coupled plasma massspectrometry (ICP) of sphalerite samples.
MineralsPb/(wt.%)Bi/(wt.%)Ca/(wt.%)Cd/(wt.%)
Sample 10.100.170.0590.12
Sample 20.120.0580.0750.16
Sample 30.09<0.050.0580.24
(The contents of the metal elements not mentioned in the table are all less than 0.05 wt.%).
Table 3. Xanthate adsorption (xanthate = 6 × 10⁻⁵ mol/L).
SphaleriteAdsorption × 10−7 (mol/g)
Sample 15.31
Sample 27.26
Sample 38.83
Table 4. Xanthate adsorption (xanthate = 1.8 × 10⁻⁴ mol/L).
SphaleriteAdsorption × 10−7 (mol/g)
Sample 15.59
Sample 27.63
Sample 39.74
Table 5. Absorption peaks for the main functional groups of xanthate and dixanthogen.
MolecularMain Functional GroupsWavenumber (cm−1)
XanthateC=S stretching vibration
C–O–C stretching vibration
1020–1050
1100–1120, 1150–1265
DixanthogenC–O1240–1265
XanthateC–O1150–1210
Table 6. Electrochemical corrosion parameters for the three samples in a solution at pH = 8 with xanthate concentration of 1.8 × 10⁻⁴ mol/L.
MineralPotential/VCurrent/×10−5 A
Sample 1−0.1561.90
Sample 2−0.1482.88
Sample 3−0.1193.81

