1. Introduction
Recently, metal dioxides with excellent photocatalytic activity have been attracting attention [
1]. Among the various metal dioxides, TiO
2 is usually used as a photocatalyst to treat water pollution for the removal of chemical contaminants [
2,
3]. Nevertheless, the recovery and the agglomerates of TiO
2 nanoparticles are two inevitable problems [
4]. Therefore, developing new TiO
2 supported catalysts is an urgent problem requiring action.
Coal fly ash (CFA) is generally derived from thermal power generation plants and can negatively impact the environment [
5]. Some researchers have concentrated on the preparation of environmentally friendly products from CFA through geopolymerization [
6,
7]. Geopolymers can be used as supported materials, which not only solves the agglomeration of nanomaterials, but also adsorbs a certain amount of harmful substances [
8]. Alouani et. al. removed methylene blue from aqueous solution by using fly ash based geopolymer powder [
9]. Further, metakaolin based geopolymer was applied to absorb multi- and mono- cations in aqueous solution by Onutai’s team [
10]. Those studies suggest the possibility of using geopolymer as supports for photocatalyst. In order to increase the amount of the loadable nanoparticles and the contact surface with water, geopolymer could be prepared as a porous structure. However, the existing literature is scarce.
Therefore, we focused on the synthesis of a porous geopolymer supported TiO2 nanocomposite. Two different methods were used in this study. The first one is the one-step method. Geopolymer-TiO2 nanocomposites were fabricated by adding TiO2 particles directly during the preparation of the foamed CFA geopolymer. In the two-step method, foamed CFA geopolymer was first prepared and then TiO2 particles were loaded on the surface. In order to explore the relationship between the structural properties of the nanocomposites and the synthesis methods, multiple techniques, including SEM, XRD, and BET were applied to investigate the properties of the geopolymer-TiO2 nanocomposites. The photocatalytic activities of the geopolymer-TiO2 nanocomposites were monitored via testing the degradation time for MB. Therefore, the objective of this work was to investigate if the one-step convenient process could have an obvious effect on enhancing photocatalytic performance by comparing with the two-step method. Although fly ash-TiO2 composites have been investigated by some researchers previously, geopolymer-TiO2 composites were prepared here by the one-step process for the first time, to the best of our knowledge.
2. Materials and Methods
CFA was collected from Shenhua Junggar Energy Corporation in Junggar, Inner Mongolia, China, and calcined at 850 °C for 4 h before use. Analytical grade sodium hydroxide, H2O2 solution (30%), grade oleic acid, TiO2 (P25), methylene blue trihydrate, and nitric acid (HNO3) were purchased from Sinopharm Chemical Reagent Co., Ltd. Commercial sodium water glass with original modulus of 3.2 was purchased from Guangdong Foshan Zhongfa Co., Ltd., China, and deionized water is self-made in the laboratory.
The foam materials were prepared based on our previous literature [
11]. The alkaline activator (the modulus is 1.2) was thoroughly stirred at 1800 rpm for 8 min. Then CFA (50 g) was mixed at 1800 rpm for 5–6 min after adding to the activator solution. Oleic acid (0.3 g) was added and mixed for another 3–5 min, then H
2O
2 solution (2.25 mL) was added to the mixture, stirring at 2000 rpm for 3–5 min to make geopolymer foam. Finally, the foam mixture was cast into a silica gel mold and cured at 80 °C for 24 h. The material was named as GF.
2.1. Preparation of Geopolymer-Supported TiO2 by One-Step Process
Subsequently, 5 g TiO2 (10 mass%) was added to the foamed geopolymer paste, and stirred for further 3–5 min. The final product was named as GFT1.
2.2. Preparation of Geopolymer-Supported TiO2 by Two-Steps Process
As specified in previous studies [
12], 3.0 g TiO
2 was dissolved in 100 mL HNO
3 (1 M), 500 mL deionized water was then added and stirred an hour under the condition of 70 °C. Then 10 g geopolymer was added to the solution and stirred for about 1 h. The materials were washed four times with deionized water for removing excess unloaded TiO
2 and calcined at 500 °C for 2 h, gradually. The product was named as GFT2.
X-ray powder diffraction (XRD) (D8-FOCUS, BrokerAXS (Beijing) Technology Co., Ltd., Beijing, China, Cu-Kα radiation) was used to measure the crystalline phases. The surface morphology of geopolymer-TiO2 composites was characterized by scanning electron microscope (SEM, Hitachi SU8010, Hitachi, Tokyo, Japan). The measurements of specific surface area and pore volume were carried out via measuring N2 adsorption-desorption isotherms at 77 K using a Micromeritics ASAP 2020 apparatus (Micromeritics Instrument (shanghai) Ltd., Shanghai, China). Photocatalytic activity was tested using a 300 W Xe lamp (CEL-HXF300, Beijing Zhongjiao Jinyuan Technology Co., Ltd., Beijing, China). 0.04 mg catalyst synthesized by one-step method and by two step process was separately adjunct to MB solution (50 mL) of 10 mg/L concentration. The mixture was stirred in dark condition for 30 min in order to reduce the error caused by adsorption-desorption. After irradiation, the degradation of MB was measured by a UV/vis spectrometer (Lambda 35, Perkinelmer, Guangzhou, China) at 665 nm, which was calculated to concentration by the Beer–Lambert law.
3. Results and Discussion
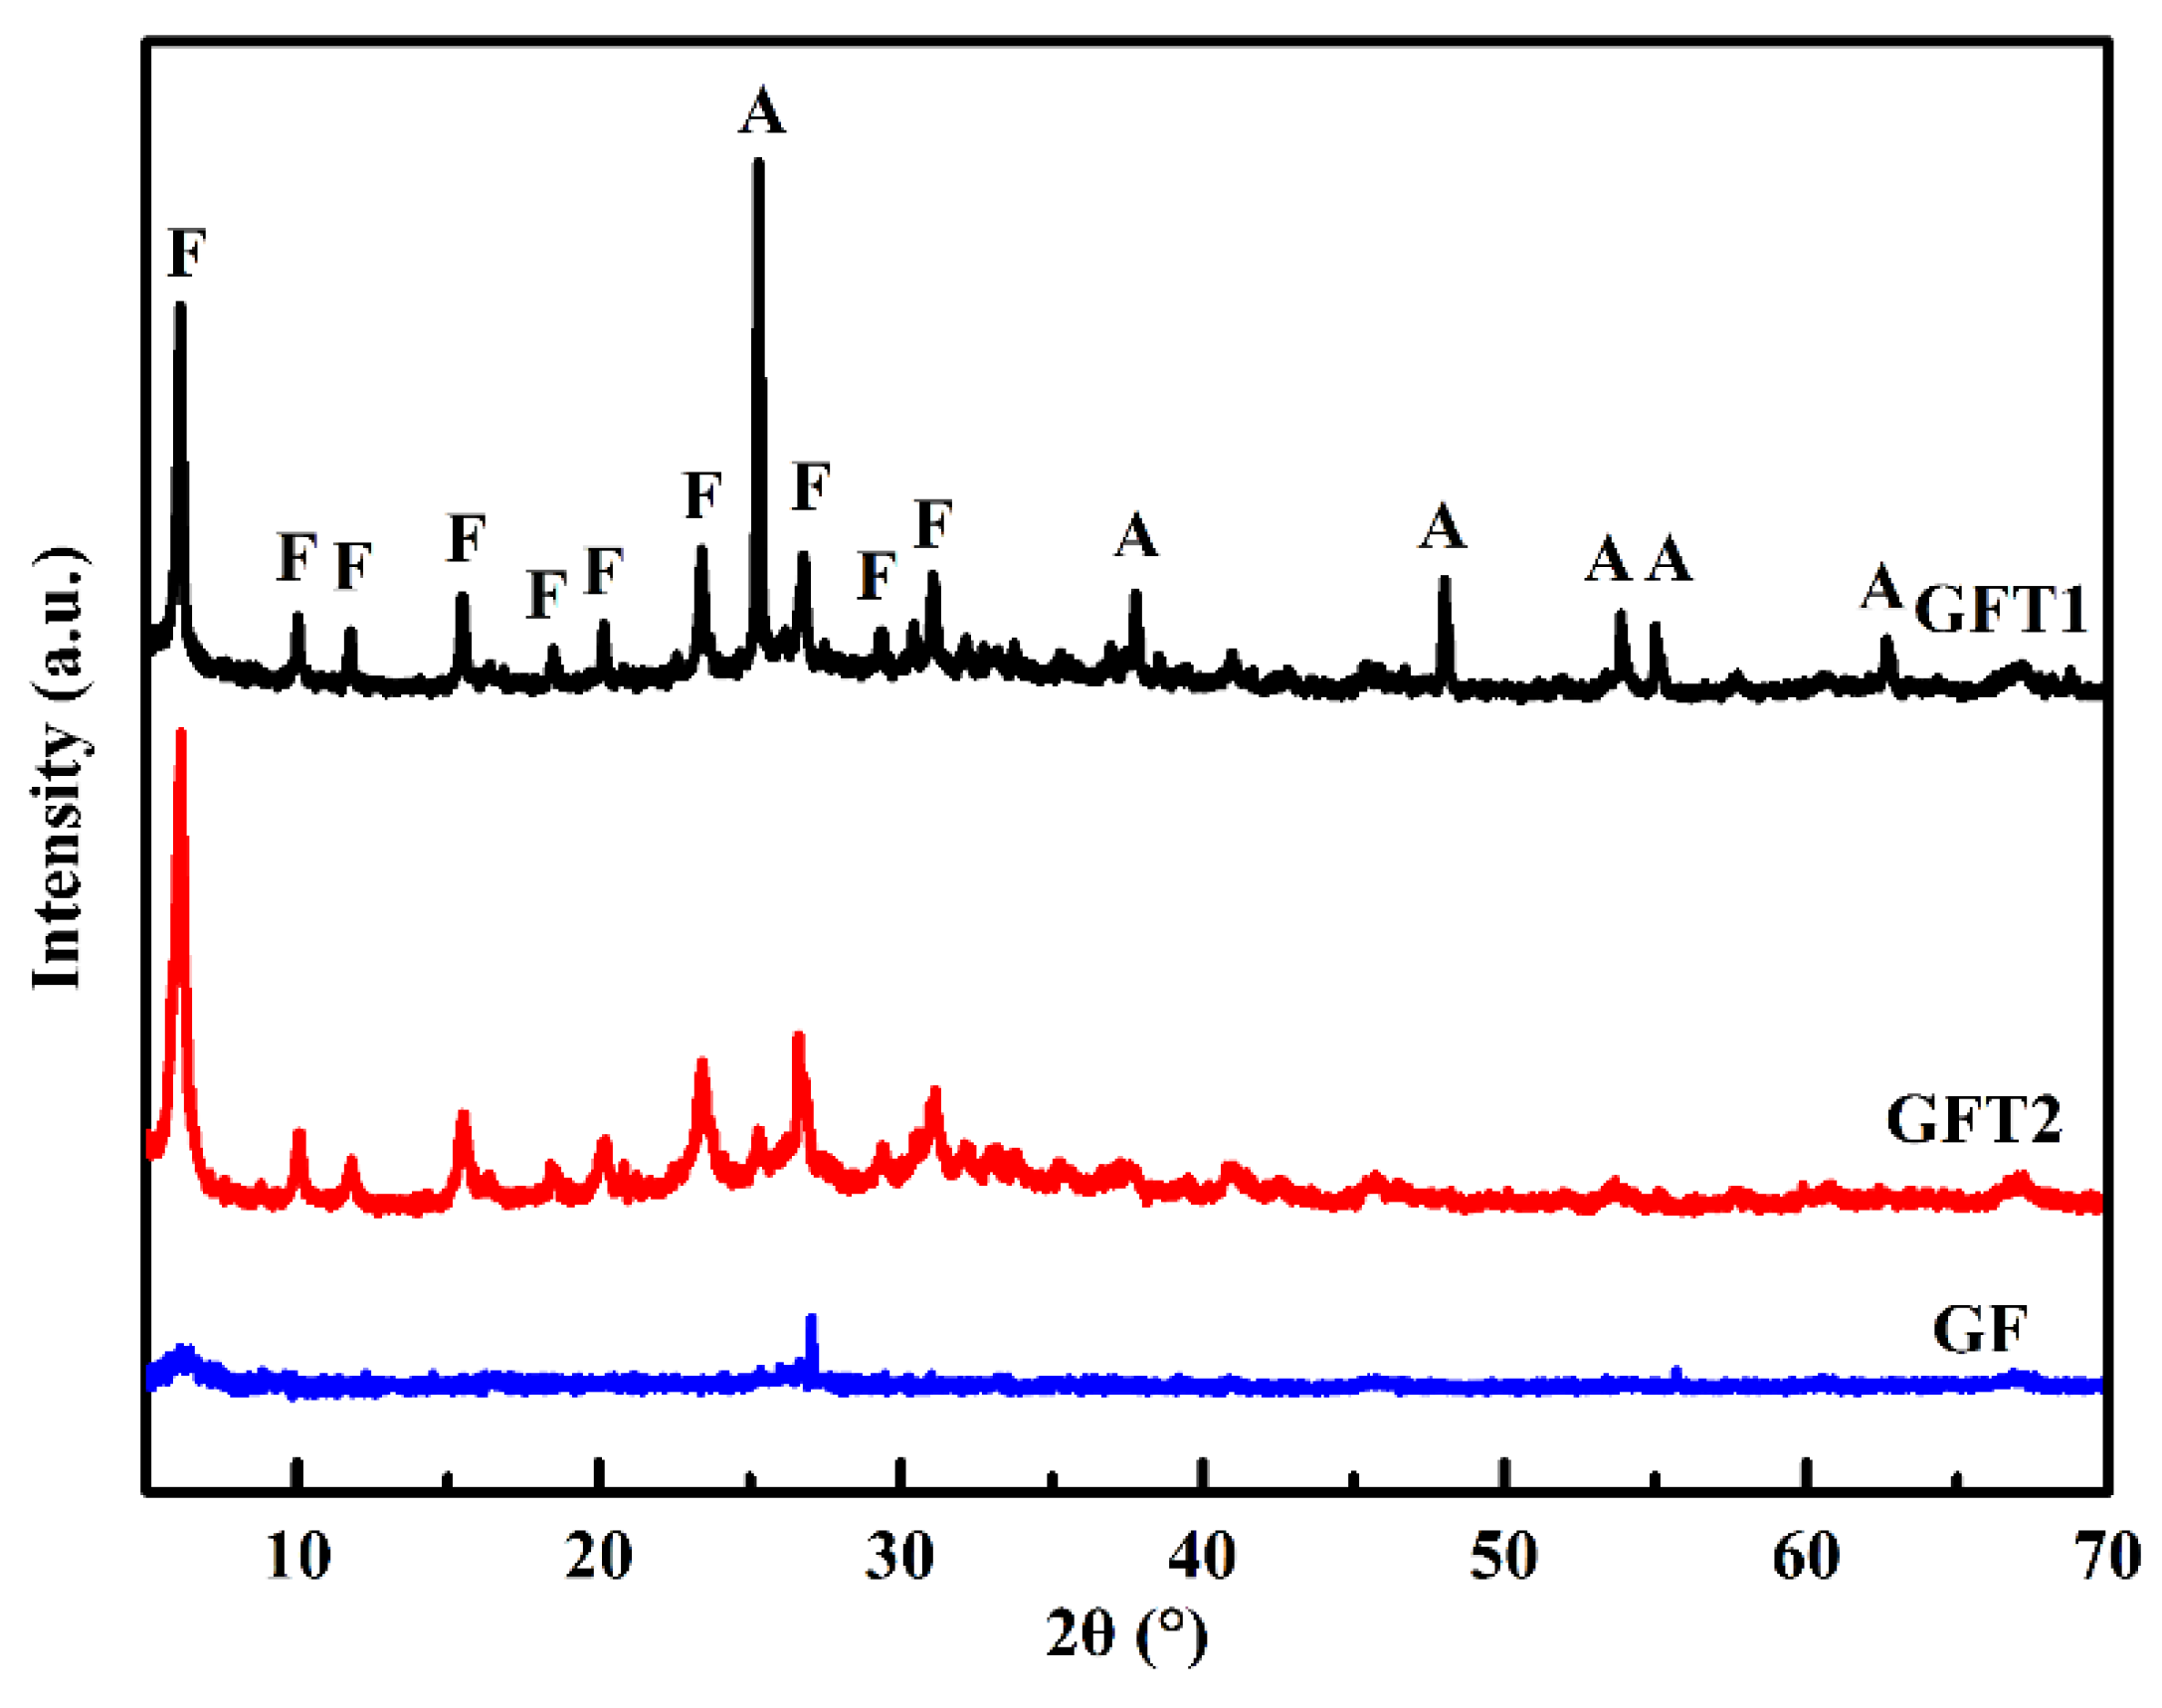
3.1. XRD Analysis
Figure 1 shows the XRD patterns of the geopolymer and the geopolymer-TiO
2 composites synthesized by different preparation approaches. The geopolymer (GF) owns one “hump” located at around 26.0–28.0° (2θ). For GFT1, the diffraction peak of the anatase phase of titania appears at 2θ = 25.3° (JCPDS NO. 65-5714), and the other diffraction peak is ascribed to the faujasite zeolite (JCPDS NO. 26-0897). Compared to GFT2, the anatase phase of titania exhibits greater sharpness and more intensity (101) of reflection in the GFT1 sample. A part of TiO
2 was lost in the two-step method during the activation process of TiO
2 in dilute acid solution, while one-step method could avoid the waste of TiO
2 on the surface of the support material. This means that the one-step method is more conductive to the preparation of the geopolymer-TiO
2 composite.
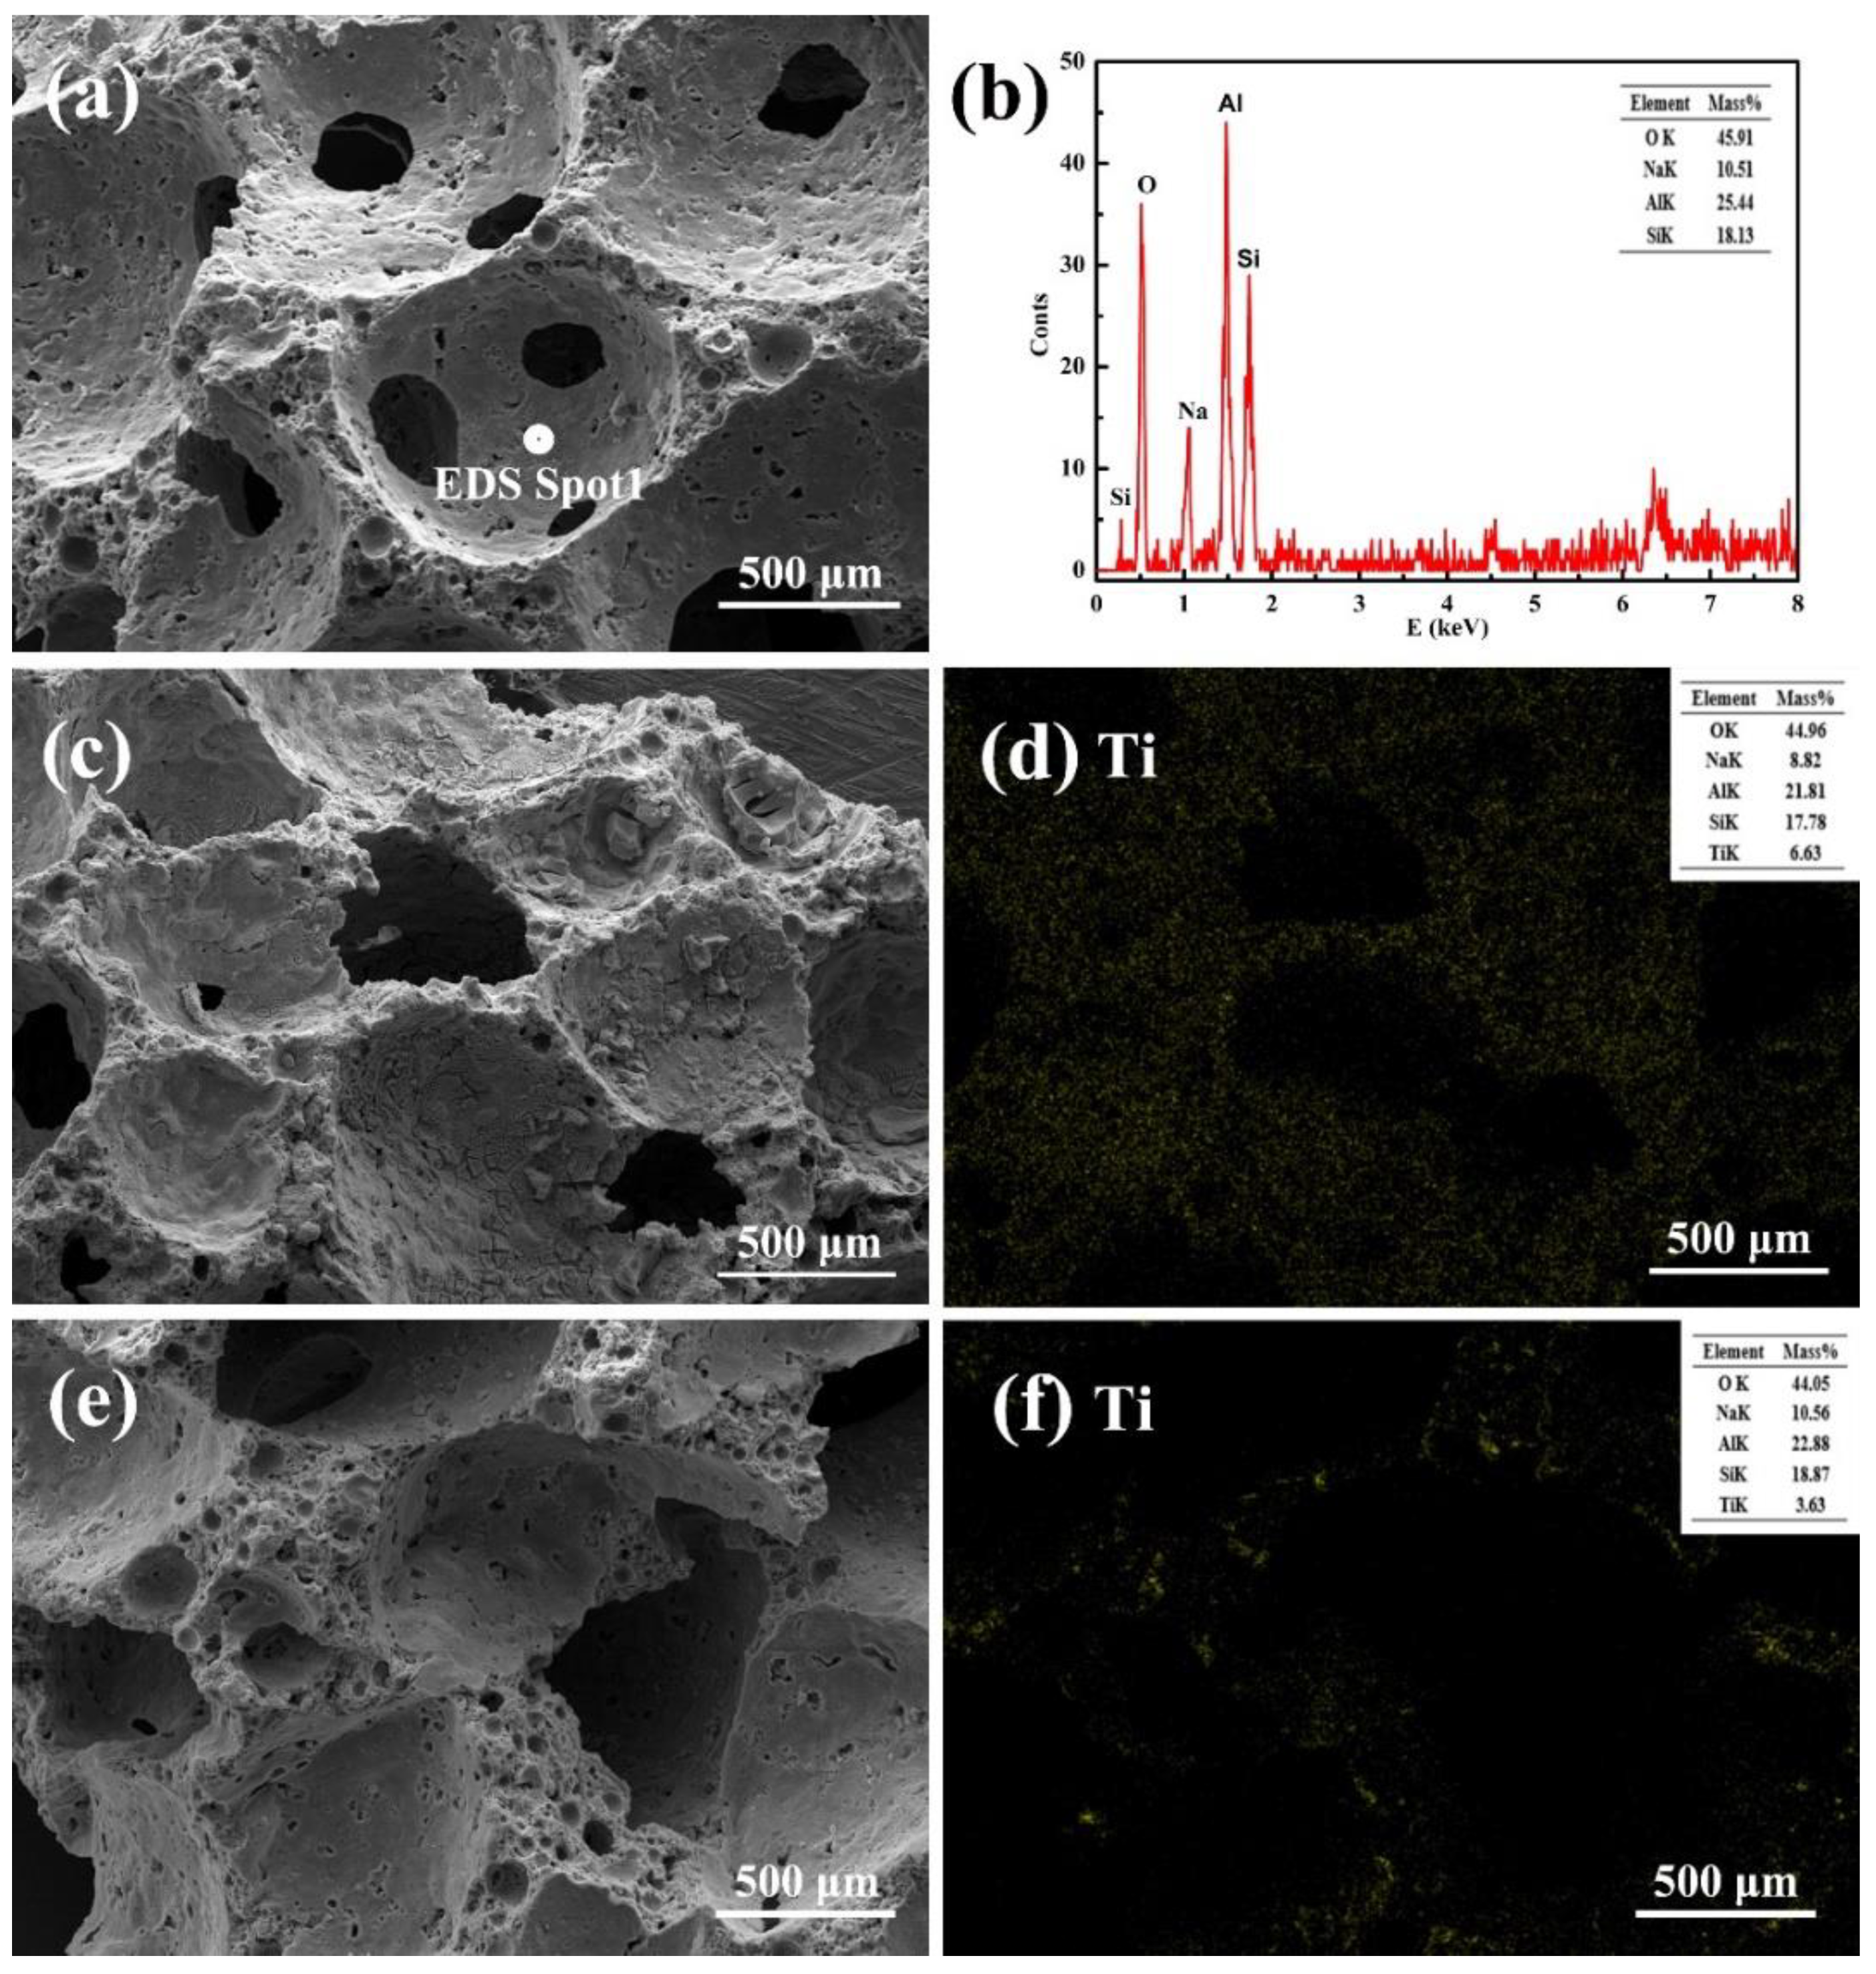
3.2. SEM Observations
The surface morphology of GF without any TiO
2 (
Figure 2a,b) and GFT1 (
Figure 2c,d) or GFT2 (
Figure 2e,f) are presented in
Figure 2. From
Figure 2a, the highly interconnected pores are observed on the surface of the geopolymer, and the material contains 45.91 mass% O, 10.51 mass% Na, 25.44 mass% Al, and 18.13 mass% Si (
Figure 2b).
Figure 2c–f indicates morphological changes and distribution of Ti in composites with the use of different preparation treatments. The SEM images of GFT1 (
Figure 2c) reveal that the excellent porous material formed by the uniform combination of TiO
2 particles and CFA could be observed. From SEM elemental mapping images (
Figure 2d), well-dispersed TiO
2 particles (about 6.63 mass%) throughout the composite samples is related to the one-step method [
13]. The porous material with a smoother surface and a more uniform pore is shown in
Figure 2e, and a small amount of TiO
2 (3.63 mass%, about half of one-step method) is supported on the surface of the porous material by the two step preparation process, which could be reflected by SEM elemental mapping images (
Figure 2f). Different treatment methods caused not only a difference in the morphology of the composite materials, but also the amounts and the extent of dispersion of TiO
2 in the composite, which is consistent with XRD analysis.
3.3. BET Analysis
Table 1 summarizes the pore structure of GFT1 and GFT2. By comparing with GFT1, the total pore volume of GFT2 increases from 0.13 to 0.26 cm
3/g, the
t-plot micropore area increases from 0 to 135.39 m
2/g and the BET surface area increases from 28.67 to 215.04 m
2/g. GFT1 synthesized by the one-step method has a BET surface area of 28.67 m
2/g, which is significantly lower than GFT2. The
t-plot micropore area for GFT1 is 0 and the total pore volume is only half of GFT2. This phenomenon is caused by the well-distribution of TiO
2 nanoparticles for sample GFT1, which is in favor of improving the photocatalytic efficiency.
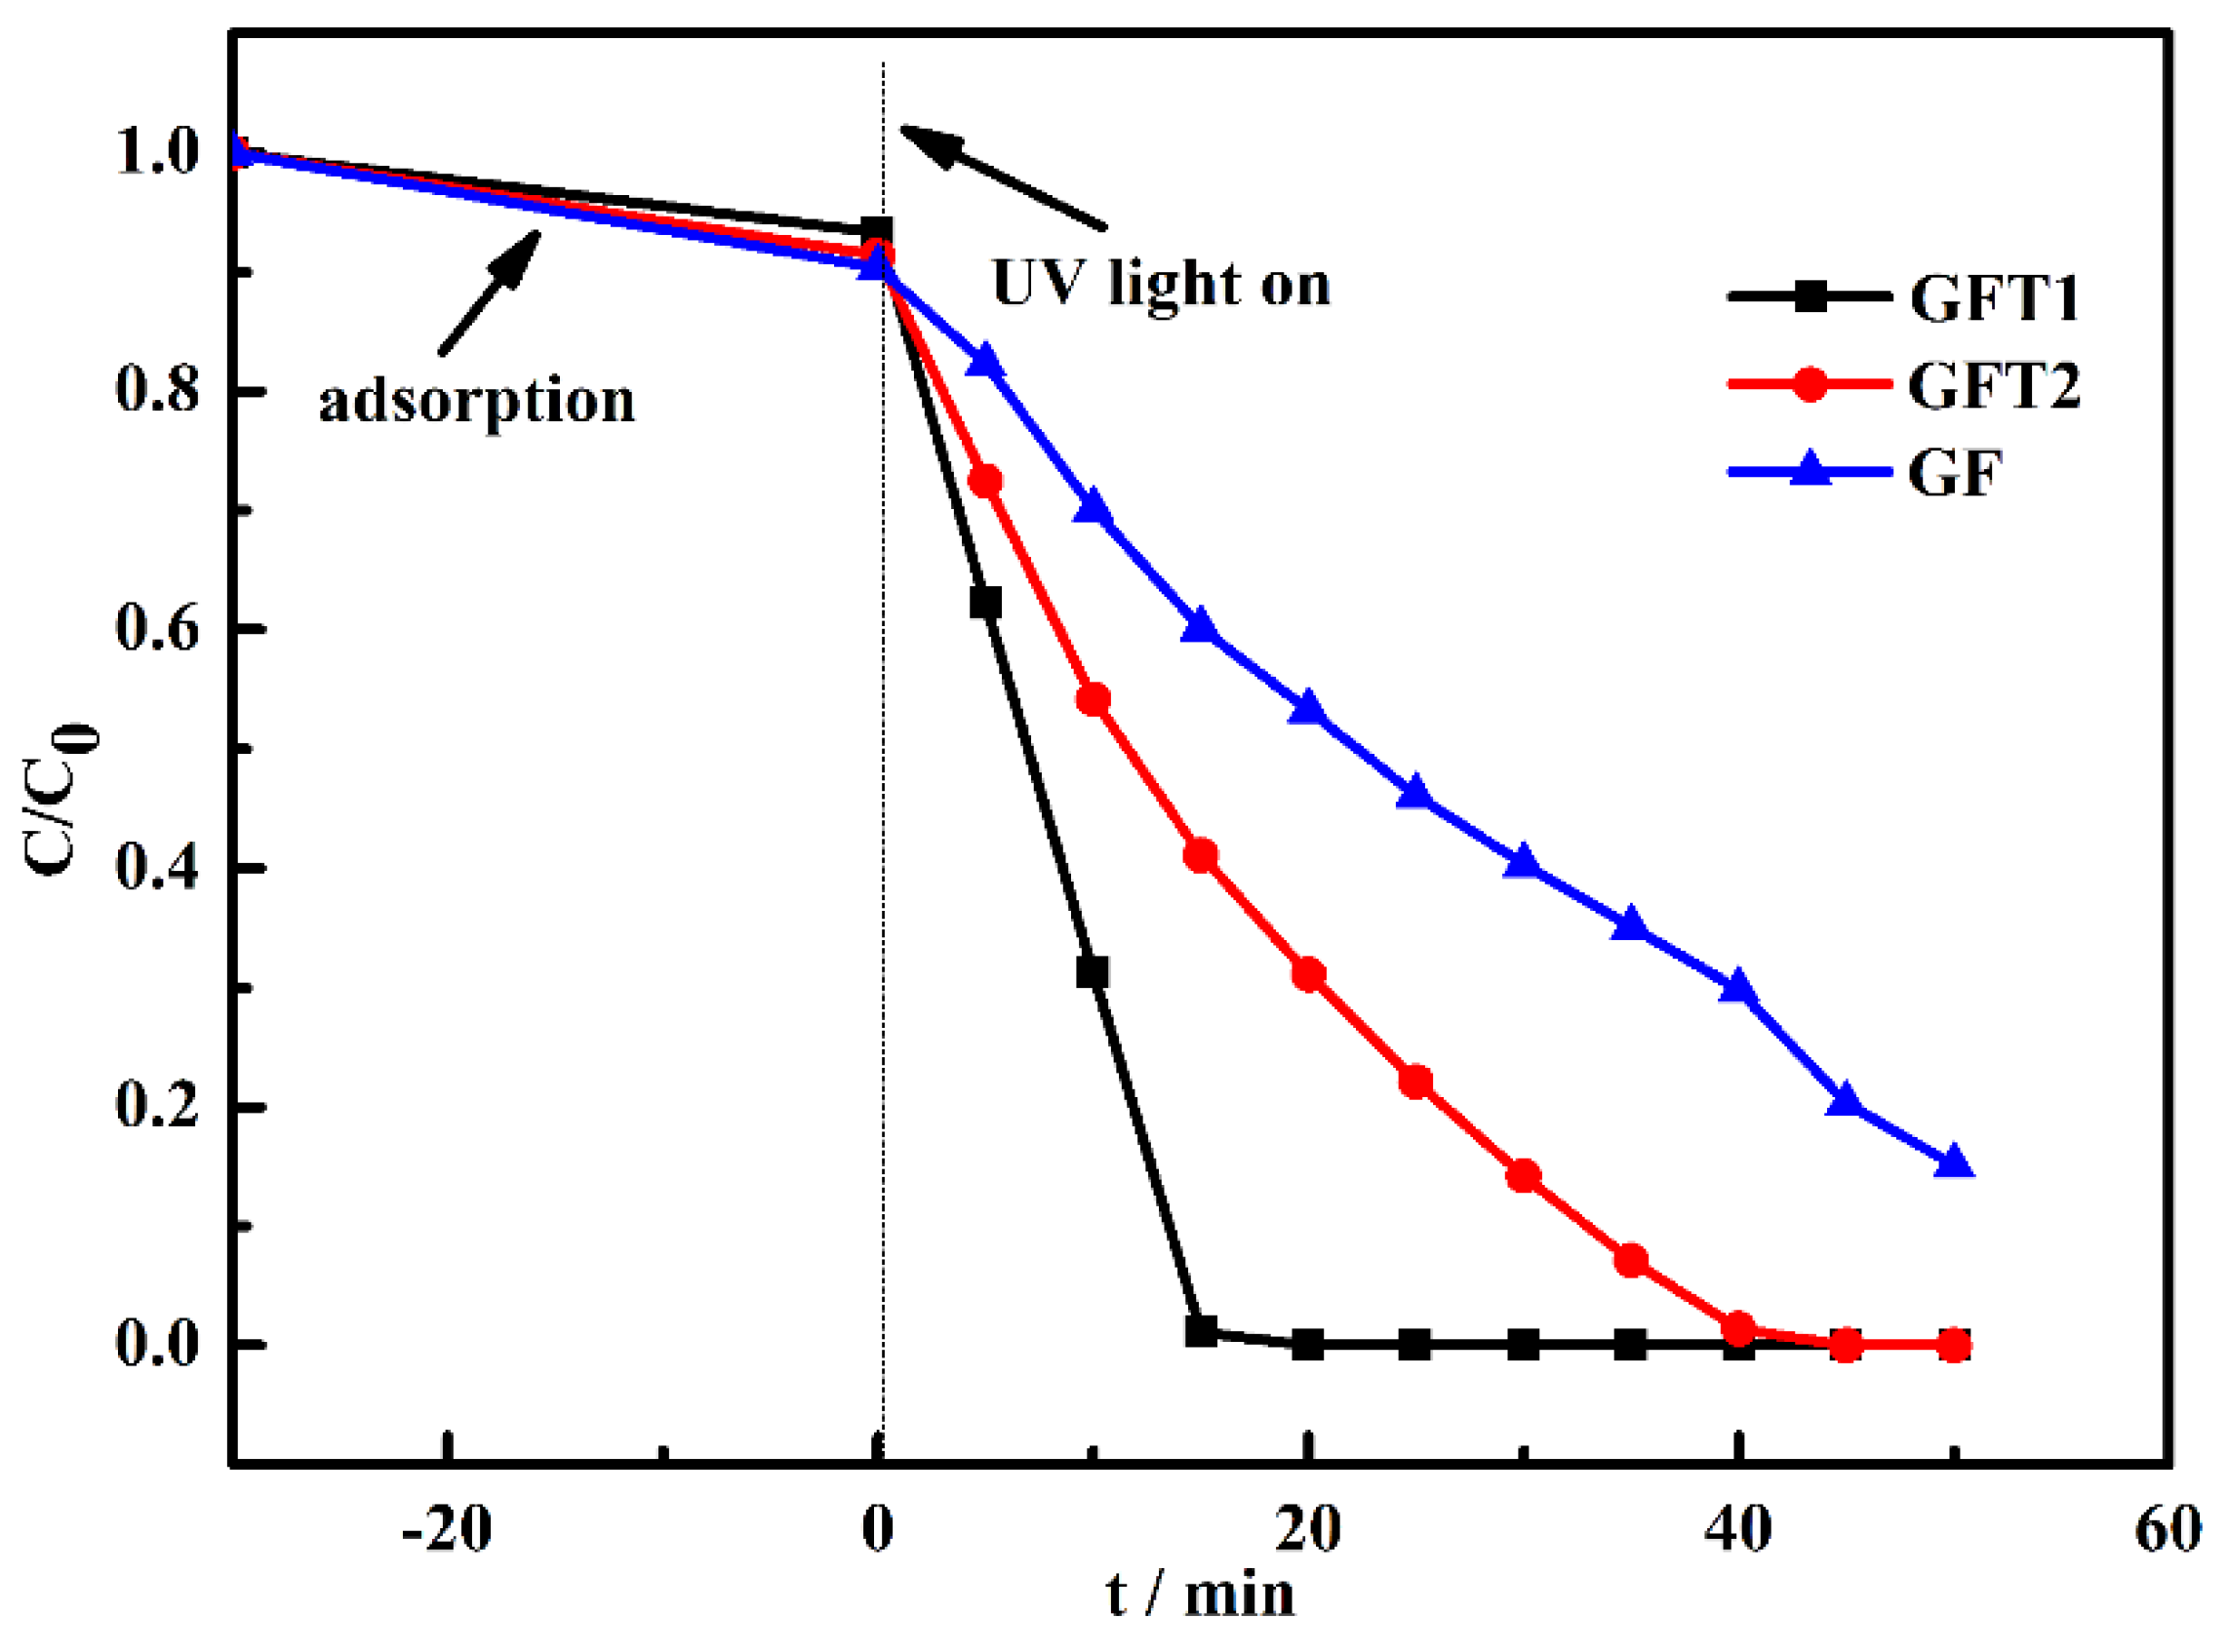
3.4. Photocatalytic Activity
For exploring the influence of geopolymer and geopolymer-TiO
2 composites prepared by two methods on the photocatalytic efficiency, the photocatalytic degradation performance of MB is compared. As shown in
Figure 3, GFT1 synthesized by one-step convenient method exhibited better photocatalytic efficiency for MB. The degradation is completed in ca. 15 min. However, GFT2 synthesized by the two-step method presented lower activity than GFT1. The MB is degraded after 45 min of irradiation. Although the photocatalysis property of geopolymer without any TiO
2 particles (GF) is relatively low, the material could fully degrade MB after 50 min. This may be caused by the high adsorption capacity of the geopolymer and some precious metals that have photocatalytic effect contained in the geopolymer [
11,
14]. The lower amount of anatase phase of TiO
2 (
Figure 1), and uneven dispersion of TiO
2 on the surface of the GFT1 sample (
Figure 2) suggest that the GFT1 sample could be a potential candidate for the treatment of industrially discharged wastewater.
4. Conclusions
In summary, the geopolymer-TiO2 nanocomposites were prepared via two different processes, namely the one-step method and two-step treatment. The preparation process was found to significantly affect the TiO2 loading amount, dispense extent, porosity, and surface area of the resultant products. TiO2 can be uniformly distributed under the condition of high-speed stirring by the one-step process. In addition, the one-step method avoided the waste of TiO2, and increased the loading amount of the composites. Composites prepared by the one-step method were superior to those synthesized by the two-step method for not only improving the crystallite loading and distribution, but also enhancing the photocatalytic performance.
Author Contributions
conceptualization, Y.L.; formal analysis, H.W.; resources, C.Y. and R.P.; writing—original draft preparation—review and editing, X.Y.
Funding
The Project was Supported by the Fundamental Research Funds for the Central Universities, China University of Geosciences (Wuhan) (grant: 26420190057) and Engineering Research Center of Nano-Geo Materials of Ministry of Education, China University of Geosciences (Wuhan) (grant: NGM2019KF016).
Conflicts of Interest
The authors declare no conflict of interest.
References
- Zhou, W.; Pang, Y.; Lai, S.; Yang, Z. Fabrication of TiO2 nanoparticles loaded on coal fly ash composite with enhanced photocatalytic activity. J. Nanosci. Nanotechnol. 2012, 12, 4658–4663. [Google Scholar] [CrossRef] [PubMed]
- Zhou, X.-T.; Ji, H.-B.; Huang, X.-J. Photocatalytic Degradation of Methyl Orange over Metalloporphyrins Supported on TiO2 Degussa P25. Molecules 2012, 17, 1149–1158. [Google Scholar] [CrossRef] [PubMed]
- Sun, Z.; Yuan, F.; Li, X.; Li, C.; Xu, J.; Wang, B. Fabrication of Novel Cyanuric Acid Modified g-C3N4/Kaolinite Composite with Enhanced Visible Light-Driven Photocatalytic Activity. Minerals 2018, 8, 437. [Google Scholar] [CrossRef]
- Zhou, F.; Yan, C.; Wang, H.; Zhou, S.; Komarneni, S. Sepiolite-TiO2 Nanocomposites for Photocatalysis: Synthesis by Microwave Hydrothermal Treatment Versus Calcination. Appl. Clay Sci. 2017, 146, 246–253. [Google Scholar] [CrossRef]
- Wang, B.; Zhou, Y.; Li, L.; Xu, H.; Sun, Y.; Du, Y.; Wang, Y. In Situ Synthesis of TiO2-Doped Mesoporous Silica from Coal Fly Ash for the Photocatalytic Degradation of Dyes. Ind. Eng. Chem. Res. 2018, 57, 15632–15637. [Google Scholar] [CrossRef]
- Katančić, Z.; Gavran, I.; Smolković, J.; Hrnjak-Murgić, Z. Fly Ash Supported Photocatalytic Nanocomposite Poly(3,4-Ethylenedioxythiophene)/TiO2 for Azo Dye Removal under Simulated Solar Irradiation. J. Appl. Polym. Sci. 2018, 135, 46316. [Google Scholar] [CrossRef]
- Singh, N.B. Fly Ash-Based Geopolymer Binder: A Future Construction Material. Minerals 2018, 8, 299. [Google Scholar] [CrossRef]
- Visa, M.; Andronic, L.; Duta, A. Fly Ash-TiO2 Nanocomposite Material for Multi-Pollutants Wastewater Treatment. J. Environ. Manag. 2015, 150, 336–343. [Google Scholar] [CrossRef] [PubMed]
- El Alouani, M.; Alehyen, S.; El Achouri, M.; Taibi, M. Removal of Cationic Dye—Methylene Blue—From Aque Ous Solution by Adsorption on Fly Ash—Based Geopolymer. J. Mater. Environ. Sci. 2018, 9, 32–46. [Google Scholar]
- Onutai, S.; Kobayashi, T.; Thavorniti, P.; Jiemsirilers, S. Metakaolin Based Geopolymer from Thailand as an Adsorbent for Adsorption of Multi- and Mono- Cations from Aqueous Solution. Key Eng. Mater. 2018, 777, 245–250. [Google Scholar] [CrossRef]
- Liu, Y.; Yan, C.; Zhang, Z.; Gong, Y.; Wang, H.; Qiu, X. A facile method for preparation of floatable and permeable fly ash-based geopolymer block. Mater. Lett. 2016, 185, 370–373. [Google Scholar] [CrossRef]
- Uğurlu, M.; Karaoğlu, M.H. Photocatalytic Removal of Olive Mill Waste Water by TiO2 Loaded on Sepiolite and under Natural Solar Irradiation. Environ. Prog. Sustain. Energy 2011, 30, 326–336. [Google Scholar] [CrossRef]
- Weng, C.-J.; Huang, J.-Y.; Huang, K.-Y.; Jhuo, Y.-S.; Tsai, M.-H.; Yeh, J.-M. Advanced Anticorrosive Coatings Prepared from Electroactive Polyimide—TiO2 Hybrid Nanocomposite Materials. Electrochim. Acta 2010, 55, 8430–8438. [Google Scholar] [CrossRef]
- Zhang, Y.; Liu, L. Fly ash-based geopolymer as a novel photocatalyst for degradation of dye from wastewater. Particuology 2013, 11, 353–358. [Google Scholar] [CrossRef]
© 2019 by the authors. Licensee MDPI, Basel, Switzerland. This article is an open access article distributed under the terms and conditions of the Creative Commons Attribution (CC BY) license (http://creativecommons.org/licenses/by/4.0/).


