Article

Nano-Phase KNa(Si6Al2)O16 in Adularia: A New Member in the Alkali Feldspar Series with Ordered K–Na Distribution

Department of Geoscience, University of Wisconsin—Madison, Madison, WI 53706, USA
*
Author to whom correspondence should be addressed.
Minerals 2019, 9(11), 649; https://doi.org/10.3390/min9110649
Submission received: 11 October 2019 / Accepted: 22 October 2019 / Published: 23 October 2019

Abstract

:
Alkali feldspars with diffuse reflections that violate C-centering symmetry were reported in Na-bearing adularia, orthoclase and microcline. TEM results indicate elongated nano-precipitates with intermediate composition of KNa(Si6Al2)O16 cause the diffuse reflections. Density functional theory (DFT) calculation indicates ordered distribution of K and Na atoms in the nano-phase with Pa symmetry. K and Na atoms are slightly off special positions for K atoms in the orthoclase structure. Formation of the intermediate nano-phase may lower the interface energy between the nano-phase and the host orthoclase. Previously reported P21/a symmetry was resulted from an artifact of overlapped diffraction spots from the nano-precipitates (Pa) and host orthoclase (C2/m). Adularia, orthoclase and microcline with the Pa nano-precipitates indicate very slow cooling of their host rocks at low temperature.

Graphical Abstract

1. Introduction

Adularias are hydrothermal K-rich feldspars that display a dominant {110} crystallographic form. Some adularia crystals display diffuse diffractions that violate C-centering symmetry [1,2,3,4]. Similar diffuse diffractions were also observed in K-feldspar lamellae in orthoclase and microcline (~Or90) from two granites [5]. The mechanism for the cause of the diffuse diffractions was not well understood. A common explanation is that nano-scale domains with P21/a symmetry are related by APBs (or out-of-phase domain boundaries) [3,6]. Tweed pattern was also observed in the adularia [7,8]. It was suggested domains related by P21/a symmetry causes the diffuse diffractions that violate C-centering [8]. However, Smith [9] proposed that domains violating C-centering are very small (nano-meter scale) within the adularia host. Only the very small phases/precipitates contribute to the diffuse diffractions. A crystal structure with P21/a symmetry was proposed but was not determined [9]. Smith and Brown [10] suggested that “such adularias should be restudied by optics, X-rays, microprobe and TEM as they are quite different from orthoclase.” In this paper, we provide both structural and textural information about the adularia using TEM, X-ray diffraction and density functional theory (DFT) calculation.

2. Sample and Experimental Methods

A gem quality adularia single crystal (a collection the Department of Earth and Planetary Sciences, Johns Hopkins University) from St. Gotthard of Switzerland was selected for TEM and XRD studies. Similar samples from the same locality were studied by Laves and Goldsmith [6], Smith and MacKenzie [1], Coville and Ribbe [3] and Phillips and Ribbe [4]. TEM samples were prepared by depositing a suspension of a crushed small grain on a holey carbon grid. TEM imaging, X-ray energy-dispersive spectroscopy (EDS) and selected-area electron diffraction (SAED) analyses were carried out using a Philips CM200-UT microscope equipped with a GE light element and energy-dispersive X-ray spectroscopy (EDS) at the Materials Science Center at the University of Wisconsin-Madison operated at 200 kV. Chemical analyses were obtained using the EDS (spot size 5 with a beam diameter of ~100 nm). Quantitative EDS results were obtained using experimentally determined k-factors from standards of albite, anorthite, orthoclase and labradorite [11].
Powder XRD patterns were collected using a Rigaku Rapid II XRD system (Mo-Kα radiation) in the Geoscience Department at the University of Wisconsin-Madison. Diffraction data were recorded on a 2-D image-plate detector. The original 2-D diffraction rings were then converted to produce conventional 2θ vs. intensity patterns using Rigaku’s 2DP software. The unit cell parameters at room temperature were determined by the Rietveld method using the Jade 9 software. A pseudo-Voigt function was used for fitting the peak profiles.
The single-crystal X-ray diffraction data were collected on a Bruker Quazar APEXII diffractometer with MoKα IμS source at 100 K. Four ω runs and 1 φ run were programmed with a scan width of 0.5° and a 30 s exposure time. The instrument was running at power of 50 kV and 0.6 mA. The detector was set at a distance of 5 cm from the crystal. Data were indexed on a primitive cell and the unit cell parameters constrained to monoclinic symmetry were refined with the APEXII software.
DFT calculations were run on the Vienna Ab initio Simulation Package (VASP) using the generalized gradient approximation functional with Perdew, Burke and Ernzerhof (PBE) parameters [12,13,14,15]. Pseudopotentials derived by the projector augmented wave method were used with an energy cut off of 450 eV. A 4 × 2 × 4 k-point mesh was used along with Gaussian smearing and a 0.2 eV sigma value. Initial structures were based on a monoclinic unit cell with space group Pa. Both cell volume and shape were allowed to fully relax. Microcline and albite structures were run using a triclinic structure as a reference for the intermediary phases.

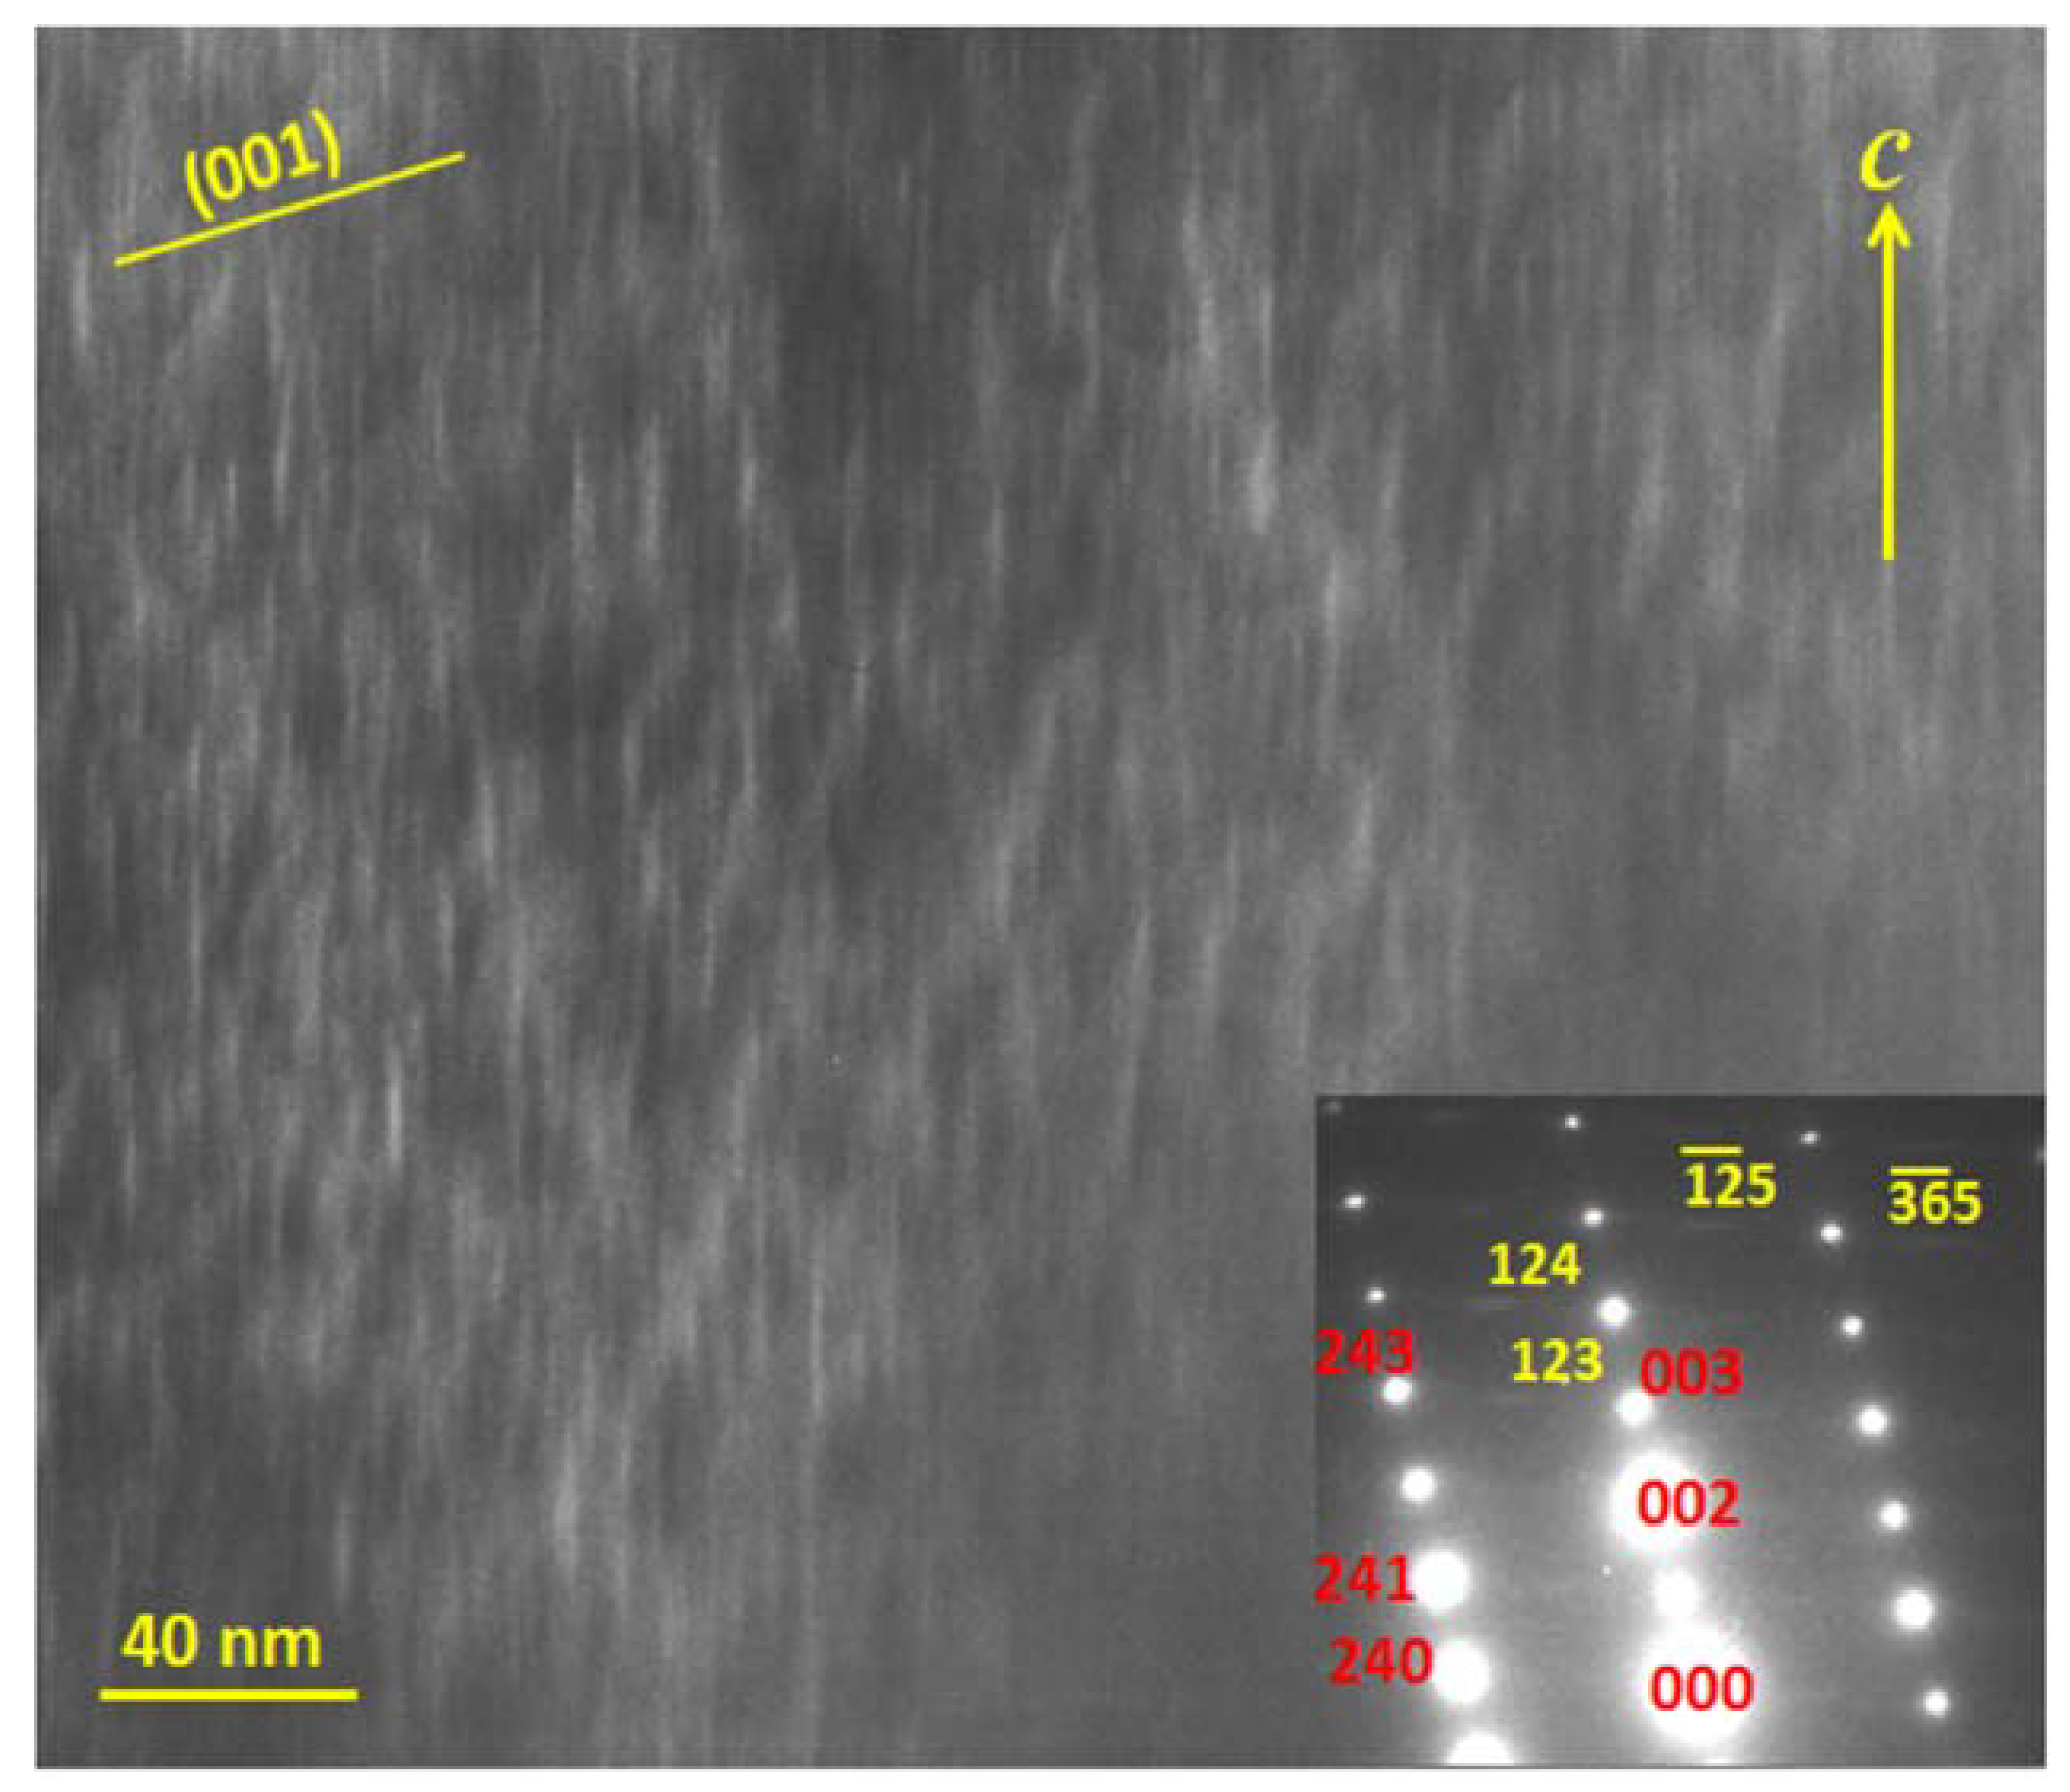
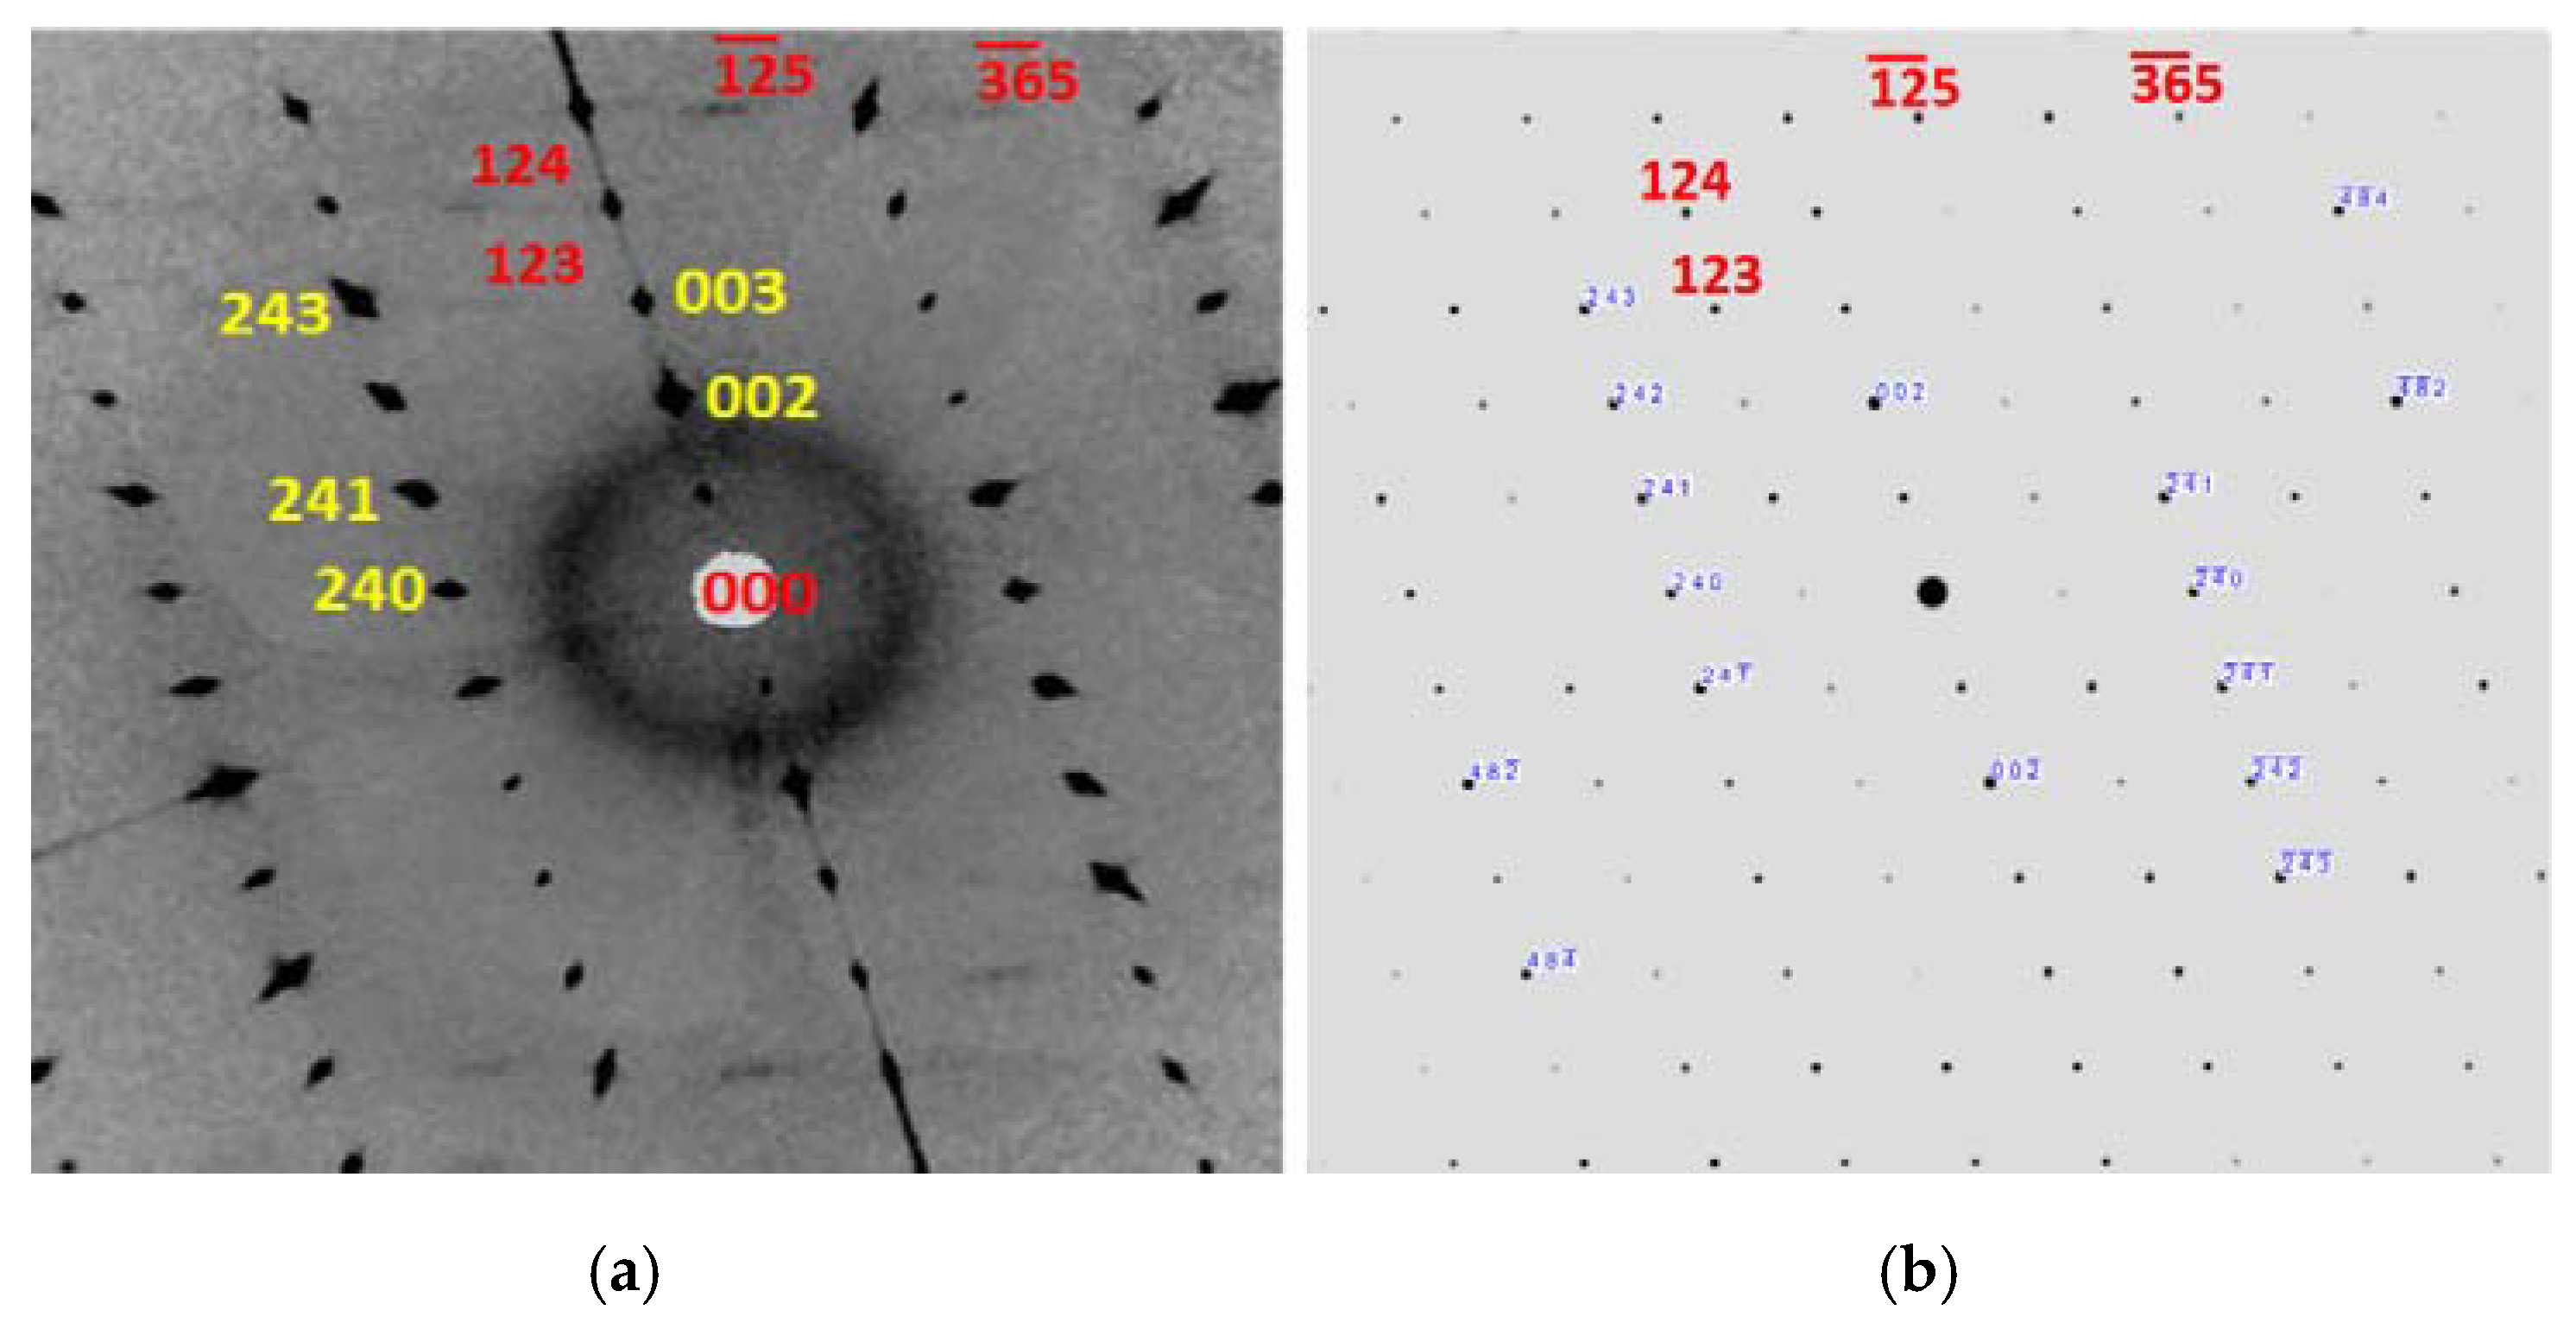
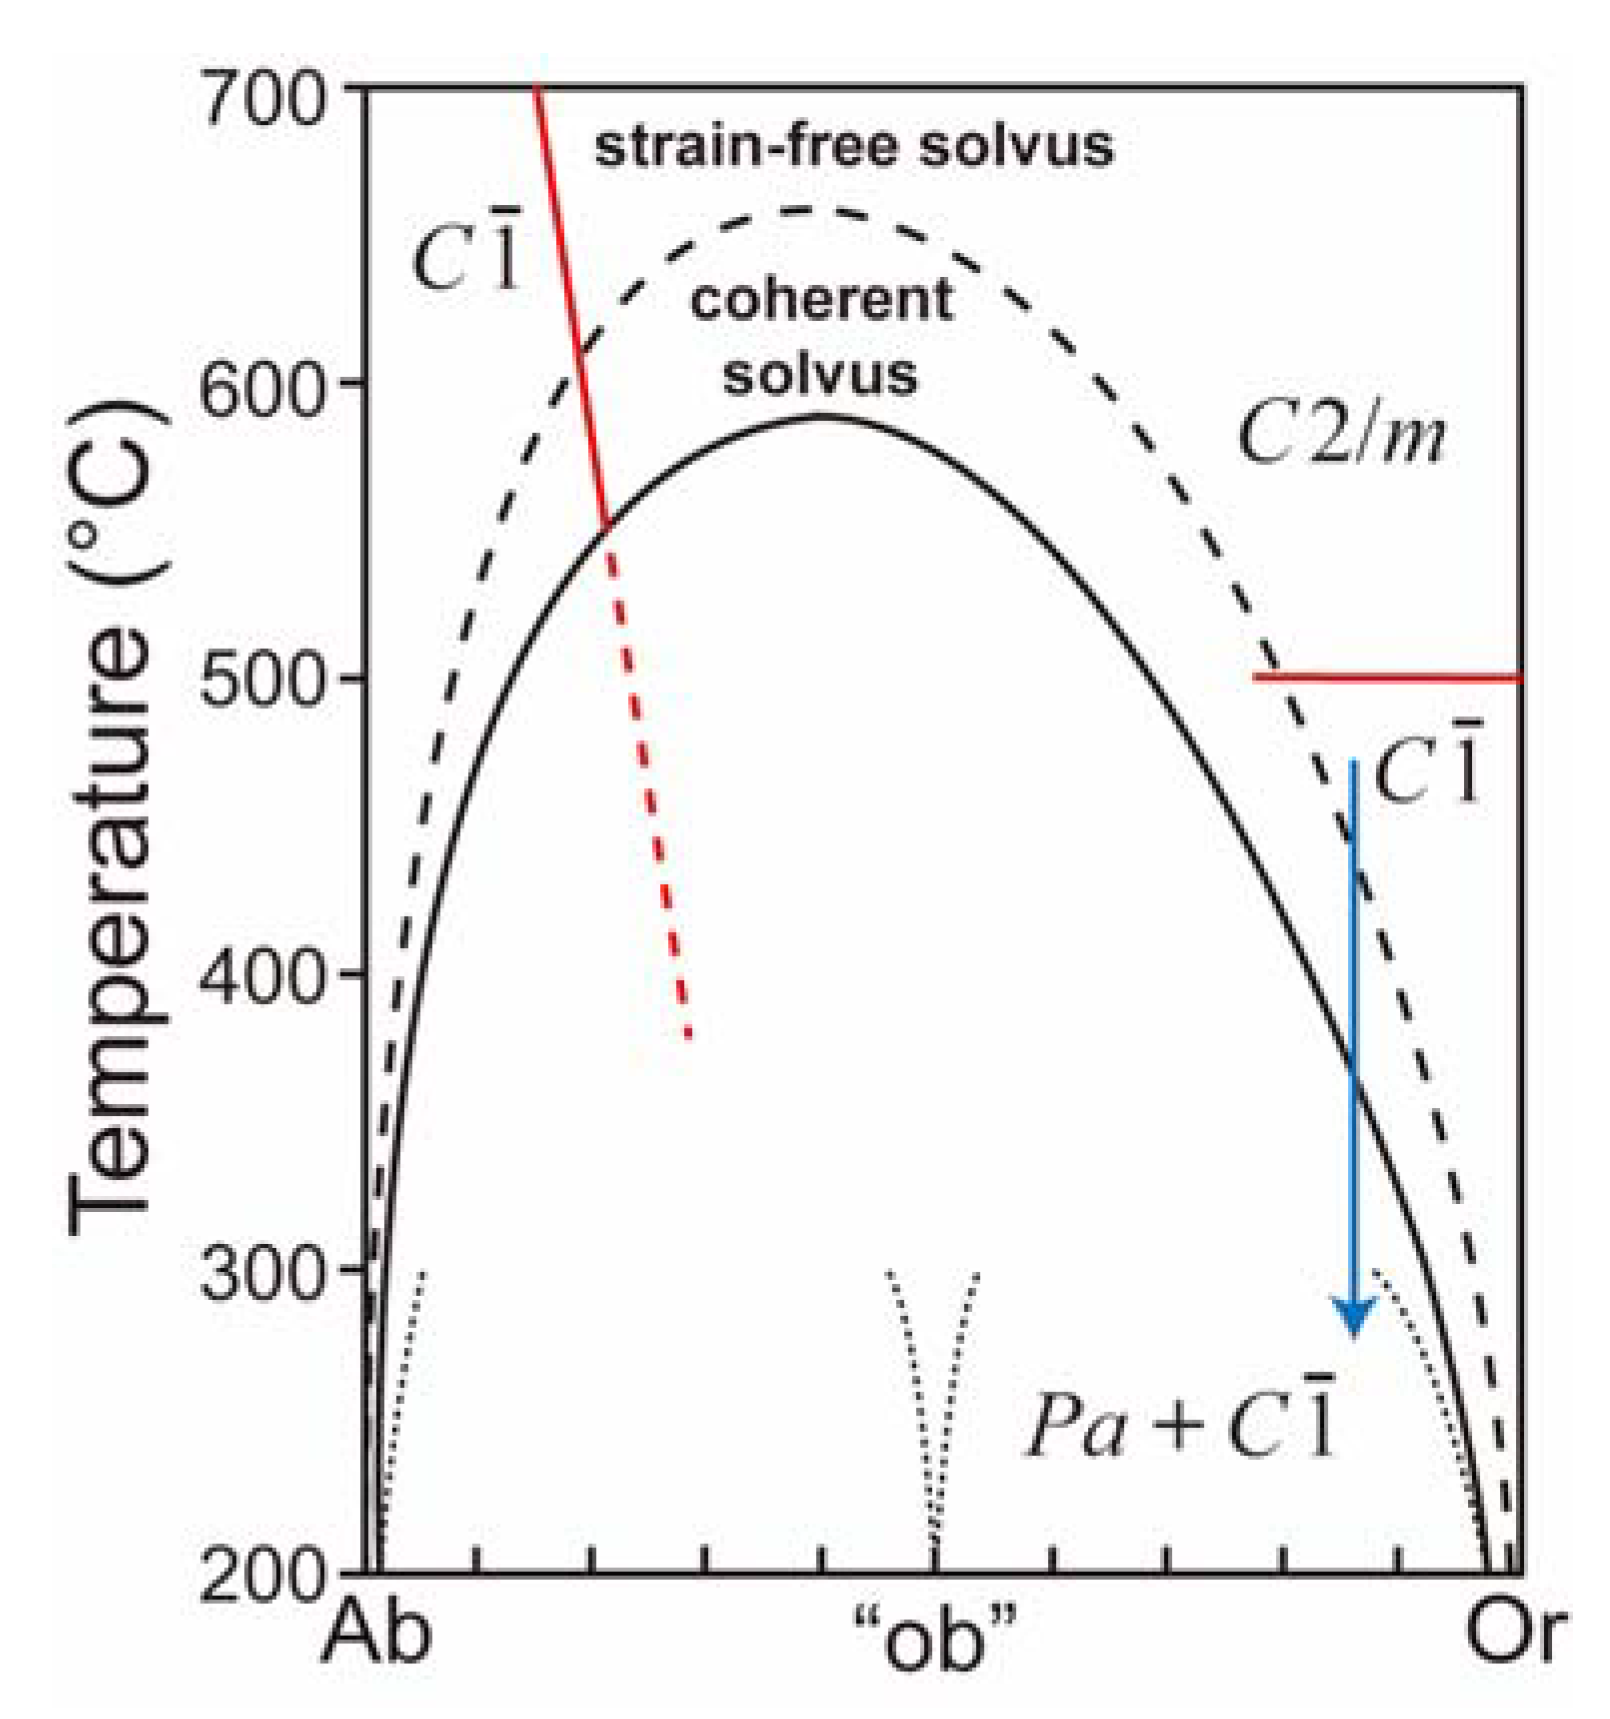
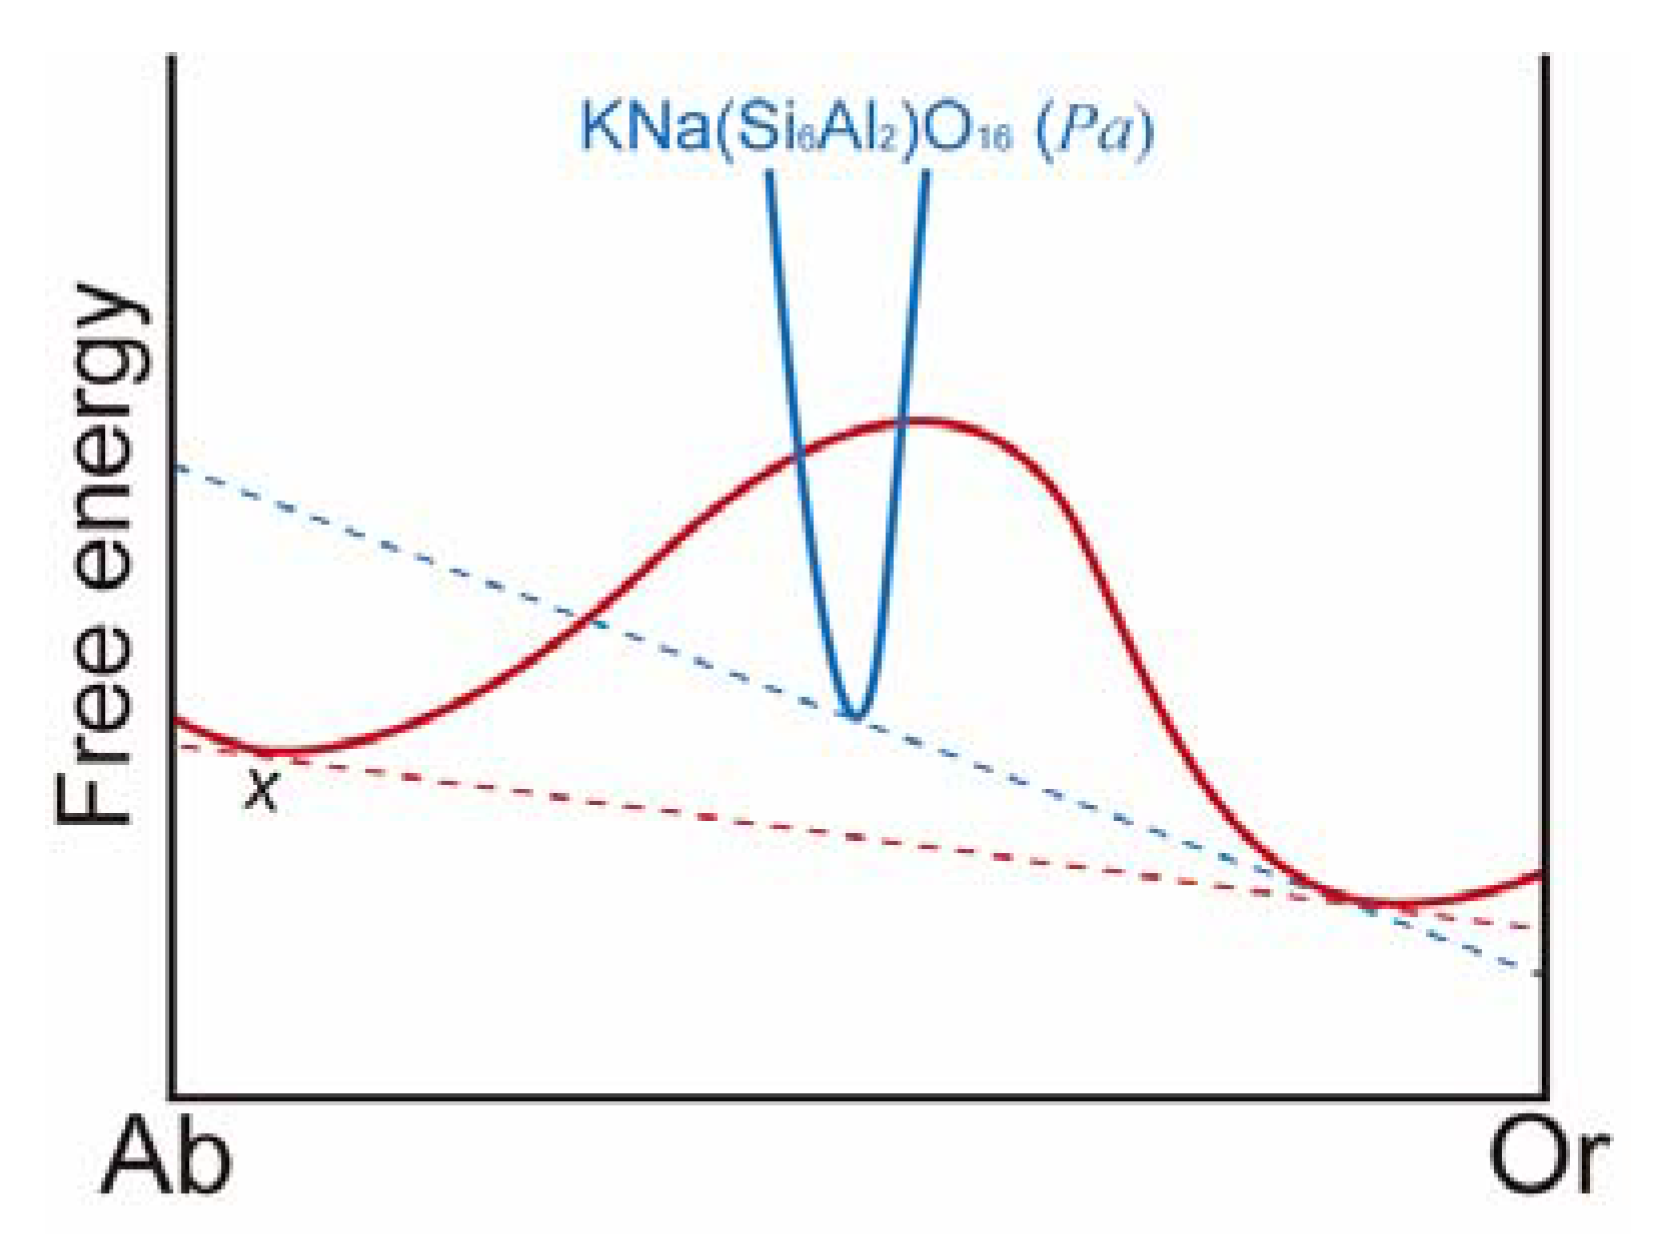
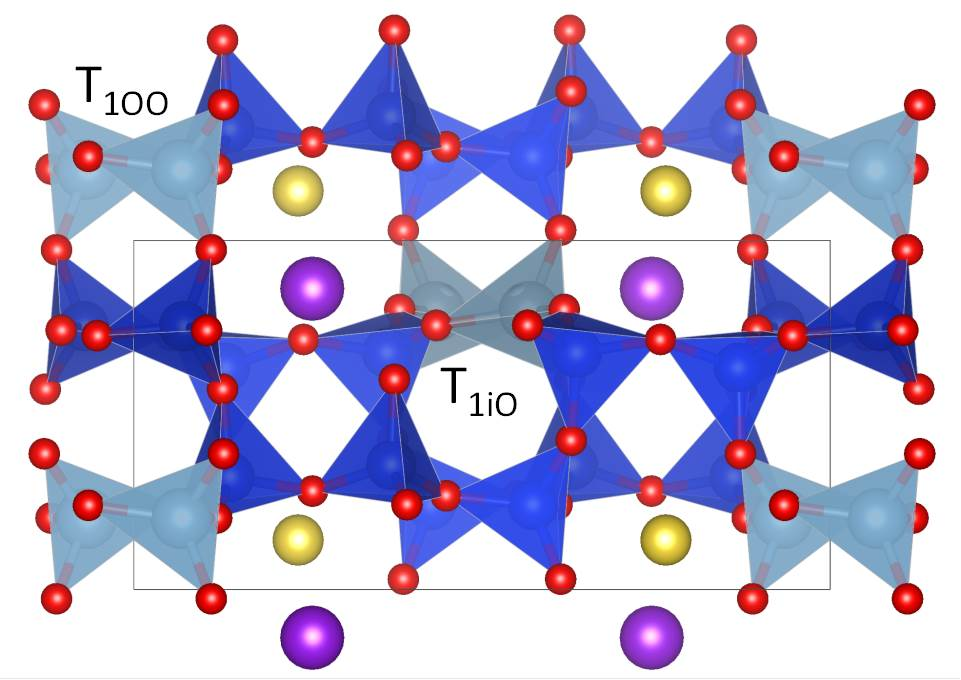
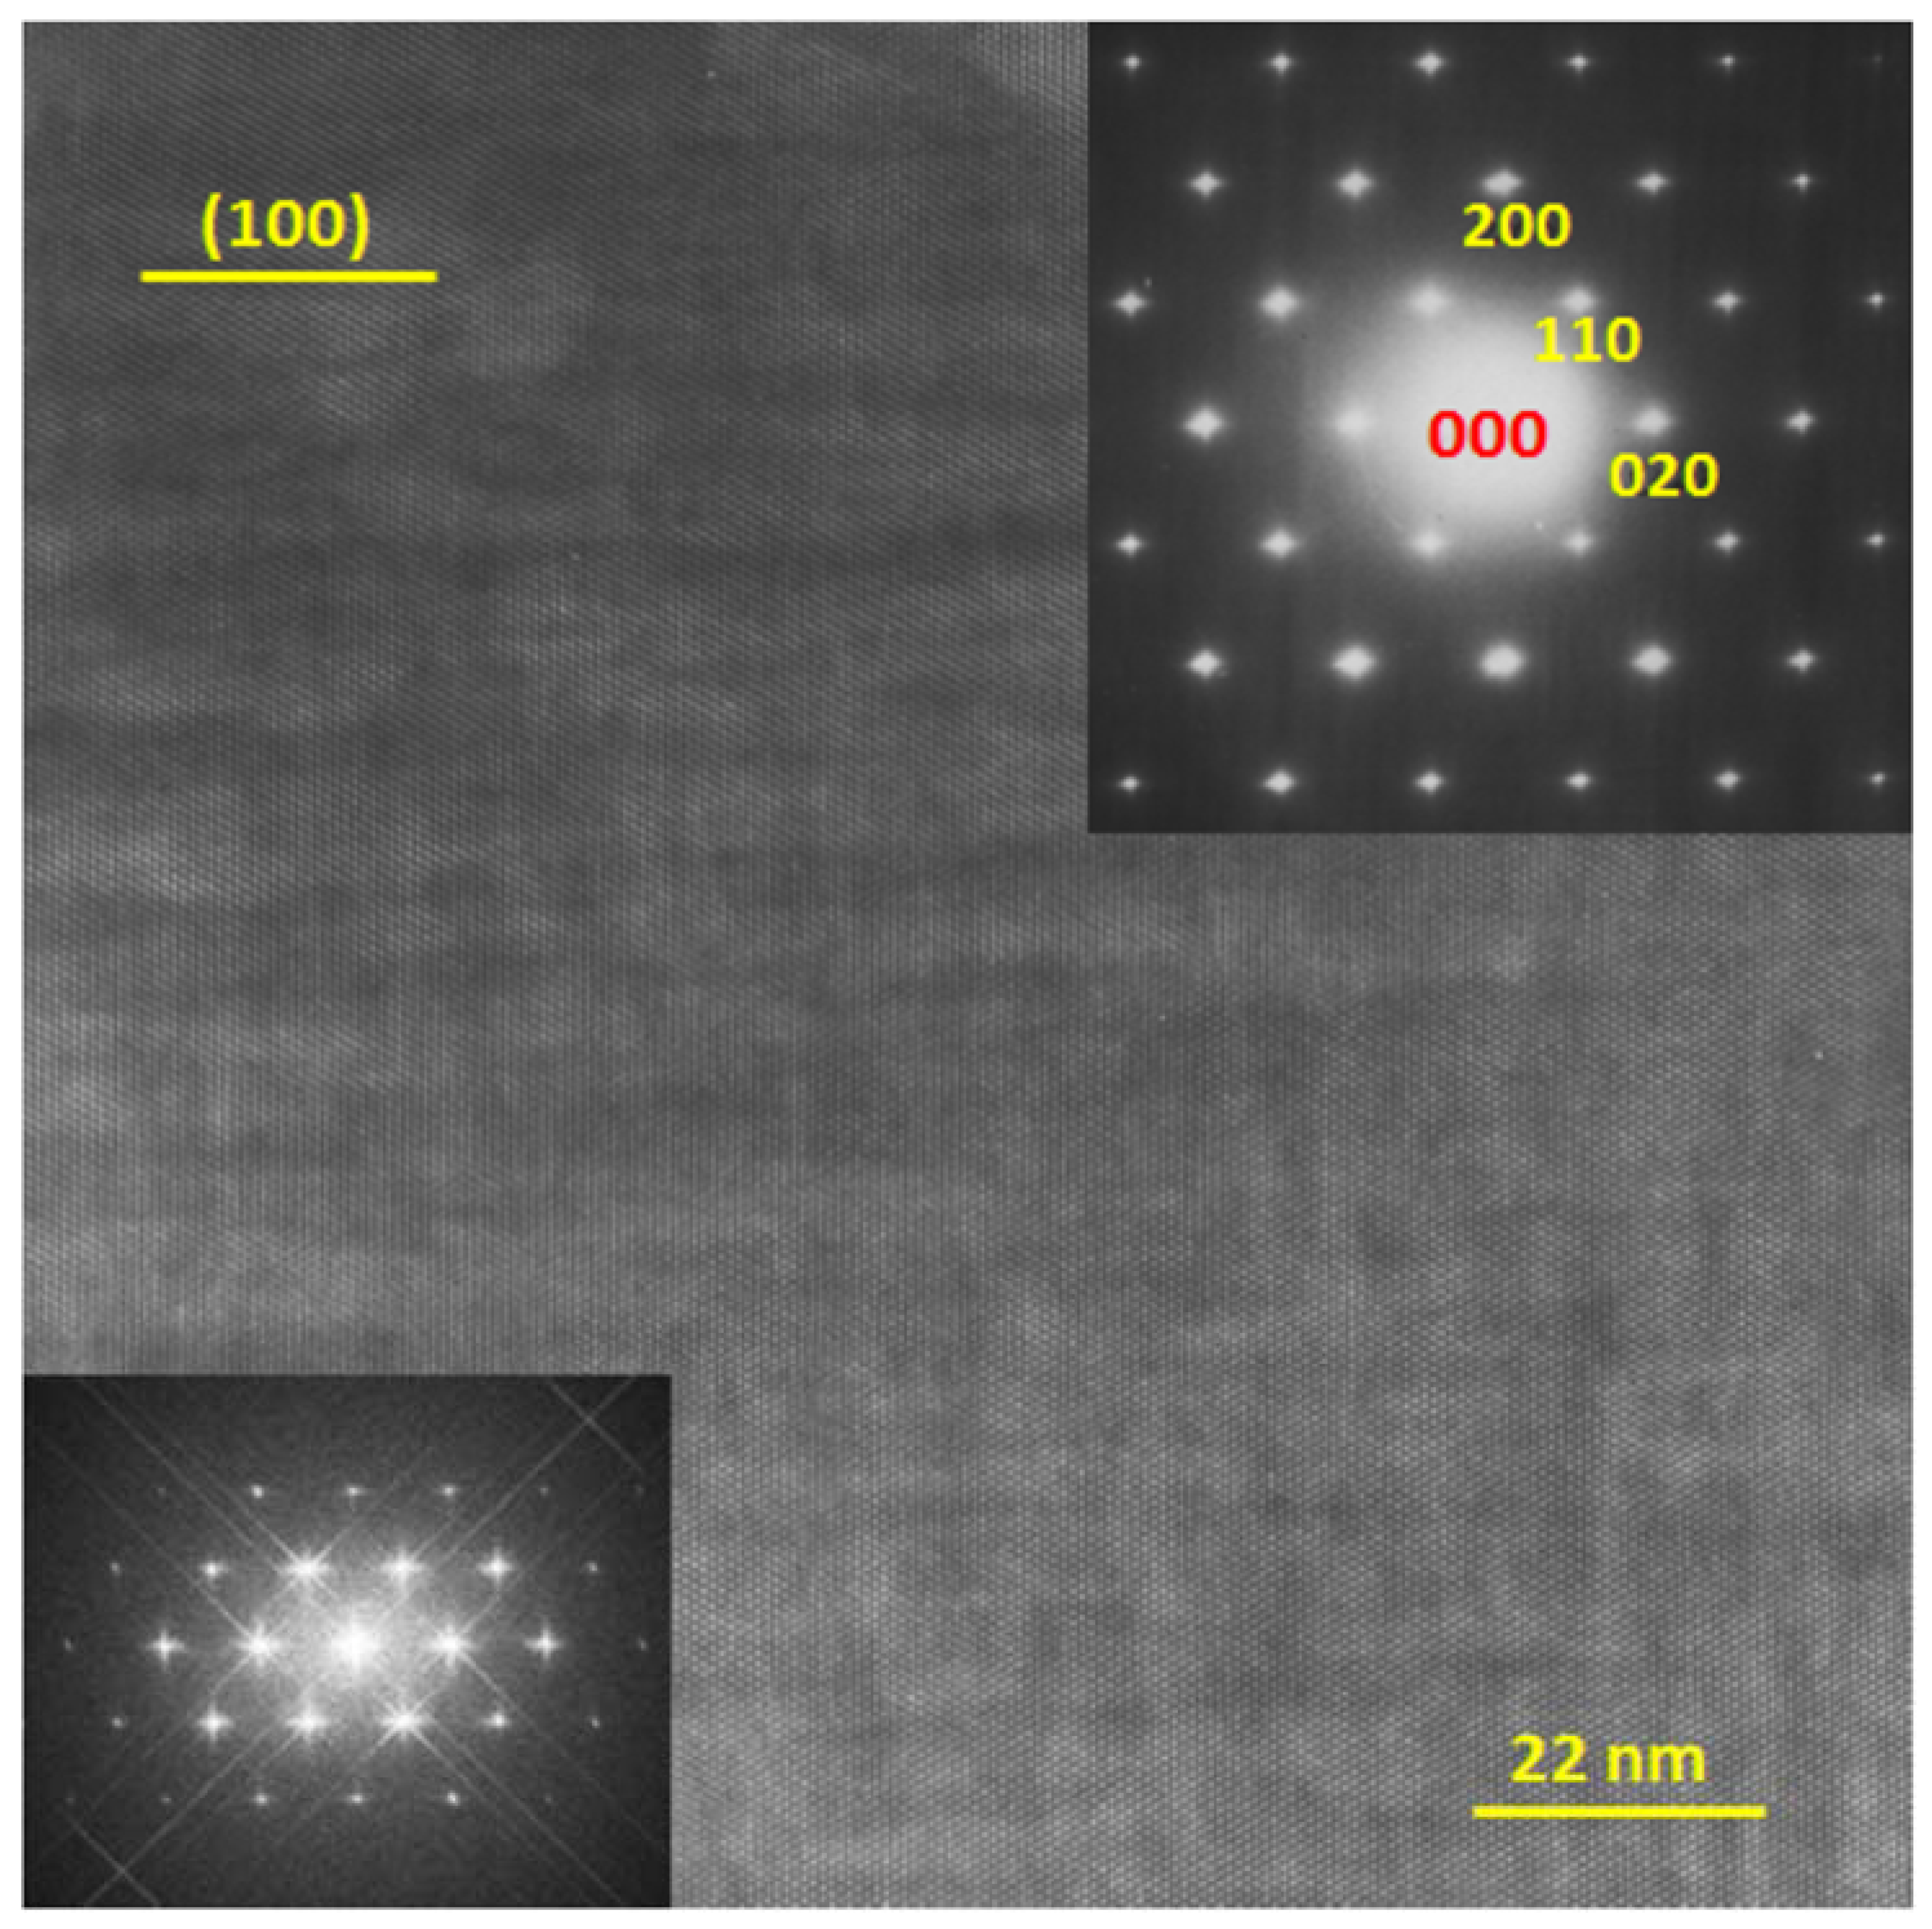
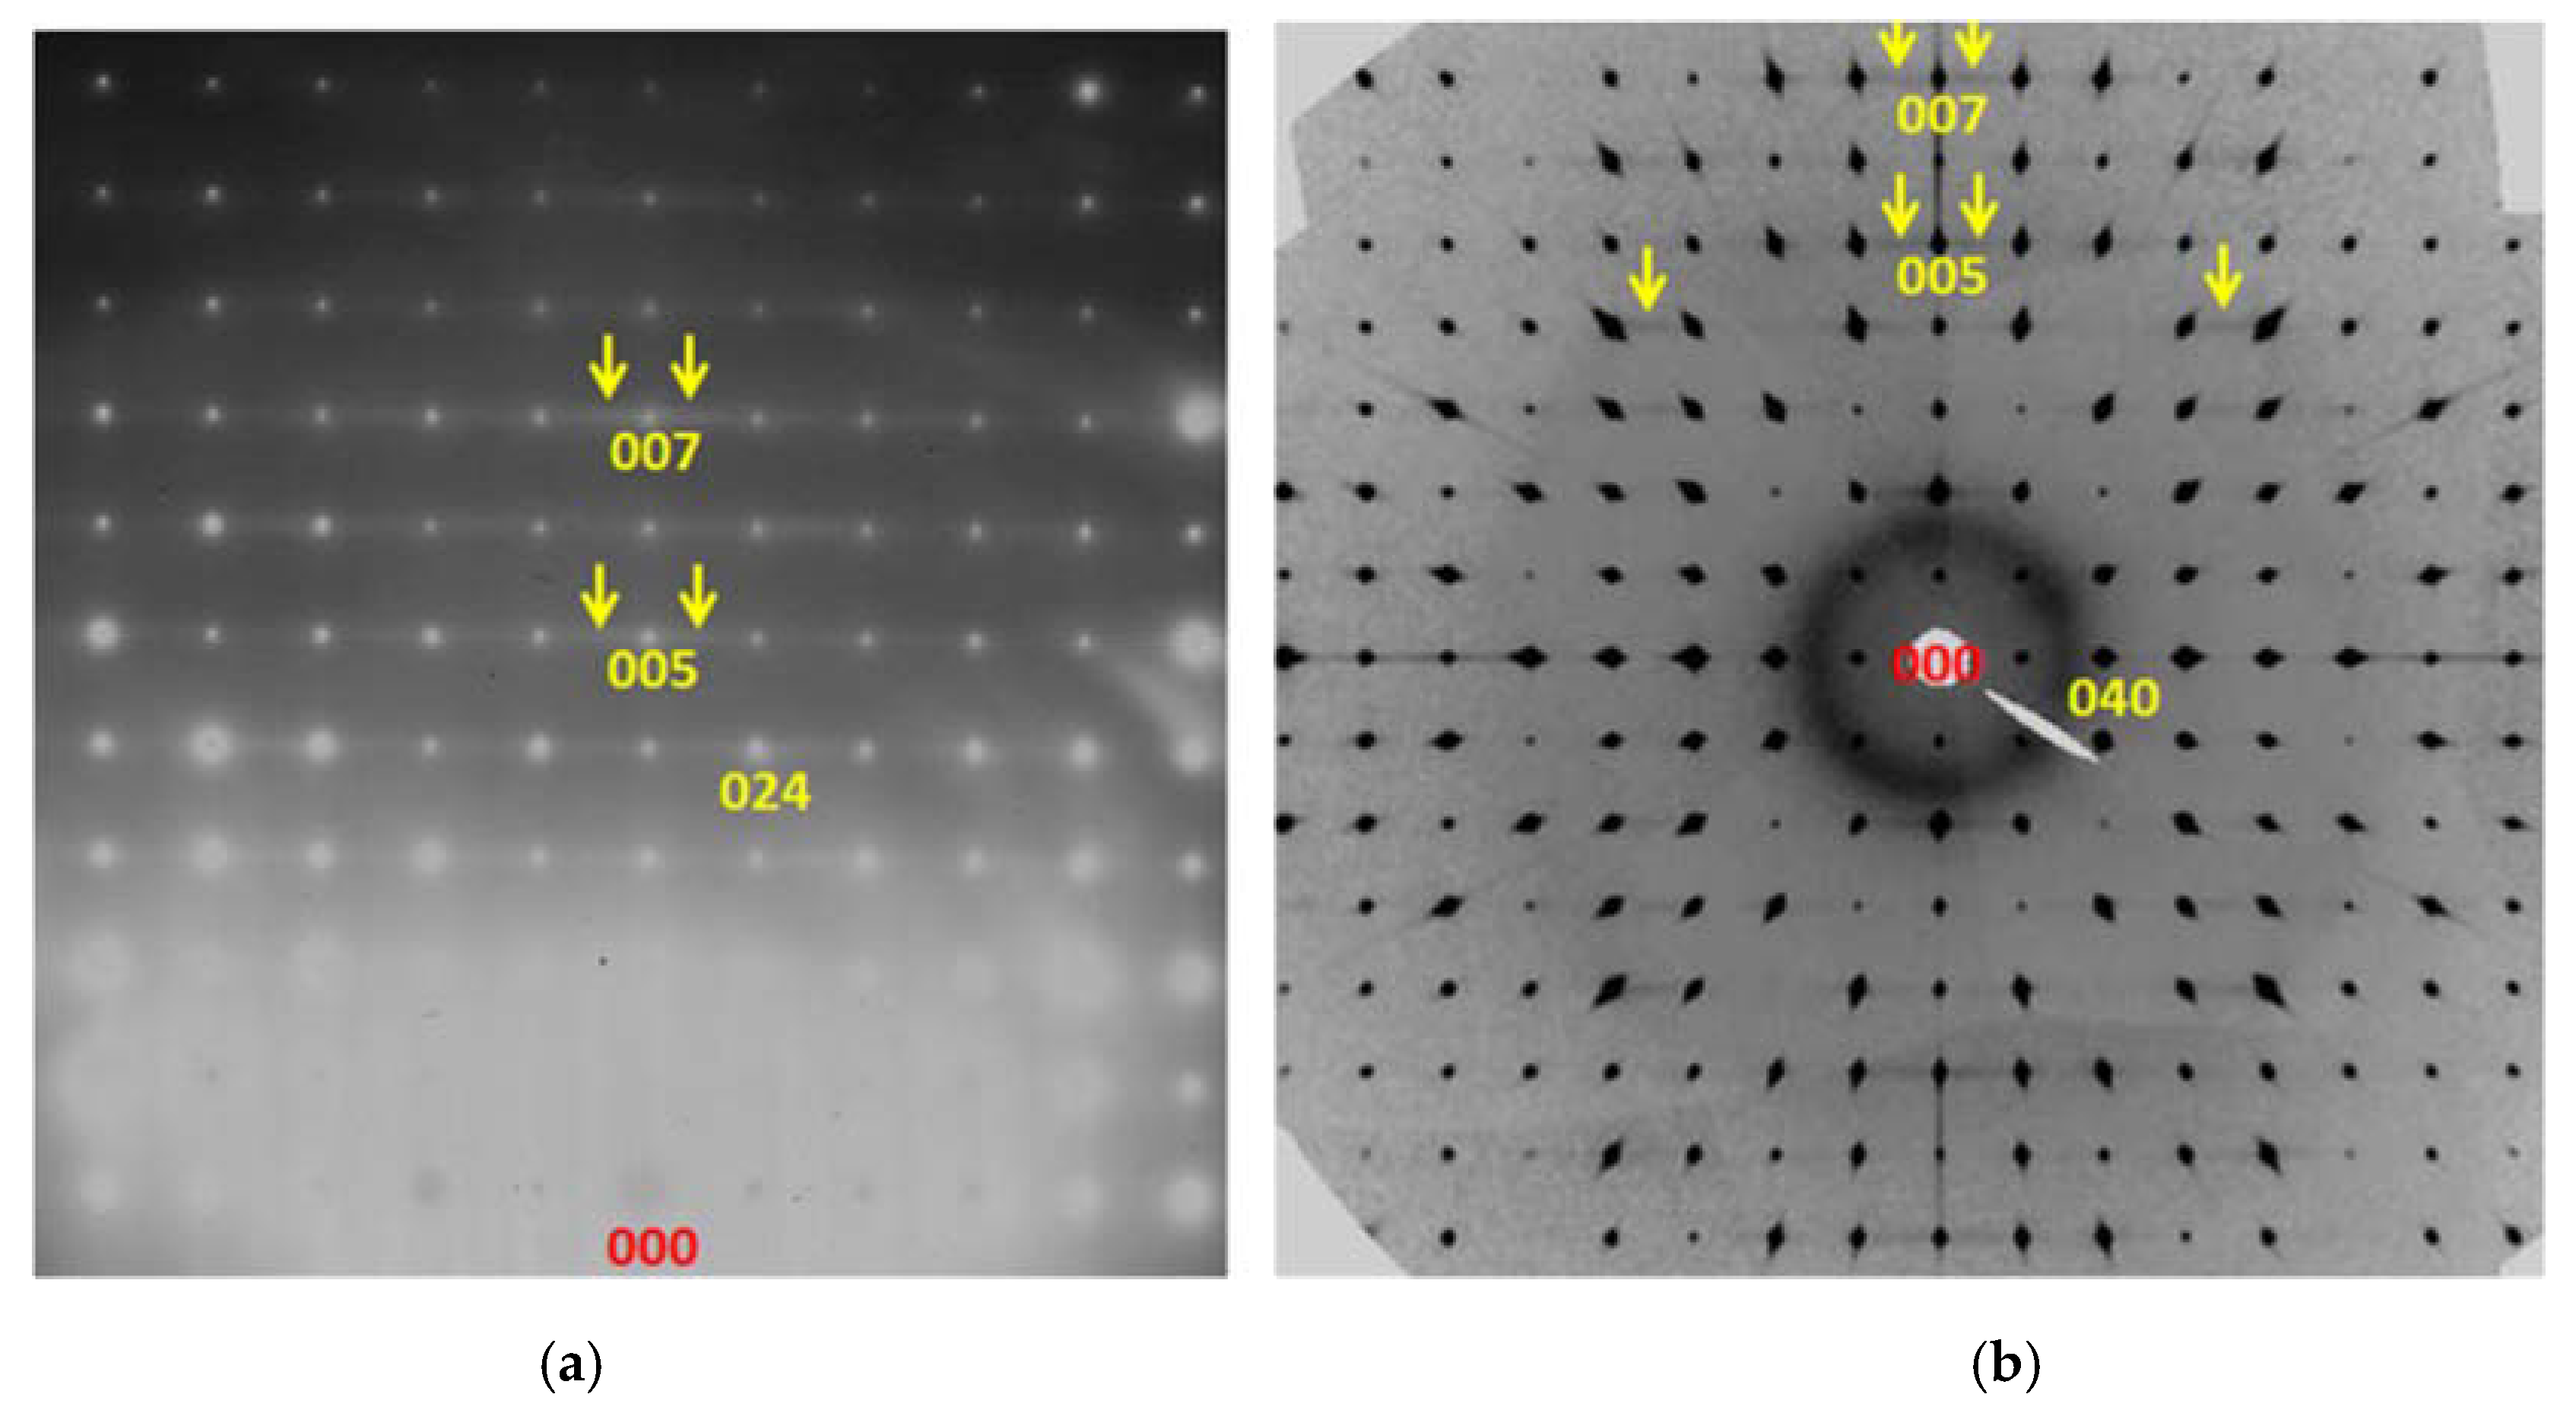
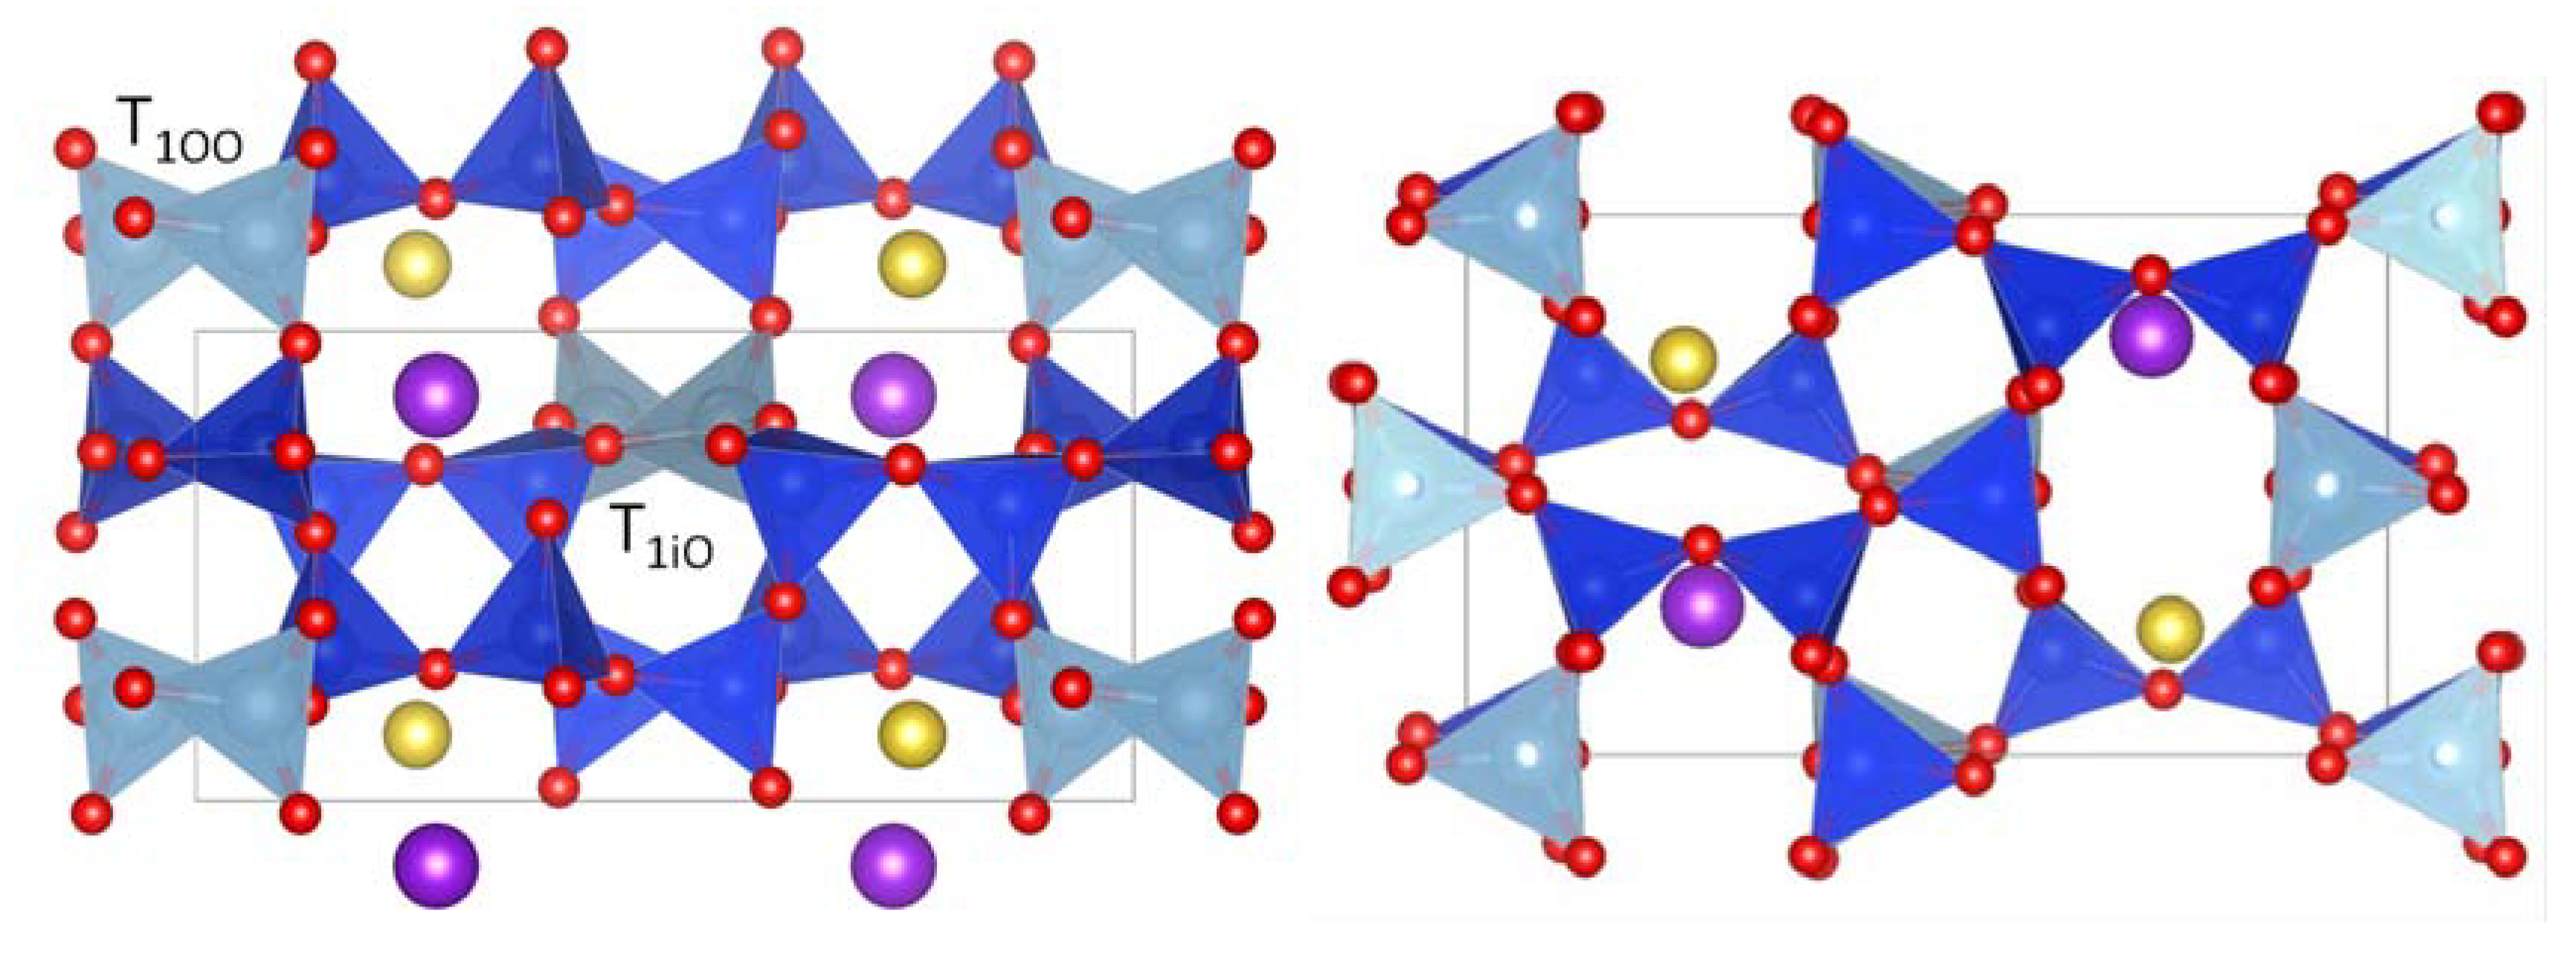
3. Results and Discussions

A [001] zone-axis selected-area electron diffraction (SAED) pattern shows streaking of main reflections along a* and b* directions (Figure 1, inserted SAED and FFT patterns). Diffuse diffractions that violate C-centering are not obvious in hk0 reflections. Multi-beam bright-field TEM image shows a tweed pattern (Figure 1). A similar texture was observed by McConnell [8]. Nano-precipitates are not obvious in the image along the [001] direction. X-ray EDS spectra show the bulk adularia contains small amounts of Na (ranging from ~Ab9 to ~Ab14) and trace amounts of Ba (~Cn0.1) (Supplementary Figure S1). A [100] zone axis SAED pattern and precession image from XRD show some diffuse diffractions along the b* direction (see the areas indicated by arrows in Figure 2). A [2 1 ¯ 0] zone-axis SAED pattern clearly shows diffuse diffractions that violate the C-centering lattice (Figure 3, inserted SAED pattern). Dark-field TEM image using a relatively strong diffuse reflection shows needle-like precipitates in the adularia (Figure 3). The needle-like nano-precipitates are about 10 to 30 nm long along the c-axis and about 1–3 nm wide perpendicular to the c-axis. There are about 20 vol.% of precipitates in the host. The dark-field image shows that only needle-like precipitates contribute to the diffuse diffractions, instead of proposed APB-like domains [3] or boundary area in the tweed texture [7,8].
The nano-precipitates are Guinier–Preston zones, or G.P. zones, that have intermediate composition between the end members of albite and orthoclase (microcline), K0.5Na0.5(Si3Al)O8 or KNa(Si6Al2)O16. Similar G.P. zones were observed in very slowly cooled orthopyroxenes [16,17]. The G.P. zone precipitates are an exsolved phase that formed at low temperature. The precipitates with stoichiometry of KNa(Si6Al2)O16 with an ordered Na–K distribution will have Pa symmetry instead of P21/a symmetry. Na and K atoms are ordered and off special positions in Pa symmetry. Both T1 and T2 sites in the orthoclase (C2/m) structure will split into four sites (T1oo, T1o2, T1io, T1i2 for T1 site, and T2oo, T2o2, T2io, T2i2 for T2 site), respectively. An adularia (~Or99–100) from a sub-Cambrian paleosol does not show precipitates and diffuse diffractions violating C-centering (Supplementary Figure S2) [18]. The tweed pattern indicates only local domains related by Albite and Pericline twins at the nano-meter scale, which will not result in diffuse diffractions violating C-centering. The formation of the nano-precipitates in Na-bearing K-feldspar is the key for the diffuse diffractions violating C-centering. The diffuse reflections display streaking perpendicular to the c-axis, which also indicates elongated nano-precipitates along the c-axis (Figure 3). The tunnel-like structure along c-axis in the feldspar allows K–Na diffusion and ordering at low temperature, which causes the elongated nano-precipitates in the adularia (Figure 3).
Compared to the unit cell parameters at the room temperature from powder XRD (a = 8.539(2), b = 12.970(3), c = 7.202(2) Å, β = 116.03(2)°), the unit cell of adularia at 100 K from single-crystal XRD (a = 8.5291(1), b = 12.9795(2), c = 7.2032(1) Å, β = 116.0521(7)°) shows the extremely anisotropic thermal contraction, only with shortening of the a-axis. The same trend of thermal contraction was observed in orthoclase and sanidine [19].
To confirm the Al in the tetrahedral sites for the ordered Pa structure, structural models with different Al–Si distribution were calculated using the DFT method. The most stable structure is the configuration with Al in T1oo and T1io sites, respectively (Figure 4). The ordered structure shows opposite shifts of Na and K atoms off the special position. Details about the structure and bond distances are listed in Table 1 and Table 2, respectively. The diffuse reflections are very weak in the [100] zone-axis diffraction pattern (Figure 2), but obvious in the [2 1 ¯ 0] zone-axis diffraction patterns (Figure 3 and Figure 4). The calculated SAED pattern match observed diffraction patterns well (Figure 5 and the inserted SAED pattern in Figure 3).
We also carried out single-crystal XRD refinement for two phases of the host orthoclase (C2/m) and the nano-precipitates (Pa) with same orientation and unit cell parameters using JANA2006 software (Supplementary Tables S1–S4, Supplementary Figures S3 and S4). The refinement results show that Na and K atoms are off special position slightly. The deviation (y coordinate) is slightly larger for Na atom than that for K atom, which is similar to the results from DFT calculation.
Na–K ordering causes polarity of the structure (and piezoelectric property). A weak second harmonic generation (SHG) signal (~1/50 of that from quartz) was observed only in an adularia from Switzerland [20], which indicates the part of the adularia is non-centric. The determined structure of the nano-precipitates of Na(Si6Al2)O16 with ordered Na–K is a reason for the observed SHG signal.
Based on strain-free solvus in the alkali feldspars (Figure 6), the adularia (~An11) crystallized at ~400 °C or higher from a hydrothermal system. When the crystal reached ~300 °C or lower, exsolution of albite lamellae within the K-spar host is a low energy state. Exsolution between albite and microcline will result in a large lattice mismatch. Nano-precipitates with intermediate composition of KNa(Si6Al2)O16 and K end-member phase may lower the interface energy although it is not the lowest energy state. Figure 7 schematically illustrates free energies for alkali feldspar solid solution and the intermediate phase at low temperature. Formation of the needle-like precipitates and ordering between Na and K at low-temperature can be achieved through diffusion in the tunnel-like positions along the c-axis. The K-rich alkali feldspar with the nano-precipitates may indicate slow cooling of alkali feldspars and their host rock at low temperature. The formation process for the nano-precipitates is very similar to that for the G.P. zones in slowly cooled orthopyroxenes [16,17]. The nano-precipitates in an adularia with similar microstructure may be a reason for the reported unusual mixing behavior between Na- and K-end members [21].

4. Conclusions

TEM results indicate that elongated nano-precipitates with an intermediate composition of KNa(Si6Al2)O16 cause the diffuse reflections in the adularia. The ordered distribution of K and Na atoms in the nano-phase resulted in Pa symmetry. K and Na atoms are slightly off the special position. Formation of the intermediate nano-phase may lower the interface energy between the nano-phase and the host orthoclase, and the structure energy penalty is smaller than the interfacial energy benefit. K-rich alkali feldspars with the Pa nano-precipitates indicate very slow cooling of their host rocks at low temperature. The combined TEM, XRD and DFT methods can be applied for solving crystal structures of nano-phases within their host crystals in natural and synthetic materials. Structure refinement using a single-phase model for the intergrowth of nano-precipitates and the host phase will result in incorrect structure.

Supplementary Materials

The following are available online at https://www.mdpi.com/2075-163X/9/11/649/s1, Figure S1: A representative X-ray EDS spectrum from the adularia; Figure S2: TEM image with SAED and EDS of adularia from North American sub-Cambrian paleosols; Figure S3: Structure model from XRD refinement; Figure S4: Precession image from XRD and calculated SAED pattern from the refined structure; Table S1: Experimental and crystallographic information of the adularia sample (100K); Table S2: Fractional coordinates for the adularia average structure with C2/m symmetry (100K); Table S3: Fractional coordinates for the nano-phase alkali feldspar with Pa symmetry (100K); Table S4: Bond distances for the T sites.

Author Contributions

H.X. conceived the idea, carried out TEM works, and drafted the manuscript; S.J. carried out single-crystal XRD works; S.L. carried out powder XRD and part of the TEM works; F.W.C.H. carried out DFT calculation; all the co-authors contributed to manuscript writing.

Funding

This study was supported by the NSF (EAR-1530614) and the NASA Astrobiology Institute (N07-5489).

Acknowledgments

We thank Izabela Szlufarska for helping us on the DFT calculation.

Conflicts of Interest

The authors declare no conflict of interest.

References

  1. Smith, J.V.; MacKenzie, W. The alkali feldspars V. The nature of orthoclase and microcline perthites and observations concerning the polymorphism of potassium feldspar. Am. Mineral. 1959, 44, 1169–1186. [Google Scholar]
  2. Goldsmith, J.R.; Laves, F. The sodium content of microclines and the microcline-albite series. Inst. Lucas Mallada C.S.I.C. 1961, 8, 81–96. [Google Scholar]
  3. Colville, A.A.; Ribbe, P.H. The crystal structure of an adularia and a refinement of the structure of orthoclase. Am. Mineral. 1968, 53, 25–37. [Google Scholar]
  4. Phillips, M.W.; Ribbe, P.H. The structures of monoclinic potassium-rich feldspars. Am. Mineral. 1973, 58, 263–270. [Google Scholar]
  5. Blasi, A.; Blasi, C.D.P. Aspects of alkali feldspar characterization: Prospects and relevance to problems outstanding. In Feldspars and Their Reactions; Parsons, I., Ed.; Springer: Boston, MA, USA, 1994; pp. 51–101. [Google Scholar]
  6. Laves, F.; Goldsmith, J. Comments on the anorthite papers by Megaw and co-workers presented at this symposium. Estudos Geologicos C.S.I.C. 1961, 8, 155–157. [Google Scholar]
  7. McConnell, J. Electron optical study of effects associated with partial inversion in a silicate phase. Philos. Mag. 1965, 11, 1289–1301. [Google Scholar] [CrossRef]
  8. McConnell, J. Hallimond Lecture 1970 Electron-Optical study of phase transformations. Mineral. Mag. 1971, 38, 1–20. [Google Scholar] [CrossRef]
  9. Smith, J.V. Chemical and textural properties. In Feldspar Minerals; Springer: Berlin, Germany, 1974; Volume 2, pp. 152–195. [Google Scholar]
  10. Smith, J.V.; Brown, W.L. Diffusion, growth, twins and intergrowths. In Feldspar Minerals; Springer: Berlin, Germany, 1988; Volume 1, pp. 398–647. [Google Scholar]
  11. Hill, T.R. High-Resolution Transmission Electron Microscopy Investigation of Nano-Crystals of Pyroxene and Copper in Oregon Sunstones. Ph.D. Thesis, University of Wisconsin-Madison, Madison, WI, USA, 2009. [Google Scholar]
  12. Kresse, G.; Furthmüller, J. Efficient iterative schemes for ab initio total-energy calculations using a plane-wave basis set. Phys. Rev. B 1996, 54, 11169. [Google Scholar] [CrossRef] [PubMed]
  13. Kresse, G.; Joubert, D. From ultrasoft pseudopotentials to the projector augmented-wave method. Phys. Rev. B 1999, 59, 1758. [Google Scholar] [CrossRef]
  14. Blöchl, P.E. Projector augmented-wave method. Phys. Rev. B 1994, 50, 17953. [Google Scholar] [CrossRef] [PubMed]
  15. Perdew, J.P.; Burke, K.; Ernzerhof, M. Generalized gradient approximation made simple. Phys. Rev. Lett. 1996, 77, 3865. [Google Scholar] [CrossRef] [PubMed]
  16. Xu, H.; Shen, Z.; Konishi, H.; Luo, G. Crystal structure of Guinier-Preston zones in orthopyroxene: Z-contrast imaging and ab inito study. Am. Mineral. 2014, 99, 2043–2048. [Google Scholar] [CrossRef]
  17. Champness, P.; Lorimer, G. Precipitation (exsolution) in an orthopyroxene. J. Mater. Sci. 1973, 8, 467–474. [Google Scholar] [CrossRef]
  18. Medaris, L.G., Jr.; Driese, S.G.; Stinchcomb, G.E.; Fournelle, J.H.; Lee, S.; Xu, H.; DiPietro, L.; Gopon, P.; Stewart, E.K. Anatomy of a Sub-Cambrian Paleosol in Wisconsin: Mass fluxes of chemical weathering and climatic conditions in North America during formation of the Cambrian Great Unconformity. J. Geol. 2018, 126, 261–283. [Google Scholar]
  19. Kimata, M.; Saito, S.; Shimizu, M.; Iida, I.; Matsui, T. Low-temperature crystal structures of orthoclase and sanidine. Neues Jahrb. Mineral. Abh. 1996, 171, 199–213. [Google Scholar]
  20. Zilczer, J.; Loiacono, G. Non-centrosymmetry tests for potassium feldspars: An application of the second-harmonic generator technique. J. Appl. Cryst. 1982, 15, 540–541. [Google Scholar] [CrossRef]
  21. Hovis, G.L. A refined view of the thermodynamic mixing quantities for alkali feldspars and the quandary of excess configurational entropy. Am. J. Sci. 2017, 317, 597–640. [Google Scholar] [CrossRef]
  22. Yund, R.; Hofmann, A.; Giletti, B.; Yoder, H. Coherent exsolution in the alkali feldspars. In Geochemical Transport and Kinetics; Hofmann, A.W., Giletti, B.J., Yoder, H.S., Jr., Yund, R.A., Eds.; Carnegie Institution of Washington Publication: Washington, DC, USA, 1974; pp. 173–183. [Google Scholar]
Figure 1. TEM image showing tweed texture due to domains related by Albite-twin and Pericline twins. Average structure of the crystal is monoclinic, i.e., orthoclase. The inserted SAED pattern (up-right corner) and Fast Fourier transform (FFT) pattern (low-left corner) display streaking along the a*- and b*-directions. No diffuse reflections that violate C-centering occur in the SAED pattern.
Minerals 09 00649 g001
Figure 2. [100] zone-axis SAED pattern (a) and precession image from single-crystal XRD (b) showing weak and diffuse diffractions violating C-centering in alkali feldspars.
Minerals 09 00649 g002
Figure 3. A DF TEM image showing needle-like elongated nano-precipitates along the c-axis. The inserted [2 1 ¯ 0] zone-axis SAED pattern shows weak and diffuse reflections violating C-centering in alkali feldspars.
Minerals 09 00649 g003
Figure 4. DFT calculated structure of the intermediate nano-phase “orthobite” at 0 K showing the opposite shifts of Na (yellow) and K (purple) atoms off the special position. Al atoms (turquoise color) are in T1oo and T1io sites, respectively.
Minerals 09 00649 g004
Figure 5. [2 1 ¯ 0] zone-axis precession image from single-crystal XRD (a) and the calculated SAED pattern (b) showing consistent intensities for the diffraction spots violating C-centering, which also matches the inserted SAED pattern in Figure 3.
Minerals 09 00649 g005
Figure 6. A phase diagram for alkali feldspar showing strain-free solvus vs. coherent solvus, with meta-stable solvus between the intermediate phased and the microcline. A blue arrow shows a possible path for the adularia with the tweed pattern. The intermediate phase of nano-precipitates (“Ob” or “orthobite” that is between orthoclase and albite) forms at low temperature. The diagram is modified from Yund [22] based on the recent mixing energy for the solid solution from Hovis [21]. The crest of the solvus is at ~Or40.
Minerals 09 00649 g006
Figure 7. A diagram schematically showing the energy curves for alkali feldspar solid solution and the intermediate phase at low temperature. Formation of nano-precipitates “orthobite” with a KNa(Si6Al2)O16 composition instead of albite exsolution lamellae was due to the low interface energy between the intermediate phase and the host phase.
Minerals 09 00649 g007
Table 1. Fractional coordinates for the nano-phase alkali feldspar with Pa symmetry (0 K).
LabelAtomxyz
MoNa0.767100.735840.14141
M2K0.723820.243840.86156
T1ooAl0.999050.432010.20296
T1o2Si0.981760.428190.75421
T1ioAl0.501760.932460.79588
T1i2Si0.516550.926620.24160
T2ooSi0.290380.368990.63497
T2o2Si0.689630.362650.32198
T2ioSi0.205590.869700.35674
T2i2Si0.806750.863490.67794
Oa1_1O0.999840.388870.97310
Oa1_2O0.511520.887000.02930
Oa2oO0.110720.756510.28148
Oa22O0.378940.256410.71607
ObooO0.162270.395530.74253
Obo2O0.809570.381010.20447
ObioO0.331330.892220.24267
Obi2O0.693250.881820.80208
OcooO0.459470.447070.72688
Oco2O0.516620.434690.24071
OcioO0.037660.948570.26821
Oci2O0.980680.934390.75671
OdooO0.188820.371270.38839
Odo2O0.809010.372690.57356
OdioO0.314670.874140.60170
Odi2O0.685820.871830.42717
Note: Unit cell parameters are a = 8.49384 Å, b = 13.02193 Å, c = 7.27200 Å, β = 116.380°.
Table 2. Bond distances for the T sites in the density functional theory (DFT)-calculated structure.
OaObOcOdAverage
T1oo1.76621.74561.75331.76371.7572
T1o21.61311.62931.63721.63961.6298
T1io1.76451.73701.75341.76121.7540
T1i21.61031.63911.63711.63491.6304
T2oo1.63361.63451.64031.60801.6291
T2o21.66381.61211.61781.65641.6375
T2io1.65221.64381.63941.60261.6345
T2i21.65501.60461.61581.65171.6318

