Abstract
Determination of the atomic-scale structures of certain fine-grained minerals using single-crystal X-ray diffraction (XRD) has been challenging because they commonly occur as submicron and nanocrystals in the geological environment. Synchrotron powder diffraction and scattering techniques are useful complementary methods for studying this type of minerals. In this review, we discussed three example studies investigated by combined methods of synchrotron radiation XRD and pair distribution function (PDF) techniques: (1) low-temperature cristobalite; (2) kaolinite; and (3) vernadite. Powder XRD is useful to determine the average structure including unit-cell parameters, fractional atomic coordinates, occupancies and isotropic atomic displacement parameters. X-ray/Neutron PDF methods are sensitive to study the local structure with anisotropic atomic displacement parameters (ADP). The results and case studies suggest that the crystal structure and high-quality ADP values can be obtained using the combined methods. The method can be useful to characterize crystals and minerals that are not suitable for single-crystal XRD.
1. Introduction
The determination of high-quality crystal structure is becoming increasingly critical to advanced science and technology [1,2,3,4]. Single-crystal X-ray diffraction (XRD) is a traditional technique to determine the crystal structures, including unit cell dimensions, bond-lengths/angles, and site-orderings as well as temperature/atomic displacement factors [5,6]. However, many crystals and minerals are not large enough for the single-crystal XRD measurement. In nature, for example, some metastable low-temperature phases and clay minerals that have been challenged to prepare as single crystals for single-crystal X-ray diffraction analysis [7]. Another example is the case of nanominerals and nanocrystals that is not available for the single-crystal method [8]. Thus, applying powder XRD techniques is critical to solving the structure for this type of system. Conventionally, powder diffraction and pair distribution function (PDF) analysis have been used as suitable techniques for studying the atomic-scale structure of submicron- and nano-crystals [7,9,10].
Powder diffraction has been an essential tool for many decades for the characterization of minerals and other crystalline materials [11,12]. The application of the Rietveld refinement from diffraction peaks has been successfully used for the determination of average crystal structures and quantitative analysis of mixture phases [13,14,15,16]. Furthermore, the powder diffraction technique has been widely applied for phase transformation studies (e.g., in-situ heating XRD) [17,18,19]. Recently, synchrotron radiation sources combined with advanced algorithms have led to high-resolution powder diffraction data allowing detailed characterization of minerals and materials including nano- and micro-structural characteristics with grain size, shapes, and preferred orientation [20,21,22,23,24]. However, the conventional Rietveld refinement has still limitations to characterize the disordered and local structures (e.g., short to medium range-ordered structures).
To complement this, PDF technique from total scattering data has been of much interest in studying the local structure of amorphous and crystalline phases [4,25,26]. In recent years, combined with the advent of the third-generation synchrotron radiation facilities (e.g., Advanced Photon Source, National Synchrotron Light Source II, and Stanford Synchrotron Radiation Light source), the PDF method developed very fast, and when coupled with high-energy total scattering data and high-speed computing has been applied to investigations of disorder in crystalline materials, nanomaterials, glasses, and liquids [27,28,29,30]. The PDF analysis can determine not only the local structure but also the long-range-ordered structure using total scattering (i.e., both Bragg and diffuse reflections) [8]. More specifically, the PDF analysis can calculate the atomic structure in the real-space from the measured total scattering data using the real-space refinement method (e.g., PDFgui and reverse Monte Carlo) [8,31,32]. Similarly, to Rietveld refinement, the PDF analysis refines structural parameters to fit the experimental PDF data [32]. There are several points to note about the PDF experiment. The use of high energy X-ray radiation may lower the instrumental resolution, which could be a disadvantage for crystalline solids and the fluorescence energies of sample should also be avoided in order to get high-quality data [25,26,27].
In this paper, we discuss three case studies: (1) low-temperature cristobalite (metastable phase); (2) kaolinite (clay mineral); and (3) vernadite (poorly crystallized nanomineral). Since three minerals that are not suitable for the single-crystal method, these minerals are investigated by synchrotron radiation XRD and PDF technique to determine high-quality parameters of unit cell parameters, coordinates, and thermal factors. The powder XRD method is useful to determine the average structure including isotropic atomic displacement parameters (Uiso) [33], by contrast, the PDF method appears to be sensitive to the local structure and anisotropic displacement parameters (ADPs) [7,34,35].
2. Basic Principles
2.1. Rietveld Refinement of Powder XRD Data
The basic idea of Rietveld refinement is that the experimental powder pattern is fitted using parameters of a structural model using a least-squares procedure. A detailed mathematical theory of Rietveld refinement was reported in the literature [11,36,37]. The main requirements for Rietveld refinement are (1) accurate powder diffraction data (e.g., 2θ vs. Intensity), (2) starting structural models identified from positions of the Bragg peaks, and (3) instrument parameters. The experimental diffraction pattern is generally fitted with pseudo-Voigt (pV) shape functions. The line broadening and the symmetrical part of peaks can be represented by the pseudo-Voigt equation,
where C(x) is the Cauchyian component, C(x) = (1 + x2)−1, and G(x) is Gaussian component, G(x) = exp[−(ln2)x2] with x = (2θ − 2θ0)/FWHM (Full-width at half maximum of diffraction peak). The Int is the scale factor and η is a function of Lorentz, Gaussian, and FWHM parameter [38]. The diffraction peaks were refined with starting values of the instrument and structural parameters using Rietveld refinement software (e.g., GSASII, FullProf, TOPAS, MDI JADE, and others) (Figure 1). The procedure is designed to minimize the difference between the observed data and simulated patterns, indicating the reliability index parameter, e.g., Rexp (expected error) and Rwp (weighted residual error), and defined as
where I0, Ic, and wi are the experimental intensities, calculated intensities, and weight factors, respectively. N is the number of experimental observations based on the weight, and P is the number of fitting parameters. The factors are associated with the goodness of fit (GoF):
ρV(x) = Σ Int [ηC(x) + (1 − η)G(x)]
GoF = Rwp/Rexp
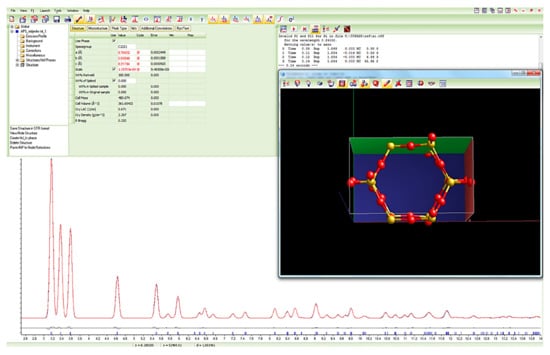
Figure 1.
A screenshot (TOPAS 5; Bruker) of Rietveld refinement of low-temperature tridymite [7].
Rietveld refinements were carried out until convergence was reached and the GoF factor approaching around 1. In the case of a quantitative analysis, we can obtain the weight fraction wi for each phase using the individual scale factors of a crystalline phase in the multiphase system based on the equation:
where S is the scale factor of phase i; Z is the number of formula units for a single unit cell; M is the atomic weight of the formula unit; V is the volume of the unit cell [33].
Wi = Si(ZMV)i/ΣjSj(ZMV)j
2.2. Pair Distribution Function
The PDF method uses the whole measured spectrum (total scattering), including both the Bragg reflections (long-range or average structure) and diffuse scattering (short-range or local structure) [26]. The structure function, S(Q), is obtained from the Bragg and diffuse scattering of X-ray, neutron or electron diffraction, which is defined as
where Icoh is the observed intensity at Q, which is the magnitude of the wave vector (i.e., Q = 4πsinθ/λ). The f(Q) is the atomic scattering factor and N is the total number of atoms. The PDF, G(r), is then calculated by using the Fourier transform according to the equations [39],
where F(Q) is the reduced structure function. The value of Qmax is determined by the size of detector and sample-to-detector distance. The values of Qmin is associated with the size of the beamstop and sample-to-detector distance. Generally, Qmax can be reduced below the experimental maximum to avoid noise in the high-Q region. The G(r) decreases in amplitude related to the crystal size and morphology, especially reflecting the distances separating pairs of atoms followed by atomic structure. The G(r) function can be defined as
S(Q) = Icoh/N[f(Q)]2 − [f(Q) 2]/[f(Q)]2 + 1
F(Q) = Q[S(Q) − 1]
G(r) = 4πr [ρ(r) – ρ0]
The ρ0 is the atomic number density of the crystal and ρ(r) is the atomic pair density. The ρ(r) represents the mean weighted density of atoms at radial distance r from the origin. The ρ(r) can also be calculated as the equation
The sums in ρ(r) indicate all atoms in the crystal, fi, and fj is the scattering factor of atoms i and j, respectively. rij is the distance between atoms i and j. Equation (10) is used to fit the experimental PDF pattern using the structure model like the Rietveld method. PDF modeling, where it is carried out, is performed by refining the parameters such as the lattice parameters, atom positions, and atomic displacement parameters, to minimize the difference between the theoretical and an experimental PDF. This procedure is performed, for example, in PDFgui and Diffpy-CMI software [32,40] (Figure 2). Many more details about PDF theory and applications can be found in the book of Egami and Billinge (2012) [4] and other referneces [41,42].
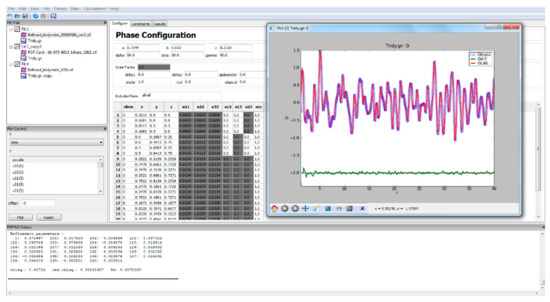
Figure 2.
A screenshot (PDFgui software) for pair distribution function (PDF) refinement of low-temperature tridymite [7].
3. Experimental Method
High-resolution X-ray powder diffraction data were collected at beamline 11-BM of the Advanced Photon Source (APS) at Argonne National Laboratory (Lemont, IL, USA) (Figure 3A). Finely ground powders of the samples were placed into polyimide tubes with an inner diameter of 1 mm for the synchrotron XRD measurements (Figure 3D). The sample-to-detector distances and beam center positions were calibrated using Si and LaB6 standard. Diffraction data of empty polyimide tube were collected with same exposure times for background removal in the data reduction. The crystal structures of powder samples were determined with the Rietveld method using the TOPAS 5 software (Bruker AXS) (Figure 1). A pseudo-Voigt method was used for fitting the peak profiles.
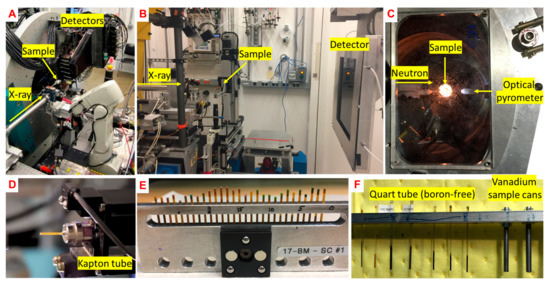
Figure 3.
(A,B) High-resolution powder diffraction (beamline 11-BM) and rapid acquisition powder diffraction experiments for XRD/PDF measurements (beamline 17-BM-B) in Advanced Photon Source (APS), Argonne National Laboratory [41]. (C) Nanoscale-Ordered Materials Diffractometer (NOMAD) instrument at beamline BL-1B in Oak Ridge National Laboratory [42]. (D,E) Polyimide capillary tubes at single and multiple sample holder for X-ray diffraction and scattering measurement. (F) boron-free quartz capillary tubes and vanadium cans for neutron PDF analysis.
Synchrotron radiation X-ray diffraction and pair distribution function experiments were conducted on beamline 17-BM at APS, Argonne National Laboratory (Lemont, IL, USA) (Figure 3B). Similarly, finely ground powder samples were placed inside polyimide (Kapton) tubes for the XRD/PDF measurements (Figure 3E). An amorphous Si area detector was set to collect 2-D diffraction imaging in transmission geometry. Each single exposure on the detector was set to 1 s. This 1 s exposure was repeated 120 times to integrate a total collection time of 120 s for each sample. The sample-to-detector distances and beam center positions were calibrated using a LaB6 standard. Diffraction data on empty polyimide tubing were collected with the same exposure time for background removal. GSASII software [43] was used to integrate and convert the images to conventional 1-D profile intensity versus wave vector (Q). The obtained data up to a Qmax of 19.8 Å−1 were then transformed to PDF patterns using PdfGetX3 [44]. PDF fitting and refinement were carried out using the PDFGui program (Figure 2) [32].
Neutron total scattering measurements were carried out on the NOMAD BL-1B beamline at the Spallation Neutron Source (SNS), Oak Ridge National Laboratory (Oak Ridge, TN, USA) (Figure 3C). The powder sample was loaded into quartz capillary tubes (Figure 3F). The total scattering structure function was calculated with the NOMAD data reduction software, and the PDF, G(r), was obtained by direct Fourier transformation of S(Q). The obtained data up to a Qmax of 31.4 Å−1 were then transformed to PDF patterns using the program PDFgetN [45]. The PDFGui [32] was used for fitting the neutron PDF data.
4. Case Studies
4.1. Low-Crystobalite
Determination of the structures of low-temperature metastable phases (e.g., low-cristobalite, and low-tridymite) has been challenging because they commonly occur as fine-grained crystals in geological environments. Therefore, applying powder diffraction and scattering techniques is important to characterize this kind of low-temperature crystal system. Synchrotron radiation XRD and the X-ray PDF method were used to investigate the crystal structure of low-cristobalite, including unit cell parameters, atomic coordinates, and ADPs. To confirm the validity of the refined structure, the results were compared with the previous single-crystal XRD results [46,47].
Rietveld refinement from synchrotron XRD data provide the high quality of average structure of the tetragonal cristobalite in space group P41212 symmetry with unit cell parameters, atomic coordinates, and bond distances/angles, which is compared with previous tetragonal cristobalite from Ellora Caves, India [46] and synthetic cristobalite [47] (Figure 4A and Tables S1 and S2). The unit cell parameters, bond distances, bond angle, and tetrahedral volume of cristobalite are in agreement with previous cristobalite structures calculated by single-crystal XRD and neutron powder diffraction (Table S1).
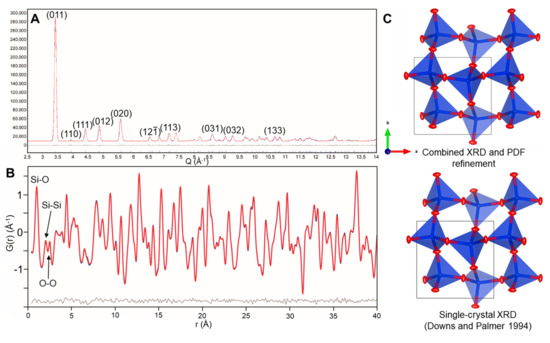
Figure 4.
(A) Rietveld method results of synchrotron radiation XRD patterns of tetragonal cristobalite (Rwp = 1.74%); (B) PDF refinement results of the tetragonal cristobalite (Rwp = 8.58%); and (C) The structure model of tetragonal cristobalite calculated by Rietveld method and PDF refinement compared to the previous structure models.
The use of synchrotron X-ray PDF analysis can provide the high-quality of local structure. Figure 4B shows the PDF pattern of cristobalite showing atomic correlations. The first peak (~1.60 Å) corresponds to Si–O correlations and the second (~2.62 Å) and third peak (~3.07 Å) refers to O–O correlations and Si–Si correlations, respectively (Figure 4B). The distances of atomic correlations are consistent with the values from Rietveld refinement (Table S1). Using the refined structure of Rietveld refinement, the PDF pattern of cristobalite fits to determine ADPs. The final refined structure from combined XRD and PDF refinement is listed in Table S1.
Figure 4C shows the structure model of cristobalite along the c-axis, compared to the structure of cristobalite refined by single-crystal XRD [47]. The structure of cristobalite is made of framework of corner-sharing SiO4 tetrahedra (Figure 4C). The major axis of displacement ellipsoid of oxygens is perpendicular to Si–O bonds, and the ellipsoid of silicon atoms are relatively spherical shape, compare to oxygen atoms (Figure 4C). Overall, the shapes and orientations of the thermal ellipsoids of our refined structure are consistent with previous cristobalite structures (Figure 4C). This result supports that a PDF analysis can determine the high-quality crystal structure, including ADPs.
4.2. Kaolinite
Kaolinite, Al2Si2O5(OH)4, is the most common clay mineral which forms from chemical weathering of aluminum silicate minerals (e.g., feldspar). The kaolinite plays significant roles in the geological process (e.g., weathering and adsorption of trace elements) and industrial applications (papers, ceramics, and medicines) [48,49,50]. Due to the characteristics of fine-grained crystals of the kaolinite phase, applying the single-crystal XRD technique has been challenged to kaolinite clay mineral [11,51,52]. We used synchrotron high-resolution XRD and PDF methods to provide a detailed structure of kaolinite including average and local structure information. In addition, we applied both neutron and X-ray PDF method for comparison.
Rietveld refinement from the synchrotron XRD pattern provides the high quality of the average structure of triclinic kaolinite with the space group C1 symmetry (Figure 5). The refined unit cell parameters are a = 5.1546(9) Å, b = 8.9425(11) Å, c = 7.4033(15) Å, with Rwp = 5.57% and the result is listed in Table 1 and appendix CIF file. Table 1 shows that the unit cell parameters and bond distances are compared with published kaolinite structure from X-ray powder diffraction [11] and low-temperature neutron powder diffraction [52] (Table 1). The bond lengths within the two tetrahedra around Si(1) and Si(2) are very similar to each other, indicating that the Si atoms almost occupy the center of regular tetrahedra (Table 1). Al octahedra display two groups of slightly different bond lengths due to the hydrogen. The Al–O bonds are significantly longer than the Al–OH bonds. Overall, the kaolinite structure from Rietveld refinement agrees well with the previously published kaolinite structures [11,51].
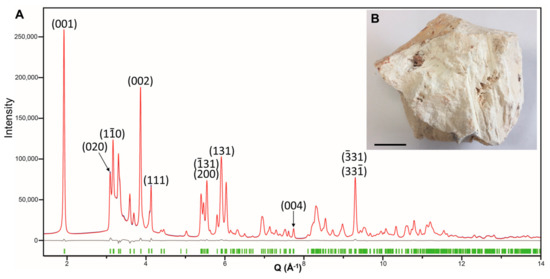
Figure 5.
(A) Rietveld refinement of synchrotron radiation XRD pattern of kaolinite. The gray line shows the differences between experimental and refined pattern). (B) A hand specimen of kaolinite sample from Murfreesboro, AR, USA (S.W. Bailey Collection of Department of Geoscience, University of Wisconsin-Madison). The scale bar indicates 2 cm.

Table 1.
The unit cell parameter and bond distances of kaolinite compared with previous kaolinite structures.
The PDF refinement of synchrotron X-ray and neutron PDF provides high-quality structure parameters including ADPs. The experimental X-ray and neutron PDF data are shown in Figures S1–S4. The PDF refinement results show a good agreement between calculated and experimental data (Figure 6). The refined structures of kaolinite are attached in the Supplementary CIF files, which are non-hydrogen atomic positions. Both X-ray and neutron PDF refinement are not sensitive to determine the H position and its APDs. The unit-cell parameters and bond distances from neutron PDF refinement are compared with other kaolinite structures listed in Table 1, which also shows good agreement with previous kaolinite structures. Figure 7 shows the structure models of kaolinite projected along the a-axis and c-axis from the X-ray and neutron PDF analysis. Both atom positions and shape of ellipsoids from the X-ray and neutron PDF refinement are very similar (Figure 7). The O and OH positions show more pronounced anisotropic displacements, which is associated with the hydrogen positions and geometry of Al octahedra and Si tetrahedra framework (Figure 7). The anisotropic ellipsoid shapes of O atoms are in the planes perpendicular to Si–Si axes in the tetrahedral sheet of corner-sharing SiO4 tetrahedra. The anisotropic ellipsoid shapes of OH atoms are different from those of O atoms due to the H atoms (CIF files in the Supplementary Materials for details). (Figure 7). The results suggest that the X-ray and neutron PDF method are both useful to determine the high-quality values ADPs for kaolinite.
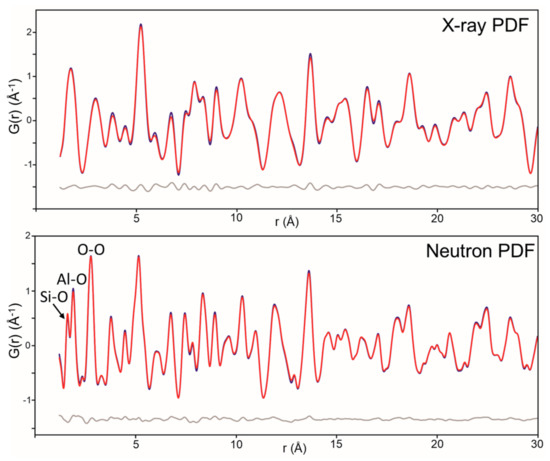
Figure 6.
PDF refinement of kaolinite from X-ray and neutron data. The gray lines are differences between the experimental (blue) and calculated (red) PDF patterns. The refined structure parameters of kaolinite are listed in Supplementary Table S1. The Rwp values are 15.59% and 13.47%, respectively.
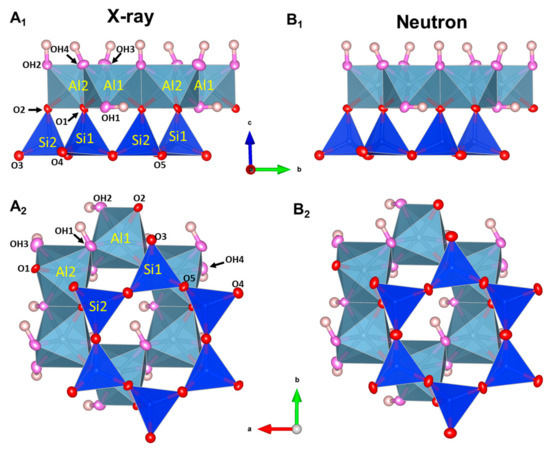
Figure 7.
The refined structure model of kaolinite from (A) X-ray and (B) neutron PDF refinement. The models show the displacement ellipsoids drawn at 60% probability. Hydrogen positions are adapted from kaolinite structure of Bish (1993) [51] for showing the approximate positions of H atoms.
4.3. Vernadite
Vernadite is a manganese oxide nanomineral, which is associated with a wide variety of soils, sediments, freshwater, and marine environments [53,54,55,56,57]. The vernadite nanophase plays vital roles in the control of many geochemical processes, such as global manganese cycle, microbially driven manganese redox reactions and the adsorbing of strategic metals, rare-earth elements and platinum-group elements [58,59,60,61,62]. Moreover, there has been a significant increase in the public interest in synthetic vernadite nanophase (δ-MnO2) for their roles in new advanced materials for catalysis, and batteries, supercapacitors and waste remediation [63,64,65,66,67]. Despite their scientific and industrial importance, the structure of vernadite was not fully determined due to the poorly crystallized characteristic with the high density of defects [53,68,69].
Since the vernadite is a poorly crystallized nanomineral (medium-range order structure), the structure determination is challenged by the conventional XRD method (e.g., Rietveld refinement) [31,70]. As an alternative, the PDF analysis is an applicable technique for characterizing this poorly crystallized nanostructure [31,68]. The structure of synthetic vernadite (δ-MnO2) has been previously studied by X-ray PDF refinement [68] and Bragg-rod method with a Debye equation analysis [69]. We investigated the natural vernadite from ferromanganese crust using combined synchrotron radiation XRD, PDF, and high-resolution transmission electron microscopy (TEM) techniques [9]. The TEM method has been widely used to image minerals and materials with atomic resolution [71,72,73].
The peak profiles of synchrotron diffraction provide the detailed crystal structure information of vernadtie. Synchrotron XRD patterns are collected from the inner part to the outer part (Figure 8). The XRD patterns of vernadite nanophase show diffraction peaks at 2.42 Å, 1.41 Å, and 1.22 Å, respectively (Figure 8A). The XRD pattern of the inner part shows a weak and broad (001) diffraction ranged from ~7.0 Å to ~16.5 Å at low Q range (Figure 8C). The weak and broad (001) diffraction with strong hk diffraction indicates monolayer or few layers of vernadite structure with heavy stacking disorder along the c-axis. In addition, the increasing intensity of the (001) peak from the outer part to the inner part indicates the increasing crystallinity of vernadite nanophase (Figure 8C). The d-spacing ratio of the first two strong diffraction peaks is ~1.72, close to , indicating the pseudo-hexagonal symmetry of manganese octahedral layer. Moreover, the nearly symmetrical shape of a diffraction peak at 1.41 Å (Figure 8D) suggests that the layer structure is associated with the hexagonal symmetry [74]. The hump at 2.2–1.9 Å (Figure 8A) is related to triple-corner sharing surface complexes at the vacancy sites of the manganese octahedral layer [75,76]. The lower intensity of the right-side shoulder of the 2.42 Å diffraction peak (an arrow in Figure 8D) also indicates the increasing the triple-corner sharing configuration of the manganese octahedral layers [75].
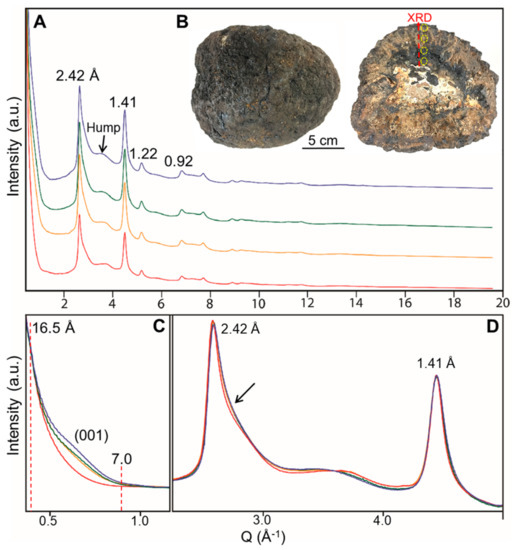
Figure 8.
(A) Synchrotron radiation XRD patterns of vernadite samples from the outer part to the inner part with image of ferromanganese crust (FMC) sample. The cross-section of FMC showing areas for XRD analysis (yellow circles) (B). The hump in Figure 8A is related to the 1.9–2.2 Å d-spacing. Two zoomed-in areas are inserted (C,D). The arrow (D) indicates the right-side shoulder at 2.42 Å peak [9].
High-resolution TEM analyses show the direct images of vernadite nanominerals (Figure 9). Vernadite appears as aggregates of platy nanocrystals (Figure 9). The lattice fringes are often curved and curled (Figure 9). The curving of layers of vernadite could be caused by the presence of vacancies and/or the influence of cation substitutions in the Mn-layers [68,69]. High-resolution TEM images show the lattice fringes of ~7.2 Å and ~9.6 Å as well as interstratified layers (Figure 9), indicating that the vernadite in FMC is a mixture of the three phases.
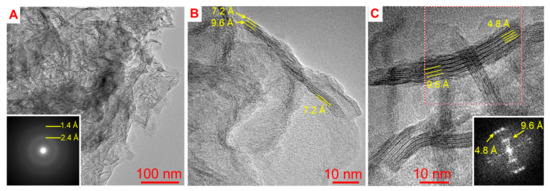
Figure 9.
(A–C) High-resolution TEM images of vernadite nanocrystals showing lattice fringes of ~7.2 Å and ~9.6 Å, and an interstratified layer of ~7.2 Å and ~9.6 Å [9].
The detailed peak profile from PDF patterns provides the detailed crystal structure of vernadite. The PDF patterns from the outer to inner part show almost identical features, suggesting similarities of local structures (Figure 10). The first major peak corresponds to Mn–O correlations of manganese octahedra (Figure 10). The second peak refers to Mn–Mn and O–O correlations in the edge-sharing Mn octahedra (Figure 10). The todorokite has a prominent peak at ~5.34 Å that is related to the tunneled structure configuration [68]. However, vernadite patterns do not exist with a strong peak of ~5.34 Å, which indicates the phyllomanganate framework (i.e., δ-MnO2 and birnessite structure) (Figure 10) [68,69]. The intensity variation at ~5.71 and ~6.05 Å is related to the interlayer species at the vacancy sites of Mn-layers (Figure 10) [75]. The high intensity at 6.05 Å (outer vernadite in Figure 10) indicates a higher density interlayer species at Mn-layers by triple-edge sharing configuration, which is also indicated by synchrotron XRD pattern (Figure 8).
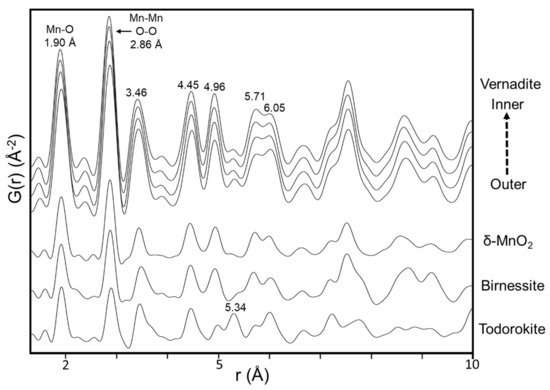
Figure 10.
PDF patterns of vernadite phases 1 Å to 10 Å range, compared with the reference patterns of synthetic δ-MnO2, birnessite and todorokite.
To verify the mixed phase of vernadite structure observed in the TEM study, the vernadite structures were fitted to the experimental PDF data using multi-phase models (Figure 11A). The Rw-values and residues further decreased after including interstratified 7-Å/10-Å phase (Rw dropped by 2.8%) (Figure 11A). The three-phase vernadite models are best fitted to describe vernadite structure [9]. Furthermore, the results of refinement show that the mismatch mainly derived from 2.86 Å and 3.46 Å peaks (Figure 11A). The mismatch is associated with local distortions as results of Mn vacant sites and/or other cations substitutions [9,69]. The refined structure is a good agreement with reported synthetic vernadite structures [9]. Therefore, the result suggests that PDF analysis can determine the nanostructure in mixed phases. However, the PDF analysis is not sensitive enough to be precisely determined interlayer cations of vernadite structure [68,69]. Figure 11B shows a schematic model of vernadite determined by combined XRD, TEM, and PDF method. The curved Mn-layers caused by the presence of vacancies and substitutions of other cations such as Ni2+, Cu2+, Mn3+, Fe3+, and Pb2+. The crystal structure, chemistry and defects of vernadite are the main factors to control the speciation of trace elements during hydrogenic FMC formation, which is important to enrichment mechanism of trace metals (e.g., strategic metals, REEs, and PGEs) [75,76].
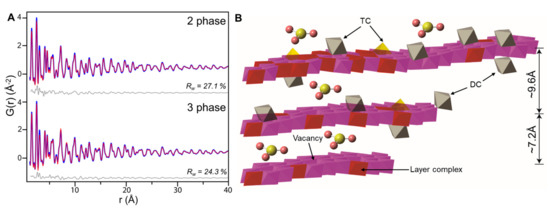
Figure 11.
(A) PDF refinement of vernadite in inner and outer part with 2 phases (7-Å and 10-Å) and 3 phases (7-Å, 10-Å, and interstratified 7-Å/10-Å). The gray lines are differences between experimental (blue) and calculated (red) PDF patterns. (B) The schematic diagram of vernadite structure including monolayered, 7-Å, 10-Å, and the interstratified phases designed by combined XRD, TEM, and PDF method. TC and DC refer to triple-corner sharing and double-corner sharing. IV and VI refer to tetrahedral (blue) and octahedral (gray). Yellow circles = monovalent cations (e.g., Na+ and K+) and pinkish circle = oxygen.
This case study shows that the integrated method of synchrotron radiation XRD, X-ray PDF and TEM is a useful tool to determine the crystal structure and chemistry of the vernadite nanomineral. Especially, the direct high-resolution TEM images identified the mixture phase of vernadite. The detail structures of vernadite can be determined by the PDF refinement. The combined synchrotron XRD/PDF and high-resolution TEM will be a powder tool for studying and characterizing other crystal structures of nanominerals.
5. Conclusions
Thanks to the high-energy synchrotron sources, the powder diffraction and scattering techniques have now become a significant analysis toolkit for the crystallographic approach. This paper shows that combined methods of synchrotron radiation XRD/PDF are powerful complementary tools for fine-grained minerals such as metastable low-temperature mineral, clay mineral, and nanomineral if the material is not suitable for single-crystal XRD. The Rietveld refinement of Bragg reflections provided accurate average structure for the crystals. X-ray and neutron PDF methods both can provide high-quality values of ADPs of atoms. These results show good agreement with previous crystal structures determined by single-crystal XRD. The combined methods will be useful for the determination of other submicron- and nano-minerals in the geological environment. Furthermore, the powder techniques combined with other methods such as TEM, Raman spectroscopy, Mossbauer spectroscopy, extended X-ray absorption fine structure (EXAFS), and theoretical calculations provide a great potential in the study of the fine-grained minerals and crystals [10,77,78,79].
Supplementary Materials
The following are available online at https://www.mdpi.com/2075-163X/10/2/124/s1, Table S1: Unit cell parameters, bond distances, bond angles and tetrahedral volume of tetragonal cristobalite; Table S2: Atomic coordinates and anisotropic thermal displacement parameters of tetragonal cristobalite; Figure S1: X-ray PDF analysis of (A) I(Q), (B) F(Q), and (C) G(r) for a kaolinite; Figure S2: Neutron PDF analysis of (A) S(Q) and (B) G(r) for a kaolinite. Figure S3: X-ray pair distribution function of kaolinite showing atomic pairs. Figure S4: Neutron pair distribution function of kaolinite showing atomic pairs. File 1: Kaolinite_Neuntron.cif; File 2: Kaolinite_Xray.cif.
Author Contributions
S.L. carried out the experiment and drafted the manuscript; H.X. conceived the idea; all the co-authors contributed to manuscript writing. All authors have read and agreed to the published version of the manuscript.
Funding
This study was supported by the NSF (EAR-1530614) and the NASA Astrobiology Institute (N07-5489).
Acknowledgments
Authors acknowledge the supports from National Science Foundation (EAR-1530614) and NASA Astrobiology Institute, and Department of Geoscience of the University of Wisconsin-Madison. A portion of this research used resources at the Spallation Neutron Source, a DOE Office of Science User Facility operated by the Oak Ridge National Laboratory. The advance photon source is a U.S. Department of Energy (DOE) Office of Science User Facility operated for the DOE Office of Science by Argonne National Laboratory under contract no. DE-AC02-06CH11357.
Conflicts of Interest
The authors declare no conflict of interest.
References
- Baker, D.; Sali, A. Protein structure prediction and structural genomics. Science 2001, 294, 93–96. [Google Scholar] [CrossRef] [PubMed]
- Cherezov, V.; Rosenbaum, D.M.; Hanson, M.A.; Rasmussen, S.G.; Thian, F.S.; Kobilka, T.S.; Choi, H.-J.; Kuhn, P.; Weis, W.I.; Kobilka, B.K. High-resolution crystal structure of an engineered human β2-adrenergic G protein–coupled receptor. Science 2007, 318, 1258–1265. [Google Scholar] [CrossRef] [PubMed]
- Merkulov, V.I.; Guillorn, M.A.; Lowndes, D.H.; Simpson, M.L.; Voelkl, E. Shaping carbon nanostructures by controlling the synthesis process. Appl. Phys. Lett. 2001, 79, 1178–1180. [Google Scholar] [CrossRef]
- Egami, T.; Billinge, S.J. Underneath the Bragg Peaks: Structural Analysis of Complex Materials; Pergamon: Oxford, UK, 2012; Volume 16, pp. 10–32. [Google Scholar]
- Jin, S.; Xu, H.; Lee, S.; Fu, P. Jinshajiangite: Structure, twinning and pseudosymmetry. Acta Cryst. B 2018, 74, 325–336. [Google Scholar] [CrossRef] [PubMed]
- Xu, H.; Jin, S.; Noll, B.C. Incommensurate density modulation in a Na-rich plagioclase feldspar: Z-contrast imaging and single-crystal X-ray diffraction study. Acta Cryst. B 2016, 72, 904–915. [Google Scholar] [CrossRef]
- Lee, S.; Xu, H. Using powder XRD and pair distribution function to determine anisotropic atomic displacement parameters of orthorhombic tridymite and tetragonal cristobalite. Acta Cryst. B 2019, 75, 160–167. [Google Scholar] [CrossRef]
- Billinge, S.J.; Kanatzidis, M. Beyond crystallography: The study of disorder, nanocrystallinity and crystallographically challenged materials with pair distribution functions. Chem. Commun. 2004, 7, 749–760. [Google Scholar] [CrossRef]
- Lee, S.; Xu, H.; Xu, W.; Sun, X. The structure and crystal chemistry of vernadite in ferromanganese crusts. Acta Cryst. B 2019, 75, 591–598. [Google Scholar] [CrossRef]
- Lee, S.; Xu, H.; Xu, H.; Jacobs, R.; Morgan, D. Valleyite: A new magnetic mineral with the sodalite-type structure. Am. Mineral. 2019, 104, 1238–1245. [Google Scholar] [CrossRef]
- Post, J.; Bish, D. Rietveld refinement of crystal structures using powder X-ray diffraction data. In Modern Powder Diffraction; Mineralogical Society of America: Chantilly, VA, USA, 1989; Volume 20, pp. 277–308. [Google Scholar]
- Lee, S.; Xu, H. XRD and TEM studies on nanophase manganese oxides in freshwater ferromanganese nodules from Green Bay, Lake Michigan. Clays Clay Miner. 2016, 64, 523–536. [Google Scholar] [CrossRef]
- Thompson, P.; Cox, D.; Hastings, J. Rietveld refinement of Debye–Scherrer synchrotron X-ray data from Al2O3. J. Appl. Crystallogr. 1987, 20, 79–83. [Google Scholar] [CrossRef]
- Lee, S.; Xu, H. Powder XRD and TEM study on crystal structure and interstratification of Zn-chlorite (baileychlore). Powder Diffr. 2017, 32, 118–123. [Google Scholar] [CrossRef]
- Lee, S.; Xu, H. The crystal structure and Gibbs free energy of formation of chukanovite as an oxidation product of carbon steel in human liver. Chem. Geol. 2018, 488, 180–188. [Google Scholar] [CrossRef]
- O’Connor, B.H.; Raven, M.D. Application of the Rietveld refinement procedure in assaying powdered mixtures. Powder Diffr. 1988, 3, 2–6. [Google Scholar] [CrossRef]
- Enderle, R.; Götz-Neunhoeffer, F.; Göbbels, M.; Müller, F.; Greil, P. Influence of magnesium doping on the phase transformation temperature of β-TCP ceramics examined by Rietveld refinement. Biomaterials 2005, 26, 3379–3384. [Google Scholar] [CrossRef]
- Gualtieri, A.F.; Venturelli, P. In situ study of the goethite-hematite phase transformation by real time synchrotron powder diffraction. Am. Mineral. 1999, 84, 895–904. [Google Scholar] [CrossRef]
- Nelmes, R.; McMahon, M. High-pressure powder diffraction on synchrotron sources. J. Synchrotron Radiat. 1994, 1, 69–73. [Google Scholar] [CrossRef]
- Wenk, H.-R.; Lutterotti, L.; Kaercher, P.; Kanitpanyacharoen, W.; Miyagi, L.; Vasin, R. Rietveld texture analysis from synchrotron diffraction images. II. Complex multiphase materials and diamond anvil cell experiments. Powder Diffr. 2014, 29, 220–232. [Google Scholar] [CrossRef]
- Lutterotti, L.; Vasin, R.; Wenk, H.-R. Rietveld texture analysis from synchrotron diffraction images. I. Calibration and basic analysis. Powder Diffr. 2014, 29, 76–84. [Google Scholar] [CrossRef]
- Ferreira, F.F.; Antonio, S.G.; Rosa, P.C.P.; de Oliveira Paiva-Santos, C. Crystal structure determination of mebendazole form A using high-resolution synchrotron x-ray powder diffraction data. J. Pharm. Sci. 2010, 99, 1734–1744. [Google Scholar] [CrossRef]
- Bhakar, A.; Pandey, A.H.; Singh, M.; Upadhyay, A.; Sinha, A.; Gupta, S.; Ganguli, T. Structural analysis of lead magnesium niobate using synchrotron powder X-ray diffraction and the Rietveld method. Acta Cryst. B 2016, 72, 404–409. [Google Scholar] [CrossRef] [PubMed]
- Xu, H.; Lee, S.; Xu, H. Luogufengite: A new nano-mineral of Fe2O3 polymorph with giant coercive field. Am. Mineral. 2017, 102, 711–719. [Google Scholar] [CrossRef]
- Chupas, P.J.; Qiu, X.; Hanson, J.C.; Lee, P.L.; Grey, C.P.; Billinge, S.J. Rapid-acquisition pair distribution function (RA-PDF) analysis. J. Appl. Crystallogr. 2003, 36, 1342–1347. [Google Scholar] [CrossRef]
- Toby, B.; Egami, T. Accuracy of pair distribution function analysis applied to crystalline and non-crystalline materials. Acta Cryst. A 1992, 48, 336–346. [Google Scholar] [CrossRef]
- Billinge, S.J. The rise of the X-ray atomic pair distribution function method: A series of fortunate events. Philos. Trans. R. Soc. A 2019, 377, 20180413. [Google Scholar] [CrossRef]
- Soper, A.K.; Barney, E.R. Extracting the pair distribution function from white-beam X-ray total scattering data. J. Appl. Crystallogr. 2011, 44, 714–726. [Google Scholar] [CrossRef]
- Davis, T.; Johnson, M.; Billinge, S.J. Toward Phase Quantification at the Nanoscale Using the Total Scattering Pair Distribution Function (TSPDF) Method: Recrystallization of Cryomilled Sulfamerazine. Cryst. Growth Des. 2013, 13, 4239–4244. [Google Scholar] [CrossRef]
- Nilsson, A.; Pettersson, L.G. The structural origin of anomalous properties of liquid water. Nat. Commun. 2015, 6, 1–11. [Google Scholar] [CrossRef]
- Billinge, S.J.; Levin, I. The problem with determining atomic structure at the nanoscale. Science 2007, 316, 561–565. [Google Scholar] [CrossRef]
- Farrow, C.; Juhas, P.; Liu, J.; Bryndin, D.; Božin, E.; Bloch, J.; Proffen, T.; Billinge, S. PDFfit2 and PDFgui: Computer programs for studying nanostructure in crystals. J. Condens. Matter Phys. 2007, 19, 335219. [Google Scholar] [CrossRef]
- McCusker, L.; Von Dreele, R.; Cox, D.; Louër, D.; Scardi, P. Rietveld refinement guidelines. J. Appl. Crystallogr. 1999, 32, 36–50. [Google Scholar] [CrossRef]
- Merritt, E.A. Expanding the model: Anisotropic displacement parameters in protein structure refinement. Acta Cryst. D 1999, 55, 1109–1117. [Google Scholar] [CrossRef] [PubMed]
- Whitfield, R.E.; Goossens, D.J.; Welberry, T.R. Total scattering and pair distribution function analysis in modelling disorder in PZN (PbZn1/3Nb2/3O3). IUCrJ 2016, 3, 20–31. [Google Scholar] [CrossRef] [PubMed]
- Rietveld, H. Line profiles of neutron powder-diffraction peaks for structure refinement. Acta Cryst. 1967, 22, 151–152. [Google Scholar] [CrossRef]
- Rietveld, H. A profile refinement method for nuclear and magnetic structures. J. Appl. Crystallogr. 1969, 2, 65–71. [Google Scholar] [CrossRef]
- Ida, T.; Ando, M.; Toraya, H. Extended pseudo-Voigt function for approximating the Voigt profile. J. Appl. Crystallogr. 2000, 33, 1311–1316. [Google Scholar] [CrossRef]
- Farrow, C.L.; Billinge, S.J. Relationship between the atomic pair distribution function and small-angle scattering: Implications for modeling of nanoparticles. Acta Cryst. A 2009, 65, 232–239. [Google Scholar] [CrossRef]
- Juhás, P.; Farrow, C.L.; Yang, X.; Knox, K.R.; Billinge, S.J. Complex modeling: A strategy and software program for combining multiple information sources to solve ill posed structure and nanostructure inverse problems. Acta Cryst. A 2015, 71, 562–568. [Google Scholar] [CrossRef]
- Wang, J.; Toby, B.H.; Lee, P.L.; Ribaud, L.; Antao, S.M.; Kurtz, C.; Ramanathan, M.; Von Dreele, R.B.; Beno, M.A. A dedicated powder diffraction beamline at the advanced photon source: Commissioning and early operational results. Rev. Sci. Instrum. 2008, 79, 085105. [Google Scholar] [CrossRef]
- Neuefeind, J.; Feygenson, M.; Carruth, J.; Hoffmann, R.; Chipley, K.K. The nanoscale ordered materials diffractometer NOMAD at the spallation neutron source SNS. Nucl. Instrum. Methods Phys. Res. 2012, 287, 68–75. [Google Scholar] [CrossRef]
- Toby, B.H.; Von Dreele, R.B. GSAS-II: The genesis of a modern open-source all purpose crystallography software package. J. Appl. Crystallogr. 2013, 46, 544–549. [Google Scholar] [CrossRef]
- Juhás, P.; Davis, T.; Farrow, C.L.; Billinge, S.J. PDFgetX3: A rapid and highly automatable program for processing powder diffraction data into total scattering pair distribution functions. J. Appl. Crystallogr. 2013, 46, 560–566. [Google Scholar] [CrossRef]
- Peterson, P.; Gutmann, M.; Proffen, T.; Billinge, S. PDFgetN: A user-friendly program to extract the total scattering structure factor and the pair distribution function from neutron powder diffraction data. J. Appl. Crystallogr. 2000, 33, 1192. [Google Scholar] [CrossRef]
- Downs, R.T.; Palmer, D.C. The pressure behavior of α cristobalite. Am. Mineral. 1994, 79, 9–14. [Google Scholar]
- Pluth, J.; Smith, J.; Faber, J., Jr. Crystal structure of low cristobalite at 10, 293, and 473 K: Variation of framework geometry with temperature. J. Appl. Phys. 1985, 57, 1045–1049. [Google Scholar] [CrossRef]
- Saikia, N.; Bharali, D.; Sengupta, P.; Bordoloi, D.; Goswamee, R.; Saikia, P.; Borthakur, P. Characterization, beneficiation and utilization of a kaolinite clay from Assam, India. Appl. Clay Sci. 2003, 24, 93–103. [Google Scholar] [CrossRef]
- Adebowale, K.O.; Unuabonah, I.E.; Olu-Owolabi, B. The effect of some operating variables on the adsorption of lead and cadmium ions on kaolinite clay. J. Hazard. Mater. 2006, 134, 130–139. [Google Scholar] [CrossRef]
- King, R. Kaolinite. Geol. Today 2009, 25, 75–78. [Google Scholar] [CrossRef]
- Bish, D.L. Rietveld refinement of the kaolinite structure at 1.5 K. Clays Clay Miner. 1993, 41, 738–744. [Google Scholar] [CrossRef]
- Bish, D.L.; Von Dreele, R.B. Rietveld refinement of non-hydrogen atomic positions in kaolinite. Clays Clay Miner. 1989, 37, 289–296. [Google Scholar] [CrossRef]
- Hochella Jr, M.F.; Kasama, T.; Putnis, A.; Putnis, C.V.; Moore, J.N. Environmentally important, poorly crystalline Fe/Mn hydrous oxides: Ferrihydrite and a possibly new vernadite-like mineral from the Clark Fork River Superfund Complex. Am. Mineral. 2005, 90, 718–724. [Google Scholar] [CrossRef]
- Lanson, B.; Marcus, M.A.; Fakra, S.; Panfili, F.; Geoffroy, N.; Manceau, A. Formation of Zn–Ca phyllomanganate nanoparticles in grass roots. Geochim. Cosmochim. Acta 2008, 72, 2478–2490. [Google Scholar] [CrossRef][Green Version]
- Bargar, J.R.; Fuller, C.C.; Marcus, M.A.; Brearley, A.J.; De la Rosa, M.P.; Webb, S.M.; Caldwell, W.A. Structural characterization of terrestrial microbial Mn oxides from Pinal Creek, AZ. Geochim. Cosmochim. Acta 2009, 73, 889–910. [Google Scholar] [CrossRef]
- Bodeï, S.; Manceau, A.; Geoffroy, N.; Baronnet, A.; Buatier, M. Formation of todorokite from vernadite in Ni-rich hemipelagic sediments. Geochim. Cosmochim. Acta 2007, 71, 5698–5716. [Google Scholar] [CrossRef]
- Ostwald, J. Ferruginous vernadite in an Indian Ocean ferromanganese nodule. Geol. Mag. 1984, 121, 483–488. [Google Scholar] [CrossRef]
- Koschinsky, A.; Halbach, P. Sequential leaching of marine ferromanganese precipitates: Genetic implications. Geochim. Cosmochim. Acta 1995, 59, 5113–5132. [Google Scholar] [CrossRef]
- Manceau, A.; Lanson, M.; Geoffroy, N. Natural speciation of Ni, Zn, Ba, and As in ferromanganese coatings on quartz using X-ray fluorescence, absorption, and diffraction. Geochim. Cosmochim. Acta 2007, 71, 95–128. [Google Scholar] [CrossRef]
- Marcus, M.A.; Manceau, A.; Kersten, M. Mn, Fe, Zn and As speciation in a fast-growing ferromanganese marine nodule1. Geochim. Cosmochim. Acta 2004, 68, 3125–3136. [Google Scholar] [CrossRef]
- Palumbo, B.; Bellanca, A.; Neri, R.; Roe, M. Trace metal partitioning in Fe–Mn nodules from Sicilian soils, Italy. Chem. Geol. 2001, 173, 257–269. [Google Scholar] [CrossRef]
- Xue, T.; Xiaoming, S.; Gaowen, H.; Shengwei, W.; Hongfeng, L.; Mei, Z. Geochemistry of PGE and Au in ferromanganese crusts from seamounts in the west Pacific Ocean. In Mineral Deposit Research: Meeting the Global Challenge; Springer: Berlin, Germany, 2005; pp. 207–209. [Google Scholar]
- Simonin, L.; Colin, J.-F.; Ranieri, V.; Canévet, E.; Martin, J.-F.; Bourbon, C.; Baehtz, C.; Strobel, P.; Daniel, L.; Patoux, S. In situ investigations of a Li-rich Mn–Ni layered oxide for Li-ion batteries. J. Mater. Chem. 2012, 22, 11316–11322. [Google Scholar] [CrossRef]
- Lafferty, B.J.; Ginder-Vogel, M.; Zhu, M.; Livi, K.J.; Sparks, D.L. Arsenite oxidation by a poorly crystalline manganese-oxide. 2. Results from X-ray absorption spectroscopy and X-ray diffraction. Environ. Sci. Technol. 2010, 44, 8467–8472. [Google Scholar] [CrossRef]
- Thackeray, M.M. Manganese oxides for lithium batteries. Progress in Solid State Chemistry 1997, 25, 1–71. [Google Scholar] [CrossRef]
- Yan, J.; Fan, Z.; Wei, T.; Qian, W.; Zhang, M.; Wei, F. Fast and reversible surface redox reaction of graphene–MnO2 composites as supercapacitor electrodes. Carbon 2010, 48, 3825–3833. [Google Scholar] [CrossRef]
- Zaharieva, I.; Chernev, P.; Risch, M.; Klingan, K.; Kohlhoff, M.; Fischer, A.; Dau, H. Electrosynthesis, functional, and structural characterization of a water-oxidizing manganese oxide. Environ. Sci. Technol. 2012, 5, 7081–7089. [Google Scholar] [CrossRef]
- Zhu, M.; Farrow, C.L.; Post, J.E.; Livi, K.J.; Billinge, S.J.; Ginder-Vogel, M.; Sparks, D.L. Structural study of biotic and abiotic poorly-crystalline manganese oxides using atomic pair distribution function analysis. Geochim. Cosmochim. Acta 2012, 81, 39–55. [Google Scholar] [CrossRef]
- Manceau, A.; Marcus, M.A.; Grangeon, S.; Lanson, M.; Lanson, B.; Gaillot, A.-C.; Skanthakumar, S.; Soderholm, L. Short-range and long-range order of phyllomanganate nanoparticles determined using high-energy X-ray scattering. J. Appl. Crystallogr. 2013, 46, 193–209. [Google Scholar] [CrossRef]
- Post, J.E. Manganese oxide minerals: Crystal structures and economic and environmental significance. Proc. Natl. Acad. Sci. USA 1999, 96, 3447–3454. [Google Scholar] [CrossRef]
- Lee, S.; Xu, H. Size-dependent phase map and phase transformation kinetics for nanometric iron (III) oxides (γ → ε → α pathway). J. Phys. Chem. C 2016, 120, 13316–13322. [Google Scholar] [CrossRef]
- Hill, T.R.; Konishi, H.; Hobbs, F.; Lee, S.; Xu, H. Precipitates of α-cristobalite and silicate glass in UHP clinopyroxene from a Bohemian Massif eclogite. Am. Mineral. 2019, 104, 1402–1415. [Google Scholar] [CrossRef]
- Lee, S.; Xu, H. The role of ε-Fe2O3 nano-mineral and domains in enhancing magnetic coercivity: Implications for the natural remanent magnetization. Minerals 2018, 8, 97. [Google Scholar] [CrossRef]
- Drits, V.A.; Lanson, B.; Gaillot, A.-C. Birnessite polytype systematics and identification by powder X-ray diffraction. Am. Mineral. 2007, 92, 771–788. [Google Scholar] [CrossRef]
- Grangeon, S.; Fernandez-Martinez, A.; Claret, F.; Marty, N.; Tournassat, C.; Warmont, F.; Gloter, A. In-situ determination of the kinetics and mechanisms of nickel adsorption by nanocrystalline vernadite. Chem. Geol. 2017, 459, 24–31. [Google Scholar] [CrossRef]
- Grangeon, S.; Fernandez-Martinez, A.; Warmont, F.; Gloter, A.; Marty, N.; Poulain, A.; Lanson, B. Cryptomelane formation from nanocrystalline vernadite precursor: A high energy X-ray scattering and transmission electron microscopy perspective on reaction mechanisms. Geochem. Trans. 2015, 16, 1–16. [Google Scholar] [CrossRef]
- Lee, S.; Shen, Z.; Xu, H. Study on nanophase iron oxyhydroxides in freshwater ferromanganese nodules from Green Bay, Lake Michigan, with implications for the adsorption of As and heavy metals. Am. Mineral. 2016, 101, 1986–1995. [Google Scholar] [CrossRef]
- Yang, P.; Lee, S.; Post, J.E.; Xu, H.; Wang, Q.; Xu, W.; Zhu, M. Trivalent manganese on vacancies triggers rapid transformation of layered to tunneled manganese oxides (TMOs): Implications for occurrence of TMOs in low-temperature environment. Geochim. Cosmochim. Acta 2018, 240, 173–190. [Google Scholar] [CrossRef]
- Tomaszewski, E.J.; Lee, S.; Rudolph, J.; Xu, H.; Ginder-Vogel, M. The reactivity of Fe (II) associated with goethite formed during short redox cycles toward Cr (VI) reduction under oxic conditions. Chem. Geol. 2017, 464, 101–109. [Google Scholar] [CrossRef]
© 2020 by the authors. Licensee MDPI, Basel, Switzerland. This article is an open access article distributed under the terms and conditions of the Creative Commons Attribution (CC BY) license (http://creativecommons.org/licenses/by/4.0/).