Ore Geology, Fluid Inclusion Microthermometry and H-O-S Isotopes of the Liyuan Gold Deposit, Central Taihang Mountains, North China Craton


 ,
,
Abstract
1. Introduction
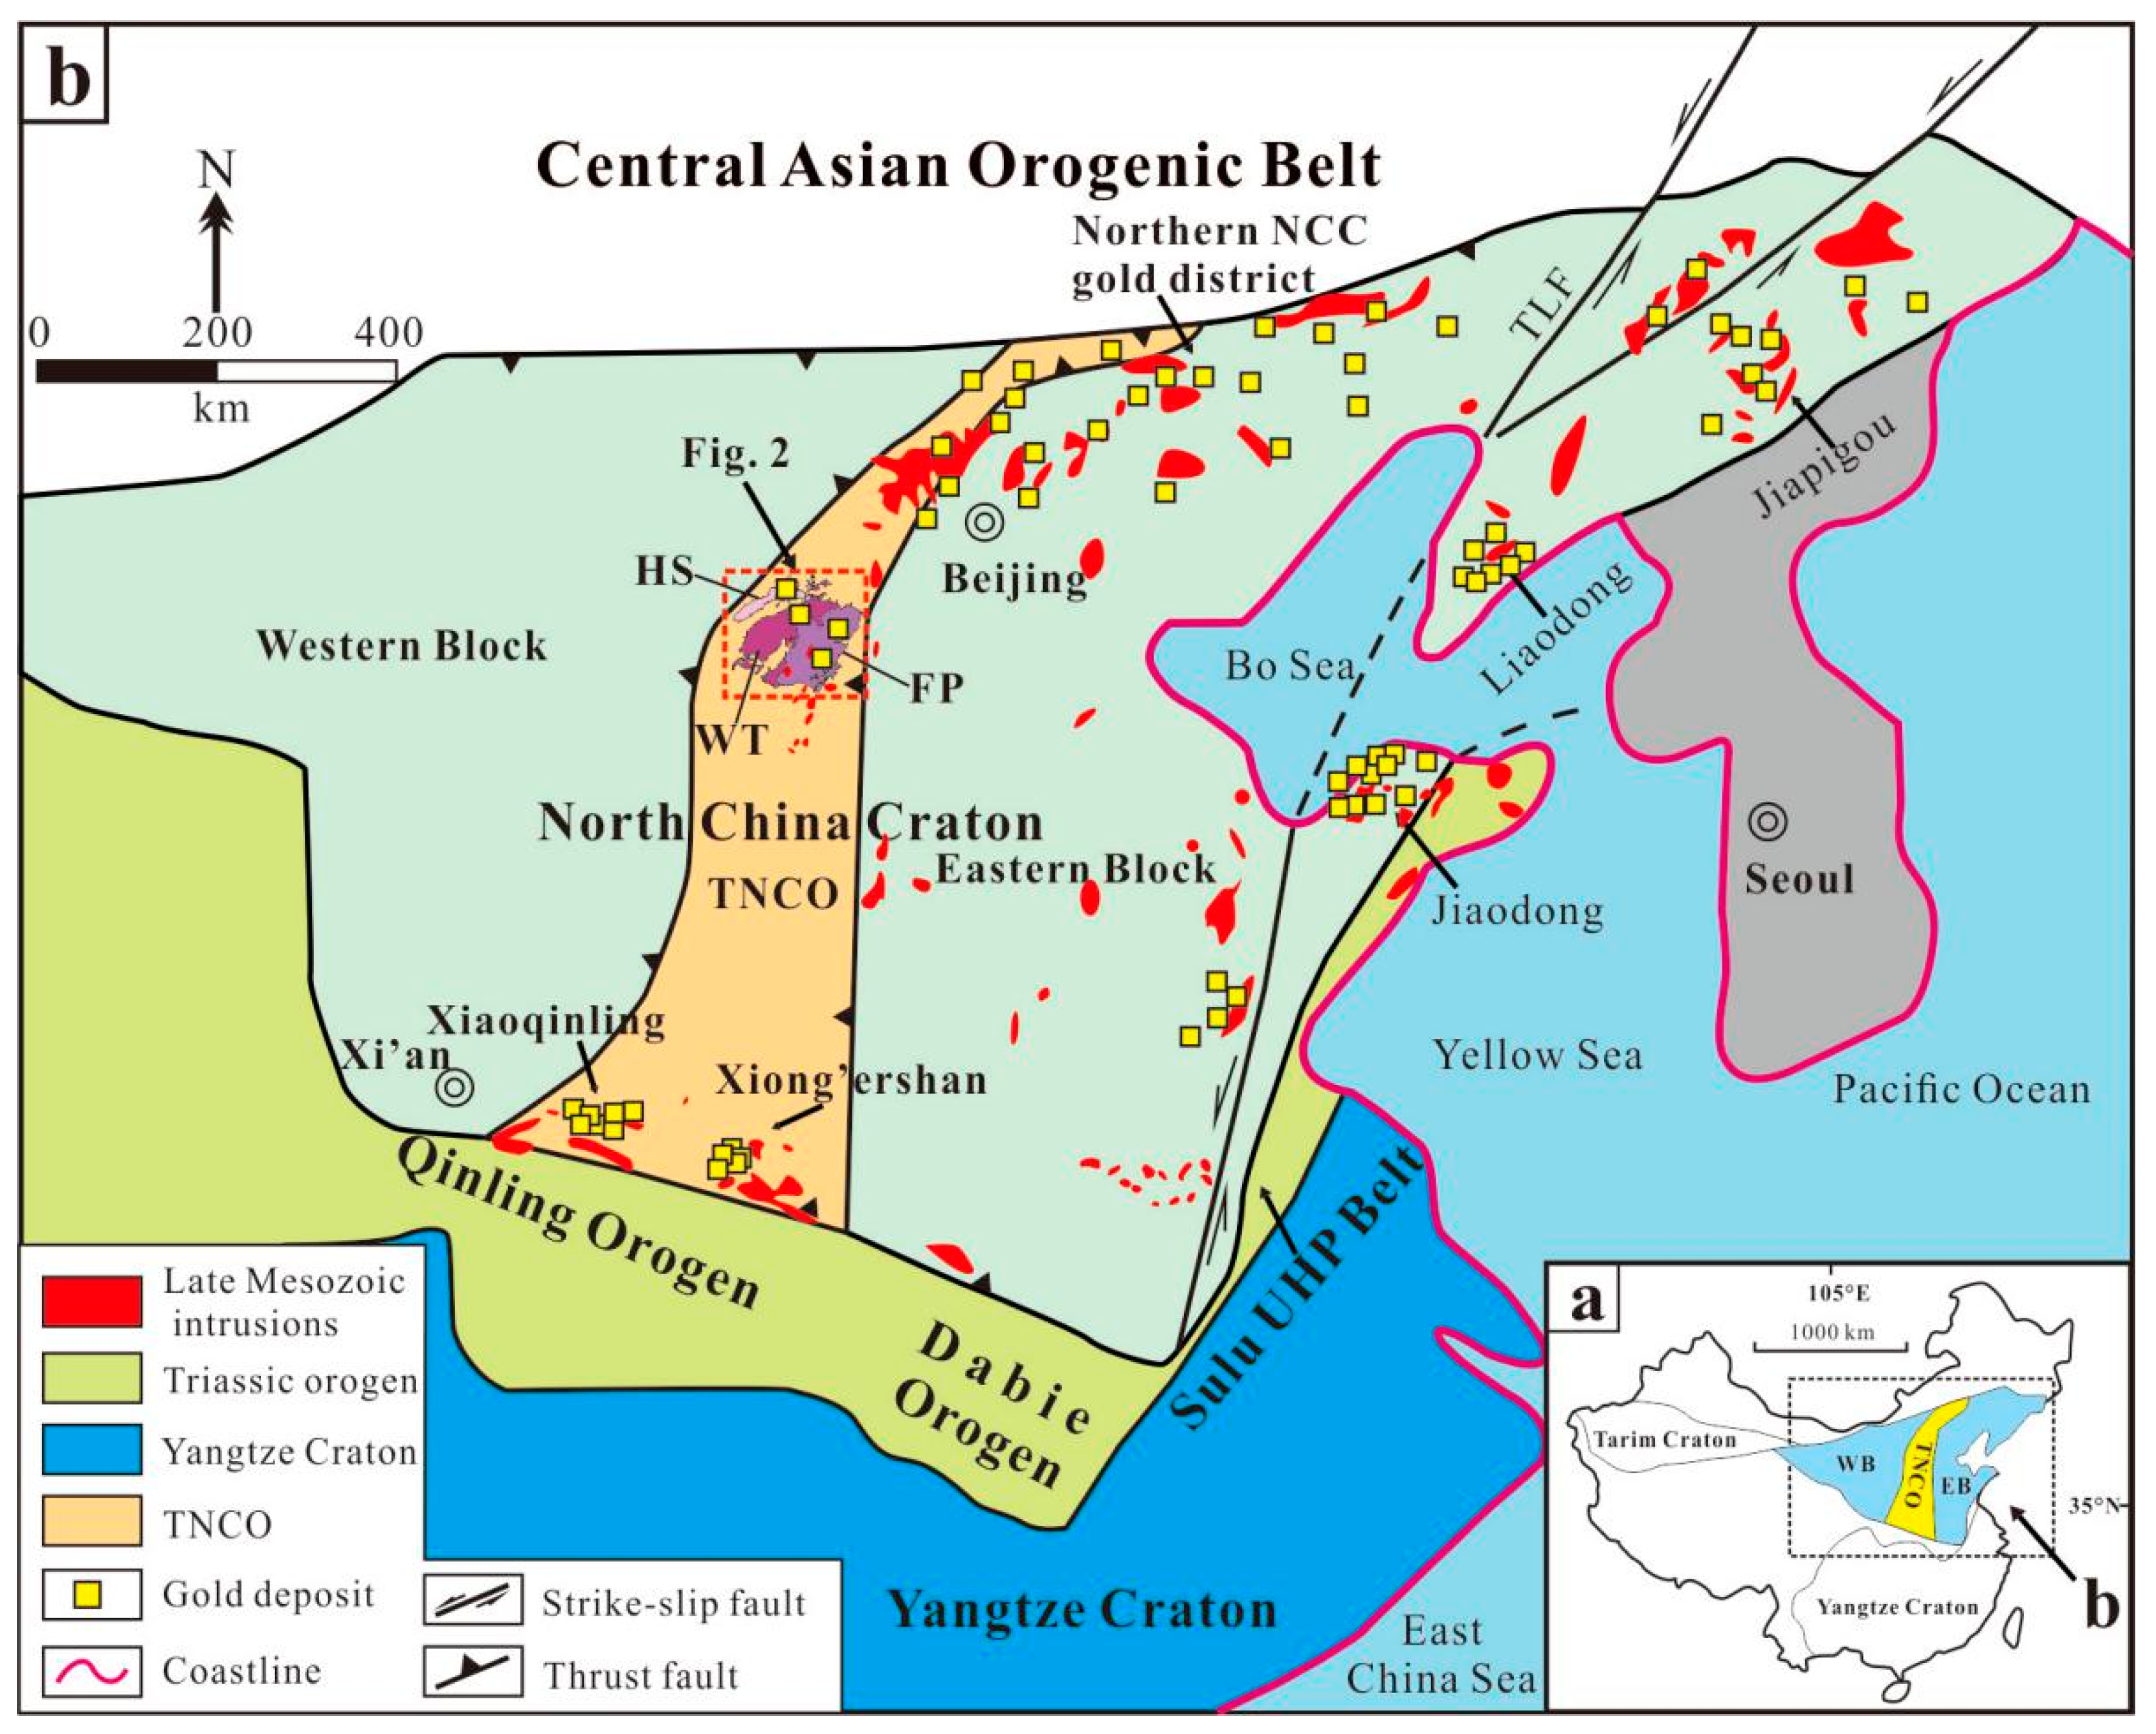
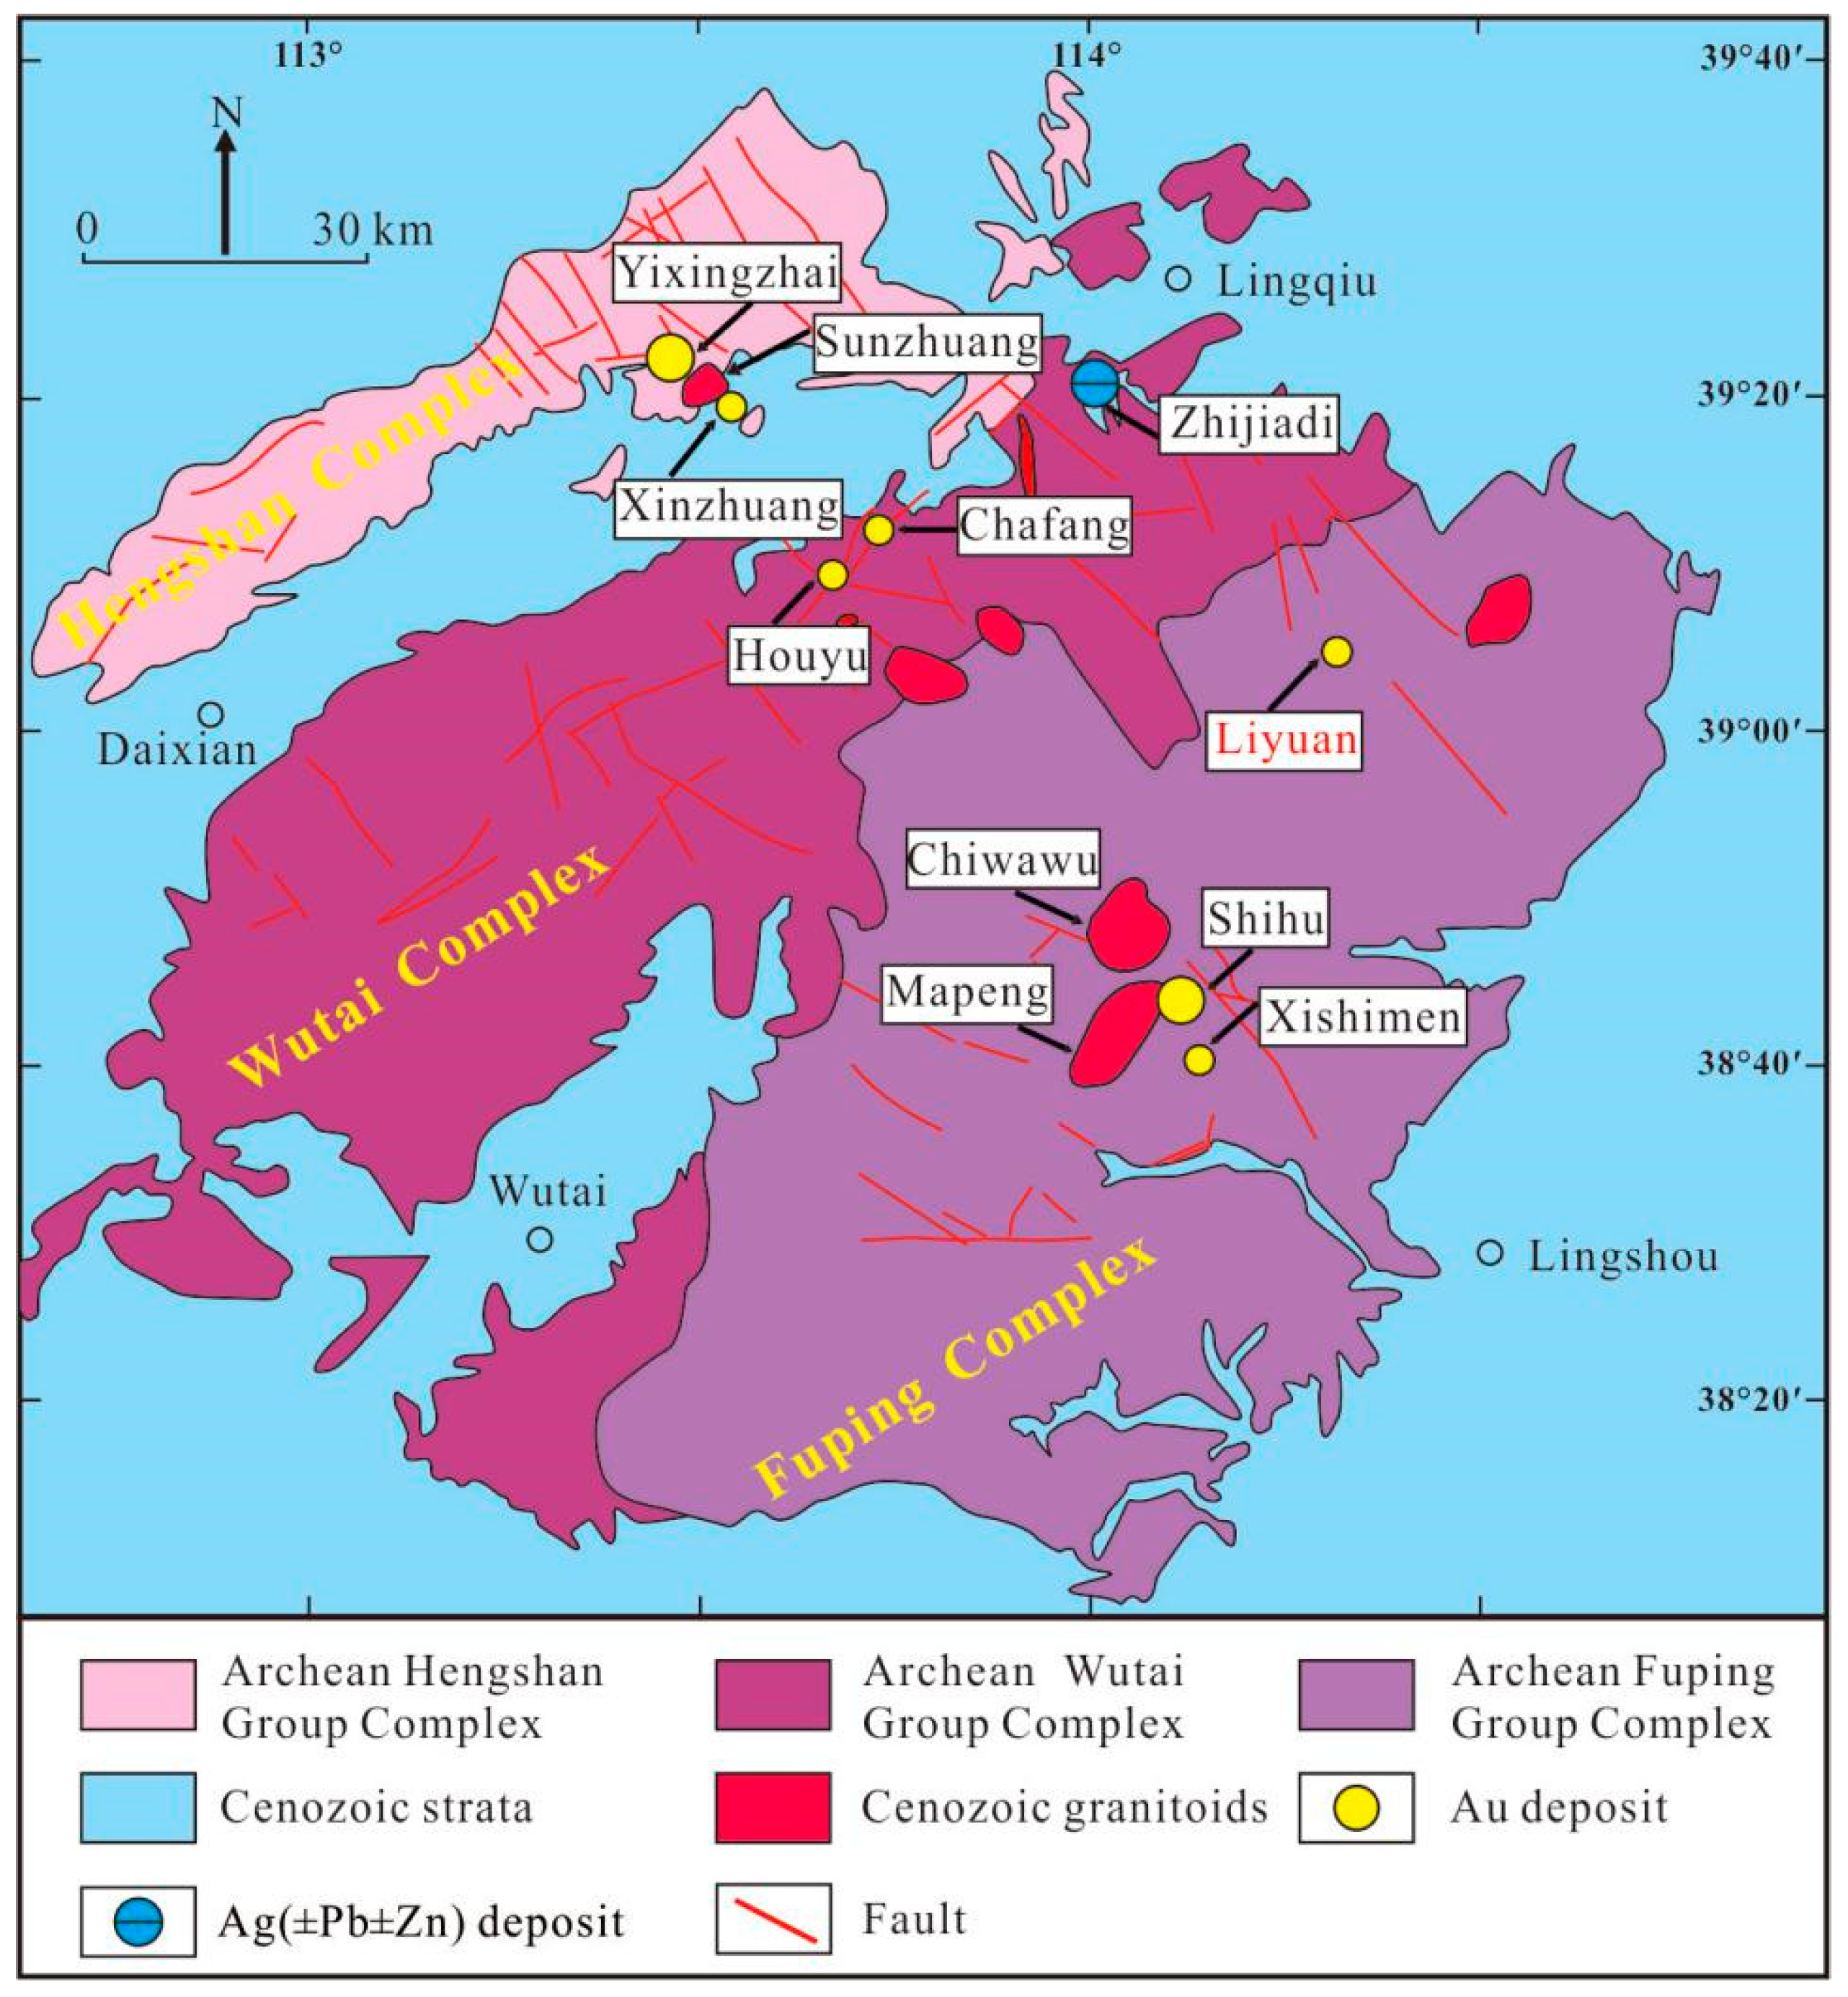
2. Geological Setting
3. Ore Geology
3.1. Stratigraphy
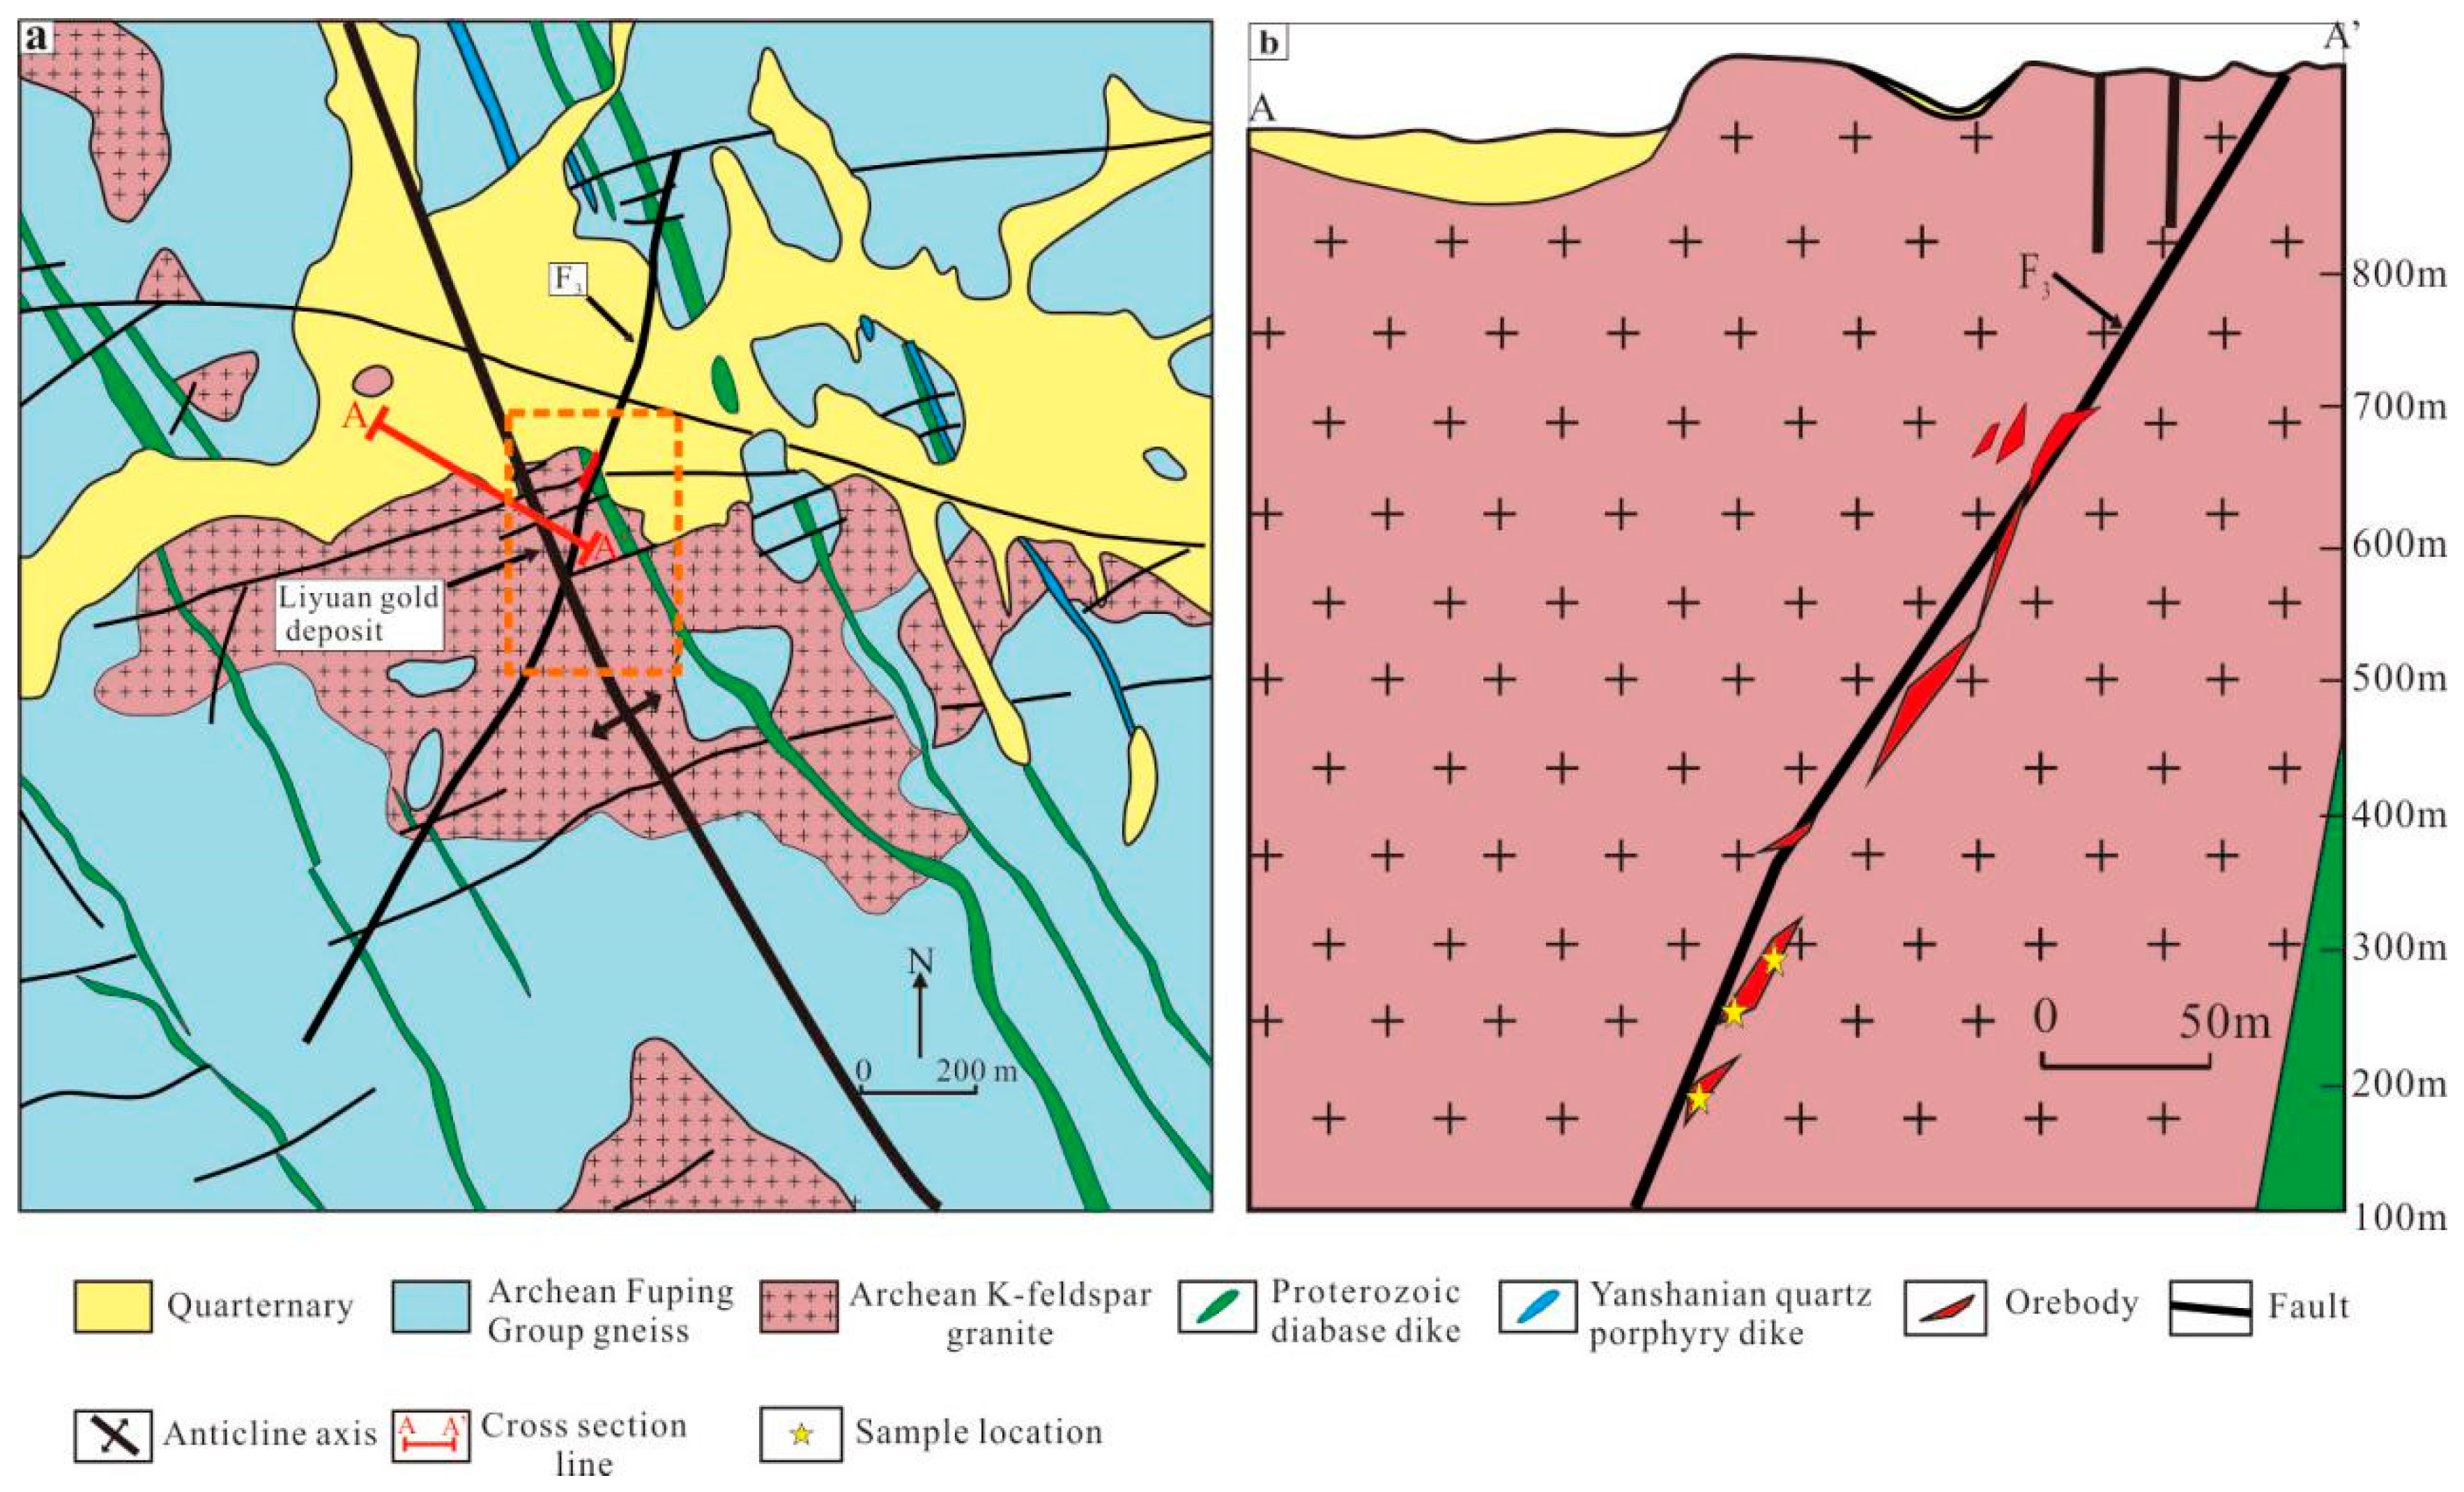
3.2. Structures
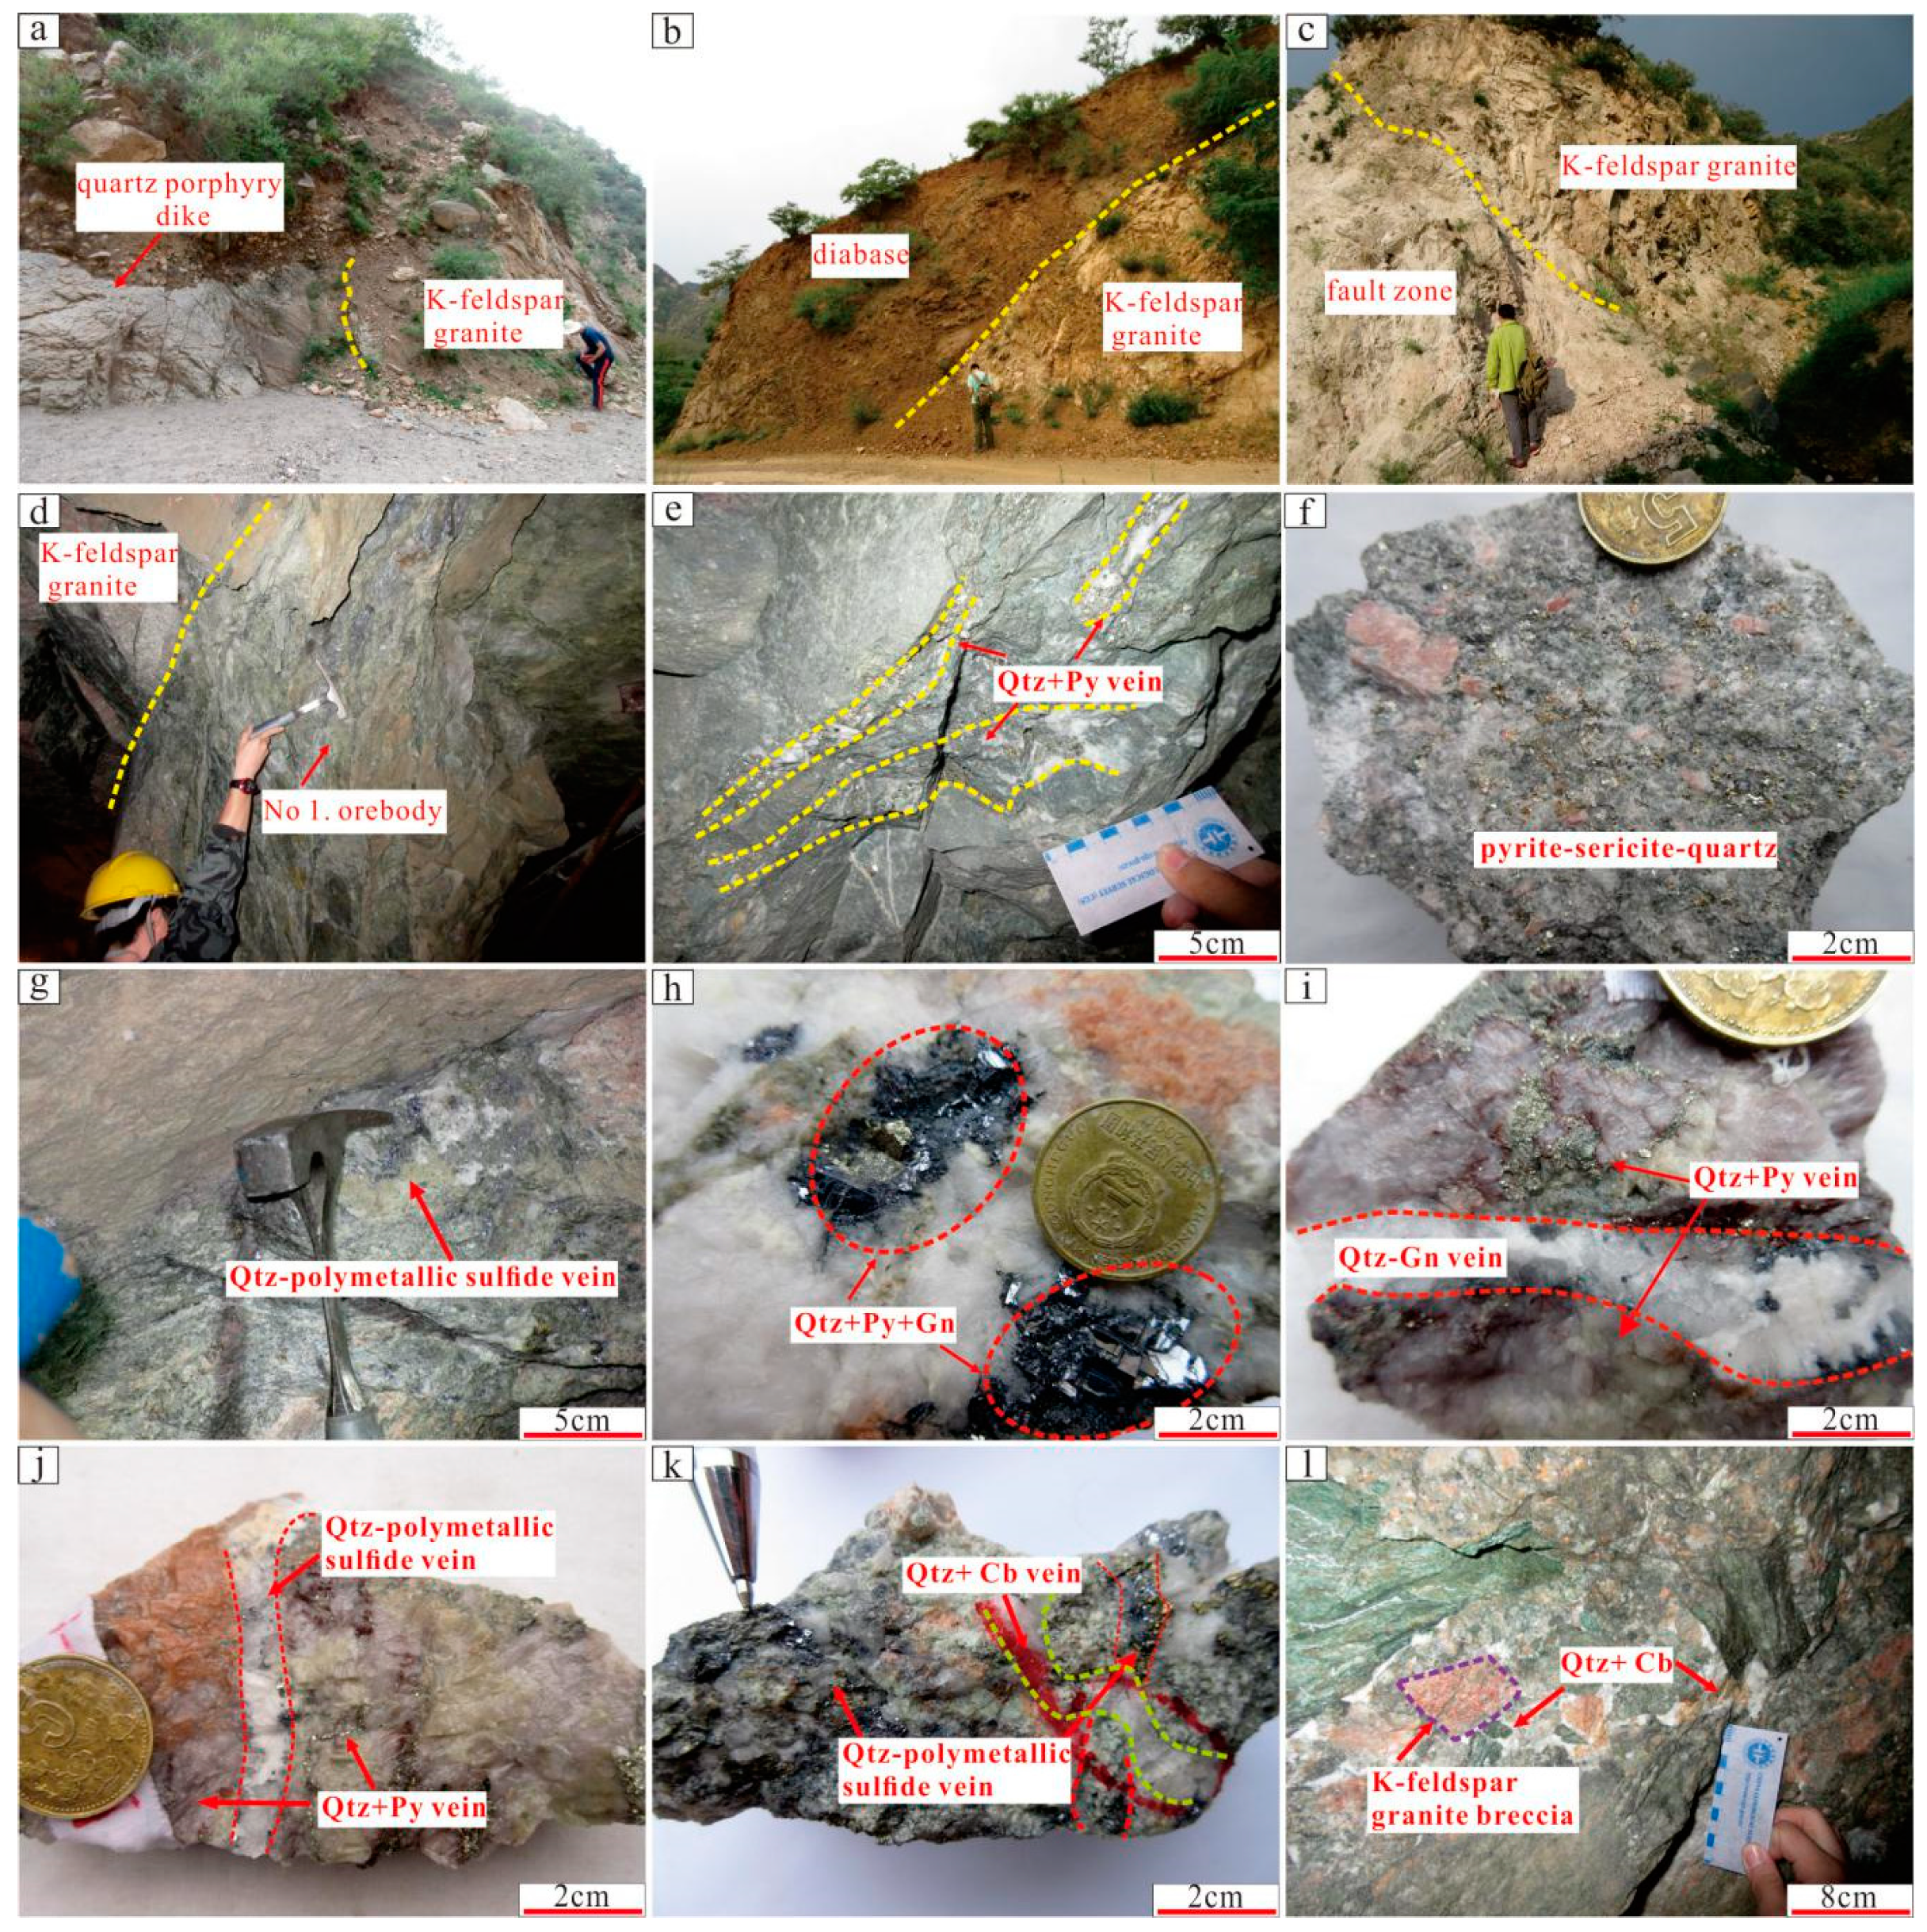
3.3. Igneous Rocks
3.4. Orebodies and Ores
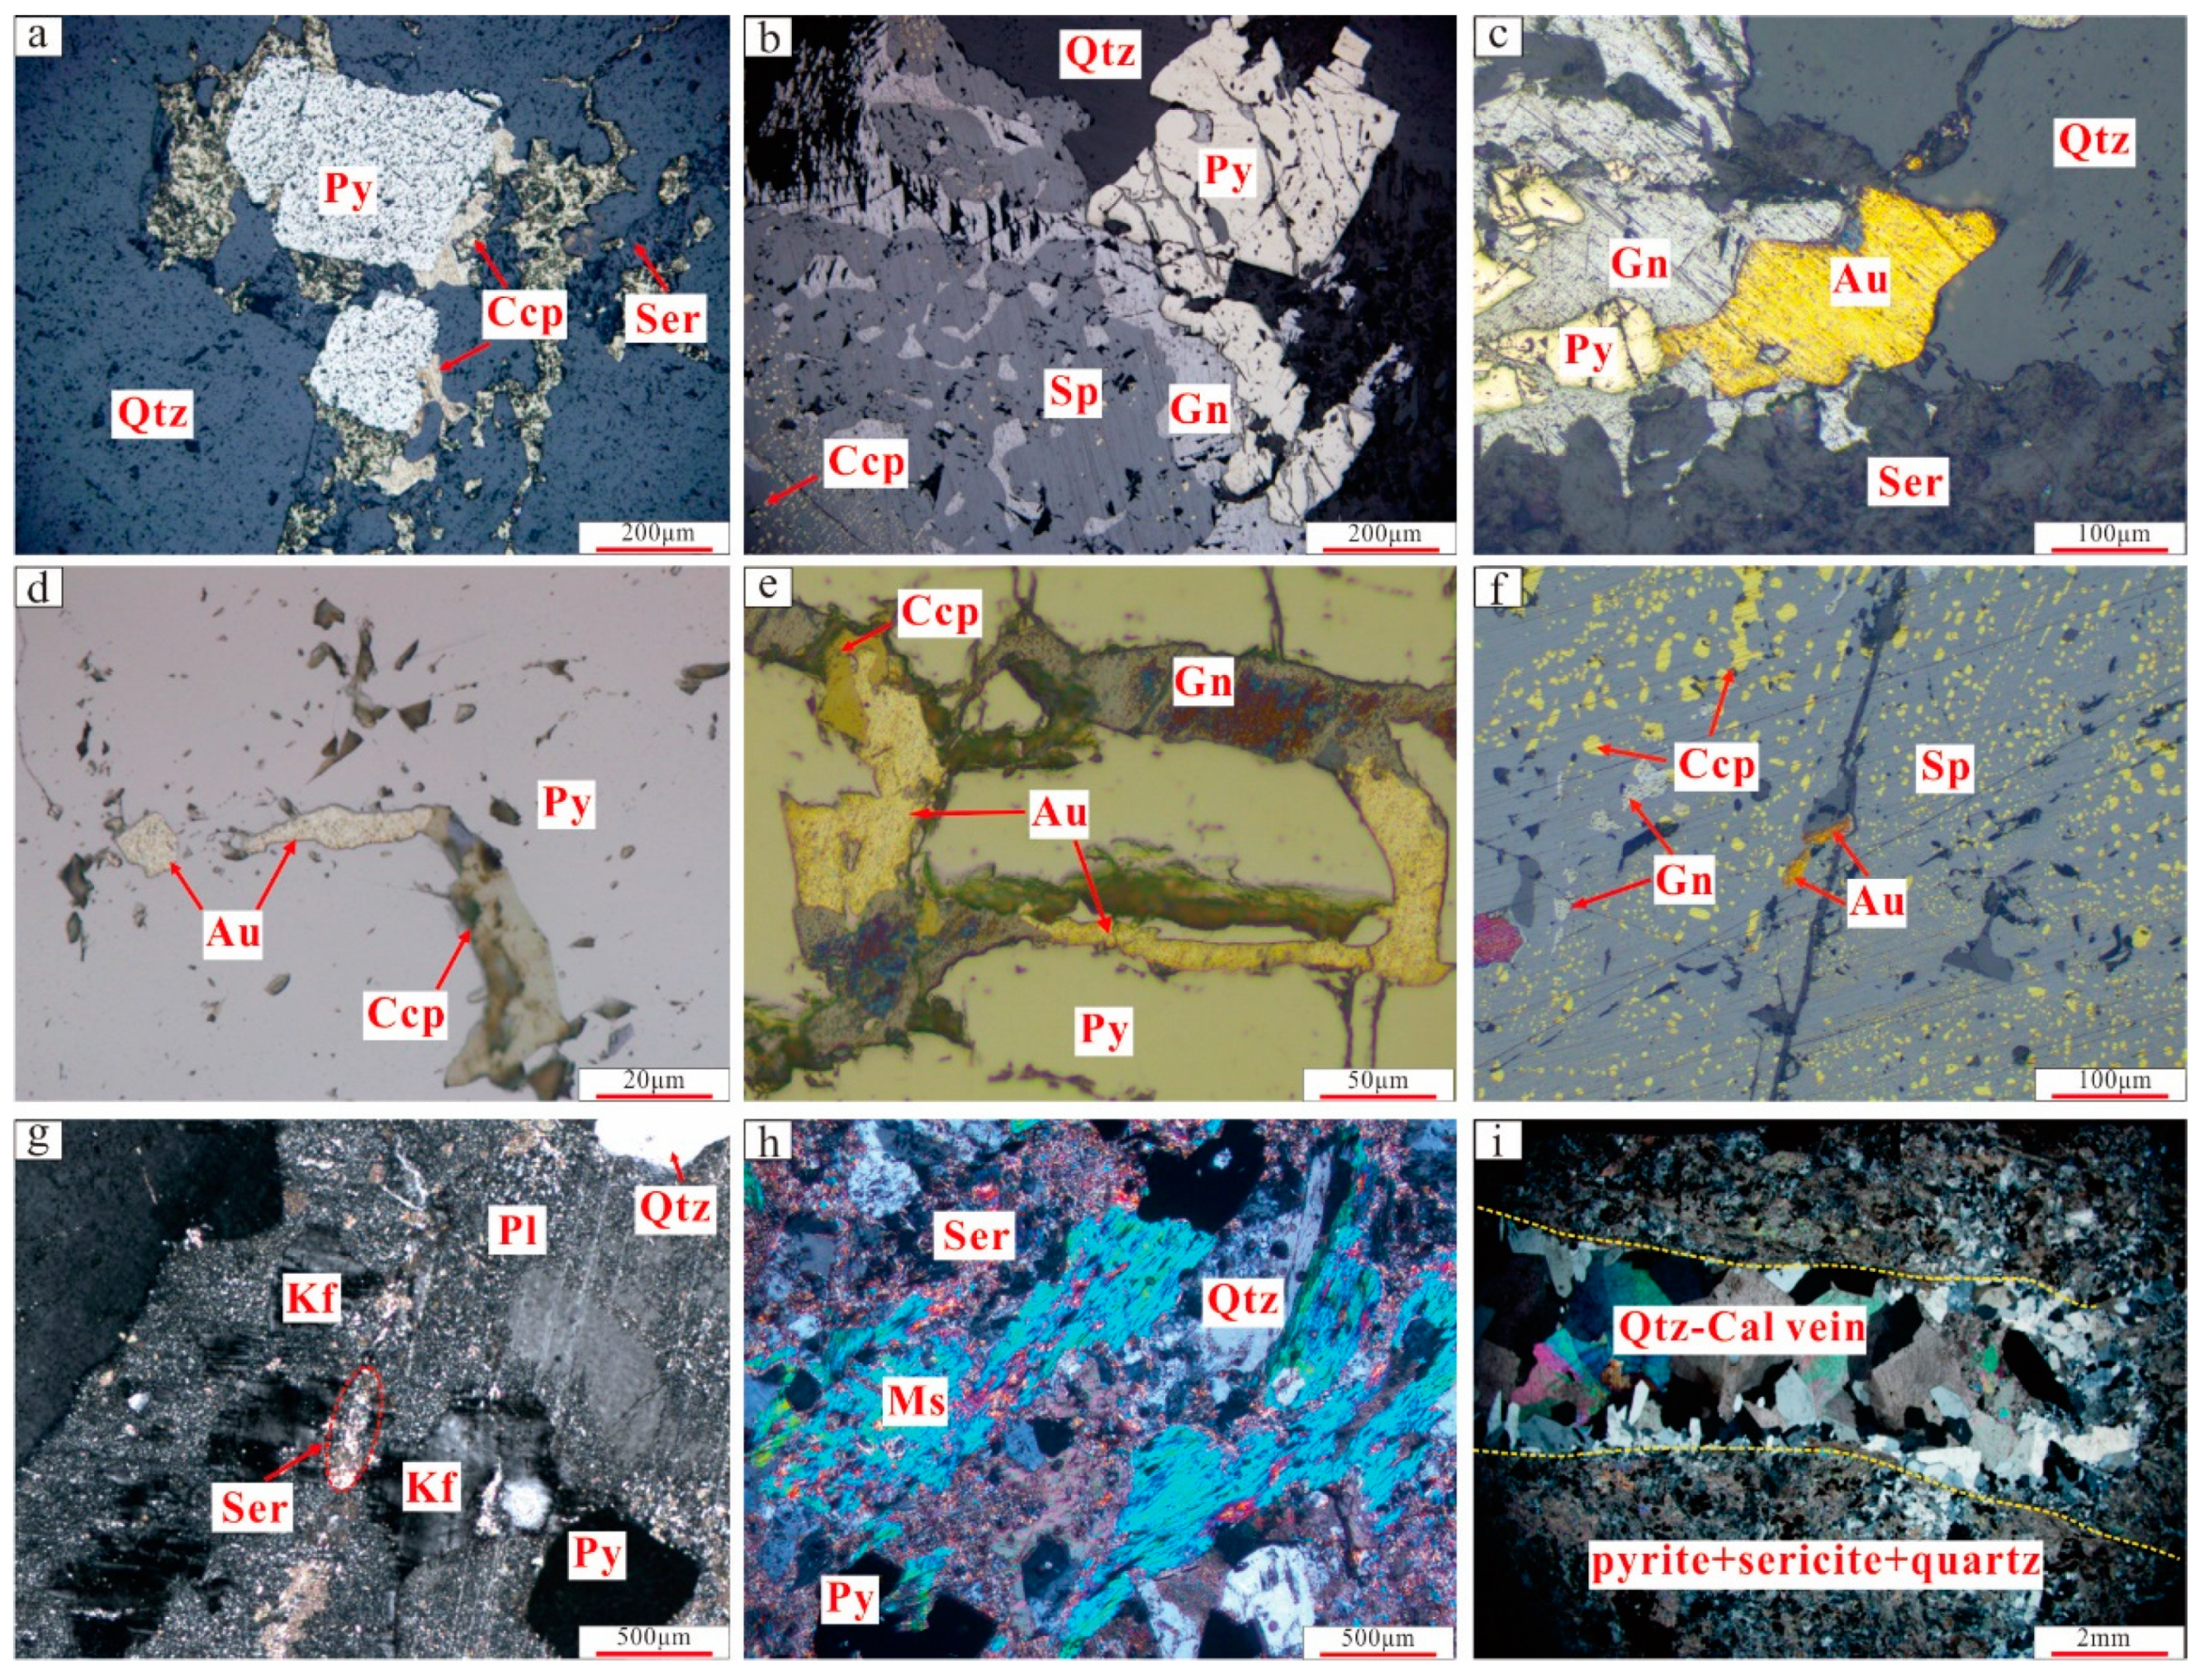
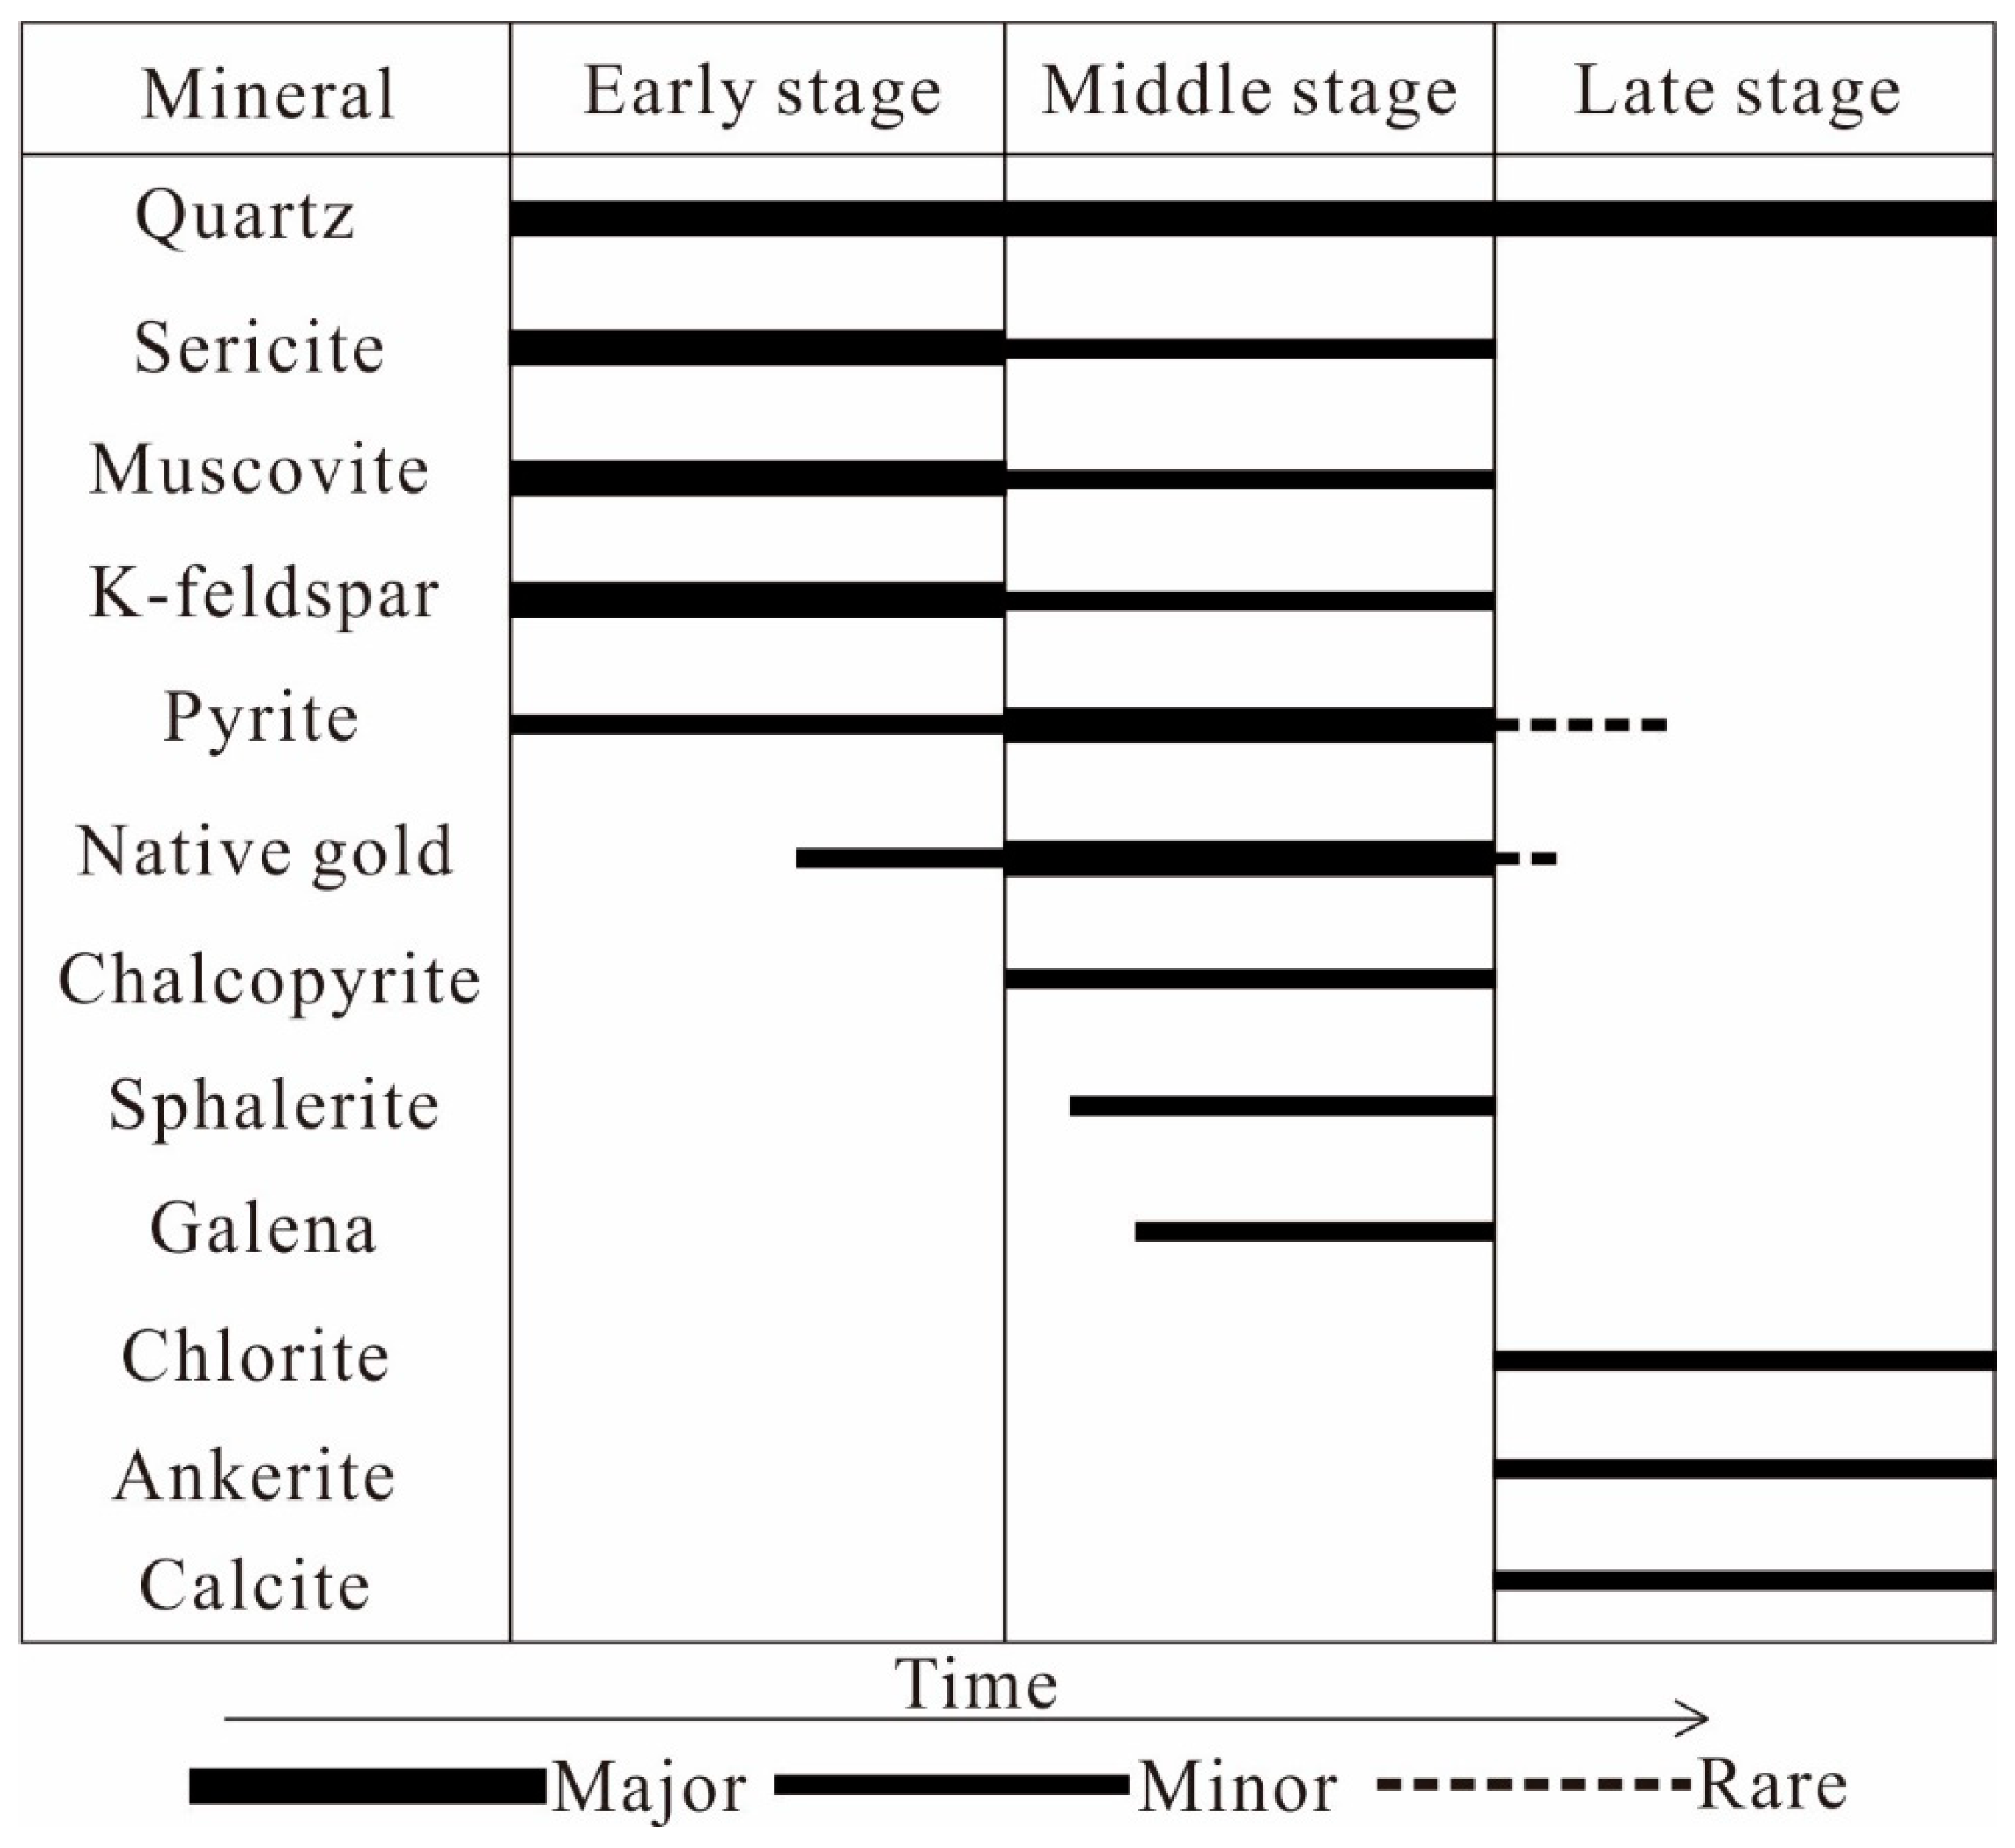
3.5. Hydrothermal Alteration and Mineralization Stages
3.5.1. Quartz–Pyrite Stage (Early Stage)
3.5.2. Quartz–Polymetallic Sulfide Stage (Middle Stage)
3.5.3. Quartz–Carbonate Stage (Late Stage)
4. Samples and Methods
4.1. Fluid Inclusion Microthermometry
4.2. H-O-S Isotope Analysis
5. Results
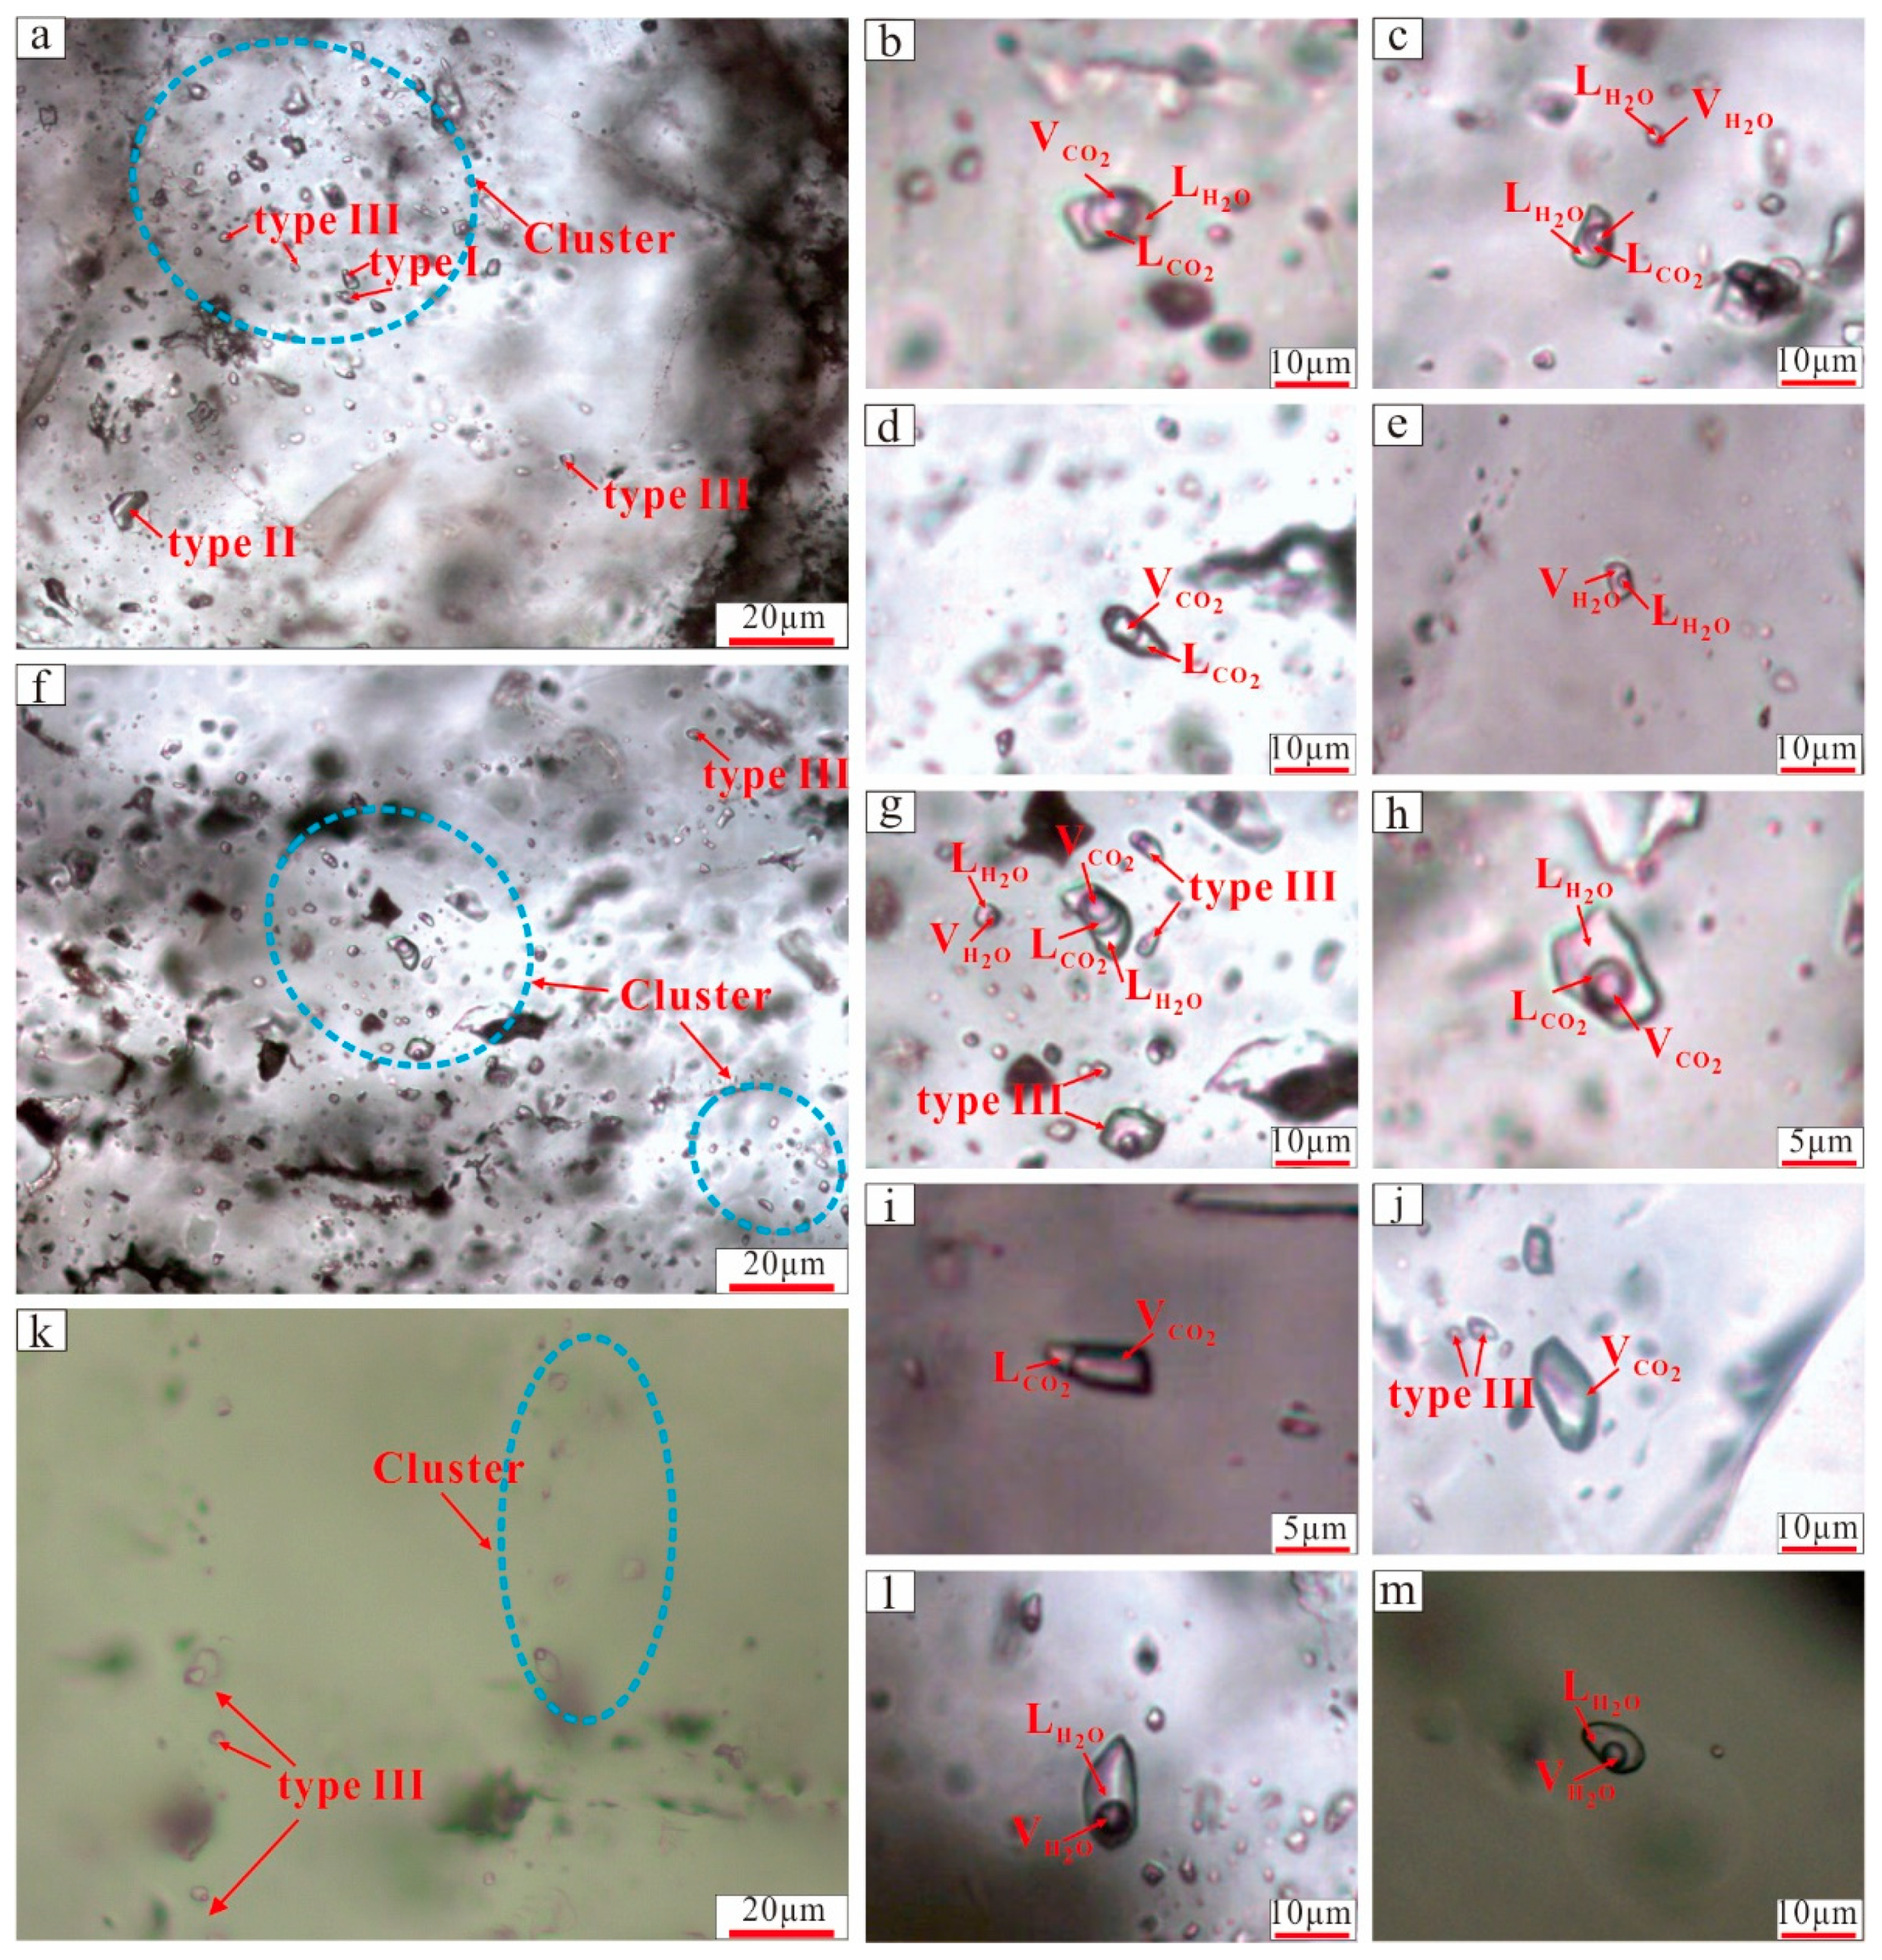
5.1. Fluid Inclusion Petrography
5.1.1. Type I
5.1.2. Type II
5.1.3. Type III
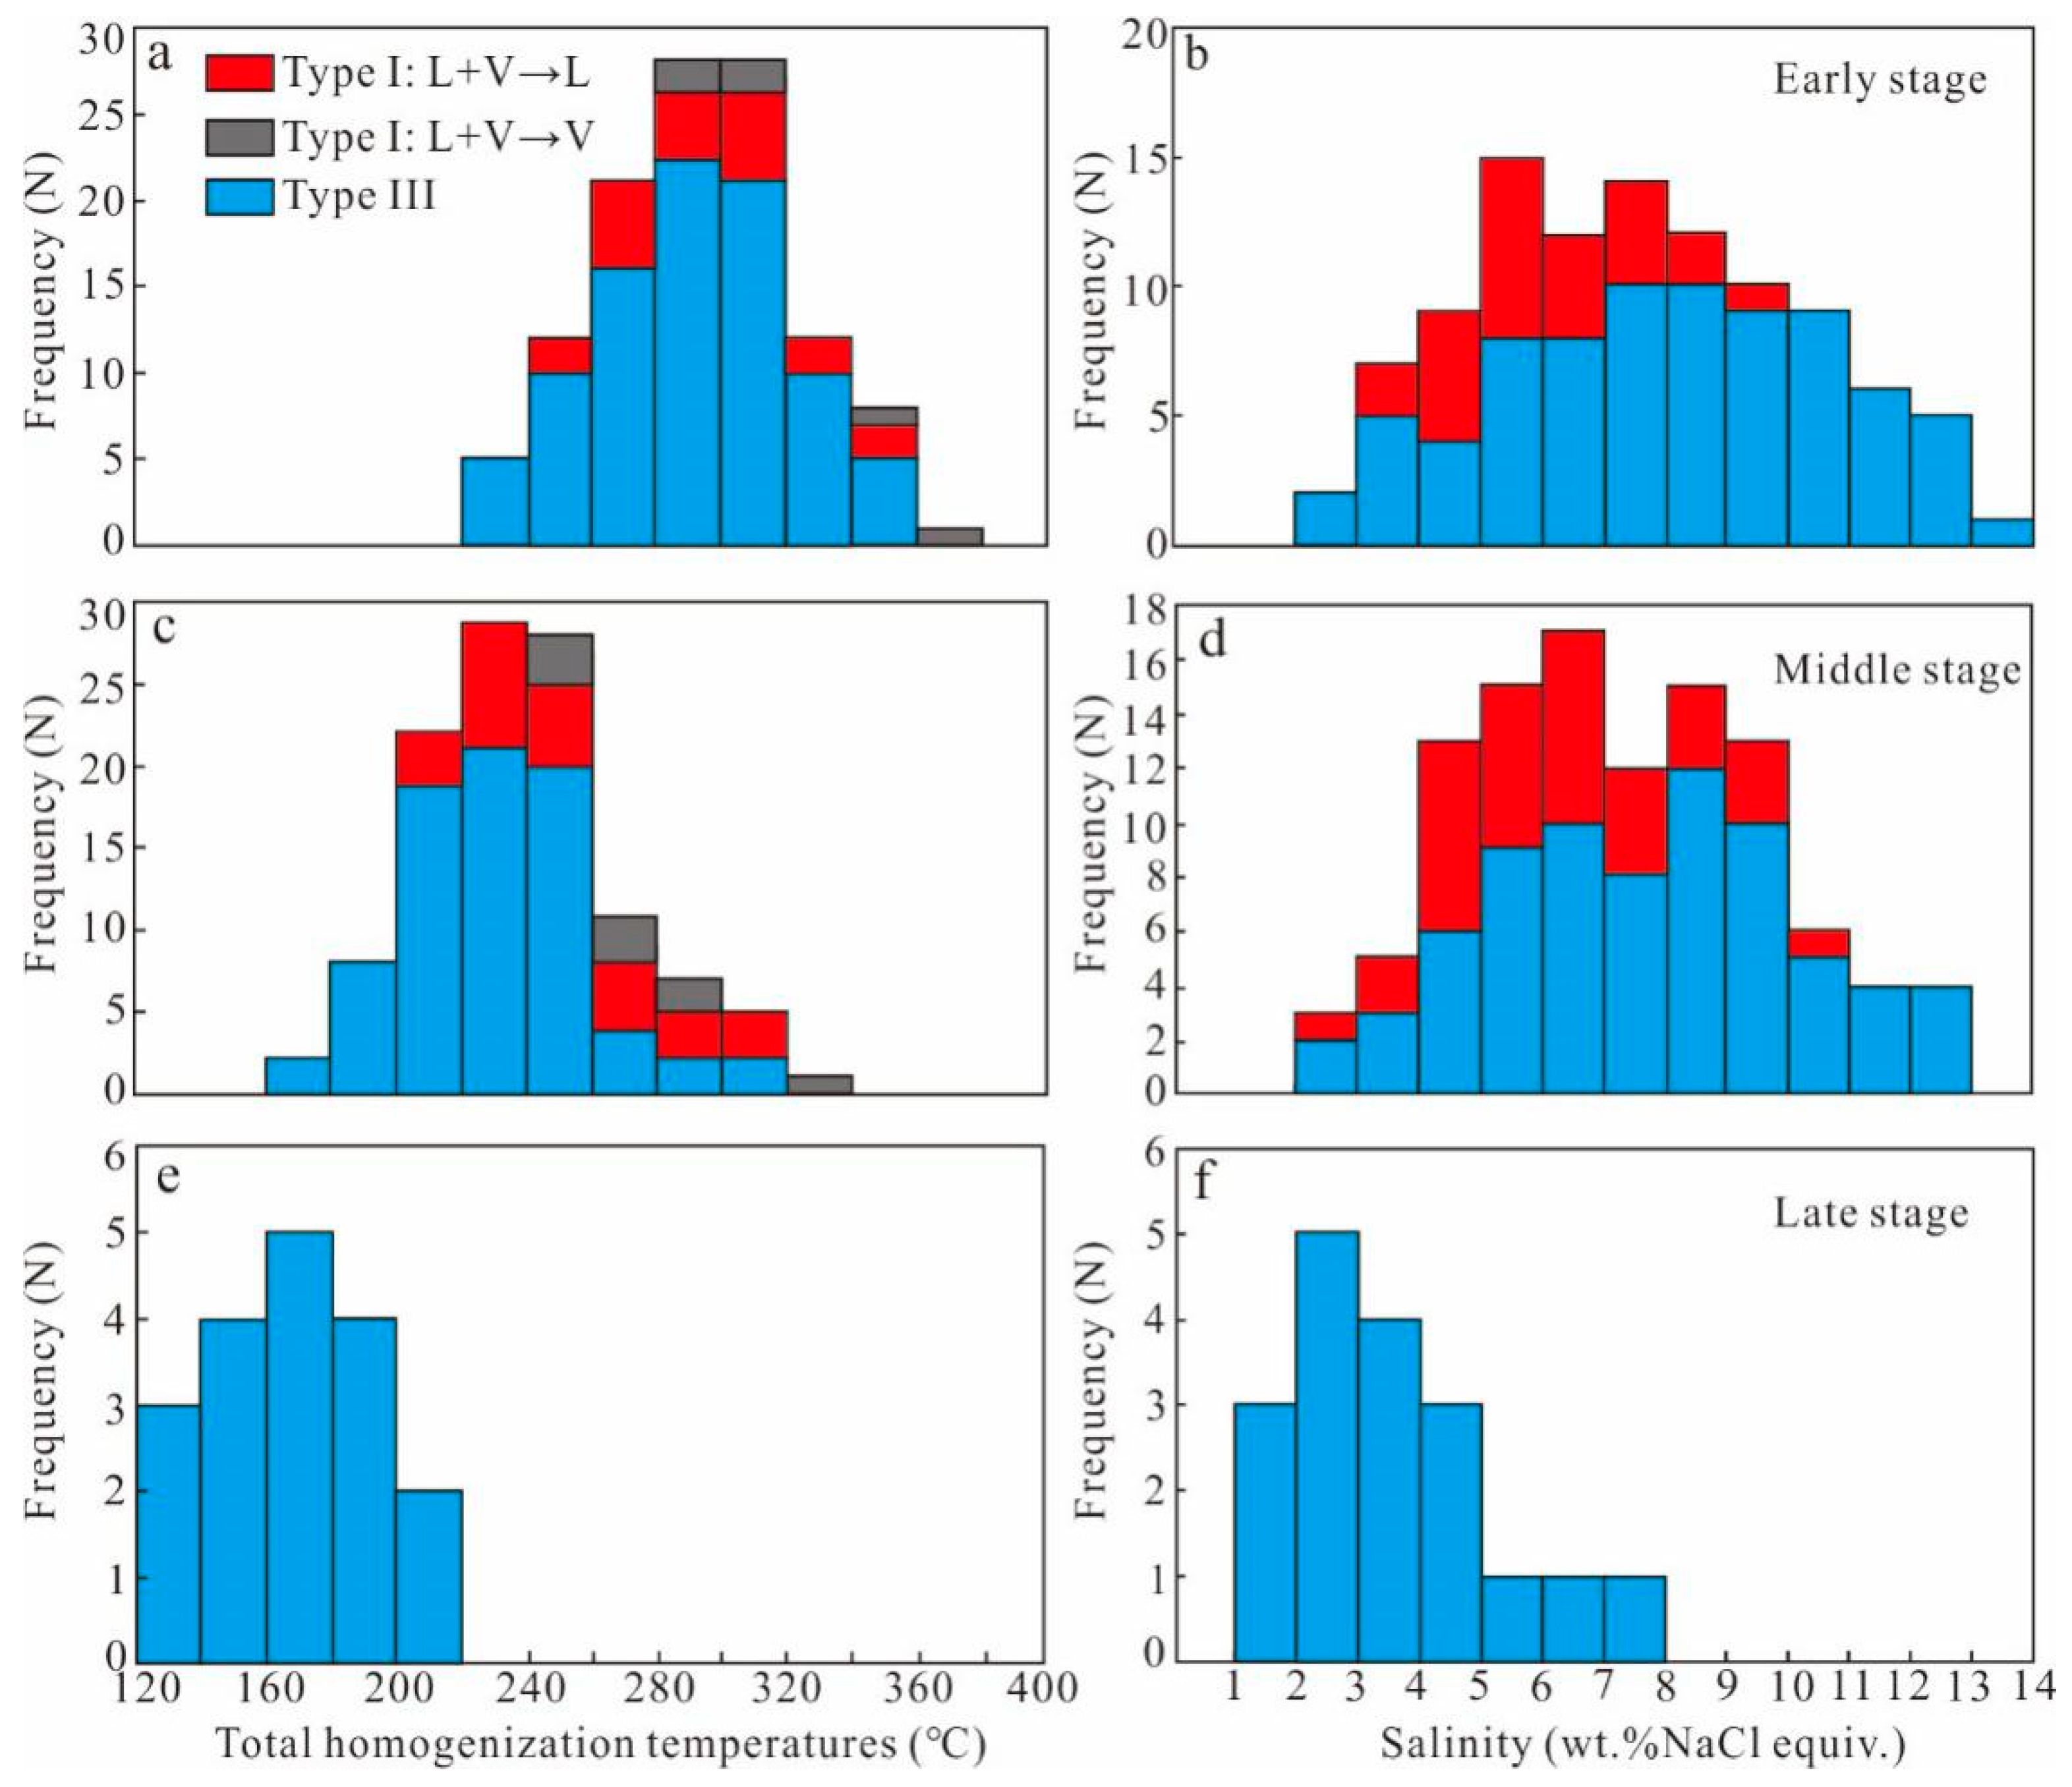
5.2. Microthermometry
5.2.1. Early Stage
5.2.2. Middle Stage
5.2.3. Late Stage
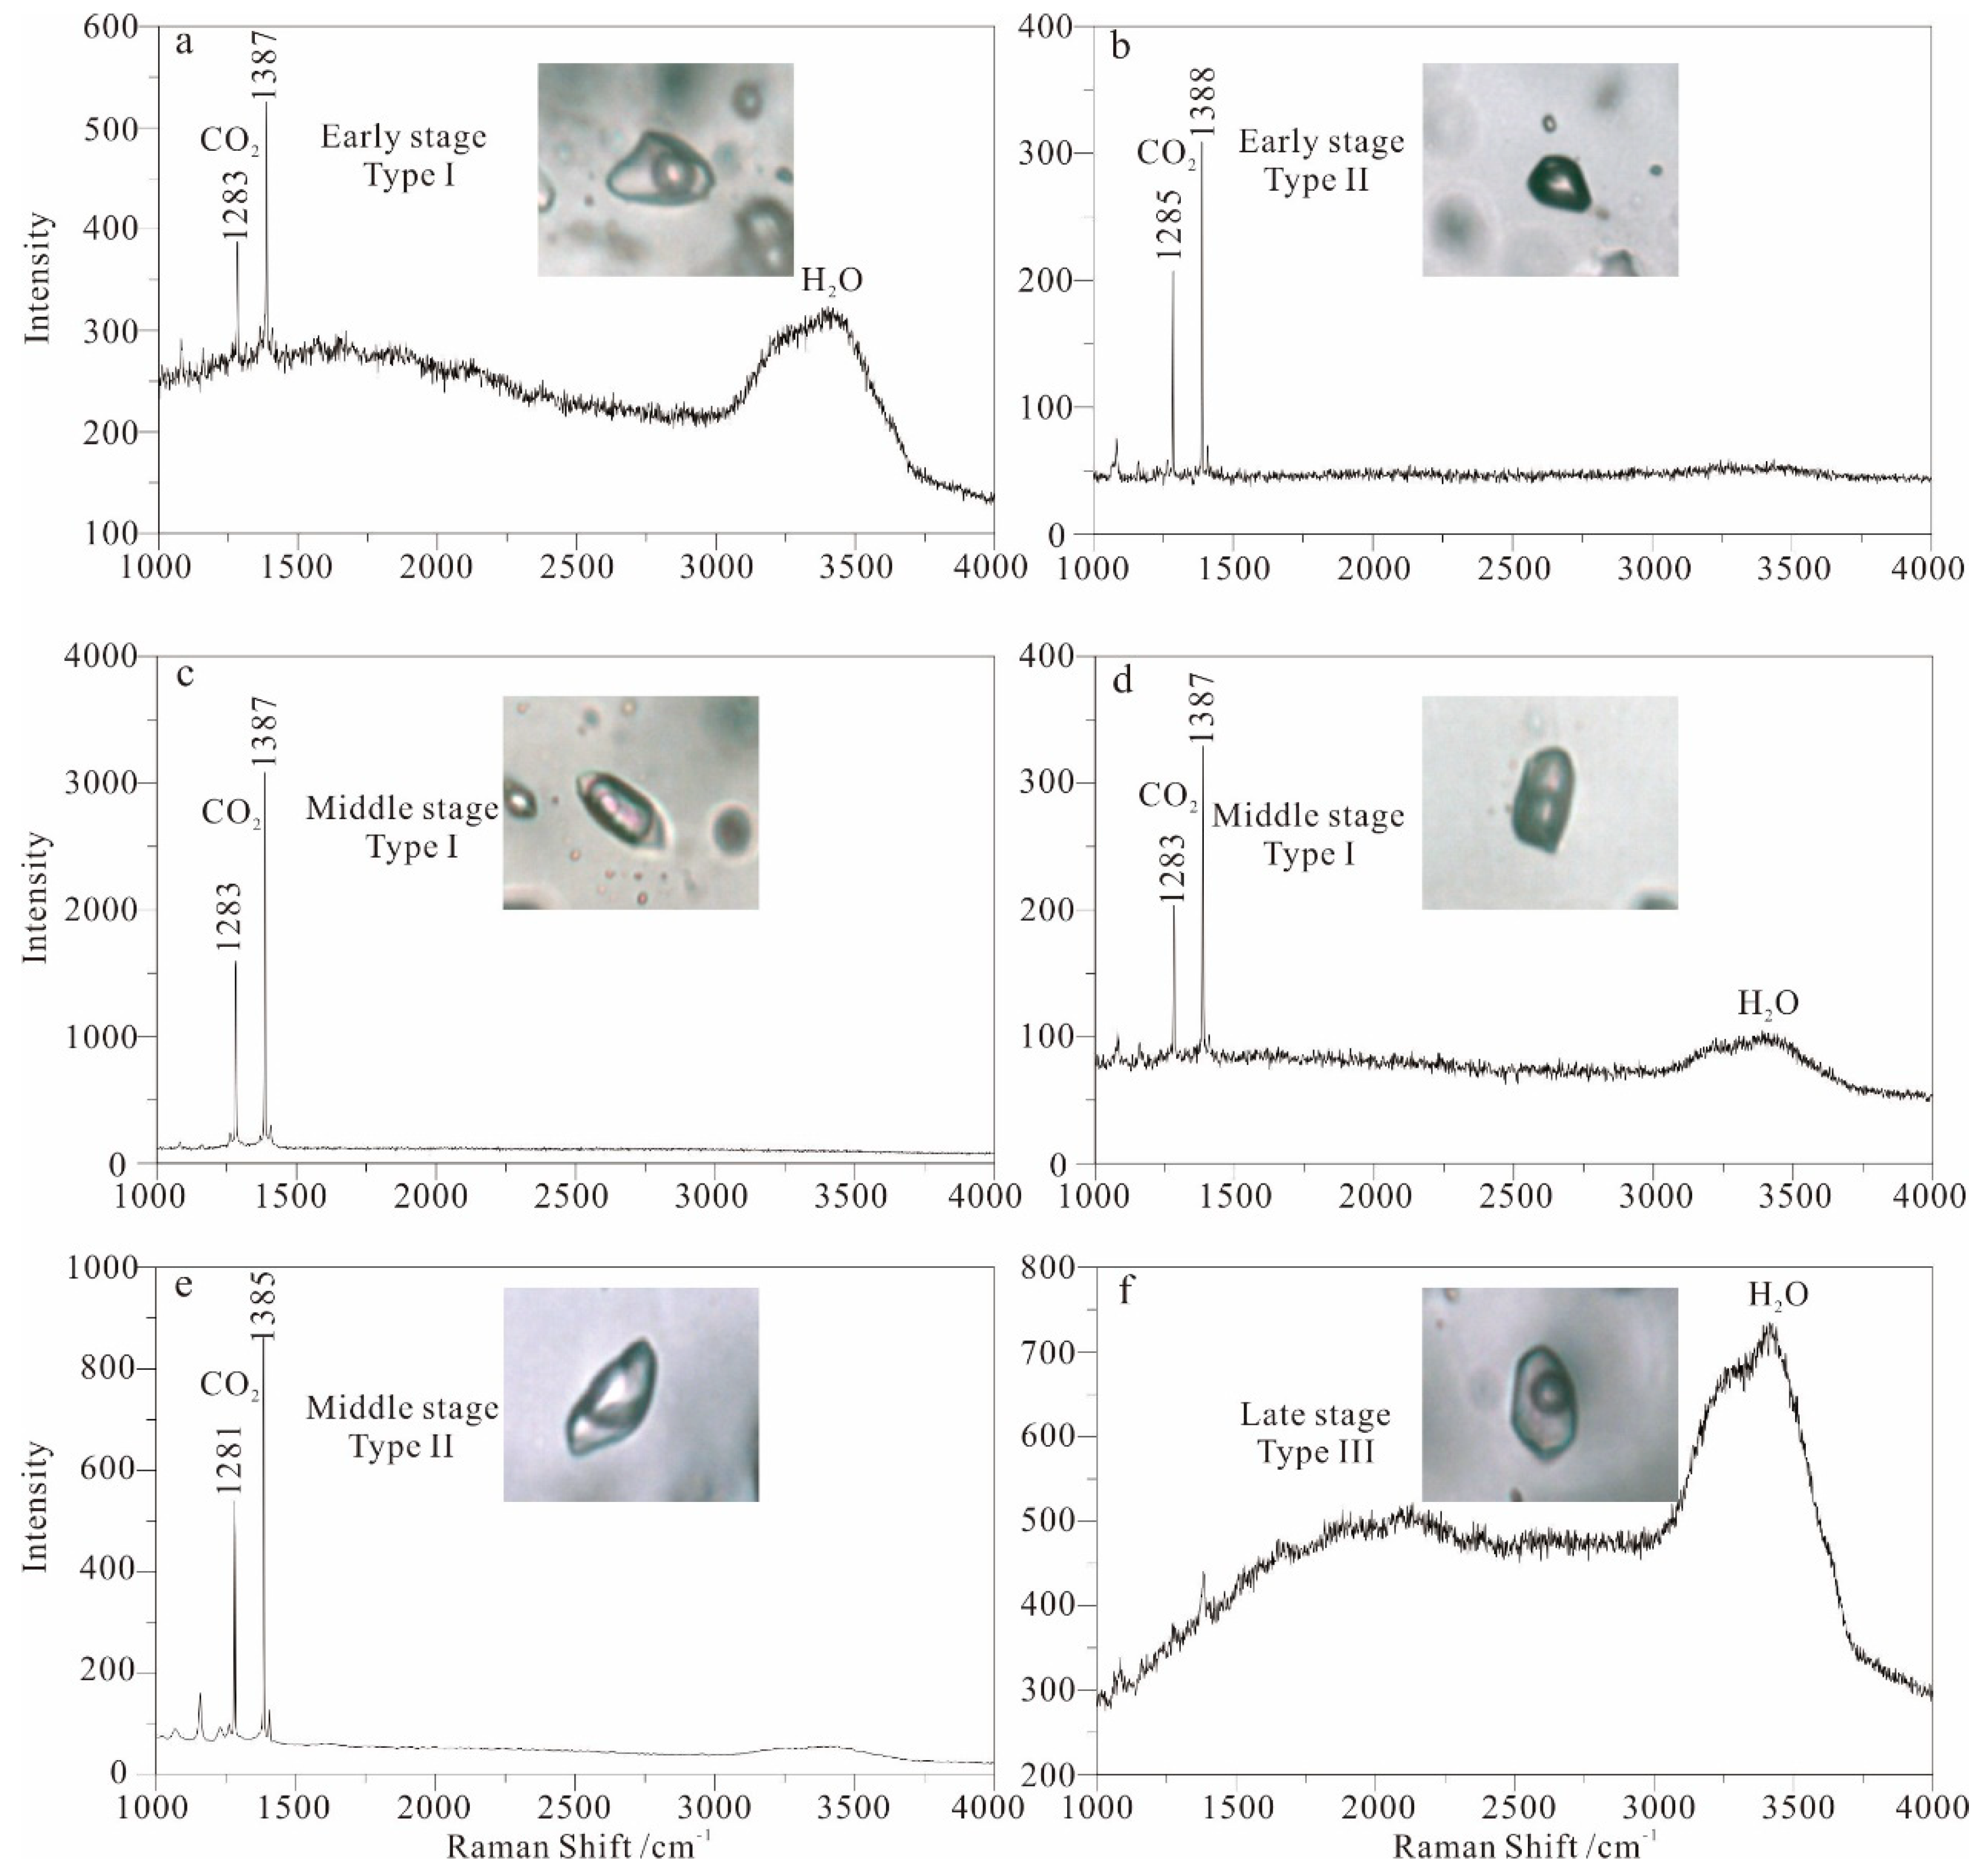
5.3. Laser Raman Spectroscopy
5.4. Stable Isotope Studies
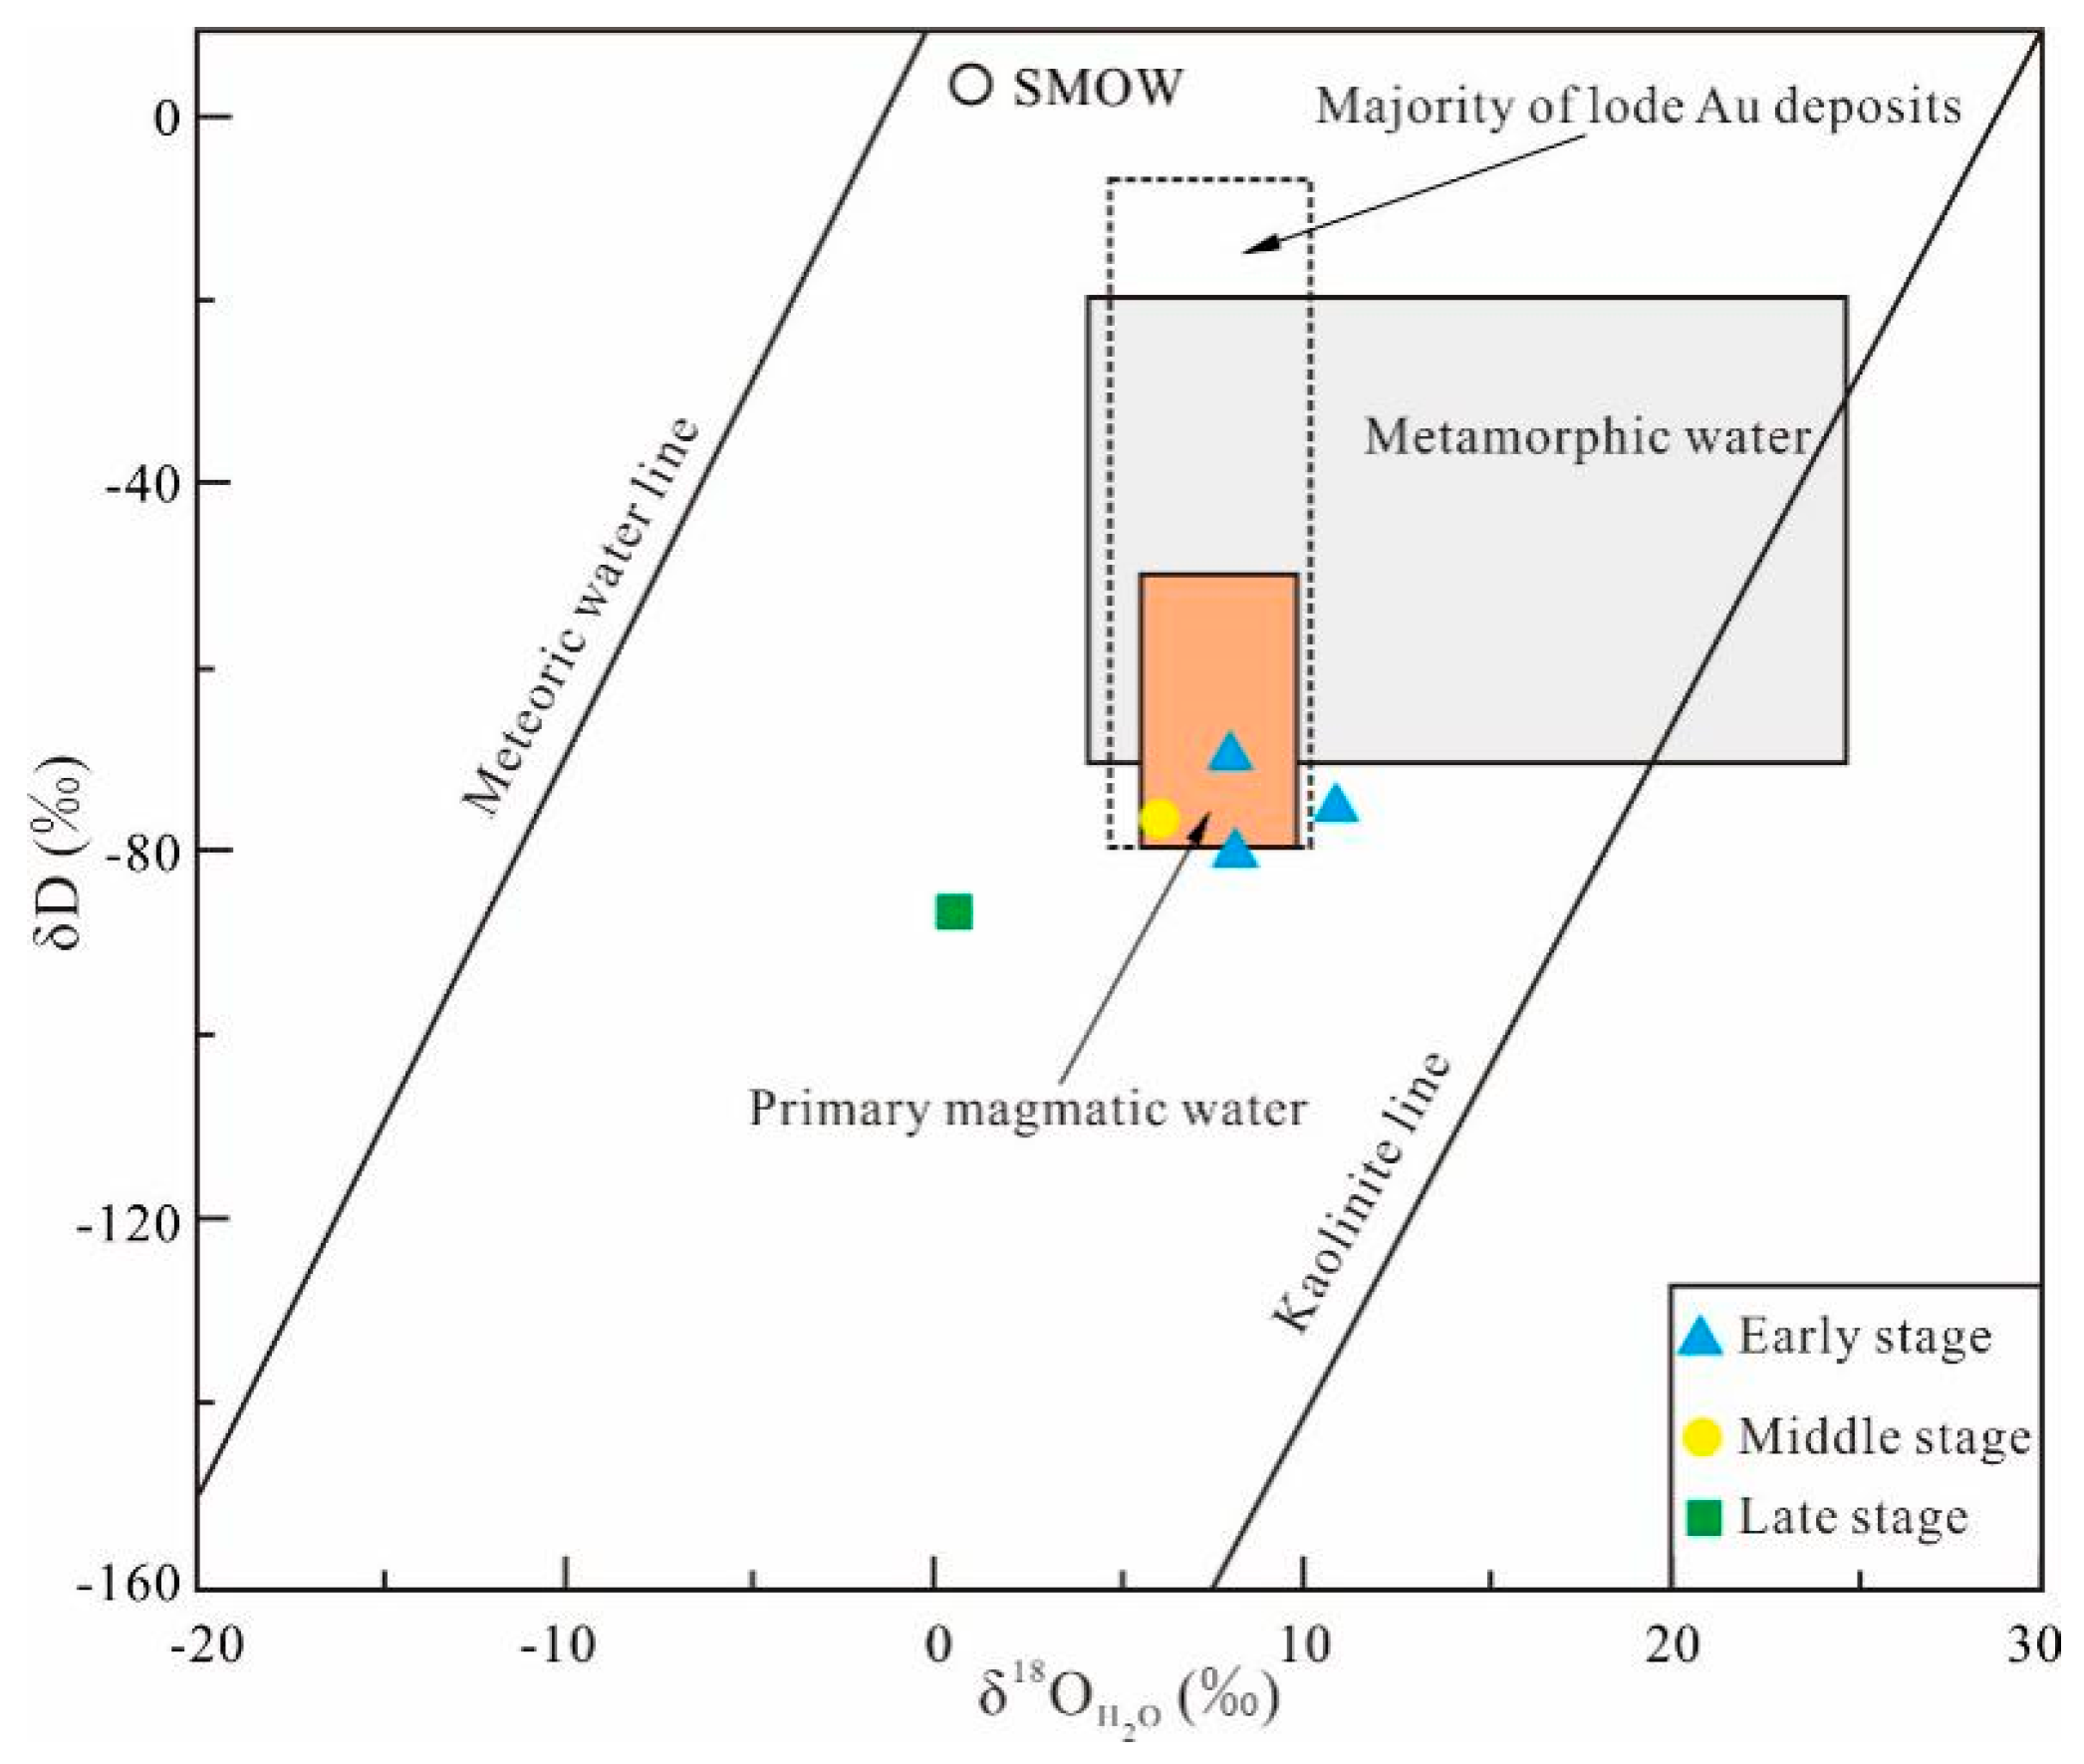
5.4.1. Hydrogen and Oxygen
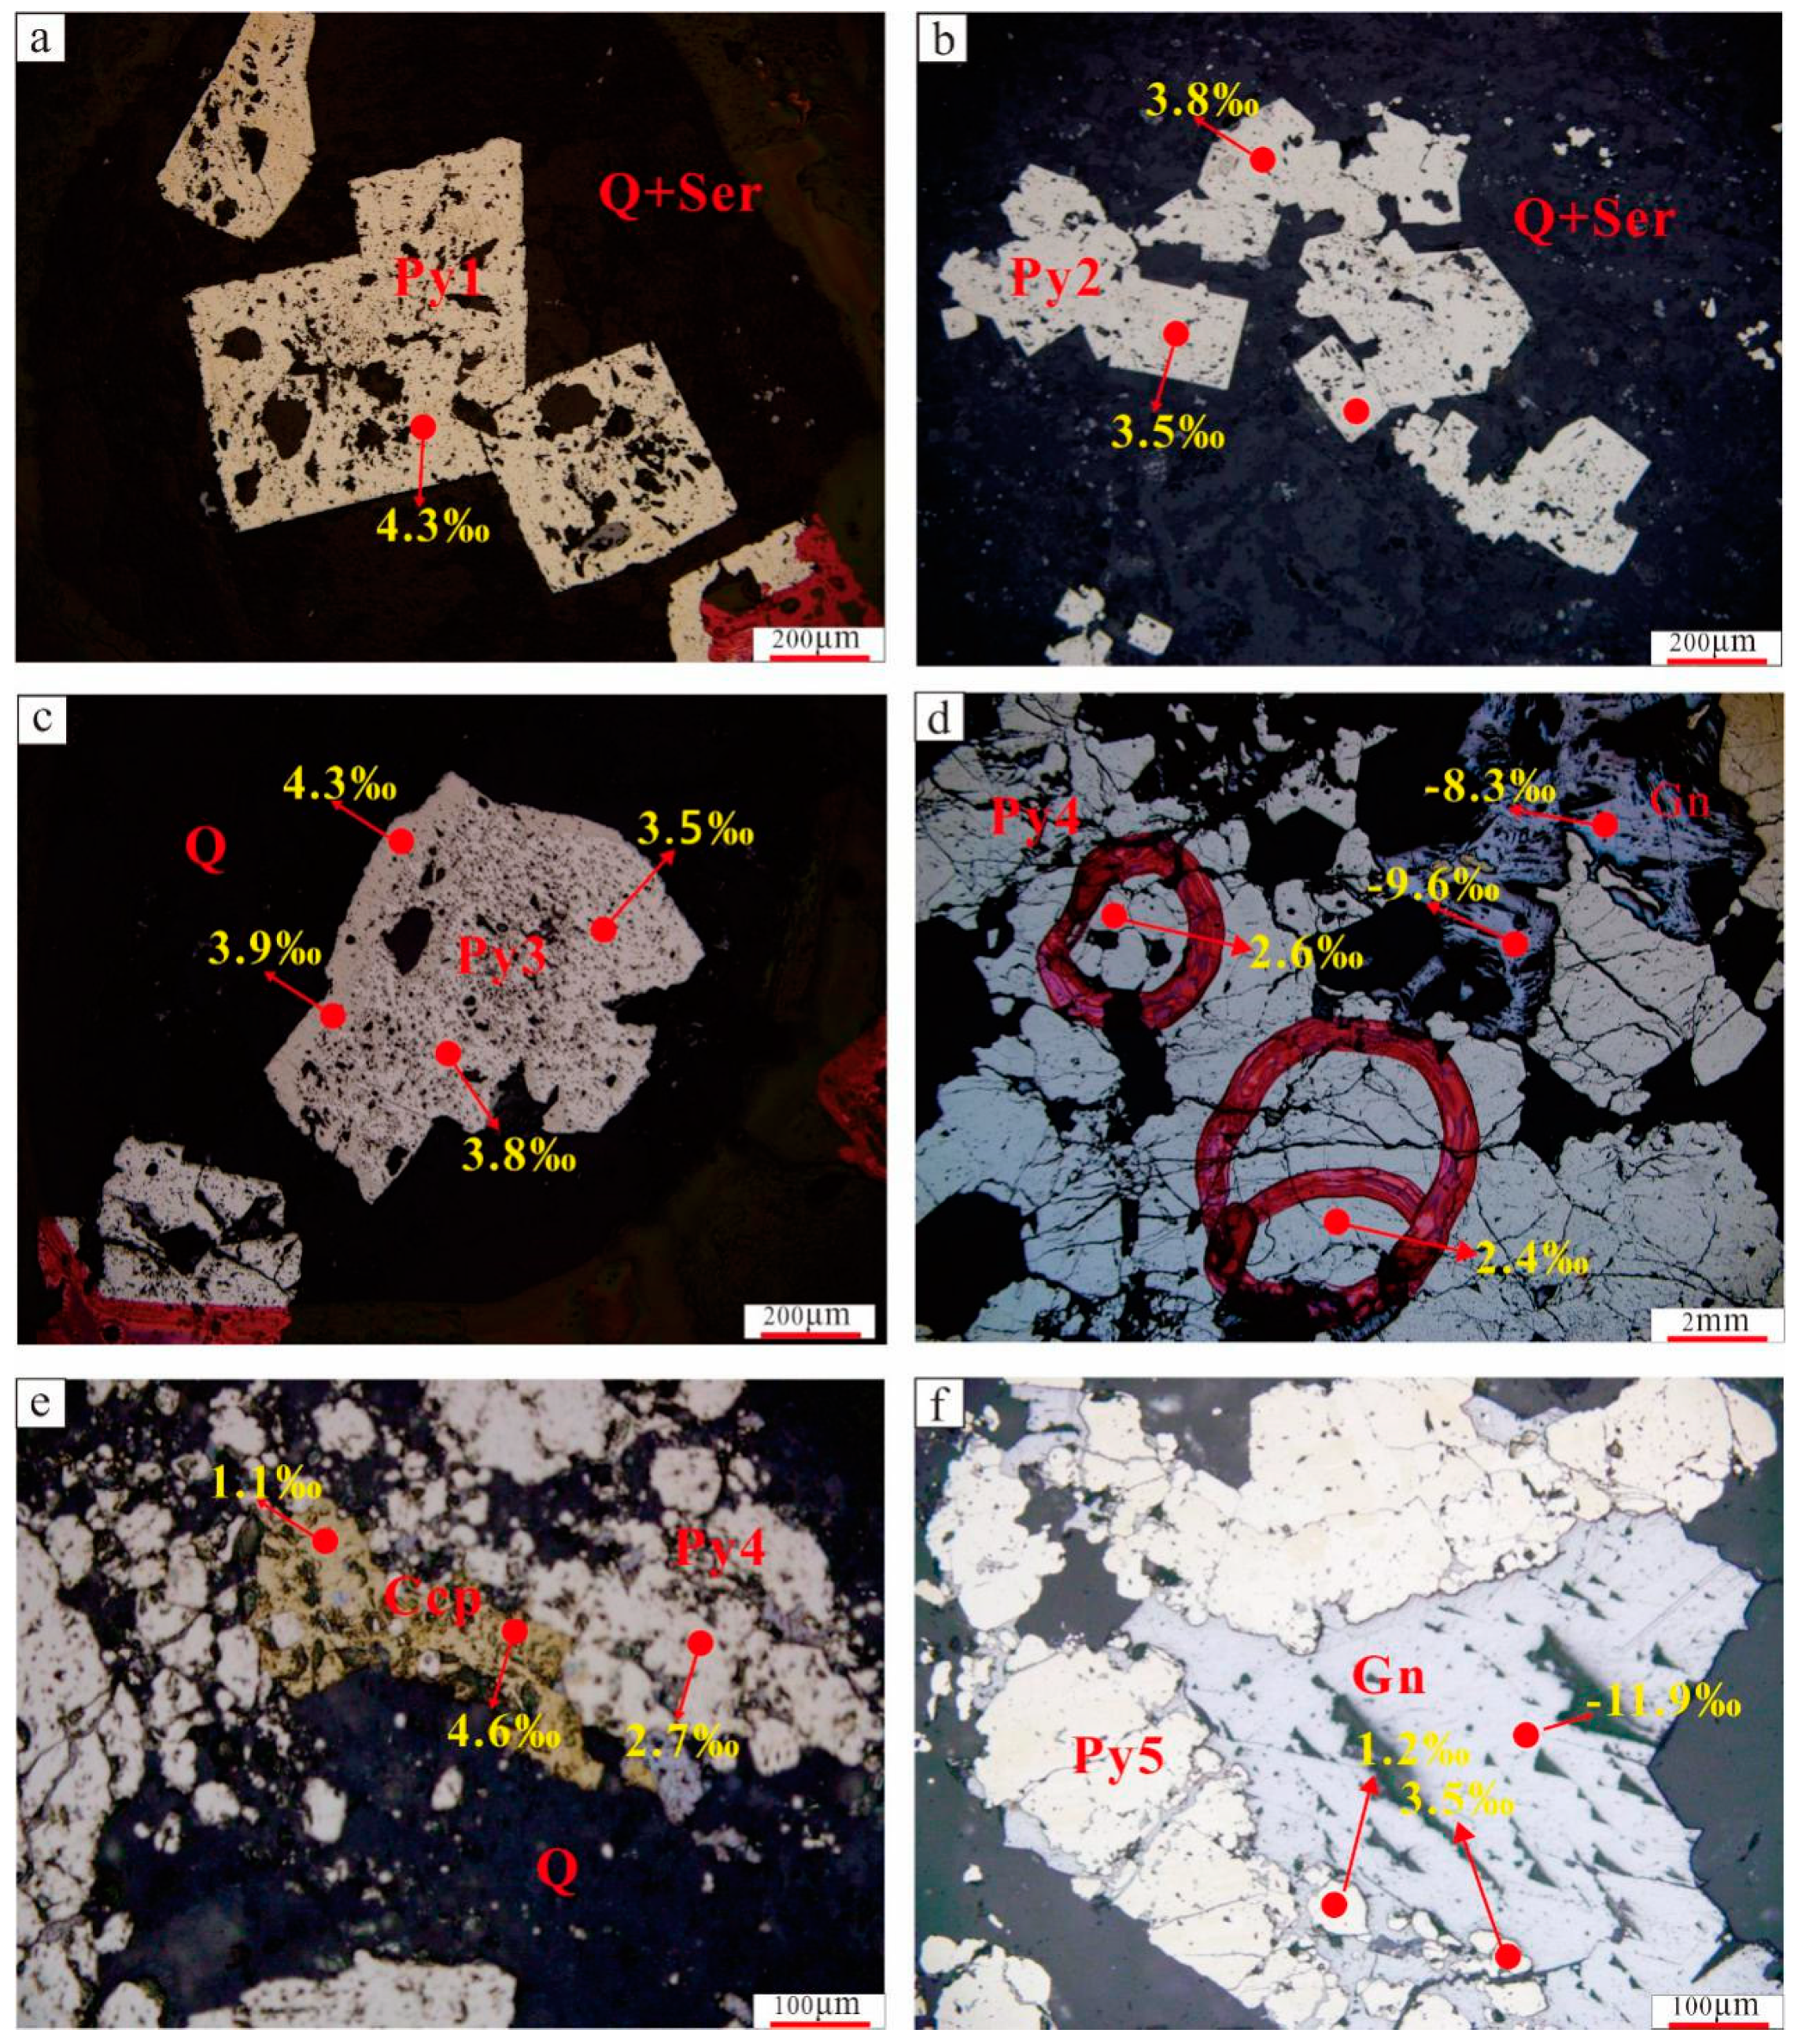
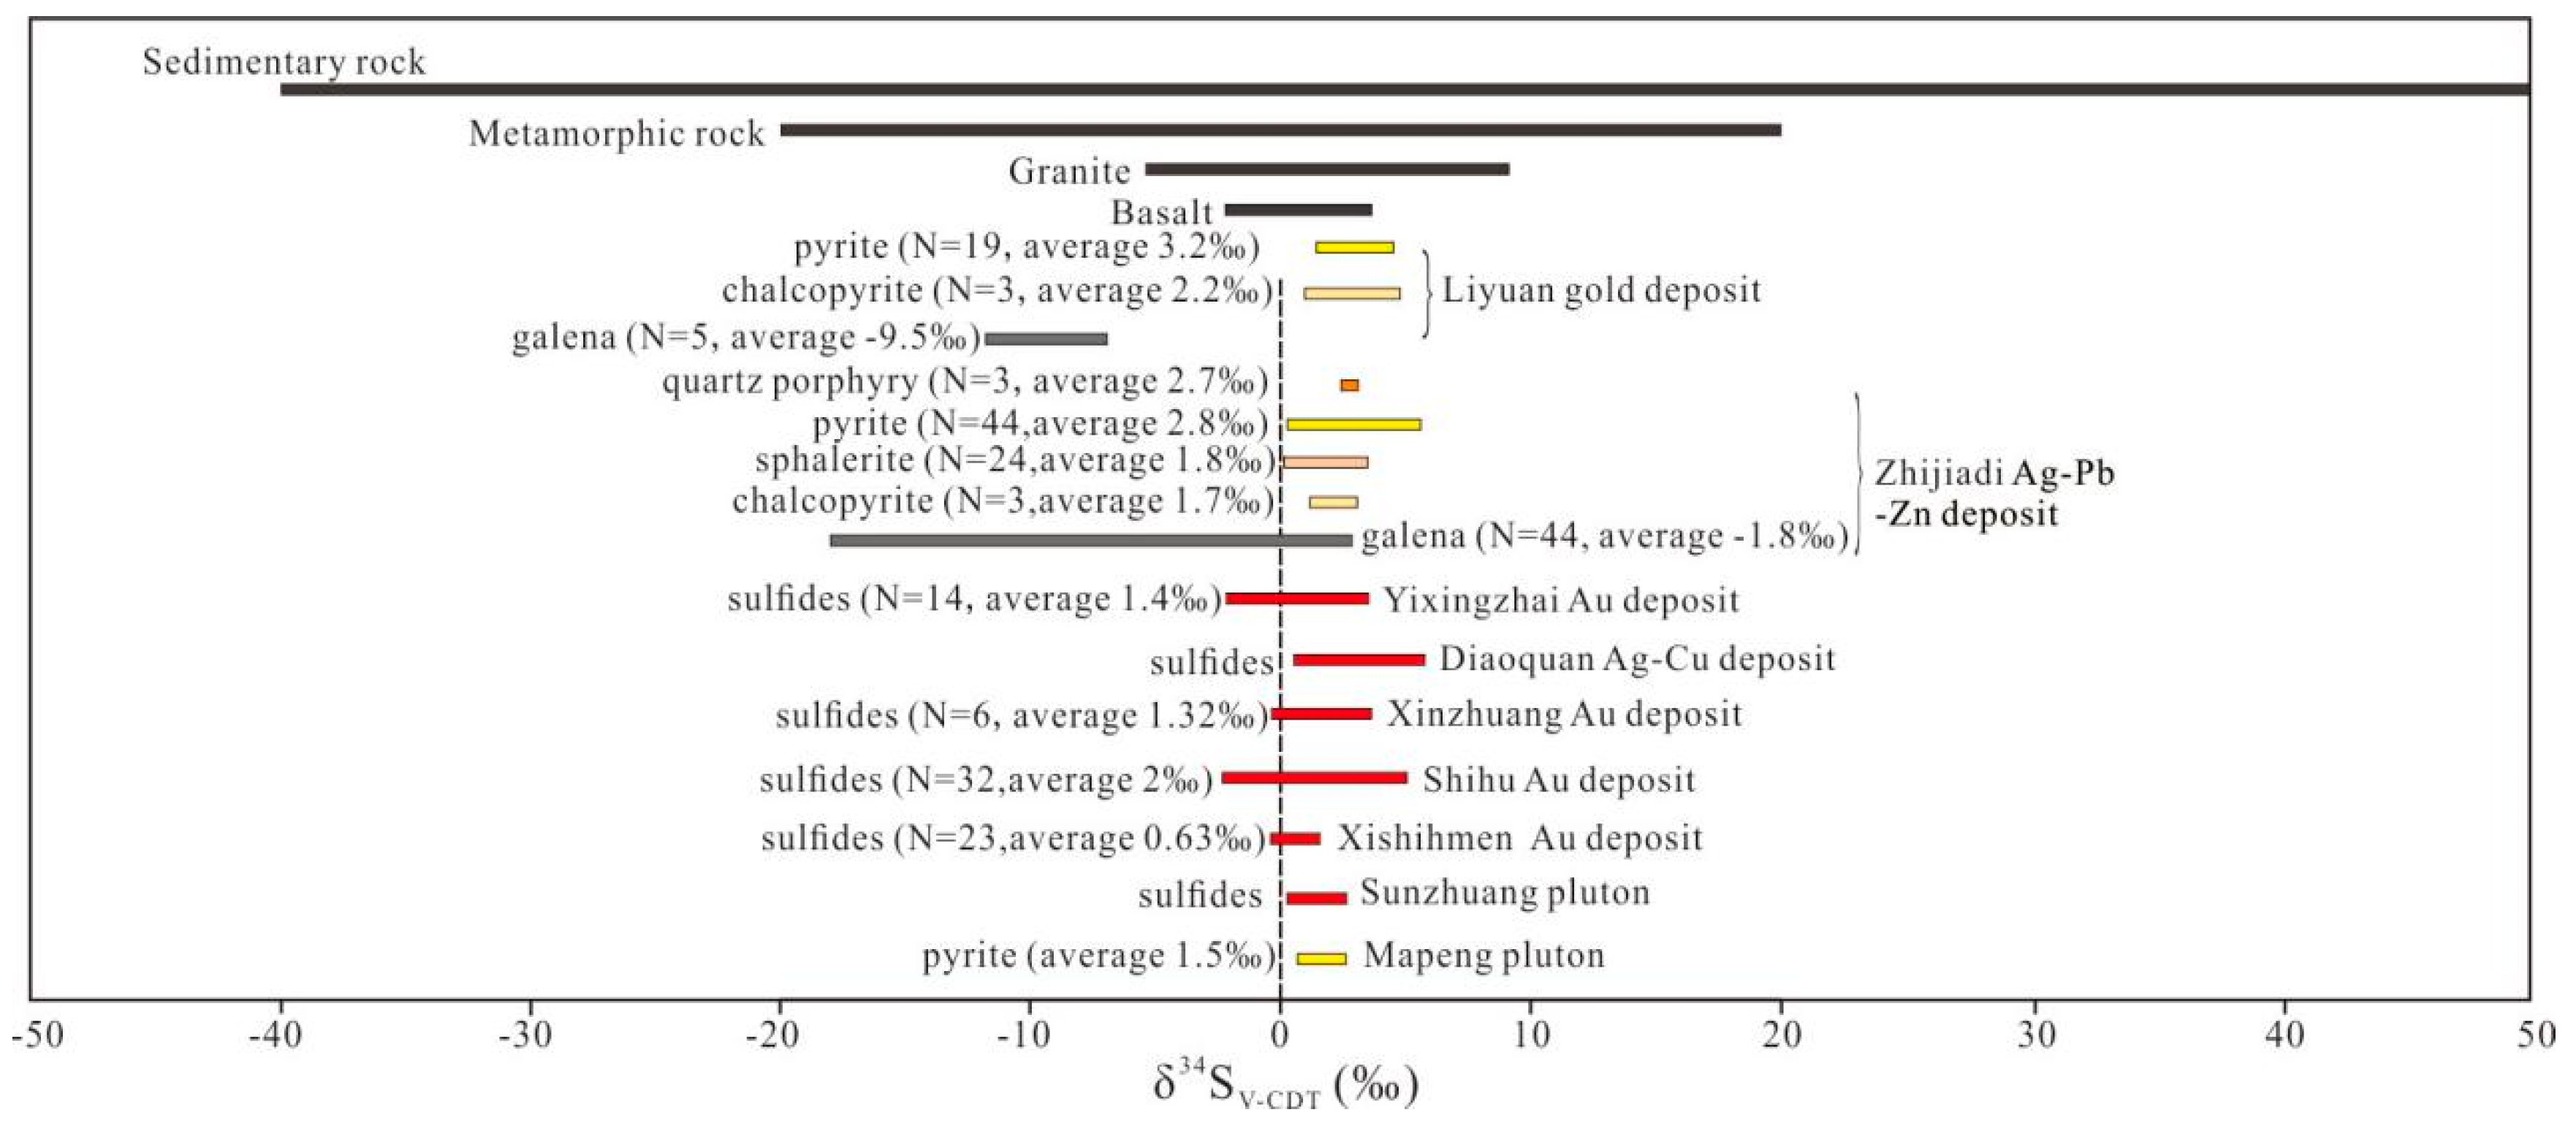
5.4.2. Sulfur Isotopes
6. Discussion
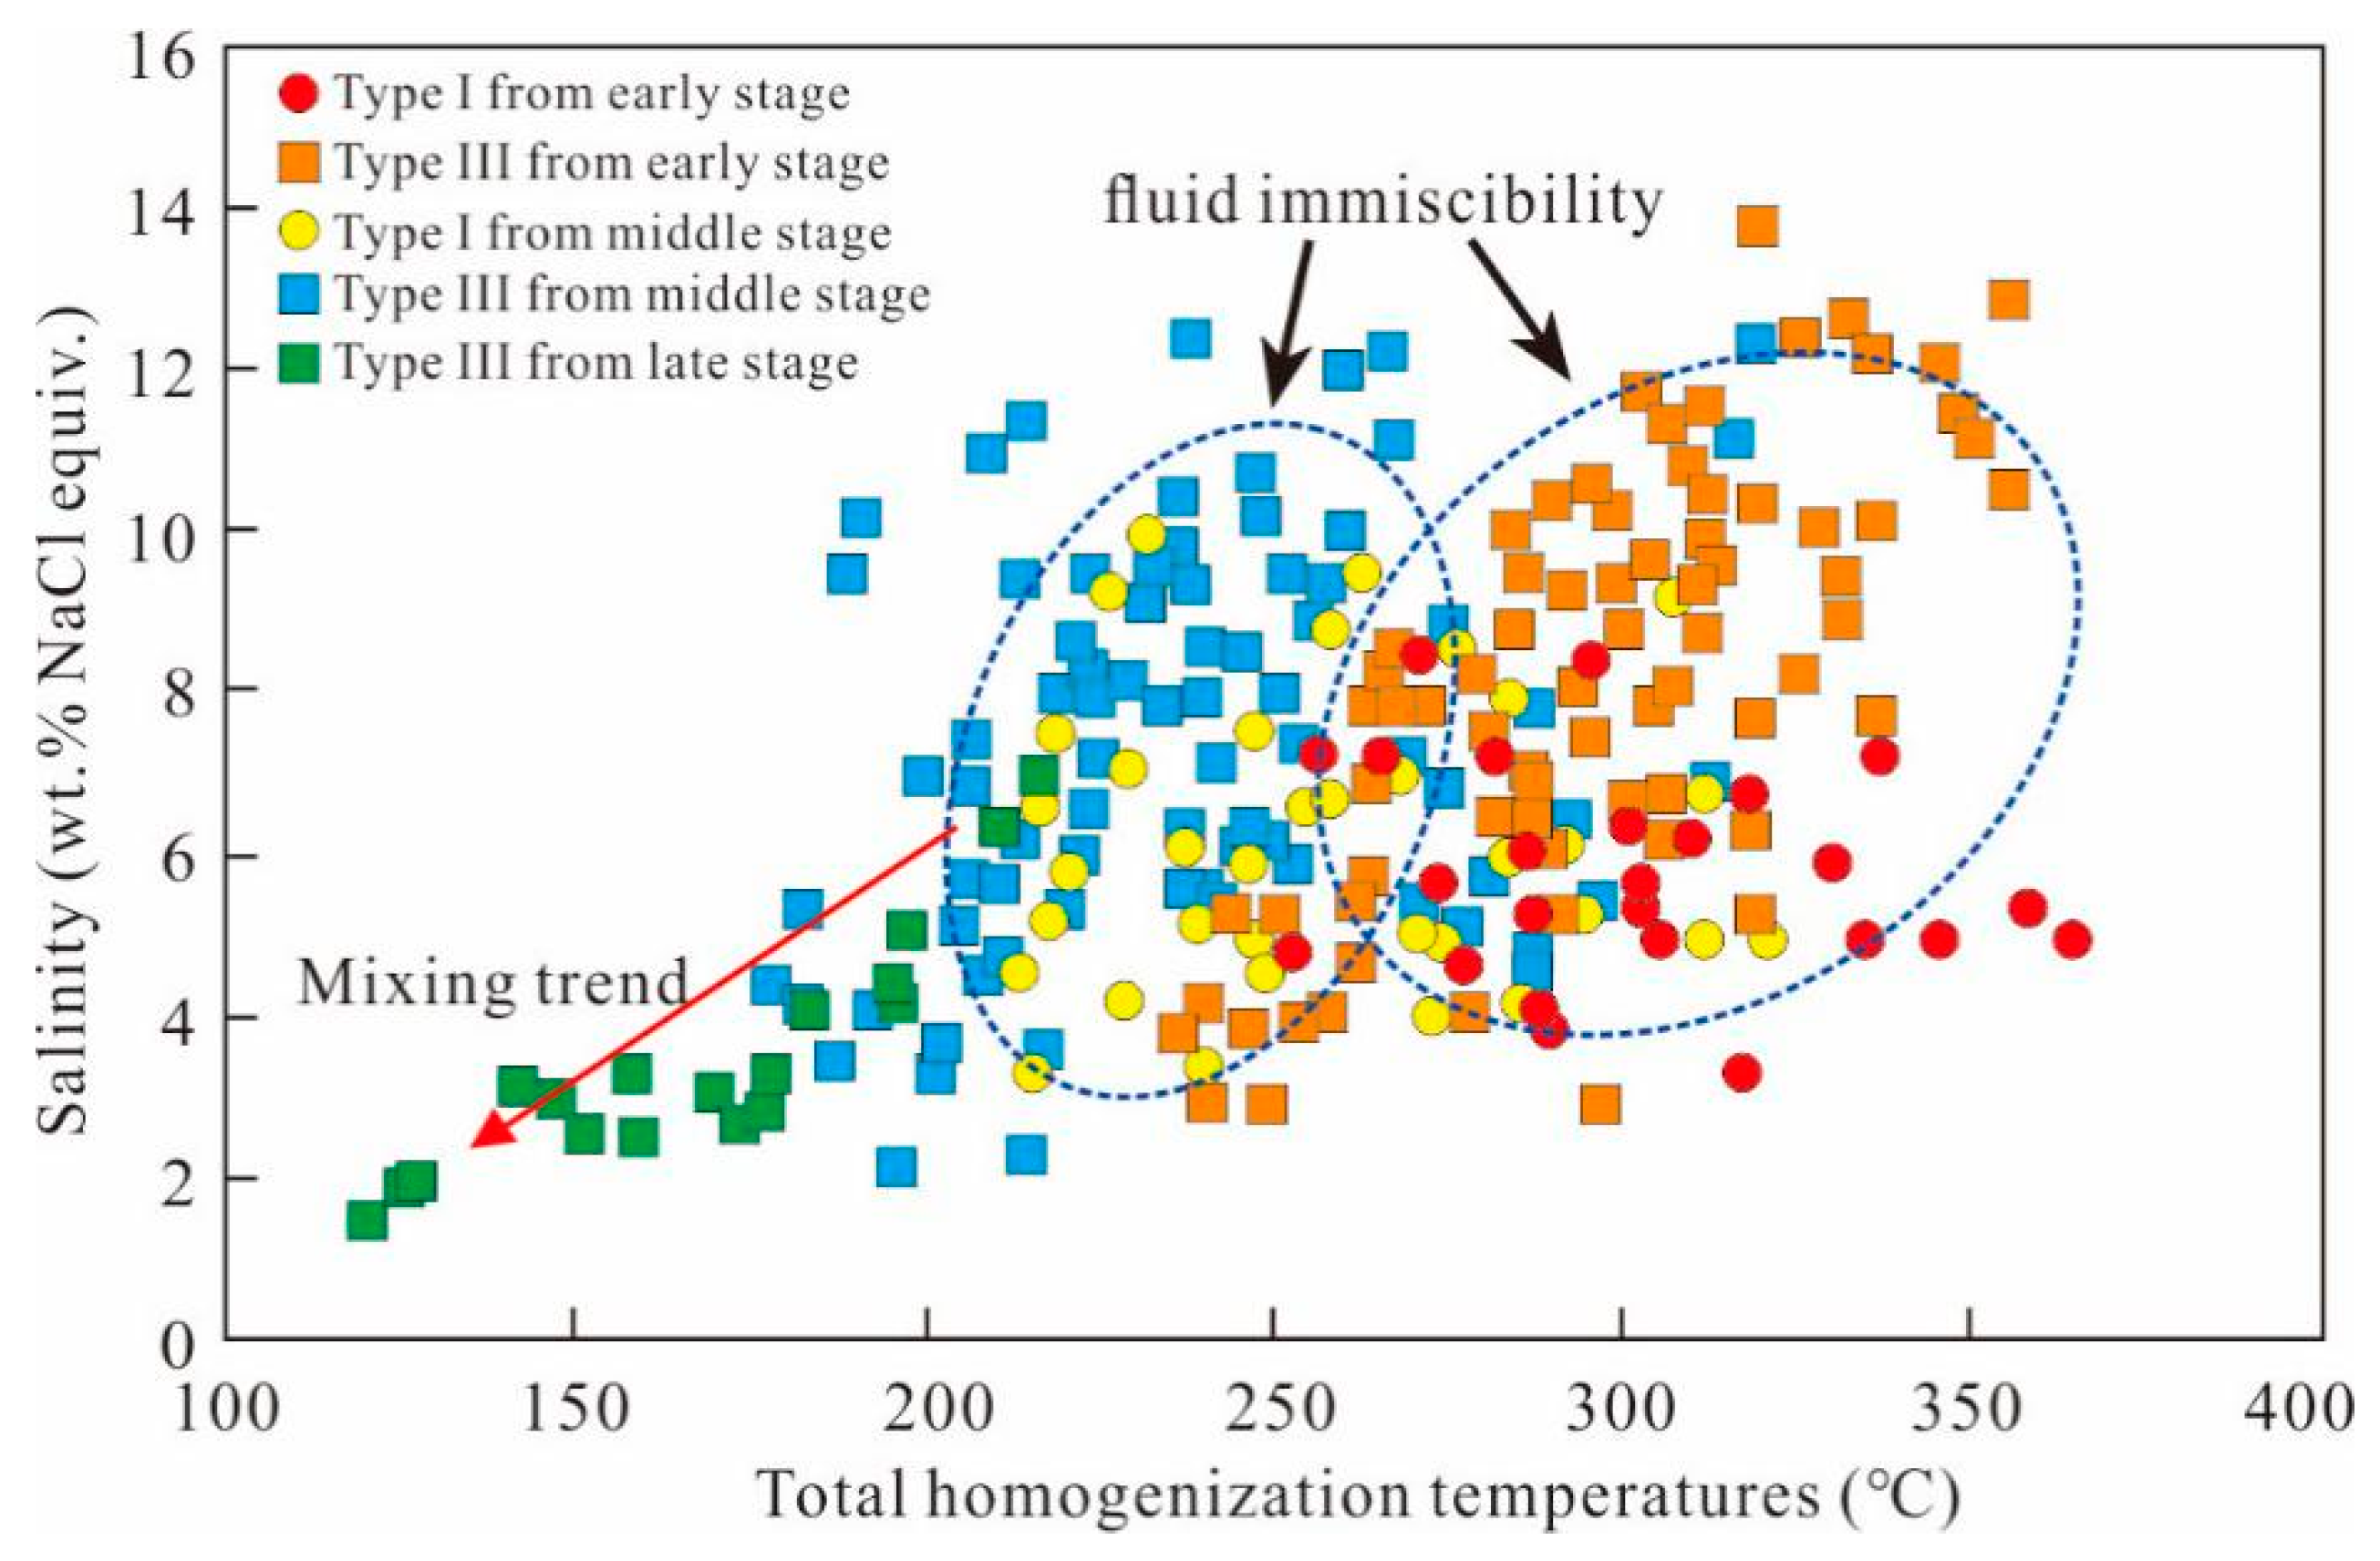
6.1. Fluid Immiscibility
6.2. Source and Evolution of Ore-Forming Fluids and Materials
6.2.1. Source of Ore-Forming Fluids and Materials
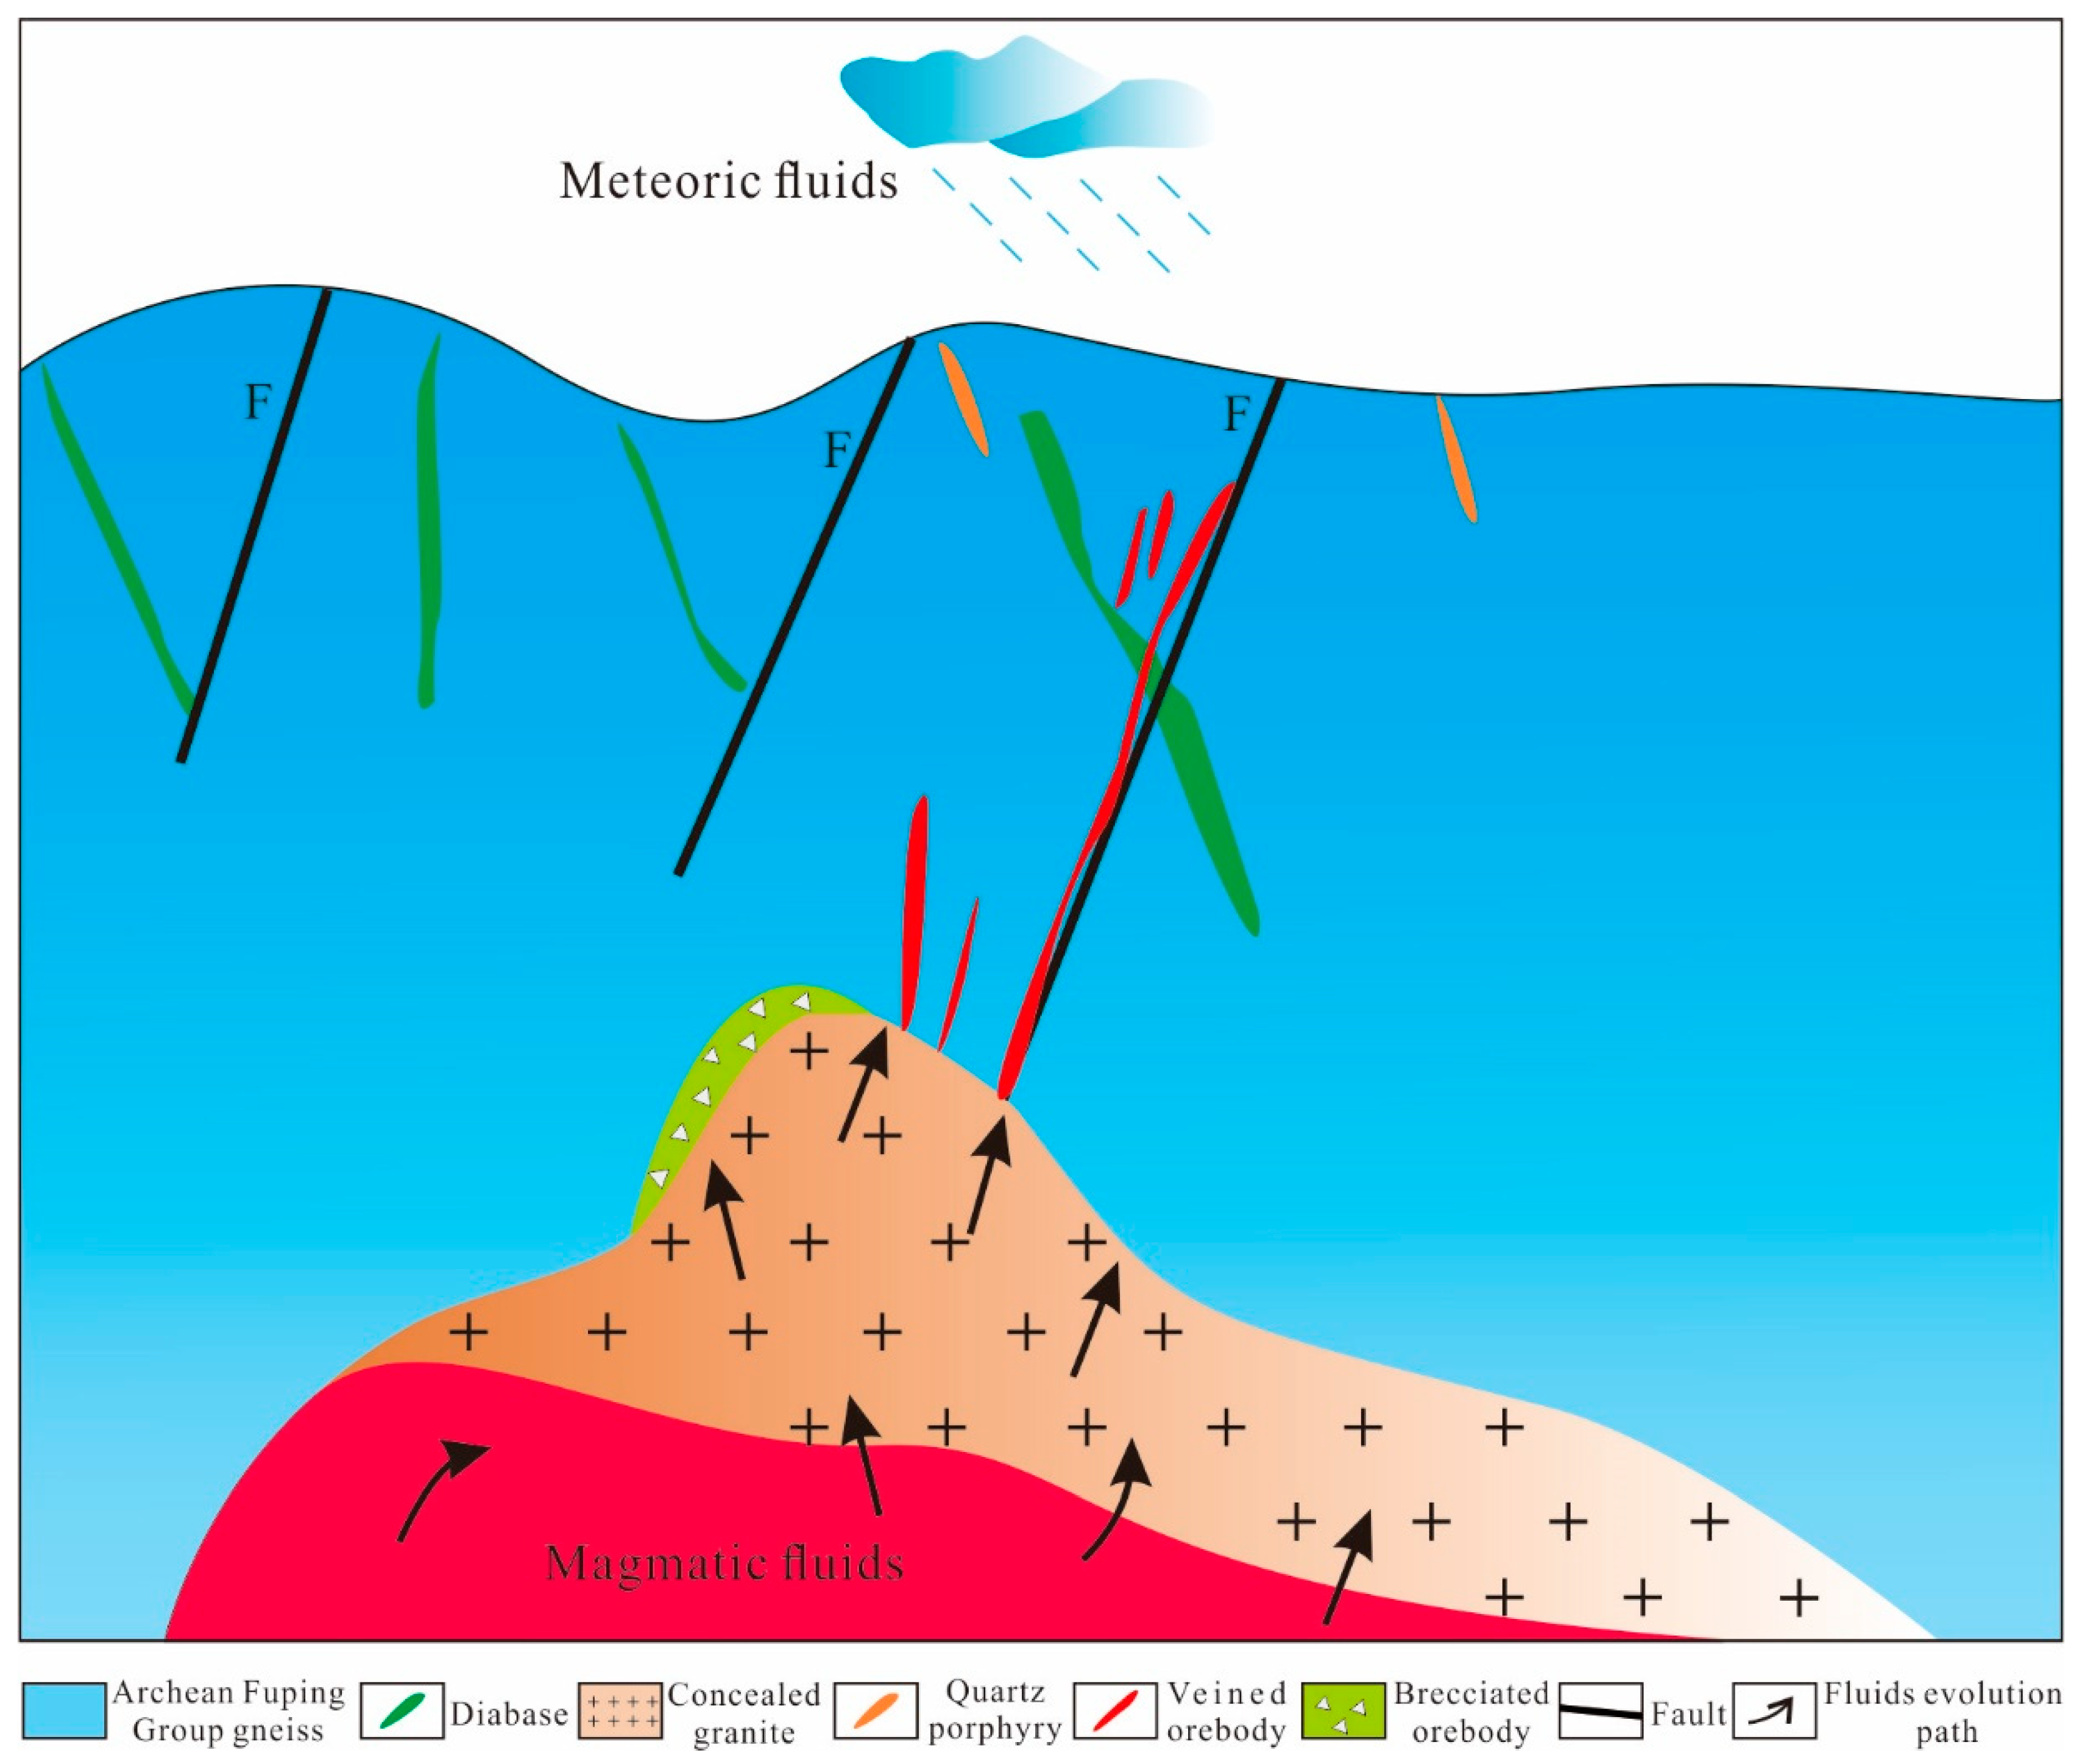
6.2.2. Evolution of Ore-Forming Fluids
6.3. Gold Deposition Mechanism
6.4. Ore Genesis
7. Conclusions
Author Contributions
Funding
Acknowledgments
Conflicts of Interest
References
- Groves, D.I.; Goldfarb, R.J.; Santosh, M. The conjunction of factors that lead to formation of giant gold provinces and deposits in non-arc settings. Geosci. Front. 2016, 7, 303–314. [Google Scholar] [CrossRef]
- Groves, D.I.; Santosh, M. The giant Jiaodong gold province: The key to a unified model for orogenic gold deposits? Geosci. Front. 2016, 7, 409–417. [Google Scholar] [CrossRef]
- Yang, F.; Santosh, M.; Kim, S.W. Mesozoic magmatism in the eastern North China Craton: Insights on tectonic cycles associated with progressive craton destruction. Gondwana Res. 2018, 60, 153–178. [Google Scholar] [CrossRef]
- Yang, F.; Santosh, M.; Tang, L. Extensive crustal melting during craton destruction: Evidence from the Mesozoic magmatic suite of Junan, Eastern North China Craton. J. Asian Earth Sci. 2018, 157, 119–140. [Google Scholar] [CrossRef]
- Li, S.R.; Santosh, M. Geodynamics of heterogeneous gold mineralization in the North China Craton and its relationship to lithospheric destruction. Gondwana Res. 2017, 50, 267–292. [Google Scholar] [CrossRef]
- Goldfarb, R.J.; Taylor, R.D.; Collins, G.S.; Goryachev, N.A.; Orlandini, O.F. Phanerozoic continental growth and gold metallogeny of Asia. Gondwana Res. 2014, 25, 48–102. [Google Scholar] [CrossRef]
- Sun, W.Y.; Li, S.R.; Santosh, M.; Wang, X.; Zhang, L.J. Isotope geochemistry and geochronology of the Qiubudong silver deposit, central North China Craton: Implications for ore genesis and lithospheric dynamics. Ore Geol. Rev. 2014, 57, 229–242. [Google Scholar] [CrossRef]
- Yang, F.; Santosh, M.; Kim, S.W.; Zhou, H.; Jeong, Y.J. Late Mesozoic intraplate rhyolitic volcanism in the North China Craton: Far-field effect of the westward subduction of the Paleo-Pacific Plate. Geol. Soc. Am. Bull. 2019. [Google Scholar] [CrossRef]
- Yang, F.; Xue, F.; Santosh, M.; Wang, G.; Kim, S.W.; Shen, Z.; Jia, W.; Zhang, X. Late Mesozoic magmatism in the East Qinling Orogen, China and its tectonic implications. Geosci. Front. 2019. [Google Scholar] [CrossRef]
- Xu, Y.G.; Li, H.Y.; Pang, C.J.; He, B. On the timing and duration of the destruction of the North China Craton. Chin. Sci. Bull. 2009, 54, 1974–1989, (In Chinese with English Abstract). [Google Scholar] [CrossRef]
- Zhang, J.J.; Zheng, Y.D. Multistage extension and age dating of the Xiaoqinling metamorphic core complex, central China. Acta Geol. Sin. 1999, 73, 139–147. [Google Scholar]
- Zhao, G.C.; Wilde, S.A.; Cawood, P.A.; Sun, M. Archean blocks and their boundaries in the North China Craton: Lithological, geochemical, structural and P-T path constraints and tectonic evolution. Precambrian Res. 2001, 107, 45–73. [Google Scholar] [CrossRef]
- Davis, G.A.; Darby, B.J.; Yadong, Z.; Spell, T.L. Geometric and temporal evolution of an extensional detachment fault, Hohhot metamorphic core complex, Inner Mongolia, China. Geology 2002, 30, 1003–1006. [Google Scholar] [CrossRef]
- Liu, J.L.; Davis, G.A.; Lin, Z.Y.; Wu, F.Y. The Liaonan metamorphic core complex, Southeastern Liaoning Province, North China: A likely contributor to Cretaceous rotation of Eastern Liaoning, Korea and contiguous areas. Tectonophysics 2005, 407, 65–80. [Google Scholar] [CrossRef]
- Wu, F.Y.; Lin, J.Q.; Wilde, S.A.; Zhang, X.; Yang, J.H. Nature and significance of the Early Cretaceous giant igneous event in eastern China. Earth Planet. Sci. Lett. 2005, 233, 103–119. [Google Scholar] [CrossRef]
- Chen, B.; Tian, W.; Jahn, B.M.; Chen, Z.C. Zircon SHRIMP U-Pb ages and in-situ Hf isotopic analysis for the mesozoic intrusions in South Taihang, North China Craton: Evidence for hybridization between mantle-derived magmas and crustal components. Lithos 2008, 102, 118–137. [Google Scholar] [CrossRef]
- Mao, J.W.; Xie, G.Q.; Pirajno, F.; Ye, H.S.; Wang, Y.B.; Li, Y.F.; Xiang, J.F.; Zhao, H.J. Late Jurassic-Early Cretaceous granitoid magmatism in Eastern Qinling, central-eastern China: SHRIMP zircon U-Pb ages and tectonic implications. Aust. J. Earth Sci. 2010, 57, 51–78. [Google Scholar] [CrossRef]
- Pei, F.P.; Xu, W.L.; Yang, D.B.; Yu, Y.; Wang, W.; Zhao, Q.G. Geochronology and geochemistry of Mesozoic mafic-ultramafic complexes in the southern Liaoning and southern Jilin provinces, NE China: Constraints on the spatial extent of destruction of the North China Craton. J. Asian Earth Sci. 2011, 40, 636–650. [Google Scholar] [CrossRef]
- Li, J.W.; Bi, S.J.; Selby, D.; Chen, L.; Vasconcelos, P.; Thiede, D.; Zhou, M.F.; Zhao, X.F.; Li, Z.K.; Qiu, H.N. Giant Mesozoic gold provinces related to the destruction of the North China Craton. Earth Planet. Sci. Lett. 2012, 349, 26–37. [Google Scholar] [CrossRef]
- Xu, X.P. Characteristics and genesis of Liyuan gold deposit in the Lingqiu County, Shanxi province. Huabei Land Resour. 2009, 3, 3–5. (In Chinese) [Google Scholar]
- Ju, P.J.; Lai, J.Q.; Yang, H.J.; Wang, Y.J.; Song, J.J.; Li, L.Y.; Xu, X.B.; Dong, W.G.; Yang, B. Characteristics of fluid inclusions and mineralization of Liyuan gold deposit in Lingqiu County, Shanxi Province, China. Chin. J. Nonferrous Met. 2015, 25, 2537–2550, (In Chinese with English Abstract). [Google Scholar]
- Ma, Y.; Jiang, S.Y.; Li, H.L. Isotope geochemistry and genesis of the Liyuan gold deposit, Shanxi, North China. Ore Geol. Rev. 2017, 92, 129–143. [Google Scholar] [CrossRef]
- Ma, Y.; Xiong, S.F.; Li, H.L.; Jiang, S.Y. Origin and evolution of ore-forming fluids in the Liyuan gold deposit, central North China Craton: Constraints from fluid inclusions and H-O-C isotopic compositions. Geofluids 2017. [Google Scholar] [CrossRef]
- Zhai, M.G.; Bian, A.G. Amalgamation of the supercontinental of the North China Craton and its break up during late-middle Proterozoic. Sci. China 2001, 43, 219–232. [Google Scholar] [CrossRef]
- Zhai, M.G.; Guo, J.H.; Liu, W.J. Neoarchean to Paleoproterozoic continental volution and tectonic history of the North China Craton. J. Asian Earth Sci. 2005, 24, 547–561. [Google Scholar] [CrossRef]
- Zhai, M.G. Cratonization and the Ancient North China Continent: A summary and review. Sci. China-Earth Sci. 2011, 54, 1110–1120. [Google Scholar] [CrossRef]
- Zhai, M.G.; Santosh, M. The early Precambrian odyssey of the North China Craton: A synoptic overview. Gondwana Res. 2011, 20, 6–25. [Google Scholar] [CrossRef]
- Santosh, M.; Teng, X.M.; He, X.F.; Tang, L.; Yang, Q.Y. Discovery of Neoarchean suprasubduction zone ophiolite suite from Yishui Complex in the North China Craton. Gondwana Res. 2016, 38, 1–27. [Google Scholar] [CrossRef]
- Zhao, G.C.; Sun, M.; Wilde, S.A.; Li, S.Z. Late Archean to Paleoproterozoic evolution of the North China Craton: Key issues revisited. Precambrian Res. 2005, 136, 177–202. [Google Scholar] [CrossRef]
- Zhang, H.; Liu, J.; Santosh, M.; Tao, N.; Zhou, Q.; Hu, B. Ultra-depleted peridotite xenoliths in the Northern Taihang Mountains: Implications for the nature of the lithospheric mantle beneath the North China Craton. Gondwana Res. 2017, 48, 72–85. [Google Scholar] [CrossRef]
- Guan, H.; Sun, M.; Wilde, S.A.; Zhou, X.H.; Zhai, M.G. SHRIMP U-Pb zircon geochronology of the Fuping Complex: Implications for formation and assembly of the North China Craton. Precambrian Res. 2002, 113, 1–18. [Google Scholar] [CrossRef]
- Li, S.R.; Santosh, M.; Zhang, H.F.; Shen, J.F.; Dong, G.C.; Wang, J.Z.; Zhang, J.Q. Inhomogeneous lithospheric thinning in the central North China Craton: Zircon U-Pb and S-He-Ar isotopic record from magmatism and metallogeny in the Taihang Mountains. Gondwana Res. 2013, 23, 141–160. [Google Scholar] [CrossRef]
- Fan, H.R.; Zhai, M.; Yang, K.F.; Hu, F.F. Late Mesozoic Gold Mineralization in the North China Craton. In Main Tectonic Events and Metallogeny of the North China Craton; Springer: Berlin/Heidelberg, Germany, 2016; pp. 511–525. [Google Scholar]
- Liu, T.; Xiong, S.F.; Jiang, S.Y.; Li, H.L.; Chen, Q.Z.; Jiang, H. Genesis of the Zhijiadi Ag-Pb-Zn Deposit, Central North China Craton: Constraints from Fluid Inclusions and Stable Isotope Data. Geofluids 2017. [Google Scholar] [CrossRef]
- Zhang, J.Q.; Li, S.R.; Santosh, M.; Li, Q.; Niu, S.D.; Li, Z.D.; Zhang, X.G.; Jia, L.B. Timing and origin of Mesozoic magmatism and metallogeny in the Wutai-Hengshan region: Implications for destruction of the North China Craton. J. Asian Earth Sci. 2015, 113, 677–694. [Google Scholar] [CrossRef]
- Cao, Y.; Li, S.R.; Yao, M.J.; Zhang, H.F.; Jiang, S.Q.; Niu, H.P. Isotope geochemistry of the Shihu gold deposit, Hebei Province, North China: Implication for the source of ore fluid and materials. Carpathian J. Earth Environ. Sci. 2011, 6, 235–249. [Google Scholar]
- Cao, Y.; Li, S.R.; Zhang, H.F.; Liu, X.B.; Li, Z.Z.; Ao, C.; Yao, M.J. Significance of zircon trace element geochemistry, the Shihu gold deposit, western Hebei Province, North China. J. Rare Earths 2011, 29, 277–286. [Google Scholar] [CrossRef]
- Cao, Y.; Carranza, M.E.J.; Li, S.R.; Yao, M.J.; Zhang, H.F. Source and evolution of fluids in the Shihu gold deposit, Taihang Mountains, China: Evidence from microthermometry, chemical composition and noble gas isotope of fluid inclusions. Geochem.-Explor. Environ. Anal. 2012, 12, 177–191. [Google Scholar] [CrossRef]
- Cao, Y.; Li, S.R.; Xiong, X.X.; Li, Z.Z.; Liu, X.B.; Yao, M.J.; Zhang, H.F. Laser ablation ICPMS U-Pb zircon geochronology of granitoids and quartz veins in the Shihu Gold Mine, Taihang orogeny, North China: Timing of gold-mineralization and tectonic implications. Acta Geol. Sin. 2012, 86, 1211–1224. [Google Scholar]
- Li, S.R.; Santosh, M.; Zhang, H.F.; Luo, J.Y.; Zhang, J.Q.; Li, C.L.; Song, J.Y.; Zhang, X.B. Metallogeny in response to lithospheric thinning and craton destruction: Geochemistry and U-Pb zircon chronology of the Yixingzhai gold deposit, central North China Craton. Ore Geol. Rev. 2014, 56, 457–471. [Google Scholar] [CrossRef]
- Zhang, D.C.; Zhang, C. The Geological Map of the Liyuan Gold Deposit; Shanxi Provincial Geological Prospecting Bureau: Datong, China, 2009. (In Chinese)
- Jiang, S.Y.; Wen, C.G.; Li, H.L.; Wang, Y.; Jiang, H.; Liu, Q.; Zhang, L.; Zhi, Y.D.; Ren, R.; Zhou, P.; et al. The Report of Prospecting Prediction of Ore District, North Shanxi Province; China University of Geosciences (Wuhan): Wuhan, China, 2016. [Google Scholar]
- Liu, B.; Shen, K. Thermodynamics of Fluid Inclusions; Geological Publishing House: Beijing, China, 1999. (In Chinese) [Google Scholar]
- Lu, H.Z.; Fan, H.R.; Ni, P.; Ou, G.X.; Shen, K.; Zhang, W.H. Fluid Inclusion; Science Press: Beijing, China, 2004; pp. 1–487. (In Chinese) [Google Scholar]
- Bodnar, R.J. Revised equation and table for determining the freezing point depression of H2O-NaCl solutions. Geochim. Cosmochim. Acta 1993, 57, 683–684. [Google Scholar] [CrossRef]
- Collins, P.L.F. Gas hydrates in CO2-bearing fluid inclusions and use freezing data for estimation of salinity. Econ. Geol. 1979, 74, 1435–1444. [Google Scholar] [CrossRef]
- Brown, P.E. Flincor: A microcomputer program for the reduction and investigation of fluid-inclusion data. Am. Miner. 1989, 74, 1390–1393. [Google Scholar]
- Clayton, R.N.; Mayeda, T.K. The use of bromine pentafluoride in the extraction of oxygen from oxides and silicates for isotopic analysis. Geochim. Cosmochim. Acta 1963, 27, 43–52. [Google Scholar] [CrossRef]
- Zhu, Z.Y.; Cook, N.; Yang, T.; Ciobanu, C.; Zhao, K.D.; Jiang, S.Y. Mapping of Sulfur Isotopes and Trace Elements in Sulfides by LA-(MC)-ICP-MS: Potential Analytical Problems, Improvements and Implications. Minerals 2016, 6, 110. [Google Scholar] [CrossRef]
- Zhu, Z.Y.; Jiang, S.Y.; Ciobanu, C.L.; Yang, T.; Cook, N.J. Sulfur isotope fractionation in pyrite during laser ablation: Implications for laser ablation multiple collector inductively coupled plasma mass spectrometry mapping. Chem. Geol. 2017, 450, 223–234. [Google Scholar] [CrossRef]
- Pichavant, M.; Ramboz, C.; Weisbrod, A. Fluid immiscibility in natural processes: Use and misuse of fluid inclusion data: I. phase equilibria analysis—A theoretical and geometrical approach. Chem. Geol. 1982, 37, 29–48. [Google Scholar] [CrossRef]
- Kruger, Y.; Diamond, L.W. P-V-T-X properties of two H2O-CO2-NaCl mixtures up to 850°C and 500 MPa: A synthetic fluid inclusion study. XVI ECROFI. Proc. Abstr. 2001, 7, 241–244. [Google Scholar]
- Thiéry, R.; Van Den Kerkhof, A.M.; Dubessy, J. VX properties of CH4-CO2 and CO2-N2 fluid inclusions: Modelling for T < 31 °C and P < 400 bars. Eur. J. Mineral. 1994, 6, 753–771. [Google Scholar]
- Clayton, R.N.; O’Neil, J.R.; Mayeda, T.K. Oxygen isotope exchange between quartz and water. J. Geophys. Res. 1972, 77, 3057–3067. [Google Scholar] [CrossRef]
- Anderson, M.R.; Rankin, A.H.; Spiro, B. Fluid mixing in the generation of isothermal gold mineralization in the Transvaal Sequence, Transvaal, South Africa. Eur. J. Mineral. 1992, 4, 933–948. [Google Scholar] [CrossRef]
- Wilkinson, J.J. Fluid inclusions in hydrothermal ore deposits. Lithos 2001, 55, 229–272. [Google Scholar] [CrossRef]
- Bakker, R.J.; Jansen, J.B.H. A mechanism for preferential H2O leakage from fluid inclusions in quartz, based on TEM observations. Contrib. Mineral. Petrol. 1994, 116, 7–20. [Google Scholar] [CrossRef]
- Roedder, E. Fluid Inclusions as Samples of Ore Fluids. In Geochemistry of Hydrothermal Ore Deposits, 2nd ed.; Wiley: New York, NY, USA, 1979; pp. 684–737. [Google Scholar]
- Bodnar, R.J. Reequilibration of fluid inclusions. In Fluid Inclusions: Analysis and Interpretation; Samson, I., Anderson, A., Marshall, D., Eds.; Mineralogical Association of Canada Short Course Series: la Couronne, QC, Canada, 2003; Volume 32, pp. 213–230. [Google Scholar]
- Xavier, R.P.; Foster, R.P. Fluid evolution and chemical controls in the Fazenda Maria Preta (FMP) gold deposit, Rio Itapicuru greenstone belt, Bahia, Brazil. Chem. Geol. 1999, 154, 133–154. [Google Scholar] [CrossRef]
- Neumayr, P.; Hagemann, S.G. Hydrothermal Fluid Evolution within the Cadillac Tectonic Zone, Abitibi Greenstone Belt, Canada: Relationship to Auriferous Fluids in Adjacent Second and Third-Order Shear Zones. Econ. Geol. 2002, 97, 1203–1225. [Google Scholar] [CrossRef]
- Yang, L.Q.; Deng, J.; Guo, L.N.; Wang, Z.L.; Li, X.Z.; Li, J.L. Origin and evolution of ore fluid, and gold-deposition processes at the giant Taishang gold deposit, Jiaodong Peninsula, eastern China. Ore Geol. Rev. 2016, 72, 585–602. [Google Scholar] [CrossRef]
- Wang, Z.L.; Yang, L.Q.; Guo, L.N.; Marsh, E.; Wang, J.P.; Liu, Y.; Zhang, C.; Li, R.H.; Zhang, L.; Zheng, X.L.; et al. Fluid immiscibility and gold deposition in the Xincheng deposit, Jiaodong Peninsula, China: A fluid inclusion study. Ore Geol. Rev. 2015, 65, 701–717. [Google Scholar] [CrossRef]
- Ma, W.D.; Fan, H.R.; Liu, X.; Yang, K.F.; Hu, F.F.; Zhao, K.; Cai, Y.C.; Hu, H.L. Hydrothermal fluid evolution of the Jintingling gold deposit in the Jiaodong peninsula, China: Constraints from U-Pb age, CL imaging, fluid inclusion and stable isotope. J. Asian Earth Sci. 2018, 160, 287–303. [Google Scholar] [CrossRef]
- Yang, L.Q.; Guo, L.N.; Wang, Z.L.; Zhao, R.X.; Song, M.C.; Zheng, X.L. Timing and mechanism of gold mineralization at the Wang’ershan gold deposit, Jiaodong Peninsula, eastern China. Ore Geol. Rev. 2017, 88, 491–510. [Google Scholar] [CrossRef]
- Jiang, N. Hydrothermal Fluid Evolution Associated with Gold Mineralization at the Wenyu Mine, Xiaoqinling District, China. Resour. Geol. 2010, 50, 103–112. [Google Scholar] [CrossRef]
- Zhao, C.; Ni, P.; Wang, G.G.; Ding, J.Y.; Chen, H.; Zhao, K.D.; Cai, Y.T.; Xu, Y.F. Geology, fluid inclusion, and isotope constraints on ore genesis of the Neoproterozoic Jinshan orogenic gold deposit, South China. Geofluids 2013, 13, 506–527. [Google Scholar] [CrossRef]
- Roedder, E. Fluid inclusions. Rev. Mineral. 1984, 12, 1–664. [Google Scholar]
- Olsen, S.N. High-density CO2 inclusions in the Colorado Front Range. Contrib. Mineral. Petrol. 1988, 100, 226–235. [Google Scholar] [CrossRef]
- Hollister, L.S. Enrichment of CO2 in fluid inclusions in quartz by removal of H2O during crystal-plastic deformation. J. Struct. Geol. 1990, 12, 895–901. [Google Scholar] [CrossRef]
- Coulibaly, Y.; Boiron, M.C.; Cathelineau, M.; Kouamelan, A.N. Fluid immiscibility and gold deposition in the birimian quartz veins of the angovia deposit (yaouré, ivory coast). J. Afr. Earth Sci. 2008, 50, 234–254. [Google Scholar] [CrossRef]
- Lawrence, D.M.; Treloar, P.J.; Rankin, A.H.; Boyce, A.; Harbidge, P. A fluid inclusion and stable isotope study at the Loulo mining district, Mali, West Africa: Implications for multifluid sources in the generation of orogenic gold deposits. Econ. Geol. 2013, 108, 229–257. [Google Scholar] [CrossRef]
- Lotfia, F.; Belkabira, A.; Brunetb, S.; Brownc, A.C.; Marcouxd, E. Lithogeochemical, mineralogical analyses and oxygen-hydrogen isotopes of the Hercynian Koudiat Aïcha massive sulphide deposit, Morocco. J. Afr. Earth Sci. 2010, 56, 150–166. [Google Scholar] [CrossRef]
- Wagner, T.; Mlynarczyk, M.S.J.; Williams-Jones, A.E.; Boyce, A.J. Stable isotope constraints on ore formation at the San Rafael Tin-Copper Deposit, Southeast Peru. Econ. Geol. 2009, 104, 223–248. [Google Scholar] [CrossRef]
- Taylor, H.P. The application of oxygen and hydrogen isotope studies to problems of hydrothermal alteration and ore deposition. Econ. Geol. 1974, 69, 843–883. [Google Scholar] [CrossRef]
- Zheng, Y.F. Stable Isotope Geochemistry; Science Press: Beijing, China, 2000; pp. 42–43. [Google Scholar]
- Ohmoto, H. Systematics of sulfur and carbon isotopes in hydrothermal ore deposits. Econ. Geol. 1972, 67, 551–578. [Google Scholar] [CrossRef]
- Ohmoto, H.; Rye, R. Isotopes of sulfur and carbon. In Geochemistry of Hydrothermal Ore Deposits; Barnes, H.L., Ed.; Wiley: New York, NY, USA, 1979; pp. 509–567. [Google Scholar]
- Rye, R.O.; Ohmoto, H. Sulfur and Carbon Isotopes and Ore Genesis: A Review. Econ. Geol. 1974, 69, 826–842. [Google Scholar] [CrossRef]
- Seal, R.R. Sulfur Isotope Geochemistry of Sulfide Minerals. Rev. Mineral. Geochem. 2006, 61, 633–677. [Google Scholar] [CrossRef]
- Kesler, S.E.; Riciputi, L.C.; Ye, Z. Evidence for a magmatic origin for Carlin-type gold deposits: Isotopic composition of sulfur in the Betze-Post-Screamer Deposit, Nevada, USA. Miner. Depos. 2005, 40, 127–136. [Google Scholar] [CrossRef]
- Chang, Z.; Large, R.R.; Maslennikov, V. Sulfur isotopes in sediment-hosted orogenic gold deposits: Evidence for an early timing and a seawater sulfur source. Geology 2008, 36, 971–974. [Google Scholar] [CrossRef]
- Ma, J.; Lü, X.; Escolme, A.; Li, S.; Zhao, N.; Cao, X.; Zhang, L.J.; Lu, F. In-situ sulfur isotope analysis of pyrite from the Pangjiahe gold deposit: Implications for variable sulfur sources in the north and south gold belt of the South Qinling orogen. Ore Geol. Rev. 2018, 98, 38–61. [Google Scholar] [CrossRef]
- Hou, L.; Peng, H.J.; Ding, J.; Zhang, J.R.; Zhu, S.B.; Wu, S.Y.; Wu, Y.; Ouyang, H.G. Textures and in situ chemical and isotopic analyses of pyrite, Huijiabao Trend, Youjiang Basin, China: Implications for paragenesis and source of sulfur. Econ. Geol. 2016, 111, 331–353. [Google Scholar] [CrossRef]
- Ohmoto, H. Stable isotope geochemistry of ore deposits. Rev. Mineral. Geochem. 1986, 16, 491–559. [Google Scholar]
- Cameron, E.M.; Hattori, K. Archean gold mineralization and oxidized hydrothermal fluids. Econ. Geol. 1987, 82, 1177–1191. [Google Scholar] [CrossRef]
- Drummond, S.E.; Ohmoto, H. Chemical evolution and mineral deposition in boiling hydrothermal systems. Econ. Geol. 1985, 80, 126–147. [Google Scholar] [CrossRef]
- Li, S.Y.; Li, Z.L.; Lin, J.Y. Sub-Volcanic Type Ag-Mn-Au Deposits in the Northeast of Shanxi Province; China University of Geology Publishing House: Wuhan, China, 2000; pp. 1–241. (In Chinese) [Google Scholar]
- Zhao, X.X. Research on the Geological and Geochemical Characteristics and Genesis of Xinzhuang Gold Deposit in Shanxi Province. Ph.D. Thesis, Central South University, Changsha, China, 2013. (In Chinese with English Abstract). [Google Scholar]
- Jing, S.H. Metallogenetic condition of the Yixingzhai gold deposit, Fanshi County. Shanxi Geol. 1992, 7, 51–64, (In Chinese with English abstract). [Google Scholar]
- Wang, Q.C.; Ma, J.L.; Zhang, J.Z. The geochemical characteristics of the Mapeng gold mine at the boundary between Lingshou and Fuping in Hebei province and the origin of the deposits. Geochimica 1995, 24, 57–68, (In Chinese with English abstract). [Google Scholar]
- Chaussidon, M.; Lorand, J.P. Sulphur isotope composition of orogenic spinel lherzolite massifs from Ariege (North-Eastern Pyrenees, France): An ion microprobe study. Geochim. Cosmochim. Acta 1990, 54, 2835–2846. [Google Scholar] [CrossRef]
- Ohmoto, H.; Goldhaber, M.B. Sulfur and carbon isotopes. In Geochemistry of Hydrothermal Ore Deposits; Barnes, H.L., Ed.; Wiley: New York, NY, USA, 1997; pp. 517–611. [Google Scholar]
- Seward, T.M. Thio complexes of gold and the transport of gold in hydrothermal ore solutions. Geochim. Cosmochim. Acta 1973, 37, 379–399. [Google Scholar] [CrossRef]
- Gammons, C.H.; Williams-Jones, A.E.; Yu, Y. New data on the stability of gold (I) chloride complexes at 300 °C. Mineral. Mag. 1994, 58, 309–310. [Google Scholar] [CrossRef]
- Benning, L.G.; Seward, T.M. Hydrosulphide complexing of gold (I) in hydrothermal solutions from 150 to 500 °C and 500 to 1500 bars. Geochim. Cosmochim. Acta 1996, 60, 1849–1871. [Google Scholar] [CrossRef]
- Mikucki, E.J. Hydrothermal transport and depositional processes in Archean lode gold systems: A review. Ore Geol. Rev. 1998, 13, 307–321. [Google Scholar] [CrossRef]
- Chen, Y.J.; Ni, P.; Fan, H.R.; Pirajno, F.; Lai, Y.; Su, W.C.; Zhang, H. Diagnostic fluid inclusions of different types hydrothermal gold deposits. Acta Petrol. Sin. 2007, 23, 2085–2108, (In Chinese with English abstract). [Google Scholar]
- Naden, J.; Shepherd, T.J. Role of methane and carbon dioxide in gold deposition. Nature 1989, 342, 793–795. [Google Scholar] [CrossRef]
- Wen, B.J.; Fan, H.R.; Santosh, M.; Hu, F.F.; Pirajno, F.; Yang, K.F. Genesis of two different types of gold mineralization in the linglong gold field, China: Constrains from geology, fluid inclusions and stable isotope. Ore Geol. Rev. 2015, 65, 643–658. [Google Scholar] [CrossRef]
- Groves, D.I.; Phillips, G.; Ho, S.E.; Houstoun, S.M. The nature, genesis and regional controls of gold mineralization in Archaean greenstone belts of the Western Australian Shield; a brief review. S. Afr. J. Geol. 1985, 88, 135–148. [Google Scholar]
- Mills, S.E.; Tomkins, A.G.; Weinberg, R.F.; Fan, H.R. Anomalously silver-rich vein-hosted mineralisation in disseminated-style gold deposits, Jiaodong gold district, China. Ore Geol. Rev. 2015, 68, 127–141. [Google Scholar] [CrossRef]
- Zhu, R.X.; Fan, H.R.; Li, J.W.; Meng, Q.R.; Li, S.R.; Zeng, Q.D. Decratonic gold deposits. Sci. China-Earth Sci. 2015, 58, 1523–1537. [Google Scholar] [CrossRef]
- Groves, D.I.; Goldfarb, R.J.; Gebremariam, M.; Hagemann, S.; Robert, F. Orogenic gold deposits: A proposed classification in the context of their crustal distribution and relationship to other gold deposit types. Ore Geol. Rev. 1998, 13, 7–27. [Google Scholar] [CrossRef]


| Stage | Type | Number | Size/μm | Tm-CO2/°C | Tm-cla/°C | Th-CO2/°C | Tm-ice/°C | Th/°C | Salinity/wt.% NaCl equiv. | CO2 Density (g/cm3) | Bulk Density (g/cm3) |
|---|---|---|---|---|---|---|---|---|---|---|---|
| Early | I | 25 | 4–16 | −61.5 to −57.0 | 4.7–8.3 | 24.4–30.9 | - | 245–364 (L/V) | 3.3–9.4 | 0.65–0.73 | 0.65–0.88 |
| II | 8 | 5–14 | −58.8 to −57.0 | - | 27.7–29.1 | - | - | - | 0.64–0.71 | - | |
| III | 89 | 3–12 | - | - | - | −9.8 to −1.7 | 233–355 | 2.9–13.7 | - | 0.69–0.93 | |
| Middle | I | 36 | 4–24 | −60.1 to −57.3 | 4.2–8.8 | 25.3–30.3 | - | 213–326 (L/V) | 2.4–10.2 | 0.66–0.72 | 0.72–0.91 |
| II | 10 | 5–12 | −59.2 to −57.4 | - | 25.0–30.5 | - | - | - | 0.60–0.72 | - | |
| III | 78 | 3–12 | - | - | - | −8.5 to −1.3 | 170–318 | 2.2–12.3 | - | 0.78–0.95 | |
| Late | III | 18 | 3–8 | - | - | - | −4.4 to −0.9 | 120–216 | 1.6–7.1 | - | 0.85–0.94 |
| Sample | Mineral | Stage | Th (°C) | δ18OV-SMOW ‰ | δ18O H2O ‰ | δD H2O ‰ |
|---|---|---|---|---|---|---|
| LYC-27 | Quartz | I | 294 | 15.1 | 7.9 | −68.4 |
| LYC-31 | Quartz | I | 294 | 17.9 | 10.7 | −73.8 |
| LYC-51 | Quartz | I | 294 | 15.2 | 8.0 | −78.9 |
| LYC-13-1 | Quartz | II | 241 | 15.3 | 5.8 | −75.8 |
| LYC-44 | Quartz | III | 170 | 14.2 | 0.3 | −85.7 |
| Stage | Sample | Minerals | δ34S |
|---|---|---|---|
| Early | LYB-116-1 | Py1 | 4.3 |
| LYB-116-2 | Py2 | 3.5 | |
| LYB-116-3 | Py2 | 3.8 | |
| LYB-116-4 | Py2 | 2.9 | |
| LYB-116-5 | Py1 | 4.1 | |
| LYB-106-1 | Py3-a | 4.3 | |
| LYB-106-2 | Py3-b | 3.5 | |
| LYB-106-3 | Py3-a | 3.9 | |
| LYB-106-4 | Py3-b | 3.8 | |
| LYB-106-5 | Py1 | 3.4 | |
| Middle | LYB-27-2-1 | Py4 | 2.4 |
| LYB-27-2-2 | Py4 | 2.6 | |
| LYB-27-2-3 | Py4 | 2.7 | |
| LYB-27-2-4 | Py5 | 3.3 | |
| LYB-27-2-5 | Py5 | 2.2 | |
| LYB-27-3-1 | Py4 | 2.6 | |
| LYB-27-3-2 | Py4 | 2.3 | |
| LYB-27-3-3 | Py5 | 1.2 | |
| LYB-27-3-4 | Py5 | 3.5 | |
| LYB-27-2-10 | Chalcopyrite | 4.6 | |
| LYB-27-2-11 | Chalcopyrite | 1.1 | |
| LYB-27-2-12 | Chalcopyrite | 0.9 | |
| LYB-27-2-6 | Galena | −10.8 | |
| LYB-27-2-7 | Galena | −8.3 | |
| LYB-27-2-8 | Galena | −9.6 | |
| LYB-27-2-9 | Galena | −7 | |
| LYB-27-3-5 | Galena | −11.9 |
© 2019 by the authors. Licensee MDPI, Basel, Switzerland. This article is an open access article distributed under the terms and conditions of the Creative Commons Attribution (CC BY) license (http://creativecommons.org/licenses/by/4.0/).
Share and Cite
Zhu, X.; Wang, J.; Pang, Z.; Zhen, S.; Yang, F.; Xue, J.; Jia, H.; Shi, G. Ore Geology, Fluid Inclusion Microthermometry and H-O-S Isotopes of the Liyuan Gold Deposit, Central Taihang Mountains, North China Craton. Minerals 2019, 9, 606. https://doi.org/10.3390/min9100606
Zhu X, Wang J, Pang Z, Zhen S, Yang F, Xue J, Jia H, Shi G. Ore Geology, Fluid Inclusion Microthermometry and H-O-S Isotopes of the Liyuan Gold Deposit, Central Taihang Mountains, North China Craton. Minerals. 2019; 9(10):606. https://doi.org/10.3390/min9100606
Chicago/Turabian StyleZhu, Xiaoqiang, Jingbin Wang, Zhenshan Pang, Shimin Zhen, Fan Yang, Jianling Xue, Hongxiang Jia, and Guangyao Shi. 2019. "Ore Geology, Fluid Inclusion Microthermometry and H-O-S Isotopes of the Liyuan Gold Deposit, Central Taihang Mountains, North China Craton" Minerals 9, no. 10: 606. https://doi.org/10.3390/min9100606
APA StyleZhu, X., Wang, J., Pang, Z., Zhen, S., Yang, F., Xue, J., Jia, H., & Shi, G. (2019). Ore Geology, Fluid Inclusion Microthermometry and H-O-S Isotopes of the Liyuan Gold Deposit, Central Taihang Mountains, North China Craton. Minerals, 9(10), 606. https://doi.org/10.3390/min9100606